Chapter 3: Cost-Volume-Profit Analysis and Planningplaza.ufl.edu/puneetk7/Managerial Acg...
21
1 Chapter 3: Cost-Volume-Profit Analysis and Planning 2 Agenda Direct Materials, Direct Labor, and Overhead Traditional vs. Contribution Margin Income Statements Cost-Volume-Profit (CVP) Analysis Profit Planning Nonunit-Level CVP (a customer profitability example) Effect of Operating Leverage on Profitability
-
Upload
truongkien -
Category
Documents
-
view
227 -
download
3
Transcript of Chapter 3: Cost-Volume-Profit Analysis and Planningplaza.ufl.edu/puneetk7/Managerial Acg...

1
Chapter 3:
Cost-Volume-Profit Analysis and Planning
2
Agenda
Direct Materials, Direct Labor, and OverheadTraditional vs. Contribution Margin Income StatementsCost-Volume-Profit (CVP) AnalysisProfit PlanningNonunit-Level CVP (a customer profitability example)Effect of Operating Leverage on Profitability
2
3
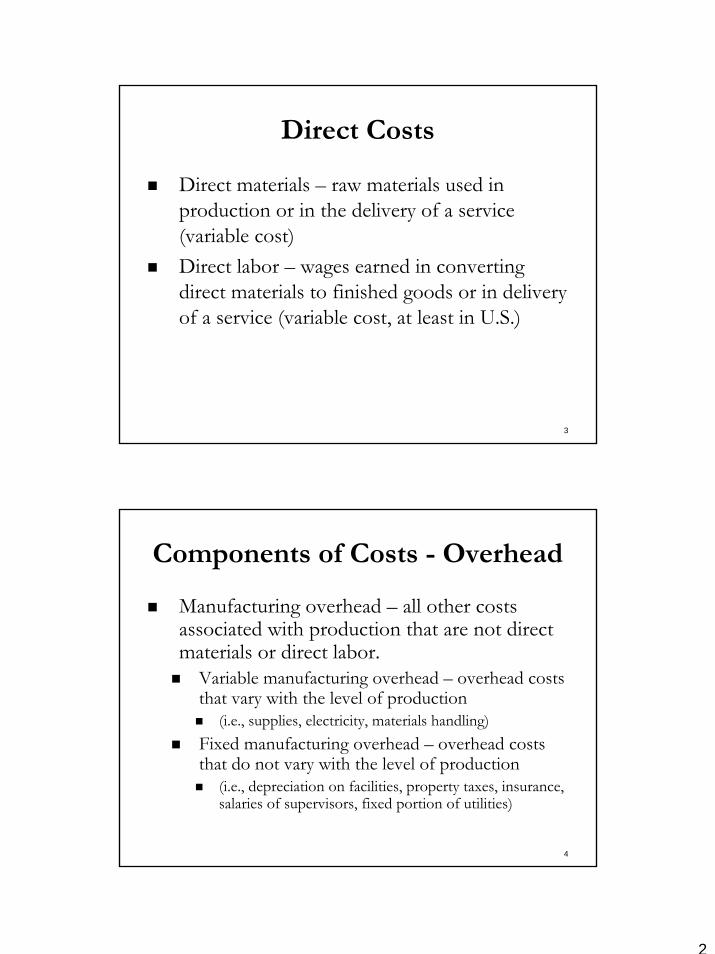
Direct Costs
Direct materials – raw materials used in production or in the delivery of a service (variable cost)Direct labor – wages earned in converting direct materials to finished goods or in delivery of a service (variable cost, at least in U.S.)
4
Components of Costs - Overhead
Manufacturing overhead – all other costs associated with production that are not direct materials or direct labor.
Variable manufacturing overhead – overhead costs that vary with the level of production
(i.e., supplies, electricity, materials handling)Fixed manufacturing overhead – overhead costs that do not vary with the level of production
(i.e., depreciation on facilities, property taxes, insurance, salaries of supervisors, fixed portion of utilities)
3
5
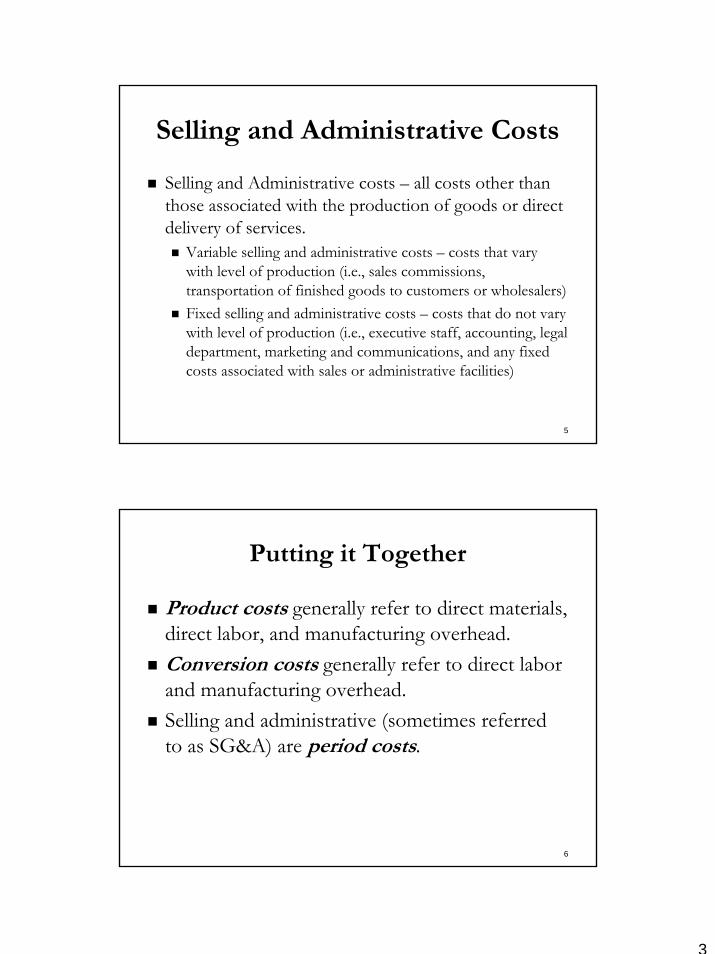
Selling and Administrative Costs
Selling and Administrative costs – all costs other than those associated with the production of goods or direct delivery of services.
Variable selling and administrative costs – costs that vary with level of production (i.e., sales commissions, transportation of finished goods to customers or wholesalers)Fixed selling and administrative costs – costs that do not vary with level of production (i.e., executive staff, accounting, legal department, marketing and communications, and any fixed costs associated with sales or administrative facilities)
6
Putting it Together
Product costs generally refer to direct materials, direct labor, and manufacturing overhead.Conversion costs generally refer to direct labor and manufacturing overhead.Selling and administrative (sometimes referred to as SG&A) are period costs.

4
7
Traditional Income Statement
Sales XXXXLess Expenses (XXX)= Net Income XXXXWe use income statements in managerial accounting also, but we tailor them to planning and decision-making. We would like to know how much income we earn on different products to cover our fixed costs:
8
Traditional (or Functional) Income Statement:
Sales XXXXLess Cost of Goods Sold:
Direct materials XXXDirect labor XXXVariable mfg overhead XXXFixed mfg overhead XXX
Total cost of goods sold (XXX)= Gross Margin (or profit) XXXX Less Selling and Admin:
Variable S&A XXXFixed S&A XXX
Total S&A expense (XXX)= Net income XXXX
5
9
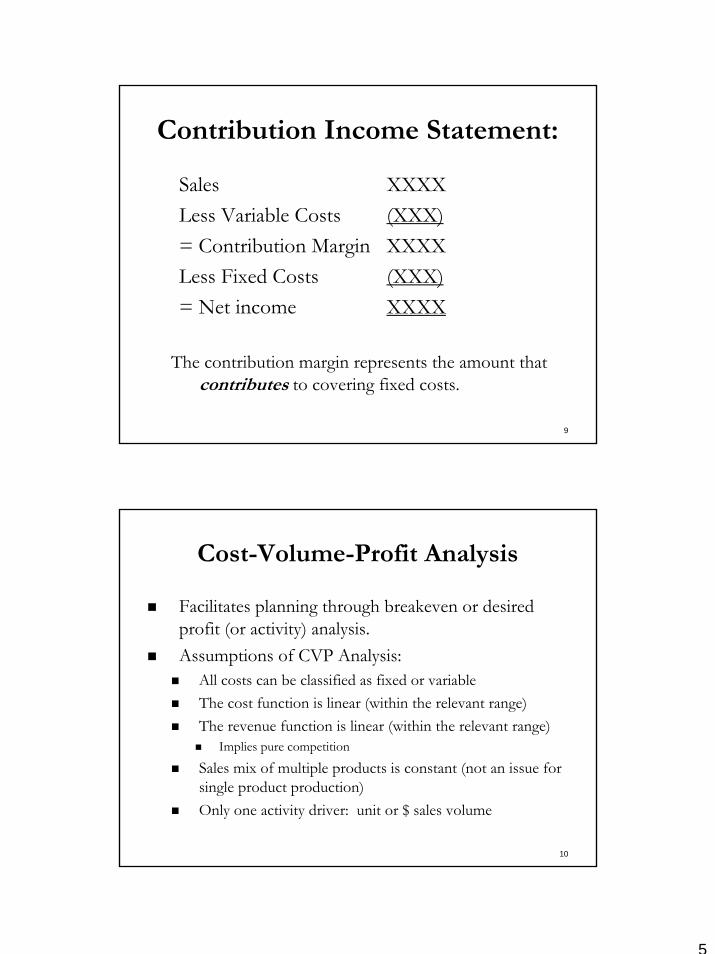
Contribution Income Statement:
Sales XXXXLess Variable Costs (XXX)= Contribution Margin XXXX Less Fixed Costs (XXX)= Net income XXXX
The contribution margin represents the amount that contributes to covering fixed costs.
10
Cost-Volume-Profit Analysis
Facilitates planning through breakeven or desired profit (or activity) analysis. Assumptions of CVP Analysis:
All costs can be classified as fixed or variableThe cost function is linear (within the relevant range)The revenue function is linear (within the relevant range)
Implies pure competition
Sales mix of multiple products is constant (not an issue for single product production)Only one activity driver: unit or $ sales volume
6
11
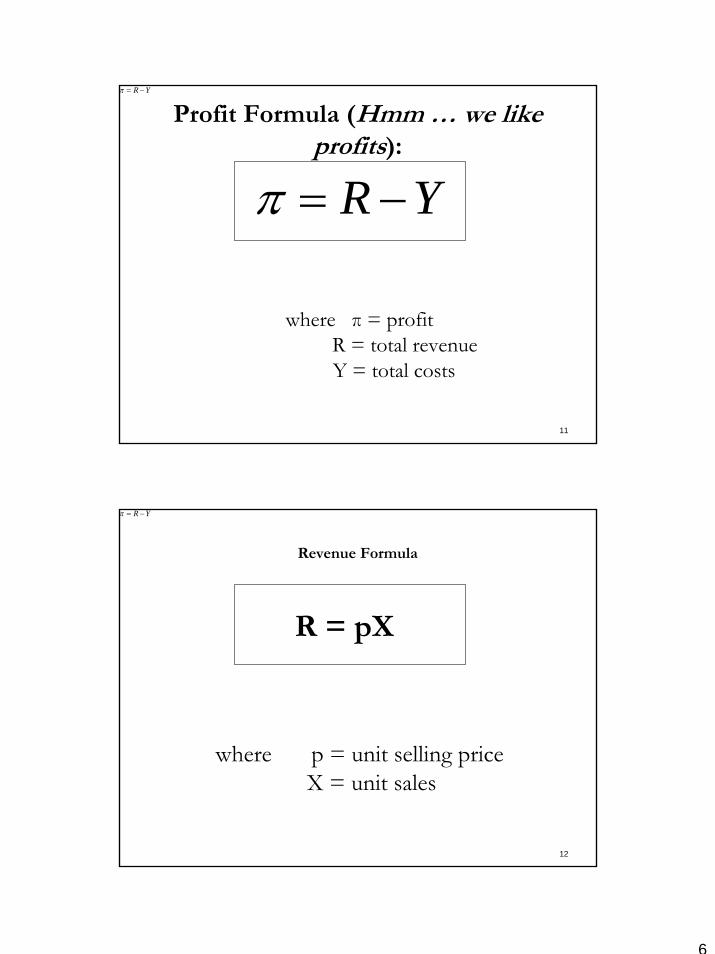
Profit Formula (Hmm … we like profits):
YR −=π
YR −=π
where π = profitR = total revenueY = total costs
12
Revenue Formula
YR −=π
where p = unit selling priceX = unit sales
R = pX
7
13
Cost Formula:
YR −=π
where a = fixed costsb = unit variable cost
Y = a + bX
14
Can then rewrite the profit formula as:
)( bXapX +−=π
YR −=π
Can use this formula for a given price, cost and activity level to predict future profits.
)( bXapX +−=π )( bXapX +−=π

8
15
Breakeven Analysis:
Breakeven point = the sales volume necessary to cover all costs
= Total revenues - Total Costs
= Profit = 0
16
Can use algebra to determine the breakeven point
Start with the following equality:
Total Revenues = Total CostspX = a + bX
and solve for X:pX – bX = a(p – b)X = a
X = a / (p – b)
In other words, the breakeven point (in units) is equal to total fixed costs divided by the contribution margin per unit.

9
17
Example
Suppose the student union has a walk-up copy division where customers pay 5 cents per copy and the union receives ½ cent per copy to cover the rent of the space. The university provides the machine, paper, toner, and service. Machines are serviced every 30,000 copies at an average cost of $90 per service call. Paper and toner cost ½ cent per copy combined. The university is charged $185 monthly rental per machine.
What is the breakeven point?
18
Solution
First, what are the variable costs per copy?Paper and toner $0.005Union rent 0.005Service ($90/30,000) 0.003Total Variable Costs $0.013
What is the contribution margin per unit?Price per copy $0.050Less VC/unit ( 0.013)Contribution margin $0.037
What are the fixed costs?$185 rental of machine
How many copies are needed each month to breakeven?Breakeven Point = $185 / $0.037
= 5,000 copies per month

10
19
Breakeven point in $
If you want the breakeven point in sales dollars, just multiply X by the unit selling price (p). Or another method is the following:$ Sales = a / Contribution margin ratio
where:Contribution margin ratio – expresses contribution margin as a % of sales price:Contribution margin ratio = contribution margin
per unit/ unit selling price
20
Guess which firm has the highest contribution margin ratio:
McDonald’s versus UAL (United Airlines)UAL
Ford Motor Company versus KrogerFord Motor Company
Oracle versus SearsOracle
Nordstrom versus E*TradeE*Trade
Coca-Cola versus Wal-MartCoca-Cola

11
21
Example – E3-15 p. 93
Determine the annual break-even dollar sales volume:
Sales $750,000Variable costs (412,500)Contribution margin $337,500Contribution margin ratio = $337,500/$750,000 = 0.45
Annual break-even dollar sales volume = $210,000/0.45 = $466,667
22
Example – E3-15 p. 93
Determine the annual margin of safety:Sales $750,000Break-even sales dollars (466,667)Margin of safety $283,333

12
23
Example – E3-15 p. 93
Prepare a CVP graph:To determine the variable and total costs lines, it is necessary to compute the variable cost ratio:Variable = variable costs = $412,500 = 0.55cost ratio sales $750,000
At a volume of $1,000,000 sales dollars, variable costs are $550,000.
24
CVP Graph
$0
$250,000
$500,000
$750,000
$1,000,000
$0 $250,000 $500,000 $750,000 $1,000,000 $1,250,000
Total Revenues
Total Revenues and
Total Costs
Fixed costs = $210,000
Variable costs = $412,500
Profit =$127,500
13
25
Example – E3-15 p. 93
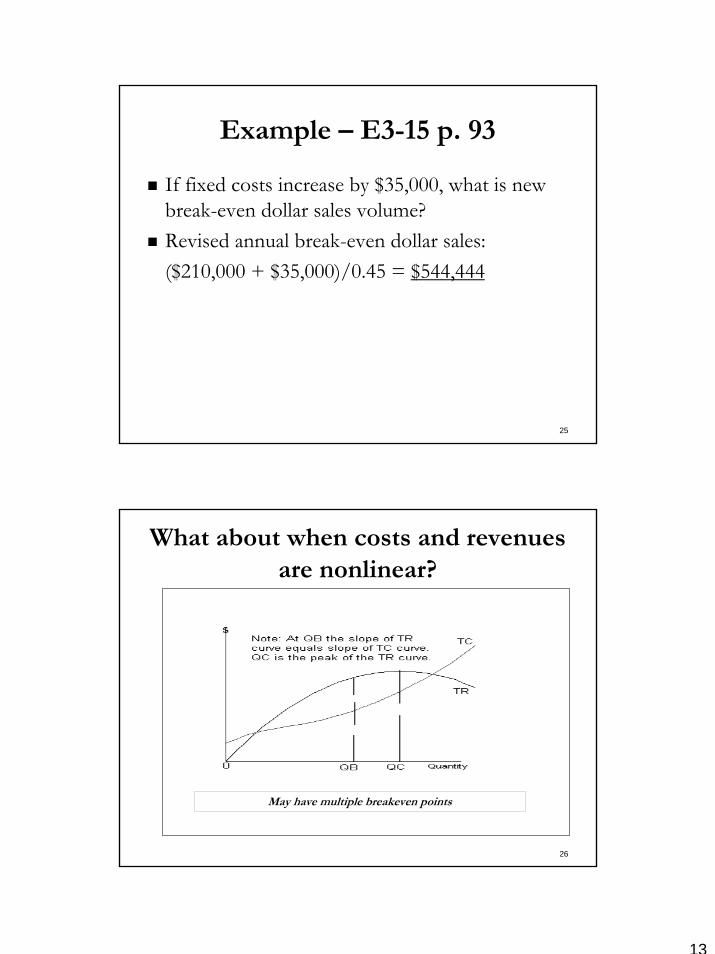
If fixed costs increase by $35,000, what is new break-even dollar sales volume?Revised annual break-even dollar sales:($210,000 + $35,000)/0.45 = $544,444
26
What about when costs and revenues are nonlinear?
May have multiple breakeven points

14
27
Profit Planning:
Can establish a plan to reach a specific profit target.Can state profit in numerous ways:
% of last year’s income% of assets (ROA)% of sales (Profit margin)% of equity (ROE)
CVP provides a rough and quick method for scenario planning (feasibility analysis).
Must consider demand and supply conditions in conjunction with assessing feasibility.
Next step after CVP would be a full-out budget.
28
Target Sales Volume:
Target unit sales volume = (Fixed costs + Desired profit)/Unit contribution marginNotice this is the same as the breakeven formula, only we’ve added desired profit to fixed costs (a) in the numerator.
15
29
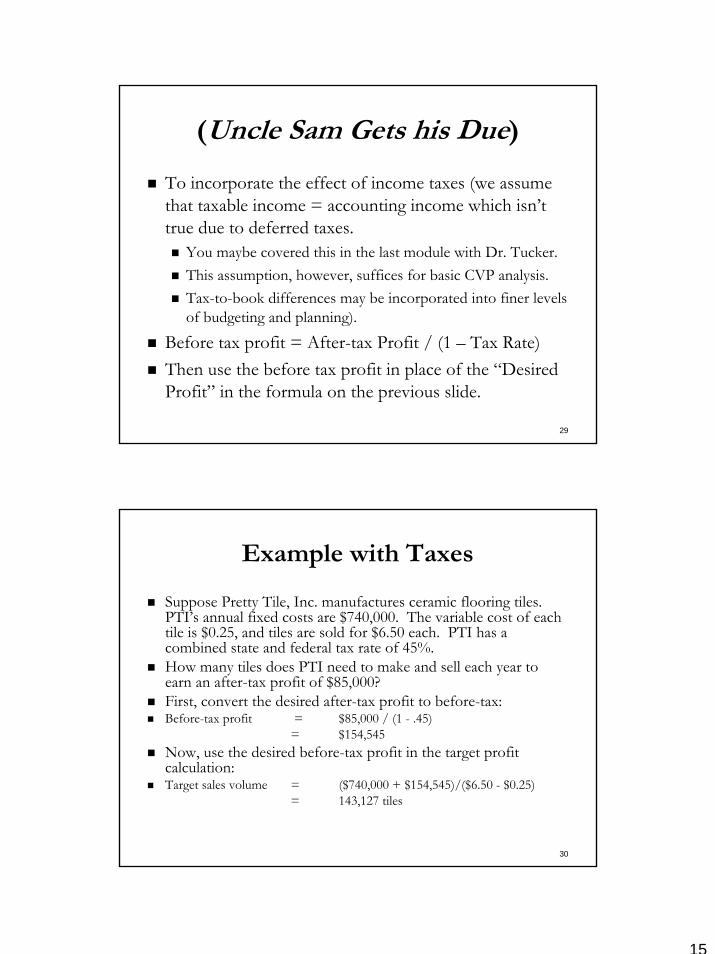
(Uncle Sam Gets his Due)
To incorporate the effect of income taxes (we assume that taxable income = accounting income which isn’t true due to deferred taxes.
You maybe covered this in the last module with Dr. Tucker.This assumption, however, suffices for basic CVP analysis.Tax-to-book differences may be incorporated into finer levels of budgeting and planning).
Before tax profit = After-tax Profit / (1 – Tax Rate)Then use the before tax profit in place of the “Desired Profit” in the formula on the previous slide.
30
Example with Taxes
Suppose Pretty Tile, Inc. manufactures ceramic flooring tiles. PTI’s annual fixed costs are $740,000. The variable cost of each tile is $0.25, and tiles are sold for $6.50 each. PTI has a combined state and federal tax rate of 45%.How many tiles does PTI need to make and sell each year to earn an after-tax profit of $85,000?First, convert the desired after-tax profit to before-tax:Before-tax profit = $85,000 / (1 - .45)
= $154,545Now, use the desired before-tax profit in the target profit calculation:Target sales volume = ($740,000 + $154,545)/($6.50 - $0.25)
= 143,127 tiles
16
31
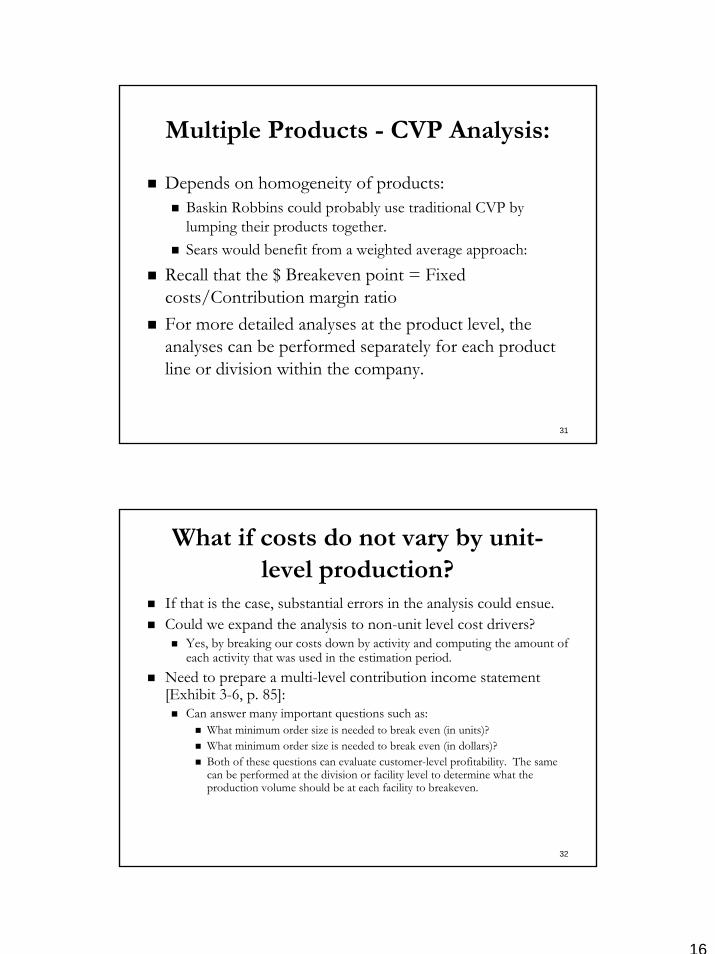
Multiple Products - CVP Analysis:
Depends on homogeneity of products: Baskin Robbins could probably use traditional CVP by lumping their products together.Sears would benefit from a weighted average approach:
Recall that the $ Breakeven point = Fixed costs/Contribution margin ratioFor more detailed analyses at the product level, the analyses can be performed separately for each product line or division within the company.
32
What if costs do not vary by unit-level production?
If that is the case, substantial errors in the analysis could ensue.Could we expand the analysis to non-unit level cost drivers?
Yes, by breaking our costs down by activity and computing the amount of each activity that was used in the estimation period.
Need to prepare a multi-level contribution income statement [Exhibit 3-6, p. 85]:
Can answer many important questions such as:What minimum order size is needed to break even (in units)?What minimum order size is needed to break even (in dollars)?Both of these questions can evaluate customer-level profitability. The same can be performed at the division or facility level to determine what the production volume should be at each facility to breakeven.

17
33
Example – E3-25
Minimum order size (in sales $) to break even on an order:Minimum order size = $200 = $2,500to break even on order (0.10 – 0.02) Annual sales $ to break even on a customer (assuming 4 orders per year are placed):Annual sales to break- = ($200 × 4 orders) + $1,000 = $22,500
even on average customer (0.10 – 0.02)
34
Example – E3-25
What would average order size be for the average customer’s breakeven point?
Average order size = $22,500/4 = $5,625

18
35
Example – E3-25
Assuming 100 customers are currently served, with each placing 4 orders per year, what is minimum annual sales to breakeven?
Order level costs ($200 × 4 orders × 100 customers) $ 80,000Customer level costs ($1,000 × 100 customers) 100,000Facility level costs 60,000Total costs $ 240,000Contribution margin ratio ÷ 0.08Minimum annual sales to break even $3,000,000
What is average order size per customer?Average order size = $3,000,000/(4 orders × 100 customers) = $7,500
36
Example – E3-25
Explain the differences in the answers to (a), (c), and (e).
Part (a) considers only order level costs while part (c) also considers customer level costs, and part (e) adds facility level costs. In order for a company to break even on an order, it need only cover order level costs. To break even on a customer, the company must cover order level and customer level costs. Finally, to achieve true break-even, all costs must be covered.

19
37
Effect of Operating Leverage:
Operating leverage represents the degree to which an organization’s costs are fixed: Degree of operating leverage = Contribution Margin / Before-Tax ProfitWould a firm rather have a higher or lower degree of operating leverage?
Higher may be desirable because additional sales have an increasing effect on profit (the fixed costs are spread across more units and overall profitability goes up).Lower may be desirable because it allows a firm more financial flexibility (remember only the variable costs are relevant in on-going operations). Also, a decrease in sales has a more severe effect on profitability the higher the operating leverage (the mirror condition of point 1 above).
38
Suppose two internet retailers have the following data:
(millions) BuyEverything.com CheapSports.com Sales $120 $186 Variable Costs 70 150 Fixed Costs 40 24 Net Income $ 10 $ 12
20
39
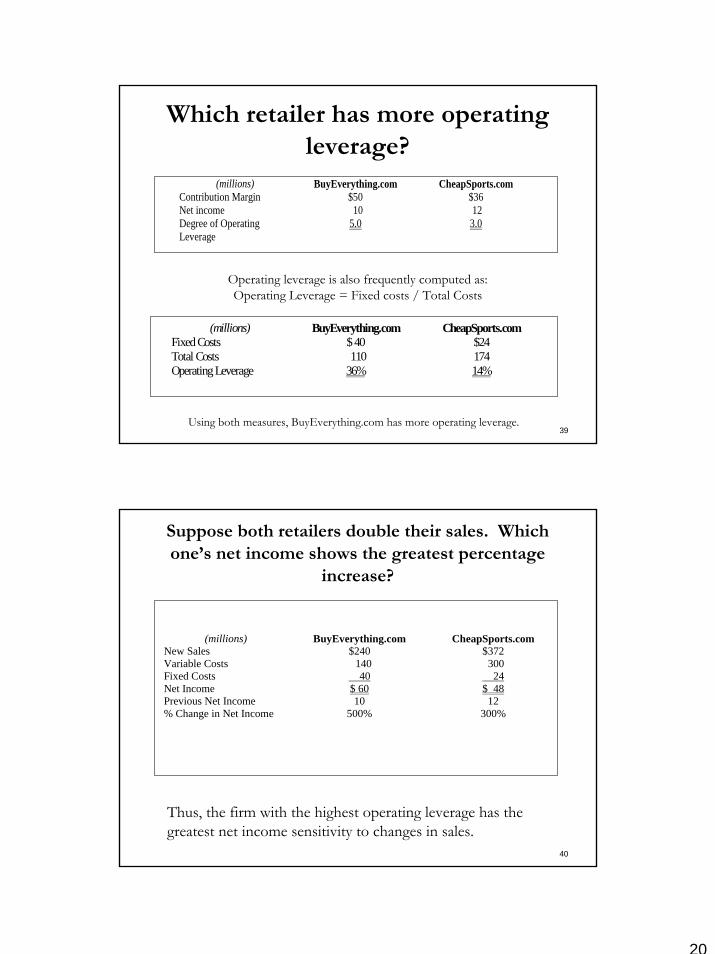
Which retailer has more operating leverage?
(millions) BuyEverything.com CheapSports.com Contribution Margin $50 $36 Net income 10 12 Degree of Operating Leverage
5.0 3.0
Operating leverage is also frequently computed as:Operating Leverage = Fixed costs / Total Costs
Using both measures, BuyEverything.com has more operating leverage.
(millions) BuyEverything.com CheapSports.com Fixed Costs $ 40 $24 Total Costs 110 174 Operating Leverage 36% 14%
40
Suppose both retailers double their sales. Which one’s net income shows the greatest percentage
increase?
(millions) BuyEverything.com CheapSports.com New Sales $240 $372 Variable Costs 140 300 Fixed Costs 40 24 Net Income $ 60 $ 48 Previous Net Income 10 12 % Change in Net Income 500% 300%
Thus, the firm with the highest operating leverage has the greatest net income sensitivity to changes in sales.
21
41
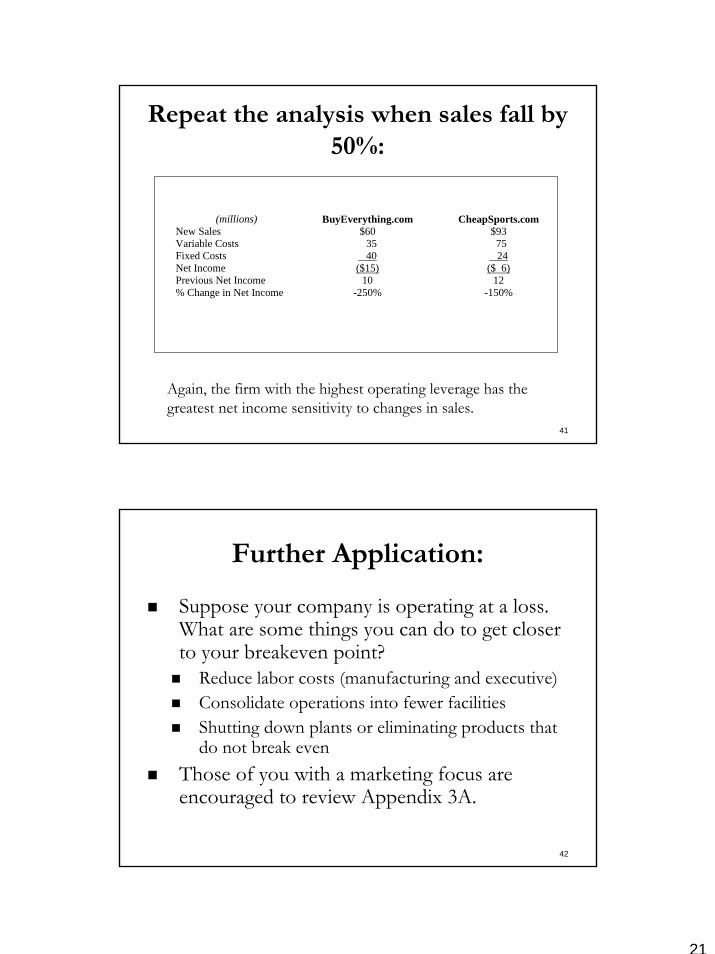
Repeat the analysis when sales fall by 50%:
Again, the firm with the highest operating leverage has the greatest net income sensitivity to changes in sales.
(millions) BuyEverything.com CheapSports.com New Sales $60 $93 Variable Costs 35 75 Fixed Costs 40 24 Net Income ($15) ($ 6) Previous Net Income 10 12 % Change in Net Income -250% -150%
42
Further Application:
Suppose your company is operating at a loss. What are some things you can do to get closer to your breakeven point?
Reduce labor costs (manufacturing and executive)Consolidate operations into fewer facilitiesShutting down plants or eliminating products that do not break even
Those of you with a marketing focus are encouraged to review Appendix 3A.