The Moose Hunt By: Harvey and Chase StartStart moose huntmoosehunt.

SPECIES MANAGEMENT REPORT
Alaska Department of Fish and Game Division of Wildlife Conservation
(907) 465-4190 – PO Box 115526 Juneau, AK 99811-5526
CHAPTER 22: MOOSE MANAGEMENT REPORT From: 1 July 2011 To: 30 June 20131
LOCATION GAME MANAGEMENT UNIT: 20A (6,796 mi2; ~5,040 mi2 of moose habitat)
GEOGRAPHIC DESCRIPTION: Tanana Flats, central Alaska Range
BACKGROUND Moose are found throughout the Tanana Flats and adjacent Alaska Range foothills at exceptionally high densities relative to similarly sized areas throughout North America. The Unit 20A moose population is a world–class wildlife resource. Gasaway et al. (1983) presented a detailed history of the Unit 20A moose population through 1978, while Boertje et al. (1996) presented a history through 1994. More recent publications that discuss important management implications include those by Young and Boertje (2004, 2008, 2011), Young et al. (2006), Boertje et al. (2007), and Boertje et al. (2009).
Preferred moose habitat is composed of riparian willow, poorly drained meadows, shallow lakes, early successional forest, and subalpine shrub communities. Suitable moose habitat covers approximately 5,040 mi2 of the unit (the area below 4,000 feet in elevation exclusive of large lakes).
Moose numbers increased in Unit 20A during the 1950s and reached high densities in the early 1960s, perhaps 4–5 moose/mi2. Reported annual moose harvests averaged 311 moose between 1963 and 1969 (McNay 1992). During 1969–1974, reported harvest increased to an average of 617 moose per year. Cow moose compose 34% of the annual harvest during 1963–1974.
Similar to numerous other ungulate populations in Alaska, the moose population declined beginning in the late 1960s and reached its lowest point in the mid-1970s. Beginning in 1975, seasons and harvests were dramatically reduced and taking of cows was prohibited. During 1975–1978, mean annual reported moose harvest was 64 bulls.
Between February 1976 and April 1982 the Alaska Department of Fish and Game (ADF&G) reduced wolf numbers. The moose population in Unit 20A increased rapidly during these reduction efforts and continued to increase at a reduced rate through 2004. During 1979–1982, reported harvests averaged 226 bulls per year (McNay 1992). During 1983–1993 the mean
1 At the discretion of the reporting biologist, this unit report may contain data collected outside the report period.
Chapter 22: Moose management report ADF&G/DWC/SMR-2014-6 Page 22-1

annual harvest increased to 358 bulls. A wolf control program to reduce predation on the declining Delta caribou herd began in October 1993, but was discontinued in December 1994. ADF&G staff reduced wolf numbers by trapping and snaring, and this appeared to influence moose population dynamics. Antlerless hunts were resumed during 1996–1998, suspended in 1999, and again resumed during 2000–2007. Reported harvest of bulls reached all-time highs in the late 1990s ( x = 623 bulls, 1996–1999), but these harvests were not sustainable. As a result, seasons were shortened in 2000, and antler restrictions were imposed in 2002 (Young and Boertje 2008). Evidence of an increasing, high-density, nutritionally stressed moose population led to liberal antlerless hunts by registration permit across the entire unit during 2004–2007 to reduce the moose population (Young et al. 2006, Boertje et al. 2007, Young and Boertje 2011). During 2008–2013, antlerless harvests were scaled back to moderate levels to stabilize the population at approximately 12,000 moose via a combination of drawing and registration permits. In 2014, antlerless harvest was suspended because the fall 2013 population estimate fell below the low end of the intensive management of 12,000 moose.
Regulations provided for a wide variety of hunting opportunities in Unit 20A. For example, the southwestern portion of the unit currently includes the Wood River controlled use area (WRCUA; no motorized access except aircraft), the Ferry Trail management area (FTMA; motorized access, but antler restrictions since 1988), the Healy–Lignite management area (HLMA; bowhunting only) and the Yanert controlled use area (YCUA; no motorized access except aircraft, antler restrictions since 1988). Hunts include a November muzzleloader drawing permit hunt for bull moose (1996–2000 and 2004–2013), drawing permit hunts for “any bull” moose (2006–2013) concurrent with the antler restricted general season hunt, and antlerless moose hunts by drawing (1996–1998, 2001–2003, 2009–2013) and registration permits (2004–2013) with seasons extending up to 7 months in portions of the unit.
Approximately one-third of Unit 20A is military land, including 1,003 mi2 used by the U.S. Army at Fort Wainwright, 893 mi2 by the U.S. Army at Fort Greely, and 17 mi2 by the U.S. Air Force at Clear Air Force Station. A variety of access restrictions, both spatial and temporal, apply to portions of these military lands.
MANAGEMENT DIRECTION MANAGEMENT GOALS Protect, maintain, and enhance the moose population and its habitat in concert with other
components of the ecosystem.
Provide the greatest sustained opportunity to participate in hunting moose.
Provide an opportunity to view and photograph moose.
MANAGEMENT OBJECTIVES Manage for a November population of between 12,000 and 15,000 moose.
Manage population levels based on 2-year mean twinning rates in conjunction with at least one of the following signals to substantiate low twinning-based nutritional status: 50% of
Chapter 22: Moose management report ADF&G/DWC/SMR-2014-6 Page 22-2

36-month-old moose are parturient, average multi-year short yearling mass is <385 lb (175 kg), or >35% of annual browse biomass is removed by moose (Boertje et al. 2007):
• <10% twinning rate — reduce the moose population
• 10–20% twinning rate — maintain a stable moose population
• >20% twinning rate — manage for population growth
Manage for a harvest of 900–1,100 moose annually.
Manage for a posthunting sex ratio of ≥30 bulls:100 cows overall and ≥20 bulls:100 cows in the Tanana Flats, western foothills, and eastern foothills areas.
METHODS POPULATION STATUS AND TREND 2011 Geospatial Population Estimation Survey We used the geospatial population estimation (GSPE) method (Kellie and DeLong 2006) to survey 138 survey units (SU; 94 high density and 44 low density; 802 mi2) of 987 SUs (5,747 mi2) during 16–28 November. A simple random sample of 100 SUs (70 high density and 30 low density) was selected from each stratum using Microsoft Excel® software. An additional 15 SUs (8 high density and 7 low density) were selected to intensively survey (i.e., a total of 21 contiguous SUs) in the northcentral Tanana Flats and another 23 SUs (16 high density and 7 low density) were selected to fill gaps in the randomized coverage.
Search time per SU with 100% moose habitat averaged 7.9 min/mi2 (n = 97 SUs). Survey conditions (Gasaway et al. 1986) with regard to snow (age and cover), light (intensity and type), and wind (strength and turbulence) were mostly excellent (51%) and good (47%) with the remainder being fair (1%) (n = 138).
2012 Geospatial Population Estimation Survey We used the GSPE method (Kellie and DeLong 2006) and surveyed 111 SUs (77 high density and 34 low density; 646 mi2) of 987 SUs (5,747 mi2) during 7–13 November. A simple random sample of 100 SUs (70 high density and 30 low density) was selected from each stratum using Microsoft Excel software. An additional 10 SUs (7 high density and 3 low density) were selected to fill gaps in the randomized coverage and 1 SU (low density) was done by mistake.
Search time per SU with 100% moose habitat averaged 8.5 min/mi2 (n = 73 SUs). Survey conditions (Gasaway et al. 1986) with regard to snow (age and cover), light (intensity and type), and wind (strength and turbulence) were mostly good (55%) and excellent (41%) with the remainder being fair (4%) (n = 111).
2013 Geospatial Population Estimation Survey We used the GSPE method (Kellie and DeLong 2006) and surveyed 122 SUs (84 high density and 38 low density; 710 mi2) of 987 SUs (5,747 mi2) during 29 November–8 December. A simple random sample of 104 SUs (73 high density and 31 low density) was selected from each stratum using Microsoft Excel software. An additional 18 SUs (11 high density and 7 low
Chapter 22: Moose management report ADF&G/DWC/SMR-2014-6 Page 22-3

density) were selected to fill gaps in the randomized coverage. We eliminated 1 SU (no. 80), a posteriori, from the analysis because it was 100% non-moose habitat.
Search time per SU with 100% moose habitat averaged 7.8 min/mi2 (n = 85 SUs). Survey conditions (Gasaway et al. 1986) with regard to snow (age and cover), light (intensity and type), and wind (strength and turbulence) were mostly excellent (46%) and good (44%) with the remainder being fair (8%) and poor (2%) (n = 122).
Twinning Surveys Twinning rate surveys were expanded in 2006 beyond the traditional survey areas in the central Tanana Flats to include the eastern and western Tanana Flats. Surveys consisted of roughly parallel transects flown at approximately ½-mile intervals at ≤500 feet above ground level in PA-18 or Scout aircraft by experienced pilots with observers. All moose observed were classified as bull; yearling cow; adult cow without a calf; or adult cow with single, twin, or triplet calves. Twinning rate surveys were flown in late May during or within a few days of the median calving date (Boertje et al. 2007) to minimize potential biases resulting from predation on one calf of a pair of twins. To increase the power of statistical comparisons between survey areas and across years, we established, a priori, a desired sample size of ≥50 cows with calves. Twinning rate was calculated as the proportion of cows with twins or triplets from the sample of all cows with calves.
HARVEST We estimated annual harvest from mandatory harvest report cards. Harvest data were summarized by regulatory year (RY), which begins 1 July and ends 30 June (e.g., RY11 = 1 July 2011–30 June 2012). This included data from report cards from the general season hunt, registration hunts (i.e., antlerless hunts RM764 and RM768), and drawing hunts (i.e., antlerless hunts DM683–DM697 [RY11], DM628–DM679 [RY12–RY13], November muzzleloader bull hunt DM766, and bull hunts DM768–DM774). Hunters received 1 or 2 reminder letters and usually an e-mail and telephone calls if we did not receive timely harvest reports. We summarized data on hunter residency, hunter success, harvest chronology, and transport methods. When antler size of bulls was reported, we considered bulls with antler spreads <30 inches to be yearlings.
We estimated total take (excluding mortality by motor vehicles and trains) as reported hunter harvest times 1.35 (Boertje et al. 2009), which includes all other types of reported (e.g., defense of life and property, dispatched, potlatch, stickdance) and unreported (e.g., illegal, snaring, other, and wounding loss) types of take. We estimated accidental mortality by motor vehicles and trains from Alaska Department of Public Safety and Alaska Railroad Corporation records.
WEATHER We evaluated weather (snowfall and temperature) using National Weather Service records and personal observations.
Chapter 22: Moose management report ADF&G/DWC/SMR-2014-6 Page 22-4

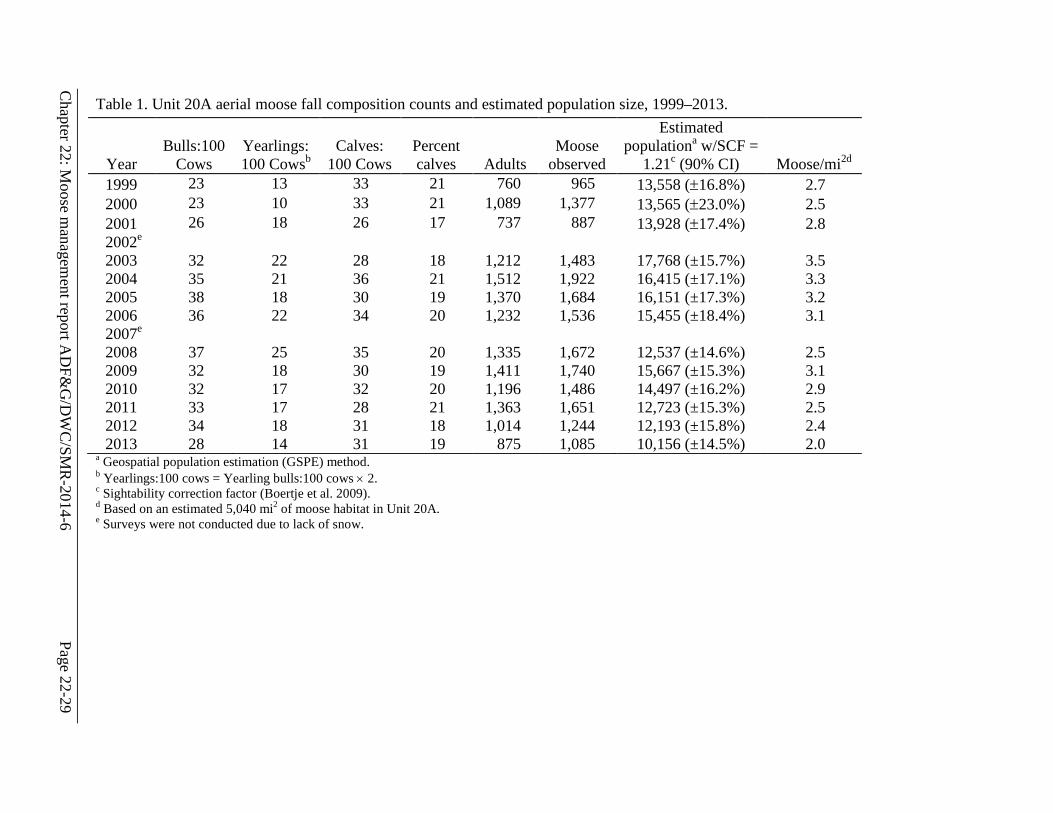
RESULTS AND DISCUSSION POPULATION STATUS AND TREND Population Size Moose densities remained high at an estimated 2.4–2.5 moose/mi2 during RY11–RY12 (Table 1). The Unit 20A moose population increased between 1999 and 2003, peaking at about 15,000–20,000 moose (Young 2008). Lower population estimates in 2011 and 2012 (Table 1) in conjunction with poor productivity, particularly in 2001, 2003, 2007, and 2010 (ADF&G files, Fairbanks), and liberal antlerless harvests during RY04–RY07 indicate a measurable population decline between 2003 and 2012. A trend model of the cow segment of the population (i.e., that segment of the population with the least annual variability) that declined from an estimated (with SCF = 1.21) 9,483 cows in 2004 to 8,059 cows in 2011 resulted in an average annual finite growth rate of 0.98 [SE = 0.016] during that period.
Population Composition Bull:cow ratios steadily increased between 2000 and 2005 and remained high through 2008 (Table 1). We deliberately increased bull harvest in RY08 and RY09 by issuing additional “any bull” drawing permits (750 in RY08 and 1,000 in RY09) to reduce bull:cow ratios to the management objective of 30:100. This reduction was consistent with our intensive management strategy to manage for elevated yield and to reduce moose densities in order to protect the moose population’s health and habitat. By 2009, bull:cow ratios had declined to 32:100. To stabilize bull:cow ratios at that level, we reduced the number of “any bull” drawing permits (896 in RY10, 752 in RY11, and 800 in RY12) to reduce the harvest of bulls to 4–5% of the estimated prehunt moose population or 15–20% of the prehunt bull moose population. This harvest strategy resulted in mean bull:cow ratios of 33:100 (range 32–34) during 2009–2012.
Sex ratios exceeded 20 bulls:100 cows in the Tanana Flats, western foothills–mountains, and eastern foothills–mountains of Unit 20A. Unlike 2001, when bull:cow ratios were much higher in the eastern foothills–mountains (40:100) than the Tanana Flats (26:100) and western foothills–mountains (22:100), bull:cow ratios were more similar across the unit during 2003–2006 and 2008 (Young 2010). This trend continued during 2009–2011 (Young 2012) and 2012 (2012: Tanana Flats 31:100, western foothills–mountains 35:100, and eastern foothills–mountains 35:100).
Yearling recruitment (i.e., yearlings:100 cows) was relatively strong during 2003–2012, averaging 20:100 (range = 17–25:100; Table 1). Also, estimated percent yearlings in the population was 11–15% during that period. Moose populations with >10% yearlings during fall, particularly in areas where mortality factors such as deep snow or predation are of minimal importance, likely exceed maintenance level recruitment (Bishop and Rausch 1974:573). Unit 20A has not had a deep snow winter (accumulated snow depth >35.5 inches; Boertje et al. 1996) since winter 1992–1993 and predation has been relatively low (Boertje et al. 2009), which suggests the moose population could have increased during 2003–2012 had harvest rates of antlerless moose remained low. The proportion of yearlings in the Unit 20A moose population likely would have been even higher had it not been for 1) spike, forked, or 50-inch antler restrictions initiated in RY02, which typically result in higher harvests of yearling bulls than an “any bull” harvest strategy; and 2) probable misclassification of yearlings with retarded antler development. Surveys conducted in late August 2007–2009 of known-age radiocollared moose
Chapter 22: Moose management report ADF&G/DWC/SMR-2014-6 Page 22-5

revealed that 22% (11 of 51) of the 15-month-old bulls had antlers ≤6 inches in length (D. Young, ADF&G files, Fairbanks). To ensure that 2-year-old bulls were not being misclassified as yearlings and artificially inflating the proportion of yearlings in the population, we also classified known-age, 27-month-old bulls during those surveys. Using brow–main palm separation, antler spread, antler length, and body size, collectively, all 27-month-old bulls (n = 43) likely would have been classified correctly (i.e., as 2-year olds) during fall surveys.
Twinning Rates 2012 Twinning Surveys. Surveys were flown afternoons and evenings (13:28–19:13 ADT; Fig. 1). Leaf-out was nearly complete. Weather, turbulence, and airsickness were not factors. Total flight time (including ferry time) was 17.5 hours ($3,938) and total survey time was 14.8 hours. We observed 683 moose ≥1 year (46 moose/hour); 128 (19%) parturient moose; and 9 parturient moose/hour. Mean (northcentral, western Tanana Flats, and eastern Tanana Flats–foothills) observed twinning rate was 12% (Table 2). We observed 2 independent black bears, both in the northcentral Tanana Flats.
Northcentral Tanana Flats — Surveys were conducted on 25 May south of the Tanana River, east of the Wood River, west of the Blair Lakes Impact Area Trail, and north of approximately N64°22.5′ (Fig.1). Total flight time was 5.5 hours ($1,238) and actual survey time was 5.1 hours. We observed 279 moose (≥1 year old) or 55 moose/hour; 54 (19%) parturient moose; and 11 parturient moose/hour. The observed twinning rate was 22% (12/54; Table 2).
Western Tanana Flats — Surveys were conducted on 26 May south of the Tanana River, west of Tatlanika Creek, east of the George Parks Highway, and north of the Rex Trail (Fig. 1). Total flight time was 6.2 hours ($1,395) and actual survey time was 5.3 hours. We observed 205 moose (≥1 year old) or 39 moose/hour; 42 (21%) parturient moose; and 8 parturient moose/hour. The observed twinning rate was 10% (4/42; Table 2).
Eastern Tanana Flats-Foothills — Surveys were conducted on 27 May south of the Tanana River, east of Delta Creek, west of the Delta River, and north of N63°53.5′ (Fig.1). Total flight time was 5.8 hours ($1,305) and actual survey time was 4.4 hours. We observed 199 moose (≥1 year old) or 45 moose/hour; 32 (16%) parturient moose; and 7 parturient moose/hour. The observed twinning rate was 3% (1/32; Table 2).
2013 Twinning Surveys. Surveys were flown afternoons and evenings (13:25–21:10 ADT; Fig. 2). Leaf-out was nearly complete. Weather, turbulence, and airsickness were not factors. Total flight time (including ferry time) was 16.4 hours ($3,690) and total survey time was 13.35 hours. We observed 629 moose ≥1 year (47 moose/hour); 123 (20%) parturient moose; and 9 parturient moose/hour. Mean (northcentral, western Tanana Flats, and eastern Tanana Flats–foothills) observed twinning rate was 12% (Table 2). We observed 3 independent grizzly bears (a breeding pair and a female with 2 dependent cubs) both in the 2009 Rex Burn in the western Tanana Flats. We observed no black bears.
Northcentral Tanana Flats — Surveys were conducted on 29 May south of the Tanana River, east of the Wood River, west of the Blair Lakes Impact Area Trail, and north of approximately N64°22.22′ (Fig. 2). Total flight time was 5.0 hours ($1,125) and actual survey time was
Chapter 22: Moose management report ADF&G/DWC/SMR-2014-6 Page 22-6

4.78 hours. We observed 261 moose (≥1 year old) or 55 moose/hour; 48 (18%) parturient moose; and 10 parturient moose/hour. The observed twinning rate was 10% (5/48; Table 2).
Western Tanana Flats — Surveys were conducted on 30 May south of the Tanana River, west of Tatlanika Creek, east of the George Parks Highway, and north of the Rex Trail (Fig. 2). Total flight time was 5.9 hours ($1,327.50) and actual survey time was 4.97 hours. We observed 208 moose (≥1 year old) or 42 moose/hour; 41 (20%) parturient moose; and 8 parturient moose/hour. The observed twinning rate was 12% (5/41; Table 2).
Eastern Tanana Flats–Foothills — Surveys were conducted on 1 June south of the Tanana River, east of Delta Creek, west of the Delta River, and north of N63°46.0′ (Fig. 2). Total flight time was 5.5 hours ($1,237.50) and actual survey time was 3.6 hours. We observed 160 moose (≥1 year old) or 44 moose/hour; 34 (21%) parturient moose; and 9 parturient moose/hour. The observed twinning rate was 15% (5/34; Table 2).
Average twinning rates, 2006–2013, were lowest in the northcentral Tanana Flats (10%) followed by the eastern Tanana Flats–foothills (13%) and the western Tanana Flats (17%) (Table 2). Overall twinning rates (i.e., northcentral Tanana Flats, western Tanana Flats, and eastern Tanana Flats–foothills) during this same period averaged 13% (Table 2; Young 2012). Based on these twinning rates, which fall between 10% and 20%, we are managing the Unit 20A moose population for zero growth.
Distribution and Movements Moose distribution varies widely across Unit 20A. Boertje et al. (2009) reported that a 2,598 mi2 study area in central Unit 20A contained about 50% of the moose habitat, but about 67% of the moose in November. For example, in 1996 he found 30% higher moose density in the study area compared to the total Unit 20A moose density. In addition, the moose population consists of nonmigratory and migratory subpopulations (Gasaway et al. 1983). From March to May many bull and cow moose migrate from the surrounding foothills (Alaska Range and Chena and Salcha river drainages) to summer range on the Tanana Flats in Unit 20A. They remain there at least through June in most years and return to the foothills from July through October. Although we do not know what proportion of the moose migrate, Gasaway et al. (1983) estimated that the seasonal migrants probably increase the spring density of moose on the Tanana Flats 2- to 4-fold over the density of resident Unit 20A moose. Boertje et al. (2009) estimated that in the 1,807 mi2 Tanana Flats portion of their central study area, calving and summer density was 1.85 times the November (1996) density.
Chapter 22: Moose management report ADF&G/DWC/SMR-2014-6 Page 22-7

MORTALITY Harvest Seasons and Bag Limits. Seasons and bag limits in Unit 20A during RY11 were as follows:
Unit and Bag Limits
Resident Open Season (Subsistence and General Hunts)
Nonresident Open Season
Unit 20A, the Ferry Trail management area, Wood River controlled use area, and the Yanert controlled use area.
RESIDENT HUNTERS: 1 bull with spike-fork antlers or 50-inch antlers or antlers with 4 or more brow tines on one side; or 1 antlerless moose by drawing permit only, up to 2,000 permits may be issued; a person may not take a calf or a cow accompanied by a calf; or 1 antlerless moose by registration permit only; a person may not take a calf or a cow accompanied by a calf; or 1 bull by drawing permit only; up to 1,000 permits may be issued; or 1 bull by drawing permit only; by muzzleloader only; up to 75 permits may be issued. NONRESIDENT HUNTERS: 1 bull with 50-inch antlers or antlers with 4 or more brow tines on one side; or 1 bull with 50-inch antlers or antlers with 4 or more brow tines on one side by drawing permit only; by muzzleloader only; up to 75 permits may be issued.
1 Sep–25 Sep
(General hunt only)
25 Aug–31 Oct (General hunt only)
1 Oct–28 Feb (General hunt only)
1 Sep–25 Sep (General hunt only)
1 Nov–30 Nov
(General hunt only)
1 Sep–25 Sep
1 Nov–30 Nov
Chapter 22: Moose management report ADF&G/DWC/SMR-2014-6 Page 22-8

Unit and Bag Limits
Resident Open Season (Subsistence and General Hunts)
Nonresident Open Season
Remainder of Unit 20A. RESIDENT HUNTERS: 1 bull with spike-fork antlers or 50-inch antlers or antlers with 3 or more brow tines on one side; or 1 antlerless moose by drawing permit only, up to 2,000 permits may be issued; a person may not take a calf or a cow accompanied by a calf; or 1 antlerless moose by registration permit only; a person may not take a calf or a cow accompanied by a calf; or 1 bull by drawing permit only; up to 1,000 permits may be issued; 1 bull by drawing permit only; by muzzleloader only; up to 75 permits may be issued. NONRESIDENT HUNTERS: 1 bull with 50-inch antlers or antlers with 4 or more brow tines on one side. 1 bull with 50-inch antlers or antlers with 4 or more brow tines on one side; by drawing permit only; by muzzleloader only; up to 75 permits may be issued.
1 Sep–25 Sep (General hunt only)
25 Aug–31 Oct (General hunt only)
1 Oct–28 Feb (General hunt only)
1 Sep–25 Sep (General hunt only)
1 Nov–30 Nov
(General hunt only)
1 Sep–25 Sep
1 Nov–30 Nov
Chapter 22: Moose management report ADF&G/DWC/SMR-2014-6 Page 22-9

Seasons and Bag Limits. Seasons and bag limits in Unit 20A during RY12 were as follows:
Unit and Bag Limits
Resident Open Season (Subsistence and General Hunts)
Nonresident Open Season
Unit 20A, the Ferry Trail management area, Wood River controlled use area, and the Yanert controlled use area.
RESIDENT HUNTERS: 1 bull with spike-fork antlers or 50-inch antlers or antlers with 4 or more brow tines on one side; or 1 antlerless moose by drawing permit only, up to 2,000 permits may be issued; a person may not take a calf or a cow accompanied by a calf; or 1 antlerless moose by registration permit only; a person may not take a calf or a cow accompanied by a calf; or 1 bull by drawing permit only; up to 1,000 permits may be issued; or 1 bull by drawing permit only; by muzzleloader only; up to 75 permits may be issued. NONRESIDENT HUNTERS: 1 bull with 50-inch antlers or antlers with 4 or more brow tines on one side; or 1 bull with 50-inch antlers or antlers with 4 or more brow tines on one side by drawing permit only; by muzzleloader only; up to 75 permits may be issued. Remainder of Unit 20A. RESIDENT HUNTERS: 1 bull with spike-fork antlers or 50-inch antlers or antlers with 3 or more brow tines on
1 Sep–25 Sep
(General hunt only)
15 Aug–15 Nov (General hunt only)
1 Oct–30 Nov (General hunt only)
1 Sep–25 Sep (General hunt only)
1 Nov–30 Nov
(General hunt only)
1 Sep–25 Sep (General hunt only)
1 Sep–25 Sep
1 Nov–30 Nov
Chapter 22: Moose management report ADF&G/DWC/SMR-2014-6 Page 22-10

Unit and Bag Limits
Resident Open Season (Subsistence and General Hunts)
Nonresident Open Season
one side; or 1 antlerless moose by drawing permit only, up to 2,000 permits may be issued; a person may not take a calf or a cow accompanied by a calf; or 1 antlerless moose by registration permit only; a person may not take a calf or a cow accompanied by a calf; or 1 bull by drawing permit only; up to 1,000 permits may be issued; 1 bull by drawing permit only; by muzzleloader only; up to 75 permits may be issued. NONRESIDENT HUNTERS: 1 bull with 50-inch antlers or antlers with 4 or more brow tines on one side.
15 Aug–15 Nov
(General hunt only)
25 Aug–28 Feb (General hunt only)
1 Sep–25 Sep (General hunt only)
1 Nov–30 Nov
1 Sep–25 Sep
Alaska Board of Game Actions and Emergency Orders.
March 2011 — The board took the following actions for moose in Unit 20A:
Extended the antlerless drawing permit hunts from 25 August–31 October to 15 August–15 November and “up to” language from 1,000 to 2,000 permits.
Extended the antlerless registration permit season from 10 January–28 February to 1 October–28 February.
Reauthorized antlerless moose hunts.
March 2012 — The board took the following actions for moose in Unit 20A:
Increased the intensive management population objective from 10,000–12,000 to 12,000–15,000 moose and reduced the harvest objective from 1,400–1,600 to 900–1,110 moose.
Modified the bag limit in antlerless hunts to allow the take of calves, but retained the prohibition on the take of cows accompanied by calves (i.e., antlerless moose, a person may not take a cow accompanied by a calf).
Changed the DM766 muzzleloader hunt back to the eastern portion of the Wood River controlled use area (via 5 AAC 92.051. Discretionary permit hunt conditions and procedures).
Chapter 22: Moose management report ADF&G/DWC/SMR-2014-6 Page 22-11

Granted the department discretionary permit hunt authority to require latitude and longitude of kill locations for antlerless moose permit hunts.
Granted the department discretionary permit hunt authority to require a locking tag be attached to the antlers in drawing permit hunts for “any moose” (DM768–DM774).
Reauthorized antlerless moose hunts.
March 2013 — The board took no actions for moose in Unit 20A.
Reauthorized antlerless moose hunts.
March 2014 — The board took the following actions for moose in Unit 20A:
Established targeted moose hunts to address public safety and nuisance moose concerns in very small areas along the road system. Targeted hunts would be implemented by selecting hunters at random from an applicant pool. They will be required to respond quickly to harvest moose from specifically defined “targeted” moose–vehicle collision or nuisance areas, using either shotgun or bow and arrow.
Limit proxy hunters to only taking 1 moose/year by proxy.
Reauthorized antlerless moose hunts.
Harvest by Hunters. Reported harvests of 799 moose in RY11 and 695 in RY12 (Table 3) fell short of the intensive management harvest objective of 900–1,100 adopted by the board in 2012, but harvest densities were the highest recorded for similarly large areas of Interior Alaska.
General Season — Reported harvest of bull moose during the general season increased 63% between RY90–RY91 ( x = 376 bulls) and RY96–RY97 ( x = 613 bulls), and remained relatively stable through RY99. Liberalizing the general season from 20 to 25 days in Unit 20A in RY95 likely contributed to the increased harvest. Average annual reported harvest RY00–RY01 declined to 540 bulls (Young 2006) after the general season was reduced by 5 days (1–20 September) and unitwide antler restrictions were adopted for nonresident hunters. Reported harvest declined further to 353 bulls after unitwide antler restrictions were imposed on resident hunters in RY02. Harvest dipped even lower to 331 bulls in RY03. However by RY05, year 4 of unitwide antler restrictions, reported harvest increased to 444 bulls, probably as a result of higher recruitment of bulls and improved age structure of the population.
A slight decline in reported harvest during the general season in RY06 (408 bulls) and RY07 (384 bulls) was likely the result of a drawing permit hunt initiated for “any bull” moose that ran concurrent with the September general season hunt. During RY06, 300 “any bull” drawing permits were issued and 71 bulls were reported harvested; in RY07, 500 permits were issued and 96 bulls were harvested; in RY08, 750 permits were issued and 142 bulls were harvested; in RY09, 1,000 permits were issued and 194 bulls were harvested. I hypothesize that some general season effort, harvest, and harvest reporting was diverted to the “any bull” drawing permit hunt (i.e., bulls taken by permittees that were legal under the general season spike-fork-50 regulation were reported as being taken under the permit hunt regulation). An increase in total reported harvest of bulls from 452 in RY05 to 621 in RY08 and 607 in RY09, supports this assertion (Tables 4 and 5). A decline in the reported harvest of bulls (i.e., the general hunt and total take)
Chapter 22: Moose management report ADF&G/DWC/SMR-2014-6 Page 22-12

during RY09–RY12 is likely due to the decline in the moose population during that time period (Table 1).
Permit Hunts Bull — Beginning in RY06, in addition to the 75 drawing permits issued for bull moose during the November muzzleloader hunt (DM766), we issued drawing permits (DM768–DM774; Fig. 3) for “any bull” specific to 7 different hunt areas to more effectively manage bull:cow ratios and harvest distribution of bull moose across the unit. Our intent during RY07–RY09 was to reduce bull:cow ratios differentially across the 7 different hunt areas to achieve our unitwide management objective of 30 bulls:100 cows. We increased the number of permits each year during RY06 (n = 300) through RY09 (n = 1,000) and harvest increased commensurately (Table 5) and bull:cow ratios declined to 32:100 by 2009 (Table 1). Beginning in 2010, we reduced the number of “any bull” drawing permits (896 in RY10, 752 in RY11, and 800 in RY12) to reduce the harvest of bulls and maintain bull:cow ratios near 30:100.
Antlerless — Drawing permit hunt harvest increased only from 127 to 175 antlerless moose during RY02–RY03 because of 2 factors: 1) a regulation change that prohibited recipients of drawing and registration permits for antlerless moose from taking an antlered bull moose in Unit 20A, and 2) the addition of a limited registration hunt (30 permits) in the western Tanana Flats. After antlerless hunts were liberalized in RY04, registration permit harvest jumped to 595, 679, 559, and 469 antlerless moose during RY04–RY07 (Table 5). There was nearly a 10-fold increase in the number of antlerless permits (registration) issued during RY04–RY07 ( x = 4,501) compared to RY02–RY03 ( x = 263). In RY08 we reduced the antlerless harvest quota substantially to 200 moose, which resulted in a commensurate decrease in the number of permits issued (n = 1,852) and antlerless moose harvested (n = 197).
Beginning in RY09, we again began issuing drawing permits for antlerless moose with the goal to obtain as much of the antlerless harvest as possible during the fall (versus the winter registration hunt) in order to reduce the take of antlerless bulls and reduce hunter conflict with trappers. That year, 372 drawing (Fig. 4) and 685 registration permits were issued and resulted in a reported harvest of 66 (27%) by drawing permit and 176 (73%) by registration permit (Table 5). During RY10–RY13, 44% (116/269), 58% (156/271), 57% (107/188), and 61% (56/92) of the antlerless moose were harvested during drawing permit hunts held during fall. Many modifications to antlerless drawing and registration hunt areas were made during RY09– RY13 to address biological, harvest, and social issues (Figs. 5–9).
Hunter Residency and Success. Success rates for general season hunts dropped to 30% after unitwide antler restrictions went into effect in RY02 and continued to decline through RY04 (Table 4). Success rates stabilized at 24–25% during RY04–RY07, but jumped to 30% in RY08. During RY09–RY10, success rates were similar to the previous 5-year average of 26%. Nonresidents had higher success rates than residents. During RY09–RY10, the average success rate was 52% for nonresident hunters compared to 22% for resident hunters. This can likely be explained by the greater use of guides by nonresident hunters (Young 2008, 2010).
The number of hunters who reported hunting moose during the general season was similar in RY02 and RY03 (Table 4). However, that number increased from 1,189 to 1,628 (37%) in RY04, likely because of strong participation in the liberal antlerless hunts (n = 2,361 hunters)
Chapter 22: Moose management report ADF&G/DWC/SMR-2014-6 Page 22-13

that were concurrent with the general season and hunters often obtained harvest tickets for both general and antlerless hunts. The number of general season hunters reached an all-time high of 1,816 in RY05, as interest in the antlerless hunts peaked (n = 2,717 hunters), then declined to 1,608 general season hunters in RY06, apparently as participation in the antlerless hunts waned (n = 2,057 hunters). This trend continued during RY09–RY10 (Young 2012), RY11–RY12 (1,184 general season hunters; 665 antlerless moose hunters), and RY12–RY13 (1,146 general season hunters; 453 antlerless moose hunters).
Harvest Chronology. Moose harvest in Unit 20A has traditionally been well distributed throughout the season and consistent across years with no deviations apparent during RY11–RY12 (Table 6).
Transport Methods. All-terrain vehicles (3- or 4-wheeler and other ORV) and airplanes remain the primary modes of transportation used by successful hunters, and no deviations from their use in recent years were apparent during RY11–RY12 (Table 7).
Other Mortality A telemetry study of moose mortality begun in 1996 concluded that predation killed 4 times more moose annually than humans and that predators killed mostly healthy moose (75% of which were calves; Boertje et al. 2009). The number of moose reported killed in accidents with motor vehicles and trains has been substantial in some years (Dale 1998), but has been relatively low since 2001 (Table 3). This may be the result of mostly below normal snowfall (long-term mean annual snowfall for Fairbanks = 68 inches) during this period (Young 2008, 2010; Young and Boertje 2011).
HABITAT We have documented that this population has the lowest productivity of wild, noninsular moose populations in North America (Boertje et al. 2007). Despite reducing the moose population by approximately 25–30% between 2004 and 2012, commensurate improvements in productivity have not yet been detected. Thus, we remain concerned that the population still exceeds habitat capability and is vulnerable to severe weather patterns. Moreover, we deem a higher moose density as undesirable until productivity and/or habitat improves. Short-yearling weights, an indicator of habitat quality, were below the threshold of 385 lb (175 kg; Table 8) used as a signal to justify liberal antlerless hunts to reduce moose densities (Boertje et al. 2007). However, 2 large wildfires (114,000 acre Survey Line burn and 85,000 acre Fish Creek burn) occurred on the Tanana Flats during summer 2001. Increased summer use by the moose population was observed in 2002, but winter use was not observed until winter 2005–2006. Another large wildfire (130,000 acre Parks Highway burn) occurred on the western Tanana Flats in 2006, and the extent to which moose use that burn is being investigated. During summers 2006 and 2007, 46,000 acres burned in the east central Tanana Flats (Little Delta burn). In 2009, there were 2 additional large wildfires: 1) the 125,000 acre Wood River Buttes burn (includes re-burn of 18,500 acres of the 2001 Survey Line burn) in the central Tanana Flats; and 2) the 101,000 acre Rex Creek burn (includes re-burn of 40,000 acres of the 2001 Fish Creek burn) in the southwestern mountains–western Tanana Flats. In 2011, 24,000 acres burned (Coal Creek burn) in the southwestern mountains. During September 2012, 47,000 acres burned in the northcentral Tanana Flats (a re-burn of the 1957 Bear and McDonald Creeks burn). Finally, in 2013, 67,000 acres burned in the northeastern Tanana Flats (re-burned most of the 1998 Carla Lake burn). Thus, roughly
Chapter 22: Moose management report ADF&G/DWC/SMR-2014-6 Page 22-14

700,000–800,000 acres burned in Unit 20A during 2001–2013, which should result in significantly greater browse production and higher carrying capacity of the range for moose. Research on mortality during 1996–2004 concluded that predation and low productivity of moose had similar major limiting effects on yield, while other factors had minor limiting effects (Boertje et al. 2009). Current research is assessing the effect of these large burns on several factors that affect moose productivity: body condition, reproductive performance, distribution and movements, and browse availability and removal.
NONREGULATORY MANAGEMENT PROBLEMS OR NEEDS The Alaska Railroad Corporation Northern Rail Extension Project’s proposed alignment between Fairbanks and Delta Junction would traverse the Tanana Flats just south of the Tanana River, potentially between Salcha and Delta Junction. The rail extension would bisect important moose habitat in the Fairbanks area in Units 20A and 20B. Of greatest concern is potential railroad kill, primarily during winter months. If fences are built, these will be impediments to seasonal moose migrations between the Tanana Flats calving areas and the adjacent Tanana hills in Unit 20B. The Fairbanks area management staff has been involved in discussions to mitigate these impacts.
ADF&G Draft Scoping Comments 2011 (Office of the Commissioner, July 9, 2012, Juneau) regarding the military’s proposed Joint Pacific Alaska Range Complex (JPARC) Modernization and Enhancement Draft Environmental Impact Statement addressed concerns about the long-standing, comprehensive management and research projects for moose in portions of Unit 20. Proposed restricted access corridors and expansion within Unit 20 could impair the ability of the department to continue long-standing, on-going research projects, increase costs due to the need to circumvent airspace, schedule additional flights and cause researchers to reduce, abandon or not undertake future projects to monitor moose or other species if predictable, adequate access to airspace cannot be assured. Without the continued ability to free access to the airspace in the region, particularly below 7,000 feet above ground level, necessary fish and wildlife population management in this area could be reduced. A reduction in the quantity and quality of data could result in a need to manage species on a more conservative basis, leading to fewer opportunities for harvest, including subsistence. Of particular concern is the active management of the Nelchina caribou herd, Units 13 and 20 moose and wolf populations, and Gulkana River Chinook and sockeye salmon, all of which are highly sought by the public. These species are managed by the department through extensive oversight and deliberative processes, including direction from the Alaska Boards of Fisheries and Game. Proposed access restrictions that could accompany the expansion may have a chilling effect on the ability of the public to freely use and enjoy the area. Public access and spontaneous use associated with good weather days could be curtailed, as would public access of desired areas due to possible corridor closures, the need to request entry authorizations, and other restrictions to airspace necessitating the public to incur extra monetary expenditures in fuel and time to avoid military operations. Additionally, Alaska is notorious for poor weather related flying conditions and the ability of the average private pilot to understand and comply with flight restriction under poor flying conditions may pose a hazard to both military and private pilots operating in the area.
CONCLUSIONS AND RECOMMENDATIONS Population estimates indicate the Unit 20A moose population remained above 12,000 moose (i.e., intensive management population objective’s upper limit through 2011 and lower limit
Chapter 22: Moose management report ADF&G/DWC/SMR-2014-6 Page 22-15

beginning in 2012) through November 2012. Continued low twinning rates, 0% yearling pregnancy rates, delayed age of first reproduction, and reproductive pauses indicate the moose population remains relatively unproductive. Ongoing research indicates that moose production in Unit 20A is reduced because of high moose densities and declining habitat condition (Boertje et al. 2007, Boertje et al. 2009). Therefore, through RY07 we continued to recommend liberal antlerless moose hunts (i.e., 600 antlerless moose) to reduce moose density and maintain high harvests. However, because a population estimate was not conducted in 2007 and the 2008 estimate was only slightly above the upper limit of the intensive management population objective, the department recommended more conservative antlerless hunts during RY08–RY11 (i.e., 200–350 antlerless moose) aimed at population stability. Our long-term objective is to stabilize the moose population unless we observe improvements in moose productivity, condition or winter forage from reduced moose densities and recent habitat improvements (i.e., roughly 700,000–800,000 acres burned during 2001–2013). Antlerless moose harvest should continue to be evaluated as a tool to prevent an overabundance of moose that are vulnerable to the synergistic effects of adverse weather and increased predation (Boertje et al. 1996). In addition, it remains important to improve habitat quality and determine the status of the Unit 20A moose population relative to nutritional and climate limitations, and increasing predator numbers.
We met our management objectives of 20 bulls:100 cows in the Tanana Flats, western foothills, and eastern foothills, and 30 bulls:100 cows unitwide. High and/or increasing bull:cow ratios during 2001–2008 indicated that unitwide antler restrictions initiated in RY02 were effective (Young and Boertje 2008) and harvest rates of bulls were below maximum sustainable levels. During RY09–RY13, I recommended retaining unitwide antler restrictions for both resident and nonresident hunters in conjunction with a limited drawing permit hunt for “any bull” moose to optimize harvest. I also recommended a harvest rate for bulls of 15–20% of the prehunt bull population. For RY14 and RY15, I recommend that we continue to use antler restrictions as the primary mechanism to regulate the harvest of bulls to maintain desired bull:cow ratios and to manage hunter and harvest densities at various spatial scales (e.g., Unit 20A, management area, controlled use area, and subarea). We should continue to closely monitor bull:cow ratios both at unitwide and lesser spatial scales to monitor the effects of current regulatory changes on bull:cow ratios.
We did not meet the intensive management harvest objective of 1,400–1,600 moose annually in RY11 or 900–1,100 moose in RY12. To meet this harvest objective, it will be necessary to harvest antlerless moose at a relatively high rate that is not sustainable over the long term. Once the population reaches the desired level, I recommend a selective harvest strategy (i.e., antler-restricted bull hunts, limited “any bull” drawing permit hunts, and antlerless hunts including both cows and calves) with a harvest ratio of approximately 60 bulls:20 cows:20 calves to maximize yield.
MANAGEMENT OBJECTIVES For the next reporting period, management objectives will be adjusted to the following:
Manage for a November population of between 12,000 and 15,000 moose.
Manage population levels based on 3-year mean (change from 2-year mean) twinning rates in conjunction with at least one of the following signals to substantiate low twinning-based
Chapter 22: Moose management report ADF&G/DWC/SMR-2014-6 Page 22-16

nutritional status: 50% of 36-month-old moose are parturient, average multi-year short yearling mass is <385 lb (175 kg), or >35% of annual browse biomass is removed by moose (Boertje et al. 2007):
o <10% twinning rate — reduce the moose population.
o 10–20% twinning rate — maintain a stable moose population.
o >20% twinning rate — manage for population growth.
Manage for a harvest of 900–1,100 moose annually.
Manage for a posthunting sex ratio of ≥30 bulls:100 cows overall and ≥20 bulls:100 cows in the Tanana Flats, western foothills, and eastern foothills areas.
REFERENCES CITED Bishop, R. H., and R. A. Rausch. 1974. Moose population fluctuations in Alaska, 1950–1972.
Naturaliste Canadien 101:559–593.
Boertje, R. D., M. A. Keech, D. D. Young, K. A. Kellie, C. T. Seaton. 2009. Managing for elevated yield of moose in Interior Alaska. Journal of Wildlife Management 73:314–327.
Boertje, R. D., K. A. Kellie, C. T. Seaton, M. A. Keech, D. D. Young, B. W. Dale, L. G. Adams, and A. R. Aderman. 2007. Ranking Alaska moose nutrition: Signals to begin liberal antlerless harvests. Journal of Wildlife Management 71:1494–1506.
Boertje, R. D., P. Valkenburg, and M. E. McNay. 1996. Increases in moose, caribou, and wolves following wolf control in Alaska. Journal of Wildlife Management 60:474–489.
Dale, B. W. 1998. Unit 20A moose. Pages 275–287 [In] M. V. Hicks, editor. Moose management report of survey and inventory activities 1 July 1995–30 June 1997. Alaska Department of Fish and Game, Division of Wildlife Conservation, Federal Aid in Wildlife Restoration Study 1.0, Juneau.
Gasaway, W. C., S. D. DuBois, D. J. Reed, and S. J. Harbo. 1986. Estimating moose population parameters from aerial surveys. Institute of Arctic Biology, Biological Papers of the University of Alaska, No. 22, Fairbanks.
Gasaway, W. C., R. O. Stephenson, J. L. Davis, P. E. K. Shepherd, and O. E. Burris. 1983. Interrelationships of wolves, prey, and man in Interior Alaska. Wildlife Monographs 84.
Kellie, K. A., and R. A. DeLong. 2006. Geospatial survey operations manual. Alaska Department of Fish and Game, Division of Wildlife Conservation, Fairbanks. http://www.adfg.alaska.gov/static/home/library/pdfs/wildlife/propubs/GSPEOperationsManual.pdf (Accessed 29 July 2014).
McNay, M. E. 1992. Units 20B and 25C moose. Pages 244–266 [In] S. M. Abbott, editor. Moose management report of survey and inventory activities 1 July 1989–30 June 1991. Alaska
Chapter 22: Moose management report ADF&G/DWC/SMR-2014-6 Page 22-17

Department of Fish and Game, Division of Wildlife Conservation, Federal Aid in Wildlife Restoration Study 1.0, Juneau.
Young, D. D. 2006. Unit 20A moose. Pages 322–343 [In] P. Harper, editor. Moose management report of survey and inventory activities 1 July 2003–30 June 2005. Alaska Department of Fish and Game, Division of Wildlife Conservation, Federal Aid in Wildlife Restoration Project 1.0, Juneau.
Young, D. D. 2008. Unit 20A moose. Pages 325–347 [In] P. Harper, editor. Moose management report of survey and inventory activities 1 July 2005–30 June 2007. Alaska Department of Fish and Game, Division of Wildlife Conservation, Federal Aid in Wildlife Restoration Project 1.0, Juneau.
Young, D. D. 2010. Unit 20A moose. Pages 320–344 [In] P. Harper, editor. Moose management report of survey and inventory activities 1 July 2007–30 June 2009. Alaska Department of Fish and Game, Division of Wildlife Conservation, Federal Aid in Wildlife Restoration Project 1.0, Juneau.
Young, D. D. 2012 (In prep). Unit 20A moose. [In] P. Harper, editor. Moose management report of survey and inventory activities 1 July 2009–30 June 2011. Alaska Department of Fish and Game, Division of Wildlife Conservation, Federal Aid in Wildlife Restoration Project 1.0, Juneau.
Young Jr., D. D., and R. D. Boertje. 2004. Initial use of moose calf hunts to increase yield, Alaska. Alces 40:1–6.
Young Jr., D. D., and R. D. Boertje. 2008. Recovery of low bull:cow ratios of moose in Interior Alaska. Alces 44:65–71.
Young Jr., D. D., and R. D. Boertje. 2011. Prudent and imprudent use of antlerless moose harvests in Interior Alaska. Alces 47:91–100.
Young Jr., D. D., R. D. Boertje, C. T. Seaton, and K. A. Kellie. 2006. Intensive management of moose at high-density: Impediments, achievements, and recommendations. Alces 42:41–48.
PREPARED BY: APPROVED BY:
Donald D. Young, Jr. Doreen I. Parker McNeill Wildlife Biologist III Management Coordinator
REVIEWED BY:
Kalin A. K. Seaton Wildlife Biologist III
Laura A. McCarthy Publications Technician II
Chapter 22: Moose management report ADF&G/DWC/SMR-2014-6 Page 22-18

Please cite any information taken from this section, and reference as:
Young Jr., D. D. 2014. Unit 20A moose. Pages 22-1 through 22-36 [In] P. Harper and L. A. McCarthy, editors. Moose management report of survey and inventory activities 1 July 2011–30 June 2013. Alaska Department of Fish and Game, Species Management Report ADF&G/DWC/SMR-2014-6, Juneau. The State of Alaska is an Affirmative Action/Equal Opportunity Employer. Contact the Division of Wildlife Conservation at (907) 465-4190 for alternative formats of this publication.
Chapter 22: Moose management report ADF&G/DWC/SMR-2014-6 Page 22-19

Figure 1. Northcentral Tanana Flats, western Tanana Flats, and eastern Tanana Flats-foothills twinning survey areas and flight paths, Unit 20A, 2012.
Chapter 22: Moose management report ADF&G/DWC/SMR-2014-6 Page 22-20

Figure 2. Northcentral Tanana Flats, western Tanana Flats, and eastern Tanana Flats-foothills twinning survey areas and flight paths, Unit 20A, 2013.
Chapter 22: Moose management report ADF&G/DWC/SMR-2014-6 Page 22-21

Chapter 22: M
oose managem
ent report AD
F&G
/DW
C/SM
R-2014-6
Page 22-22
Figure 3. Bull drawing permit hunts DM768–DM774, regulatory yearsa 2008–2013. a Regulatory year begins 1 July and ends 30 June (e.g., regulatory year 2008 = 1 July 2008–30 June 2009).

Chapter 22: M
oose managem
ent report AD
F&G
/DW
C/SM
R-2014-6
Page 22-23
Figure 4. Antlerless drawing permit hunts DM683–DM697 hunt areas, regulatory yearsa 2009–2011. a Regulatory year begins 1 July and ends 30 June (e.g., regulatory year 2009 = 1 July 2009–30 June 2010).

Chapter 22: M
oose managem
ent report AD
F&G
/DW
C/SM
R-2014-6
Page 22-24
Figure 5. Antlerless drawing permit hunts DM628–DM679 hunt areas, regulatory yearsa 2012 and 2013. a Regulatory year begins 1 July and ends 30 June (e.g., regulatory year 2012 = 1 July 2012–30 June 2013).

Figure 6. Antlerless moose registration hunt RM764 hunt areas, regulatory yeara 2011. a Regulatory year begins 1 July and ends 30 June (e.g., regulatory year 2011 = 1 July 2011–30 June 2012).
Chapter 22: Moose management report ADF&G/DWC/SMR-2014-6 Page 22-25

Figure 7. Antlerless moose registration hunt RM764 hunt areas, regulatory yeara 2012. a Regulatory year begins 1 July and ends 30 June (e.g., regulatory year 2012 = 1 July 2012–30 June 2013).
Chapter 22: Moose management report ADF&G/DWC/SMR-2014-6 Page 22-26

Figure 8. Antlerless moose registration hunt RM764 hunt areas, regulatory yeara 2013. a Regulatory year begins 1 July and ends 30 June (e.g., regulatory year 2013 = 1 July 2013–30 June 2014).
Chapter 22: Moose management report ADF&G/DWC/SMR-2014-6 Page 22-27

Figure 9. Antlerless moose registration hunt RM768 hunt area, regulatory yearsa 2009–2013. a Regulatory year begins 1 July and ends 30 June (e.g., regulatory year 2009 = 1 July 2009–30 June 2010).
Chapter 22: Moose management report ADF&G/DWC/SMR-2014-6 Page 22-28
Chapter 22: M
oose managem
ent report AD
F&G
/DW
C/SM
R-2014-6
Page 22-29
Table 1. Unit 20A aerial moose fall composition counts and estimated population size, 1999–2013.
Year Bulls:100
Cows Yearlings:100 Cowsb
Calves: 100 Cows
Percent calves Adults
Moose observed
Estimated populationa w/SCF =
1.21c (90% CI) Moose/mi2d 1999 23 13 33 21 760 965 13,558 (±16.8%) 2.7 2000 23 10 33 21 1,089 1,377 13,565 (±23.0%) 2.5 2001 26 18 26 17 737 887 13,928 (±17.4%) 2.8 2002e 2003 32 22 28 18 1,212 1,483 17,768 (±15.7%) 3.5 2004 35 21 36 21 1,512 1,922 16,415 (±17.1%) 3.3 2005 38 18 30 19 1,370 1,684 16,151 (±17.3%) 3.2 2006 36 22 34 20 1,232 1,536 15,455 (±18.4%) 3.1 2007e 2008 37 25 35 20 1,335 1,672 12,537 (±14.6%) 2.5 2009 32 18 30 19 1,411 1,740 15,667 (±15.3%) 3.1 2010 32 17 32 20 1,196 1,486 14,497 (±16.2%) 2.9 2011 33 17 28 21 1,363 1,651 12,723 (±15.3%) 2.5 2012 34 18 31 18 1,014 1,244 12,193 (±15.8%) 2.4 2013 28 14 31 19 875 1,085 10,156 (±14.5%) 2.0
a Geospatial population estimation (GSPE) method. b Yearlings:100 cows = Yearling bulls:100 cows × 2. c Sightability correction factor (Boertje et al. 2009). d Based on an estimated 5,040 mi2 of moose habitat in Unit 20A. e Surveys were not conducted due to lack of snow.

Table 2. Unit 20A moose twinning rates from transect surveys, 2006–2013.
Year Date Cows
% Twinsa Meanb w/Single calf w/Twins Total 2006c 23 May 49 6 55 11
14 2006d 24 May 32 6 38 16 2006e 25 May 30 6 36 17 2007c 25 May 58 2 60 3
13 2007d 28 May 28 9 37 24 2007e 2 Jun 36 4 40 10 2008c 23 May 57 6 63 10
15 2008d 27 May 46 14 60 23 2008e 26 May 36 5 41 12 2009c 23–24 May 55 5 60 8
10 2009d 27–28 May 52 6 58 10 2009e 30 May 32 4 36 11 2010c 24, 26 May 51 3 54 6
12 2010d 27 May 30 6 36 17 2010e 28 May 26 4 30 13 2011c 24 May 45 5 50 10
19 2011d 26 May 32 11 43 26 2011e 27 May 24 6 30 20 2012c 25 May 42 12 54 22
12 2012d 26 May 38 4 42 10 2012e 27 May 31 1 32 3 2013c 29 May 43 5 48 10
12 2013d 30 May 36 5 41 12 2013e 1 Jun 29 5 34 15
a Percentage of cows with calves that had twins. b Mean of percent twins for central, western, and eastern Tanana Flats. c Northcentral Tanana Flats. d Western Tanana Flats. e Eastern Tanana Flats.
Chapter 22: Moose management report ADF&G/DWC/SMR-2014-6 Page 22-30

Chapter 22: M
oose managem
ent report AD
F&G
/DW
C/SM
R-2014-6
Page 22-31
Table 3. Estimate of Unit 20A moose harvesta and accidental death, regulatory yearsb 2001–2012.
Regulatory year
Human take Accidental death Grand total
Reported hunter harvest Estimated totalc
Reported M F Unk Total Roadd Traine Total
2001 541 70 4 615 830 3 4 7 837
2002 363 115 1 479 647 7 6 13 660 2003 347 159 0 506 683 0 6 6 689 2004 431 557 0 988 1,334 0 11 11 1,345 2005 497 634 0 1,131 1,527 0 6 6 1,533 2006 558 493 0 1,051 1,419 2 8 10 1,429 2007 538 417 7 962 1,299 0 8 8 1,307 2008 643 171 8 822 1,110 1 11 12 1,122 2009 643 202 0 845 1,141 1f 9f 10 1,151 2010 593 231 0 824 1,112 1f 9f 10 1,122 2011 545 254 0 799 1,079 1f 9f 10 1,089 2012 518 177 0 695 938 1f 9f 10 948
a Includes general and permit hunt harvest. b Regulatory year begins 1 July and ends 30 June (e.g., regulatory year 2001 = 1 July 2001–30 June 2002). c Reported total harvest times 1.35 (Boertje et al. 2009); includes all other types of reported (e.g., defense of life or property, dispatched, potlatch, stickdance) and unreported (e.g., illegal, snaring, other, and wounding loss), except train and roadkill. d Documented kills; actual number killed by vehicles is certainly greater. e Confirmed dead between Alaska Railroad mileposts 371.0 and 411.7; “Missing” moose (moose hit but not recovered) are not included. Data provided by the Alaska Railroad. f Average reported killed regulatory years 2003–2008.

Chapter 22: M
oose managem
ent report AD
F&G
/DW
C/SM
R-2014-6
Page 22-32
Table 4. Unit 20A general season moose huntera residency and success, regulatory yearsb 2001–2012.
Regulatory year
Successful Unsuccessful Total
hunters Localc
resident Nonlocal resident Nonresident Unk Total (%)
Localc resident
Nonlocal resident Nonresident Unk Total (%)
2001 350 131 56 2 539 (35) 705 219 81 7 1,012 (65) 1,551 2002 190 77 85 1 353 (30) 567 190 70 1 828 (70) 1,181 2003 185 68 78 0 331 (28) 551 202 99 6 858 (72) 1,189 2004 191 95 92 15 393 (24) 815 320 85 15 1,235 (76) 1,628 2005 211 112 119 2 444 (24) 892 385 86 9 1,372 (76) 1,816 2006 177 107 123 1 408 (25) 755 327 108 10 1,200 (75) 1,608 2007 176 90 116 2 384 (24) 694 374 132 1 1,201 (76) 1,585 2008 197 113 136 5 451 (30) 596 304 116 22 1,038 (70) 1,489 2009 173 104 111 10 398 (27) 623 322 97 21 1,063 (73) 1,461 2010 135 80 103 30 348 (26) 563 277 101 51 992 (74) 1,340 2011 136 97 74 8 315 (27) 470 298 80 21 869 (73) 1,184 2012 126 81 70 11 288 (25) 429 325 78 26 858 (75) 1,146
a Excludes hunters in permit hunts. b Regulatory year begins 1 July and ends 30 June (e.g., regulatory year 2001 = 1 July 2001–30 June 2002). c Residents of Unit 20.

Chapter 22: M
oose managem
ent report AD
F&G
/DW
C/SM
R-2014-6
Page 22-33
Table 5. Unit 20A moose harvest data by permit hunt, regulatory yearsa 2004–2012.
Permit hunt Regulatory
year Permits issued
Successful hunters (%)
Unsuccessful hunters (%)
Did not hunt (%) Male (%) Female (%) Unk Harvest
Totals for antlerless
permit hunts
2004 5,430 595 (25) 1,766 (75) 3,069 (57) 37 (6) 553 (94) 5 595 2005 5,114 679 (25) 2,038 (75) 2,397 (47) 47 (7) 629 (93) 3 679 2006 3,737 559 (27) 1,498 (73) 1,680 (45) 66 (12) 484 (88) 9 559 2007 3,721 469 (25) 1,419 (75) 1,833 (49) 44 (9) 421 (91) 4 469 2008 1,852 197 (31) 447 (69) 1,208 (65) 24 (12) 171 (88) 2 197 2009 1,057 242 (32) 522 (68) 293 (28) 33 (15) 189 (85) 20 242 2010 1,355 269 (38) 436 (62) 650 (48) 39 (15) 225 (85) 5 269 2011 1,383 271 (41) 394 (59) 718 (52) 14 (5) 253 (95) 4 271 2012 1,129 188 (42) 265 (58) 676 (60) 11 (6) 177 (94) 0 188
Totals for antlered permit
hunts
2004 0 0 (0) 0 (0) 0 (0) 0 0 0 (0) 0 0 2005 75 8 (23) 27 (77) 40 (53) 8 (100) 0 (0) 0 8 2006 375 85 (40) 126 (60) 164 (44) 85 (100) 0 (0) 0 85 2007 576 113 (34) 223 (66) 240 (42) 113 (100) 0 (0) 0 113 2008 825 170 (41) 242 (59) 413 (50) 170 (100) 0 (0) 0 170 2009 1,040 210 (39) 332 (61) 498 (48) 209 (100) 0 (0) 1 210 2010 936 208 (40) 307 (60) 421 (45) 208 (100) 0 (0) 0 208 2011 827 216 (47) 242 (53) 369 (45) 216 (100) 0 (0) 0 216 2012 871 219 (46) 261 (54) 391 (45) 219 (100) 0 (0) 0 219
Totals for all permit hunts
2004 5,430 595 (25) 1,766 (75) 3,069 (57) 37 (6) 553 (94) 5 595 2005 5,189 687 (25) 2,065 (75) 2,437 (47) 55 (8) 629 (92) 3 687 2006 4,112 644 (28) 1,624 (72) 1,844 (45) 151 (24) 484 (76) 9 644 2007 4,297 582 (26) 1,642 (74) 2,073 (48) 157 (27) 421 (73) 4 582 2008 2,677 367 (35) 689 (65) 1,621 (61) 194 (53) 171 (47) 2 367 2009 2,097 452 (35) 854 (65) 791 (38) 242 (56) 189 (44) 21 452 2010 2,291 477 (39) 743 (61) 1,071 (47) 247 (52) 225 (48) 5 477 2011 2,210 487 (43) 636 (57) 1,087 (49) 230 (48) 253 (52) 4 487 2012 2,000 407 (44) 526 (56) 1,067 (53) 230 (57) 177 (43) 0 407
a Regulatory year begins 1 July and ends 30 June (e.g., regulatory year 2004 = 1 July 2004–30 June 2005).

Table 6. Unit 20A moose harvesta chronology percent by month/day, regulatory yearsb 2007–2012. Regulatory
year Harvest chronology percent by month/day
Unk/Other n 9/1–9/5 9/6–9/10 9/11–9/15 9/16–9/20 9/21–9/25 2007 18 11 23 26 20 2 384 2008 14 15 20 25 23 3 454 2009 16 15 26 23 18 2 398 2010 16 12 23 23 24 2 348 2011 18 15 17 29 21 1 315 2012 14 16 23 21 22 4 288
a Excludes permit hunt harvest. b Regulatory year begins 1 July and ends 30 June (e.g., regulatory year 2007 = 1 July 2007–30 June 2008).
Chapter 22: Moose management report ADF&G/DWC/SMR-2014-6 Page 22-34

Chapter 22: M
oose managem
ent report AD
F&G
/DW
C/SM
R-2014-6
Page 22-35
Table 7. Unit 20A moose harvesta percent by transport method, regulatory yearsb 2001–2012.
Regulatory year
Harvest percent by transport method
n Airplane Horse Boat 3- or
4-wheeler Snowmachine Other ORV Highway vehicle Airboat Unknown
2001 34 5 19 20 0 10 3 7 1 539 2002 36 5 14 23 0 8 3 8 2 353 2003 32 5 13 26 0 10 3 9 2 331 2004 33 5 14 29 0 10 3 4 2 393 2005 37 3 15 25 0 11 3 4 0 395 2006 38 7 13 28 0 7 2 4 1 408 2007 32 5 15 25 1 12 2 5 2 387 2008 38 5 15 30 0 6 2 4 1 455 2009 30 8 12 32 0 9 3 3 2 398 2010 32 7 12 31 0 9 3 3 2 348 2011 29 9 8 41 0 10 1 3 1 315 2012 30 7 10 35 0 11 1 3 3 288
a Excludes permit hunt harvest. b Regulatory year begins 1 July and ends 30 June (e.g., regulatory year 2001 = 1 July 2001–30 June 2002).

Table 8. Unit 20A short-yearling weights, 2009, 2010, and 2012.
Area Year Avg weight
(lb) n Variance SE Dates Central Unit 20A 2009 340.2 49 2,141.147109 6.6 1–13 Mar 2009
2010 348.8 77 1,930.214627 5.0 24 Feb–10 Mar 2010
Western Unit 20A 2009 348.4 22 2,405.777056 10.5 1–13 Mar 2009
2012 349.8 37 2,447.063063 8.1 1–8 Mar 2012
Chapter 22: Moose management report ADF&G/DWC/SMR-2014-6 Page 22-36