Chapter 2 Understanding Financial Statements, Taxes, and ...
39
Copyright © 2011 Pearson Prentice Hall. All rights reserved. Understanding Financial Statements, Taxes, and Cash Flows Chapter 2
Transcript of Chapter 2 Understanding Financial Statements, Taxes, and ...
Copyright © 2011 Pearson Prentice Hall. All rights reserved.
Understanding Financial Statements, Taxes, and Cash Flows
Chapter 2
Copyright © 2011 Pearson Prentice Hall. All rights reserved.3-2
Slide Contents
• Learning Objectives
• Principles Used in This Chapter
1. An Overview of the Firm’s Financial Statements
2. The Income Statement
3. Corporate Taxes
4. The Balance Sheet
5. The Cash Flow Statement
• Key Terms
Copyright © 2011 Pearson Prentice Hall. All rights reserved.3-3
Learning Objectives
1. Describe the content of the four basic financial statements and discuss the importance of financial statement analysis to the financial manager.
2. Evaluate firm profitability using the income statement.
3. Estimate a firm’s tax liability using the corporate tax schedule and distinguish between the average and marginal tax rate.
Copyright © 2011 Pearson Prentice Hall. All rights reserved.
3.1 An Overview of the Firm’s Financial Statements
Copyright © 2011 Pearson Prentice Hall. All rights reserved.3-5
Basic Financial Statements
• Following four types of financial statements are mandated by the accounting and financial regulatory authorities:
1. Income statement
2. Balance sheet
3. Cash flow statement
4. Statement of shareholder’s equity
Copyright © 2011 Pearson Prentice Hall. All rights reserved.3-6
Basic Financial Statements (cont.)
• 1. Income Statement:
– An income statement provides the following information for a specific period of time (for example, a year or 6 months or 3 months):
• Revenue,
• Expenses, and
• Profit.
Copyright © 2011 Pearson Prentice Hall. All rights reserved.3-7
Basic Financial Statements (cont.)
• 2. Balance sheet:
– Balance sheet provides a snap shot of the following on a specific date (for example, as of December 31, 2010)
• Assets (value of what the firm owns),
• Liabilities (value of firm’s debts), and
• Shareholder’s equity (the money invested by the company owners).
Copyright © 2011 Pearson Prentice Hall. All rights reserved.3-8
Basic Financial Statements (cont.)
• 4. Statement of shareholder’s equity:
– It provides a detailed account of the firm’s activities in the following accounts over a period of time (for example, last six months):
• Common stock account,
• Preferred stock account,
• Retained earnings account, and
• Changes to owner’s equity.
Copyright © 2011 Pearson Prentice Hall. All rights reserved.3-9
Why Study Financial Statements?
• Analyzing a firm’s financial statement can help managers carry out three important tasks:
1. Assess current performance through financial statement analysis,
2. Monitor and control operations, and
3. Forecast future performance.
Copyright © 2011 Pearson Prentice Hall. All rights reserved.
3.2 The Income Statement
Copyright © 2011 Pearson Prentice Hall. All rights reserved.3-11
An Income Statement
• An income statement is also called a profit and loss statement.
• An income statement measures the amount of profits generated by a firm over a given time period (usually a year or a quarter).
Copyright © 2011 Pearson Prentice Hall. All rights reserved.3-12
An Income Statement (cont.)
• Income statement can be expressed as follows:
Revenues (or Sales) – Expenses = Profits
Copyright © 2011 Pearson Prentice Hall. All rights reserved.3-13
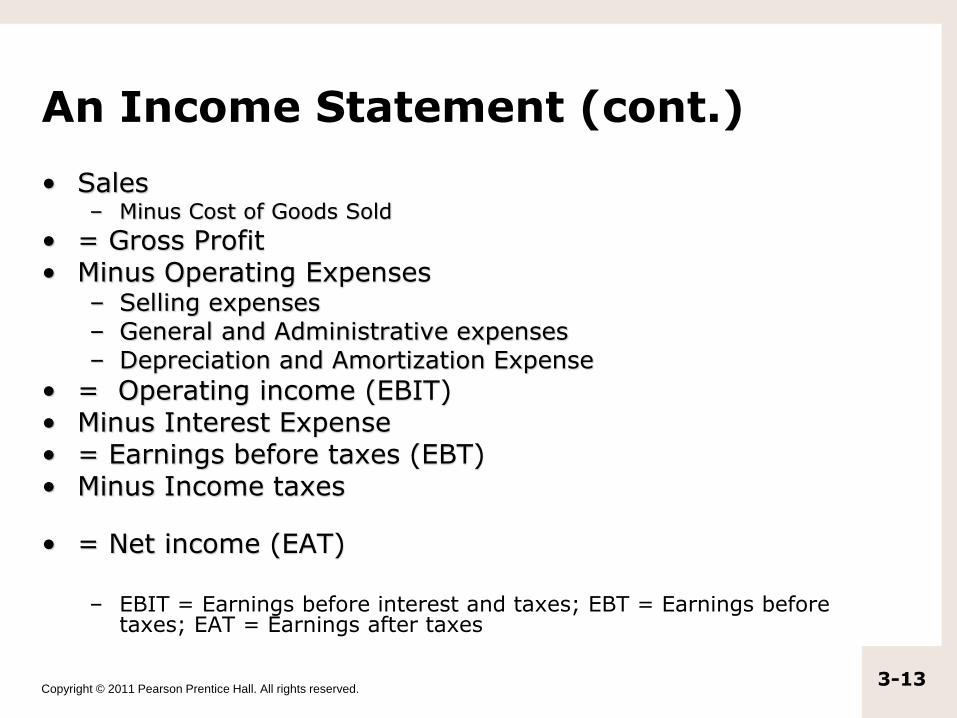
An Income Statement (cont.)
• Sales– Minus Cost of Goods Sold
• = Gross Profit• Minus Operating Expenses
– Selling expenses– General and Administrative expenses– Depreciation and Amortization Expense
• = Operating income (EBIT)• Minus Interest Expense• = Earnings before taxes (EBT)• Minus Income taxes
• = Net income (EAT)
– EBIT = Earnings before interest and taxes; EBT = Earnings before taxes; EAT = Earnings after taxes
Copyright © 2011 Pearson Prentice Hall. All rights reserved.3-14
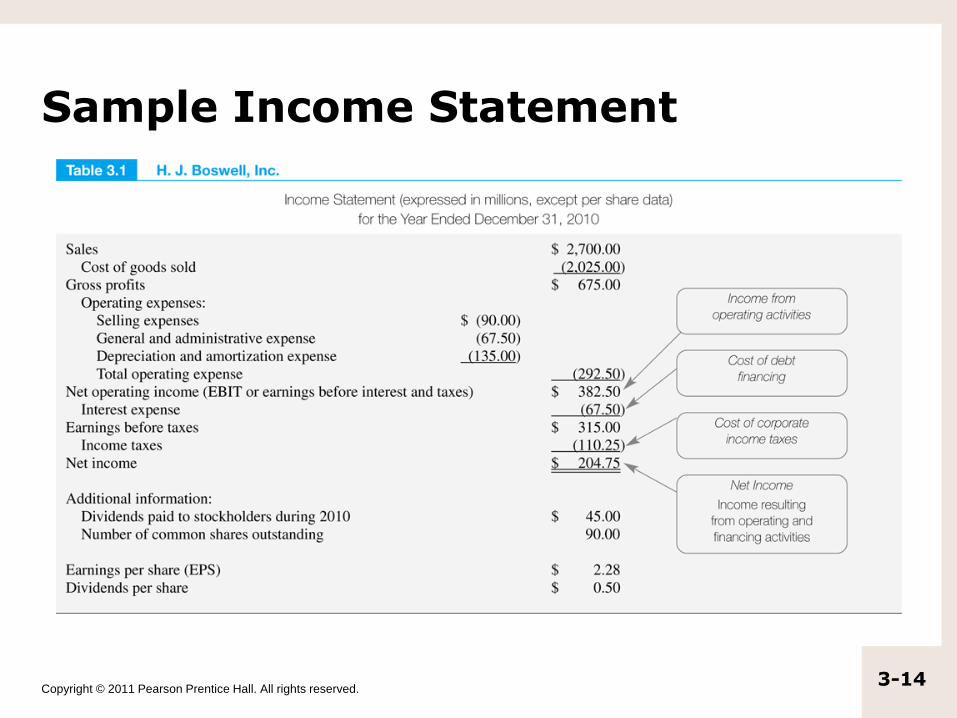
Sample Income Statement

Slide
4-15
Illustration
Format
LO 3Illustration 4-2
Income Statement
Includes all of the
major items in the list
above, except for
discontinued
operations.
Slide
4-16
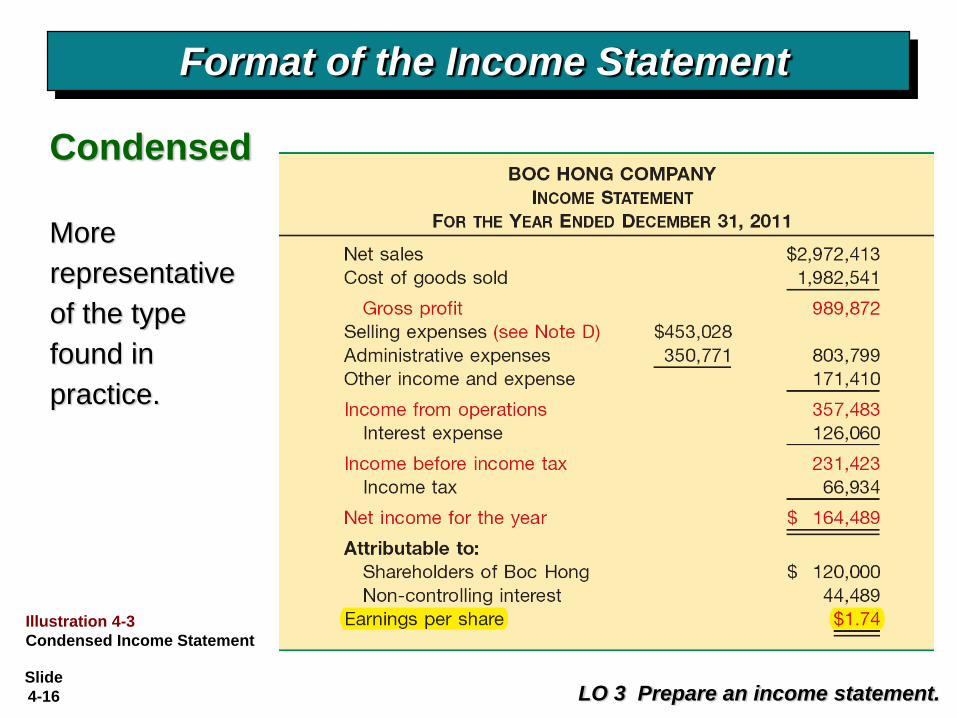
Format of the Income Statement
LO 3 Prepare an income statement.
Condensed
More
representative
of the type
found in
practice.
Illustration 4-3
Condensed Income Statement
Copyright © 2011 Pearson Prentice Hall. All rights reserved.3-17
Evaluating a Firm’s EPS and Dividends
• We can use the income statement to determine the earnings per share (EPS) and dividends.
• EPS = Net income÷ Number of shares outstanding
Copyright © 2011 Pearson Prentice Hall. All rights reserved.3-18
Evaluating a Firm’s EPS and Dividends (cont.)
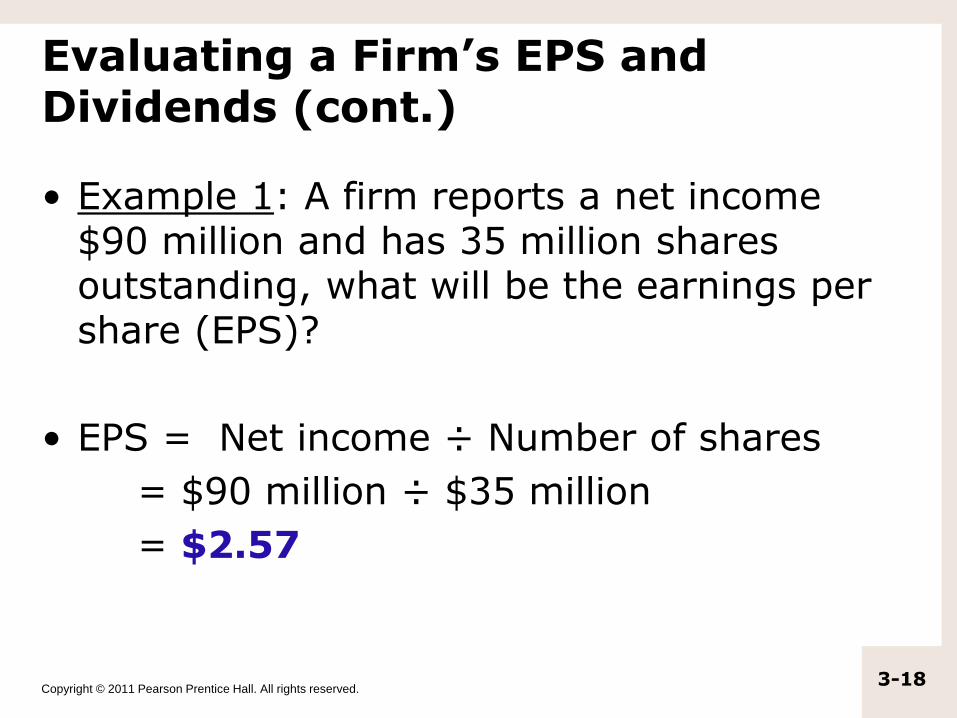
• Example 1: A firm reports a net income $90 million and has 35 million shares outstanding, what will be the earnings per share (EPS)?
• EPS = Net income ÷ Number of shares
= $90 million ÷ $35 million
= $2.57
Copyright © 2011 Pearson Prentice Hall. All rights reserved.3-19
Evaluating a Firm’s EPS and Dividends (cont.)
• We can determine the dividends paid by the firm to each shareholder by dividing the total amount of dividend (reported on the income statement) by the total number of shares outstanding.
• Dividends per share = Net income ÷Number of shares
Copyright © 2011 Pearson Prentice Hall. All rights reserved.3-20
Evaluating a Firm’s EPS and Dividends (cont.)
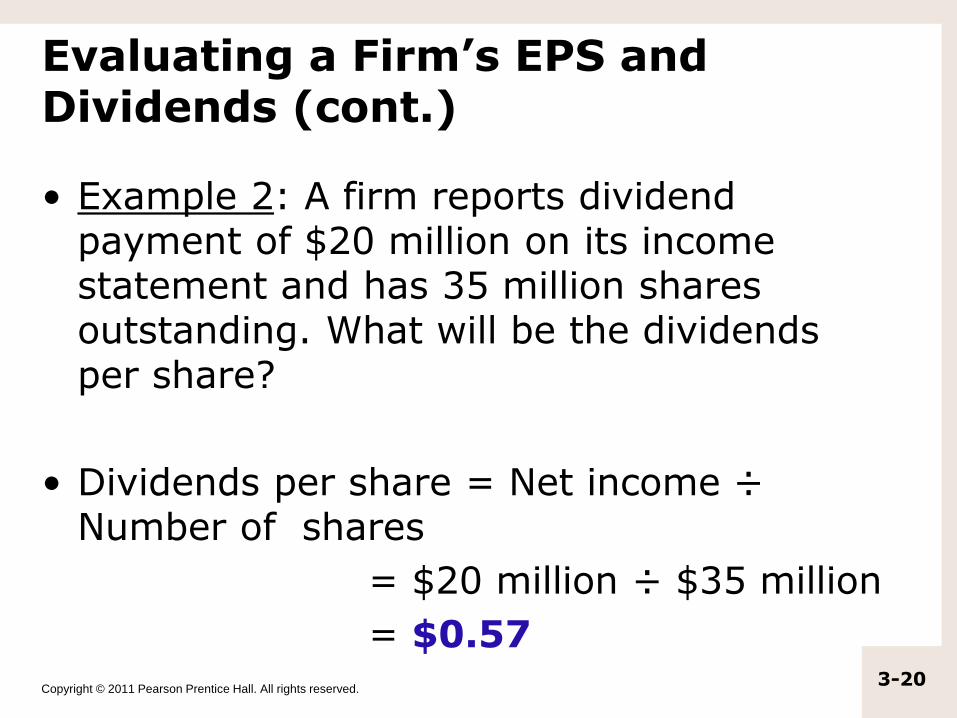
• Example 2: A firm reports dividend payment of $20 million on its income statement and has 35 million shares outstanding. What will be the dividends per share?
• Dividends per share = Net income ÷Number of shares
= $20 million ÷ $35 million
= $0.57
Copyright © 2011 Pearson Prentice Hall. All rights reserved.3-21
Connecting the Income Statement and the Balance Sheet (cont.)
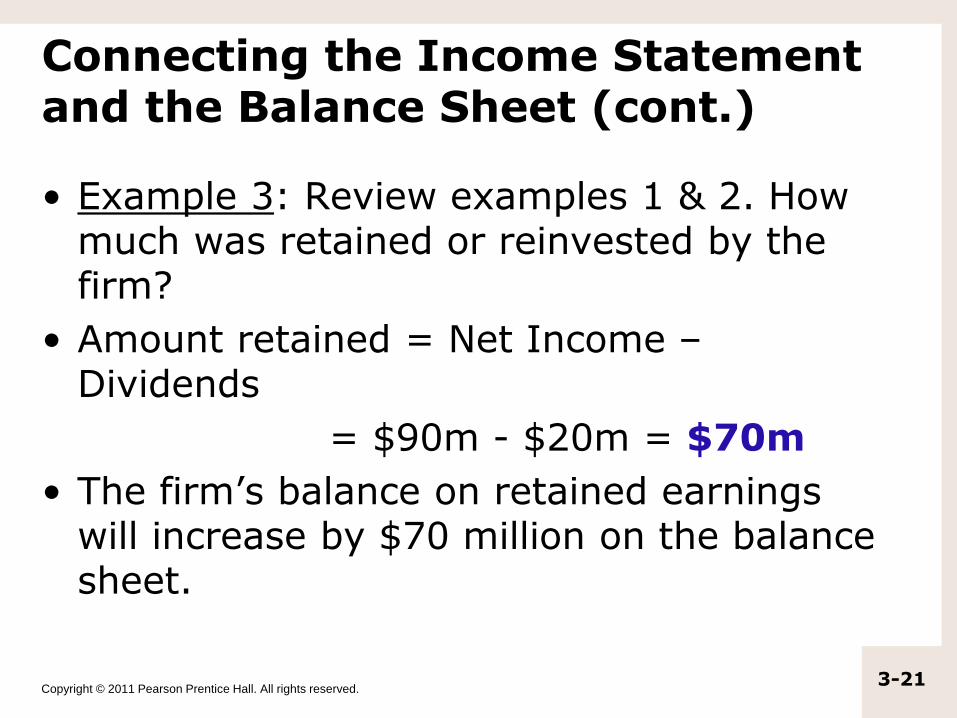
• Example 3: Review examples 1 & 2. How much was retained or reinvested by the firm?
• Amount retained = Net Income –Dividends
= $90m - $20m = $70m
• The firm’s balance on retained earnings will increase by $70 million on the balance sheet.

Copyright © 2011 Pearson Prentice Hall. All rights reserved.
3.3 Corporate Taxes
Copyright © 2011 Pearson Prentice Hall. All rights reserved.3-23
Corporate Taxes
• A firm’s income tax liability is calculated using its taxable income and the tax rates on corporate income.
• See the table on next slide for corporate tax rates.
Copyright © 2011 Pearson Prentice Hall. All rights reserved.3-24
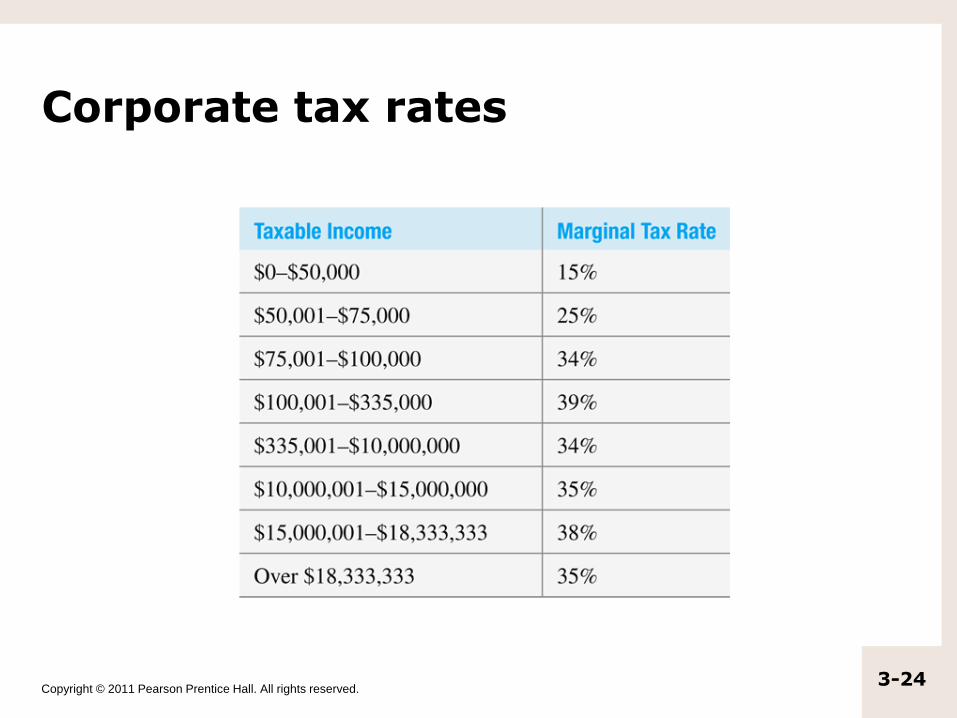
Corporate tax rates
Copyright © 2011 Pearson Prentice Hall. All rights reserved.3-25
Corporate tax rates
• The table reveals the following:
– Tax rates range from 15% to 39%
– Tax rates are progressive i.e. larger corporations with higher profits will tend to pay more taxes compared to smaller firms with lower profits.
– Note: In addition to federal taxes, a firm may face State and City taxes.
Copyright © 2011 Pearson Prentice Hall. All rights reserved.3-26
Marginal and Average Tax Rates
• While analyzing the tax consequences of a new business venture, the appropriate tax rate is the marginal tax rate.
• Marginal tax rate is the tax rate that the company will pay on its next dollar of taxable income.
• Average tax rate is total taxes paid divided by the taxable income.
Copyright © 2011 Pearson Prentice Hall. All rights reserved.3-27
Marginal and Average Tax Rates
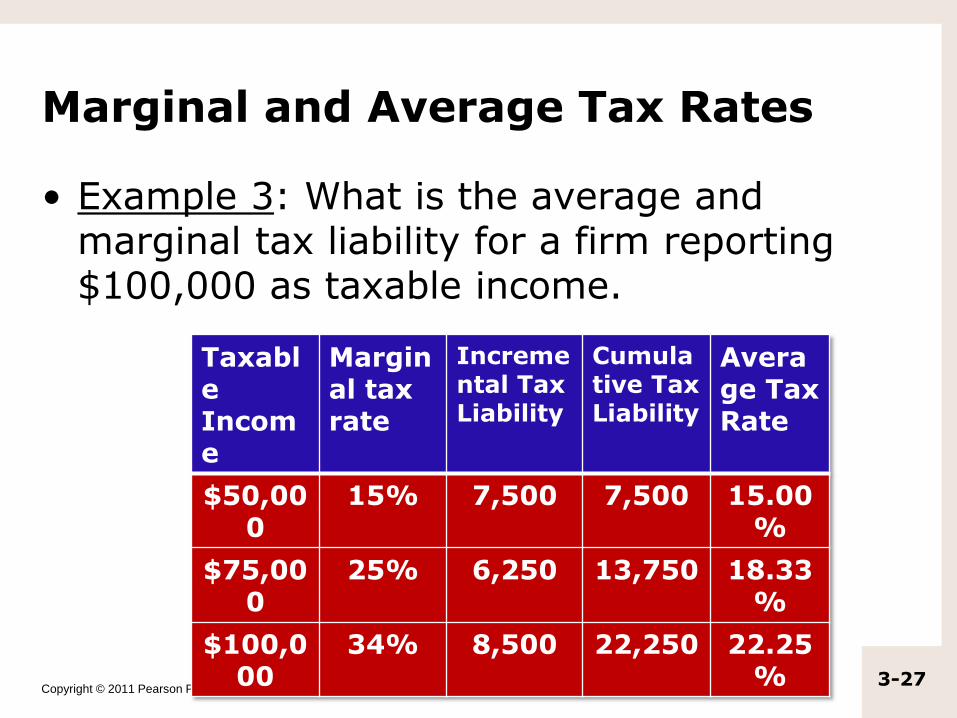
• Example 3: What is the average and marginal tax liability for a firm reporting $100,000 as taxable income.
TaxableIncome
Marginal tax rate
Incremental Tax Liability
Cumulative Tax Liability
Average Tax Rate
$50,000
15% 7,500 7,500 15.00%
$75,000
25% 6,250 13,750 18.33%
$100,000
34% 8,500 22,250 22.25%
Copyright © 2011 Pearson Prentice Hall. All rights reserved.3-28
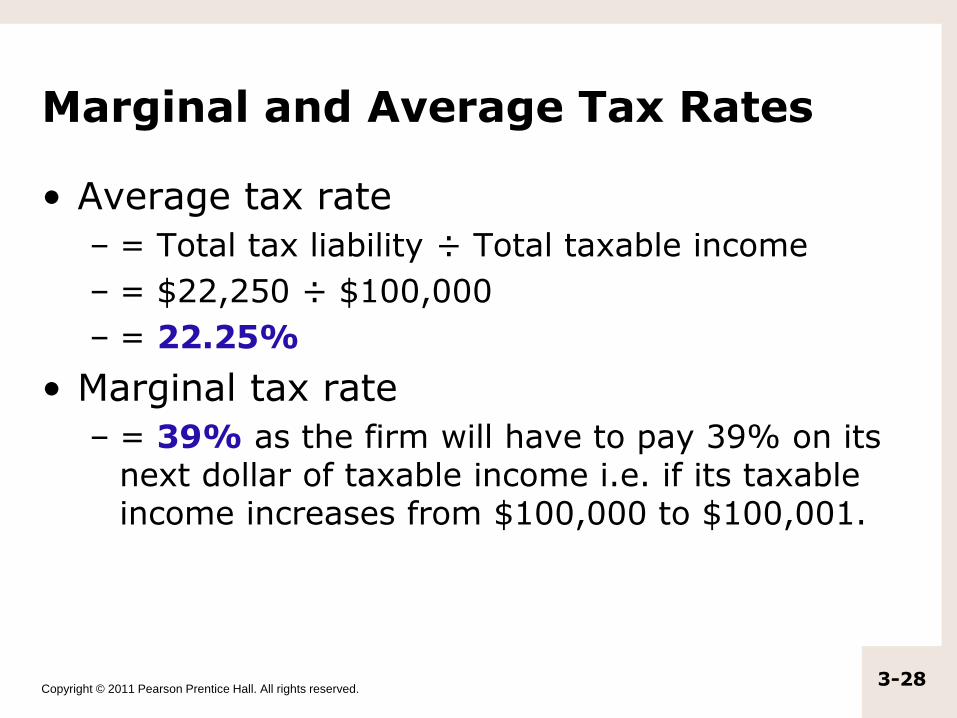
Marginal and Average Tax Rates
• Average tax rate
– = Total tax liability ÷ Total taxable income
– = $22,250 ÷ $100,000
– = 22.25%
• Marginal tax rate
– = 39% as the firm will have to pay 39% on its next dollar of taxable income i.e. if its taxable income increases from $100,000 to $100,001.

Copyright © 2011 Pearson Prentice Hall. All rights reserved.
3.4 The Balance Sheet
Copyright © 2011 Pearson Prentice Hall. All rights reserved.3-30
The Balance Sheet
• The balance sheet provides a snapshot of the firm’s financial position on a specific date.
• The balance sheet is defined by the following equation:
Total Assets = Total Liabilities + Total Shareholder’s Equity
Copyright © 2011 Pearson Prentice Hall. All rights reserved.3-31
The Balance Sheet (cont.)
• Total assets represents the resources owned by the firm.
• Total liabilities represent the total amount of money the firm owes its creditors
• Total shareholders’ equity refers to the difference in the value of the firm’s total assets and the firm’s total liabilities.
Copyright © 2011 Pearson Prentice Hall. All rights reserved.3-32
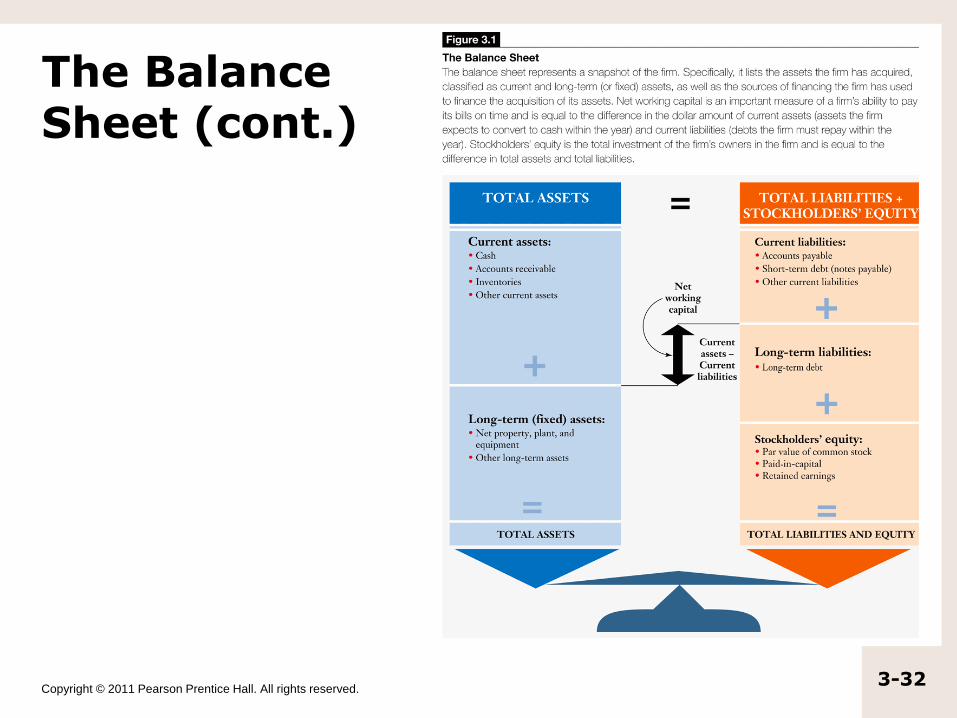
The Balance Sheet (cont.)
Copyright © 2011 Pearson Prentice Hall. All rights reserved.3-33
The Balance Sheet (cont.)
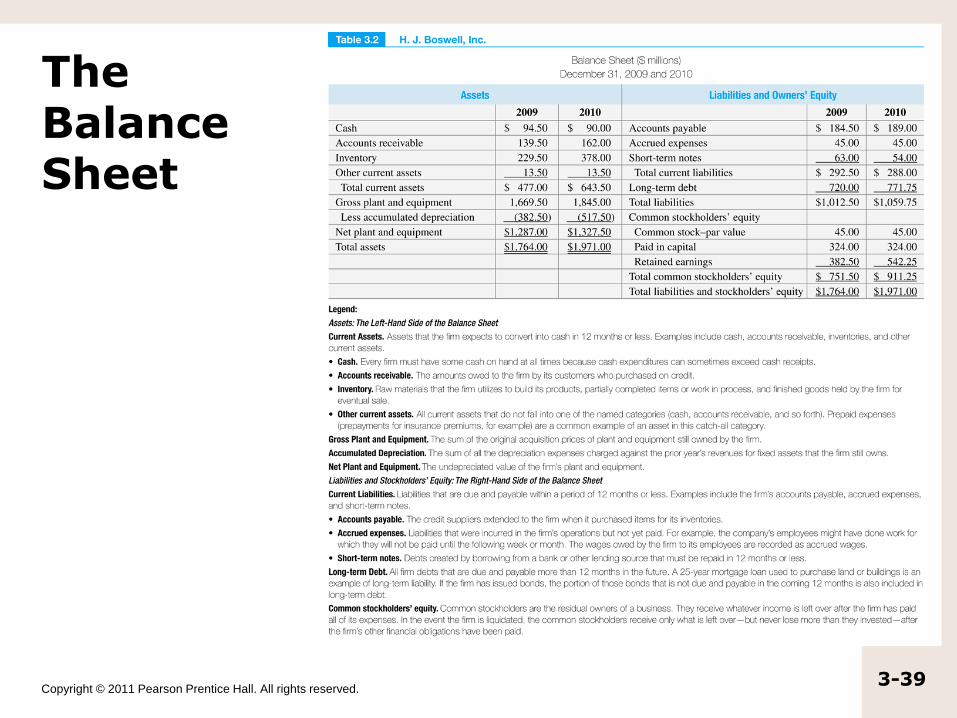
• The balance sheet includes the following main components:
1.Assets – Found on the left-hand side of the balance sheet. It includes current assets and fixed assets.
2.Sources of financing – Found on the right-hand side of the balance sheet. It includes current liabilities, long-term liabilities, and owner’s equity.
Copyright © 2011 Pearson Prentice Hall. All rights reserved.3-34
The Balance Sheet (cont.)
• Current assets consists of firm’s cash plus other assets the firm expects to convert to cash within 12 months or less, such as receivables and inventory.
• Fixed assets are assets that the firm does not expect to sell within one year. For example, plant and equipment, land.
Copyright © 2011 Pearson Prentice Hall. All rights reserved.3-35
The Balance Sheet (cont.)
• Current liabilities represent the amount that the firm owes to creditors that must be repaid within a period of 12 months or less such as accounts payable, notes payable.
• Long-term liabilities refer to debt with maturities longer than a year such as bank loans, bonds.
Copyright © 2011 Pearson Prentice Hall. All rights reserved.3-36
The Balance Sheet (cont.)
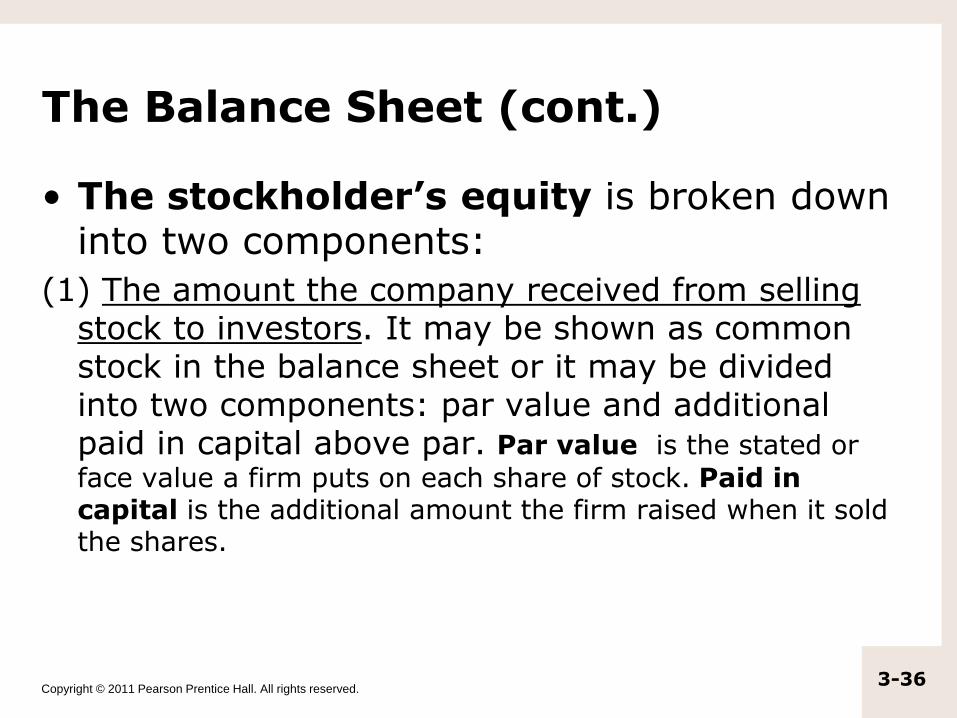
• The stockholder’s equity is broken down into two components:
(1) The amount the company received from selling stock to investors. It may be shown as common stock in the balance sheet or it may be divided into two components: par value and additional paid in capital above par. Par value is the stated or
face value a firm puts on each share of stock. Paid in capital is the additional amount the firm raised when it sold the shares.
Copyright © 2011 Pearson Prentice Hall. All rights reserved.3-37
The Balance Sheet (cont.)
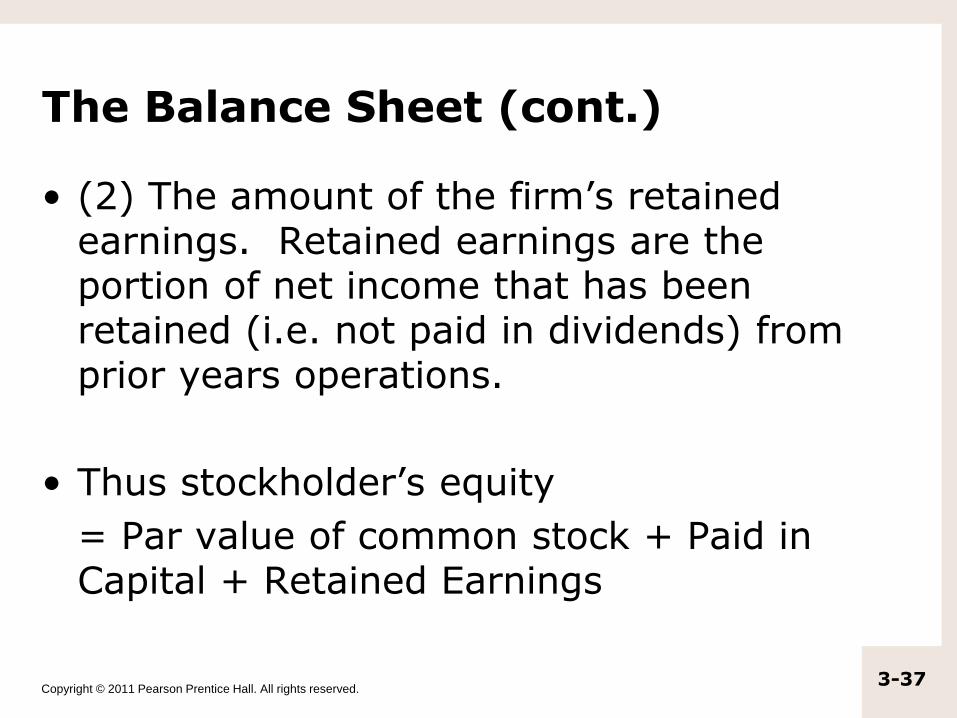
• (2) The amount of the firm’s retained earnings. Retained earnings are the portion of net income that has been retained (i.e. not paid in dividends) from prior years operations.
• Thus stockholder’s equity
= Par value of common stock + Paid in Capital + Retained Earnings
Copyright © 2011 Pearson Prentice Hall. All rights reserved.3-38
The Balance Sheet (cont.)
• We can also express stockholders’ equity as follows:
Shareholders' equity = Total Assets – Total
Liabilities
Copyright © 2011 Pearson Prentice Hall. All rights reserved.3-39
The Balance Sheet