Chapter 2: Organizing the Data 1. a. b. c.
31
Solutions Manual Chapter 2: Elementary Statistics in Social Research Organizing the Data Chapter 2: Organizing the Data 1. A cross-tabulation of serious illnesses is a table in which the distribution of illnesses is a. presented separately for the categories of a second variable, such as gender, age, or race. b. presented in a table. c. presented in a graph. d. presented in a pie chart. Answer: (a) presented separately for the categories of a second variable, such as gender, age, or race. 2. Frequency distributions can be used to a. compare gender differences in violent criminal behavior. b. display the grades on a midterm examination for all students in a sociology course. c. compare attitudes of college students and their parents regarding war. d. show attitudes of all students on a campus regarding war. e. All of the above Answer: (e) All of the above 3. Which of the following is not used to make comparisons between distributions when their total frequencies differ? a. Proportions b. Rates c. Ratios d. Class limits Answer: (d) ratios 4. By definition, class intervals contain more than one a. score value. b. score. c. respondent. d. category. Answer: (a) score value. Elementary Statistics in Social Research 12th Edition Levin Solutions Manual Full Download: http://alibabadownload.com/product/elementary-statistics-in-social-research-12th-edition-levin-solutions-manual/ This sample only, Download all chapters at: alibabadownload.com
Transcript of Chapter 2: Organizing the Data 1. a. b. c.

Solutions Manual Chapter 2: Elementary Statistics in Social Research Organizing the Data
Chapter 2: Organizing the Data
1. A cross-tabulation of serious illnesses is a table in which the distribution of
illnesses is a. presented separately for the categories of a second variable, such as
gender, age, or race. b. presented in a table. c. presented in a graph. d. presented in a pie chart.
Answer: (a) presented separately for the categories of a second variable, such as gender, age, or race.
2. Frequency distributions can be used to a. compare gender differences in violent criminal behavior. b. display the grades on a midterm examination for all students in a
sociology course. c. compare attitudes of college students and their parents regarding war. d. show attitudes of all students on a campus regarding war. e. All of the above
Answer: (e) All of the above
3. Which of the following is not used to make comparisons between distributions when their total frequencies differ?
a. Proportions b. Rates c. Ratios d. Class limits
Answer: (d) ratios
4. By definition, class intervals contain more than one
a. score value. b. score. c. respondent. d. category.
Answer: (a) score value.
Elementary Statistics in Social Research 12th Edition Levin Solutions ManualFull Download: http://alibabadownload.com/product/elementary-statistics-in-social-research-12th-edition-levin-solutions-manual/
This sample only, Download all chapters at: alibabadownload.com

Solutions Manual Chapter 2: Elementary Statistics in Social Research Organizing the Data
5. Which of the following is employed when comparing a score on a final examination against the entire distribution of grades in a class?
a. Midpoint b. Class interval c. Class limits d. Percentiles
Answer: (d) Percentiles
6. The peakedness of a distribution of scores is also known as
a. kurtosis. b. skewness. c. midpoint. d. mean.
Answer: (a) kurtosis
7. A frequency distribution of the number of defendants sentenced to death in each of
the 50 states during 2001 would be depicted best in the form of a a. histogram. b. bar graph. c. frequency polygon. d. line chart.
Answer: (c) frequency polygon
8. The direction of skewness is determined by the relative position of the
a. peak of the distribution. b. midpoint of the distribution. c. tail of the distribution. d. class limits of the distribution.
Answer: (c) tail of the distribution

Solutions Manual Chapter 2: Elementary Statistics in Social Research Organizing the Data
9. To show changes in birth rate from 1980 to the present, by year, a researcher would probably use a
a. pie chart. b. bar graph. c. line chart. d. frequency polygon.
Answer: (c) line chart
10. From the following table representing achievement for 173 television viewers and
183 nonviewers, find (a) the percent of nonviewers who are high achievers, (b) the percent of viewers who are high achievers, (c) the proportion of nonviewers who are high achievers, and (d) the proportion of viewers who are high achievers.
Achievement for Television Viewers and Nonviewers
Viewing Status Achievement Nonviewers ViewersHigh achievers 93 46Low achievers 90 127 Total 183 173
Answer:
a.
% (100)
93(100)
183
50.8%
f
N
b.
% (100)
46(100)
173
26.6%
f
N

Solutions Manual Chapter 2: Elementary Statistics in Social Research Organizing the Data
c.
93
183
0.51
fP
N
d.
46
173
0.27
fP
N
11. From the following table representing family structure for black and white children
in a particular community, find (a) the percent of black children having two-parent families, (b) the percent of white children having two-parent families, (c) the proportion of black children having two-parent families, and (d) the proportion of white children having two-parent families.
Family Structure for Black and White Children
Race of Child Family Black WhiteOne parent 53 59Two parents 60 167 Total 113 226
Answer:
a.
% (100)
60(100)
113
53.1%
f
N

Solutions Manual Chapter 2: Elementary Statistics in Social Research Organizing the Data
b.
% (100)
167(100)
226
73.9%
f
N
c.
60
113
0.53
fP
N
d.
167
226
0.74
fP
N
12. From the following table illustrating the handedness of a random sample of men and women, find (a) the percent of men who are left-handed, (b) the percent of women who are left-handed, (c) the proportion of men who are left-handed, and (d) the proportion of women who are left-handed. (e) What can you conclude about gender and the prevalence of left-handedness?
Handedness of Men and Women Gender
Handedness Male FemaleLeft-handed 15 8Right-handed 86 114 Total 101 122

Solutions Manual Chapter 2: Elementary Statistics in Social Research Organizing the Data
Answer:
a.
% (100)
15(100)
101
14.9%
f
N
b.
% (100)
8(100)
122
6.6%
f
N
c.
15
101
0.15
fP
N
d.
8
122
0.07
fP
N
e. Left-handedness is more prevalent among men.

Solutions Manual Chapter 2: Elementary Statistics in Social Research Organizing the Data
13. As part of a public health survey, a random sample of college students were asked about their weekly drinking habits. The following results were obtained:
Gender of Student
Never
< 3 Drinks per Week
3+ Drinks per week
Men 116 88 49 Women 164 104 32
a. Are there independent and dependent variables in this case? If so, what
are they? If not, why not? b. What percent of the sample reports not drinking? c. What percent of men report drinking, but having fewer than three drinks
per week? d. What percent of women report drinking, but having fewer than three drinks
per week? e. What percent of men report drinking at least three drinks per week? f. What percent of women report drinking at least three drinks per week? g. What percent of the sample reports having at least three drinks per week?
Answer:
a. Gender is the independent variable Number of drinks is the dependent variable
b.
% (100)
280(100)
553
50.6%
f
N
c.
% (100)
88(100)
253
34.8%
f
N

Solutions Manual Chapter 2: Elementary Statistics in Social Research Organizing the Data
d.
% (100)
104(100)
300
34.7%
f
N
e.
% (100)
49(100)
253
19.4%
f
N
f.
% (100)
32(100)
300
10.7%
f
N
g.
% (100)
81(100)
553
14.6%
f
N
Solutions Manual Chapter 2: Elementary Statistics in Social Research Organizing the Data
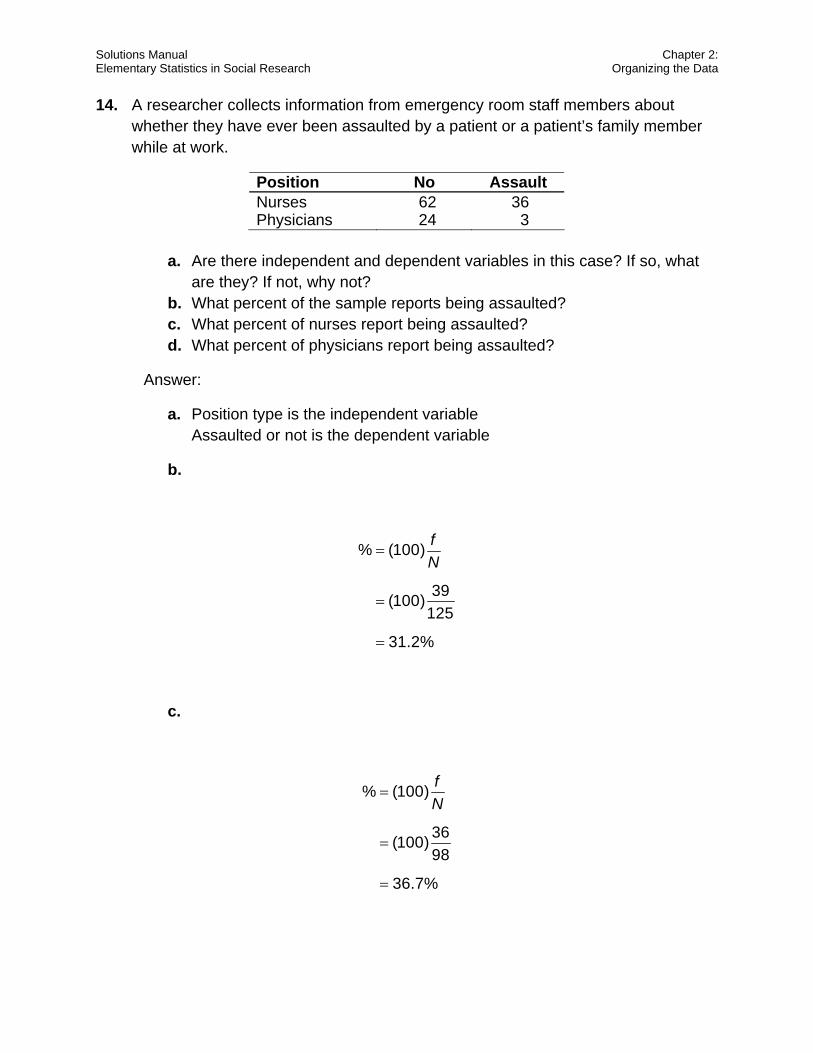
14. A researcher collects information from emergency room staff members about whether they have ever been assaulted by a patient or a patient’s family member while at work.
Position No Assault Nurses 62 36Physicians 24 3
a. Are there independent and dependent variables in this case? If so, what
are they? If not, why not? b. What percent of the sample reports being assaulted? c. What percent of nurses report being assaulted? d. What percent of physicians report being assaulted?
Answer:
a. Position type is the independent variable Assaulted or not is the dependent variable
b.
% (100)
39(100)
125
31.2%
f
N
c.
% (100)
36(100)
98
36.7%
f
N

Solutions Manual Chapter 2: Elementary Statistics in Social Research Organizing the Data
d.
% (100)
3(100)
27
11.1%
f
N
15. A researcher collects information from a random sample of consumers of different social classes about whether they had purchased a new car within the past year.
Social Class No New New Car Upper class 23 10Middle class 21 6 Lower class 12 1
a. Are there independent and dependent variables in this case? If so, what
are they? If not, why not? b. What percent of the sample reported purchasing a new car within the last
year? c. What percent of upper-class respondents reported purchasing a new car? d. What percent of middle-class respondents reported purchasing a new
car? e. What percent of lower-class respondents reported purchasing a new car? f. What is the effect of social class on purchases of new cars?
Answer:
a. Class position is the independent variable Car purchase is the dependent variable
b.
% (100)
17(100)
73
23.3%
f
N

Solutions Manual Chapter 2: Elementary Statistics in Social Research Organizing the Data
c.
% (100)
10(100)
33
30.3%
f
N
d.
% (100)
6(100)
27
22.2%
f
N
e.
% (100)
1(100)
13
7.7%
f
N
f. The higher the social class the higher the percentage of new cars purchased in the past year
16. In a group of 125 males and 80 females, what is the gender ratio (number of males per 100 females)?
Answer:
malesGender ratio (100)
females
125(100)
80
156.25
f
f

Solutions Manual Chapter 2: Elementary Statistics in Social Research Organizing the Data
17. In a group of 15 black children and 20 white children, what is the ratio of blacks to whites?
Answer:
1
2
ratio =
15
20
3
4
f
f
18. If 300 live births occur among 3,500 women of childbearing age, what is the birth rate (per 1,000 women of childbearing age)?
actual casesBirth rate (1,000)
potential cases
300(1,000)
3,500
85.71
f
f
There are 85.71 live births for every 1,000 women of childbearing age.
19. What is the rate of change for a population increase from 15,000 in 1960 to 25,000 in 2000?
Answer:
time 2 time 1rate of change (100)
time 1
25,000 15,000(100)
15,000
66.67%
f f
f

Solutions Manual Chapter 2: Elementary Statistics in Social Research Organizing the Data
20. What is the rate of change for a tax increase from $32 billion per year to $37 billion per year?
Answer:
time 2 time 1rate of change (100)
time 1
37 32(100)
32
15.63%
f f
f
21. A researcher studying the prevalence of alcohol use among seniors in a particular high school asked 45 of these youths how many drinks they had consumed in the last week. Convert the following frequency distribution of responses (number of drinks) into a grouped frequency distribution containing four class intervals, and (a) determine the size of the class intervals, (b) indicate the upper and lower limits of each class interval, (c) identify the midpoint of each class interval, (d) find the percentage for each class interval, (e) find the cumulative frequency of each class interval, and (f) find the cumulative percentage for each class interval.
Number of Drinks f7 56 95 64 113 42 31 30 4
N =45
Answer:
Number of f % Cf c% 6-7 14 31.1 45 100.0 4-5 17 37.8 31 69.0 2-3 7 15.6 14 31.2 0-1 7 15.6 7 15.6
N = 45
Solutions Manual Chapter 2: Elementary Statistics in Social Research Organizing the Data
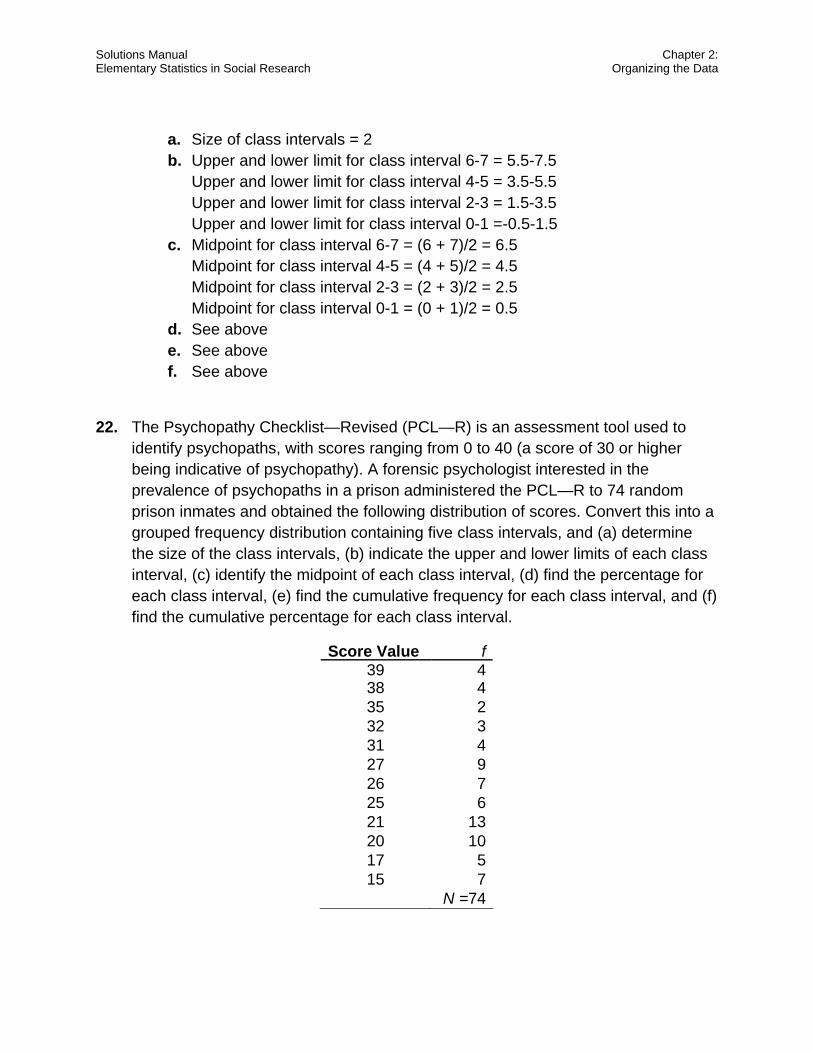
a. Size of class intervals = 2 b. Upper and lower limit for class interval 6-7 = 5.5-7.5
Upper and lower limit for class interval 4-5 = 3.5-5.5 Upper and lower limit for class interval 2-3 = 1.5-3.5 Upper and lower limit for class interval 0-1 =-0.5-1.5
c. Midpoint for class interval 6-7 = (6 + 7)/2 = 6.5 Midpoint for class interval 4-5 = (4 + 5)/2 = 4.5 Midpoint for class interval 2-3 = (2 + 3)/2 = 2.5 Midpoint for class interval 0-1 = (0 + 1)/2 = 0.5
d. See above e. See above f. See above
22. The Psychopathy Checklist—Revised (PCL—R) is an assessment tool used to identify psychopaths, with scores ranging from 0 to 40 (a score of 30 or higher being indicative of psychopathy). A forensic psychologist interested in the prevalence of psychopaths in a prison administered the PCL—R to 74 random prison inmates and obtained the following distribution of scores. Convert this into a grouped frequency distribution containing five class intervals, and (a) determine the size of the class intervals, (b) indicate the upper and lower limits of each class interval, (c) identify the midpoint of each class interval, (d) find the percentage for each class interval, (e) find the cumulative frequency for each class interval, and (f) find the cumulative percentage for each class interval.
Score Value f39 438 435 232 331 427 926 725 621 1320 1017 515 7
N =74
Solutions Manual Chapter 2: Elementary Statistics in Social Research Organizing the Data
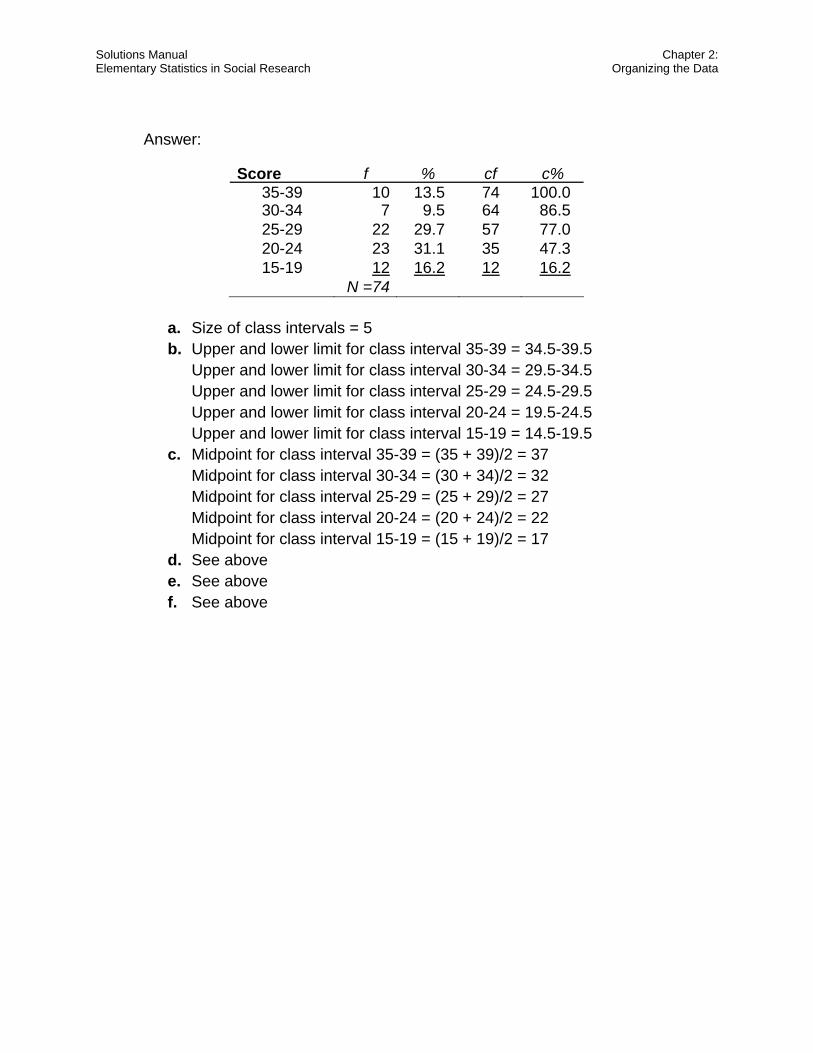
Answer:
Score f % cf c%35-39 10 13.5 74 100.0 30-34 7 9.5 64 86.5 25-29 22 29.7 57 77.0 20-24 23 31.1 35 47.3 15-19 12 16.2 12 16.2
N =74
a. Size of class intervals = 5 b. Upper and lower limit for class interval 35-39 = 34.5-39.5
Upper and lower limit for class interval 30-34 = 29.5-34.5 Upper and lower limit for class interval 25-29 = 24.5-29.5 Upper and lower limit for class interval 20-24 = 19.5-24.5 Upper and lower limit for class interval 15-19 = 14.5-19.5
c. Midpoint for class interval 35-39 = (35 + 39)/2 = 37 Midpoint for class interval 30-34 = (30 + 34)/2 = 32 Midpoint for class interval 25-29 = (25 + 29)/2 = 27 Midpoint for class interval 20-24 = (20 + 24)/2 = 22 Midpoint for class interval 15-19 = (15 + 19)/2 = 17
d. See above e. See above f. See above

Solutions Manual Chapter 2: Elementary Statistics in Social Research Organizing the Data
23. The following is a cross-tabulation of whether respondents rent or own their home
by social class for a sample of 240 heads of households:
Housing Status Social Class Rent Own TotalLower Class 62 18 80Middle Class 47 63 110 Upper Class 11 39 50 Total 120 120 240
a. Which is the independent variable and which is the dependent variable? b. Compute row percents for the cross-tabulation. c. What percent of the sample owns their home? d. What percent of the sample rents? e. What percent of the lower-class respondents owns? f. What percent of the middle-class respondents rents? g. Which social class has the greatest tendency to rent? h. Which social class has the greatest tendency to own? i. What can be concluded about the relationship between social class and
housing status? ` Answer:
a. IV = social class, DV = housing status b.
Housing Status Social Class Rent Own Total
Lower Class 62
77.5%18
22.5%80
100%
Middle Class 4742.7%
6357.3
110100%
Upper Class 1122.0%
3978.0%
50100%
Total 120
50.0%120
50.0%240
100%
c. 120
Percent of sample that owns = 100 50.0%240
d. 120
Percent of sample that rents = 100 50.0%240

Solutions Manual Chapter 2: Elementary Statistics in Social Research Organizing the Data
e. 18
Percent of lower-class respondent who owns = 100 22.5%80
f. 47
Percent of middle-class respondent who rents = 100 42.7%110
g. Lower class h. Upper class i. The higher the social class, the greater the tendency to own rather than
rent.
24. A sample of respondents was asked their opinions of the death penalty for convicted murderers and of mercy killing for the terminally ill. The responses are given in the following cross-tabulation:
Death Penalty Mercy Killing Favor Oppose TotalFavor 63 29 92Oppose 70 18 88 Total 133 47 180
a. Why is there no independent or dependent variable? b. Compute total percents for the cross-tabulation. c. What percent of the sample favors the use of the death penalty? d. What percent of the sample favors mercy killing? e. What percent of the sample favors both types of killing? f. What percent of the sample opposes both types of killing? g. What percent of the sample favors one type of killing but not the other? h. What can be concluded about the relationship between the variables?
Answer:
a. Because neither opinion is clearly the result of the other b.
Death Penalty Mercy Killing Favor Oppose Total
Favor 63
35.0%29
16.1%92
51.1%
Oppose 70
38.9%18
10.0%88
48.9%
Total 133
73.9%47
26.1%180
100%

Solutions Manual Chapter 2: Elementary Statistics in Social Research Organizing the Data
c. 133
Percent of sample that favors the use of the death penalty = 100 73.9%180
d. 92
Percent of sample that favors mercy killings = 100 51.1%180
e. 63
Percent of sample that favors both types of killings = 100 35.0%180
f. 18
Percent of sample that opposes both types of killings = 100 10.0%180
g. 99
Percent of sample that favors one type of killing but not the other = 100 55.0%180
h. People who favor the death penalty are more likely to oppose mercy
killing, whereas people who oppose the death penalty are more likely to favor mercy killing.
25. Gender
Sexual Orientation Male Female Total Heterosexual 87 106 193Homosexual 14 9 23 Bisexual 6 3 9 Total 107 118 225
a. Are there independent and dependent variables in this case? If so, what
are they? If not, why not? b. Compute column percents for the cross-tabulation. c. What percent of the sample is heterosexual? d. What percent of the sample is comprised of female homosexuals? e. What percent of the sample is bisexual? f. What percent of the sample is comprised of male heterosexuals? g. What can we conclude about gender differences in sexual orientation?
` Answer:
a. No, there is no IV or DV because gender does not cause sexual orientation

Solutions Manual Chapter 2: Elementary Statistics in Social Research Organizing the Data
b. Gender
Sexual Orientation Male Female Total
Heterosexual 87
81.3%106
89.8%193
85.8%
Homosexual 1413.1%
97.6%
23 10.2%
Bisexual 65.6%
32.5%
9 4.0%
Total 107
100%118
100%225
100%
c. 193
Percent of sample that is heterosexual = 100225
85.8%
d. 9
Percent of sample that is comprised of female homosexuals = 100 4.0%225
e. 9
Percent of sample that is bisexual = 100 4.0%225
f. 87
Percent of sample that is comprised of male heterosexuals = 100 38.7%225
g. Both males and females tend to be heterosexual.
26. A random sample of women over the age of 18 was asked if they considered
themselves to be depressed. Their responses are given next, cross-tabulated with their marital status:
Martial Status State of Depression Single Married Divorced Widowed Total Depressed 24 37 11 3 75 Nondepressed 113 82 68 14 277 Total 137 119 79 17 352
a. Compute total percents for the cross-tabulation. b. What percent of the sample considered themselves to be depressed? c. What percent of the sample did not consider themselves to be depressed? d. What percent of the sample is divorced women who are not depressed? e. What percent of the sample is single women who are depressed? f. Which marital status is associated with the highest percentage of
depressed women?

Solutions Manual Chapter 2: Elementary Statistics in Social Research Organizing the Data
Answer:
a. Martial Status State of
Depression Single Married Divorced Widowed Total
Depressed 24
6.8%37
10.5%11
3.1%3
0.8% 75
21.3%
Nondepressed 113
32.1%82
23.3%68
19.3%14
4.0% 277
78.7%
Total 137
38.9%119
33.8%79
22.4%17
4.8% 352
100%
b. Percent of sample that consider themselves to be depressed
75= 100 21.3%
352
c. Percent of sample that did not consider themselves to be depressed
227= 100 78.7%
352
d. Percent of sample that is divorced women who are not depressed
68= 100 19.3%
352
e. 24
Percent of sample that is single women who are depressed =100 6.8%352
f. Married
27. Use a pie chart to depict the following information about college majors of students in a statistics class.
Major f % Social work 12 24Criminal justice 9 17Political science 6 12Sociology 24 47

Solutions Manual Chapter 2: Elementary Statistics in Social Research Organizing the Data
Answer:
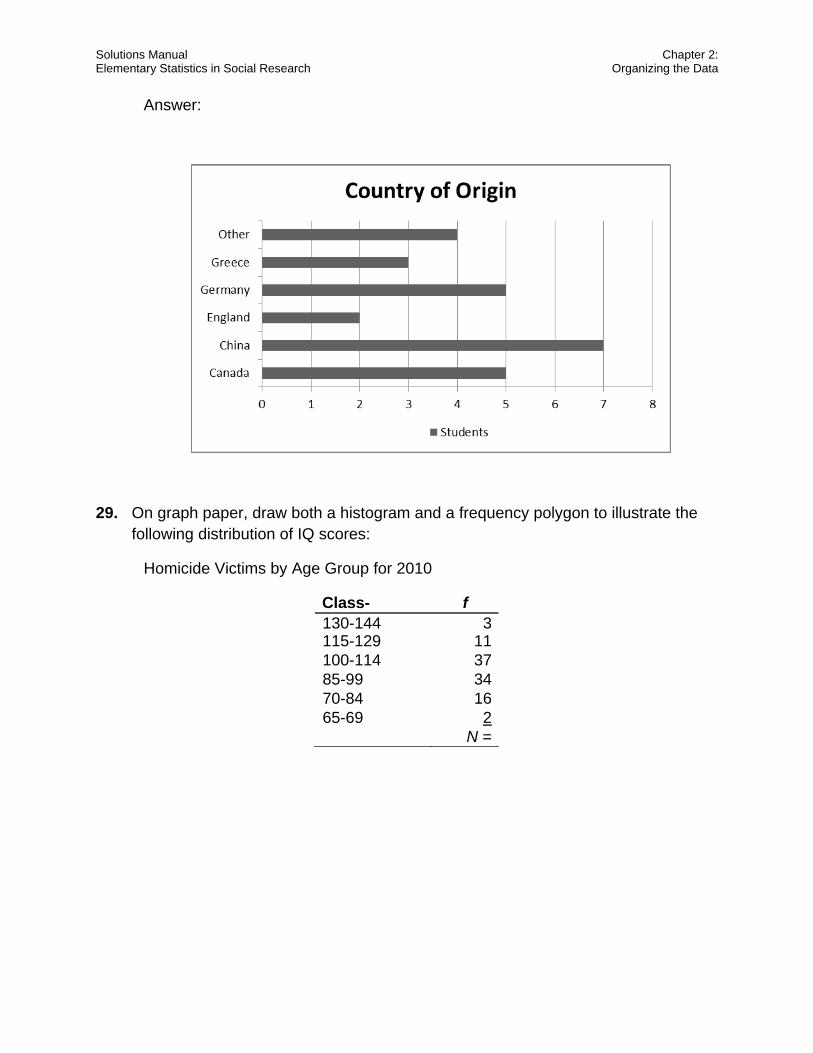
28. Depict the following data in a bar graph:
Country of Origin of International St d t
f
Canada 5China 7England 2Germany 5Greece 3Other 4 N = 26
Solutions Manual Chapter 2: Elementary Statistics in Social Research Organizing the Data
Answer:
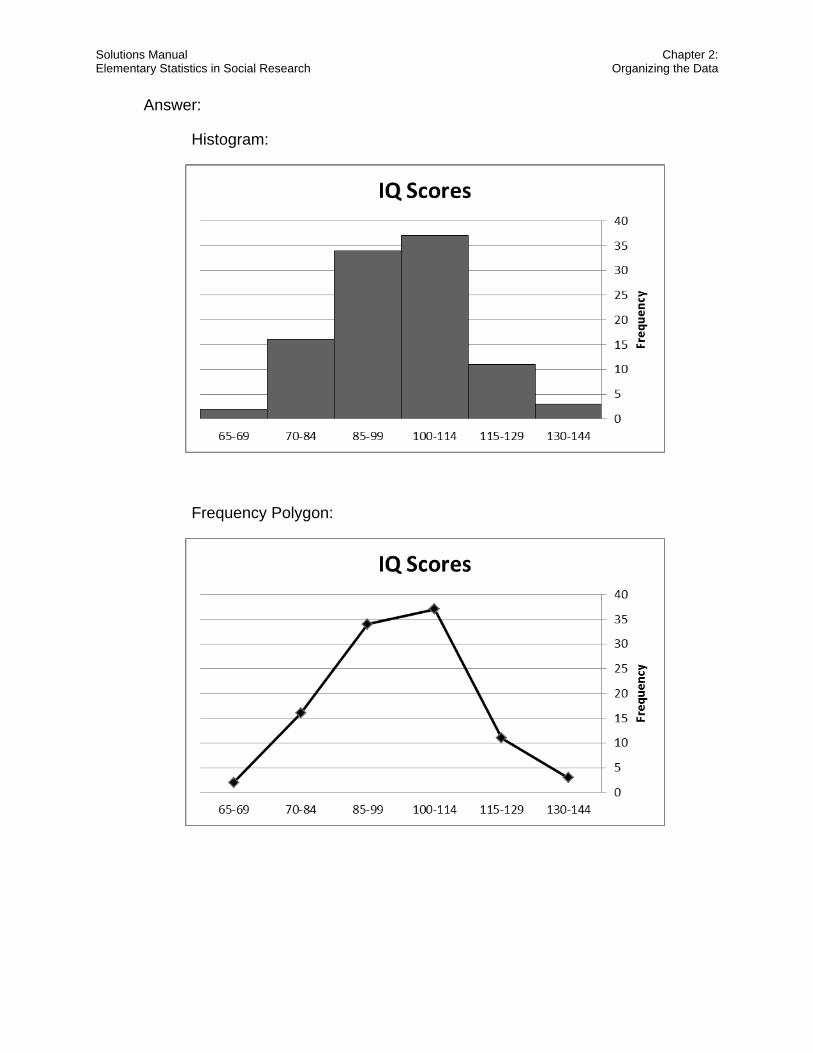
29. On graph paper, draw both a histogram and a frequency polygon to illustrate the following distribution of IQ scores:
Homicide Victims by Age Group for 2010
Class- f 130-144 3115-129 11100-114 3785-99 3470-84 1665-69 2 N =
Solutions Manual Chapter 2: Elementary Statistics in Social Research Organizing the Data
Answer:
Histogram:
Frequency Polygon:

Solutions Manual Chapter 2: Elementary Statistics in Social Research Organizing the Data
30. Display the following suicide rates (per 100,000) both as a histogram and as a line chart:
Age Suicide 15-24 13.125-34 15.7 35-44 15.2 45-54 16.4 55-64 17.0 65-74 19.7 75-84 25.2 85+ 20.8
Answer:
Histogram:
Line Chart:

Solutions Manual Chapter 2: Elementary Statistics in Social Research Organizing the Data
31. The distribution of Scholastic Assessment Test (SAT) scores for 38 high school seniors who graduated in the top third of their class is as follows:
SAT f750-800 1700-740 2650-690 3600-640 5550-590 10500-540 8450-490 4400-440 3350-390 2
N = 38
a. For each class interval, find the size, midpoint, upper and lower limits, the cumulative frequency, the percentage, and the cumulative percentage.
b. To depict the distribution of SAT scores for the 38 students, draw a histogram and a frequency polygon.
c. To depict the cumulative distribution of these SAT scores, draw a cumulative frequency polygon.

Solutions Manual Chapter 2: Elementary Statistics in Social Research Organizing the Data
Answer:
SAT f % cf c%750-800 1 2.6% 38 100% 700-740 2 5.3% 37 97.5% 650-690 3 7.9% 35 92.2% 600-640 5 13.2% 32 84.3% 550-590 10 26.3% 27 71.1% 500-540 8 21.1% 17 44.8% 450-490 4 10.5% 9 23.7% 400-440 3 7.9% 5 13.2% 350-390 2 5.3% 2 5.3%
N = 38
a. Size of class intervals = 50 Upper and lower limit for class interval 750-800 = 745-805 Upper and lower limit for class interval 700-740 = 695-745 Upper and lower limit for class interval 650-690 = 645-695 Upper and lower limit for class interval 600-640 = 595-645 Upper and lower limit for class interval 550-590 = 545-595 Upper and lower limit for class interval 500-540 = 495-545 Upper and lower limit for class interval 450-490 = 445-495 Upper and lower limit for class interval 400-440 = 395-445 Upper and lower limit for class interval 350-390 = 345-395 Midpoint for class interval 750-800 = 775 Midpoint for class interval 700-740 = 720 Midpoint for class interval 650-690 = 670 Midpoint for class interval 600-640 = 620 Midpoint for class interval 550-590 = 570 Midpoint for class interval 500-540 = 520 Midpoint for class interval 450-490 = 470 Midpoint for class interval 400-440 = 420 Midpoint for class interval 350-390 = 370

Solutions Manual Chapter 2: Elementary Statistics in Social Research Organizing the Data
b. Histogram
Frequency Polygon

Solutions Manual Chapter 2: Elementary Statistics in Social Research Organizing the Data
c. Cumulative frequency Polygon

Solutions Manual Chapter 2: Elementary Statistics in Social Research Organizing the Data
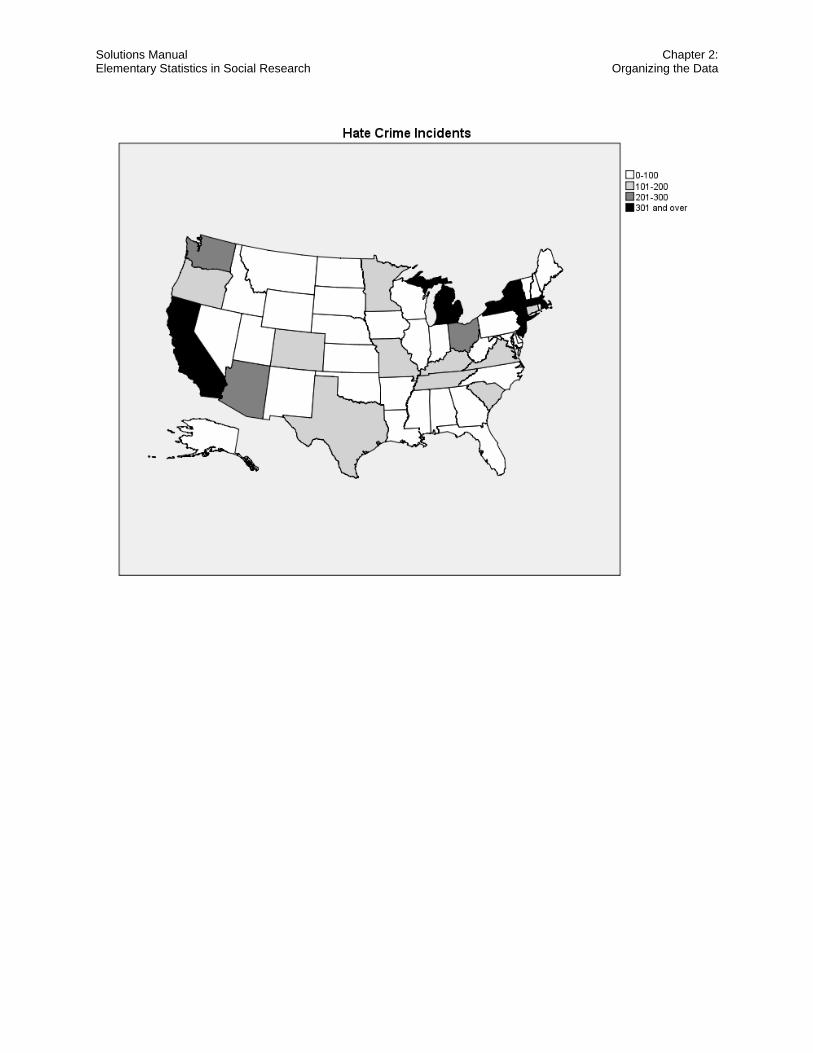
32. Create a grouped frequency distribution with four categories using the following data. Then, using your grouped frequency distribution and a blank map of the United States, display the data on the number of hate crimes reported in 2010.
State Total Number State Total Number of
Alabama 19 Nebraska 61 Alaska 7 Nevada 68 Arizona 236 New 31 Arkansas 63 New Jersey 543 California 1,092 New Mexico 24 Colorado 154 New York 699 Connecticut 147 North Carolina 94 Delaware 20 North Dakota 8 Florida 136 Ohio 247 Georgia 17 Oklahoma 49 Idaho 28 Oregon 134 Illinois 94 Pennsylvania 57 Indiana 94 Rhode Island 20 Iowa 17 South 109 Kansas 58 South Dakota 51 Kentucky 173 Tennessee 147 Louisiana 13 Texas 174 Maine 61 Utah 63 Maryland 80 Vermont 17 Massachusetts 316 Virginia 175 Michigan 304 Washington 232 Minnesota 127 West Virginia 33 Mississippi 11 Wisconsin 93 Missouri 142 Wyoming 2 Montana 31
Answer:
Number of Incidents Reported
f
301 and over 5201-300 3101-200 110-100 30Total 49
Solutions Manual Chapter 2: Elementary Statistics in Social Research Organizing the Data

Teacher’s Manual Chapter 2: Elementary Statistics in Criminal Justice Research Organizing the Data
Elementary Statistics in Social Research 12th Edition Levin Solutions ManualFull Download: http://alibabadownload.com/product/elementary-statistics-in-social-research-12th-edition-levin-solutions-manual/
This sample only, Download all chapters at: alibabadownload.com