Chapter 2 Energy and Energy Types
45
Chapter 2 Energy and Energy Types 2.1 Energy Energy is the capacity to do work. Energy comes in various forms, such as motion, heat, light, electrical, chemical, nuclear energy, and gravitational. Total energy is the sum of all forms of the energy a system possesses. In the absence of magnetic, electrical and surface tension effects, the total energy of a system consists of the kinetic, potential, and internal energies. The internal energy of a system is made up of sensible, latent, chemical, and nuclear energies. The sensible internal energy is due to translational, rotational, and vibrational effects of atoms and molecules. Thermal energy is the sensible and latent forms of internal energy. The classifi- cation of energy into different ‘‘types’’ often follows the boundaries of the fields of study in the natural sciences. For example, chemical energy is the kind of potential energy stored in chemical bonds, and nuclear energy is the energy stored in interactions between the particles in the atomic nucleus. Microscopic forms of energy are related to the molecular structure of a system and they are independent of outside reference frames. Hydrogen represents a store of potential energy that can be released by fusion of hydrogen in the Sun. Some of the fusion energy is then transformed into sunlight, which may again be stored as gravitational potential energy after it strikes the earth. For example, water evaporates from the oceans, may be deposited on elevated parts of the earth, and after being released at a hydroelectric dam, it can drive turbines to produce energy in the form of electricity. Atmospheric phenomena like wind, rain, snow, and hurricanes, are all a result of energy transformations brought about by solar energy on the atmosphere of the earth. Sunlight is also captured by plants as chemical potential energy in photosynthesis, when carbon dioxide and water are converted into carbohydrates, lipids, and proteins. This chemical potential energy is responsible for growth and develop- ment of a biological cell. British thermal unit (Btu) is the energy unit in the English system needed to raise the temperature of 1 lb m of water at 68°F by 1°F. Calorie (cal) is the amount Y. Demirel, Energy, Green Energy and Technology, DOI: 10.1007/978-1-4471-2372-9_2, Ó Springer-Verlag London Limited 2012 27
Transcript of Chapter 2 Energy and Energy Types
Chapter 2Energy and Energy Types
2.1 Energy
Energy is the capacity to do work. Energy comes in various forms, such as motion,heat, light, electrical, chemical, nuclear energy, and gravitational. Total energy isthe sum of all forms of the energy a system possesses. In the absence of magnetic,electrical and surface tension effects, the total energy of a system consists of thekinetic, potential, and internal energies. The internal energy of a system is madeup of sensible, latent, chemical, and nuclear energies. The sensible internal energyis due to translational, rotational, and vibrational effects of atoms and molecules.Thermal energy is the sensible and latent forms of internal energy. The classifi-cation of energy into different ‘‘types’’ often follows the boundaries of the fields ofstudy in the natural sciences. For example, chemical energy is the kind of potentialenergy stored in chemical bonds, and nuclear energy is the energy stored ininteractions between the particles in the atomic nucleus. Microscopic forms ofenergy are related to the molecular structure of a system and they are independentof outside reference frames.
Hydrogen represents a store of potential energy that can be released by fusionof hydrogen in the Sun. Some of the fusion energy is then transformed intosunlight, which may again be stored as gravitational potential energy after it strikesthe earth. For example, water evaporates from the oceans, may be deposited onelevated parts of the earth, and after being released at a hydroelectric dam, it candrive turbines to produce energy in the form of electricity. Atmosphericphenomena like wind, rain, snow, and hurricanes, are all a result of energytransformations brought about by solar energy on the atmosphere of the earth.Sunlight is also captured by plants as chemical potential energy in photosynthesis,when carbon dioxide and water are converted into carbohydrates, lipids, andproteins. This chemical potential energy is responsible for growth and develop-ment of a biological cell.
British thermal unit (Btu) is the energy unit in the English system needed toraise the temperature of 1 lbm of water at 68�F by 1�F. Calorie (cal) is the amount
Y. Demirel, Energy, Green Energy and Technology,DOI: 10.1007/978-1-4471-2372-9_2, � Springer-Verlag London Limited 2012
27
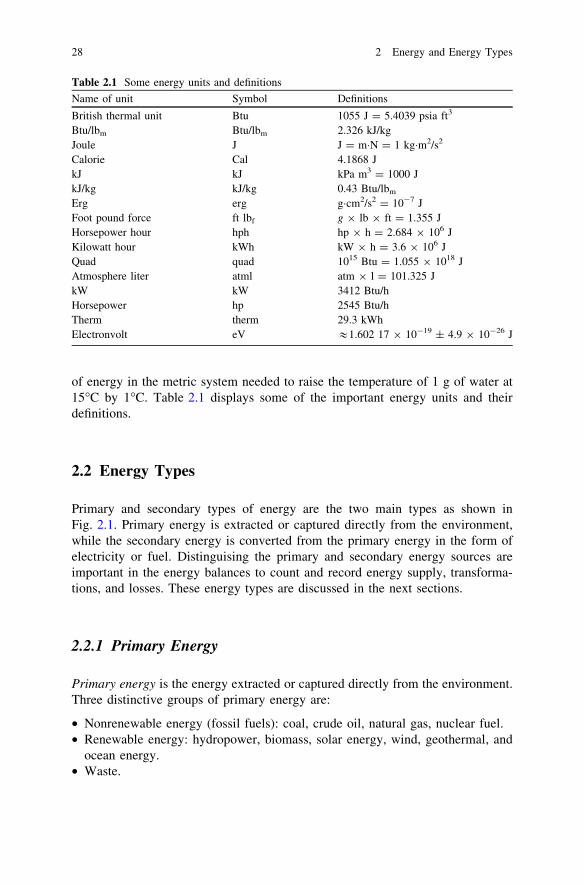
of energy in the metric system needed to raise the temperature of 1 g of water at15�C by 1�C. Table 2.1 displays some of the important energy units and theirdefinitions.
2.2 Energy Types
Primary and secondary types of energy are the two main types as shown inFig. 2.1. Primary energy is extracted or captured directly from the environment,while the secondary energy is converted from the primary energy in the form ofelectricity or fuel. Distinguising the primary and secondary energy sources areimportant in the energy balances to count and record energy supply, transforma-tions, and losses. These energy types are discussed in the next sections.
2.2.1 Primary Energy
Primary energy is the energy extracted or captured directly from the environment.Three distinctive groups of primary energy are:
• Nonrenewable energy (fossil fuels): coal, crude oil, natural gas, nuclear fuel.• Renewable energy: hydropower, biomass, solar energy, wind, geothermal, and
ocean energy.• Waste.
Table 2.1 Some energy units and definitions
Name of unit Symbol Definitions
British thermal unit Btu 1055 J = 5.4039 psia ft3
Btu/lbm Btu/lbm 2.326 kJ/kgJoule J J = m�N = 1 kg�m2/s2
Calorie Cal 4.1868 JkJ kJ kPa m3 = 1000 JkJ/kg kJ/kg 0.43 Btu/lbm
Erg erg g�cm2/s2 = 10-7 JFoot pound force ft lbf g 9 lb 9 ft = 1.355 JHorsepower hour hph hp 9 h = 2.684 9 106 JKilowatt hour kWh kW 9 h = 3.6 9 106 JQuad quad 1015 Btu = 1.055 9 1018 JAtmosphere liter atml atm 9 l = 101.325 JkW kW 3412 Btu/hHorsepower hp 2545 Btu/hTherm therm 29.3 kWhElectronvolt eV &1.602 17 9 10-19 ± 4.9 9 10-26 J
28 2 Energy and Energy Types
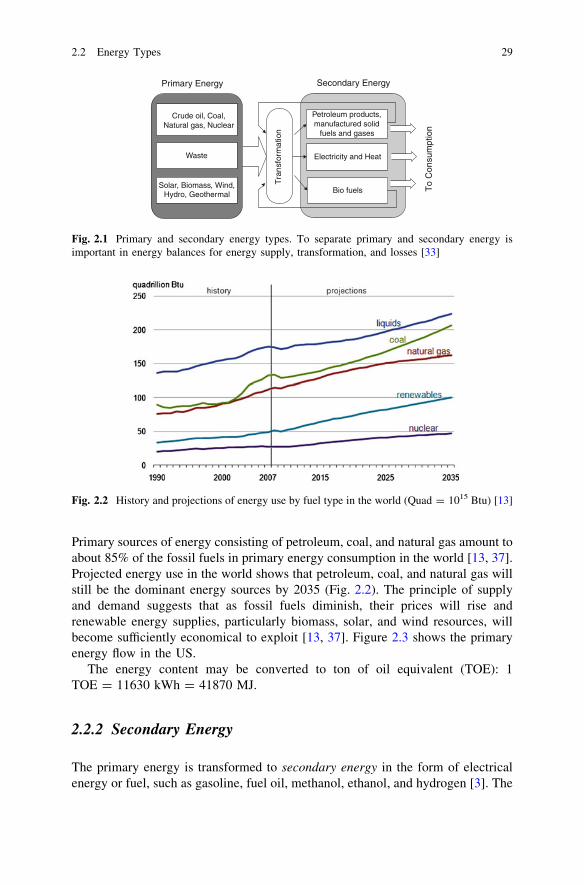
Primary sources of energy consisting of petroleum, coal, and natural gas amount toabout 85% of the fossil fuels in primary energy consumption in the world [13, 37].Projected energy use in the world shows that petroleum, coal, and natural gas willstill be the dominant energy sources by 2035 (Fig. 2.2). The principle of supplyand demand suggests that as fossil fuels diminish, their prices will rise andrenewable energy supplies, particularly biomass, solar, and wind resources, willbecome sufficiently economical to exploit [13, 37]. Figure 2.3 shows the primaryenergy flow in the US.
The energy content may be converted to ton of oil equivalent (TOE): 1TOE = 11630 kWh = 41870 MJ.
2.2.2 Secondary Energy
The primary energy is transformed to secondary energy in the form of electricalenergy or fuel, such as gasoline, fuel oil, methanol, ethanol, and hydrogen [3]. The
Crude oil, Coal, Natural gas, Nuclear
Waste
Solar, Biomass, Wind, Hydro, Geothermal
Tra
nsfo
rmat
ion
Petroleum products, manufactured solid
fuels and gases
Electricity and Heat
Bio fuels To
Con
sum
ptio
n
Primary Energy Secondary Energy
Fig. 2.1 Primary and secondary energy types. To separate primary and secondary energy isimportant in energy balances for energy supply, transformation, and losses [33]
Fig. 2.2 History and projections of energy use by fuel type in the world (Quad = 1015 Btu) [13]
2.2 Energy Types 29
primary energy of renewable energy sources, such as sun, wind, biomass, geo-thermal energy, and flowing water is usually equated with either electrical orthermal energy produced from them. Final energy is often electrical energy andfuel, which is referred to as useful energy. The selected four types of final energyare electrical, thermal, mechanical, and chemical energy. These types of finalenergy set a boundary between the energy production and the consumption sectors[7, 14, 33].
2.3 Non Renewable Energy Sources
It is generally accepted that nonrenewable energy sources or fossil fuels are formedfrom the remains of dead plants and animals by exposure to heat and pressure inthe earth’s crust over the millions of years. Major nonrenewable energy sourcesare:
• Coal• Petroleum• Natural gas• Nuclear
Fossil fuels contain high percentages of carbon and include mainly coal, petro-leum, and natural gas. Natural gas, for example, contains only very low boilingpoint and gaseous components, while gasoline contains much higher boiling pointcomponents. The specific mixture of hydrocarbons gives a fuel its characteristicproperties, such as boiling point, melting point, density, and viscosity. These types
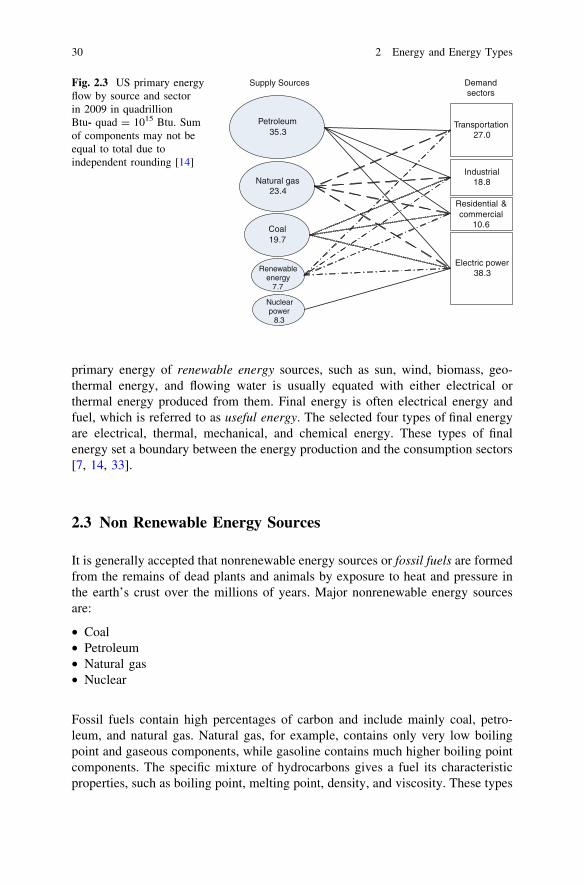
Petroleum35.3
Natural gas23.4
Coal19.7
Renewable energy
7.7
Nuclear power
8.3
Transportation27.0
Industrial18.8
Residential & commercial
10.6
Electric power38.3
Supply Sources Demand sectors
Fig. 2.3 US primary energyflow by source and sectorin 2009 in quadrillionBtu- quad = 1015 Btu. Sumof components may not beequal to total due toindependent rounding [14]
30 2 Energy and Energy Types
of fuels are known as nonrenewable energy sources. The following sections dis-cuss some important nonrenewable energy sources.
2.3.1 Coal
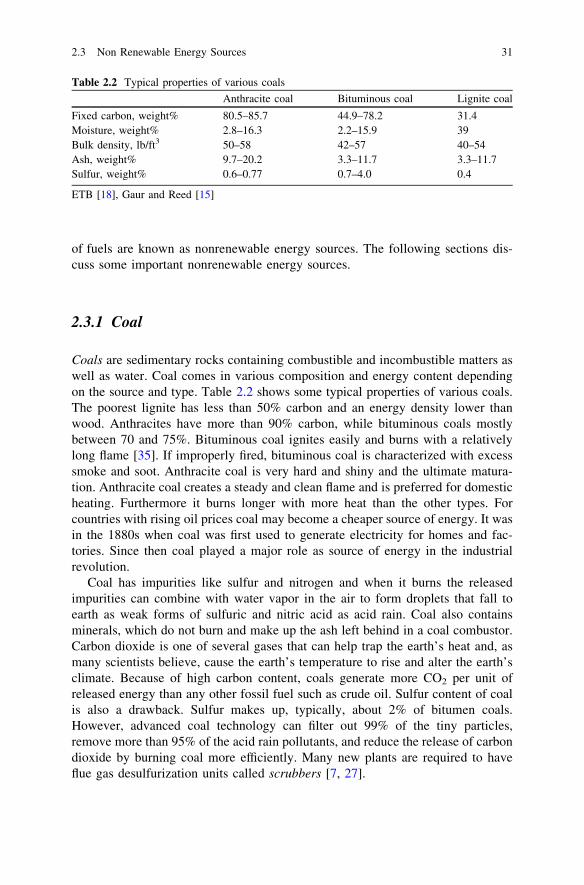
Coals are sedimentary rocks containing combustible and incombustible matters aswell as water. Coal comes in various composition and energy content dependingon the source and type. Table 2.2 shows some typical properties of various coals.The poorest lignite has less than 50% carbon and an energy density lower thanwood. Anthracites have more than 90% carbon, while bituminous coals mostlybetween 70 and 75%. Bituminous coal ignites easily and burns with a relativelylong flame [35]. If improperly fired, bituminous coal is characterized with excesssmoke and soot. Anthracite coal is very hard and shiny and the ultimate matura-tion. Anthracite coal creates a steady and clean flame and is preferred for domesticheating. Furthermore it burns longer with more heat than the other types. Forcountries with rising oil prices coal may become a cheaper source of energy. It wasin the 1880s when coal was first used to generate electricity for homes and fac-tories. Since then coal played a major role as source of energy in the industrialrevolution.
Coal has impurities like sulfur and nitrogen and when it burns the releasedimpurities can combine with water vapor in the air to form droplets that fall toearth as weak forms of sulfuric and nitric acid as acid rain. Coal also containsminerals, which do not burn and make up the ash left behind in a coal combustor.Carbon dioxide is one of several gases that can help trap the earth’s heat and, asmany scientists believe, cause the earth’s temperature to rise and alter the earth’sclimate. Because of high carbon content, coals generate more CO2 per unit ofreleased energy than any other fossil fuel such as crude oil. Sulfur content of coalis also a drawback. Sulfur makes up, typically, about 2% of bitumen coals.However, advanced coal technology can filter out 99% of the tiny particles,remove more than 95% of the acid rain pollutants, and reduce the release of carbondioxide by burning coal more efficiently. Many new plants are required to haveflue gas desulfurization units called scrubbers [7, 27].
Table 2.2 Typical properties of various coals
Anthracite coal Bituminous coal Lignite coal
Fixed carbon, weight% 80.5–85.7 44.9–78.2 31.4Moisture, weight% 2.8–16.3 2.2–15.9 39Bulk density, lb/ft3 50–58 42–57 40–54Ash, weight% 9.7–20.2 3.3–11.7 3.3–11.7Sulfur, weight% 0.6–0.77 0.7–4.0 0.4
ETB [18], Gaur and Reed [15]
2.3 Non Renewable Energy Sources 31

2.3.2 Petroleum (Crude Oil)
Oil is a naturally occurring flammable liquid consisting of a complex mixture ofhydrocarbons of various molecular weights, which define its physical and chemicalproperties, like heating value, color, and viscosity. The composition of hydro-carbons ranges from as much as 97% by weight in the lighter oils to as little as50% in the heavier oils. The proportion of chemical elements varies over fairlynarrow limits as seen in Table 2.3. The hydrocarbons in crude oil are mostlyalkanes, cycloalkanes and various aromatic hydrocarbons while the other organiccompounds contain nitrogen, oxygen, sulfur, and trace amounts of metals. Therelative percentage of each varies and determines the properties of oil (seeTable 2.4).
• Alkanes, also known as paraffin, are saturated hydrocarbons with straight orbranched chains containing only carbon and hydrogen and have the generalformula CnH2n+2. They generally have from 5 to 40 carbon atoms per molecule.For example, CH4 represents the methane, which is a major component ofnatural gas. The propane (C3H8) and butane (C4H10) are known as petroleumgases. At the heavier end of the range, paraffin wax is an alkane with approx-imately 25 carbon atoms, while asphalt has 35 and up. These long chain alkanesare usually cracked by modern refineries into lighter and more valuableproducts.
• Cycloalkanes, also known as naphthenes, are saturated hydrocarbons whichhave one or more carbon rings to which hydrogen atoms are attached accordingto the formula CnH2n. Cycloalkanes have similar properties to alkanes but havehigher boiling points.
• Aromatic hydrocarbons are unsaturated hydrocarbons which have one or moresix-carbon rings called benzene rings with double and single bonds andhydrogen atoms attached according to the formula CnHn.
Table 2.3 Typical elementalcomposition by weight ofcrude oil [17]
Element Percent range (%)
Carbon 83–87Hydrogen 10–14Nitrogen 0.1–2Oxygen 0.1–1.5Sulfur 0.5–6Metals \0.1
Table 2.4 Composition byweight of hydrocarbons inpetroleum
Hydrocarbon Average (%) Range (%)
Paraffins (alkanes) 30 15–60Naphtanes (cycloalkanes) 49 30–60Aromatics 15 3–30Asphaltics 6 Remainder
32 2 Energy and Energy Types
Oil currently supplies more than 40% of our total energy demands and morethan 99% of the fuel are used in transportation. Known oil reserves are typicallyestimated at around 1.2 trillion barrels without oil sands, or 3.74 trillion barrelswith oil sands [3, 26].
2.3.3 Petroleum Fractions
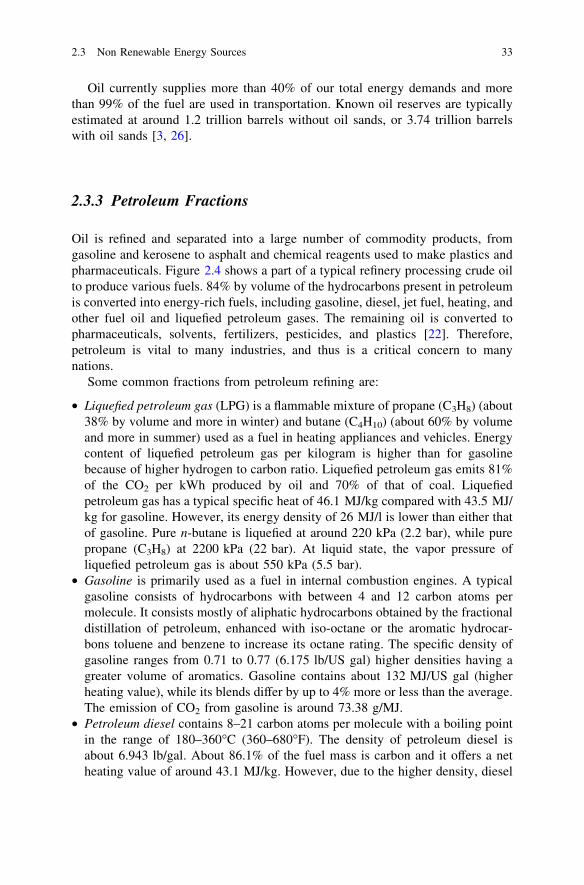
Oil is refined and separated into a large number of commodity products, fromgasoline and kerosene to asphalt and chemical reagents used to make plastics andpharmaceuticals. Figure 2.4 shows a part of a typical refinery processing crude oilto produce various fuels. 84% by volume of the hydrocarbons present in petroleumis converted into energy-rich fuels, including gasoline, diesel, jet fuel, heating, andother fuel oil and liquefied petroleum gases. The remaining oil is converted topharmaceuticals, solvents, fertilizers, pesticides, and plastics [22]. Therefore,petroleum is vital to many industries, and thus is a critical concern to manynations.
Some common fractions from petroleum refining are:
• Liquefied petroleum gas (LPG) is a flammable mixture of propane (C3H8) (about38% by volume and more in winter) and butane (C4H10) (about 60% by volumeand more in summer) used as a fuel in heating appliances and vehicles. Energycontent of liquefied petroleum gas per kilogram is higher than for gasolinebecause of higher hydrogen to carbon ratio. Liquefied petroleum gas emits 81%of the CO2 per kWh produced by oil and 70% of that of coal. Liquefiedpetroleum gas has a typical specific heat of 46.1 MJ/kg compared with 43.5 MJ/kg for gasoline. However, its energy density of 26 MJ/l is lower than either thatof gasoline. Pure n-butane is liquefied at around 220 kPa (2.2 bar), while purepropane (C3H8) at 2200 kPa (22 bar). At liquid state, the vapor pressure ofliquefied petroleum gas is about 550 kPa (5.5 bar).
• Gasoline is primarily used as a fuel in internal combustion engines. A typicalgasoline consists of hydrocarbons with between 4 and 12 carbon atoms permolecule. It consists mostly of aliphatic hydrocarbons obtained by the fractionaldistillation of petroleum, enhanced with iso-octane or the aromatic hydrocar-bons toluene and benzene to increase its octane rating. The specific density ofgasoline ranges from 0.71 to 0.77 (6.175 lb/US gal) higher densities having agreater volume of aromatics. Gasoline contains about 132 MJ/US gal (higherheating value), while its blends differ by up to 4% more or less than the average.The emission of CO2 from gasoline is around 73.38 g/MJ.
• Petroleum diesel contains 8–21 carbon atoms per molecule with a boiling pointin the range of 180–360�C (360–680�F). The density of petroleum diesel isabout 6.943 lb/gal. About 86.1% of the fuel mass is carbon and it offers a netheating value of around 43.1 MJ/kg. However, due to the higher density, diesel
2.3 Non Renewable Energy Sources 33
offers a higher volumetric energy density at 128,700 Btu/gal versus 115,500Btu/gal for gasoline, some 11% higher (see Table 2.7). The CO2 emissions fromdiesel are 73.25 g/MJ, (similar to gasoline). Because of quality regulations,additional refining is required to remove sulfur which may contribute to a highercost.
• Kerosene is a thin, clear liquid formed containing between 6 and 16 carbonatoms per molecule, with density of 0.78–0.81 g/cm3. The flash point of kero-sene is between 37 and 65�C (100 and 150�F) and its autoignition temperature is220�C (428 F). The heat of combustion of kerosene is similar to that of diesel:its lower heating value is around 18,500 Btu/lb, (43.1 MJ/kg), and its higherheating value is 46.2 MJ/kg (19,861 Btu/lb).
• Jet fuel is a type of aviation fuel designed for use in aircraft powered by gas-turbine engines. The commonly used fuels are Jet A and Jet A-1 which areproduced to a standardised international specification. Jet B is used for itsenhanced cold-weather performance. Jet fuel is a mixture of a large number ofdifferent hydrocarbons with density of 0.775-0.840 kg/l at 15�C (59�F). Therange is restricted by the requirements for the product, for example, the freezingpoint or smoke point. Kerosene-type jet fuel (including Jet A and Jet A-1) has acarbon number between about 8 and 16; wide-cut or naphtha-type jet fuel(including Jet B), between about 5 and 15.
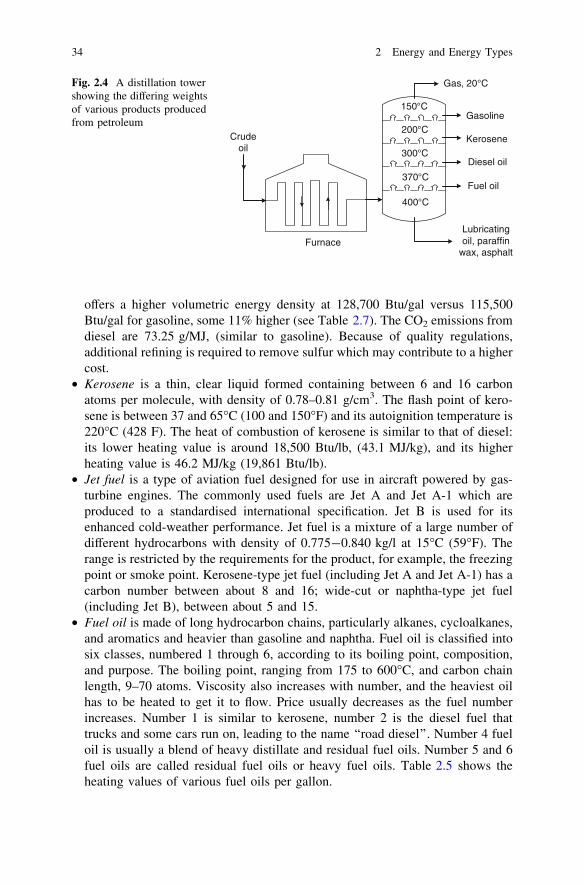
• Fuel oil is made of long hydrocarbon chains, particularly alkanes, cycloalkanes,and aromatics and heavier than gasoline and naphtha. Fuel oil is classified intosix classes, numbered 1 through 6, according to its boiling point, composition,and purpose. The boiling point, ranging from 175 to 600�C, and carbon chainlength, 9–70 atoms. Viscosity also increases with number, and the heaviest oilhas to be heated to get it to flow. Price usually decreases as the fuel numberincreases. Number 1 is similar to kerosene, number 2 is the diesel fuel thattrucks and some cars run on, leading to the name ‘‘road diesel’’. Number 4 fueloil is usually a blend of heavy distillate and residual fuel oils. Number 5 and 6fuel oils are called residual fuel oils or heavy fuel oils. Table 2.5 shows theheating values of various fuel oils per gallon.
150°C
200°C
300°C
370°C
400°C
Gas, 20°C
Gasoline
Kerosene
Diesel oil
Fuel oil
Lubricating oil, paraffin
wax, asphalt
Crude oil
Furnace
Fig. 2.4 A distillation towershowing the differing weightsof various products producedfrom petroleum
34 2 Energy and Energy Types
Carbon fuels contain sulfur and impurities. Combustion of such fuels eventuallyleads to producing sulfur monoxides (SO) and sulfur dioxide (SO2) in the exhaustwhich promotes acid rain. One final element in exhaust pollution is ozone (O3).This is not emitted directly but made in the air by the action of sunlight on otherpollutants to form ground level ozone, which is harmful on the respiratory systemsif the levels are too high. However, the ozone layer in the high atmosphere isuseful in blocking the harmful rays from the sun. Ozone is broken down bynitrogen oxides. For the nitrogen oxides, carbon monoxide, sulfur dioxide, andozone, there are accepted levels that are set by legislation to which no harmfuleffects are observed.
2.3.4 Natural Gas
Natural gas is a naturally occurring mixture, consisting mainly of methane.Table 2.6 shows the typical components of natural gas. Natural gas provides 23%of all energy consumed in the world. The International Energy Agency predictsthat the demand for natural gas will grow by more than 67% through 2030. Naturalgas is becoming increasingly popular as an alternative transportation fuel. Typicaltheoretical flame temperature of natural gas is 1960�C (3562�F), ignition point is593�C.
Natural gas is a major source of electricity production through the use of gasturbines and steam turbines. It burns more cleanly and produces about 30% lesscarbon dioxide than burning petroleum and about 45% less than burning coal foran equivalent amount of heat produced. Combined cycle power generation usingnatural gas is thus the cleanest source of power available using fossil fuels, and thistechnology is widely used wherever gas can be obtained at a reasonable cost. Thegross heat of combustion of one cubic meter of natural gas is around 39 MJ and thetypical caloric value is roughly 1,000 Btu per cubic foot, depending on gascomposition.
Liquefied natural gas exists at -161�C (-258�F). Impurities and heavy hydro-carbons from the gaseous fossil fuel are removed before the cooling process. Thedensity of liquefied natural gas is in the range 410–500 kg/m3. The volume of the liquidis approximately 1/600 of the gaseous volume at atmospheric conditions.
Table 2.5 Typical heatingvalues of various fuel oils
Type Unit Btu
No. 1 Oil Gallon 137400No. 2 Oil Gallon 139600No. 3 Oil Gallon 141800No. 4 Oil Gallon 145100No. 5 Oil Gallon 148800No. 6 Oil Gallon 152400
ETB [15] with permission
2.3 Non Renewable Energy Sources 35
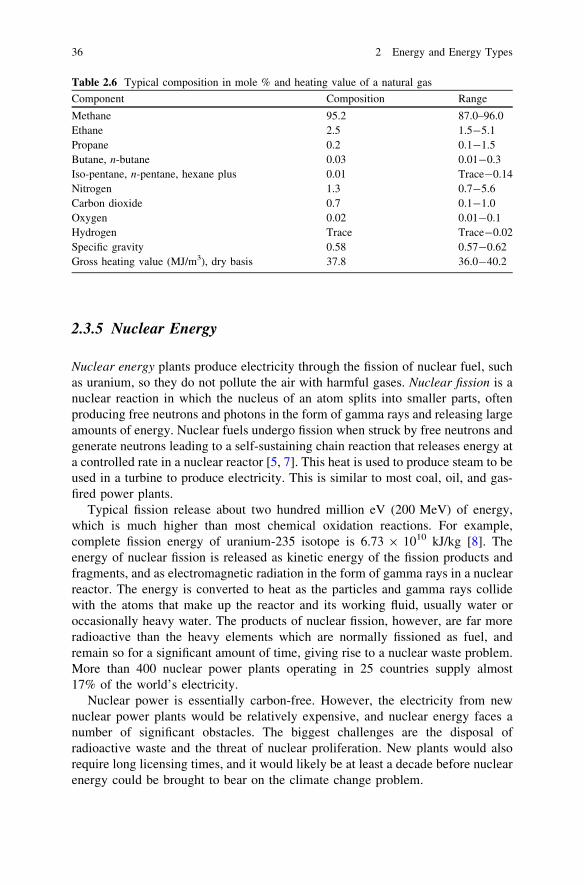
2.3.5 Nuclear Energy
Nuclear energy plants produce electricity through the fission of nuclear fuel, suchas uranium, so they do not pollute the air with harmful gases. Nuclear fission is anuclear reaction in which the nucleus of an atom splits into smaller parts, oftenproducing free neutrons and photons in the form of gamma rays and releasing largeamounts of energy. Nuclear fuels undergo fission when struck by free neutrons andgenerate neutrons leading to a self-sustaining chain reaction that releases energy ata controlled rate in a nuclear reactor [5, 7]. This heat is used to produce steam to beused in a turbine to produce electricity. This is similar to most coal, oil, and gas-fired power plants.
Typical fission release about two hundred million eV (200 MeV) of energy,which is much higher than most chemical oxidation reactions. For example,complete fission energy of uranium-235 isotope is 6.73 9 1010 kJ/kg [8]. Theenergy of nuclear fission is released as kinetic energy of the fission products andfragments, and as electromagnetic radiation in the form of gamma rays in a nuclearreactor. The energy is converted to heat as the particles and gamma rays collidewith the atoms that make up the reactor and its working fluid, usually water oroccasionally heavy water. The products of nuclear fission, however, are far moreradioactive than the heavy elements which are normally fissioned as fuel, andremain so for a significant amount of time, giving rise to a nuclear waste problem.More than 400 nuclear power plants operating in 25 countries supply almost17% of the world’s electricity.
Nuclear power is essentially carbon-free. However, the electricity from newnuclear power plants would be relatively expensive, and nuclear energy faces anumber of significant obstacles. The biggest challenges are the disposal ofradioactive waste and the threat of nuclear proliferation. New plants would alsorequire long licensing times, and it would likely be at least a decade before nuclearenergy could be brought to bear on the climate change problem.
Table 2.6 Typical composition in mole % and heating value of a natural gas
Component Composition Range
Methane 95.2 87.0–96.0Ethane 2.5 1.5-5.1Propane 0.2 0.1-1.5Butane, n-butane 0.03 0.01-0.3Iso-pentane, n-pentane, hexane plus 0.01 Trace-0.14Nitrogen 1.3 0.7-5.6Carbon dioxide 0.7 0.1-1.0Oxygen 0.02 0.01-0.1Hydrogen Trace Trace-0.02Specific gravity 0.58 0.57-0.62Gross heating value (MJ/m3), dry basis 37.8 36.0-40.2
36 2 Energy and Energy Types
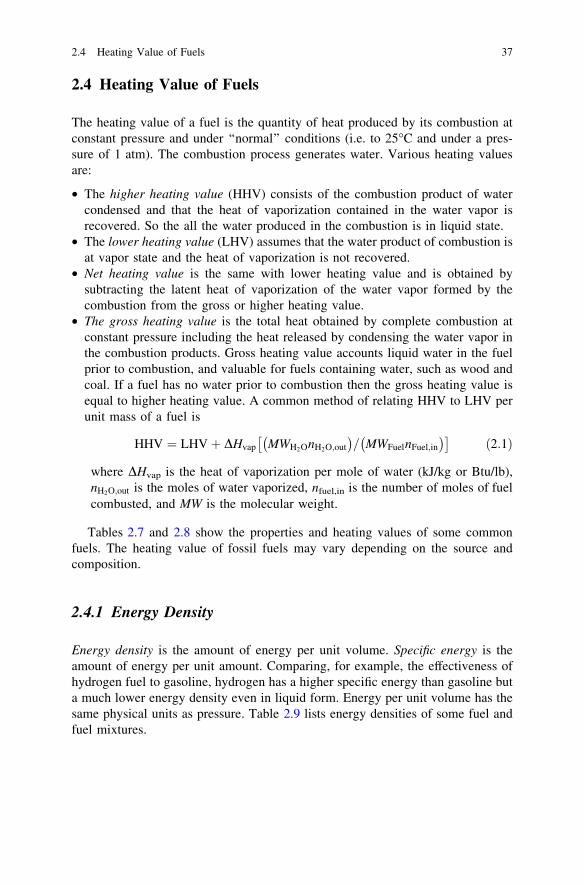
2.4 Heating Value of Fuels
The heating value of a fuel is the quantity of heat produced by its combustion atconstant pressure and under ‘‘normal’’ conditions (i.e. to 25�C and under a pres-sure of 1 atm). The combustion process generates water. Various heating valuesare:
• The higher heating value (HHV) consists of the combustion product of watercondensed and that the heat of vaporization contained in the water vapor isrecovered. So the all the water produced in the combustion is in liquid state.
• The lower heating value (LHV) assumes that the water product of combustion isat vapor state and the heat of vaporization is not recovered.
• Net heating value is the same with lower heating value and is obtained bysubtracting the latent heat of vaporization of the water vapor formed by thecombustion from the gross or higher heating value.
• The gross heating value is the total heat obtained by complete combustion atconstant pressure including the heat released by condensing the water vapor inthe combustion products. Gross heating value accounts liquid water in the fuelprior to combustion, and valuable for fuels containing water, such as wood andcoal. If a fuel has no water prior to combustion then the gross heating value isequal to higher heating value. A common method of relating HHV to LHV perunit mass of a fuel is
HHV ¼ LHVþ DHvap MWH2OnH2O;out
� �= MWFuelnFuel;in
� �� �ð2:1Þ
where DHvap is the heat of vaporization per mole of water (kJ/kg or Btu/lb),nH2O;out is the moles of water vaporized, nfuel,in is the number of moles of fuelcombusted, and MW is the molecular weight.
Tables 2.7 and 2.8 show the properties and heating values of some commonfuels. The heating value of fossil fuels may vary depending on the source andcomposition.
2.4.1 Energy Density
Energy density is the amount of energy per unit volume. Specific energy is theamount of energy per unit amount. Comparing, for example, the effectiveness ofhydrogen fuel to gasoline, hydrogen has a higher specific energy than gasoline buta much lower energy density even in liquid form. Energy per unit volume has thesame physical units as pressure. Table 2.9 lists energy densities of some fuel andfuel mixtures.
2.4 Heating Value of Fuels 37
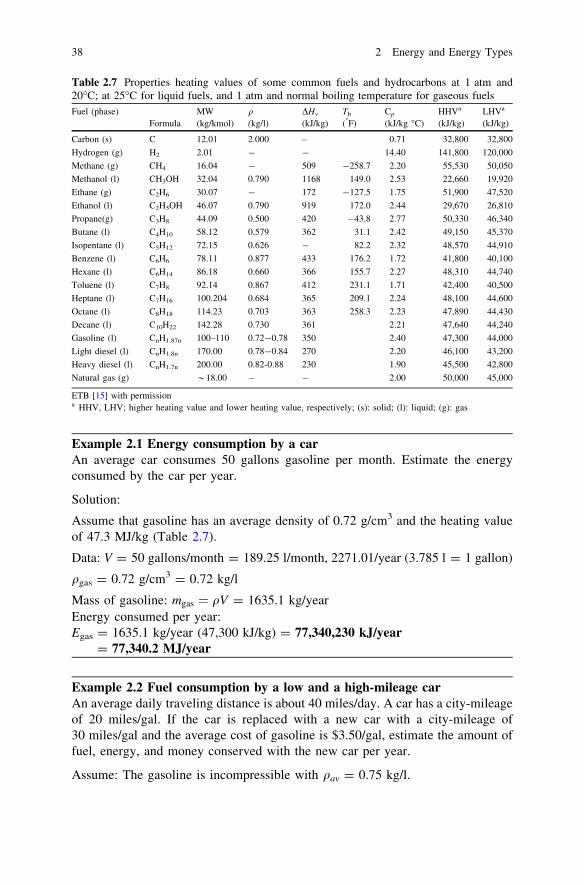
Example 2.1 Energy consumption by a carAn average car consumes 50 gallons gasoline per month. Estimate the energyconsumed by the car per year.
Solution:
Assume that gasoline has an average density of 0.72 g/cm3 and the heating valueof 47.3 MJ/kg (Table 2.7).
Data: V = 50 gallons/month = 189.25 l/month, 2271.01/year (3.785 l = 1 gallon)
qgas = 0.72 g/cm3 = 0.72 kg/l
Mass of gasoline: mgas ¼ qV = 1635.1 kg/yearEnergy consumed per year:Egas = 1635.1 kg/year (47,300 kJ/kg) = 77,340,230 kJ/year
= 77,340.2 MJ/year
Example 2.2 Fuel consumption by a low and a high-mileage carAn average daily traveling distance is about 40 miles/day. A car has a city-mileageof 20 miles/gal. If the car is replaced with a new car with a city-mileage of30 miles/gal and the average cost of gasoline is $3.50/gal, estimate the amount offuel, energy, and money conserved with the new car per year.
Assume: The gasoline is incompressible with qav = 0.75 kg/l.
Table 2.7 Properties heating values of some common fuels and hydrocarbons at 1 atm and20�C; at 25�C for liquid fuels, and 1 atm and normal boiling temperature for gaseous fuelsFuel (phase)
FormulaMW(kg/kmol)
q(kg/l)
DHv
(kJ/kg)Tb
(�F)Cp
(kJ/kg �C)HHVa
(kJ/kg)LHVa
(kJ/kg)
Carbon (s) C 12.01 2.000 – 0.71 32,800 32,800
Hydrogen (g) H2 2.01 - - 14.40 141,800 120,000
Methane (g) CH4 16.04 - 509 -258.7 2.20 55,530 50,050
Methanol (l) CH3OH 32.04 0.790 1168 149.0 2.53 22,660 19,920
Ethane (g) C2H6 30.07 - 172 -127.5 1.75 51,900 47,520
Ethanol (l) C2H5OH 46.07 0.790 919 172.0 2.44 29,670 26,810
Propane(g) C3H8 44.09 0.500 420 -43.8 2.77 50,330 46,340
Butane (l) C4H10 58.12 0.579 362 31.1 2.42 49,150 45,370
Isopentane (l) C5H12 72.15 0.626 - 82.2 2.32 48,570 44,910
Benzene (l) C6H6 78.11 0.877 433 176.2 1.72 41,800 40,100
Hexane (l) C6H14 86.18 0.660 366 155.7 2.27 48,310 44,740
Toluene (l) C7H8 92.14 0.867 412 231.1 1.71 42,400 40,500
Heptane (l) C7H16 100.204 0.684 365 209.1 2.24 48,100 44,600
Octane (l) C8H18 114.23 0.703 363 258.3 2.23 47,890 44,430
Decane (l) C10H22 142.28 0.730 361 2.21 47,640 44,240
Gasoline (l) CnH1.87n 100–110 0.72-0.78 350 2.40 47,300 44,000
Light diesel (l) CnH1.8n 170.00 0.78-0.84 270 2.20 46,100 43,200
Heavy diesel (l) CnH1.7n 200.00 0.82-0.88 230 1.90 45,500 42,800
Natural gas (g) *18.00 - - 2.00 50,000 45,000
ETB [15] with permissiona HHV, LHV; higher heating value and lower heating value, respectively; (s): solid; (l): liquid; (g): gas
38 2 Energy and Energy Types

Table 2.8 Higher heating values (gross calorific value) of some common fuels
Fuel Higher heating value
kJ/kg Btu/lb
Anthracite 32,500-34,000 14,000-14,500Bituminous coal 17,000-23,250 7,300-10,000Butane 49,510 20,900Charcoal 29,600 12,800Coal(anthracite) 30,200 13,000Coal(bituminous) 27,900 12,000Coke 28,000-31,000 12,000-13,500Diesel 44,800 19,300Ether 43,000Gasoline 47,300 20,400Glycerin 19,000Hydrogen 141,790 61,000Lignite 16,300 7,000Methane 55,530Oils, vegetable 39,000-48,000Peat 13,800-20,500 5,500-8,800Petroleum 43,000Propane 50,350Semi anthracite 26,700-32,500 11,500-14,000Wood (dry) 14,400-17,400 6,200-7,500
kJ/m3 Btu/ft3
Acetylene 56,000Butane C4H10 133,000 3200Hydrogen 13,000Natural gas 43,000 950-1,150Methane CH4 39,820Propane C3H8 101,000 2550Butane C4H10 3200
kJ/l Btu/gal
Gasoline 32,000 115,000Heavy fuel oil #6 42,600 153,000Kerosene 37,600 135,000Diesel 36,300 130,500Biodiesel 33,500 120,000Butane C4H10 36,200 130,000Methanol 15,900 57,000Ethanol 21,100 76,000
Gaur and Reed [18]; ETB [15] with permission1 kJ/kg = 1 J/g = 0.43 Btu/lbm = 0.239 kcal/kg1 Btu/lbm = 2.326 kJ/kg = 0.55 kcal/kg1 kcal/kg = 4.187 kJ/kg = 1.8 Btu/lbm
2.4 Heating Value of Fuels 39
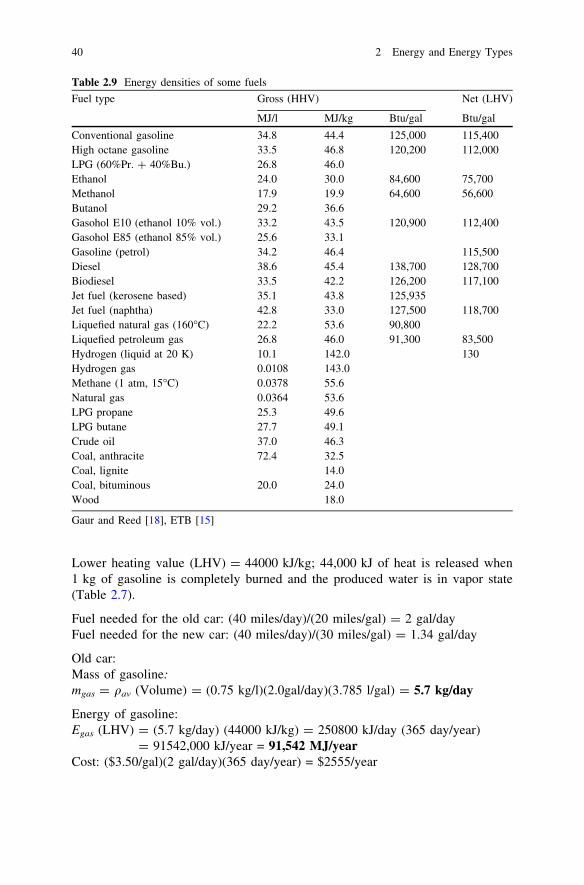
Lower heating value (LHV) = 44000 kJ/kg; 44,000 kJ of heat is released when1 kg of gasoline is completely burned and the produced water is in vapor state(Table 2.7).
Fuel needed for the old car: (40 miles/day)/(20 miles/gal) = 2 gal/dayFuel needed for the new car: (40 miles/day)/(30 miles/gal) = 1.34 gal/day
Old car:Mass of gasoline:mgas = qav (Volume) = (0.75 kg/l)(2.0gal/day)(3.785 l/gal) = 5.7 kg/day
Energy of gasoline:Egas (LHV) = (5.7 kg/day) (44000 kJ/kg) = 250800 kJ/day (365 day/year)
= 91542,000 kJ/year = 91,542 MJ/yearCost: ($3.50/gal)(2 gal/day)(365 day/year) = $2555/year
Table 2.9 Energy densities of some fuels
Fuel type Gross (HHV) Net (LHV)
MJ/l MJ/kg Btu/gal Btu/gal
Conventional gasoline 34.8 44.4 125,000 115,400High octane gasoline 33.5 46.8 120,200 112,000LPG (60%Pr. ? 40%Bu.) 26.8 46.0Ethanol 24.0 30.0 84,600 75,700Methanol 17.9 19.9 64,600 56,600Butanol 29.2 36.6Gasohol E10 (ethanol 10% vol.) 33.2 43.5 120,900 112,400Gasohol E85 (ethanol 85% vol.) 25.6 33.1Gasoline (petrol) 34.2 46.4 115,500Diesel 38.6 45.4 138,700 128,700Biodiesel 33.5 42.2 126,200 117,100Jet fuel (kerosene based) 35.1 43.8 125,935Jet fuel (naphtha) 42.8 33.0 127,500 118,700Liquefied natural gas (160�C) 22.2 53.6 90,800Liquefied petroleum gas 26.8 46.0 91,300 83,500Hydrogen (liquid at 20 K) 10.1 142.0 130Hydrogen gas 0.0108 143.0Methane (1 atm, 15�C) 0.0378 55.6Natural gas 0.0364 53.6LPG propane 25.3 49.6LPG butane 27.7 49.1Crude oil 37.0 46.3Coal, anthracite 72.4 32.5Coal, lignite 14.0Coal, bituminous 20.0 24.0Wood 18.0
Gaur and Reed [18], ETB [15]
40 2 Energy and Energy Types

New car:Mass of gasoline:mgas = qav (Volume) = (0.75 kg/l)(1.34gal/day)(3.785 l/gal) = 3.8 kg/dayEnergy of gasoline:Egas (LHV) = (3.8 kg/day) (44000 kJ/kg) = 167,200 kJ/day (365 day/year)
= 61,028,000 kJ/year = 61,028 MJ/yearCost: ($3.50/gal)(1.34 gal/day)(365 day/year) = $1712/year
The new car reduces the fuel consumption by around 33%, which is significiant.
Example 2.3 Daily consumption of natural gas by a cityThe new car reduces the fuel consumption by around 33%, which is significant.A city consumes natural gas at a rate of 500 9 106 ft3/day. The volumetric flow isat standard conditions of 60�F and 1 atm = 14.7 psia. If the natural gas is costing$6/GJ of higher heating value what is the daily cost of the gas for the city.
Solution:Q = 500 9 106 ft3/day at 60�F and 1 atm = 14.7 psia.
The higher heating value is the heat of combustion of the natural gas when thewater product is at liquid state. From Table 2.7, the value of HHV is:1,030 Btu/ft3 (Table 2.8)
Heating value: 1030 Btu/ft3 (500 9 106 ft3/day) = 515.0 9 109 Btu/day(515.0 9109 Btu/day) (1055 J/Btu) = 543,325 GJ/day
Daily cost: (543,325 GJ/day) ($6/GJ) = $32.6 3 105/day
Example 2.4 Energy consumed by a carAn average car consumes about 2 gallons (US gallon = 3.785 l) a day, and thecapacity of the fule tank is about 15 gallon. Therefore, a car needs to be refueledonce every week. The density of gasoline ranges from 0.72 to 0.78 kg/l(Table 2.7). The lower heating value of gasoline is about 44,000 kJ/kg. Assumethat the average density of gasoline is 0.75 kg/l. If the car was able to use 0.2 kg ofnuclear fuel of uranium-235, estimate the time in years for refueling.
Solution:Assume: The gasoline is incompressible with qav = 0.75 kg/l.Lower heating value (LHV) = 44,000 kJ/kg; 44,000 kJ of heat is released when1 kg of gasoline is completely burned and the produced water is in vapor state.
Complete fission energy of U-235 = 6.73 9 1010 kJ/kgMass of gasoline per day:mgas = qav V = (0.75 kg/l)(2gal/day)(3.785 l/gal) = 5.67 kg/day
Energy of gasoline per day :Egas = mgas (LHV) = (5.67 kg/day)(44,000 kJ/kg) = 249,480 kJ/day
2.4 Heating Value of Fuels 41

Energy released by the complete fission of 0.2 kg U-235:EU-235 = (6.73 1010 kJ/kg)(0.2 kg) = 1.346 1010 kJ
Time for refueling: (1.346 1010 kJ)/(249,480 kJ/day) = 53952 days = 148 yearsTherefore, the car will not need refueling for about 148 years.
2.5 Renewable Energy Resources
Renewable energy comes from natural resources and are naturally replenished.Major renewable energy sources are:
• Hydroelectric• Solar energy• Biomass• Wind• Geothermal heat• Ocean
In its various forms, renewable energy comes directly from the sun, or from heatgenerated deep within the earth. In 2008, about 19% of global final energy con-sumption came from renewables, with 13% coming from traditional biomass,which is mainly used for heating, and 3.2% from hydroelectricity. Other renew-ables, such as small hydro, biomass, wind, solar, geothermal, and biofuels con-tributed around 2.7% and are growing rapidly. The share of renewables inelectricity generation is around 18%, with 15% of global electricity coming fromhydroelectricity and 3% from new renewables. Climate change concerns, high oilprices, and government support are leading to increase in renewable energy usageand commercialization [14]. Consequently, between 2004 and 2009, worldwiderenewable energy capacity grew at rates of 10–60% annually creating businessesand employment. Renewable energy replaces conventional fuels in four distinctareas: power generation, hot water/space heating, transport fuels, and rural (off-grid) energy services [6, 7]:
• Renewable power generation provides 18% of total electricity generationworldwide. Renewable power generators are spread across many countries, andwind power alone already provides a significant share of electricity in some areas.
• Solar hot water contributes a portion of the water heating needs of over70 million households in many countries.
• Renewable biofuels have contributed to a decline in oil consumption in Brazil,the United States and many other countries. The 93 billion liters of biofuelsproduced worldwide in 2009 displaced the equivalent of an estimated 68 billionliters of gasoline, equal to about 5% of world gasoline production.
New and emerging renewable energy technologies are still under development andinclude cellulosic ethanol, hot-dry-rock geothermal power, and ocean energy.Renewable energy generally gets cheaper in the long term, while fossil fuels
42 2 Energy and Energy Types

generally get more expensive. Fossil fuel technologies are more mature, whilerenewable energy technologies are being rapidly improved to increase the efficiencyof renewable energy and reduce its cost. In rural and remote areas, transmission anddistribution of energy generated from fossil fuels can be difficult and expensive;therefore producing renewable energy locally can offer a viable alternative.
The International Renewable Energy Agency (IRENA) promotes the adoptionof renewable energy worldwide. As of March 2010, IRENA has 143 memberstates. Renewable energy policy targets exist in some 73 countries around theworld, and public policies to promote renewable energy use have become morecommon in recent years. Mandates for blending biofuels into vehicle fuels havebeen enacted in 17 countries. The shift from food crop feedstock to waste residuesand native grasses offers significant opportunities for farmers and investors [30].
2.5.1 Hydroenergy
Hydroenergy is derived from the force or energy of moving water. Most hydro-electric energy comes from the potential energy of dammed water driving a waterturbine and generator. The power extracted from the water depends on the volumeand on the difference in height between the source and the water’s outflow. Thisheight difference is called the head. The amount of potential energy in water isproportional to the head. To deliver water to a turbine while maintaining pressurearising from the head, a large pipe called a penstock may be used. In 1878, theworld’s first house to be powered with hydroelectricity was in Northumberland,England. The old Schoelkopf Power Station near Niagara Falls in the US began toproduce electricity in 1881.
One of the major advantages of hydroelectricity is the elimination of fuel.Because there is no fuel combustion, there is little air pollution in comparison withfossil fuel plants and limited thermal pollution compared with nuclear plants.Hydroelectric plants also tend to have longer economic lives than fuel-fired powergeneration, with some plants now in service which were built 50–100 years ago.Operating labor cost is also usually low, as plants are automated and need fewpersonnel on site during normal operation. The sale of electricity from the stationmay cover the construction costs after 5–8 years of full operation.
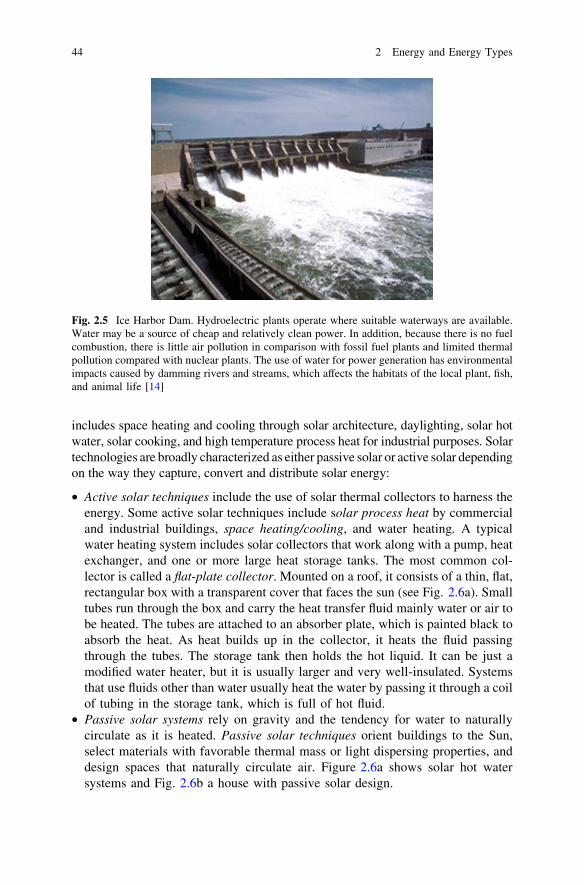
Hydroelectric usually refers to large-scale hydroelectric dams. Micro hydrosystems typically produce up to 100 kW of power. Hydro systems without damderive kinetic energy from rivers and oceans. Ocean energy includes marinecurrent power, ocean thermal energy conversion, and tidal power. Figure 2.5shows the Ice Harbor dam in the US.
2.5.2 Solar Energy
Solar energy is derived from the sun through the form of solar radiation. Solar poweredelectrical generation relies on photovoltaics and heat engines. Other solar applications
2.5 Renewable Energy Resources 43
includes space heating and cooling through solar architecture, daylighting, solar hotwater, solar cooking, and high temperature process heat for industrial purposes. Solartechnologies are broadly characterized as either passive solar or active solar dependingon the way they capture, convert and distribute solar energy:
• Active solar techniques include the use of solar thermal collectors to harness theenergy. Some active solar techniques include solar process heat by commercialand industrial buildings, space heating/cooling, and water heating. A typicalwater heating system includes solar collectors that work along with a pump, heatexchanger, and one or more large heat storage tanks. The most common col-lector is called a flat-plate collector. Mounted on a roof, it consists of a thin, flat,rectangular box with a transparent cover that faces the sun (see Fig. 2.6a). Smalltubes run through the box and carry the heat transfer fluid mainly water or air tobe heated. The tubes are attached to an absorber plate, which is painted black toabsorb the heat. As heat builds up in the collector, it heats the fluid passingthrough the tubes. The storage tank then holds the hot liquid. It can be just amodified water heater, but it is usually larger and very well-insulated. Systemsthat use fluids other than water usually heat the water by passing it through a coilof tubing in the storage tank, which is full of hot fluid.
• Passive solar systems rely on gravity and the tendency for water to naturallycirculate as it is heated. Passive solar techniques orient buildings to the Sun,select materials with favorable thermal mass or light dispersing properties, anddesign spaces that naturally circulate air. Figure 2.6a shows solar hot watersystems and Fig. 2.6b a house with passive solar design.
Fig. 2.5 Ice Harbor Dam. Hydroelectric plants operate where suitable waterways are available.Water may be a source of cheap and relatively clean power. In addition, because there is no fuelcombustion, there is little air pollution in comparison with fossil fuel plants and limited thermalpollution compared with nuclear plants. The use of water for power generation has environmentalimpacts caused by damming rivers and streams, which affects the habitats of the local plant, fish,and animal life [14]
44 2 Energy and Energy Types

2.5.2.1 Nonresidential Solar Collectors
The two main types of solar collectors used for nonresidential buildings are anevacuated-tube collector and a linear concentrator. They can operate at hightemperatures with high efficiency. An evacuated-tube collector is a set of manydouble-walled, glass tubes and reflectors to heat the fluid inside the tubes.A vacuum between the two walls insulates the inner tube, retaining the heat. Linearconcentrators use long, rectangular, U-shaped mirrors tilted to focus sunlight ontubes that run along the length of the mirrors. The concentrated sunlight heats thefluid within the tubes. Solar absorption systems use thermal energy to evaporate arefrigerant fluid to cool the air. In contrast, solar desiccant systems use thermalenergy to regenerate desiccants that dry the air, thereby cooling the air [4, 14].
2.5.2.2 Solar Electric Generating Systems
Solar electric generating system use parabolic trough collectors to collect the sun’senergy to generate steam to drive a conventional steam turbine [4]. The parabolicmirrors automatically track the sun throughout the day. The sun light is directed tocentral tube carrying synthetic oil, which heats around 400�C. The heat is used toconvert water to steam to drive a steam turbine and produce electricity. The largestsolar thermal power station is in the Mojave Desert in the US with a power outputof 354 MW (see Fig. 2.7).
2.5.2.3 Photovoltaic
Solar photovoltaic (PV) convert light into electricity using semiconductor mate-rials. Photovoltaic cell is a solar cell, which is a solid state electrical device thatconverts the energy of light directly into electricity. Assemblies of cells are known
Fig. 2.6 a For solar hot water systems, flat-plate solar collectors are typically installed facingsouth on a rooftop; b the Zion National Park Visitor Center incorporates passive solar designfeatures, including clerestory windows for daylighting and Trombe walls that absorb heat duringthe day and give off heat at night [32]
2.5 Renewable Energy Resources 45

as solar modules or solar panels. Solar modules are typically deployed as an arrayof individual modules on rooftops, building facades, or in large-scale ground-based arrays (see Fig. 2.8). A module consists of many jointly connected solarcells. Most crystalline modules usually consist of 60–72 cells. Photovoltaic celland modules use various semiconductors; they have three types (1) crystallinesilicon, (2) thin-film, and (3) concentrator. Photovoltaic systems produce direct
Fig. 2.7 a The 150-MW Kramer Junction plants shown here are part of a 354 MW series ofSEGS (solar electric generating system) facilities, each using parabolic trough collectors tocollect the sun’s energy to generate steam to drive a conventional steam turbine. The plants havebeen operating in the California Mojave Desert for two decades [32]; b parabolic trough solarcollectors at the recently dedicated 1-MW Saguaro power plant outside Tucson concentratesunlight onto a receiver tube located along the trough’s focal line. The solar energy heats theworking fluid in the receiver tube, which vaporizes a secondary fluid to power a turbine. A next-generation version of this collector is being installed at a new 64-MW plant in Nevada [25]
Fig. 2.8 a Photovoltaic systems are typically sited on roofs and may be connected to theelectrical grid. Photovoltaic modules can compete against the retail price of electricity, offsettingthe technology’s high cost; b rooftop photovoltaic module (Oberlin College’s Adam JosephLewis Center for Environmental Studies features a south-facing curved roof covered inWilliamson) [25]
46 2 Energy and Energy Types
current, which must be converted to alternating current via an inverter if the outputfrom the system is to be used in the grid. Annual production of photovoltaicmodules in 2005 was about 150 MW in the US and about 1.7 gigawatts (GW)worldwide [11].
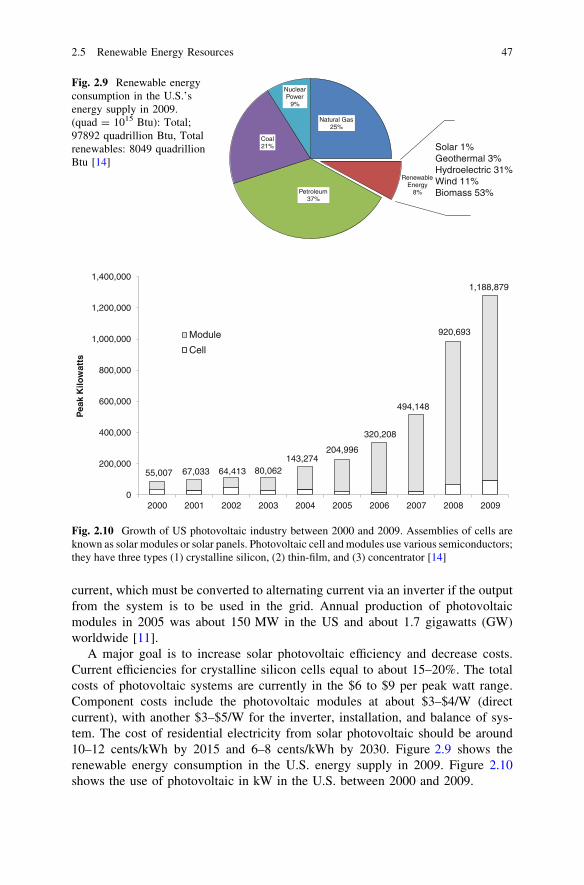
A major goal is to increase solar photovoltaic efficiency and decrease costs.Current efficiencies for crystalline silicon cells equal to about 15–20%. The totalcosts of photovoltaic systems are currently in the $6 to $9 per peak watt range.Component costs include the photovoltaic modules at about $3–$4/W (directcurrent), with another $3–$5/W for the inverter, installation, and balance of sys-tem. The cost of residential electricity from solar photovoltaic should be around10–12 cents/kWh by 2015 and 6–8 cents/kWh by 2030. Figure 2.9 shows therenewable energy consumption in the U.S. energy supply in 2009. Figure 2.10shows the use of photovoltaic in kW in the U.S. between 2000 and 2009.
Natural Gas25%
Renewable Energy
8%Petroleum37%
Coal21%
Nuclear Power
9%
Solar 1%Geothermal 3%Hydroelectric 31%Wind 11%Biomass 53%
Fig. 2.9 Renewable energyconsumption in the U.S.’senergy supply in 2009.(quad = 1015 Btu): Total;97892 quadrillion Btu, Totalrenewables: 8049 quadrillionBtu [14]
55,007 67,033 64,413 80,062143,274
204,996
320,208
494,148
920,693
1,188,879
0
200,000
400,000
600,000
800,000
1,000,000
1,200,000
1,400,000
2000 2001 2002 2003 2004 2005 2006 2007 2008 2009
Pea
k K
ilow
atts
Module
Cell
Fig. 2.10 Growth of US photovoltaic industry between 2000 and 2009. Assemblies of cells areknown as solar modules or solar panels. Photovoltaic cell and modules use various semiconductors;they have three types (1) crystalline silicon, (2) thin-film, and (3) concentrator [14]
2.5 Renewable Energy Resources 47

2.5.3 Biomass and Bioenergy
Biomass is organic material made from plants including microorganisms andanimals. Plants absorb the sun’s energy in photosynthesis and store the energy asbiomass (see Fig. 2.11). Therefore, biomass is a renewable energy source based onthe carbon cycle. Some examples of biomass fuels include wood, crops, and algae.When burned, the chemical energy in biomass is released as heat. Biomass can beconverted to other biofuels, such as ethanol and biodiesel. Biomass grown forbiofuel includes corn, soybeans, willow switch grass, rapeseed, sugar beet, palmoil, and sorghum [30]. Cellulosic biomass, such as corn stover, straw, timber, ricehusks can also be used for biofuel production (see Fig. 2.11). Anaerobic digestionof biomass produces biogas, while gasification produces syngas, which is themixture of hydrogen and carbon dioxide to be converted to liquid fuels. Cellulosicethanol can also be created by a thermo-chemical process, which uses variouscombinations of temperature, pressure, water, oxygen or air, and catalysts toconvert biomass to cellulosic ethanol. Table 2.10 shows lower heating values,moisture, and ash content of some biomass.
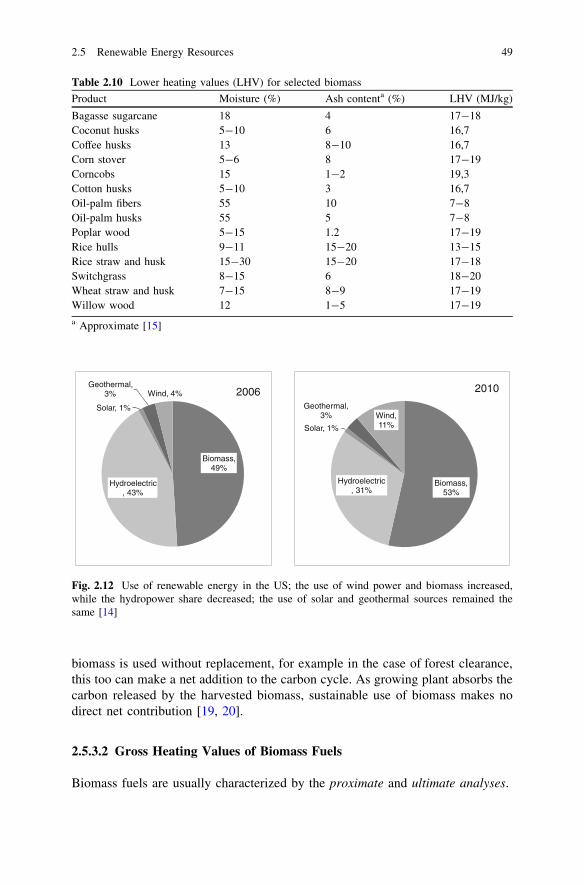
As Fig. 2.12 indicates that between years 2006 and 2010 the use of wind powerand biomass increased, while the hydropower share decreased; the use of solar andgeothermal sources remained the same [14].
2.5.3.1 Carbon Cycle
In the carbon cycle, carbon in various forms is transported between the variouscomponents of the Earth’s biosphere, between the atmosphere, hydrosphere (seasand oceans), lithosphere (rocks, soils and mineral deposits, including fossil fuels)and biological material including plants and animals. Carbon cycle maintains astate of dynamic equilibrium. Other forms, most notably fossil fuels, can poten-tially store carbon indefinitely, however if they are burned the carbon is releasedand makes a net addition to the carbon cycle and raising the total free carbon. If
Fig. 2.11 a Photosynthesis; in the photosynthesis plants convert solar energy into chemicalenergy in the form of glucose: Water ? Carbon dioxide ? Sunlight ? Glucose ? Oxygen andH2O ? CO2 ? Sunlight ? C6H12O6 ? 6O2; b biomass growth; c the 21 MW Tracy BiomassPlant uses wood residues discarded from agricultural and industrial operations to provide the SanFrancisco Bay Area with base load capacity [32]
48 2 Energy and Energy Types
biomass is used without replacement, for example in the case of forest clearance,this too can make a net addition to the carbon cycle. As growing plant absorbs thecarbon released by the harvested biomass, sustainable use of biomass makes nodirect net contribution [19, 20].
2.5.3.2 Gross Heating Values of Biomass Fuels
Biomass fuels are usually characterized by the proximate and ultimate analyses.
Table 2.10 Lower heating values (LHV) for selected biomass
Product Moisture (%) Ash contenta (%) LHV (MJ/kg)
Bagasse sugarcane 18 4 17-18Coconut husks 5-10 6 16,7Coffee husks 13 8-10 16,7Corn stover 5-6 8 17-19Corncobs 15 1-2 19,3Cotton husks 5-10 3 16,7Oil-palm fibers 55 10 7-8Oil-palm husks 55 5 7-8Poplar wood 5-15 1.2 17-19Rice hulls 9-11 15-20 13-15Rice straw and husk 15-30 15-20 17-18Switchgrass 8-15 6 18-20Wheat straw and husk 7-15 8-9 17-19Willow wood 12 1-5 17-19a Approximate [15]
Biomass, 49%
Hydroelectric, 43%
Solar, 1%
Geothermal, 3% Wind, 4%
Biomass, 53%
Hydroelectric, 31%
Solar, 1%
Geothermal, 3% Wind,
11%
2006 2010
Fig. 2.12 Use of renewable energy in the US; the use of wind power and biomass increased,while the hydropower share decreased; the use of solar and geothermal sources remained thesame [14]
2.5 Renewable Energy Resources 49
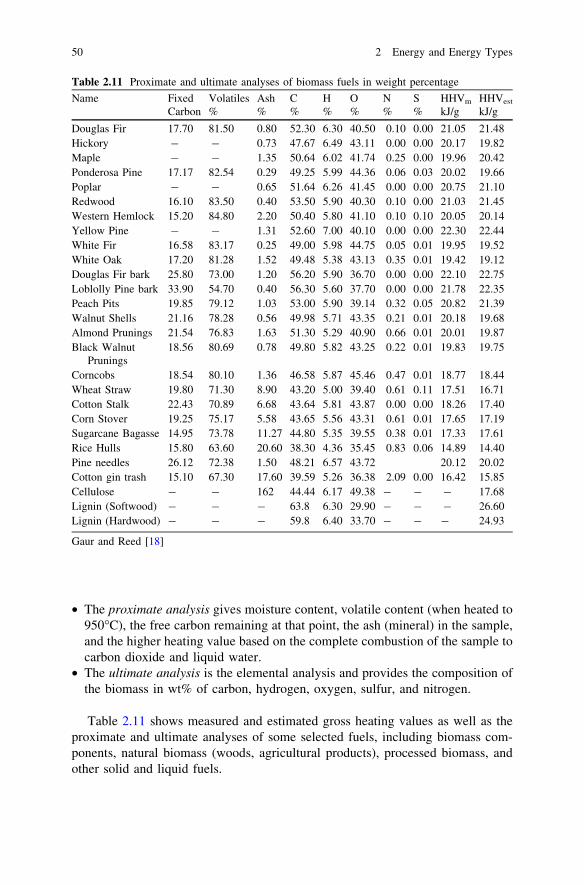
• The proximate analysis gives moisture content, volatile content (when heated to950�C), the free carbon remaining at that point, the ash (mineral) in the sample,and the higher heating value based on the complete combustion of the sample tocarbon dioxide and liquid water.
• The ultimate analysis is the elemental analysis and provides the composition ofthe biomass in wt% of carbon, hydrogen, oxygen, sulfur, and nitrogen.
Table 2.11 shows measured and estimated gross heating values as well as theproximate and ultimate analyses of some selected fuels, including biomass com-ponents, natural biomass (woods, agricultural products), processed biomass, andother solid and liquid fuels.
Table 2.11 Proximate and ultimate analyses of biomass fuels in weight percentage
Name Fixed Volatiles Ash C H O N S HHVm HHVest
Carbon % % % % % % % kJ/g kJ/g
Douglas Fir 17.70 81.50 0.80 52.30 6.30 40.50 0.10 0.00 21.05 21.48Hickory - - 0.73 47.67 6.49 43.11 0.00 0.00 20.17 19.82Maple - - 1.35 50.64 6.02 41.74 0.25 0.00 19.96 20.42Ponderosa Pine 17.17 82.54 0.29 49.25 5.99 44.36 0.06 0.03 20.02 19.66Poplar - - 0.65 51.64 6.26 41.45 0.00 0.00 20.75 21.10Redwood 16.10 83.50 0.40 53.50 5.90 40.30 0.10 0.00 21.03 21.45Western Hemlock 15.20 84.80 2.20 50.40 5.80 41.10 0.10 0.10 20.05 20.14Yellow Pine - - 1.31 52.60 7.00 40.10 0.00 0.00 22.30 22.44White Fir 16.58 83.17 0.25 49.00 5.98 44.75 0.05 0.01 19.95 19.52White Oak 17.20 81.28 1.52 49.48 5.38 43.13 0.35 0.01 19.42 19.12Douglas Fir bark 25.80 73.00 1.20 56.20 5.90 36.70 0.00 0.00 22.10 22.75Loblolly Pine bark 33.90 54.70 0.40 56.30 5.60 37.70 0.00 0.00 21.78 22.35Peach Pits 19.85 79.12 1.03 53.00 5.90 39.14 0.32 0.05 20.82 21.39Walnut Shells 21.16 78.28 0.56 49.98 5.71 43.35 0.21 0.01 20.18 19.68Almond Prunings 21.54 76.83 1.63 51.30 5.29 40.90 0.66 0.01 20.01 19.87Black Walnut
Prunings18.56 80.69 0.78 49.80 5.82 43.25 0.22 0.01 19.83 19.75
Corncobs 18.54 80.10 1.36 46.58 5.87 45.46 0.47 0.01 18.77 18.44Wheat Straw 19.80 71.30 8.90 43.20 5.00 39.40 0.61 0.11 17.51 16.71Cotton Stalk 22.43 70.89 6.68 43.64 5.81 43.87 0.00 0.00 18.26 17.40Corn Stover 19.25 75.17 5.58 43.65 5.56 43.31 0.61 0.01 17.65 17.19Sugarcane Bagasse 14.95 73.78 11.27 44.80 5.35 39.55 0.38 0.01 17.33 17.61Rice Hulls 15.80 63.60 20.60 38.30 4.36 35.45 0.83 0.06 14.89 14.40Pine needles 26.12 72.38 1.50 48.21 6.57 43.72 20.12 20.02Cotton gin trash 15.10 67.30 17.60 39.59 5.26 36.38 2.09 0.00 16.42 15.85Cellulose - - 162 44.44 6.17 49.38 - - - 17.68Lignin (Softwood) - - - 63.8 6.30 29.90 - - - 26.60Lignin (Hardwood) - - - 59.8 6.40 33.70 - - - 24.93
Gaur and Reed [18]
50 2 Energy and Energy Types
A relationship between the high heating value, HHV and the elemental com-position is given by
HHV in kJ=gð Þ ¼ 0:3491Cþ 1:1783H� 0:1034O� 0:0211Aþ 0:1005S
� 0:0151 N ð2:2Þ
where C is the weight fraction of carbon, H of hydrogen, O of oxygen, A of ash, Sof sulfur, and N of nitrogen appearing in the ultimate analysis. This equationrepresents the experimental data with an average error of 1.45% and can be used inestimating heat values and modeling of biomass processes [18].
Based on chemical functional groups of the fuels, the heating values may vary.When the oxygen percentage is higher in a fuel, the percentages of carbon andhydrogen available for combustion are reduced. This leads to the lower heatingvalues. By using the values of fixed carbon (FC, wt%), the higher heating value ofthe biomass samples can be estimated by
HHV MJ=kgð Þ ¼ 0:196 FCð Þ þ 14:119 ð2:3Þ
The heating values calculated from Eq. (2.3) shows a mean difference of 2.2%between estimated and measured values [10]. Another correlation between theHHV and dry ash content from proximate analysis of biomass (in weight percent)is expressed by
HHV MJ=kgð Þ ¼ 19:914� 0:2324Ash ð2:4Þ
Based on the composition of main elements (in wt%) C, H, and O, the heatingvalue is estimated by
HHV MJ=kgð Þ ¼ 0:3137Cþ 0:7009Hþ 0:0318O� 1:3675 ð2:5Þ
with more than 90% predictions in the range of ±5% error [34].
Example 2.5 Gross heating value estimationsUsing data in Table 2.11, estimate the gross heating values in kJ/kg for the bio-mass redwood from: (a) ultimate analysis, (b) fixed carbon, (c) dry ash content,and (d) carbon (C), hydrogen (H), and oxygen (O) compositions.
Name Fixed Volatiles Ash C H O N S HHVm HHVest
Carbon (%) (%) (%) (%) (%) (%) (%) (kJ/g) (kJ/g)
Redwood 16.10 83.50 0.40 53.50 5.90 40.30 0.10 0.00 21.03 21.45
Solution:(a) From ultimate analysisHHV (in MJ/kg)= 0.3491C ? 1.1783 H - 0.1034 O - 0.0211 A ? 0.1005 S - 0.0151 N
2.5 Renewable Energy Resources 51
HHV (in MJ/kg) = 0.3491(53.50) ? 1.1783 (5.90) - 0.1034 (40.3) - 0.0211(0.0040) ? 0.1005 (0.0) -0.0151 (0.0010) = 21.44 MJ/kg = 21,440 kJ/kg
(b) From fixed carbon percentageHHV (MJ/kg) = 0.196(FC) ? 14.119HHV (MJ/kg) = 0.196(16.10) ? 14.119 = 17.3 MJ/kg = 17,300 kJ/kg
(c) From dry ash contentHHV (MJ/kg) = 19.914 – 0.2324 AshHHV (MJ/kg) = 19.914 – 0.2324 (0.0040) = 19.914 MJ/kg = 19,914 kJ/kg
(d) From the main elements (in wt%) C, H, and OHHV (MJ/kg) = 0.3137 C ? 0.7009 H ? 0.0318 O-1.3675HHV (MJ/kg) = 0.3137 (53.50) ? 0.7009 (5.9) ? 0.0318 (40.3)-1.3675 = 20.83 MJ/kg
= 20,830 kJ/kg
Estimation from Eq. (2.5), used in part (d), is the closest to the measured value of21.03 MJ/kg (21,030 kJ/kg)
2.5.3.3 Bioenergy
Biological fuels produced from photosynthesis can be categorized in three groups:
• Carbohydrates, representing a mixture of mono-di-and poly-saccharides(4 kcal/g or 17 kJ/g).
• Fats, unsaturated and saturated fatty acids (triacylglycerol or triglyceride)(9 kcal/g or 39 kJ/g).
• Proteins, used partly as fuel source (4 kcal/g or 17 kJ/g).
Carbohydrates are straight-chain aldehydes or ketones with many hydroxylgroups that can exist as straight chains or rings. Carbohydrates such as starch arethe most abundant biological molecules, and play numerous roles, such as thestorage and transport of energy, and structural components such as cellulose inplants. Triglycerides and fatty free acids both contain long, linear aliphatichydrocarbon chains, which are partially unsaturated and have a carbon numberrange. The fuel value is equal to the heat of combustion (oxidation) of fuel.Carbohydrates and fats can be completely oxidized while proteins can only bepartially oxidized and hence has lower fuel values [28].
Synthetic biofuels are:
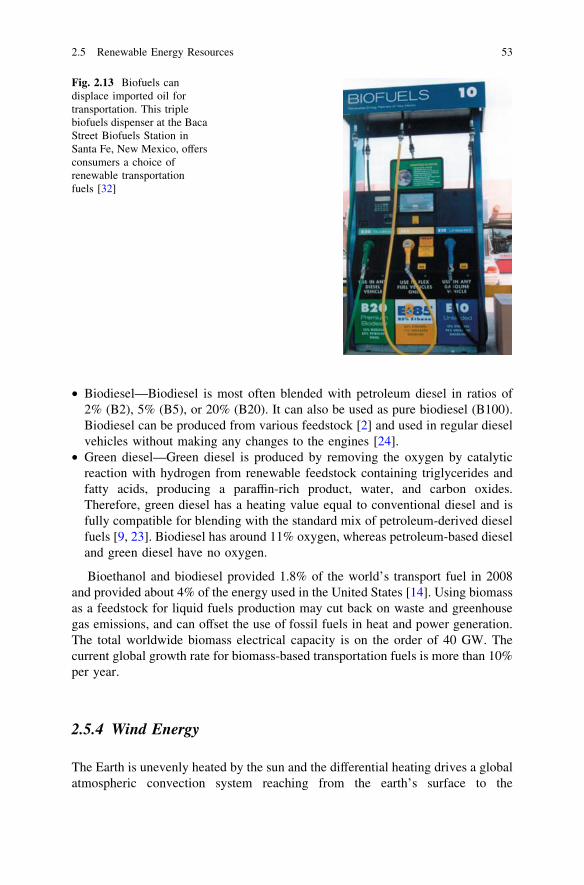
• Bioethanol—In the United States, corn-based ethanol is currently the largestsource of biofuel as a gasoline substitute or additive. The gasoline sold in theUnited States today is mixed with 10% ethanol, a mix known as E10 (or gas-ohol). Only specific types of vehicles named as flexible fuel vehicles can usemixtures with greater than 10% ethanol. E85 is an alternative fuel that containsup to 85% ethanol (see Fig. 2.13; [16]).
52 2 Energy and Energy Types
• Biodiesel—Biodiesel is most often blended with petroleum diesel in ratios of2% (B2), 5% (B5), or 20% (B20). It can also be used as pure biodiesel (B100).Biodiesel can be produced from various feedstock [2] and used in regular dieselvehicles without making any changes to the engines [24].
• Green diesel—Green diesel is produced by removing the oxygen by catalyticreaction with hydrogen from renewable feedstock containing triglycerides andfatty acids, producing a paraffin-rich product, water, and carbon oxides.Therefore, green diesel has a heating value equal to conventional diesel and isfully compatible for blending with the standard mix of petroleum-derived dieselfuels [9, 23]. Biodiesel has around 11% oxygen, whereas petroleum-based dieseland green diesel have no oxygen.
Bioethanol and biodiesel provided 1.8% of the world’s transport fuel in 2008and provided about 4% of the energy used in the United States [14]. Using biomassas a feedstock for liquid fuels production may cut back on waste and greenhousegas emissions, and can offset the use of fossil fuels in heat and power generation.The total worldwide biomass electrical capacity is on the order of 40 GW. Thecurrent global growth rate for biomass-based transportation fuels is more than 10%per year.
2.5.4 Wind Energy
The Earth is unevenly heated by the sun and the differential heating drives a globalatmospheric convection system reaching from the earth’s surface to the
Fig. 2.13 Biofuels candisplace imported oil fortransportation. This triplebiofuels dispenser at the BacaStreet Biofuels Station inSanta Fe, New Mexico, offersconsumers a choice ofrenewable transportationfuels [32]
2.5 Renewable Energy Resources 53
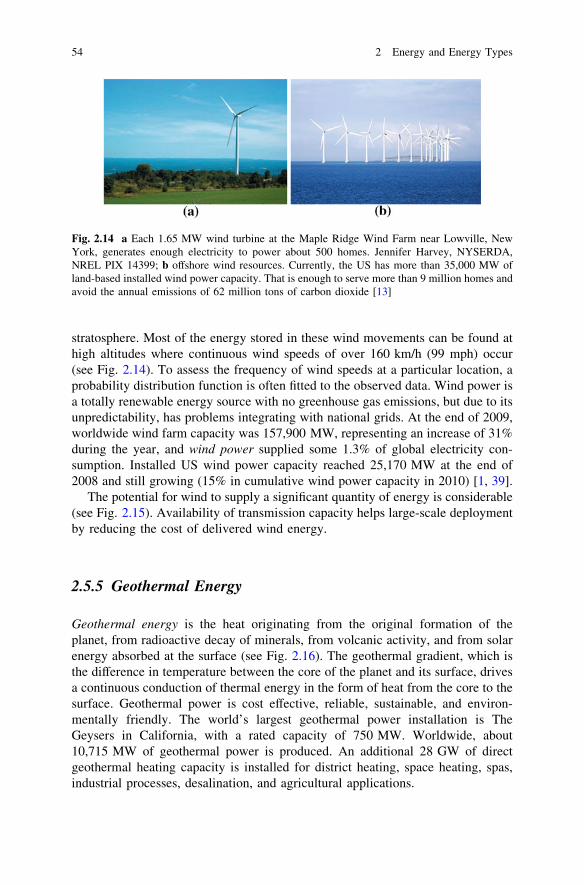
stratosphere. Most of the energy stored in these wind movements can be found athigh altitudes where continuous wind speeds of over 160 km/h (99 mph) occur(see Fig. 2.14). To assess the frequency of wind speeds at a particular location, aprobability distribution function is often fitted to the observed data. Wind power isa totally renewable energy source with no greenhouse gas emissions, but due to itsunpredictability, has problems integrating with national grids. At the end of 2009,worldwide wind farm capacity was 157,900 MW, representing an increase of 31%during the year, and wind power supplied some 1.3% of global electricity con-sumption. Installed US wind power capacity reached 25,170 MW at the end of2008 and still growing (15% in cumulative wind power capacity in 2010) [1, 39].
The potential for wind to supply a significant quantity of energy is considerable(see Fig. 2.15). Availability of transmission capacity helps large-scale deploymentby reducing the cost of delivered wind energy.
2.5.5 Geothermal Energy
Geothermal energy is the heat originating from the original formation of theplanet, from radioactive decay of minerals, from volcanic activity, and from solarenergy absorbed at the surface (see Fig. 2.16). The geothermal gradient, which isthe difference in temperature between the core of the planet and its surface, drivesa continuous conduction of thermal energy in the form of heat from the core to thesurface. Geothermal power is cost effective, reliable, sustainable, and environ-mentally friendly. The world’s largest geothermal power installation is TheGeysers in California, with a rated capacity of 750 MW. Worldwide, about10,715 MW of geothermal power is produced. An additional 28 GW of directgeothermal heating capacity is installed for district heating, space heating, spas,industrial processes, desalination, and agricultural applications.
Fig. 2.14 a Each 1.65 MW wind turbine at the Maple Ridge Wind Farm near Lowville, NewYork, generates enough electricity to power about 500 homes. Jennifer Harvey, NYSERDA,NREL PIX 14399; b offshore wind resources. Currently, the US has more than 35,000 MW ofland-based installed wind power capacity. That is enough to serve more than 9 million homes andavoid the annual emissions of 62 million tons of carbon dioxide [13]
54 2 Energy and Energy Types

Hot water or steam reservoirs deep in the earth are accessed by drilling.Geothermal reservoirs located near the earth’s surface maintain a relatively con-stant temperature of 50�–60�F. The hot water and steam from reservoirs can beused to drive generators and produce electricity. In other applications, the heatproduced from geothermal is used directly in heating buildings and industrialplants. As in the case of biomass electricity, a geothermal plant runs 24 hours perday, 7 days per week and can provide base load power, thus competing againstcoal plants.
2.5.6 Ocean Energy
Systems to harvest electrical power from ocean waves have recently been gainingmomentum as a viable technology. The potential for this technology is consideredpromising. The world’s first commercial tidal power station was installed in 2007
Fig. 2.15 Wind generationversus capacity; growth ofwind power [14]
Fig. 2.16 a The Earth’s heat—called geothermal energy—escapes as steam at a hot springs inNevada; b the Mammoth Lakes power plant is located in a picturesque area of northernCalifornia. Binary-cycle geothermal power plants release no carbon dioxide or water vaporplumes and blend into the environment [32]
2.5 Renewable Energy Resources 55

in the narrows of Strangford Lough in Ireland. Although the generator is powerfulenough to power a thousand homes, the turbine has minimal environmentalimpact, as it is almost entirely submerged, and the rotors pose no danger to wildlifeas they turn quite slowly. Ocean thermal energy conversion uses the temperaturedifference that exists between deep and shallow waters to run a heat engine (seeSect 7.16).
2.5.7 Projection on Renewable Energy Contributions
The pie chart in Fig. 2.17 shows the relative contributions of different renewableenergy technologies. Hybrid renewable energy systems usually consist of two ormore renewable energy sources used together to provide increased system effi-ciency as well as greater balance in energy supply. For example, consider a load of100% power supply and there is no renewable system to fulfill this need, so two ormore renewable energy systems can be combined. For example, 60% from abiomass system, 20% from a wind energy system and the remainder from fuelcells. Thus combining all these renewable energy systems may provide 100% ofthe power and energy requirements for the load, such as a home or business.Another example is the combination of a photovoltaic array coupled with a windturbine. This would create more output from the wind turbine during the winter,whereas during the summer, the solar panels would produce their peak output.
2.6 Hydrogen
Hydrogen is the simplest element. Each atom of hydrogen has only one proton.The sun is basically a giant ball of hydrogen and helium gases. In the sun’s core,hydrogen atoms combine to form helium atoms (called fusion process) and givesoff radiant energy. This radiant energy sustains life on earth as it drives thephotosynthesis in plants and other living systems, and is stored as chemical energyin fossil fuels.
Geothermal, 16%
Biofuels, 11%
Biomass, 14%
PV, 12%
Wind, 35%
CSP, 12%
Fig. 2.17 Pie chart showingfuture projections of relativecontributions of the variousrenewables in 2030 [14]. PVPhotovoltaic; CSPConcentrated solar power
56 2 Energy and Energy Types
Hydrogen does not exist on earth as a gas and is found only in compound formwith other elements, such as water H2O and methane CH4. Hydrogen is producedfrom other resources including natural gas, coal, biomass, and even water. The twomost common production methods are steam reforming and electrolysis in whichthe water is split into oxygen and hydrogen. Steam reforming is currently the leastexpensive and most common method of producing hydrogen. Electrolysis is cur-rently an expensive process. Currently, global hydrogen production is 48% fromnatural gas, 30% from oil, 18% from coal, and 4% from water electrolysis.
Hydrogen has the highest energy content of any common fuel by weight (aboutthree times more than gasoline), but the lowest energy content by volume (seeTable 2.9). Hydrogen transports energy in a useable form from one place toanother. Like electricity, hydrogen is an energy carrier. Hydrogen burns cleanly,producing water H2O. When burned in an engine or; used a fuel cell, it is con-verted to water only. To make hydrogen a renewable fuel it should use renewableenergy, such as wind power or solar power, for production.
There are two primary uses for hydrogen today. About half of hydrogen is usedto produce ammonia (NH3) via the Haber process. Ammonia, in turn, is useddirectly or indirectly as fertilizer. The other half of current hydrogen production isused in hydrocracking process to convert heavy petroleum sources into lighterfractions suitable for use as fuels. Hydrogen fuel cells produce electricity. They arevery efficient, but expensive to build. Small fuel cells can power electric cars,while large fuel cells can provide electricity in remote places with no power lines.
2.7 Electric Energy
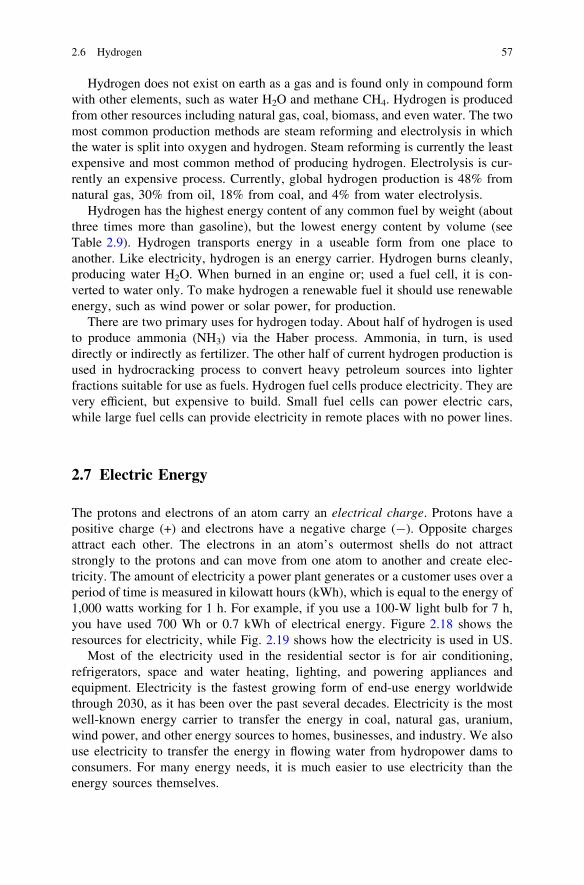
The protons and electrons of an atom carry an electrical charge. Protons have apositive charge (+) and electrons have a negative charge (-). Opposite chargesattract each other. The electrons in an atom’s outermost shells do not attractstrongly to the protons and can move from one atom to another and create elec-tricity. The amount of electricity a power plant generates or a customer uses over aperiod of time is measured in kilowatt hours (kWh), which is equal to the energy of1,000 watts working for 1 h. For example, if you use a 100-W light bulb for 7 h,you have used 700 Wh or 0.7 kWh of electrical energy. Figure 2.18 shows theresources for electricity, while Fig. 2.19 shows how the electricity is used in US.
Most of the electricity used in the residential sector is for air conditioning,refrigerators, space and water heating, lighting, and powering appliances andequipment. Electricity is the fastest growing form of end-use energy worldwidethrough 2030, as it has been over the past several decades. Electricity is the mostwell-known energy carrier to transfer the energy in coal, natural gas, uranium,wind power, and other energy sources to homes, businesses, and industry. We alsouse electricity to transfer the energy in flowing water from hydropower dams toconsumers. For many energy needs, it is much easier to use electricity than theenergy sources themselves.
2.6 Hydrogen 57
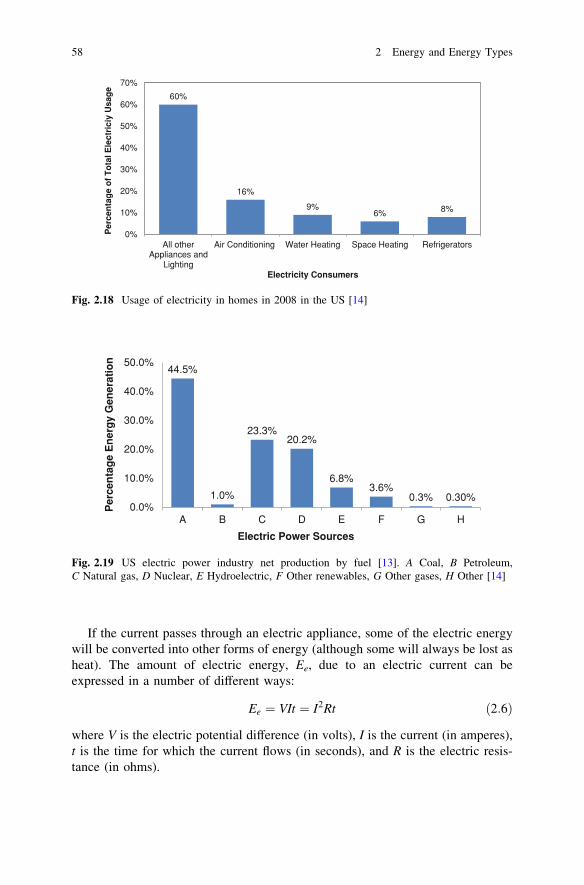
If the current passes through an electric appliance, some of the electric energywill be converted into other forms of energy (although some will always be lost asheat). The amount of electric energy, Ee, due to an electric current can beexpressed in a number of different ways:
Ee ¼ VIt ¼ I2Rt ð2:6Þ
where V is the electric potential difference (in volts), I is the current (in amperes),t is the time for which the current flows (in seconds), and R is the electric resis-tance (in ohms).
60%
16%
9%6% 8%
0%
10%
20%
30%
40%
50%
60%
70%
All otherAppliances and
Lighting
Air Conditioning Water Heating Space Heating Refrigerators
Per
cen
tag
e o
f T
ota
l Ele
ctri
ciy
Usa
ge
Electricity Consumers
Fig. 2.18 Usage of electricity in homes in 2008 in the US [14]
44.5%
1.0%
23.3%20.2%
6.8%3.6%
0.3% 0.30%0.0%
10.0%
20.0%
30.0%
40.0%
50.0%
A B C D E F G H
Per
cen
tag
e E
ner
gy
Gen
erat
ion
Electric Power Sources
Fig. 2.19 US electric power industry net production by fuel [13]. A Coal, B Petroleum,C Natural gas, D Nuclear, E Hydroelectric, F Other renewables, G Other gases, H Other [14]
58 2 Energy and Energy Types

In alternating current (AC) the direction of the flow of electrons switches backand forth at regular intervals or cycles. Current flowing in power lines and normalhousehold electricity that comes from a wall outlet is alternating current. Thestandard current used in the US is 60 cycles per second (i.e. a frequency of 60 Hz);in Europe and most other parts of the world it is 50 cycles per second (i.e. afrequency of 50 Hz.). In Direct current (DC), on the other hand, electrical currentflows consistently in one direction. The current that flows in a flashlight is directcurrent. One advantage of alternating current is that it is relatively cheap to changethe voltage of the current. Furthermore, the inevitable loss of energy that occurswhen current is carried over long distances is far smaller with alternating currentthan with direct current.
Example 2.6 Electricity consumption of a laptop computerA laptop consuming 90 Watt is used on average 10 h per day. The laptop costs$500 and will be used for 4 years. Electricity cost is $0.15/kWh. Estimate the totalelectricity cost in four years for the laptop.
Solution:
Costlaptop¼$500
4 year¼ $125=year
Costelectricity¼$0:15
kWh
10 h
day
365 days
year90 W
kW
1000 W¼ $49:3=year
Costtotal¼ Costlaptop þ Costelectricity¼ ð$125=yearþ $49:3=yearÞ4 years ¼ $697:2
2.8 Magnetic Energy
There is no fundamental difference between magnetic energy and electric energy:the two phenomena are related by Maxwell’s equations. The potential energy of amagnet of magnetic moment m in a magnetic field B is defined as the work ofmagnetic force (magnetic torque), and is estimated by
Em ¼ �mB ð2:7Þ
Calculating work needed to create an electric or magnetic field in unit volumeresults in the electric and magnetic fields energy densities. Electromagnetic radi-ation, such as microwaves, visible light, or gamma rays, represents a flow ofelectromagnetic energy. The energy of electromagnetic radiation has discreteenergy levels. The spacing between these levels is equal to E = hm where h is the
2.7 Electric Energy 59

Planck constant, 6.626 9 10-34 Js [31], and m is the frequency of the radiation.This quantity of electromagnetic energy is usually called a photon. The photonswhich make up visible light have energies of 160 - 310 kJ/mol.
2.9 Chemical Energy
Chemical energy results from the associations of atoms in molecules and variousother kinds of aggregates of matter. It may be defined as a work done by electricforces that is electrostatic potential energy of electric charges. If the chemicalenergy of a system decreases during a chemical reaction, the difference is trans-ferred to the surroundings in the form of heat or light. On the other hand, if thechemical energy of a system increases as a result of a chemical reaction, thedifference then is supplied by the surroundings in form of heat or light. Typicalvalues for the change in molar chemical energy during a chemical reaction rangefrom tens to hundreds of kilojoules per mole. For example, 2,2,4-trimethylpentane(isooctane), widely used in petrol, has a chemical formula of C8H18 and it reactswith oxygen exothermically and produces 10.86 MJ per mole of isooctane
C8H18 lð Þ þ 25=2 O2 gð Þ ! 8CO2 gð Þ þ 9H2O gð Þ þ 10:86 MJ=mole ð2:8Þ
When two hydrogen atoms react to form a hydrogen molecule, the chemicalenergy decreases by the bond energy of the H–H. When the electron is completelyremoved from a hydrogen atom, forming a hydrogen ion, the chemical energycalled the ionization energy increases.
2.10 Energy and Global Warming
The burning of fossil fuels produces around 21.3 Gigatons of carbon dioxide peryear, and natural processes can only absorb about half of that amount, so there is anet increase of 10.65 billion tons of atmospheric carbon dioxide per year [21].
One tonne of carbon is equivalent to: MWCO2/MWC = 44/12 = 3.7 tons of
carbon dioxideCarbon dioxide emission can be calculated as
eCO2¼ Cf =Ef
� �MWCO2
=MWCð Þ ð2:9Þ
where eCO2is the CO2 emission in kgCO2/kWh, Cf is the carbon content in the fuel
(kgC/kgfuel) and Ef is the energy content of the fuel (kWh/kgfuel).Table 2.12 shows typical emission of carbon dioxide from the combustion of
various fuels. An average car traveling 10,000 miles per year and consuming anaverage 25 miles per gallon emits about 1.2 tons of carbon dioxide per year. Sincethe early 1800s, it is known that various atmospheric gases, acting like the glass in
60 2 Energy and Energy Types
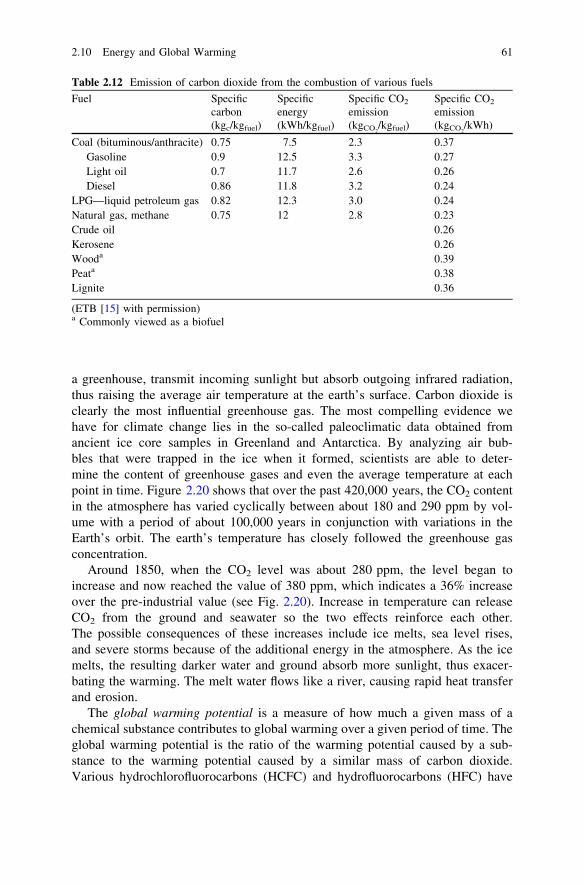
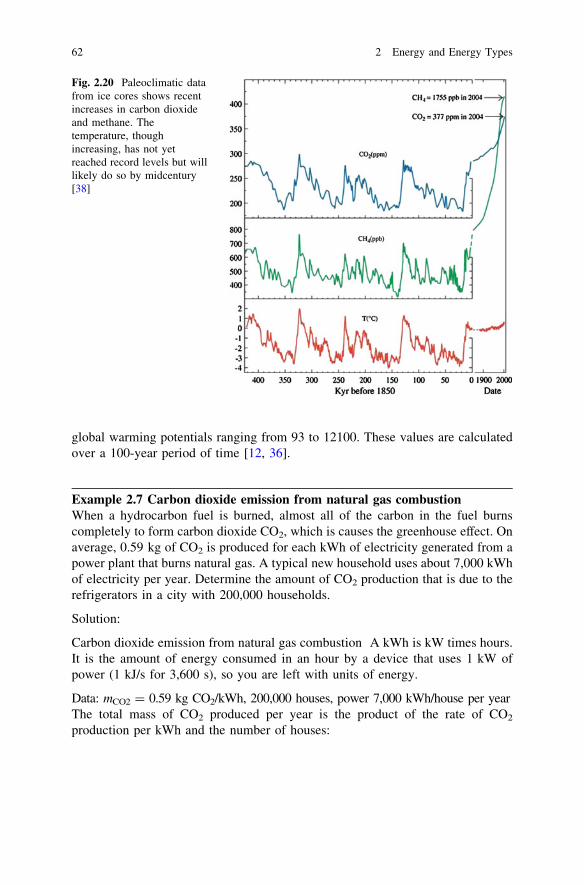
a greenhouse, transmit incoming sunlight but absorb outgoing infrared radiation,thus raising the average air temperature at the earth’s surface. Carbon dioxide isclearly the most influential greenhouse gas. The most compelling evidence wehave for climate change lies in the so-called paleoclimatic data obtained fromancient ice core samples in Greenland and Antarctica. By analyzing air bub-bles that were trapped in the ice when it formed, scientists are able to deter-mine the content of greenhouse gases and even the average temperature at eachpoint in time. Figure 2.20 shows that over the past 420,000 years, the CO2 contentin the atmosphere has varied cyclically between about 180 and 290 ppm by vol-ume with a period of about 100,000 years in conjunction with variations in theEarth’s orbit. The earth’s temperature has closely followed the greenhouse gasconcentration.
Around 1850, when the CO2 level was about 280 ppm, the level began toincrease and now reached the value of 380 ppm, which indicates a 36% increaseover the pre-industrial value (see Fig. 2.20). Increase in temperature can releaseCO2 from the ground and seawater so the two effects reinforce each other.The possible consequences of these increases include ice melts, sea level rises,and severe storms because of the additional energy in the atmosphere. As the icemelts, the resulting darker water and ground absorb more sunlight, thus exacer-bating the warming. The melt water flows like a river, causing rapid heat transferand erosion.
The global warming potential is a measure of how much a given mass of achemical substance contributes to global warming over a given period of time. Theglobal warming potential is the ratio of the warming potential caused by a sub-stance to the warming potential caused by a similar mass of carbon dioxide.Various hydrochlorofluorocarbons (HCFC) and hydrofluorocarbons (HFC) have
Table 2.12 Emission of carbon dioxide from the combustion of various fuels
Fuel Specificcarbon(kgc/kgfuel)
Specificenergy(kWh/kgfuel)
Specific CO2
emission(kgCO2
/kgfuel)
Specific CO2
emission(kgCO2
/kWh)
Coal (bituminous/anthracite) 0.75 7.5 2.3 0.37Gasoline 0.9 12.5 3.3 0.27Light oil 0.7 11.7 2.6 0.26Diesel 0.86 11.8 3.2 0.24
LPG—liquid petroleum gas 0.82 12.3 3.0 0.24Natural gas, methane 0.75 12 2.8 0.23Crude oil 0.26Kerosene 0.26Wooda 0.39Peata 0.38Lignite 0.36
(ETB [15] with permission)a Commonly viewed as a biofuel
2.10 Energy and Global Warming 61
global warming potentials ranging from 93 to 12100. These values are calculatedover a 100-year period of time [12, 36].
Example 2.7 Carbon dioxide emission from natural gas combustionWhen a hydrocarbon fuel is burned, almost all of the carbon in the fuel burnscompletely to form carbon dioxide CO2, which is causes the greenhouse effect. Onaverage, 0.59 kg of CO2 is produced for each kWh of electricity generated from apower plant that burns natural gas. A typical new household uses about 7,000 kWhof electricity per year. Determine the amount of CO2 production that is due to therefrigerators in a city with 200,000 households.
Solution:
Carbon dioxide emission from natural gas combustion A kWh is kW times hours.It is the amount of energy consumed in an hour by a device that uses 1 kW ofpower (1 kJ/s for 3,600 s), so you are left with units of energy.
Data: mCO2 = 0.59 kg CO2/kWh, 200,000 houses, power 7,000 kWh/house per yearThe total mass of CO2 produced per year is the product of the rate of CO2
production per kWh and the number of houses:
Fig. 2.20 Paleoclimatic datafrom ice cores shows recentincreases in carbon dioxideand methane. Thetemperature, thoughincreasing, has not yetreached record levels but willlikely do so by midcentury[38]
62 2 Energy and Energy Types
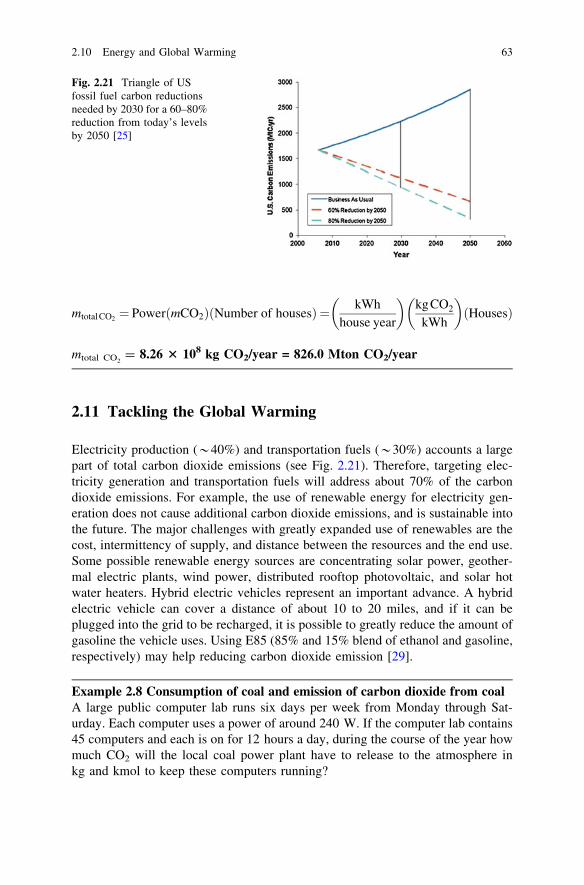
mtotalCO2¼ PowerðmCO2ÞðNumber of housesÞ ¼ kWh
house year
� �kgCO2
kWh
� �ðHousesÞ
mtotal CO2= 8.26 3 108 kg CO2/year = 826.0 Mton CO2/year
2.11 Tackling the Global Warming
Electricity production (*40%) and transportation fuels (*30%) accounts a largepart of total carbon dioxide emissions (see Fig. 2.21). Therefore, targeting elec-tricity generation and transportation fuels will address about 70% of the carbondioxide emissions. For example, the use of renewable energy for electricity gen-eration does not cause additional carbon dioxide emissions, and is sustainable intothe future. The major challenges with greatly expanded use of renewables are thecost, intermittency of supply, and distance between the resources and the end use.Some possible renewable energy sources are concentrating solar power, geother-mal electric plants, wind power, distributed rooftop photovoltaic, and solar hotwater heaters. Hybrid electric vehicles represent an important advance. A hybridelectric vehicle can cover a distance of about 10 to 20 miles, and if it can beplugged into the grid to be recharged, it is possible to greatly reduce the amount ofgasoline the vehicle uses. Using E85 (85% and 15% blend of ethanol and gasoline,respectively) may help reducing carbon dioxide emission [29].
Example 2.8 Consumption of coal and emission of carbon dioxide from coalA large public computer lab runs six days per week from Monday through Sat-urday. Each computer uses a power of around 240 W. If the computer lab contains45 computers and each is on for 12 hours a day, during the course of the year howmuch CO2 will the local coal power plant have to release to the atmosphere inkg and kmol to keep these computers running?
Fig. 2.21 Triangle of USfossil fuel carbon reductionsneeded by 2030 for a 60–80%reduction from today’s levelsby 2050 [25]
2.10 Energy and Global Warming 63

Solution:Data: Coal(bituminous/anthracite): 0.37 kg of CO2/kWh. Data from Table 2.12.
240 W
computer
� �kW
1; 000 W
� �52 weeks
year
� �6 days
week
� �12 h
day
� �45 computers
lab
� �
¼ 40; 435:2 kWh
We know that 40,435.2 kWh is needed from the lab per year and since the powerplant is coal we can use its emission value of 0.37 kg of CO2/kWh.(40435.2 kWh) (0.37 kg CO2/kWh) = 14,961 kg CO2 releasedor14,962 kg/(44.01 kg/mole) = 339.9 kmols CO2 released
Example 2.9 Reducing air pollution by geothermal heatingA district uses natural gas for heating. Assume that average NOx and CO2 emis-sions from a gas furnace are 0.0045 kg/therm and 6.4 kg/therm, respectively. It isconsidered to replace the gas heating system with a geothermal heating system.The projected saving by the geothermal heating system would be 20 9 106 thermsof natural gas per year. Determine the amount of NOx and CO2 emissions thegeothermal heating system would save every year.
Solution:therm = 29.3 kWh (Table 2.1)Reduction in NOx emission = (0.0045 kg/therm) (20 9 106 therm/year)
= 9.0 3 104 kg/yearReduction in CO2 emission = (6.4 kg/therm) (20 9 106 therm/year)
= 12.8.0 3 107 kg/yearAtypical car produces about 8.5 kg NOx and 6000 kg of CO2 per year. Replacingthe gas heating system by the geothermal heating system is equivalent to taking10600 cars off the road for NOx emission and taking 21000 cars of the road forCO2 emission. Therefore, the proposed geothermal heating would have a positiveimpact on the air pollution [8].
Student Concern of Global Warming
Each generation has its own crisis, in which people are gravely affected. Some generationshave wars or famine, however my generation will certainly have both if our energy crisisis not addressed. Our reliance on fossil fuels has become an addiction. We enjoy manyluxuries such as air conditioning, television, and the ability to surf the web or make a callacross the country. All of these luxuries are telling of the modernized society we live in,but sadly in times where energy is scarce, we are hardest hit. It would be hard to believethat the generation following the greatest rise in human ingenuity could be blind to such anissue. Our fossil fuel energy resources are limited and many scientists say the expirationdate is within our lifetime. We need to better understand the basic principles of energy andits usage so that we can make better choices and change the direction we are currentlyheading.—Brad Healey-Senior UNL-2012
64 2 Energy and Energy Types
Problems
2.1. What are the advantages and disadvantages of using coal?2.2. Does an electric car reduce the use of fossil fuels?2.3. Is a fuel oil heater or an electric resistance heater the best for the
environment?2.4. Is a natural gas heater or a geothermal heating system the best for the house?2.5. Why is electrical energy so useful?2.6. How can the energy in the wind be used?2.7. 2.7. How can wind power help conserve our oil supplies?2.8. How might using wind energy help reduce the air pollution?2.9. What is the best energy source to convert to electricity?
2.10. Do the white-colored roof tiles keep houses cool?2.11. How can energy from the sun be used to heat water?2.12. With the clear advantages of nuclear power, why is it not more commonly
used?2.13. How can using solar energy help reduce pollution in the atmosphere and
help conserve our oil supplies?2.14. Why is the process of photosynthesis so valuable?2.15. Name some foods that are known to be high energy foods.2.16. Why are battery-powered vehicles considered to be the transport of the future?2.17. Why is chemical energy useful to us?2.18. What other forms of energy can be produced from chemical energy?2.19. Name three examples of other fuels that contain chemical energy.2.20. An over used car may consume around 250 gallons of gasoline per month.
Estimate the energy consumed by the car per year.2.21. An over used car may consume around 150 gallons gasoline per month.
Estimate the energy consumed by the car per year.2.22. A car’s daily travelling distance is about 80 miles/day. A car has a city-
mileage of 20 miles/gal. If the car is replaced with a new car with a city-mileage of 30 miles/gal and the average cost of gasoline is $4.50/gal,estimate (a) the amount of fuel, energy, and money conserved with the newcar per year, (b) reduction in CO2 emission.
2.23. A car’s daily travelling distance is about 80 miles/day. A car has a city-mileage of 10 miles/gal. If the car is replaced with a new car with a city-mileage of 32 miles/gal and the average cost of gasoline is $4.50/gal,estimate (a) the amount of fuel, energy, and money conserved with the newcar per year, (b) reduction in CO2 emission.
2.24. A city consumes natural gas at a rate of 500 106 ft3/day. The volumetricflow is at standard conditions of 60�F and 1 atm = 14.7 psia. If the naturalis costing $12/GJ of higher heating value what is the daily cost of the gasfor the city.
2.25. A city consumes natural gas at a rate of 800� 106 ft3/day. The volumetricflow is at standard conditions of 60�F and 1 atm = 14.7 psia. If the natural
Problems 65
is costing $10/GJ of higher heating value what is the daily cost of the gasfor the city.
2.26. A car consumes about 6 gallons a day, and the capacity of a full tank isabout 15 gallons. The density of gasoline ranges from 0.72 to 0.78 kg/l(Table 2.2). The lower heating value of gasoline is about 44,000 kJ/kg.Assume that the average density of gasoline is 0.75 kg/l. If the car was ableto use 0.2 kg of nuclear fuel of uranium-235, estimate the time in years forrefueling.
2.27. A car consumes about 3 gallons a day, and the capacity of the full tank isabout 11 gallon. The density of gasoline ranges from 0.72 to 0.78 kg/l(Table 2.2). The lower heating value of gasoline is about 44,000 kJ/kg.Assume that the average density of gasoline is 0.75 kg/l. If the car was ableto use 0.1 kg of nuclear fuel of uranium-235, estimate the time in years forrefueling.
2.28. Using data in Table 2.11 and ultimate analysis, fixed carbon, dry ashcontent, C, H, and O compositions estimate the gross heating values in kJ/kg for the biomass white oak.
2.29. Using data in Table 2.11 and ultimate analysis, fixed carbon, dry ashcontent, and C, H, and O compositions only estimate the gross heatingvalues in kJ/kg for the biomass corn stover and wheat straw.
2.30. When a hydrocarbon fuel is burned, almost all of the carbon in the fuelburns completely to form CO2 (carbon dioxide), which is the principle gascausing the greenhouse effect and thus global climate change. On average,0.59 kg of CO2 is produced for each kWh of electricity generated from apower plant that burns natural gas. A typical new household uses about7,000 kWh of electricity per year. Determine the amount of CO2 produc-tion that is due to the refrigerators in a city with 100,000 households
2.31. When a hydrocarbon fuel is burned, almost all of the carbon in the fuelburns completely to form CO2 (carbon dioxide), which is the principle gascausing the greenhouse effect and thus global climate change. On average,0.59 kg of CO2 is produced for each kWh of electricity generated from apower plant that burns natural gas. A typical new household uses about10,000 kWh of electricity per year. Determine the amount of CO2 pro-duction that is due to the refrigerators in a city with 250,000 households
2.32. A large public computer lab operates Monday through Saturday. There thecomputers are either being used constantly or remain on until the next usercomes. Each computer needs around 240 W. If the computer lab contains53 computers and each is on for 12 h a day, during the course of the yearhow much CO2 will the local coal power plant have to release to theatmosphere in gram moles to keep these computers running?
2.33. The average university will have a large public computer lab open Mondaythrough Saturday. There the computers are either being used constantly orremain on until the next user comes. Each computer needs around 240 W.If the computer lab contains 53 computers and each is on for 12 h a day,
66 2 Energy and Energy Types
during the course of the year how much coal will the local coal power planthave to consume to keep these computers running?
2.34. A large public computer lab runs six days per week from Monday throughSaturday. Each computer uses a power of around 120 W. If the computerlab contains 45 computers and each is on for 12 h a day, during the courseof the year how much CO2 will the local coal power plant have to release tothe atmosphere in gram moles to keep these computers running?
2.35. If a car consumes 60 gallons gasoline per month. Estimate the energyconsumed by the car per year.
2.36. A car having an average 22 miles/gal is used 32 miles every day. If the costof a gallon fuel is $3.8 estimate the yearly cost of fuel.
2.37. A car having an average 22 miles/gal is used 32 miles every day. Estimatethe yearly energy usage.
2.38. How can you control your carbon footprint?2.39. A 150-W electric light bulb is used on average 10 h per day. A new bulb
costs $2.0 and lasts about 5,000 h. If electricity cost is $0.15/kWh, estimatethe yearly cost of the bulb.
2.40. A laptop consuming 90 Watt is used on average 5 h per day. If a laptopcosts $500 and will be used for four years estimate the total electricity costin four years for the laptop. Electricity cost is $0.15/kWh.
2.41. A laptop consuming 90 Watt is used on average 7 h per day. If a laptopcosts $500 and will be used for four years estimate the total electricity costin four years for the laptop. Electricity cost is $0.10/kWh.
2.42. A 20-hp electric motor is used to pump ground water into a storage tank4 h every day. Estimate the work done by the pump in kW every year andthe cost of electricity every year. Assume that the electricity unit cost is$0.1/kWh.
2.43. A city consumes natural gas at a rate of 2509106 ft3/day. The volumetricflow is at standard conditions of 60�F and 1 atm = 14.7 psia. If the naturalgas is costing $6/GJ of higher heating value what is the daily cost of the gasfor the city.
2.44. A home consumes natural gas at a rate of 4.3ft3/day to heat the home. Thevolumetric flow is at standard conditions of 60�F and 1 atm = 14.7 psia. Ifthe natural gas is costing $0.67/MJ of higher heating value what is the dailycost of the gas for the home?
2.45. A district uses natural gas for heating. Assume that average NOx and CO2
emissions from a gas furnace are 0.0045 kg/therm and 6.4 kg/therm,respectively. The district wants to replace the gas heating system with ageothermal heating system. The projected saving by the geothermal heat-ing system would be 40 9 106 therms of natural gas per year. Determinethe amount of NOx and CO2 emissions the geothermal heating systemwould save every year.
2.46. A water heater consumes propane, which is providing 80% of the standardheat of combustion when the water produced after combustion is vapor. If
Problems 67

the price of propane is $2.2/gal measured at 25�C. What is the heating costin $ per million Btu and in $ per MJ?
2.47. An average video games system consumes 170 W of power duringgameplay. If a person were to play an hour a day for 80% of the year howmany liters of gasoline would the person have burned? (Evaluated at HHV)
2.48. A competitive road cyclist can hold an average of 300W of power during a4 h race. During long races he must do this each day for three weeks. Howmany protein bars will the cyclist have to eat at 184 calories per bar to justmake up the calories lost during the race?
2.49. Describe the process of how natural gas goes from its natural state to themarket?
2.50. Some people like to have background noise when they are falling asleep.Many choose to listen to their television. The television will usually run onabout 340 W and will run during the 8 h that you are asleep. With elec-tricity costing $0.20/kWh, calculate how much this will cost you if you dothis for five days a week for an entire year.
2.51. What are the advantages and disadvantages of electrical energy in analternating current?
2.52. What are the advantages and disadvantages of electrical energy flowing indirect current?
2.53. In the search for new sources of energy that are renewable and emit lessgreenhouse gases, carbon-based biofuels are of major interest. These fuelsare still carbon-based and must undergo combustion to release the chemicalenergy. Why is this process being looked at as a reasonable energy source?
2.54. While fixing wiring in a house, an electrician aims to deliver the sameamount of electric energy to a devise at the same rate it is currently comingin. The wiring he is replacing runs at has 2 ohms of resistance and has a20 A current. To deliver the same amount of electric energy how manyamps will be needed if the resistance is changed to 4 ohms?
2.55. Calculate the yearly dollar savings if you cut down from a daily 9 min showerto a 6 min shower. The shower volumetric flow rate is 3.2 gpm and theamount of energy used per gallon is 440 Btu and energy costs $0.13/kWh.
2.56. Rank the following carbon-based fuels in order of lowest to highest grossenergy density; diesel, ethanol, conventional gasoline, and kerosene-basedjet fuel.
References
1. AWEA (2006) U.S. Wind industry ends most productive year, sustained growth expected forat least next two years. American Wind Energy Association in http://www.awea.org
2. Behzadi S, Farid MM (2007) Review: examining the use of different feedstock for theproduction of biodiesel. Asia-Pac J Chem Eng 2:480–486
68 2 Energy and Energy Types

3. Belyaev LS, Marchenko OV, Filippov SP, Solomin SV, Stepanova TB, Kokorin AL (2002)World energy and transition to sustainable development. Kluwer, Boston
4. Blair N, Short W, Mehos M, Heimiller D (2006) Concentrating solar deployment systems(CSDS)—A new model for estimating U.S. concentrating solar power marketpotentialpotential. ASES Solar conference, 8–13 July 2006
5. Bodansky D (2004) Nuclear energy: principles practices and prospects. Springer, Oxford6. Bolinger M, Wiser R (2005) Balancing cost and risk: the treatment of renewable energy in
western utility resource plans, Lawrence Berkeley National Laboratory, Berkeley, California.http://eetd.lbl.gov/EA/EMP/reports/58450.pdf
7. Capehart BL (2007) Encyclopedia of energy engineering and technology. CRC Press, BocaRaton
8. Çengel YA, Boles MA (2002) Thermodynamics an engineering approach. McGraw-Hill,New York
9. Demirbas A (2008) Biodiesel: a realistic fuel alternative for diesel engines. Springer, Berlin10. Demirbas A (1997) Calculation of higher heating values of biomass fuels. Fuel 76:431–43411. Denholm P, Margolis R (2006) Very large-scale deployment of grid-connected solar
photovoltaicphotovoltaic in the United States: challenges and opportunities. ASES Solarconference, 8–13 July 2006
12. Davidson E, Janssens I (2006) Temperature sensitivity of soil carbon decomposition andfeedbacks to climate change. Nature 440:165
13. DOE/EIA (2010) International energy outlook. Report #:DOE/EIA-0484. http://www.eia.gov/oiaf/ieo/highlights.html. Accessed May 2011
14. EIA (2011) Renewable energy consumption and electricity preliminary statistics 2010,Release date: June 28, 2011. http://www.eia.gov/renewable/. Accessed July 2011
15. ETB (2011) Engineering Tool Box. http://www.engineeringtoolbox.com. Accessed May2011
16. Farrell A, Plevin R et al (2006) Ethanol can contribute to energy and environmental goals.Science 311:506–508
17. Gary JH, Handwerk GH (1994) Petroleum refining technology, 3rd edn. Marcel Dekker,New York
18. Gaur S, Reed T (1998) Thermal data for natural and synthetic fuels. Marcel Dekker,New York
19. Houghton RA (2005) The contemporary carbon cycle. In: Schlesinger WH (ed)Biogeochemistry. Elsevier, Amsterdam
20. Janzen HH (2004) Carbon cycling in earth systems -a soil science perspective. Agric EcosysEnviron 104:399–417
21. Jacobson MZ (2009) Review of solutions to global warming, air pollution, and energysecurity. Energy Environ Sci 2:148–173
22. Kaes GL (2000) Refinery process modeling. Kaes Enterprises, Colbert23. Kalnes T, Marker T, Shonnard DR (2007) Green diesel: a second generation biofuel. Int J
Chem Reactor Eng 5:1–924. Knothe G (2006) Dependence of biodiesel fuel properties on the structure of fatty acids alkyl
esters. Fuel Process Technol 86:1059–107025. Kutscher CF (2007) (ed) Tackling climate change in the U.S., American Solar Energy
Society. www.ases.org/climatechange. Accessed May 201126. Kydes AS, Kanudiab A, Loulouc R (2004) National energy modeling systems. In: Cleveland
CJ (ed) The encyclopedia of energy. Elsevier, Oxford27. Laursen JKr, Karavanov AN (2006) Processes for sulfur recovery, regeneration of spent acid,
and reduction of nox emissions. Chem Petrol Eng 42:229–23428. Marks DB (1999) Biochemistry, 3rd edn. Kluwer, Ney York29. Metz B, Davidson O et al (2005) IPCC special report on carbon dioxide capture and storage.
Working Group III. Intergovernmental Panel on Climate Change. Cambridge UniversityPress, Cambridge
References 69

30. Milbrandt A (2005) A geographic perspective on the current biomass resource availability inthe United States, NREL, Golden, Colorado. http://www.nrel.gov/learning
31. Mohr PJ, Taylor BN, Newell DB (2011) The 2010 CODATA Recommended values of thefundamental physical constants. This database was developed by Baker J, Douma M,Kotochigova S. http://physics.nist.gov/constants
32. NREL (2011) National Renewable Energy Laboratory Golden Colorado. http://www.nrel.gov/learning. Accessed May 2011
33. Øvergaard S (2008) Issue paper: definition of primary and secondary energy. www.og.ssb.no.Accessed April 2011
34. Sheng C, Azevedo JLT (2005) Estimating the higher heating value of biomass fuels frombasic analysis data. Biomass Bioenergy 28:499–507
35. Smoot LD, Smith PJ (1985) Coal combustion and gasification. Plenum Press, New York36. Swisher J (2006) Tackling climate change in the U.S.: the potential contribution from energy
efficiency, the ASES Solar National Conference, 8–13 July 200637. EP UN (2009) Towards sustainable production and use of resources: assessing biofuels.
United Nations Environment Programme, Renewable Energy World38. Vimeux F, Cuffey KM, Jouzel J (2002) New insights into southern hemisphere temperature
changes from Vostok ice cores using deuterium excess correction. Earth Planet Sci Lett203:829–843
39. Wiser R, Bolinger M (2010) DOE EERE, 2010 Wind technologies market report. http://www.osti.gov/bridge. Accessed July 2011
70 2 Energy and Energy Types

http://www.springer.com/978-1-4471-2371-2