Chapter 15 Economics of Land Degradation in India...Chapter 15 Economics of Land Degradation in...
39
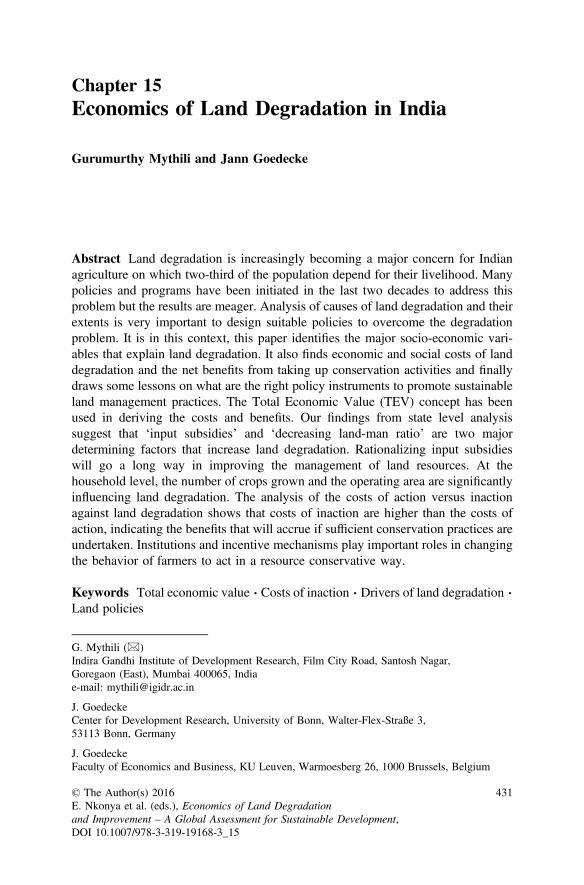
Chapter 15 Economics of Land Degradation in India Gurumurthy Mythili and Jann Goedecke Abstract Land degradation is increasingly becoming a major concern for Indian agriculture on which two-third of the population depend for their livelihood. Many policies and programs have been initiated in the last two decades to address this problem but the results are meager. Analysis of causes of land degradation and their extents is very important to design suitable policies to overcome the degradation problem. It is in this context, this paper identifies the major socio-economic vari- ables that explain land degradation. It also finds economic and social costs of land degradation and the net benefits from taking up conservation activities and finally draws some lessons on what are the right policy instruments to promote sustainable land management practices. The Total Economic Value (TEV) concept has been used in deriving the costs and benefits. Our findings from state level analysis suggest that ‘input subsidies’ and ‘decreasing land-man ratio’ are two major determining factors that increase land degradation. Rationalizing input subsidies will go a long way in improving the management of land resources. At the household level, the number of crops grown and the operating area are significantly influencing land degradation. The analysis of the costs of action versus inaction against land degradation shows that costs of inaction are higher than the costs of action, indicating the benefits that will accrue if suf ficient conservation practices are undertaken. Institutions and incentive mechanisms play important roles in changing the behavior of farmers to act in a resource conservative way. Keywords Total economic value Costs of inaction Drivers of land degradation Land policies G. Mythili (&) Indira Gandhi Institute of Development Research, Film City Road, Santosh Nagar, Goregaon (East), Mumbai 400065, India e-mail: [email protected] J. Goedecke Center for Development Research, University of Bonn, Walter-Flex-Straße 3, 53113 Bonn, Germany J. Goedecke Faculty of Economics and Business, KU Leuven, Warmoesberg 26, 1000 Brussels, Belgium © The Author(s) 2016 E. Nkonya et al. (eds.), Economics of Land Degradation and Improvement – A Global Assessment for Sustainable Development, DOI 10.1007/978-3-319-19168-3_15 431
Transcript of Chapter 15 Economics of Land Degradation in India...Chapter 15 Economics of Land Degradation in...
Chapter 15Economics of Land Degradation in India
Gurumurthy Mythili and Jann Goedecke
Abstract Land degradation is increasingly becoming a major concern for Indianagriculture on which two-third of the population depend for their livelihood. Manypolicies and programs have been initiated in the last two decades to address thisproblem but the results are meager. Analysis of causes of land degradation and theirextents is very important to design suitable policies to overcome the degradationproblem. It is in this context, this paper identifies the major socio-economic vari-ables that explain land degradation. It also finds economic and social costs of landdegradation and the net benefits from taking up conservation activities and finallydraws some lessons on what are the right policy instruments to promote sustainableland management practices. The Total Economic Value (TEV) concept has beenused in deriving the costs and benefits. Our findings from state level analysissuggest that ‘input subsidies’ and ‘decreasing land-man ratio’ are two majordetermining factors that increase land degradation. Rationalizing input subsidieswill go a long way in improving the management of land resources. At thehousehold level, the number of crops grown and the operating area are significantlyinfluencing land degradation. The analysis of the costs of action versus inactionagainst land degradation shows that costs of inaction are higher than the costs ofaction, indicating the benefits that will accrue if sufficient conservation practices areundertaken. Institutions and incentive mechanisms play important roles in changingthe behavior of farmers to act in a resource conservative way.
Keywords Total economic value � Costs of inaction � Drivers of land degradation �Land policies
G. Mythili (&)Indira Gandhi Institute of Development Research, Film City Road, Santosh Nagar,Goregaon (East), Mumbai 400065, Indiae-mail: [email protected]
J. GoedeckeCenter for Development Research, University of Bonn, Walter-Flex-Straße 3,53113 Bonn, Germany
J. GoedeckeFaculty of Economics and Business, KU Leuven, Warmoesberg 26, 1000 Brussels, Belgium
© The Author(s) 2016E. Nkonya et al. (eds.), Economics of Land Degradationand Improvement – A Global Assessment for Sustainable Development,DOI 10.1007/978-3-319-19168-3_15
431
Introduction
Land degradation poses a considerable challenge to agricultural growth and povertyreduction in India. It is officially estimated that about 44 % of India’s land area isdegraded. The causes of land degradation are numerous and complex. Proximatefactors include the extension of crop cultivation to marginal and low potential landsor to lands vulnerable to natural hazards,1 improper crop rotations, overuse ofagrochemicals, and mismanagement of the irrigation system. Moreover, “shiftingcultivation” practiced in many parts of the country is responsible for deforestationand the expansion of agriculture to less productive lands. However, the underlyingcauses are believed to be poverty among agricultural households, land fragmenta-tion, insecure land tenure, open access nature of some resources, and policy andinstitutional failures.
To illustrate one of these drivers in more detail, India supports 18 % of the worldhuman population, 15 % of the global livestock population, but endowed with only2.4 % of world land area. Moreover, the average size of land holdings in agriculturedeclined from 2.30 to 1.16 ha during 1970–2010 due to increasing populationpressure. About 60 % of the land is rainfed and low in productivity, leading to highinter-annual fluctuations in agricultural output. About 200 million rural poor dependon these rainfed areas for their livelihoods.
Intensive farming practices, particularly with wheat and rice, initiated during theGreen Revolution in 1970s, have mined nutrients from the soil. Soil degradation islimiting gains in agricultural output and forest production. Land degradation is a bigchallenge to policy makers who need to balance the multiple goals of povertyeradication, food security and sustainable land management.
The major objective of this study is to scientifically support policy actions inIndia on sustainable land management, through finding answers to the threeresearch questions below:
(i) What are key causes of land degradation across typical agro-ecologicalregions of India?
(ii) What are the economic, social and environmental costs of land degradationand net benefits resulting from taking actions against degradation compared toinaction?
(iii) What are the feasible policy and development strategies that enable and cat-alyze sustainable land management (SLM) actions?
This Economics of Land Degradation (ELD) research seeks to test twohypotheses. Firstly, we test which factors, such as climate and agricultural practices,population density, poverty, absence of secure land tenure, lack of market accessand others, are significant causes of land degradation. Secondly, we also
1Steep slopes, shallow and sandy soils, fragile arid and semi-arid lands bordering deserts.
432 G. Mythili and J. Goedecke

hypothesize that the benefit of taking action against land degradation through SLMmeasures is greater than the costs of inaction.
The chapter begins with a brief introduction to Conceptual Framework andfollowed by Land use, land degradation status, trend and classifications. The fol-lowing section focuses on land policies and their influences on land degradation.This is followed by the impacts of land degradation where the survey of paststudies, the methodology adopted for our own estimates and the estimates of costsof action vs inaction are highlighted. Then we move to the drivers of land degra-dation which contains state level and household level analysis. Finally we drawinferences from the findings and policy implications.
ELD Conceptual Framework
The conceptual framework used in the India case study of Economics of LandDegradation broadly follows the ELD framework presented in von Braun et al.(2013). The causes of land degradation are divided into proximate and underlying,which interact with each other to result in different levels of land degradation. Thelevel of land degradation determines its outcomes or effects—whether on-site oroffsite—on the provision of ecosystem services and the benefits humans derivefrom those services. Actors can then take action to control the causes of landdegradation, its level, or its effects (ibid.).
Many of the services provided by ecosystems are not transacted through themarkets, so different agents do not take into account negative or positive effects onthose ecosystems. Since the external costs or benefits are not accounted for in thefarmer’s land use decision, this leads to an undervaluation of land and its provisionof ecosystem services (ibid.). The failure to capture these values causes higher ratesof land degradation. To adequately account for ecosystem services in decisionmaking, the economic values of those services have to be determined (Nkonya et al.2011). Attributing economic values to ecosystem services is challenging, due tomeasurement problems. As economic values are linked to the number of (human)beneficiaries and the socioeconomic context, these services depend on local orregional conditions (ibid.). As TEEB (2010) indicates, a global framework thatidentifies a set of key attributes and then monitors these by building on nationalindicators could help answering this challenge.
It is also crucial to identify and understand institutional arrangements affectingland management, in order to devise sustainable and efficient policies to combatland degradation. For example, if farmers use excessive water or fertilizer, leadingto some forms of land degradation, it must be understood why they do so. Missingor very low prices of irrigation water or fertilizer provide incentives to degrade landand soils in a misleading institutional setup.
15 Economics of Land Degradation in India 433
The Extent and Types of Land Degradation in India
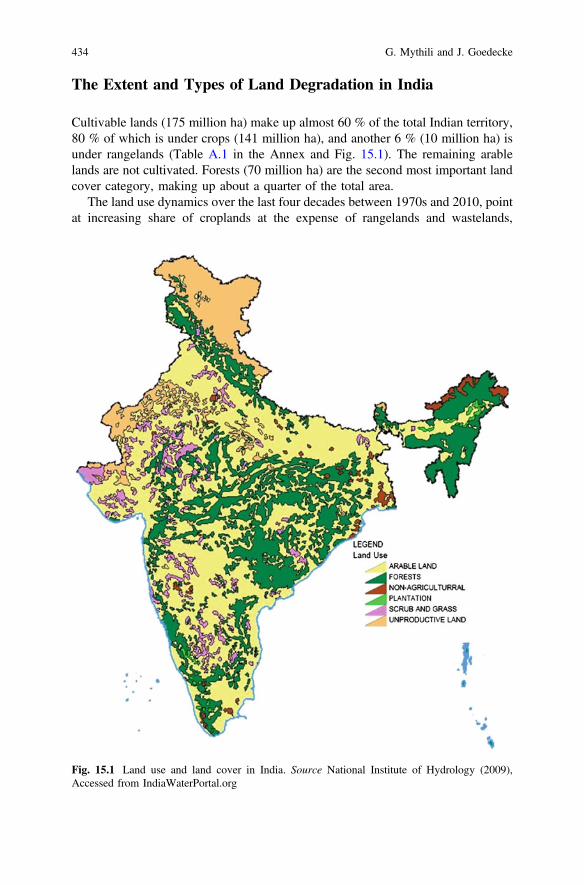
Cultivable lands (175 million ha) make up almost 60 % of the total Indian territory,80 % of which is under crops (141 million ha), and another 6 % (10 million ha) isunder rangelands (Table A.1 in the Annex and Fig. 15.1). The remaining arablelands are not cultivated. Forests (70 million ha) are the second most important landcover category, making up about a quarter of the total area.
The land use dynamics over the last four decades between 1970s and 2010, pointat increasing share of croplands at the expense of rangelands and wastelands,
Fig. 15.1 Land use and land cover in India. Source National Institute of Hydrology (2009),Accessed from IndiaWaterPortal.org
434 G. Mythili and J. Goedecke

rapidly growing urbanization and a slight extension in the forest cover (Table A.1 inthe Annex). However, the analysis of more recent MODIS satellite data shows thatbetween 2001 and 2009, the forest cover declined all across India by a total of2.8 million ha, of which the largest shares are in Kerala, Madhya Pradesh, andAndhra Pradesh (Table 15.1).
Similarly, the areas under woodlands and barren lands have also decreased by3.2 million ha each. On the other hand, the biggest land use change was the increase
Table 15.1 Land use change between 2001 and 2009 in Indian states (without Union territories),in thousand ha
Location Forest Shrub Grassland Cropland Wood Barren Water
Andhra Pradesh −324 85 1418 1230 −2330 −48 −32
Arunachal Pradesh 265 −141 80 −5 −41 −144 −13
Assam −200 −68 −138 19 409 −49 27
Bihar −148 −221 −115 725 −216 −13 −12
Chhattisgarh −123 26 −69 521 −358 5 −3
Goa −1 −8 −14 −7 32 −3 0
Gujarat 10 −787 −105 1331 30 −597 116
Haryana 3 −143 −11 155 0 −5 0
Jammu & Kashmir 427 −253 −595 130 −64 387 −32
Jharkhand −237 99 −1 472 −332 0 0
Karnataka −118 −81 1347 −1524 379 −9 6
Kerala −945 −16 −11 172 820 −1 −19
Madhya Pradesh −452 −152 481 372 −312 12 51
Maharashtra −35 −413 473 227 −256 −10 15
Manipur −123 −25 3 58 88 0 −1
Meghalaya −110 2 −24 −1 134 0 −1
Mizoram −291 −2 −15 −25 332 0 0
Nagaland 36 −2 −14 −16 −3 0 −1
Orissa −268 62 62 772 −599 −19 −10
Punjab 7 −18 −17 24 5 0 −1
Rajasthan −16 4893 −770 −1400 107 −2815 1
Sikkim 19 −4 15 0 −17 −10 −2
Tamil Nadu −159 −210 325 774 −736 5 2
Tripura −240 −7 −29 −14 291 0 −2
Uttar Pradesh −104 −145 −108 528 −151 −7 −14
Uttarakhand 234 −178 −77 104 −153 80 −10
West Bengal 43 −42 −43 390 −283 −29 −34
India −2848 2252 2048 5010 −3222 −3271 32Source MODIS land coverNote “urban” was left out since no change is reported in the considered time period
15 Economics of Land Degradation in India 435
of the cropped areas by 5 million ha between 2001 and 2009, and increase of 2.2and 2 million ha of shrublands and grasslands, respectively. These overall figureshide significant regional differences. For example, even though the overall croplandarea has increased in India, such states as Karnataka, Rajasthan, have lost about1.5 million ha of croplands each; whereas such other states as Gujarat, AndhraPradesh have gained about 1.3 million ha of croplands each. Table 15.1 shows theseregional differences in detail.
Geographically, India is divided into six zones: North, South, East, North East,West, Central, and Union territories. The land degradation data (Table 15.2) showthat soil erosion due to water and wind occupy more than 70 % of the totaldegraded area. The water induced soil erosion is the single largest contributor toland degradation, i.e. about two-third of the total, followed by salinity, about 15 %,which is a common problem in the irrigated lands in the country. Region-wisestatistics show that central region is the worst affected of all (59 % of its total area),followed by North-Eastern and Southern regions.
Land degradation statistics vary depending on the source and estimation method.One estimate is based on universal soil loss function, as applied in the NBSS andthe other, on National Remote Sensing Agency (NRSA). NRSA bases its estimateson remotely sensed satellite data. NRSA estimates are lower than the former esti-mates by NBSS&LUP-ICAR-2005 and are expected to be more accurate and togive more detailed information.
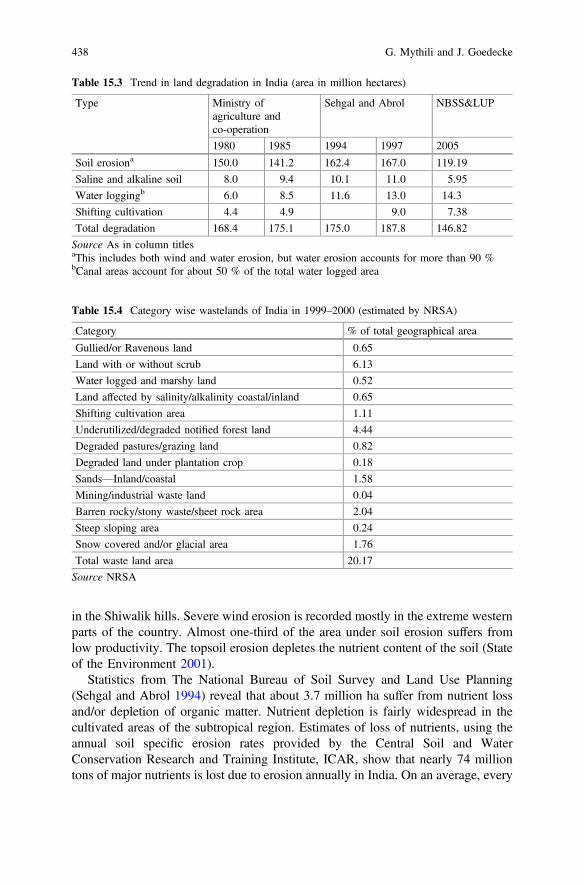
Table 15.3 provides trends on land degradation using the former method.The NRSA estimates are given in Table 15.4. The trend shows that land degra-dation declined after 1996. There is a need to evaluate the reasons behind thisdecline. One potential cause could be the increased public investments to addressdegradation after 1996. The most important type of land degradation in India is soilerosion (both by wind and water) (on 119 million ha), followed by shifting culti-vation, waterlogging and salinity.
According to the NRSA estimates only about 20 % of the territory in India, i.e.65 million ha of land are considered as wastelands. However, it should be noted thatthese two estimates do not necessarily contradict each other as they measure dif-ferent things.
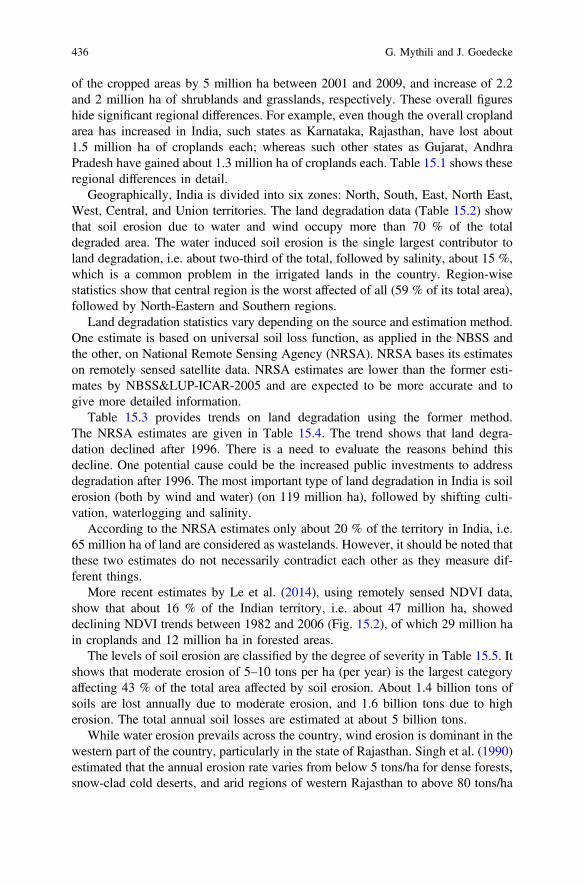
More recent estimates by Le et al. (2014), using remotely sensed NDVI data,show that about 16 % of the Indian territory, i.e. about 47 million ha, showeddeclining NDVI trends between 1982 and 2006 (Fig. 15.2), of which 29 million hain croplands and 12 million ha in forested areas.
The levels of soil erosion are classified by the degree of severity in Table 15.5. Itshows that moderate erosion of 5–10 tons per ha (per year) is the largest categoryaffecting 43 % of the total area affected by soil erosion. About 1.4 billion tons ofsoils are lost annually due to moderate erosion, and 1.6 billion tons due to higherosion. The total annual soil losses are estimated at about 5 billion tons.
While water erosion prevails across the country, wind erosion is dominant in thewestern part of the country, particularly in the state of Rajasthan. Singh et al. (1990)estimated that the annual erosion rate varies from below 5 tons/ha for dense forests,snow-clad cold deserts, and arid regions of western Rajasthan to above 80 tons/ha
436 G. Mythili and J. Goedecke

Tab
le15
.2The
classificatio
nof
land
degradationin
India,
bytypesandregion
s(in10
00ha)
Region
Water
erosion
Wind
erosion
Water
logg
ing
Salin
ity/alkalinity
Several
degradation
types
combined
Total
degraded
area
Area
Degraded
area
(%)
North
23,449
9040
4396
3342
335
40,562
101,06
140
North
East
4136
–52
255
3424
2212
,614
26,219
48
Central
17,883
–35
968
4211
2626
,210
44,345
59
East
9249
–33
9223
2219
415
,157
41,833
36
West
16,446
443
599
1869
1993
21,350
50,743
42
South
22,330
–50
3119
0213
0230
,565
63,576
48
Union
Territories
187
––
99
205
825
25
INDIA
93,680
(64%)
9483
(6%)
14,299
(10%)
21,820
(15%)
7381
(5%)
146,66
3(100
%)
328,60
245
NoteFigu
resin
parenthesesarepercentagesto
totaldegraded
area.States
ineach
region
:North:Delhi,JammuandKashm
ir,Him
achalPradesh,
Punjab,
Haryana,U
ttarakh
and,
UttarPradesh.
North
East:Assam
,Sikkim,N
agaland,
Meghalaya,M
anipur,M
izoram
,Tripu
ra,A
runachal
Pradesh.
Central:Madhy
aPradesh,
Chh
attisgarh.E
ast:Bihar,O
rissa,Jharkh
and,
WestB
engal.West:Rajasthan,G
ujarat,G
oa,M
aharashtra.S
outh:A
ndhraPradesh,
Kerala,Karnataka,
Tam
ilNadu
Source
NBSS
&LUP-ICAR-200
5on
theScaleof
1:25
0,00
0
15 Economics of Land Degradation in India 437
in the Shiwalik hills. Severe wind erosion is recorded mostly in the extreme westernparts of the country. Almost one-third of the area under soil erosion suffers fromlow productivity. The topsoil erosion depletes the nutrient content of the soil (Stateof the Environment 2001).
Statistics from The National Bureau of Soil Survey and Land Use Planning(Sehgal and Abrol 1994) reveal that about 3.7 million ha suffer from nutrient lossand/or depletion of organic matter. Nutrient depletion is fairly widespread in thecultivated areas of the subtropical region. Estimates of loss of nutrients, using theannual soil specific erosion rates provided by the Central Soil and WaterConservation Research and Training Institute, ICAR, show that nearly 74 milliontons of major nutrients is lost due to erosion annually in India. On an average, every
Table 15.3 Trend in land degradation in India (area in million hectares)
Type Ministry ofagriculture andco-operation
Sehgal and Abrol NBSS&LUP
1980 1985 1994 1997 2005
Soil erosiona 150.0 141.2 162.4 167.0 119.19
Saline and alkaline soil 8.0 9.4 10.1 11.0 5.95
Water loggingb 6.0 8.5 11.6 13.0 14.3
Shifting cultivation 4.4 4.9 9.0 7.38
Total degradation 168.4 175.1 175.0 187.8 146.82
Source As in column titlesaThis includes both wind and water erosion, but water erosion accounts for more than 90 %bCanal areas account for about 50 % of the total water logged area
Table 15.4 Category wise wastelands of India in 1999–2000 (estimated by NRSA)
Category % of total geographical area
Gullied/or Ravenous land 0.65
Land with or without scrub 6.13
Water logged and marshy land 0.52
Land affected by salinity/alkalinity coastal/inland 0.65
Shifting cultivation area 1.11
Underutilized/degraded notified forest land 4.44
Degraded pastures/grazing land 0.82
Degraded land under plantation crop 0.18
Sands—Inland/coastal 1.58
Mining/industrial waste land 0.04
Barren rocky/stony waste/sheet rock area 2.04
Steep sloping area 0.24
Snow covered and/or glacial area 1.76
Total waste land area 20.17
Source NRSA
438 G. Mythili and J. Goedecke

Fig. 15.2 Land degradation hotspots in India. Source Le et al. (2014). Note Land degradationhotspots are colored in red
Table 15.5 Levels of soil erosion of varying severity for India
Severity oferosion
Annual soil lossrange (ton/ha)
The share of the totalaffected area (%)
Annual loss of soil(million tons)
Slight ≤5 24 401
Moderate 5–10 43 1406
High 10–20 24 1610
Very high 20–40 5 640
Severe 40–80 3 666
Very severe ≥80 1 255
Total 4978
Source Singh et al. (1990)
15 Economics of Land Degradation in India 439

year, the country loses 0.8 million tons of nitrogen, 1.8 million tons of phosphorus,and 26.3 million tons of potassium (State of the Environment 2001). The offsiteeffect of erosion is the siltation in the reservoirs. Many reservoirs have sufferedfrom reduced storage capacity due to increasing erosion and deposition. Siltation ofmajor river courses due to excessive silt deposits is observed widely in Bihar andUttar Pradesh since many rivers in these regions are flood-prone. The total areaaffected due to this problem is about 2.73 million ha (Das 1977; Mukherjee et al.1985). The rivers Ganga and Brahmaputra carry the maximum sediment loadannually, about 586 and 470 million tons, respectively. Between 6000 and12,000 million tons of fertile soil are eroded annually and much of it is deposited inthe reservoirs leading to a reduction in their storage capacity by 1–2 % (State of theEnvironment 2001).
Salt-affected soils are widespread in the different agro climatic zones of theIndo-Gangetic Plain. Areas with a mean annual rainfall of more than 600 mm aremostly of alkali soils, while saline soils are dominant in the arid, semiarid, andcoastal regions (State of the Environment 2001). About 7 million ha is salt-affected,of which 2.5 million ha represents the alkali soils in the Indo-Gangetic Plain. Nearly50 % of the canal-irrigated area is affected by salinization and/or alkalisation due toinadequate drainage, inefficient water management and distorted subsidized energypricing (State of the Environment 2001). The regions affected by salinizationcaused by the rise in ground water are Uttar Pradesh, Haryana, Rajasthan,Maharashtra, and Karnataka. Inadequate planning and management of surfaceirrigation systems is the major cause of salinity of canal command area (State of theEnvironment 2001).
Evolution of Land Policies
The land policy is one major factor in the societal efforts to conserve land resources.Looking back, the pre-independence period was characterized by Zamindari andRyotwari systems where the main motive was collecting land revenue or tax fromthe users of the land. In this system many non-cultivating intermediaries emergedand the government did not make any effort to abolish the intermediaries. Hence atthe time of independence, the major challenge was to reform the agrarian structureand this brought about land reforms in the country. Various programs and policiesthat have bearing on land resources is given in Annex Table A.2.
In the subsequent Five Year Plans, land Policy was one of the major compo-nents. It broadly consists of (1) abolition of intermediaries, tenancy Reform andRedistribution of land (1950–72), (2) Bringing uncultivated land under cultivation(1972–85), (3) Water and Soil Conservation efforts (1985–95), and (4) Improveland revenue administration and land entitlement (1995 till date) (Deshpande 2003).The issues in various plan period and policy focus is given in the Annex Table A.3.
Secured land rights gives the cultivator incentives to use the land in such a waythat the long term interest is protected. However the tenancy laws did not meet with
440 G. Mythili and J. Goedecke

success in India as it helped tenants acquire ownership right of only a very smallpercentage of the cultivated area. There were many forms of concealed tenancywhich were difficult to break. If we go through the statistics provided by NationalSample Survey, there was a very sharp reduction in tenancy over time. One factorresponsible for reduction in tenancy was that many land owners evicted theirtenants in response to the tenancy legislation (Deshpande 2003). Even thoughreduction in tenancy is likely to help reduce land degradation, there is no sufficientinformation available to conclude if the land vacated by tenants is put to productiveuse by the land owner or left as fallow land.
In recent land policies, attention was drawn to loss of micronutrient due toirrational and imbalanced use of fertiliser. Rationalising fertiliser subsidies is beingconsidered as one of the objectives in the current policies (Annex Table A.3).
The Impact of Land Degradation
A Survey of Past Studies
In the literature on the costs of land degradation in India, soil loss has been valuedusing productivity approach, preventive cost approach, and replacement costapproach. The productivity approach basically attempts to value through impacts,viz. through productivity loss. Preventive measures are practices such as conser-vation agriculture. The replacement cost is cost of restoration of soil to its originalstate (Mythili 2003).
Econometric techniques have been utilized in a few studies (e.g. Parikh 1989;Parikh and Ghosh 1991) to estimate soil loss by having the yield function asseparable in input response function and soil quality multiplier function. Given ameasurable soil quality multiplier, potential yield value foregone as a result ofdecline in soil quality for a given input bundle can be determined.2 Few studiesestimate benefits from soil conservation through watershed development program interms of productivity gains (e.g. Ninan 2002). This method is known as preventivemethod. However loss of productivity is widely used in the Indian context tomeasure the impact (Mythili 2003).
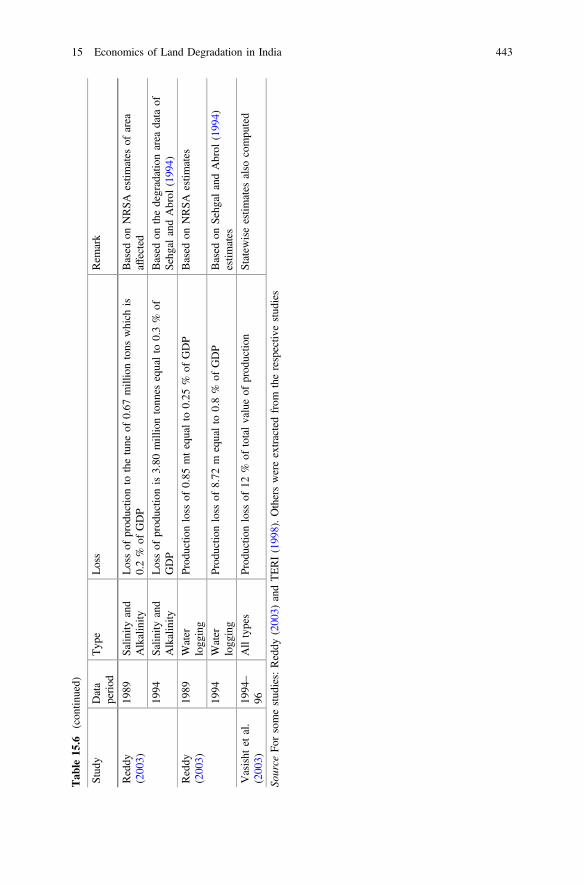
Most of the studies which attempted valuation of degradation failed to recognizethe regional level diversities. According to soil types, black and red soils are morevulnerable to land degradation (Sehgal and Abrol 1994). Loss estimates of somemajor studies are presented in Table 15.6.
Table 15.7 presents state wise estimates of losses due to different types of landdegradation based on soil loss, extracted from the study by Vasisht et al. (2003).About 8 states reported more than 20 % loss in the production due to degradation.
2The farmers’ adaptation mechanism for alteration in the soil quality can also be dealt within themodel.
15 Economics of Land Degradation in India 441

Tab
le15
.6Im
pact
ofsoilerosion,
salin
ityandwater
logg
ingin
India—
areview
Stud
yData
period
Typ
eLoss
Rem
ark
Narayana
andRam
Babu(198
3)
1976
Soilerosion
(water
indu
ced)
Ann
ualloss
ofsoil16
.4tons/ha
Sing
het
al.
(199
0)19
70s
Soilerosion
(water
indu
ced)
Ann
ualloss
ofsoil15
.2tons/ha
Bansil
(199
0)19
86So
ilerosion
(water
indu
ced)
Ann
ualloss
inprod
uctio
nof
major
crop
s13
.5milliontons
(3.1
%of
totalprod
uctio
n)Cov
eragricultu
ralland
,other
non-wasteland
andno
n-forestland
UNDP,
FAO
andUNEP
(199
3)
1993
Soilerosion
(water
indu
ced)
Ann
ualloss
inprod
uctio
n8.2milliontons
(1.7
%of
total
prod
uctio
n)Onlyagricultu
ralland
Sehg
aland
Abrol
(199
4)19
90s
Soilerosion
(water
indu
ced)
Soilprod
uctiv
itydeclinerang
esfrom
12%
indeep
soilto
73%
inshallow
soil
Lossismorein
redandblacksoilas
comparedto
alluvium
derivedsoil
Brand
onet
al.(199
6)19
90s
Soilerosion
Ann
ualloss
of4–6.3%
agricultu
ralprod
uctio
n
UNDP,
FAO
andUNEP
(199
3)
1993
Salin
ity6.2milliontons
ofProd
uctio
nloss
AsperFA
Odata
Sing
h(199
4)19
90s
Salin
ityAbo
ut50
%of
canalirrigatedarea
isaffected
bysalin
ity
Sing
h(199
4)19
90s
Waterlogg
ing
Prod
uctiv
ityloss
rang
ingfrom
40%
forpadd
yto
80%
for
potato
Reddy
(200
3)19
89So
ilerosion
Lossin
term
sof
replacem
entcostrang
efrom
1to
1.7%
ofGDPbasedon
variou
sdata
estim
ates.In
term
sof
prod
uctio
nloss
itis4tim
eshigh
er
Erosion
data
ofNRSA
andARPU
and
Sehg
alandAbrol
(199
4)areused
tofind
costof
erosion
(con
tinued)
442 G. Mythili and J. Goedecke
Tab
le15
.6(con
tinued)
Stud
yData
period
Typ
eLoss
Rem
ark
Reddy
(200
3)19
89Salin
ityand
Alkalinity
Lossof
prod
uctio
nto
thetune
of0.67
milliontons
which
is0.2%
ofGDP
Based
onNRSA
estim
ates
ofarea
affected
1994
Salin
ityand
Alkalinity
Lossof
prod
uctio
nis3.80
milliontonn
esequalto
0.3%
ofGDP
Based
onthedegradationarea
data
ofSehg
alandAbrol
(199
4)
Reddy
(200
3)19
89Water
logg
ing
Prod
uctio
nloss
of0.85
mtequalto
0.25
%of
GDP
Based
onNRSA
estim
ates
1994
Water
logg
ing
Prod
uctio
nloss
of8.72
mequalto
0.8%
ofGDP
Based
onSehg
alandAbrol
(199
4)estim
ates
Vasisht
etal.
(200
3)19
94–
96Alltypes
Prod
uctio
nloss
of12
%of
totalvalueof
prod
uctio
nStatew
iseestim
ates
also
compu
ted
Source
Forsomestud
ies:Reddy
(200
3)andTERI(199
8).Otherswereextractedfrom
therespectiv
estud
ies
15 Economics of Land Degradation in India 443

Methodology of Deriving Costs of Land Degradation
In the present study, the economic impacts of land degradation are calculated usingthe Total Economic Value (TEV) Framework (MEA 2005). TEV approach capturesthe total costs of land degradation more comprehensively (Nkonya et al. 2013). Weuse the data from TEEB database, based on more than 300 case studies around theworld, and use value transfer approach to cover the areas for which the data islacking (Nkonya et al. 2013). The values of the ecosystem services thus obtainedwere used in calculating the Total Economic Value of the economic impacts of landdegradation.
Table 15.7 State-wise estimates of economic losses of land degradation in India
State Degraded land areaa
(1000 ha)Losses due to degradation as % to total value ofproduction
AndhraPradesh
15,662 20
Assam 2807 25
Bihar 6291 14
Gujarat 10,336 22
HimachalPradesh
3008 27
Haryana 1384 15
Jammu &Kashmir
2225 17
Karnataka 7681 18
Kerala 2608 24
Maharashtra 13,328 22
MadhyaPradesh
26,209 20
Orissa 6121 19
Rajasthan 13,586 17
Tamil Nadu 5273 21
Uttar Pradesh 15,253 13
West Bengal 2752 10
Punjab 896 19
All Indiab 187,770 12
Source Vasisht et al. (2003)aBased on the estimate of Sehgal and Abrol (1994)bNational Bureau of Soil Survey and Land Use Planning
444 G. Mythili and J. Goedecke
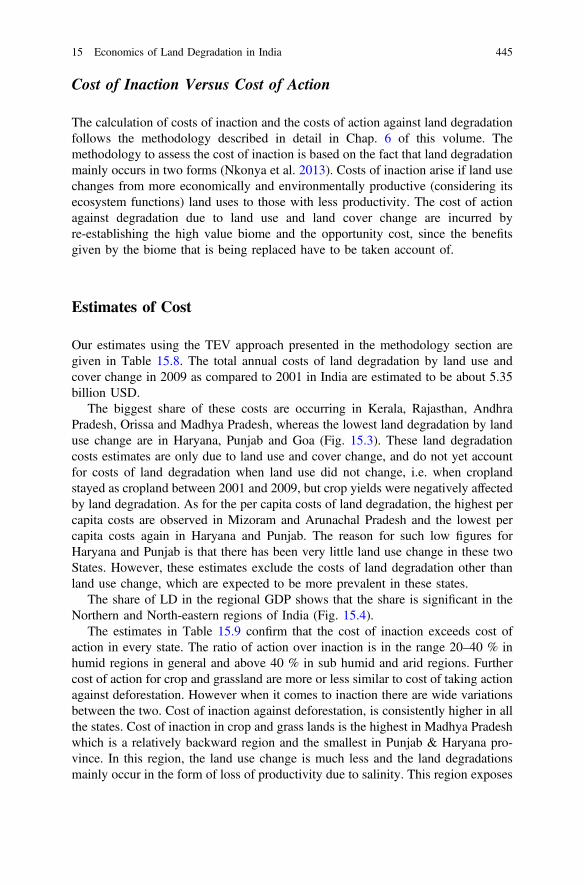
Cost of Inaction Versus Cost of Action
The calculation of costs of inaction and the costs of action against land degradationfollows the methodology described in detail in Chap. 6 of this volume. Themethodology to assess the cost of inaction is based on the fact that land degradationmainly occurs in two forms (Nkonya et al. 2013). Costs of inaction arise if land usechanges from more economically and environmentally productive (considering itsecosystem functions) land uses to those with less productivity. The cost of actionagainst degradation due to land use and land cover change are incurred byre-establishing the high value biome and the opportunity cost, since the benefitsgiven by the biome that is being replaced have to be taken account of.
Estimates of Cost
Our estimates using the TEV approach presented in the methodology section aregiven in Table 15.8. The total annual costs of land degradation by land use andcover change in 2009 as compared to 2001 in India are estimated to be about 5.35billion USD.
The biggest share of these costs are occurring in Kerala, Rajasthan, AndhraPradesh, Orissa and Madhya Pradesh, whereas the lowest land degradation by landuse change are in Haryana, Punjab and Goa (Fig. 15.3). These land degradationcosts estimates are only due to land use and cover change, and do not yet accountfor costs of land degradation when land use did not change, i.e. when croplandstayed as cropland between 2001 and 2009, but crop yields were negatively affectedby land degradation. As for the per capita costs of land degradation, the highest percapita costs are observed in Mizoram and Arunachal Pradesh and the lowest percapita costs again in Haryana and Punjab. The reason for such low figures forHaryana and Punjab is that there has been very little land use change in these twoStates. However, these estimates exclude the costs of land degradation other thanland use change, which are expected to be more prevalent in these states.
The share of LD in the regional GDP shows that the share is significant in theNorthern and North-eastern regions of India (Fig. 15.4).
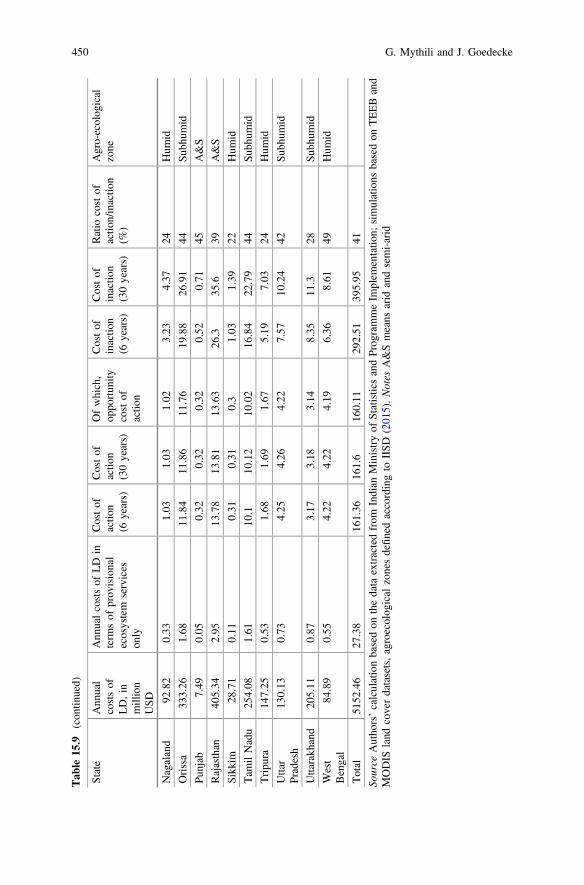
The estimates in Table 15.9 confirm that the cost of inaction exceeds cost ofaction in every state. The ratio of action over inaction is in the range 20–40 % inhumid regions in general and above 40 % in sub humid and arid regions. Furthercost of action for crop and grassland are more or less similar to cost of taking actionagainst deforestation. However when it comes to inaction there are wide variationsbetween the two. Cost of inaction against deforestation, is consistently higher in allthe states. Cost of inaction in crop and grass lands is the highest in Madhya Pradeshwhich is a relatively backward region and the smallest in Punjab & Haryana pro-vince. In this region, the land use change is much less and the land degradationsmainly occur in the form of loss of productivity due to salinity. This region exposes
15 Economics of Land Degradation in India 445
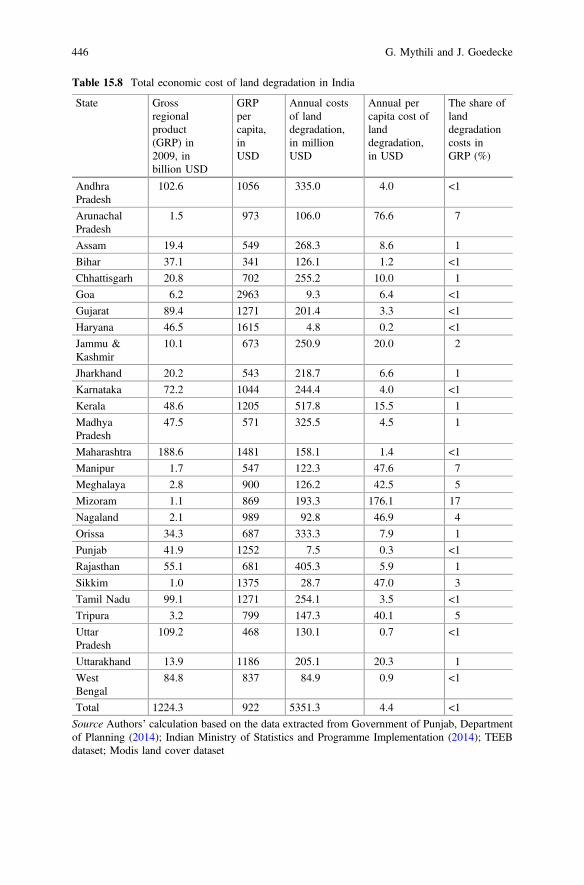
Table 15.8 Total economic cost of land degradation in India
State Grossregionalproduct(GRP) in2009, inbillion USD
GRPpercapita,inUSD
Annual costsof landdegradation,in millionUSD
Annual percapita cost oflanddegradation,in USD
The share oflanddegradationcosts inGRP (%)
AndhraPradesh
102.6 1056 335.0 4.0 <1
ArunachalPradesh
1.5 973 106.0 76.6 7
Assam 19.4 549 268.3 8.6 1
Bihar 37.1 341 126.1 1.2 <1
Chhattisgarh 20.8 702 255.2 10.0 1
Goa 6.2 2963 9.3 6.4 <1
Gujarat 89.4 1271 201.4 3.3 <1
Haryana 46.5 1615 4.8 0.2 <1
Jammu &Kashmir
10.1 673 250.9 20.0 2
Jharkhand 20.2 543 218.7 6.6 1
Karnataka 72.2 1044 244.4 4.0 <1
Kerala 48.6 1205 517.8 15.5 1
MadhyaPradesh
47.5 571 325.5 4.5 1
Maharashtra 188.6 1481 158.1 1.4 <1
Manipur 1.7 547 122.3 47.6 7
Meghalaya 2.8 900 126.2 42.5 5
Mizoram 1.1 869 193.3 176.1 17
Nagaland 2.1 989 92.8 46.9 4
Orissa 34.3 687 333.3 7.9 1
Punjab 41.9 1252 7.5 0.3 <1
Rajasthan 55.1 681 405.3 5.9 1
Sikkim 1.0 1375 28.7 47.0 3
Tamil Nadu 99.1 1271 254.1 3.5 <1
Tripura 3.2 799 147.3 40.1 5
UttarPradesh
109.2 468 130.1 0.7 <1
Uttarakhand 13.9 1186 205.1 20.3 1
WestBengal
84.8 837 84.9 0.9 <1
Total 1224.3 922 5351.3 4.4 <1
Source Authors’ calculation based on the data extracted from Government of Punjab, Departmentof Planning (2014); Indian Ministry of Statistics and Programme Implementation (2014); TEEBdataset; Modis land cover dataset
446 G. Mythili and J. Goedecke

a high level of irrigation and fertiliser use. Since this analysis takes into accountonly land use cover changes, Punjab and Haryana show much less costs of inaction.Goa also shows smaller units of costs of inaction but it has much less activity undercrop and grass lands and it mainly derives its income from tourism.
Loss Due to Rangeland Degradation
With regard to Biomass decline of grazing land for livestock, it is estimated byKwon et al. (Chap. 8 of the book) that 7.70 US million dollars of value (at 2007prices) is lost in milk and meat production due to decline in grass biomass from
Total cost of LD> 300 mln200 - 300 mln100 - 200 mln< 100 mln
Fig. 15.3 Annual costs of land degradation, in million USD. Source Government of Punjab,Department of Planning (2014); Indian Ministry of Statistics and Programme Implementation(2014); TEEB dataset; Modis land cover dataset
15 Economics of Land Degradation in India 447

rangeland degradation.3 Almost 80 % of this decline constitutes loss of milk pro-duction as meat consumption is low in India.
This estimate of total loss of livestock products for India by this study is muchless in comparison with smaller African countries like Ethiopia and Kenya.However this study did not consider the forest lands which are widely used forgrazing in India. In India, about 60 % of livestock grazing area is forest area (Kapuret al. 2010). The loss of rangeland value significantly varies between studies due tovarying methodologies. Mani et al. (2012) reported 3–4 billion dollars of livestockvalue loss at 2010 prices due to grassland degradation.
Ratio cost of LD / GSDP2.2% - 17.5%0.9% - 2.2%0.1% - 0.9%0.0% - 0.1%
Fig. 15.4 The share of annual land degradation costs in regional GDP (thresholds according toquartiles). Source Indian Ministry of Statistics and Programme Implementation; simulations basedon TEEB and MODIS land cover datasets, agroecological zones defined according to IISD (2015)
3Only cattle, buffalo, sheep and goat are considered in this study.
448 G. Mythili and J. Goedecke

Tab
le15
.9Costof
actio
nandinactio
nagainstland
degradation,
bystate(inbillion
USD
)
State
Ann
ual
costsof
LD,in
million
USD
Ann
ualcostsof
LD
interm
sof
prov
isional
ecosystem
services
only
Costof
actio
n(6
years)
Costof
actio
n(30years)
Ofwhich,
oppo
rtun
itycostof
actio
n
Costof
inactio
n(6
years)
Costof
inactio
n(30years)
Ratio
costof
actio
n/inactio
n(%
)
Agro-ecolog
ical
zone
And
hra
Pradesh
334.96
2.29
20.02
20.05
19.88
28.41
38.46
52Su
bhum
id
Arunachal
Pradesh
106.02
0.39
1.46
1.46
1.45
4.09
5.54
26Hum
id
Assam
268.28
1.2
5.4
5.41
5.36
12.06
16.33
33Hum
id
Bihar
126.14
0.74
4.75
4.76
4.72
7.97
10.79
44Hum
id
Chh
attisgarh
255.19
1.31
8.89
8.9
8.83
15.11
20.45
43Su
bhum
id
Goa
9.35
0.04
0.15
0.15
0.15
0.39
0.53
28Hum
id
Gujarat
201.42
1.78
11.94
11.96
11.83
18.18
24.61
49A&S
Haryana
4.75
0.07
0.9
0.9
0.89
1.03
1.39
65A&S
Jammu&
Kashm
ir25
0.94
1.14
2.89
2.9
2.85
9.47
12.82
23A&S
Jharkh
and
218.66
1.07
6.68
6.69
6.63
12.01
16.25
41Su
bhum
id
Karnataka
244.4
1.34
9.08
9.1
9.02
15.22
20.6
44Su
bhum
id
Kerala
517.78
1.87
6.1
6.11
6.06
18.34
24.82
25Hum
id
Madhy
aPradesh
325.53
1.94
15.49
15.51
15.38
23.52
31.84
49Su
bhum
id
Maharashtra
158.15
1.22
11.77
11.78
11.69
15.81
21.4
55Su
bhum
id
Manipur
122.34
0.45
1.63
1.64
1.62
4.53
6.14
27Hum
id
Meghalaya
126.21
0.46
1.49
1.49
1.48
4.52
6.12
24Hum
id
Mizoram
193.25
0.67
2.01
2.01
2.0
6.57
8.9
23Hum
id (con
tinued)
15 Economics of Land Degradation in India 449
Tab
le15
.9(con
tinued)
State
Ann
ual
costsof
LD,in
million
USD
Ann
ualcostsof
LD
interm
sof
prov
isional
ecosystem
services
only
Costof
actio
n(6
years)
Costof
actio
n(30years)
Ofwhich,
oppo
rtun
itycostof
actio
n
Costof
inactio
n(6
years)
Costof
inactio
n(30years)
Ratio
costof
actio
n/inactio
n(%
)
Agro-ecolog
ical
zone
Nagaland
92.82
0.33
1.03
1.03
1.02
3.23
4.37
24Hum
id
Orissa
333.26
1.68
11.84
11.86
11.76
19.88
26.91
44Su
bhum
id
Punjab
7.49
0.05
0.32
0.32
0.32
0.52
0.71
45A&S
Rajasthan
405.34
2.95
13.78
13.81
13.63
26.3
35.6
39A&S
Sikk
im28
.71
0.11
0.31
0.31
0.3
1.03
1.39
22Hum
id
Tam
ilNadu
254.08
1.61
10.1
10.12
10.02
16.84
22.79
44Su
bhum
id
Tripu
ra14
7.25
0.53
1.68
1.69
1.67
5.19
7.03
24Hum
id
Uttar
Pradesh
130.13
0.73
4.25
4.26
4.22
7.57
10.24
42Su
bhum
id
Uttarakh
and
205.11
0.87
3.17
3.18
3.14
8.35
11.3
28Su
bhum
id
West
Bengal
84.89
0.55
4.22
4.22
4.19
6.36
8.61
49Hum
id
Total
5152
.46
27.38
161.36
161.6
160.11
292.51
395.95
41
Source
Autho
rs’calculationbasedon
thedata
extractedfrom
Indian
Ministryof
StatisticsandProg
rammeIm
plem
entatio
n;simulations
basedon
TEEBand
MODIS
land
coverdatasets,agroecolog
ical
zonesdefinedaccordingto
IISD
(201
5).Notes
A&Smeans
arid
andsemi-arid
450 G. Mythili and J. Goedecke

Focus Group Discussions
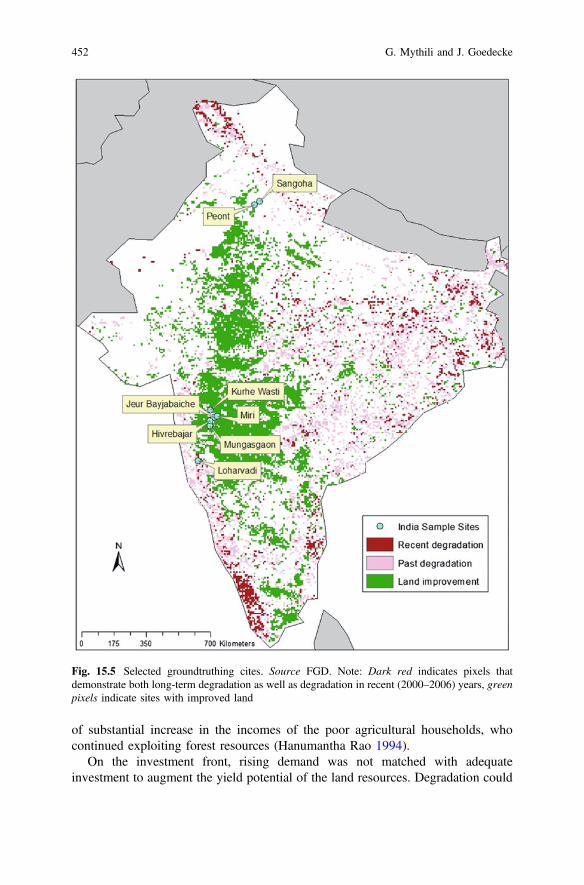
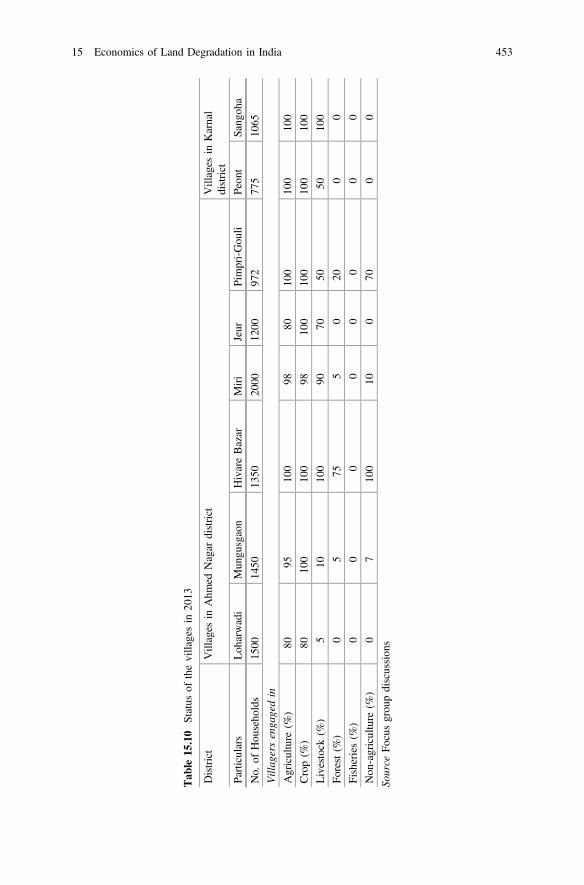
Focus Group Discussions were conducted in 8 villages from 2 districts.Ahmednagar in the western Maharashtra and Karnal in eastern part of Haryana werechosen. They both fall in the Hot semi-arid ecological zone. Six villages wereselected from Ahmednagar and two were selected from Karnal for ground truthingexercise. The villages are depicted in Fig. 15.5. Table 15.10 presents the basicstatistics of the village economy for the year 2013.
The FGD uncovered the following results. As for LUCC, the shrub land andgrass land have come down in Hivare bazar of Ahmednagar, the grass land hasincreased in Karnal in both the villages. The major drivers of land use change arecited as infrastructure development, income increase, easier access to informationtechnology and policies. For Hivare bazar livestock is as important as crops.Livestock population has drastically increased in this region in the last decade andthat could be one reason that the grass land has been over exploited which led to itsfall. This village also actively engaged in non-farm activities. As against this,villages in Haryana mainly depend on agriculture, uses machinery intensively onfarm and as a result, the grassland has not witnessed a fall. About 50 % of thesample villages witnessed moderate to severe deforestation due to expansion ofcropland. Almost 75 % perceived change in attitude towards higher interest inpreserving cultural heritage.
The off-site eco system valuation from the perception of focal group participantsof the village revealed that the benefits far exceed the costs. It was felt that com-munity awareness, governmental policies would help contributing towards con-servation of ecosystem. Many have revealed that they would be willing tocontribute towards provision of any service that would improve their soil quality.
Drivers of Land Degradation
Survey of Literature
In mid-sixties, before the start of the Green revolution, increases in agriculturalproduction in India were mainly achieved through expansion of the cultivated area,usually at the expense of community lands and forests. Since much of the area wasbrought under cultivation, or subject to grazing pressure, soil erosion and degra-dation had been substantial. The later advancements of Green revolution weremostly land saving. Therefore, it was believed that technological innovations willreduce pressure on marginal and sub-marginal lands, and thus, reduce further landdegradation. However, the technological innovations were also capital intensiveand not sufficiently labor-absorbing. Moreover, in many states, real wages eitherremained stagnant or declined between mid-1950s and mid-1970s, leading to lack
15 Economics of Land Degradation in India 451
of substantial increase in the incomes of the poor agricultural households, whocontinued exploiting forest resources (Hanumantha Rao 1994).
On the investment front, rising demand was not matched with adequateinvestment to augment the yield potential of the land resources. Degradation could
Fig. 15.5 Selected groundtruthing cites. Source FGD. Note: Dark red indicates pixels thatdemonstrate both long-term degradation as well as degradation in recent (2000–2006) years, greenpixels indicate sites with improved land
452 G. Mythili and J. Goedecke
Tab
le15
.10
Status
ofthevillagesin
2013
District
Villages
inAhm
edNagar
district
Villages
inKarnal
district
Particulars
Loh
arwadi
Mun
gusgaon
HivareBazar
Miri
Jeur
Pimpri-Gou
liPeon
tSang
oha
No.
ofHou
seho
lds
1500
1450
1350
2000
1200
972
775
1065
Villag
ersenga
gedin
Agriculture
(%)
8095
100
9880
100
100
100
Crop(%
)80
100
100
9810
010
010
010
0
Livestock
(%)
510
100
9070
5050
100
Forest(%
)0
575
50
200
0
Fisheries(%
)0
00
00
00
0
Non
-agriculture
(%)
07
100
100
700
0
Source
Focusgrou
pdiscussion
s
15 Economics of Land Degradation in India 453

be perceived as a consequence of the failure to cope with the rising demand forfood, fodder, fuel wood and other forest products through necessary investment intechnological change and institutional arrangement for managing the resources. Theagrarian change in India is different in different regions and hence problem ofdegradation is different. The regions with intensive cultivation which caused landdegradation problems are, Punjab, Haryana, West Uttar Pradesh, and the deltaicregions of Andhra Pradesh and Tamil Nadu. This region is characterised by moreintensive application of inputs, irrigation, fertiliser and pesticide, HYV seeds andmechanisation. Increasing demand for labour has resulted in higher wages andhence lower poverty. The other extreme is the region with more extension of area toecologically fragile lands ranging from arid and semi-arid zones with low anduncertain rainfall, to hilly areas with assured rainfall. They have comparativeadvantage in animal husbandry, forestry and horticulture. They are characterised byincreasing poverty and pressure for land under cultivation. In between these twotypes lies the majority of area. The progress of irrigation and land augmentingtechnological change is slow. Expansion of area under cultivation is moderate andmechanisation is slow. They exert pressure on common lands.
The existing studies on the link between land degradation and socioeconomicvariables are very few. In fact there is only one systematic attempt on the deter-minants of land degradation in India (Reddy 2003). But this study deals only withdistrict level and state level data and not at the household level. Some empiricalstudies have rejected the direct relation between poverty and resource degradation(Nadkarni 1990; Jodha 1986; Reddy 1999). These studies argue that the poor havegreater motivation to conserve the resource because their livelihood depends on it;they are often victims of degradation and not the cause of degradation.
Reddy (2003) has conducted an empirical exercise using a regression techniqueto find the determinants of degradation at the district level and at the state level. Theproportion of area degraded under various components to the total geographicalarea of the region (Source: NRSA) is the dependent variable. The regressors consistof: Socioeconomic, demographic, technological, institutional and climatic factors.At the district level, the period of analysis is 1986–93, while at the state level, theanalysis was conducted for the 3 periods, 1981–82, 1988–89 and 1986–93. Thestate-wise analysis reveals that land-man ratio (defined as rural population perhectare of net sown area) exerts significantly positive influence on degradation,meaning that higher population pressure on agricultural land is not the cause of landdegradation. The regions of intensive cultivation are actually less prone to degra-dation. In the district level analysis, there were 3 different regressions, one each fortotal degraded, salt affected and water logged area. For the salt affected land,percentage of irrigated area and population density, as expected, imposed a sig-nificantly positive influence; output per hectare imposed a negative influence.
From Reddy’s (2003) analysis it appeared that better carrying capacity of landssupport higher population densities. Hence no direct relationship was revealedbetween poverty and degradation. Per capita income does not exert any influence ondegradation. Output per hectare is inversely related to land degradation indicatingthat regions with higher productive land are less prone to degradation. Rainfall does
454 G. Mythili and J. Goedecke

not have any bearing on degradation. Even the variable on availability of institu-tional credit has no impact on extent of degradation.
From a case study of Maharashtra, Joshi et al. (1996) has found that theinvestment for the mitigation of land degradation always gets the last priority.Farmers are enthusiastically willing to spend family labour time for conservationactivities. It has been found that farmers are rational in following soil conservationmethods. Absence of direct economic benefit results in non-adoption (Chopra1996). The solution here would be the creation of incentives by the state. Most ofthe conservation technologies are capital intensive and hence needs support fromthe state.
Various programs initiated by the government over time have impacted landmanagement directly and indirectly (Annex Table A.3) and studies on impact ofprograms on land management have shown that programs such as WastelandDevelopment Programs and Watershed Development Programs have mitigateddegradation.
Empirical Analysis of Drivers of Land Degradation
We analyse the drivers of land degradation both on the macro (comparing states) aswell as on the micro (comparing households) level. As the results of existingstate-level analyses were based on the data for the period before 2000, it is henceproposed to update the analysis using the data of post 2000 periods. For thispurpose, we have selected 13 states4 of India which have significant land degra-dation due to soil erosion and the time periods are 2000, 2005, 2007 and 2010, theyears for which data are available for soil erosion. The model to estimate follows apanel design and is given by
Ys;t ¼ as þ b1xs;t þ b1zs;t þ es;t ð15:1Þ
where s denotes the observed state and t is the year of observation. Our dependentvariable Y is ‘waste land’ which is the area affected by soil erosion. We regressedthis with the host of influencing agricultural variables captured by the vector x, suchas number of cultivators per unit of area, cropping intensity, fertiliser consumptionor fertiliser subsidy, percentage of irrigated area, and yield. We control for astate-dependent characteristics, GDP, population density, poverty ratio and literacyrate. All the variables except the dummies have been used in logarithmic form inthe estimation.
Additionally to the state-level analysis, we also perform an analysis of drivers ofland degradation at household level. More specifically, the unit of observation is a
4The selected states are: Andhra Pradesh, Bihar, Gujarat, Haryana, Karnataka, Madhya Pradesh(including Chattisgarh), Maharashtra, Orissa, Punjab, Rajasthan, Tamilnadu, Uttar Pradesh andWest Bengal.
15 Economics of Land Degradation in India 455

plot cultivated by a household, where households may own more than one plot. Toachieve this, the Cost of Cultivation Survey (CCS)5 dataset is employed, which isconducted annually, covering 19 Indian states. The dependent variable is the plotlevel of soil erosion perceived by farmers themselves, serving as a proxy for landdegradation, with 4 possible states in ranked order (none, sheet erosion, smallgullies, large gullies). For this reason we regress soil erosion on household char-acteristics and plot specific information in an ordered probit regression framework:
PrðLDtþ 1ij ¼ kÞ ¼ Uðlk � bXt
ijÞ � Uðlk�1 � b0XtijÞ ð15:2Þ
wherei = 1,…, N householdsj = 1,…, Mi plots for the ith householdsk = 1,…, 4 ordered outcomest = 2005 the base yearμ–1 = –∞ and μ4 = ∞
Vector Xij contains socio-demographic characteristics of the household andplot-specific information, which is further explained in the next section.
Data and Variables
For the state-level analysis, information on the extent of wastelands per state wasobtained from various sources, and is measured in 1000 ha.6 The variables con-sidered independent for our purposes can be summarized as follows:
Gross agricultural State Domestic Product per capita: The Gross state DomesticProduct from agriculture and allied activities was considered at the constant pricesof 1999–2000 for this variable. Since the 2010 GSDP was available only at 2004–05 prices, it was converted at 1999–2000 prices using an implicit price deflator.Number of Cultivators per cultivated area: The Number of cultivators per unit ofcultivated area measures the density of farm holdings in the available area. This ismeasured in number of cultivators per 1000 ha.
5Indian Commission for Agricultural Costs and Prices (CACP), Comprehensive Cost ofCultivation scheme for the year 2005–06 and 2006–07, Indian directorate of economics andstatistics, Ministry of Agriculture.6Degraded and wastelands of India, status and spatial distribution, ICAR, 2010; Wastelands Atlasof India by National remote sensing agency, 2000; Degraded and Wastelands of India—Statusand Spatial Distribution, Indian Council of Agricultural Research and National Academy ofAgricultural Sciences, New Delhi, June 2010, website (http://www.icar.org.in/files/Degraded-and-Wastelands.pdf). Wasteland atlas of India by National remote sensing agency, 2005; Statisticsreleased by ministry of rural development, Govt. of India.
456 G. Mythili and J. Goedecke

Fertiliser subsidy: The fertiliser subsidy was available at the national level and itwas allocated using the weights of fertiliser consumption share of the state to the allIndia consumption.Cropping Intensity: The cropping intensity, measured as ratio of gross cropped areaover net sown area, was collected from the database available at Ministry ofagriculture, Government of India.Population density: The population density is measured as population in 1000 km−2
of geographical area of the state.Rural Poverty ratio and the literacy rates: The poverty ratios and the literacy rateshave been interpolated for the study years from the available years. Poverty ratiowas available for the years 1996–97, 2001–02, 2006–07 and 2011–12 whereasliteracy rates were available on the decadal basis for the years 1991, 2001 and 2011.The data were taken from Ministry of Statistics and Programme Implementationand Rural development statistics, National Institute of Rural Development.Yield: The yield of major food grains is the value added in agriculture per hectare ofcultivated area.Percentage of Irrigated area: The percentage of irrigated area has been calculatedby dividing the net irrigated area by net sown area.
To account for spatial differences, dummy variables are used for each region,North, West, East while keeping South as the reference category. Data for alldescribed variables were compiled from different sources.7
For the micro level analysis, several items asked for in the CCS are considered asexplanatory for the extent of soil erosion. Household demographics include highesteducation completed, age, time available for work (all given for head of household),a dummy denoting if the head of household is female, size of the household as wellas proxies for the household’s wealth: the log value of livestock, the number oflivestock and the log value of physical assets. Plot specific information entailsquality of drainage, the number of different crops grown on the plot, the number ofseasons where crops are grown and the total area of the plot, as well as dummies forirrigation, property of land and land use. While those variables are cross sectional asof 2005, the CCS data also includes monthly data on crop inputs between 2005 and2006, where the intensity in the application of organic manure, chemical fertilizers,and pesticides are of interest. Data on agricultural extension, and sources of farmer’sinformation, were not available in the data. To account for correlation in thedependent variable within villages, standard errors are clustered on the village level.
7Source: Yield, The Gross State Domestic Product, Percentage of Irrigated area for the year 2010,Number of Cultivators, Cultivated area and fertiliser consumption has been collected from TheAgriculture statistics at a glance, 2003; 2007, 2010 and 2013. The Irrigated area and the net sownarea for the years 2000, 2005 and 2007 has been taken from Ministry of agriculture, Govt. of India.Whereas the fertiliser subsidy has been taken from: Lok Sabha Unstarred Question No. 2623,dated 23.07.2009, the statistics released by: Lok Sabha Starred Question No. 121, dated on11.3.2005, statistics released by: Lok sabha Unstarred Question No. 2484, dated 10.03.2011 andUnstarred question no. 1810, dated 01.12.2011.
15 Economics of Land Degradation in India 457
Estimation
State Level Analysis
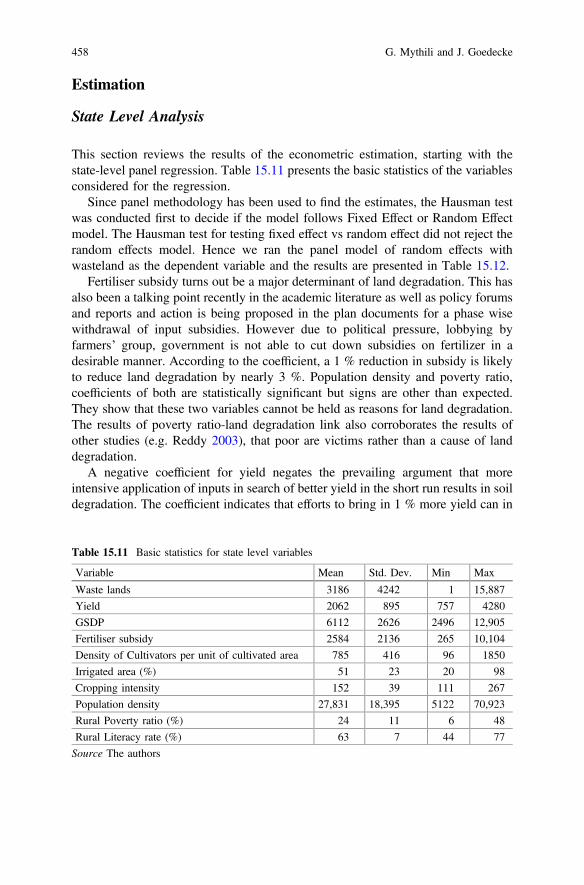
This section reviews the results of the econometric estimation, starting with thestate-level panel regression. Table 15.11 presents the basic statistics of the variablesconsidered for the regression.
Since panel methodology has been used to find the estimates, the Hausman testwas conducted first to decide if the model follows Fixed Effect or Random Effectmodel. The Hausman test for testing fixed effect vs random effect did not reject therandom effects model. Hence we ran the panel model of random effects withwasteland as the dependent variable and the results are presented in Table 15.12.
Fertiliser subsidy turns out be a major determinant of land degradation. This hasalso been a talking point recently in the academic literature as well as policy forumsand reports and action is being proposed in the plan documents for a phase wisewithdrawal of input subsidies. However due to political pressure, lobbying byfarmers’ group, government is not able to cut down subsidies on fertilizer in adesirable manner. According to the coefficient, a 1 % reduction in subsidy is likelyto reduce land degradation by nearly 3 %. Population density and poverty ratio,coefficients of both are statistically significant but signs are other than expected.They show that these two variables cannot be held as reasons for land degradation.The results of poverty ratio-land degradation link also corroborates the results ofother studies (e.g. Reddy 2003), that poor are victims rather than a cause of landdegradation.
A negative coefficient for yield negates the prevailing argument that moreintensive application of inputs in search of better yield in the short run results in soildegradation. The coefficient indicates that efforts to bring in 1 % more yield can in
Table 15.11 Basic statistics for state level variables
Variable Mean Std. Dev. Min Max
Waste lands 3186 4242 1 15,887
Yield 2062 895 757 4280
GSDP 6112 2626 2496 12,905
Fertiliser subsidy 2584 2136 265 10,104
Density of Cultivators per unit of cultivated area 785 416 96 1850
Irrigated area (%) 51 23 20 98
Cropping intensity 152 39 111 267
Population density 27,831 18,395 5122 70,923
Rural Poverty ratio (%) 24 11 6 48
Rural Literacy rate (%) 63 7 44 77
Source The authors
458 G. Mythili and J. Goedecke

fact reduce soil degradation by about 0.9 %. Inclusion of cropping intensity as avariable has helped in holding the intensity of application constant. Hence the otherfactors which help in increasing the yield, namely soil conservation measures, betterirrigation system, etc. gives a negative coefficient for this variable. The number ofcultivators per unit of cultivated area which is a measure of land scarcity, asexpected, shows a positive relation. It indicates that a 1 % increase in this measurewill lead to nearly 0.9 % increase in soil degradation. The rural literacy rate hasgiven a wrong sign as the increase in literacy leads to increased degradation.However this measure is debatable since quality of education in rural areas variessubstantially and is not accounted for in this simple measure of literacy. Variablessuch as Agriculture value added per capita, cropping intensity, percentage of irri-gated area did not give statistically significant coefficients even though they all havetheir expected sign. The agricultural GDP per capita is an indicator for rural growth.Growth versus resource degradation literature debates on Environmental Kuznetscurve (EKC) theory that in the phase of initial growth, more environmental harmwill take place which will slowly decline along the growth path and once thethreshold level is reached, further growth will be environmental friendly. Hence wecan say that the income per capita is yet to reach the threshold level.
Table 15.12 Estimates of random effect model
Explanatory variables Coefficient Z value
Yield −0.8765* −2.68
Fertiliser subsidy 2.937* 8.73
Population density −3.5083* −5.11
Sectoral GDP from agriculture per capita 0.5786 0.63
Density of cultivators 0.9026* 2.22
Cropping intensity 1.3688 1.56
% of irrigated area 0.9326 1.03
Poverty ratio −0.4795 −1.16
Literacy rate 3.9741* 2.02
Dummy variables
Northern 0.1914 0.28
Eastern 1.8706* 2.86
Western −0.8709 −1.54
Constant −6.7865 −0.69
Wald Chi2 153.23*
Observations 52
Source The authorsNote The dependent variable is area affected by soil erosion. All the variables except dummies areexpressed in logarithm. Hence the coefficients directly measure elasticities*Indicates significance at 5 % level
15 Economics of Land Degradation in India 459

The coefficients of regional dummies indicate that, as compared to the southernregion, the northern and eastern regions suffer from more degradation, holdingeverything else constant, and the western region is subject to less land degradation.The northern region allots a larger percentage of land to cereal crops due to which itis likely that over-application of fertilizer and water causes more degradation. Someparts of the eastern region receive a maximum quantum of rainfall. Hence thepossibility of water induced soil erosion is higher in this region if the rainfall is notscattered across region or time.
The Household Plot Level Analysis
This section presents the analysis of drivers of land degradation on the householdlevel as described in the methodology. Since soil erosion induced by water isunambiguously the major symptom of land degradation in India, as shown inTable 15.2, it is regarded as a suitable proxy for land degradation in a broader sense.Table 15.13 displays descriptive statistics of all the variables used in the analysis.
The main results are depicted in Table 15.14, first column. They show that thehigher the frequency of application of organic manure, as well as chemical fertil-izers, the lower the likelihood of soil erosion, given equal characteristics, where theeffects are significant at 1 %. The use of pesticides, in contrast, is found to increasethe occurrence of soil erosion. The number of different crops grown within the timespan of the monthly survey also significantly (p < 0.001) drives the extent of soilerosion. The quality of drainage exposes a U-shaped influence on erosion, where agood drainage system fosters erosion and a mediocre one works against it, com-pared to bad quality drainage. Erosion is rather present on large fields, as shown bythe positive significant coefficient of the plot area. Other variables that are nega-tively associated with erosion are the education dummies (relative to the category“illiterate”) and the time of the household head devoted to work on the parcel.Interestingly, land property is positively associated with soil erosion, which mighthint at a certain degree of insecurity in land tenure.
The second column of Table 15.14 displays results with state fixed effects, whichaccount for some variation. While some variables display lower coefficients, themain explanatory variables, namely application of manure and fertilizer, respec-tively, remain significant in their explanatory power. The last two columns run ausual probit, where erosion is measured with two outcomes, “yes” or “no”,regardless of the extent. The results are qualitatively similar, with the coefficientsfor use of manure and fertilizer still on a high level, while use of pesticides does notsignificantly explain erosion. The positive effect of organic manure application thanthe effect of fertilizer application is stronger in all four specifications. Thus, theapplication of manure seems to be more sustainable way in terms of land conser-vation compared to the utilization of chemical fertilizer or pesticides.
460 G. Mythili and J. Goedecke
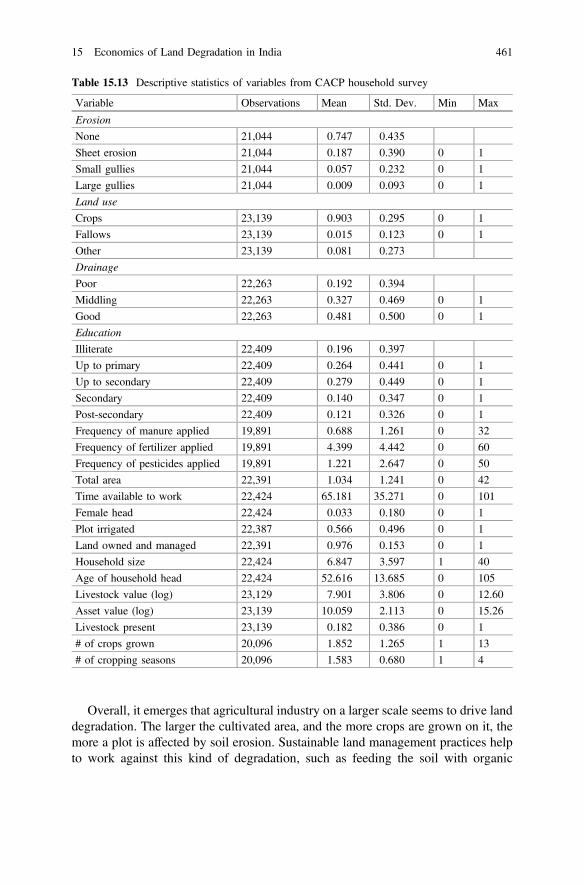
Overall, it emerges that agricultural industry on a larger scale seems to drive landdegradation. The larger the cultivated area, and the more crops are grown on it, themore a plot is affected by soil erosion. Sustainable land management practices helpto work against this kind of degradation, such as feeding the soil with organic
Table 15.13 Descriptive statistics of variables from CACP household survey
Variable Observations Mean Std. Dev. Min Max
Erosion
None 21,044 0.747 0.435
Sheet erosion 21,044 0.187 0.390 0 1
Small gullies 21,044 0.057 0.232 0 1
Large gullies 21,044 0.009 0.093 0 1
Land use
Crops 23,139 0.903 0.295 0 1
Fallows 23,139 0.015 0.123 0 1
Other 23,139 0.081 0.273
Drainage
Poor 22,263 0.192 0.394
Middling 22,263 0.327 0.469 0 1
Good 22,263 0.481 0.500 0 1
Education
Illiterate 22,409 0.196 0.397
Up to primary 22,409 0.264 0.441 0 1
Up to secondary 22,409 0.279 0.449 0 1
Secondary 22,409 0.140 0.347 0 1
Post-secondary 22,409 0.121 0.326 0 1
Frequency of manure applied 19,891 0.688 1.261 0 32
Frequency of fertilizer applied 19,891 4.399 4.442 0 60
Frequency of pesticides applied 19,891 1.221 2.647 0 50
Total area 22,391 1.034 1.241 0 42
Time available to work 22,424 65.181 35.271 0 101
Female head 22,424 0.033 0.180 0 1
Plot irrigated 22,387 0.566 0.496 0 1
Land owned and managed 22,391 0.976 0.153 0 1
Household size 22,424 6.847 3.597 1 40
Age of household head 22,424 52.616 13.685 0 105
Livestock value (log) 23,129 7.901 3.806 0 12.60
Asset value (log) 23,139 10.059 2.113 0 15.26
Livestock present 23,139 0.182 0.386 0 1
# of crops grown 20,096 1.852 1.265 1 13
# of cropping seasons 20,096 1.583 0.680 1 4
15 Economics of Land Degradation in India 461
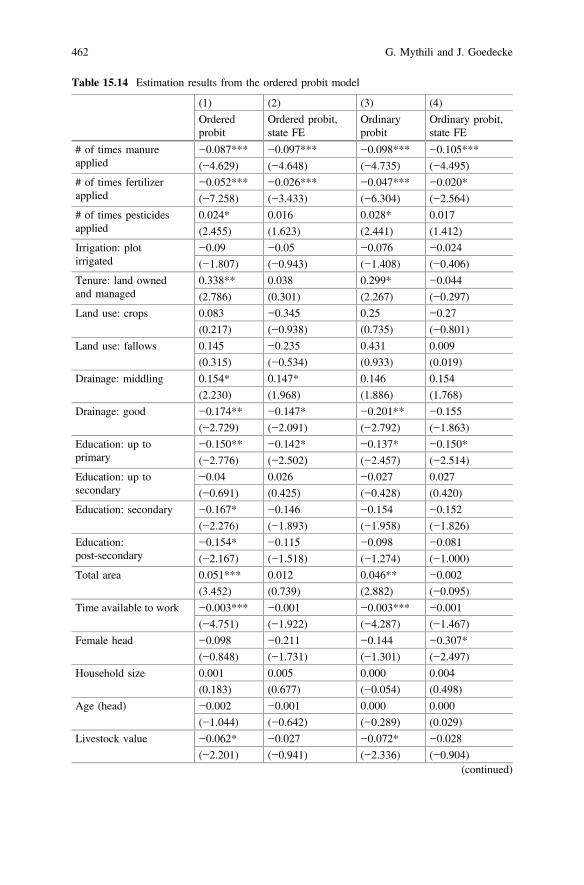
Table 15.14 Estimation results from the ordered probit model
(1) (2) (3) (4)
Orderedprobit
Ordered probit,state FE
Ordinaryprobit
Ordinary probit,state FE
# of times manureapplied
−0.087*** −0.097*** −0.098*** −0.105***
(−4.629) (−4.648) (−4.735) (−4.495)
# of times fertilizerapplied
−0.052*** −0.026*** −0.047*** −0.020*
(−7.258) (−3.433) (−6.304) (−2.564)
# of times pesticidesapplied
0.024* 0.016 0.028* 0.017
(2.455) (1.623) (2.441) (1.412)
Irrigation: plotirrigated
−0.09 −0.05 −0.076 −0.024
(−1.807) (−0.943) (−1.408) (−0.406)
Tenure: land ownedand managed
0.338** 0.038 0.299* −0.044
(2.786) (0.301) (2.267) (−0.297)
Land use: crops 0.083 −0.345 0.25 −0.27
(0.217) (−0.938) (0.735) (−0.801)
Land use: fallows 0.145 −0.235 0.431 0.009
(0.315) (−0.534) (0.933) (0.019)
Drainage: middling 0.154* 0.147* 0.146 0.154
(2.230) (1.968) (1.886) (1.768)
Drainage: good −0.174** −0.147* −0.201** −0.155
(−2.729) (−2.091) (−2.792) (−1.863)
Education: up toprimary
−0.150** −0.142* −0.137* −0.150*
(−2.776) (−2.502) (−2.457) (−2.514)
Education: up tosecondary
−0.04 0.026 −0.027 0.027
(−0.691) (0.425) (−0.428) (0.420)
Education: secondary −0.167* −0.146 −0.154 −0.152
(−2.276) (−1.893) (−1.958) (−1.826)
Education:post-secondary
−0.154* −0.115 −0.098 −0.081
(−2.167) (−1.518) (−1.274) (−1.000)
Total area 0.051*** 0.012 0.046** −0.002
(3.452) (0.739) (2.882) (−0.095)
Time available to work −0.003*** −0.001 −0.003*** −0.001
(−4.751) (−1.922) (−4.287) (−1.467)
Female head −0.098 −0.211 −0.144 −0.307*
(−0.848) (−1.731) (−1.301) (−2.497)
Household size 0.001 0.005 0.000 0.004
(0.183) (0.677) (−0.054) (0.498)
Age (head) −0.002 −0.001 0.000 0.000
(−1.044) (−0.642) (−0.289) (0.029)
Livestock value −0.062* −0.027 −0.072* −0.028
(−2.201) (−0.941) (−2.336) (−0.904)(continued)
462 G. Mythili and J. Goedecke

manure, or usage of a well-working drainage system, which prevents loss of waterand increases water use efficiency. If livestock is held on a plot, this likewise seemsto help the soil recover, possibly because the area is then cultivated less intensively.Some of the results’ magnitude shrink considerably when controlling for stateeffects, which points at systematic differences in the surrounding conditions andagriculture practices across regions. For instance, land tenure exhibits no mean-ingful influence on soil erosion, once state fixed effects are included. This may hintat different legislations regarding land tenure security between states. No effect canbe attributed to irrigation, which means that neither rainfed nor irrigated plots arestronger affected per se, and sustainable land management practices are expected tohave a desired outcome in both.
Table 15.14 (continued)
(1) (2) (3) (4)
Orderedprobit
Ordered probit,state FE
Ordinaryprobit
Ordinary probit,state FE
Asset value 0.036* −0.002 0.044** 0.011
(2.304) (−0.122) (2.624) (0.584)
Livestock present −0.549* −0.269 −0.621* −0.276
(−2.049) (−0.998) (−2.113) (−0.934)
# of crops grown 0.100*** 0.075*** 0.093*** 0.086***
(6.294) (4.532) (5.159) (4.617)
# of cropping seasons −0.041 −0.028 −0.033 −0.022
(−1.138) (−0.717) (−0.830) (−0.479)
Constant −0.528 −0.248
(−1.092) (−0.430)
µ1 0.345 −0.25
(0.700) (−0.423)
µ2 1.289** 0.759
(2.614) (1.277)
µ3 2.252*** 1.746**
(4.540) (2.949)
State fixed effects No Yes No Yes
Observations 16,649 16,649 16,649 16,649
Pseudo R-squared 0.041 0.100 0.048 0.135
Source CACP, calculation by the authorst-statistics shown in parentheses*p < 0.05, **p < 0.01, ***p < 0.001. Standard errors clustered on the village level
15 Economics of Land Degradation in India 463

Concluding Remarks
Understanding the major causes of land degradation is important for findingsolution to mitigate the problem. Our analysis on drivers of land degradation showsthat fertiliser subsidy and decreasing land-man ratio are important reasons forincreasing land degradation. At the household level, the quality of the drainagesystem, as well as application of organic manure may significantly reduce soilerosion. A larger operated area, and a higher number of different crops grown, bothincrease degradation. This hints at sustainable land management practices reducingerosion.
While access to irrigation checks degradation, poor management of irrigationwater itself contributes to degradation. Proper management of irrigation water willgo a long way in controlling degradation. If wastage of water is tackled, it wouldhelp in reducing water logging and salinity problems. Judicious management offorests through the right kind of institutional mechanism would help in checkingwater and wind erosion, which forms a major share of total degradation.
Water and energy are underpriced which leads to inefficient use of land andwater. However, energy pricing is a political pursuit in India. Unless the scarcity ofthe resource is reflected in pricing, overutilization of the resource continues to occurwhich in turn increases degradation. Agricultural extension services is anotherfactor that needs to be strengthened for training the users of the land for theadoption of resource conserving technologies.
Creating awareness and ownership rights for cultivators are important steps inthe challenge of mitigating land degradation. The solution lies in changing thebehaviour of the farmer through the right set of institutional arrangements andmarket based instruments. Identifying all the stakeholders of land improvement,viz. farmers, farm labour, industries and institutions and how they are impacted bythe policies related to the improvement would help in finding a comprehensivesolution. This awaits further analysis.
Acknowledgments We are thankful to Dr. Vijaylaxmi Pandey, IGIDR for useful discussions onan earlier draft, Dr. Nandan Nawn, Indian Society for Ecological Economics and Teri Universityfor helping us in gathering data of Cost of Cultivation Scheme and Ms. Arpita Nehra, formerIntern, IGIDR for her help in collecting data for the state level analysis.
Open Access This chapter is distributed under the terms of the Creative Commons AttributionNoncommercial License, which permits any noncommercial use, distribution, and reproduction inany medium, provided the original author(s) and source are credited.
Annex
(See Tables A.1, A.2 and A.3).
464 G. Mythili and J. Goedecke
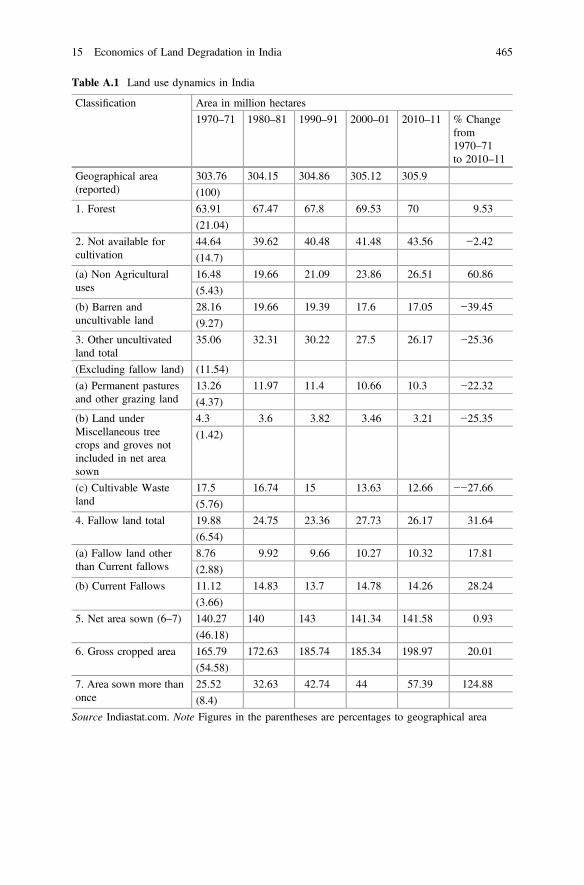
Table A.1 Land use dynamics in India
Classification Area in million hectares
1970–71 1980–81 1990–91 2000–01 2010–11 % Changefrom1970–71to 2010–11
Geographical area(reported)
303.76 304.15 304.86 305.12 305.9
(100)
1. Forest 63.91 67.47 67.8 69.53 70 9.53
(21.04)
2. Not available forcultivation
44.64 39.62 40.48 41.48 43.56 −2.42
(14.7)
(a) Non Agriculturaluses
16.48 19.66 21.09 23.86 26.51 60.86
(5.43)
(b) Barren anduncultivable land
28.16 19.66 19.39 17.6 17.05 −39.45
(9.27)
3. Other uncultivatedland total
35.06 32.31 30.22 27.5 26.17 −25.36
(Excluding fallow land) (11.54)
(a) Permanent pasturesand other grazing land
13.26 11.97 11.4 10.66 10.3 −22.32
(4.37)
(b) Land underMiscellaneous treecrops and groves notincluded in net areasown
4.3 3.6 3.82 3.46 3.21 −25.35
(1.42)
(c) Cultivable Wasteland
17.5 16.74 15 13.63 12.66 −−27.66
(5.76)
4. Fallow land total 19.88 24.75 23.36 27.73 26.17 31.64
(6.54)
(a) Fallow land otherthan Current fallows
8.76 9.92 9.66 10.27 10.32 17.81
(2.88)
(b) Current Fallows 11.12 14.83 13.7 14.78 14.26 28.24
(3.66)
5. Net area sown (6–7) 140.27 140 143 141.34 141.58 0.93
(46.18)
6. Gross cropped area 165.79 172.63 185.74 185.34 198.97 20.01
(54.58)
7. Area sown more thanonce
25.52 32.63 42.74 44 57.39 124.88
(8.4)
Source Indiastat.com. Note Figures in the parentheses are percentages to geographical area
15 Economics of Land Degradation in India 465
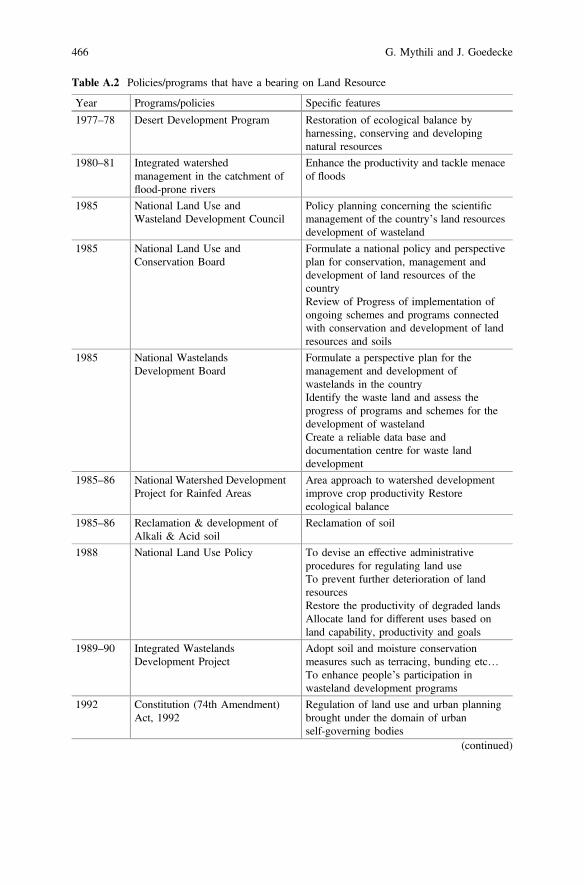
Table A.2 Policies/programs that have a bearing on Land Resource
Year Programs/policies Specific features
1977–78 Desert Development Program Restoration of ecological balance byharnessing, conserving and developingnatural resources
1980–81 Integrated watershedmanagement in the catchment offlood-prone rivers
Enhance the productivity and tackle menaceof floods
1985 National Land Use andWasteland Development Council
Policy planning concerning the scientificmanagement of the country’s land resourcesdevelopment of wasteland
1985 National Land Use andConservation Board
Formulate a national policy and perspectiveplan for conservation, management anddevelopment of land resources of thecountryReview of Progress of implementation ofongoing schemes and programs connectedwith conservation and development of landresources and soils
1985 National WastelandsDevelopment Board
Formulate a perspective plan for themanagement and development ofwastelands in the countryIdentify the waste land and assess theprogress of programs and schemes for thedevelopment of wastelandCreate a reliable data base anddocumentation centre for waste landdevelopment
1985–86 National Watershed DevelopmentProject for Rainfed Areas
Area approach to watershed developmentimprove crop productivity Restoreecological balance
1985–86 Reclamation & development ofAlkali & Acid soil
Reclamation of soil
1988 National Land Use Policy To devise an effective administrativeprocedures for regulating land useTo prevent further deterioration of landresourcesRestore the productivity of degraded landsAllocate land for different uses based onland capability, productivity and goals
1989–90 Integrated WastelandsDevelopment Project
Adopt soil and moisture conservationmeasures such as terracing, bunding etc…To enhance people’s participation inwasteland development programs
1992 Constitution (74th Amendment)Act, 1992
Regulation of land use and urban planningbrought under the domain of urbanself-governing bodies
(continued)
466 G. Mythili and J. Goedecke
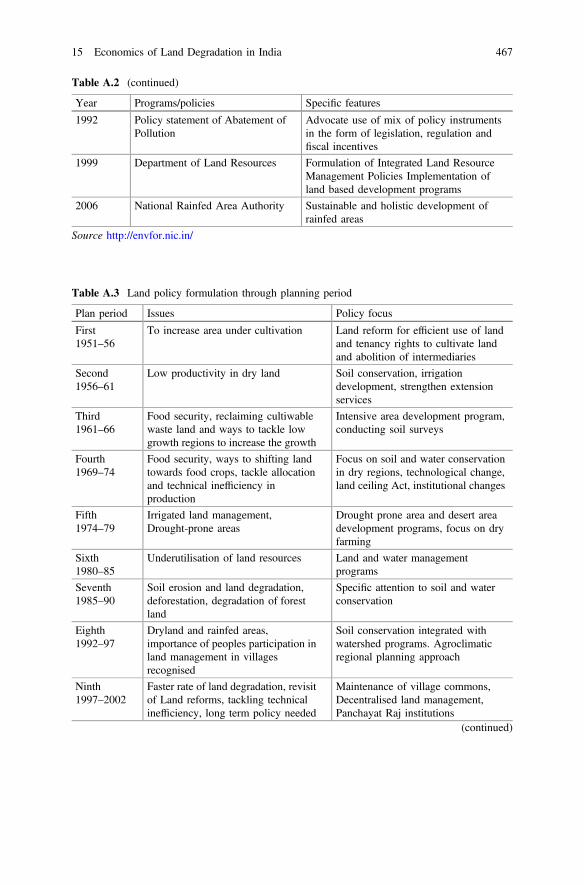
Table A.2 (continued)
Year Programs/policies Specific features
1992 Policy statement of Abatement ofPollution
Advocate use of mix of policy instrumentsin the form of legislation, regulation andfiscal incentives
1999 Department of Land Resources Formulation of Integrated Land ResourceManagement Policies Implementation ofland based development programs
2006 National Rainfed Area Authority Sustainable and holistic development ofrainfed areas
Source http://envfor.nic.in/
Table A.3 Land policy formulation through planning period
Plan period Issues Policy focus
First1951–56
To increase area under cultivation Land reform for efficient use of landand tenancy rights to cultivate landand abolition of intermediaries
Second1956–61
Low productivity in dry land Soil conservation, irrigationdevelopment, strengthen extensionservices
Third1961–66
Food security, reclaiming cultiwablewaste land and ways to tackle lowgrowth regions to increase the growth
Intensive area development program,conducting soil surveys
Fourth1969–74
Food security, ways to shifting landtowards food crops, tackle allocationand technical inefficiency inproduction
Focus on soil and water conservationin dry regions, technological change,land ceiling Act, institutional changes
Fifth1974–79
Irrigated land management,Drought-prone areas
Drought prone area and desert areadevelopment programs, focus on dryfarming
Sixth1980–85
Underutilisation of land resources Land and water managementprograms
Seventh1985–90
Soil erosion and land degradation,deforestation, degradation of forestland
Specific attention to soil and waterconservation
Eighth1992–97
Dryland and rainfed areas,importance of peoples participation inland management in villagesrecognised
Soil conservation integrated withwatershed programs. Agroclimaticregional planning approach
Ninth1997–2002
Faster rate of land degradation, revisitof Land reforms, tackling technicalinefficiency, long term policy needed
Maintenance of village commons,Decentralised land management,Panchayat Raj institutions
(continued)
15 Economics of Land Degradation in India 467
References
Bansil, P. C. (1990). Agricultural statistical compendium (Vol. 1). New Delhi: Techno-economicResearch Institute.
Brandon, C. & Hommann, K. (1996). The cost of inaction: valuing the economy-wide cost ofenvironmental degradation in India, UNU/IAS Working paper No. 9.
Chopra, K. (1996). The management of degraded land: issues and an analysis of technological andinstitutional solutions. Indian Journal of Agricultural Economics, 51, 1–2.
Das, D. C. (1977). Soil conservation practices and erosion control in India—a case study. FAOSoils Bulletin, 33, 11–50.
Deshpande, R. S. (2003). Current land policy Issues in India. In Land Reform: Land Settlementand Cooperatives. Rural Development Division, FAO.
Government of Punjab, Department of Planning (2014). State-wise statistics 2009–2011. http://pbplanning.gov.in/pdf/Statewise%20GSDP%20PCI%20and%20G.R.pdf. Accessed December2014.
Hanumantha Rao, C. H. (1994). Agricultural growth, rural poverty and environmentaldegradation in India. Oxford: Oxford University Press.
IISD. (2015). Arid and semi-arid lands: Characteristics and importance. http://www.iisd.org/casl/asalprojectdetails/asal.htm. Accessed December 2014.
Indian Ministry of Statistics and Programme Implementation (2014). Gross state domesticproducts. http://mospi.nic.in/Mospi_New/upload/State_wise_SDP_2004-05_14mar12.pdf.Accessed December 2014.
Jodha, N. S. (1986). Common property resources and rural poor in dry regions of India. Economicand Political Weekly, 21(27), 1169–1181.
Joshi, P. K., Wani, S. P., Chopde, V. K., & Foster, J. (1996). Farmers’ perception of landdegradation: A case study. Economic and Political Weekly, 31(26), A89–A92.
Kapur, D., Ravindranath, D., Kishore, K., Sandeep, K., Priyadarshini, P., Kavoori, P. S., & Sinha,S. (2010). A commons story. The Rain Shadow of Green Revolution. FES.
Le Q. B., Nkonya, E., & Mirzabaev, A. (2014). Biomass productivity-based mapping of globalland degradation hotspots, ZEF Discussion Paper on Development Policy No. 193, Centre forDevelopment Research, University of Bonn.
Mani, M., Markandya, A, Sagar, A., & Strukova, E. (2012). An analysis of physical and monetarylosses of environmental health and natural resources in India, Policy Research Working PaperNo. 6219. The World Bank.
MEA (Millenium Ecosystem Assessment). (2005). Dryland Systems. In R. Hassan, R. Scholes, &N. Ash (Eds.), Ecosystem and well-being: Current state and trends (pp. 623–662).Washington, DC: Island Press.
Table A.3 (continued)
Plan period Issues Policy focus
Tenth2002–2007
Groundwater depletion and waterlogging
Rainwater harvesting, groundwaterrecharging measures and controllinggroundwater exploitation, treatmentof waterlogged areas
Eleventh2007–2012
In addition to erosion, salinity andalkalinity, soils losing soil carbon andmicronutrients due to irrational andunbalanced fertilizer use
Rationalise subsidies across nutrients,reform delivery method of subsidies,agriculture extension
Source Deshpande (2003) and five year plan documents
468 G. Mythili and J. Goedecke

Mukherjee, B. K., Das, D. C., Singh, Shamsher, Prasad, C. S., & Samuel, J. C. (1985). Statistics:Soil and water conservation-watershed management, land resources and landReclamation-soil and water conservation division. GOI, New Delhi: Ministry of Agricultureand Rural Development.
Mythili, G. (2003). Land degradation due to agriculture. In Envisage Newsletter, EnvironmentalEconomics Node, Madras School of Economics, 2(1), 1–7.
Nadkarni, M. V. (1990). Use and management of Common lands: Towards an EnvironmentallySound Strategy. In C. J. Saldanha (Ed.), Karnataka: State of the Environment Report IV, centrefor Taxonomic Studies, Bangalore.
Narayana, V. V. D., & Babu, Ram. (1983). Estimation of soil erosion in India. Journal ofIrrigation and Drainage Engineering, 109(4), 419–434.
Ninan, K. N. (2002). Watershed development programs in India: A review. Paper Presented at the12th ISCO Conference, Beijing, 2002.
Nkonya, E., Gerber, N., Von Braun J., & De Pinto, A. (2011). Economics of land degradation: Thecosts of action versus inaction. International Food Policy Research Institute Brief 68, IFPRIand ZEF, Bonn.
Nkonya, E., von Braun, J., Mirzabaev, A., Le, Q. B. Kwon H. Y. & Kirui, O. (2013). Economicsof land degradation initiative: Methods and approach for global and national assessments. ZEFDiscussion Papers 183.
Parikh, K. S. (1989). An operational measureable definition of sustainable development, IndiraGandhi Institute of Development Research, Discussion paper No. 21.
Parikh, K. S. & Ghosh, U. (1991). Natural resource accounting for soils: Towards an empiricalestimate of costs of soil degradation in India. Indira Gandhi Institute of Development ResearchDiscussion Paper No. 48.
Ratna, Reddy V. (1999). Valuation of renewable natural resource: User perspective. Economic andPolitical Weekly, 34(23), 1435–1444.
Reddy, V. R. (2003). Land degradation in India: Extent, costs and determinants. Economic andPolitical Weekly, 38(44), 4700–4713.
Sehgal, J., & Abrol, I. P. (1994). Soil degradation in India: Status and impact. Oxford: Oxford andIBH.
Singh, N. T. (1994). Land degradation and remedial measures with reference to salinity, alkalinity,waterlogging and acidity. In D. L. Deb (Ed.), Natural resource management for sustainableagriculture and environment (pp. 109–142), Noida, India.
Singh, G., Babu, R., Bhushan, N., & Abrol, I. P. (1990). Soil erosion rates in India. Journal of Soiland Water Conservation, 47(1), 97–99.
State of the Environment India. (2001). Land degradation, Part III http://envfor.nic.in/sites/default/files/soer/2001/soer.html. Accessed February 2014.
TEEB (The Economics of Ecosystems and Biodiversity). (2010). Mainstreaming the economics ofnature: A synthesis of the approach. Malta: Conclusions and Recommendations of TEEB.
TERI. (1998). Green India 2047: Looking Back to Think Ahead. In R. K. Pachauri, &P. V. Sridharan (Eds.), Tata energy research Institute, New Delhi.
UNDP, FAO and UNEP. (1993). Land degradation in South Asia: Its severity, causes and effectsupon the people. Rome: FAO, World Soil Research Report No. 78.
Vasisht, A. K., Singh, R. P., & Mathur, V. C. (2003). Economic implications of land degradationon sustainability and food security in India. Agropedology, 13(2), 19–27.
von Braun, J., Gerber, N., Mirzabaev, A., & Nkonya, E. (2013). The economics of landdegradation. An Issue Paper for Global Soil Week. Berlin, Germany 08–22 November, 2012.
15 Economics of Land Degradation in India 469


![Land degradation [autosaved]](https://static.fdocuments.in/doc/165x107/55871382d8b42ae2508b45bf/land-degradation-autosaved.jpg)