
Chapter 14assets.press.princeton.edu/links/kricher/slides/chap14.pdfChapter 14 Forest Fragmentation...
24
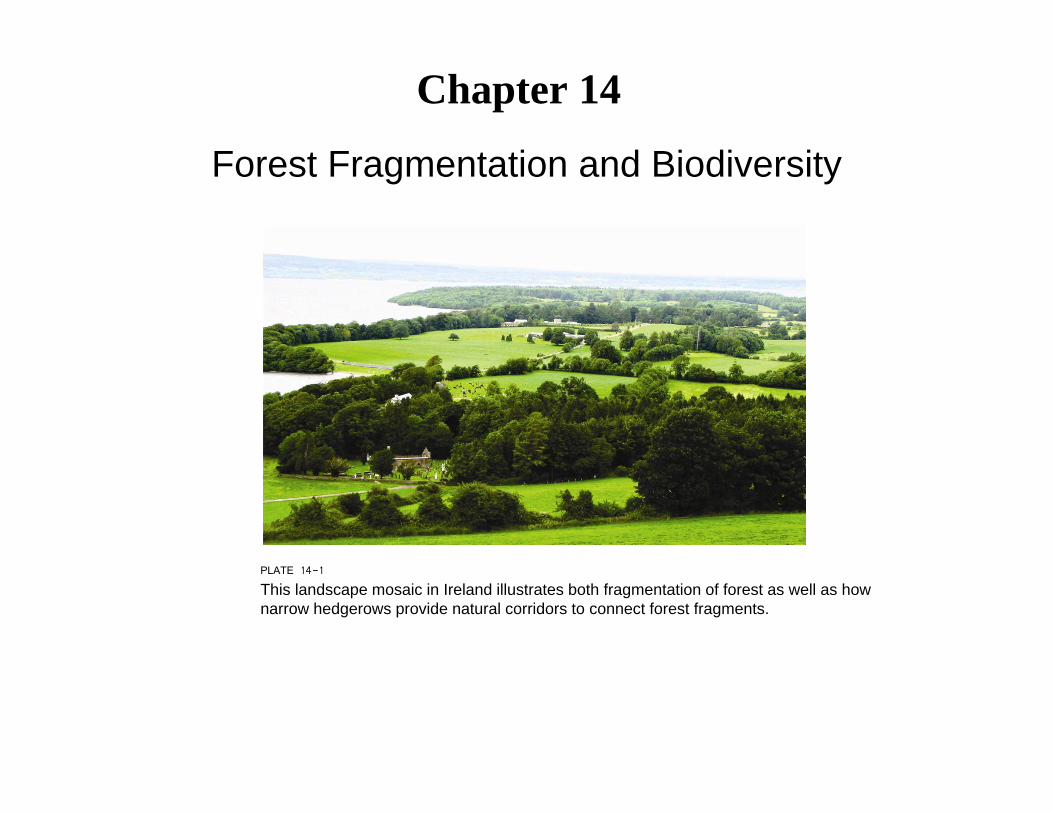
Chapter 14 Forest Fragmentation and Biodiversity PLATE 14-1 This landscape mosaic in Ireland illustrates both fragmentation of forest as well as how narrow hedgerows provide natural corridors to connect forest fragments.
-
Upload
phungnguyet -
Category
Documents
-
view
218 -
download
3
Transcript of Chapter 14assets.press.princeton.edu/links/kricher/slides/chap14.pdfChapter 14 Forest Fragmentation...
Chapter 14
Forest Fragmentation and Biodiversity
PLATE 14-1
This landscape mosaic in Ireland illustrates both fragmentation of forest as well as how narrow hedgerows provide natural corridors to connect forest fragments.

PLATE 14-2
This photograph was taken near Alta Floresta, Brazil. The foreground shows essentially total deforestation. Forest remnants are barely visible in the distance. The dense haze is smoke from fires set to burn the slash.
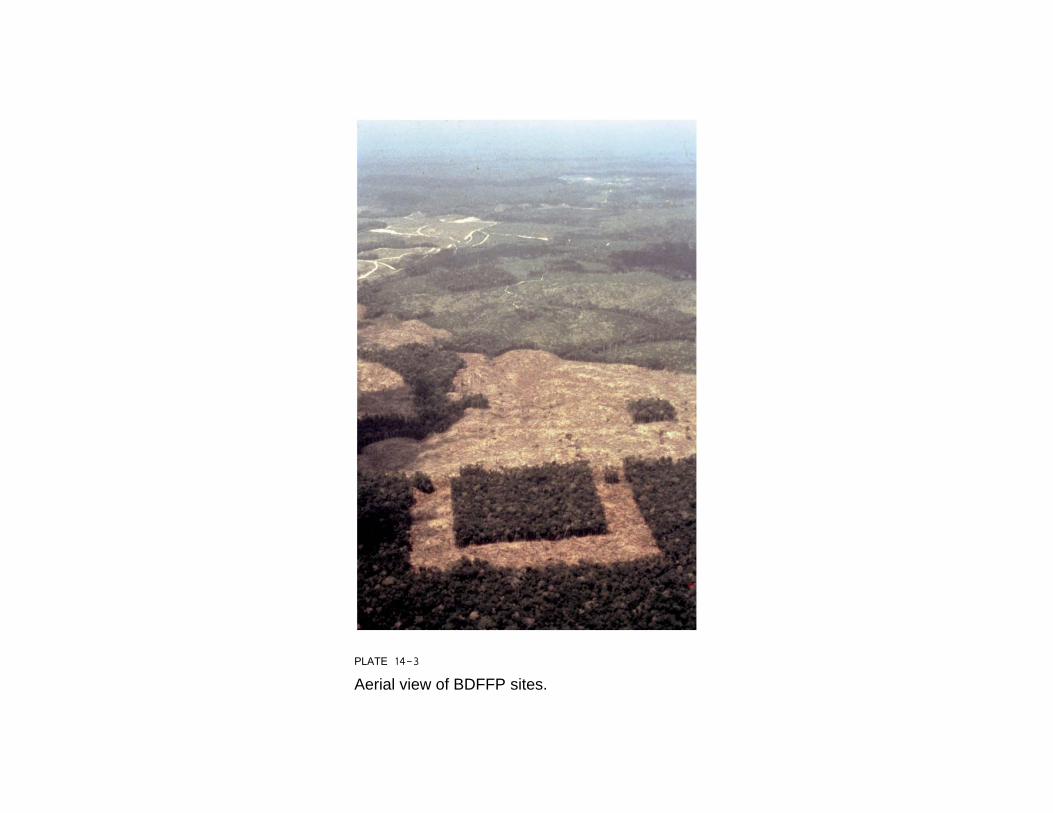
PLATE 14-3
Aerial view of BDFFP sites.
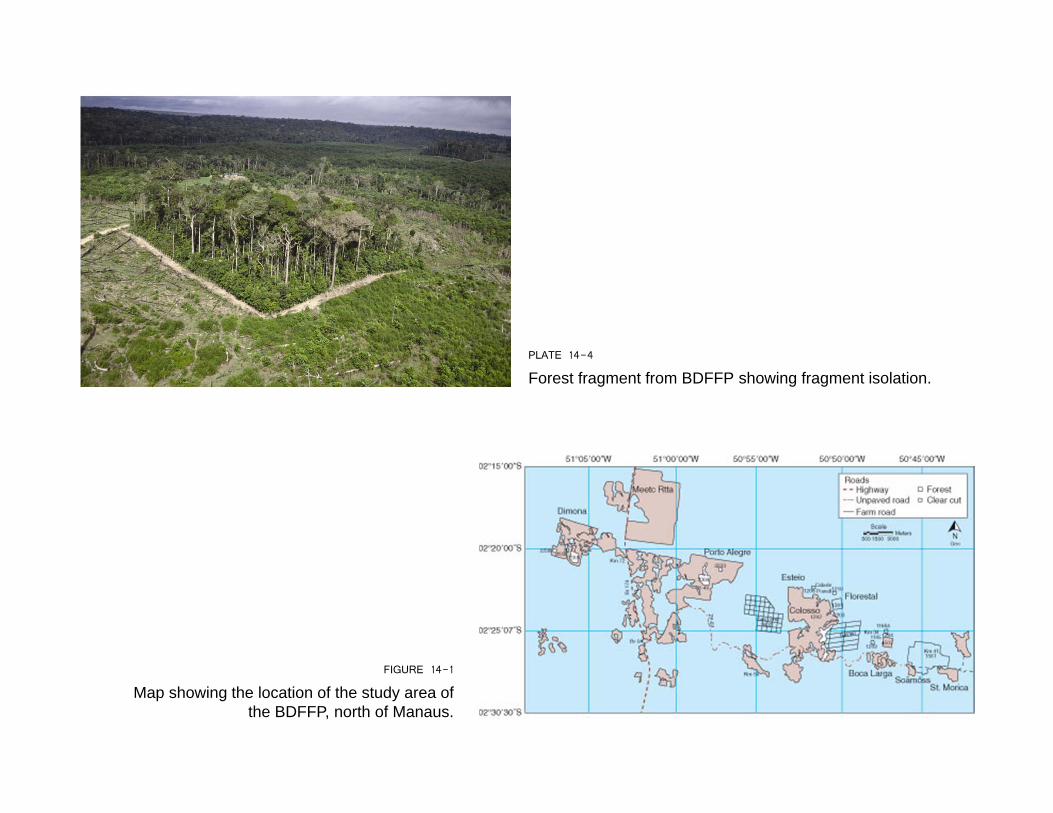
PLATE 14-4
Forest fragment from BDFFP showing fragment isolation.
FIGURE 14-1
Map showing the location of the study area of the BDFFP, north of Manaus.
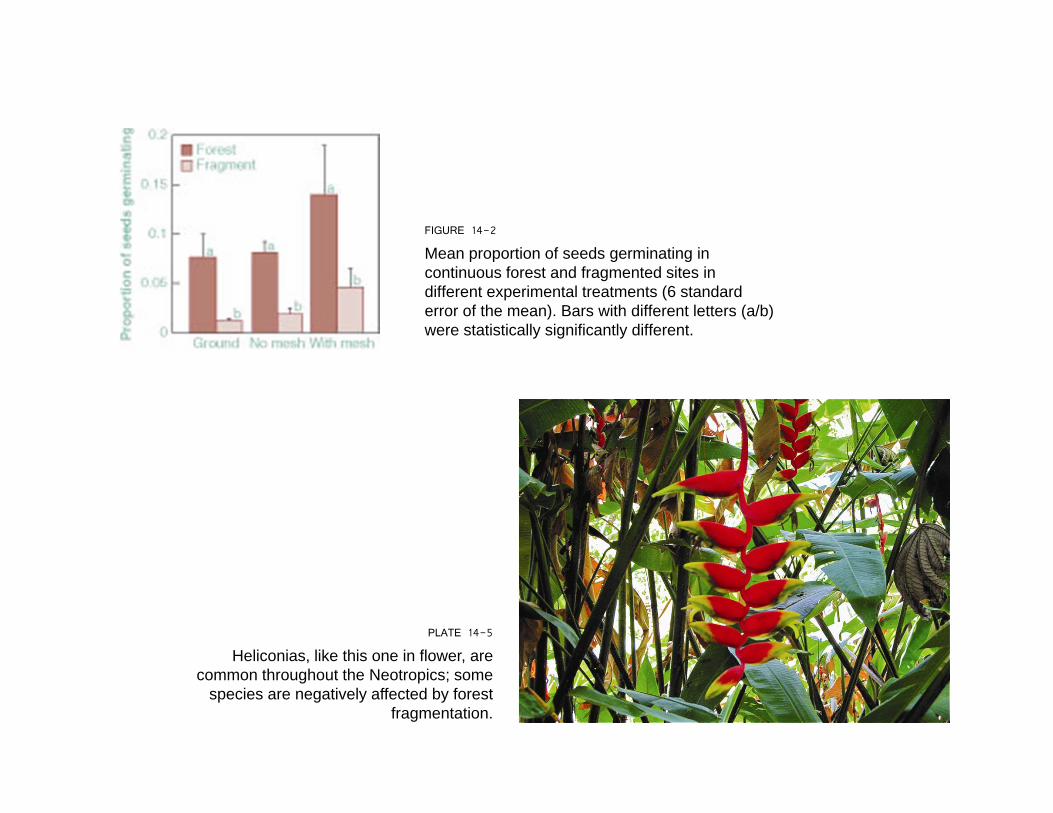
FIGURE 14-2
Mean proportion of seeds germinating in continuous forest and fragmented sites in different experimental treatments (6 standard error of the mean). Bars with different letters (a/b) were statistically significantly different.
PLATE 14-5
Heliconias, like this one in flower, are common throughout the Neotropics; some
species are negatively affected by forest fragmentation.
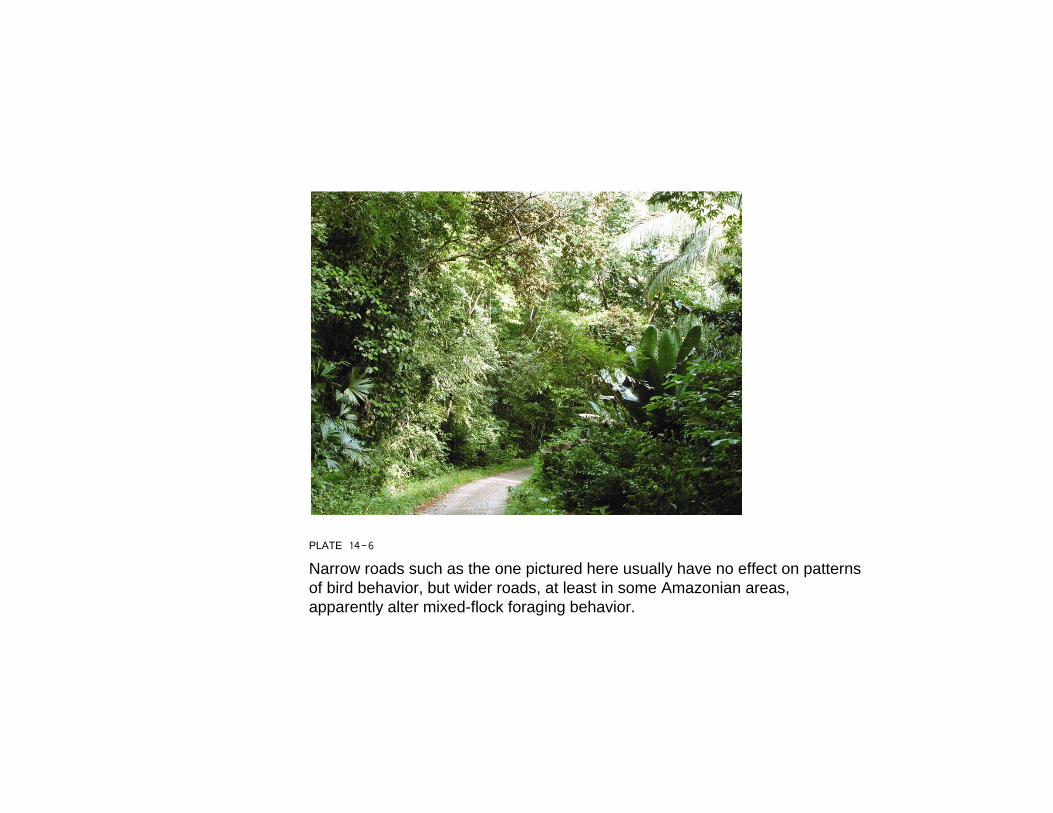
PLATE 14-6
Narrow roads such as the one pictured here usually have no effect on patterns of bird behavior, but wider roads, at least in some Amazonian areas, apparently alter mixed-flock foraging behavior.

FIGURE 14-3
The residual bird species richness (B) increases significantly with the annual woody increment (AWI). If all of the islands where AWI
was measured (n + 9 islands) are included, the relationship is described by the linear function B + 0.2 + 20.1(AWI) (solid line; r2 + 0.48, P < 0.05). If Facil and Colon islands are excluded as outliers,
the relationship is significantly improved (dotted line, B = 1.3 + 20.9[AWI]; r2 = 0.94, P < 0.0005).
PLATE 14-7
(a) The black-throated antshrike (Frederickena viridis) (female shown in photo) is an obligate forest interior species and poor colonizer. (b) The barred antshrike (Thamnophilus doliatus) is a widespread species that thrives in disturb ed successional areas and along edges of forests. It is not sensitive to fragmentation.
(a)
(b)

PLATE 14-8
LAGO GURI ISLANDS

PLATE 14-9
Agoutis became more abundant on medium-sized islands in the absence of predators.

FIGURE 14-4
Density of successional trees as a function of distance from forest edge (note the log scale), in 66 1-hectare plots in intact forest and
in 9 forest fragments ranging from 13 to 17 years old. The relationship is highly significant (rs = 20.393, n = 66, P = 0.001;
Spearman rank correlation).
PLATE 14-10
Cecropia trees are among the most aggressive colonizers along edges.
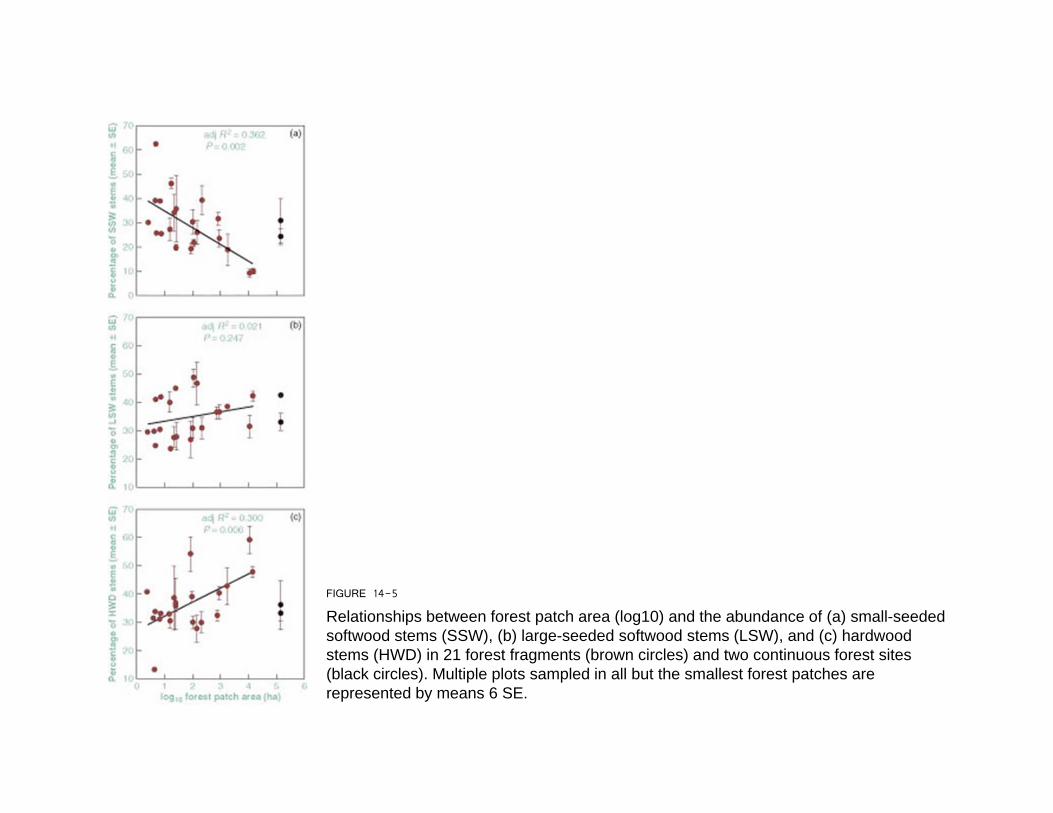
FIGURE 14-5
Relationships between forest patch area (log10) and the abundance of (a) small-seeded softwood stems (SSW), (b) large-seeded softwood stems (LSW), and (c) hardwood stems (HWD) in 21 forest fragments (brown circles) and two continuous forest sites (black circles). Multiple plots sampled in all but the smallest forest patches are represented by means 6 SE.

FIGURE 14-6
The death of a forest. Forest edges at three different stages after isolation. (a) Recent cutover area shows abrupt forest edge subjected to lateral winds and light penetration that allow for significant microclimatic changes inside the forest edge. (b) After several years of isolation, regenerating vegetation is found along the forest border and in the understory, closing the edge. In a landscape with low matrix harshness, this edge will be maintained (and could expand outward), buffering the forest interior from the severity of the initial edge effects. (c) In landscapes with high matrix harshness, the process of forest regeneration along the edge breaks down, resulting in greater penetration of edge effects and a gradually receding edge. The original edge will be replaced by scrubby vegetation, eventually leading to vanishing reserves.
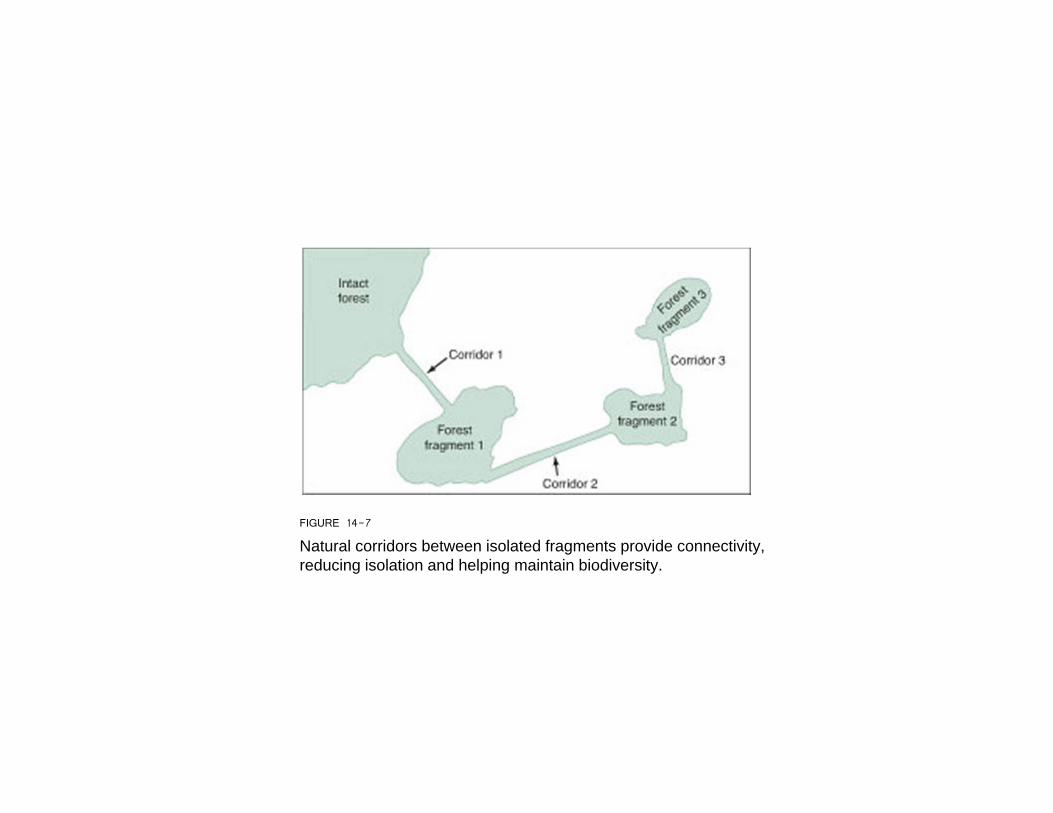
FIGURE 14-7
Natural corridors between isolated fragments provide connectivity, reducing isolation and helping maintain biodiversity.
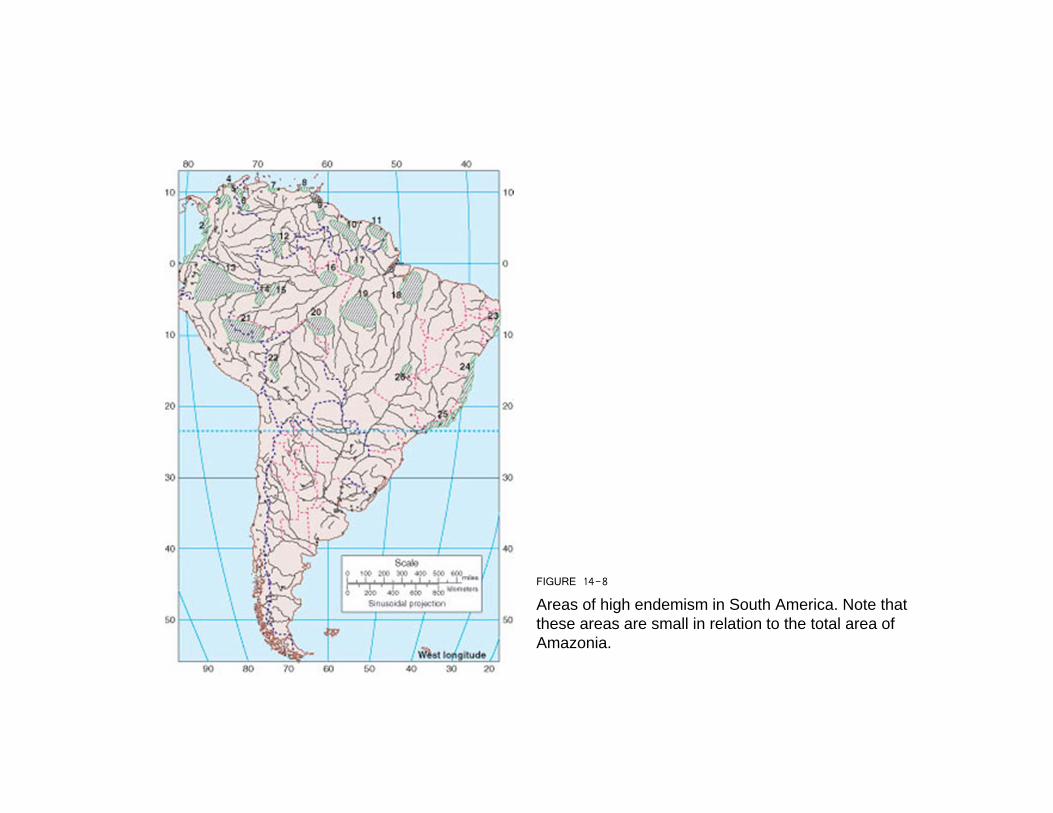
FIGURE 14-8
Areas of high endemism in South America. Note that these areas are small in relation to the total area of Amazonia.
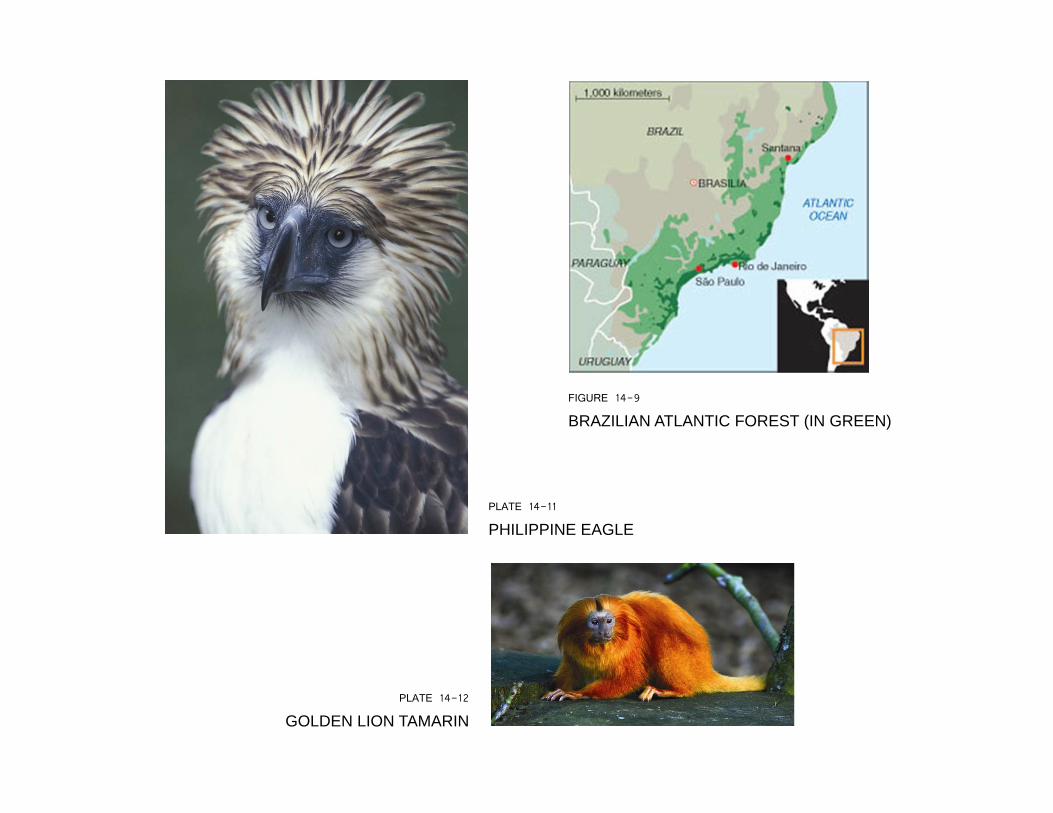
PLATE 14-12
GOLDEN LION TAMARIN
FIGURE 14-9
BRAZILIAN ATLANTIC FOREST (IN GREEN)
PLATE 14-11
PHILIPPINE EAGLE
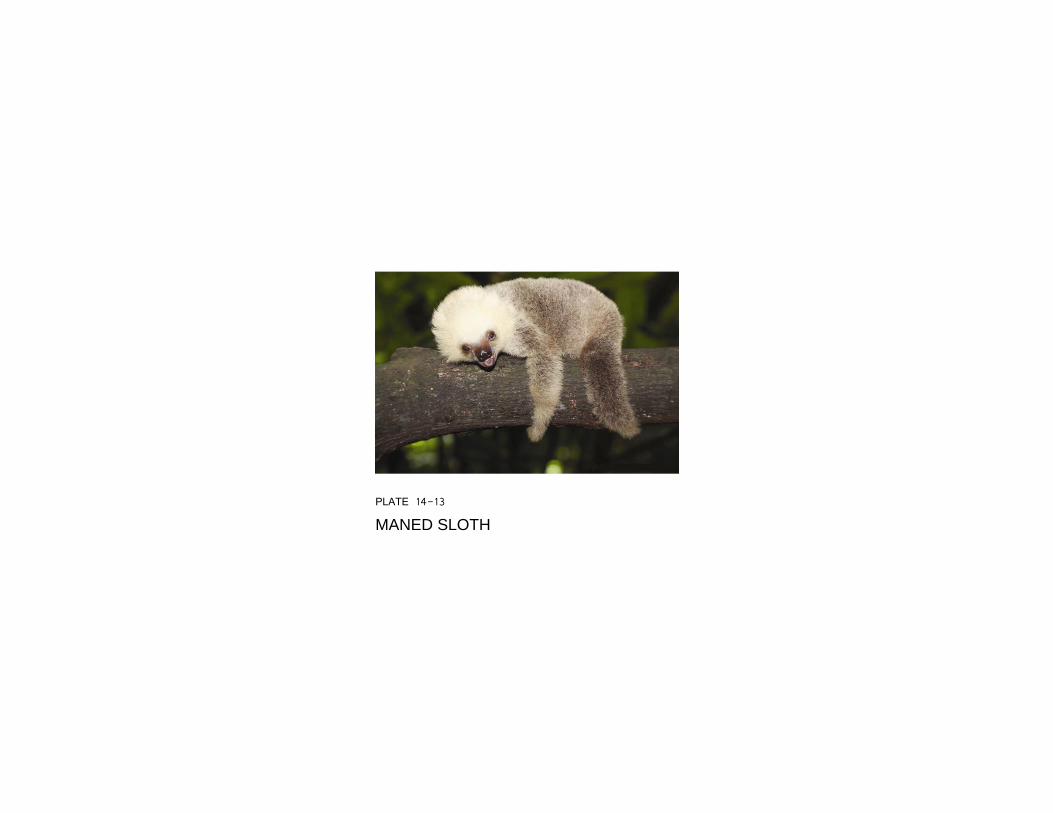
PLATE 14-13
MANED SLOTH

FIGURE 14-10
Hypothesized mechanisms involved in biodiversity experiments using synthetic communities. Sampling effects are involved in community assembly, such that communities that have more species have a greater probability of containing a higher phenotypic trait diversity. Phenotypic diversity then maps onto ecosystem processes through two main mechanisms: dominance of species with particular traits, and complementarity among species with different traits. Intermediate scenarios involve complementarity among particular species or functional groups or, equivalently, dominance of particular subsets of complementary species.

FIGURE 14-11
Relationship between flying fox abundance and median proportion of diaspores dispersed > 5 meters at each site in Vava’u (Tonga, Polynesia). Lines are fitted separately to the data points above and below the threshold flying fox abundance required for them to function as seed dispersers of large fruit. Points of the same shape and fill represent repeat visits to the same site.
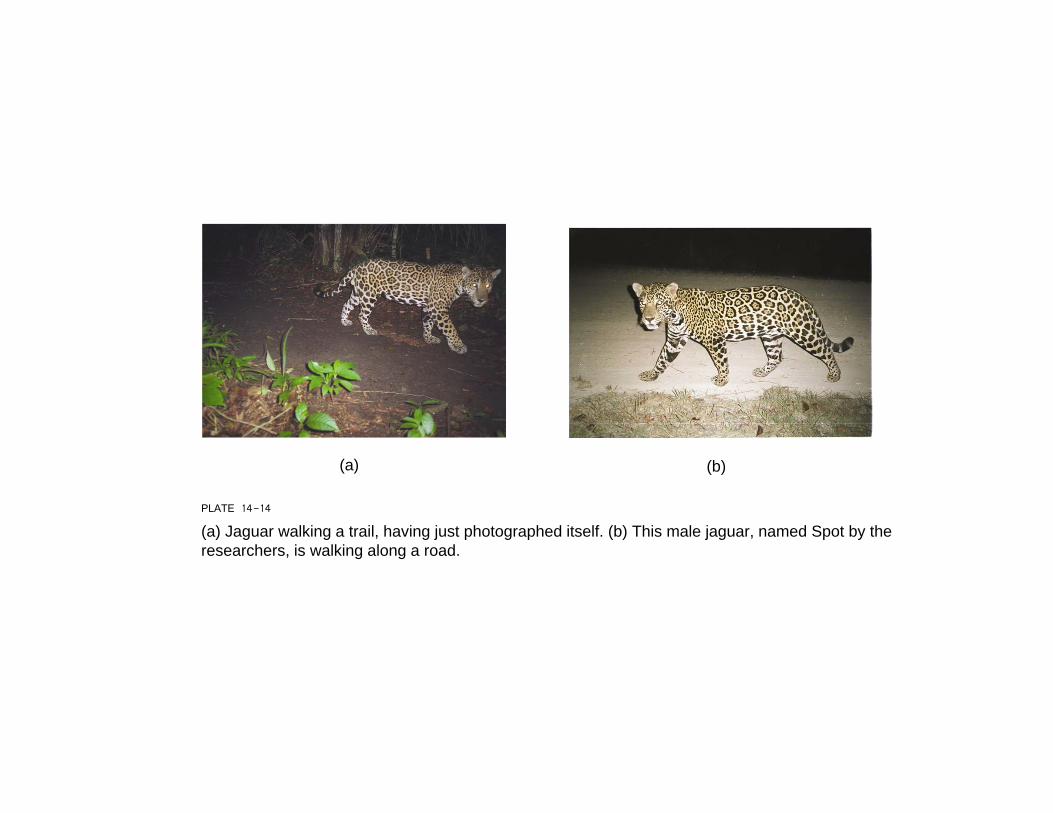
PLATE 14-14
(a) Jaguar walking a trail, having just photographed itself. (b) This male jaguar, named Spot by the researchers, is walking along a road.
(a) (b)
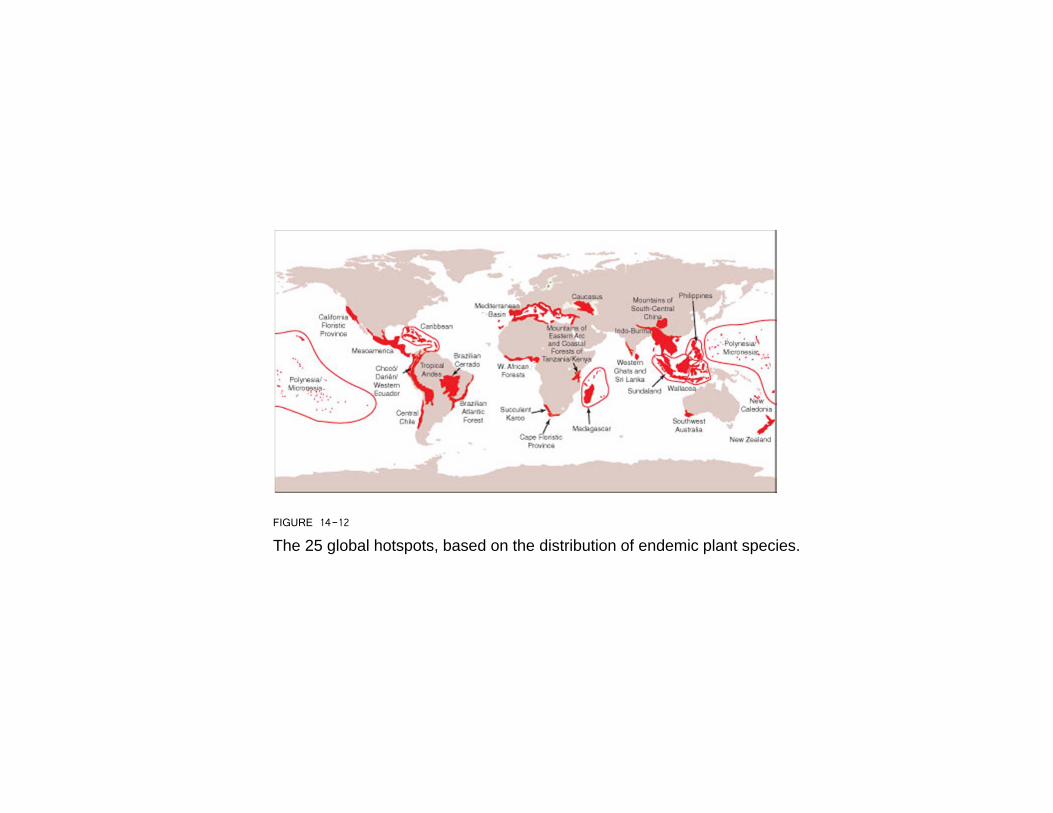
FIGURE 14-12
The 25 global hotspots, based on the distribution of endemic plant species.

PLATE 14-15
This chameleon is one of many endemic species on Madagascar.
FIGURE 14-13
World population density (1995) and the 25 biodiversity hotspots (outlined in red, numbered) and three major tropical wilderness areas (outlined in black, lettered). Hotspots: (1) Tropical Andes; (2) Mesoamerica; (3) Caribbean; (4) Atlantic Forest Region; (5) Chocó-Darién-Western Ecuador; (6) Brazilian Cerrado; (7) Central Chile; (8) California Floristic Province; (9) Madagascar; (10) Eastern Arc Mountains and Coastal Forests of Tanzania and Kenya; (11) West African Forests; (12) Cape Floristic Region; (13) Succulent Karoo; (14) Mediterranean Basin; (15) Caucasus; (16) Sundaland; (17) Wallacea; (18) Philippines; (19) Indo-Burma; (20) Mountains of South-Central China; (21) Western Ghats and Sri Lanka; (22) Southwest Australia; (23) New Caledonia; (24) New Zealand; and (25) Poly-nesia and Micronesia. Major tropical wilderness areas: (A) Upper Amazonia and Guiana Shield; (B) Congo River Basin; and (C) New Guinea and Melanesian Islands.

PLATE 14-16
The Nullarbor Plain, in Australia.

PLATE 14-17
Coral reef ecosystems, such as this on the Great Barrier Reef of Australia, are uniquely threatened ecosystems.
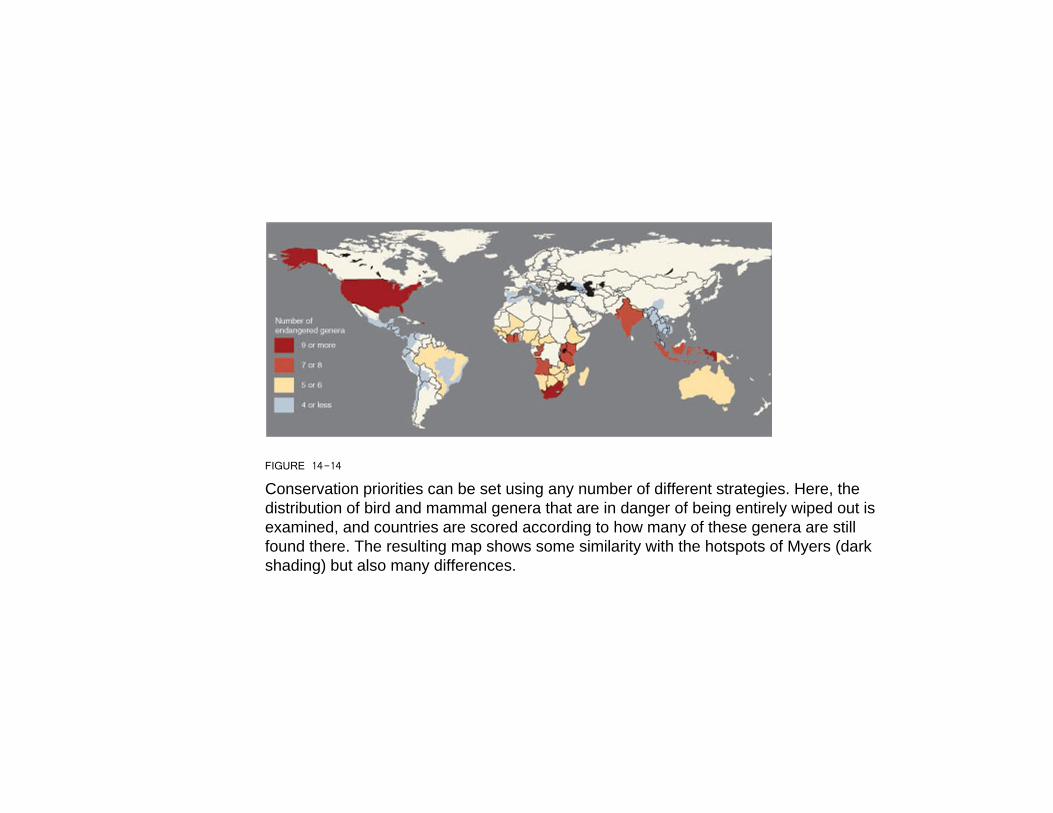
FIGURE 14-14
Conservation priorities can be set using any number of different strategies. Here, the distribution of bird and mammal genera that are in danger of being entirely wiped out is examined, and countries are scored according to how many of these genera are still found there. The resulting map shows some similarity with the hotspots of Myers (dark shading) but also many differences.