
Chapter 11: Presenting results and ‘Summary of findings...
21
Chapter 11: Presenting results and ‘Summary of findings’ tables Authors: Holger J Schünemann, Andrew D Oxman, Julian PT Higgins, Gunn E Vist, Paul Glasziou and Gordon H Guyatt on behalf of the Cochrane Applicability and Recommendations Methods Group and the Cochrane Statistical Methods Group. Copyright © 2011 The Cochrane Collaboration. This extract is from Cochrane Handbook for Systematic Reviews of Interventions version 5.1.0. For guidance on how to cite it, see Section 11.10. An earlier version (version 5.0.2) of the Handbook is also published by John Wiley & Sons, Ltd under “The Cochrane Book Series” Imprint, as Higgins JPT, Green S (editors), Cochrane Handbook for Systematic Reviews of Interventions (ISBN 978-0470057964) by John Wiley & Sons Ltd, The Atrium, Southern Gate, Chichester, West Sussex PO19 8SQ, England, Telephone (+44) 1243 779777; Email (for orders and customer service enquiries): [email protected]. Visit their Home Page on www.wiley.com. This extract is made available solely for use in the authoring, editing or refereeing of Cochrane reviews, or for training in these processes by representatives of formal entities of The Cochrane Collaboration. Other than for the purposes just stated, no part of this publication may be reproduced, stored in a retrieval system or transmitted in any form or by any means, electronic, mechanical, photocopying, recording, scanning or otherwise, except under the terms of the Copyright, Designs and Patents Act 1988 or under the terms of a licence issued by the Copyright Licensing Agency Ltd, 90 Tottenham Court Road, London W1T 4LP, UK, without the permission in writing of the copyright holders. Permission to translate part or all of this document must be obtained from the Handbook editors. Key points • Tables and figures help to present included studies and their findings in a systematic and clear format. • Forest plots are the standard way to illustrate results of individual studies and meta-analyses. These can be generated using Review Manager software, and a selection of them can be chosen for inclusion in the body of a Cochrane review. • A ‘Summary of findings’ table provides key information concerning the quality of evidence, the magnitude of effect of the interventions examined, and the sum of available data on all important outcomes for a given comparison. • The Abstract of a Cochrane review should be targeted primarily at healthcare decision makers (including clinicians, informed consumers and policy makers); and a ‘Plain language summary’ conveys the findings in a straightforward style that can be understood by consumers of health care. 11.1
Transcript of Chapter 11: Presenting results and ‘Summary of findings...

Chapter 11: Presenting results and ‘Summary of findings’ tables Authors: Holger J Schünemann, Andrew D Oxman, Julian PT Higgins, Gunn E Vist, Paul Glasziou and Gordon H Guyatt on behalf of the Cochrane Applicability and Recommendations Methods Group and the Cochrane Statistical Methods Group. Copyright © 2011 The Cochrane Collaboration. This extract is from Cochrane Handbook for Systematic Reviews of Interventions version 5.1.0. For guidance on how to cite it, see Section 11.10. An earlier version (version 5.0.2) of the Handbook is also published by John Wiley & Sons, Ltd under “The Cochrane Book Series” Imprint, as Higgins JPT, Green S (editors), Cochrane Handbook for Systematic Reviews of Interventions (ISBN 978-0470057964) by John Wiley & Sons Ltd, The Atrium, Southern Gate, Chichester, West Sussex PO19 8SQ, England, Telephone (+44) 1243 779777; Email (for orders and customer service enquiries): [email protected]. Visit their Home Page on www.wiley.com. This extract is made available solely for use in the authoring, editing or refereeing of Cochrane reviews, or for training in these processes by representatives of formal entities of The Cochrane Collaboration. Other than for the purposes just stated, no part of this publication may be reproduced, stored in a retrieval system or transmitted in any form or by any means, electronic, mechanical, photocopying, recording, scanning or otherwise, except under the terms of the Copyright, Designs and Patents Act 1988 or under the terms of a licence issued by the Copyright Licensing Agency Ltd, 90 Tottenham Court Road, London W1T 4LP, UK, without the permission in writing of the copyright holders. Permission to translate part or all of this document must be obtained from the Handbook editors.
Key points • Tables and figures help to present included studies and their findings in a systematic and clear
format. • Forest plots are the standard way to illustrate results of individual studies and meta-analyses.
These can be generated using Review Manager software, and a selection of them can be chosen for inclusion in the body of a Cochrane review.
• A ‘Summary of findings’ table provides key information concerning the quality of evidence, the magnitude of effect of the interventions examined, and the sum of available data on all important outcomes for a given comparison.
• The Abstract of a Cochrane review should be targeted primarily at healthcare decision makers (including clinicians, informed consumers and policy makers); and a ‘Plain language summary’ conveys the findings in a straightforward style that can be understood by consumers of health care.
11.1

11.1 Introduction The Results section of a review should summarize the findings in a clear and logical order, and should explicitly address the objectives of the review. Review authors can use a variety of tables and figures to present information in a more convenient format: • ‘Characteristics of included studies’ tables (including ‘Risk of bias’ tables). • ‘Data and analyses’ (the full set of data tables and forest plots). • Figures (a selection of study flow diagrams, forest plots, funnel plots, ‘Risk of bias’ plots and
other figures). • ‘Summary of findings’ tables. • Additional tables. ‘Characteristics of included studies’ tables present information on individual studies; ‘Data and analyses’ tables and forest plots present outcome data from individual studies and may additionally include meta-analyses; ‘Summary of findings’ tables present the cumulative information, data and quality of evidence for the most important outcomes. The findings of a review also must be summarized for an abstract and for a plain language summary. ‘Summary of findings’ tables are key among these presentation tools, and a substantial part of this chapter is dedicated to them. We discuss the specification of the important outcomes that might be relevant to people considering the intervention(s) under study, a step that we believe is often neglected in Cochrane reviews. We then present examples of ‘Summary of findings’ tables, and describe the contents of those tables. Chapter 12 discusses issues in the interpretation of results.
11.2 Results of the search and selection of studies 11.2.1 Study flow diagram Study flow diagrams are used to illustrate the results of the search and the process of screening and selecting studies for inclusion in the review. Figure 11.2.a provides an example of a flow diagram, following the template described in the PRISMA statement (Liberati 2009). A flow diagram using the PRISMA template may be created within RevMan, and RevMan also includes the facility to create a flow diagram with a flexible structure.
It is important that the text of the flow diagram draws a clear distinction between studies and records. Records are information sources about a study, such as journal articles, book chapters, web pages and other documents. Studies are the research enterprises themselves, typically randomized trials in the context of a Cochrane review. Usually a flow diagram will start by describing numbers of records retrieved (the majority of which will typically be from bibliographic databases). Following de-duplication, the records will have been mapped onto distinct studies (see Chapter 7, Section 7.2), and the flow diagram will reflect this by switching its emphasis to studies.
The flow diagram should present: • number of unique records identified by the searches; • number of records excluded after preliminary screening (e.g. of titles and abstracts); • number of records retrieved in full text; • number of records or studies excluded after assessment of the full text, with brief reasons;
11.2

• number of studies meeting eligibility criteria for the review (and thus contributing to qualitative synthesis); and
• number of studies contributing to the main outcome. Further guidance on preparing a study flow diagram is provided in the explanation and elaboration paper for the PRISMA statement (Liberati 2009) and in a review of published flow diagrams (Hind 2007).
Figure 11.2.a: Example of a PRISMA study flow diagram
11.2.2 ‘Characteristics of included studies’ tables Review authors must decide which characteristics of the studies are likely to be relevant to users of the review. It is likely that most of these characteristics will have been outlined in the review protocol. Review authors should, as a minimum, include the following in the ‘Characteristics of included studies’ table: Methods: study design (stating whether or not the study was randomized), including, where relevant, a clear indication of how the study differs from a standard parallel group design (e.g. a cross-over or cluster-randomized design); duration of the study (if not included under Intervention). Note: the ‘Methods’ entry should not include measures of risk of bias; these should appear in a ‘Risk of bias’ table (see Chapter 8, Section 8.5).
11.3

Participants: setting; relevant details of health status of participants; age; sex; country. Sufficient information should be provided to allow users of the review to determine the applicability of the study to their population, and to allow exploration of differences in participants across studies. Intervention: a clear list of the intervention groups included in the study. If feasible, sufficient information should be provided for each intervention to be replicated in practice; for drug interventions, include details of drug name, dose, frequency, mode of administration (if not obvious), duration (if not included under Methods); for non-drug interventions, include relevant considerations and components related to the intervention. Outcomes: a clear list of either (i) outcomes and time-points from the study that are considered in the review; or (ii) outcomes and time-points measured (or reported) in the study. Study results should not be included here (or elsewhere in this table). Notes: further comments from the review authors on aspects of the study that are not covered by the categories above. Note that assessments of risk of bias should be made in a ‘Risk of bias’ table. It is possible to add up to three extra fields in the ‘Characteristics of included studies’ table. Where appropriate, review authors are recommended to use an extra field to provide information about the funding of each study.
11.3 Data and analyses 11.3.1 The ‘Data and analyses’ section of a review The ‘Data and analyses’ section of a Cochrane review is a detailed resource of results. It includes outcome data (numeric or text), forest plots and meta-analysis results. The root of the ‘Data and analyses’ resource is a table of comparisons, outcomes and (optionally) subgroups for which data are available. Analyses listed in this table comprise either a table of results (‘other data’ tables) or, more usually, a table of data accompanied by a forest plot. The ‘Data and analyses’ tables are included in the full publication of a Cochrane review. However, some formats of a published review may omit the forest plots and ‘other data’ tables (along with appendices), and so they should generally be considered as supplementary material, and key results should be included in the text of the review under ‘Results’. The published review will always include a summary table of all analyses (including numbers of studies and meta-analysis results for each subgroup under each outcome for each comparison). The review should include the most important forest plots from the ‘Data and analyses’ resource as figures and these should be referenced in the ‘Results’ section (see Section 11.4.2).
11.3.2 Forest plots A forest plot displays effect estimates and confidence intervals for both individual studies and meta-analyses (Lewis 2001). Each study is represented by a block at the point estimate of intervention effect with a horizontal line extending either side of the block. The area of the block indicates the weight assigned to that study in the meta-analysis while the horizontal line depicts the confidence interval (usually with a 95% level of confidence). The area of the block and the confidence interval convey similar information, but both make different contributions to the graphic. The confidence interval depicts the range of intervention effects compatible with the study’s result and indicates whether each was individually statistically significant. The size of the block draws the eye towards the studies with larger weight (usually those with narrower confidence intervals), which dominate the calculation of the pooled result. 11.3.2.1 Forest plots in RevMan RevMan provides a flexible framework for producing forest plots in the ‘Data and analyses’ section of a Cochrane review. Components of a Cochrane forest plot are described in Box 11.3.a, and an example from RevMan is given in Figure 11.3.a, using results from a review of compression stockings to
11.4

prevent deep vein thrombosis in airline passengers (Clarke 2006). A tutorial on the use of RevMan is available within RevMan (available from www.cc-ims.net). RevMan offers multiple options for changing the analysis methods (e.g. between fixed and random-effects meta-analyses, or using different measures of effect; see Chapter 9 (Section 9.4) and graphics (e.g. scale of axes and ordering of studies). One forest plot for each dataset entered into RevMan is automatically incorporated into the full published version of the Cochrane review. Default analyses are displayed unless options are overridden. The defaults are Mantel-Haenszel odds ratios for dichotomous data, fixed-effect meta-analyses of mean differences for continuous data, Peto odds ratios for ‘O–E and Variance’ outcomes and fixed-effect meta-analyses for generic inverse variance outcomes (see Chapter 9, Section 9.4). The author should override any default settings that do not correspond with results reported in the text when setting up or editing outcomes in RevMan. This ensures that the results displayed are consistent with what is described in the text. In addition, the scale of the axis should be selected so that the point estimates (and most, if not all, of the confidence intervals) are visible in the plot. A past convention in the Cochrane Database of Systematic Reviews (CDSR) has been that dichotomous outcomes have focused on unfavourable outcomes, so that risk ratios and odds ratios less than one (and risk differences less than zero) indicate that an experimental intervention is superior to a control intervention. This would result in effect estimates to the left of the vertical line in a forest plot implying a benefit of the experimental intervention. The convention is no longer encouraged since it is not universally appropriate. A much superior approach is to make it transparent which side of the line indicates benefit of which intervention by labelling the directions on the axis on the forest plots. RevMan allows authors to specify the labels used for ‘experimental’ and ‘control’ groups in each outcome. These labels are then used in the CDSR. Thus it is essential to know which way figures are constructed and should be interpreted. This is particularly important for measurement scale data where it is not always apparent to a reader which direction on a scale indicates worsening health. Forest plots should not be generated that contain no studies, and are discouraged when only a single study is found for a particular outcome. To display outcomes that have been investigated only in single studies, authors can use a forest plot using a subgroup for each outcome (ensuring that the option to pool the data is disabled). Otherwise results of single studies may more conveniently be presented in an Additional table (see Section 11.6).
Box 11.3.a: Details provided in a Cochrane forest plot
Forest plots for dichotomous outcomes and ‘O–E and Variance’ outcomes illustrate, by default: 1. the raw data (corresponding to the 2×2 tables) for each study; 2. point estimates and confidence intervals for the chosen effect measure, both as blocks and lines
and as text; 3. a meta-analysis for each subgroup using the chosen effect measure and chosen method (fixed or
random effects), both as a diamond and as text; 4. the total numbers of participants and total numbers with events in the experimental intervention
and control intervention groups; 5. heterogeneity statistics (among-study variance (tau-squared, or Tau2, or τ2) for random-effects
meta-analyses, the chi-squared test, the I2 statistic and a test for differences across subgroups if they are present and appropriate);
6. a test for overall effect (overall average effect for random-effects meta-analyses); 7. percent weights given to each study.
11.5

Note that 3–7 are not displayed unless data are pooled. Furthermore, the test for differences across subgroups is not displayed for Mantel-Haenszel analyses. For ‘O–E and Variance’ outcomes it is also possible to enable display of the O–E and V statistics. Forest plots for continuous outcomes illustrate, by default: 1. the raw data (means, standard deviations and sample sizes) for each arm in each study; 2. point estimates and confidence intervals for the chosen effect measure, both as blocks and lines
and as text; 3. a meta-analysis for each subgroup using the chosen effect measure and chosen method (fixed or
random effects), both as a diamond and as text; 4. the total numbers of participants in the experimental and control groups; 5. heterogeneity statistics (among-study variance (tau-squared) for random-effects meta-analyses, the
chi-squared test, the I2 statistic and a test for differences across subgroups if they are present); 6. a test for overall effect (overall average effect for random-effects meta-analyses); and 7. percent weights given to each study. Note that 3–7 are not displayed unless the data are pooled. Forest plots for the generic inverse variance method illustrate, by default: 1. the summary data for each study, as entered by the author (for ratio measures these will be on the
natural log (‘ln’) scale); 2. point estimates and confidence intervals, both as blocks and lines and as text (for ratio measures
these will be on the natural scale rather than the log scale); 3. a meta-analysis for each subgroup using the chosen method (fixed or random effects), both as a
diamond and as text; 4. heterogeneity statistics (among-study variance (tau-squared) for random-effects meta-analyses, the
chi-squared test, the I2 statistic, and a test for differences across subgroups if they are present); 5. a test for overall effect (overall average effect for random-effects meta-analyses); and 6. percent weights given to each study.
Note that 3–6 are not shown unless data are pooled. It is possible additionally to enter sample sizes for experimental and control groups. These should be entered as appropriate for the design of the study. The sample sizes are not involved in the analysis, but if entered are displayed as: 7. numbers of participants in the experimental and control group for each study; and 8. the total numbers of participants in the experimental and control groups.
Figure 11.3.a: Example of a RevMan forest plot
11.6
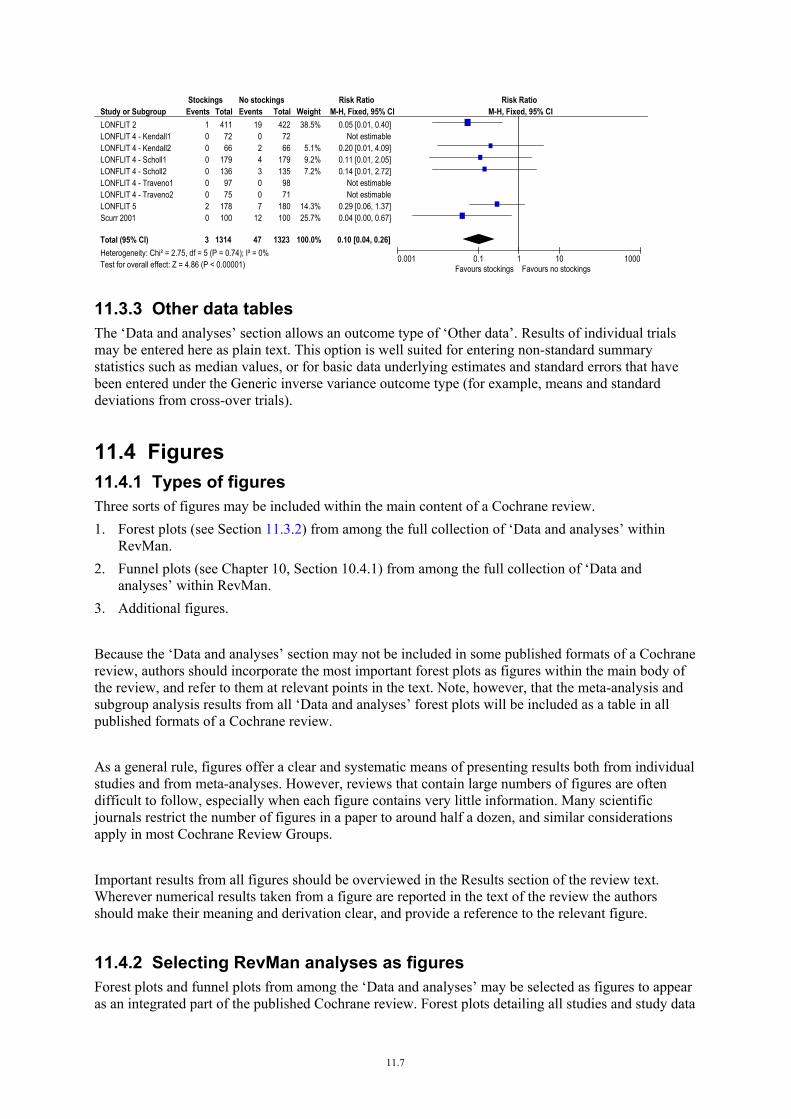
Study or SubgroupLONFLIT 2LONFLIT 4 - Kendall1LONFLIT 4 - Kendall2LONFLIT 4 - Scholl1LONFLIT 4 - Scholl2LONFLIT 4 - Traveno1LONFLIT 4 - Traveno2LONFLIT 5Scurr 2001
Total (95% CI)Heterogeneity: Chi² = 2.75, df = 5 (P = 0.74); I² = 0%Test for overall effect: Z = 4.86 (P < 0.00001)
Events100000020
3
Total4117266
1791369775
178100
1314
Events19
0243007
12
47
Total422
7266
179135
9871
180100
1323
Weight38.5%
5.1%9.2%7.2%
14.3%25.7%
100.0%
M-H, Fixed, 95% CI0.05 [0.01, 0.40]
Not estimable0.20 [0.01, 4.09]0.11 [0.01, 2.05]0.14 [0.01, 2.72]
Not estimableNot estimable
0.29 [0.06, 1.37]0.04 [0.00, 0.67]
0.10 [0.04, 0.26]
Stockings No stockings Risk Ratio Risk RatioM-H, Fixed, 95% CI
0.001 0.1 1 10 1000Favours stockings Favours no stockings
11.3.3 Other data tables The ‘Data and analyses’ section allows an outcome type of ‘Other data’. Results of individual trials may be entered here as plain text. This option is well suited for entering non-standard summary statistics such as median values, or for basic data underlying estimates and standard errors that have been entered under the Generic inverse variance outcome type (for example, means and standard deviations from cross-over trials).
11.4 Figures 11.4.1 Types of figures Three sorts of figures may be included within the main content of a Cochrane review. 1. Forest plots (see Section 11.3.2) from among the full collection of ‘Data and analyses’ within
RevMan. 2. Funnel plots (see Chapter 10, Section 10.4.1) from among the full collection of ‘Data and
analyses’ within RevMan. 3. Additional figures. Because the ‘Data and analyses’ section may not be included in some published formats of a Cochrane review, authors should incorporate the most important forest plots as figures within the main body of the review, and refer to them at relevant points in the text. Note, however, that the meta-analysis and subgroup analysis results from all ‘Data and analyses’ forest plots will be included as a table in all published formats of a Cochrane review. As a general rule, figures offer a clear and systematic means of presenting results both from individual studies and from meta-analyses. However, reviews that contain large numbers of figures are often difficult to follow, especially when each figure contains very little information. Many scientific journals restrict the number of figures in a paper to around half a dozen, and similar considerations apply in most Cochrane Review Groups. Important results from all figures should be overviewed in the Results section of the review text. Wherever numerical results taken from a figure are reported in the text of the review the authors should make their meaning and derivation clear, and provide a reference to the relevant figure.
11.4.2 Selecting RevMan analyses as figures Forest plots and funnel plots from among the ‘Data and analyses’ may be selected as figures to appear as an integrated part of the published Cochrane review. Forest plots detailing all studies and study data
11.7
for the primary outcomes would usually be included as figures. If there are sufficient studies, a funnel plot for one or more of the primary outcomes may be a useful supplement to these forest plots (see Chapter 10, Section 10.4.1).
11.4.3 Additional figures Although RevMan can produce forest plots and funnel plots, it may be appropriate to include other types of figures in a review. Examples include: 1. ‘overview’ forest plots, where each line represents a meta-analysis rather than a study (for
example, to illustrate multiple subgroup analyses or sensitivity analyses); 2. plots illustrating meta-regression analyses; and 3. L’Abbé plots. Such plots may be produced in software other than RevMan and included as an ‘additional’ figure. Photographs and diagrams may be included in the same way for use in other parts of a Cochrane review. Additional figures should seldom be required, and should not be used to draw forest plots that could be drawn using RevMan. Where possible, figures should be produced using statistical software packages that produce appropriate publication-quality graphics, such as Stata, SAS, SPSS, S-Plus or specialized meta-analysis software. General-purpose spreadsheet programs may not provide suitable flexibility nor produce output of adequate quality. A separate document, Considerations and recommendations for figures in Cochrane reviews: Graphs of statistical data, provides extensive guidance on the content of additional figures that illustrate numerical data (available from http://www.cochrane.org/training/cochrane-handbook). The document includes descriptions and recommendations for the plots listed above and several others. Authors should refer to this document before submitting a review containing additional figures. All additional figures should be assessed by a statistical editor or advisor prior to submission of a Cochrane review to the CDSR. Authors should be aware that additional figures can often be large and take up valuable storage space on the Cochrane Library. Guidance on technical aspects of additional figures is available among the RevMan documentation at http://www.cc-ims.net. The ability to incorporate additional figures in RevMan technically allows authors to attach tables as graphics files. Authors are discouraged from doing this due to the high volume of storage space taken up by graphics files. Authors are instead asked to use the Additional tables function, which is provided for this purpose.
11.5 ‘Summary of findings’ tables 11.5.1 Introduction to ‘Summary of findings’ tables ‘Summary of findings’ tables present the main findings of a review in a transparent and simple tabular format. In particular, they provide key information concerning the quality of evidence, the magnitude of effect of the interventions examined, and the sum of available data on the main outcomes. Most reviews would be expected to have a single ‘Summary of findings’ table. Other reviews may include more than one, for example if the review addresses more than one major comparison, or substantially different populations. In the CDSR, the principal ‘Summary of findings’ table of a review will appear at the beginning, before the Background section. Other ‘Summary of findings’ tables will appear between the Results and Discussion sections.
11.8

The planning for the ‘Summary of findings’ table comes early in the systematic review, with the selection of the outcomes to be included in (i) the review and (ii) the ‘Summary of findings’ table. Because this is a crucial step, and one typically not formally addressed in traditional Cochrane reviews, we will review the issues in selecting outcomes here.
11.5.2 Selecting outcomes for ‘Summary of findings’ tables Cochrane reviews begin by developing a review question and by listing all main outcomes that are important to patients and other decision makers (see Chapter 5, Section 5.4) to ensure production of optimally useful information. Consultation and feedback on the review protocol can enhance this process. Important outcomes are likely to include widely familiar events such as mortality and major morbidity (such as strokes and myocardial infarction). However, they may also represent frequent minor and rare major side effects, symptoms and quality of life, burdens associated with treatment, and resource issues (costs). Burdens include the demands of adhering to an intervention that patients or caregivers (e.g. family) may dislike, such as having to undergo more frequent tests, or restrictions on lifestyle that certain interventions require. Frequently, when formulating questions that include all patient-important outcomes for decision making, review authors will confront the fact that reports of randomized trials have not included all these outcomes. This is particularly true for adverse outcomes. For instance, randomized trials might contribute data on intended effects, and on frequent, relatively minor side effects, but not address the relative risk of rare adverse outcomes such as suicide attempts. Chapter 14 discusses strategies for adequately addressing adverse effects. To obtain data for all important outcomes it may be necessary to examine the results of observational studies. If a review includes only randomized trials, addressing all important outcomes may not be possible within the constraints of the review. Review authors should acknowledge these limitations, and make them transparent to readers. Review authors who take on the challenge of compiling and summarizing the best evidence for all relevant outcomes may face a number of challenges. These include the fact that the analysis of harm may be carried out in studies whose participants differ from those included in the studies used in the analysis of benefit. Thus, review authors will need to consider how much, if at all, the participants in observational studies differ from those in the randomized trials. This can influence the quality of evidence because of concerns about directness (see Chapter 12, Section 12.2). When review authors do not include information on these important outcomes in the review they should say so. Further discussion of these issues appears also in Chapter 13.
11.5.3 General template for ‘Summary of findings’ tables While there may be good reasons for modifying the format of a ‘Summary of findings’ table for some reviews, a standard format for them has been developed with the aim of ensuring consistency and ease of use across reviews, inclusion of the most important information needed by decision makers, and optimal presentation of this information. Standard Cochrane ‘Summary of findings’ tables therefore include the following six elements using a fixed format (see Figure 11.5.a). 1. A list of all important outcomes, both desirable and undesirable. 2. A measure of the typical burden of these outcomes (e.g. illustrative risk, or illustrative mean, on
control intervention).
11.9
3. Absolute and relative magnitude of effect (if both are appropriate). 4. Numbers of participants and studies addressing these outcomes. 5. A grade of the overall quality of the body of evidence for each outcome (which may vary by
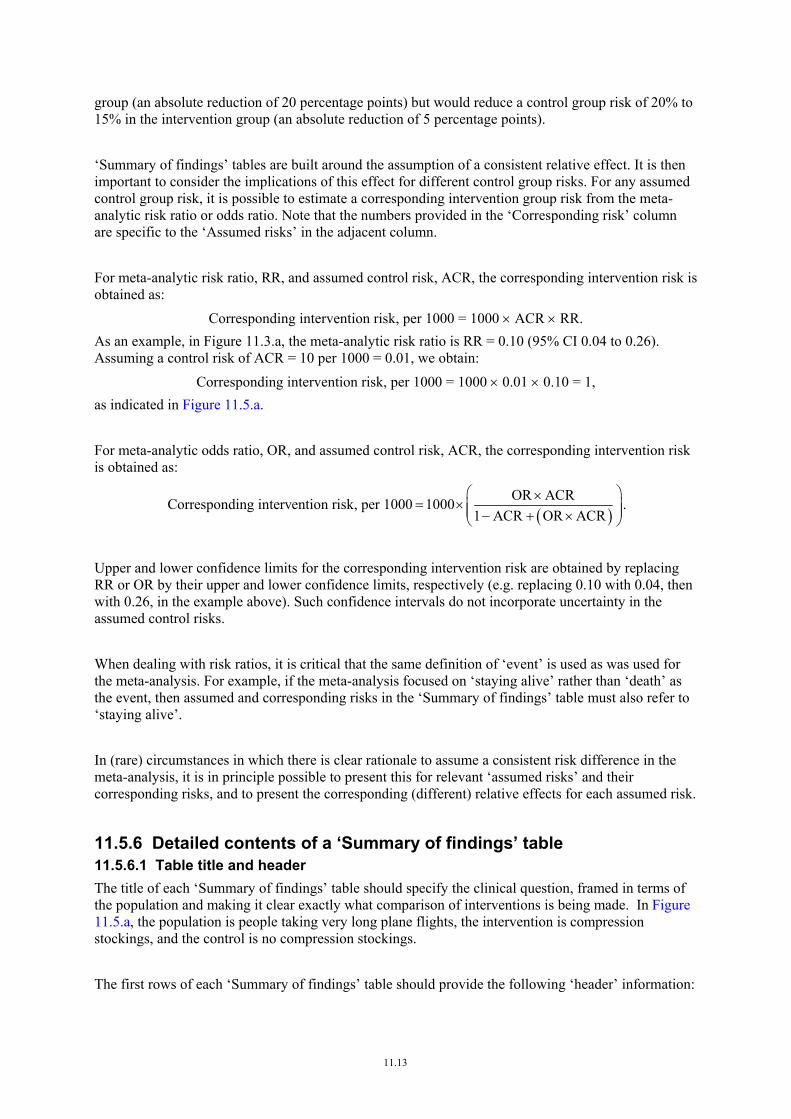
outcome). 6. Space for comments. As a measure of the magnitude of effect, for dichotomous outcomes the table will usually provide both a relative measure (e.g. risk ratio or odds ratio) and measures of absolute risk. For other types of data, either an absolute measure alone (such as difference in means for continuous data) or a relative measure alone (e.g. hazard ratio for time-to-event data) might be provided. Where possible, however, both relative and absolute measures of effect should be provided. Reviews with more than one main comparison require separate ‘Summary of findings’ tables for each comparison. Figure 11.5.a provides an example of a ‘Summary of findings’ table.
A detailed description of the contents of a ‘Summary of findings’ table appears in Section 11.5.6
11.10

Figure 11.5.a: Example of a ‘Summary of findings’ table
Summary of findings:
Compression stockings compared with no compression stockings for people taking long flights
Patients or population: Anyone taking a long flight (lasting more than 6 hours) Settings: International air travel Intervention: Compression stockings1 Comparison: Without stockings
Illustrative comparative risks* (95% CI)
Assumed risk Corresponding risk
Outcomes
Without stockings
With stockings
Relative effect (95% CI)
Number of participants (studies)
Quality of the evidence (GRADE)
Comments
Symptomatic deep vein thrombosis (DVT)
See comment See comment Not estimable 2821 (9 studies)
See comment
0 participants developed symptomatic DVT in these studies.
Low risk population 2
10 per 1000 1 per 1000 (0 to 3)
High risk population 2
Symptom-less deep vein thrombosis
30 per 1000 3 per 1000 (1 to 8)
RR 0.10 (0.04 to 0.26)
2637 (9 studies)
⊕⊕⊕⊕ High
Superficial vein thrombosis
13 per 1000 6 per 1000 (2 to 15)
RR 0.45 (0.18 to 1.13)
1804 (8 studies)
⊕⊕⊕ Moderate3
Oedema Post-flight values measured on a scale from 0, no oedema, to 10, maximum oedema.
The mean oedema score ranged across control groups from 6 to 9.
The mean oedema score in the intervention groups was on average 4.7 lower (95% CI –4.9 to –4.5).
1246 (6 studies)
⊕⊕
Low4
Pulmonary embolus See comment See comment Not estimable 2821 (9 studies)
See comment
0 participants developed pulmonary embolus in these studies. 5
Death See comment See comment Not estimable 2821 (9 studies)
See comment
0 participants died in these studies.
11.11
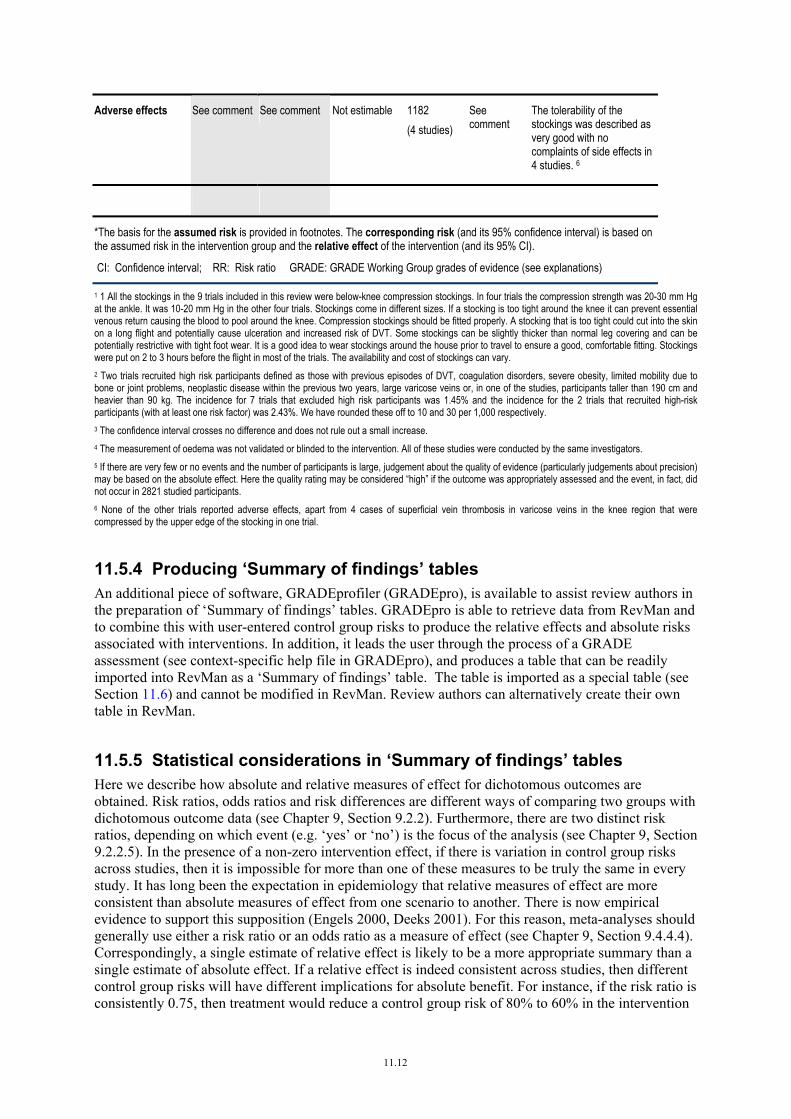
Adverse effects See comment See comment Not estimable 1182 (4 studies)
See comment
The tolerability of the stockings was described as very good with no complaints of side effects in 4 studies. 6
*The basis for the assumed risk is provided in footnotes. The corresponding risk (and its 95% confidence interval) is based on the assumed risk in the intervention group and the relative effect of the intervention (and its 95% CI).
CI: Confidence interval; RR: Risk ratio GRADE: GRADE Working Group grades of evidence (see explanations)
1 1 All the stockings in the 9 trials included in this review were below-knee compression stockings. In four trials the compression strength was 20-30 mm Hg at the ankle. It was 10-20 mm Hg in the other four trials. Stockings come in different sizes. If a stocking is too tight around the knee it can prevent essential venous return causing the blood to pool around the knee. Compression stockings should be fitted properly. A stocking that is too tight could cut into the skin on a long flight and potentially cause ulceration and increased risk of DVT. Some stockings can be slightly thicker than normal leg covering and can be potentially restrictive with tight foot wear. It is a good idea to wear stockings around the house prior to travel to ensure a good, comfortable fitting. Stockings were put on 2 to 3 hours before the flight in most of the trials. The availability and cost of stockings can vary. 2 Two trials recruited high risk participants defined as those with previous episodes of DVT, coagulation disorders, severe obesity, limited mobility due to bone or joint problems, neoplastic disease within the previous two years, large varicose veins or, in one of the studies, participants taller than 190 cm and heavier than 90 kg. The incidence for 7 trials that excluded high risk participants was 1.45% and the incidence for the 2 trials that recruited high-risk participants (with at least one risk factor) was 2.43%. We have rounded these off to 10 and 30 per 1,000 respectively. 3 The confidence interval crosses no difference and does not rule out a small increase. 4 The measurement of oedema was not validated or blinded to the intervention. All of these studies were conducted by the same investigators. 5 If there are very few or no events and the number of participants is large, judgement about the quality of evidence (particularly judgements about precision) may be based on the absolute effect. Here the quality rating may be considered “high” if the outcome was appropriately assessed and the event, in fact, did not occur in 2821 studied participants. 6 None of the other trials reported adverse effects, apart from 4 cases of superficial vein thrombosis in varicose veins in the knee region that were compressed by the upper edge of the stocking in one trial.
11.5.4 Producing ‘Summary of findings’ tables An additional piece of software, GRADEprofiler (GRADEpro), is available to assist review authors in the preparation of ‘Summary of findings’ tables. GRADEpro is able to retrieve data from RevMan and to combine this with user-entered control group risks to produce the relative effects and absolute risks associated with interventions. In addition, it leads the user through the process of a GRADE assessment (see context-specific help file in GRADEpro), and produces a table that can be readily imported into RevMan as a ‘Summary of findings’ table. The table is imported as a special table (see Section 11.6) and cannot be modified in RevMan. Review authors can alternatively create their own table in RevMan.
11.5.5 Statistical considerations in ‘Summary of findings’ tables Here we describe how absolute and relative measures of effect for dichotomous outcomes are obtained. Risk ratios, odds ratios and risk differences are different ways of comparing two groups with dichotomous outcome data (see Chapter 9, Section 9.2.2). Furthermore, there are two distinct risk ratios, depending on which event (e.g. ‘yes’ or ‘no’) is the focus of the analysis (see Chapter 9, Section 9.2.2.5). In the presence of a non-zero intervention effect, if there is variation in control group risks across studies, then it is impossible for more than one of these measures to be truly the same in every study. It has long been the expectation in epidemiology that relative measures of effect are more consistent than absolute measures of effect from one scenario to another. There is now empirical evidence to support this supposition (Engels 2000, Deeks 2001). For this reason, meta-analyses should generally use either a risk ratio or an odds ratio as a measure of effect (see Chapter 9, Section 9.4.4.4). Correspondingly, a single estimate of relative effect is likely to be a more appropriate summary than a single estimate of absolute effect. If a relative effect is indeed consistent across studies, then different control group risks will have different implications for absolute benefit. For instance, if the risk ratio is consistently 0.75, then treatment would reduce a control group risk of 80% to 60% in the intervention
11.12
group (an absolute reduction of 20 percentage points) but would reduce a control group risk of 20% to 15% in the intervention group (an absolute reduction of 5 percentage points). ‘Summary of findings’ tables are built around the assumption of a consistent relative effect. It is then important to consider the implications of this effect for different control group risks. For any assumed control group risk, it is possible to estimate a corresponding intervention group risk from the meta-analytic risk ratio or odds ratio. Note that the numbers provided in the ‘Corresponding risk’ column are specific to the ‘Assumed risks’ in the adjacent column. For meta-analytic risk ratio, RR, and assumed control risk, ACR, the corresponding intervention risk is obtained as:
Corresponding intervention risk, per 1000 = 1000 × ACR × RR. As an example, in Figure 11.3.a, the meta-analytic risk ratio is RR = 0.10 (95% CI 0.04 to 0.26). Assuming a control risk of ACR = 10 per 1000 = 0.01, we obtain:
Corresponding intervention risk, per 1000 = 1000 × 0.01 × 0.10 = 1, as indicated in Figure 11.5.a. For meta-analytic odds ratio, OR, and assumed control risk, ACR, the corresponding intervention risk is obtained as:
( )OR ACRCorresponding intervention risk, per 1000 1000
1 ACR OR ACR⎛ ⎞×
= ×⎜ ⎟⎜ ⎟− + ×⎝ ⎠.
Upper and lower confidence limits for the corresponding intervention risk are obtained by replacing RR or OR by their upper and lower confidence limits, respectively (e.g. replacing 0.10 with 0.04, then with 0.26, in the example above). Such confidence intervals do not incorporate uncertainty in the assumed control risks. When dealing with risk ratios, it is critical that the same definition of ‘event’ is used as was used for the meta-analysis. For example, if the meta-analysis focused on ‘staying alive’ rather than ‘death’ as the event, then assumed and corresponding risks in the ‘Summary of findings’ table must also refer to ‘staying alive’. In (rare) circumstances in which there is clear rationale to assume a consistent risk difference in the meta-analysis, it is in principle possible to present this for relevant ‘assumed risks’ and their corresponding risks, and to present the corresponding (different) relative effects for each assumed risk.
11.5.6 Detailed contents of a ‘Summary of findings’ table 11.5.6.1 Table title and header The title of each ‘Summary of findings’ table should specify the clinical question, framed in terms of the population and making it clear exactly what comparison of interventions is being made. In Figure 11.5.a, the population is people taking very long plane flights, the intervention is compression stockings, and the control is no compression stockings. The first rows of each ‘Summary of findings’ table should provide the following ‘header’ information:
11.13

Patients or population: This further clarifies the population (and possibly the sub-populations) of interest and ideally the magnitude of risk of the most crucial adverse outcome at which treatment is directed. For instance: patients on a long haul flight may be at different risks for DVT; or patients using SSRIs might be at different risk for side effects; or patients with atrial fibrillation may be at low (< 1%), moderate (1% to 4%) or high (> 4%) yearly risk of stroke. Setting: This should specify any specific characteristics of the settings in which the studies were carried out that might limit the applicability of the summary of findings to other settings; e.g. primary care in Europe and North America. Intervention: The experimental intervention. Comparison: The control (comparison) intervention (including no specific treatment). 11.5.6.2 Outcomes The rows of a ‘Summary of findings’ table should include all desirable and undesirable outcomes (listed in order of importance) that are essential for decision-making, up to a maximum of seven outcomes. If there are an excessive number of outcomes in the review, authors will need to omit the less important outcomes. Details of scales and time frames should be provided. Authors should aim to decide which outcomes are important for the ‘Summary of findings’ table during protocol development and before they undertake the review. However, review authors should be alert to the possibility that the importance of an outcome (e.g. a serious adverse effect) may only become known after the protocol was written or the analysis was carried out, and should take appropriate actions to include these in the ‘Summary of findings’ table. Note that authors should list these outcomes in the table whether data are available or not. Serious adverse events should be included, but it might be possible to combine minor adverse events, and describe this in a footnote (note that it is not appropriate to add events together unless they are known to be independent). Multiple time points will be a particular problem. In general, to keep the table simple, only outcomes critical to decision making should be presented at multiple time points. The remainder should be presented at a common time point. Continuous outcome measures can be shown in the ‘Summary of findings’ table; review authors should endeavour to make these interpretable to the target audience (see Chapter 12, Section 12.6). This requires that the units are clear and readily interpretable, for example, days of pain, or frequency of headache. However, many measurement instruments are not readily interpretable by non-specialist clinicians or patients, for example, points on a Beck Depression Inventory or quality of life score. For these, a more interpretable presentation might involve converting a continuous to a dichotomous outcome, such as > 50% improvement (see Chapter 12, Section 12.6). 11.5.6.3 Illustrative comparative risks 1: Assumed risk (with control intervention) Authors should provide up to three typical risks for participants receiving the control intervention. It is recommended that these be presented in the form of a number of people experiencing the event per 1000 people (natural frequency). A suitable alternative greater than 1000 may be used for rare events, or 100 may be used for more frequent events. Assumed control intervention risks could be based on assessments of typical risks in different patient groups or at different lengths of follow-up. Ideally, risks would reflect groups that clinicians can easily identify on the basis of their presenting features. A footnote should specify the source or rationale for each control group risk, including the time period to which it corresponds where appropriate. In Figure 11.5.a, clinicians can easily differentiate individuals with risk factors for deep venous thrombosis from those without. If there is known to be little variation in baseline risk then review authors may use the median control group risk across studies.
11.14
11.5.6.4 Illustrative comparative risks 2: Corresponding risk (with experimental intervention) For dichotomous outcomes, a corresponding absolute risk should be provided for each assumed risk in the preceding column, along with a confidence interval. This absolute risk with (experimental) intervention will usually be derived from the meta-analysis result presented as in the relative effect column (see Section 11.5.6.5). Formulae are provided in Section 11.5.5. Review authors should present the absolute effect in the same format as assumed risks with control intervention (see Section 11.5.6.3), e.g. as a number of people experiencing the event per 1000 people. For continuous outcomes, a difference in means or standardized difference in means should be presented with its confidence interval. These will typically be obtained directly from a meta-analysis. Explanatory text should be used to clarify the meaning, as in Figure 11.5.a. 11.5.6.5 Relative effect (95% CI) The relative effect will typically be a risk ratio or odds ratio (or occasionally a hazard ratio) with its accompanying 95% confidence interval, obtained from a meta-analysis performed on the basis of the same effect measure. Risk ratios and odds ratios are similar when the control intervention risks are low and effects are small, but differ considerably as these increase. The meta-analysis may involve an assumption of either fixed or random effects, depending on what the review authors consider appropriate. 11.5.6.6 Number of participants (studies) This column should include the number of participants assessed in the included studies for each outcome and the corresponding number of studies that contributed these participants. 11.5.6.7 Quality of the evidence (GRADE) Authors will comment on the quality of the body of evidence as ‘High’, ‘Moderate’, ‘Low’, or ‘Very Low’. This is a matter of judgement, but the judgement process operates within a transparent structure and is described in Chapter 12 (Section 12.2). As an example, the quality would be ‘High’ if the summary is of several randomized trials with low risk of bias, but the rating of quality becomes lower if there are concerns about design or implementation, imprecision, inconsistency, indirectness, or reporting bias. Authors should use the specific evidence grading system developed by the GRADE collaboration (GRADE Working Group 2004), which is described in detail in Chapter 12 (Section 12.2). Judgements other than of ‘High’ quality should be made transparent using footnotes or the Comments column in the ‘Summary of findings’ table (see Figure 11.5.a). 11.5.6.8 Comments The aim of the Comments field is to provide additional comments to help interpret the information or data identified in the row. For example, this may be on the validity of the outcome measure or the presence of variables that are associated with the magnitude of effect. Important caveats about the results should be flagged here. Not all rows will need comments, so it is best to leave blank if there is nothing warranting a comment.
11.6 Additional tables The Additional tables feature provides a flexible way of creating tables, allowing presentation of results of both trials and meta-analyses, and other meta-analytical investigations (such as meta-regression analyses). Important results from all Additional tables should be summarized in the Results section of the review text.
11.15
11.7 Presenting results in the text 11.7.1 Results of meta-analyses The Results section should be organized to follow the order of comparisons and outcomes specified in the protocol so that it explicitly addresses the objectives of the review. The text should present the overall results in a logical and systematic way: it should not have to rely too heavily on the tables or figures, or constantly refer to them to get a clear picture of the review findings. Rather, tables should be used as an additional resource that might provide further details. However, excessive repetition of data in the text that are also provided in tables or figures should be avoided. Answers to post hoc analyses and less important questions for which there happen to be plentiful data should not be overemphasized. Post hoc analyses should always be identified as such. Authors should make clear in the Results section the method of analysis used for each quoted result (in particular, the choice of effect measure, the direction of a beneficial effect and the meta-analysis model used), although the analytic methods themselves should be described in the Methods section. Results should always be accompanied by a measure of uncertainty, such as a 95% confidence interval. The abstract should summarize findings for only the most important comparisons and outcomes, and not selectively report those with the most significant results. It is helpful also to indicate the amount of information (numbers of studies and participants) on which analyses were based. Each figure and Additional table should be referred to, explicitly, in the text. When referring to results in a figure, table or ‘Data and analysis’ forest plot that has not been selected as figures, the figure, table or analysis should be referenced in the text. Authors should consider presenting results in formats that are easy to interpret. For example, odds ratios and standardized mean differences do not lend themselves to direct application in clinical practice but can be re-expressed in more accessible forms. See Chapter 12 (Sections 12.5 and 12.6).
11.7.2 Results without meta-analyses Methods for meta-analysis allow quantification of direction of effect, size of effect and consistency of effect (see Chapter 9, Section 9.1). If suitable numerical data are not available for meta-analysis, or if meta-analyses are considered inappropriate, then these domains may often still be examined to provide a systematic assessment of the evidence available. A narrative assessment of the evidence can be challenging, especially if the review includes a large number of studies; if the studies themselves examine complex interventions and outcomes; or if there is a lot of variation in the effects of the intervention. Patterns of effects, and similarities or differences between studies may therefore not be immediately obvious. Adopting a systematic approach to presentation is important to making sense of the results of a review. If a descriptive paragraph is provided for the results from each study, this should be done consistently, including the same elements of information for each study, presented in the same order. Organizing the studies into groupings or clusters is encouraged (e.g. by intervention type, population groups, setting etc) if a large number of studies (e.g. more than 20) have been included in the review, and can make the process of narratively describing the results more manageable. It can also enable identification of patterns in results, both within and between the groups that are formed.
11.16
11.8 Writing an abstract All full reviews must include an abstract of not more than 400 words. The abstract should be kept as brief as possible without sacrificing important content. Abstracts to Cochrane reviews are published in MEDLINE and the Science Citation Index, and are made freely available on the internet. It is therefore important that they can be read as stand-alone documents. The abstract should summarize the key methods, results and conclusions of the review and should not contain any information that is not in the review. Links to other parts of the review (such as references, studies, tables and figures) may not be included in the abstract. A hypothetical example of an abstract is included in Box 11.8.a. Abstracts should be targeted primarily at healthcare decision makers (clinicians, informed consumers and policy makers) rather than just to researchers. Terminology should be reasonably comprehensible to a general rather than a specialist healthcare audience. Abbreviations should be avoided, except where they are widely understood (for example, HIV). Where essential, other abbreviations should be spelt out (with the abbreviations in brackets) on first use. Names of drugs and interventions that can be understood internationally should be used wherever possible. Trade names should not be used. The content under each heading in the abstract should be as follows: Background: This should be one or two sentences to explain the context or elaborate on the purpose and rationale of the review. If this version of the review is an update of an earlier one, it is helpful to include a sentence such as “This is an update of a Cochrane review first published in YEAR, and previously updated in YEAR”. Objectives: This should be a precise statement of the primary objective of the review, ideally in a single sentence, matching the Objectives in the main text of the review. Where possible the style should be of the form “To assess the effects of [intervention or comparison] for [health problem] for/in [types of people, disease or problem and setting if specified]”. Search methods: This should list the sources and the dates of the last search, for each source, using the active form ‘We searched….’ or, if there is only one author, the passive form can be used, for example, ‘Database X, Y, Z were searched’. Search terms should not be listed here. If the CRG’s Specialized Register was used, this should be listed first in the form ‘Cochrane X Group Specialized Register’. The order for listing other databases should be the Cochrane Central Register of Controlled Trials, MEDLINE, EMBASE, other databases. The date range of the search for each database should be given. For the Cochrane Central Register of Controlled Trials this should be in the form ‘Cochrane Central Register of Controlled Trials (The Cochrane Library 2007, Issue 1)’. For most other databases, such as MEDLINE, it should be in the form ‘MEDLINE (January 1966 to December 2006)’. Searching of bibliographies for relevant citations can be covered in a generic phrase ‘reference lists of articles’. If there were any constraints based on language or publication status, these should be listed. If individuals or organizations were contacted to locate studies this should be noted and it is preferable to use ‘We contacted pharmaceutical companies’ rather than a listing of all the pharmaceutical companies contacted. If journals were specifically handsearched for the review, this should be noted but handsearching to help build the Specialized Register of the CRG should not be listed. Selection criteria: These should be given as ‘[type of study] of [type of intervention or comparison] in [disease, problem or type of people]’. Outcomes should only be listed here if the review was restricted to specific outcomes. Data collection and analysis: This should be restricted to how data were extracted and assessed, and not include details of what data were extracted. This section should cover whether data extraction and assessments of risk of bias were done by more than one person. If the authors contacted investigators
11.17

to obtain missing information, this should be noted here. What steps, if any, were taken to identify adverse effects should be noted. Main results: This section should begin with the total number of studies and participants included in the review, and brief details pertinent to the interpretation of the results (for example, the risk of bias in the studies overall or a comment on the comparability of the studies, if appropriate). It should address the primary objective and be restricted to the main qualitative and quantitative results (generally including not more than six key results). The outcomes included should be selected on the basis of which are most likely to help someone making a decision about whether or not to use a particular intervention. Adverse effects should be included if these are covered in the review. If necessary, the number of studies and participants contributing to the separate outcomes should be noted, along with concerns over quality of evidence specific to these outcomes. The results should be expressed narratively as well as quantitatively if the numerical results are not clear or intuitive (such as those from a standardized mean differences analysis). The summary statistics in the abstract should be the same as those selected as the defaults for the review, and should be presented in a standard way, such as ‘odds ratio 2.31 (95% confidence interval 1.13 to 3.45)’. Ideally, risks of events (percentage) or averages (for continuous data) should be reported for both comparison groups. If overall results are not calculated in the review, a qualitative assessment or a description of the range and pattern of the results can be given. However, ‘vote counts’ in which the numbers of ‘positive’ and ‘negative’ studies are reported should be avoided. Authors’ conclusions: The primary purpose of the review should be to present information, rather than to offer advice or recommendations. The Authors’ conclusions should be succinct and drawn directly from the findings of the review so that they directly and obviously reflect the main results. Assumptions should generally not be made about practice circumstances, values, preferences, tradeoffs; and the giving of advice or recommendations should generally be avoided. Any important limitations of data and analyses should be noted. Important conclusions about the implications for research should be included if these are not obvious.
Box 11.8.a: Hypothetical example of an abstract
(For the review ‘A versus B for treating influenza in adults’ by Peach A, Apricot D, Plum P.)
Background A and B both have antiviral properties, but they are not widely used due to incomplete knowledge of their properties and concerns about possible adverse effects. This is an update of a Cochrane review first published in 1999, and previously updated in 2006. Objectives To assess the effects of A and B in adults with influenza. Search methods We searched the Cochrane Acute Respiratory Infections Group Specialized Register (15 February 2007), the Cochrane Central Register of Controlled Trials (The Cochrane Library Issue 1, 2007), MEDLINE (January 1966 to January 2007), EMBASE (January 1985 to December 2006) and reference lists of articles. We also contacted manufacturers and researchers in the field. Selection criteria Randomized and quasi-randomized studies comparing A and/or B with placebo, or comparing doses or schedules of A and /or B in adults with influenza. Data collection Two authors independently assessed trial quality and extracted data. We contacted study authors for additional information. We collected adverse effects information from the trials.
11.18
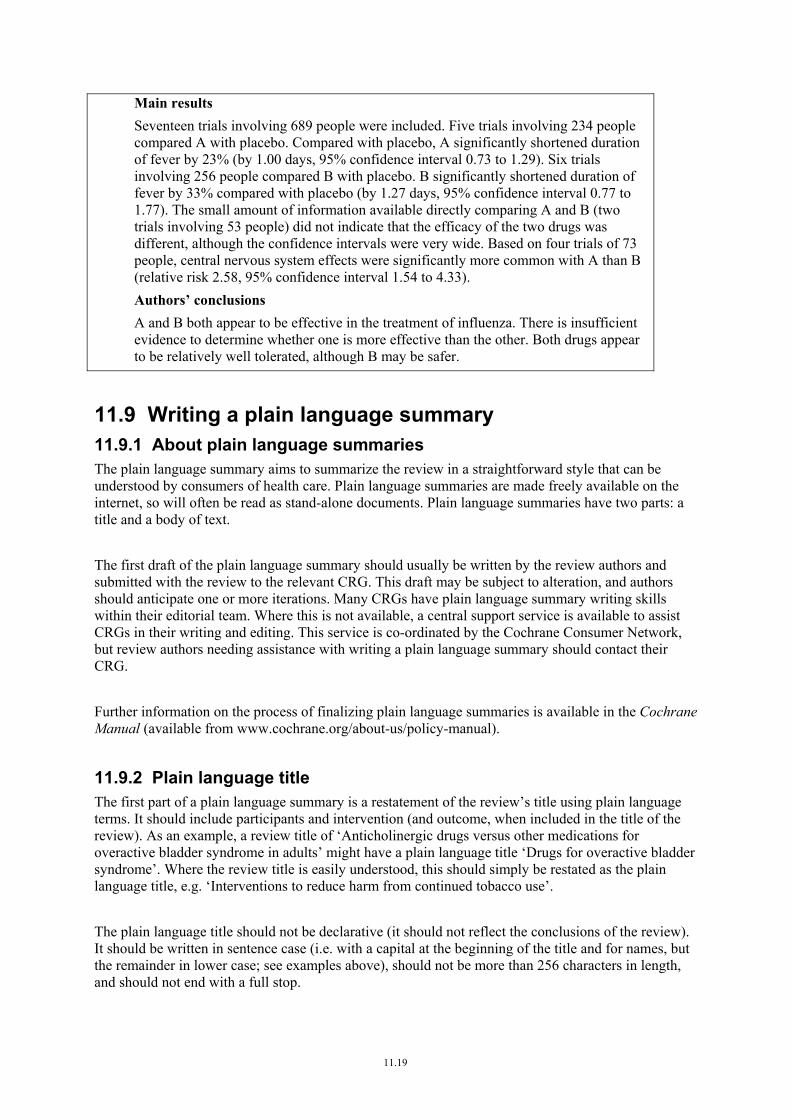
Main results Seventeen trials involving 689 people were included. Five trials involving 234 people compared A with placebo. Compared with placebo, A significantly shortened duration of fever by 23% (by 1.00 days, 95% confidence interval 0.73 to 1.29). Six trials involving 256 people compared B with placebo. B significantly shortened duration of fever by 33% compared with placebo (by 1.27 days, 95% confidence interval 0.77 to 1.77). The small amount of information available directly comparing A and B (two trials involving 53 people) did not indicate that the efficacy of the two drugs was different, although the confidence intervals were very wide. Based on four trials of 73 people, central nervous system effects were significantly more common with A than B (relative risk 2.58, 95% confidence interval 1.54 to 4.33). Authors’ conclusions A and B both appear to be effective in the treatment of influenza. There is insufficient evidence to determine whether one is more effective than the other. Both drugs appear to be relatively well tolerated, although B may be safer.
11.9 Writing a plain language summary 11.9.1 About plain language summaries The plain language summary aims to summarize the review in a straightforward style that can be understood by consumers of health care. Plain language summaries are made freely available on the internet, so will often be read as stand-alone documents. Plain language summaries have two parts: a title and a body of text. The first draft of the plain language summary should usually be written by the review authors and submitted with the review to the relevant CRG. This draft may be subject to alteration, and authors should anticipate one or more iterations. Many CRGs have plain language summary writing skills within their editorial team. Where this is not available, a central support service is available to assist CRGs in their writing and editing. This service is co-ordinated by the Cochrane Consumer Network, but review authors needing assistance with writing a plain language summary should contact their CRG. Further information on the process of finalizing plain language summaries is available in the Cochrane Manual (available from www.cochrane.org/about-us/policy-manual).
11.9.2 Plain language title The first part of a plain language summary is a restatement of the review’s title using plain language terms. It should include participants and intervention (and outcome, when included in the title of the review). As an example, a review title of ‘Anticholinergic drugs versus other medications for overactive bladder syndrome in adults’ might have a plain language title ‘Drugs for overactive bladder syndrome’. Where the review title is easily understood, this should simply be restated as the plain language title, e.g. ‘Interventions to reduce harm from continued tobacco use’. The plain language title should not be declarative (it should not reflect the conclusions of the review). It should be written in sentence case (i.e. with a capital at the beginning of the title and for names, but the remainder in lower case; see examples above), should not be more than 256 characters in length, and should not end with a full stop.
11.19

11.9.3 Summary text The second part, or body, of the plain language summary should be no more than 400 words in length and should include: • A statement about why the review is important: for example definition of and background to the
healthcare problem, signs and symptoms, prevalence, description of the intervention and the rationale for its use.
• The main findings of the review: this could include numerical summaries when the review has reported results in numerical form, but these should be given in a general and easily understood format. Results in the plain language summary should not be presented any differently from in the review (i.e. no new results should appear in the summary). Where possible an indication of the number of trials and participants on which the findings are based should be provided.
• A comment on any adverse effects. • A brief comment on any limitations of the review (for example trials in very specific populations
or poor methods of included trials). At the end of the plain language summary authors may give web links (for example to other information or decision aids on CRG web sites, providing that these comply with The Cochrane Collaboration policy on web links. Graphs or pictures should not be included in the plain language summary. As with other components of a Cochrane review, plain language summaries should follow the format of the Cochrane Style Guide (available from http://www.cochrane.org/training/authors-mes/cochrane-style-guide/cochrane-style-guide).
11.10 Chapter information Authors: Holger J Schünemann, Andrew D Oxman, Julian PT Higgins, Gunn E Vist, Paul Glasziou and Gordon H Guyatt on behalf of the Cochrane Applicability and Recommendations Methods Group and the Cochrane Statistical Methods Group. This chapter should be cited as: Schünemann HJ, Oxman AD, Higgins JPT, Vist GE, Glasziou P, Guyatt GH. Chapter 11: Presenting results and ‘Summary of findings’ tables. In: Higgins JPT, Green S (editors), Cochrane Handbook for Systematic Reviews of Interventions. Version 5.1.0 [updated March 2011]. The Cochrane Collaboration, 2011. Available from www.cochrane-handbook.org. Acknowledgements: Professor Penny Hawe contributed to the text on adverse effects. Jon Deeks provided helpful contributions. Sally Green, Janet Wale and Gill Gyte developed the guidance on plain language summaries, and we also drew on guidance for narrative synthesis by Rebecca Ryan and the Consumers and Communication Review Group. The material on writing abstracts builds on earlier versions of the Handbook. For details of previous authors and editors of the Handbook, please refer to Section 1.4. For details of the Cochrane Applicability and Recommendations Methods Group, see Chapter 12 (Box 12.8.a); for the Cochrane Statistical Methods Group, see Chapter 9 (Box 9.8.a). Conflict of interest: Holger Schünemann, Andrew Oxman, Gunn Vist, Paul Glasziou and Gordon Guyatt have, to varying degrees, taken leadership roles in the GRADE Working Group from which many of the ideas around ‘Summary of findings’ tables have arisen.
11.11 References Clarke 2006 Clarke M, Hopewell S, Juszczak E, Eisinga A, Kjeldstrøm M. Compression stockings for preventing deep vein thrombosis in airline passengers. Cochrane Database of Systematic Reviews 2006, Issue 2. Art No: CD004002.
Deeks 2001 Deeks JJ, Altman DG. Effect measures for meta-analysis of trials with binary outcomes. In: Egger M,
11.20
11.21
Davey Smith G, Altman DG (editors). Systematic Reviews in Health Care: Meta-analysis in Context (2nd edition). London (UK): BMJ Publication Group, 2001.
Engels 2000 Engels EA, Schmid CH, Terrin N, Olkin I, Lau J. Heterogeneity and statistical significance in meta-analysis: an empirical study of 125 meta-analyses. Statistics in Medicine 2000; 19: 1707-1728.
GRADE Working Group 2004 GRADE Working Group. Grading quality of evidence and strength of recommendations. BMJ 2004; 328: 1490-1494.
Hind 2007 Hind D, Booth A. Do health technology assessments comply with QUOROM diagram guidance? An empirical study. BMC Med Res Methodol 2007; 7: 49.
Lewis 2001 Lewis S, Clarke M. Forest plots: trying to see the wood and the trees. BMJ 2001; 322: 1479-1480.
Liberati 2009 Liberati A, Altman DG, Tetzlaff J, Mulrow C, Gotzsche PC, Ioannidis JP, Clarke M, Devereaux PJ, Kleijnen J, Moher D. The PRISMA statement for reporting systematic reviews and meta-analyses of studies that evaluate health care interventions: explanation and elaboration. PLoS Medicine 2009; 6: e1000100.


![1. Select the references you want to export Select your ...airways.cochrane.org/sites/airways.cochrane.org/files/public/uploads... · EndNote X4 - [My EndNote Library_demo.enl] Fie](https://static.fdocuments.in/doc/165x107/5f05d5e47e708231d414f2d9/1-select-the-references-you-want-to-export-select-your-endnote-x4-my-endnote.jpg)


