
CHAPTER 1 SIGNAL PROPAGATION IN DWDM OPTICAL...
35
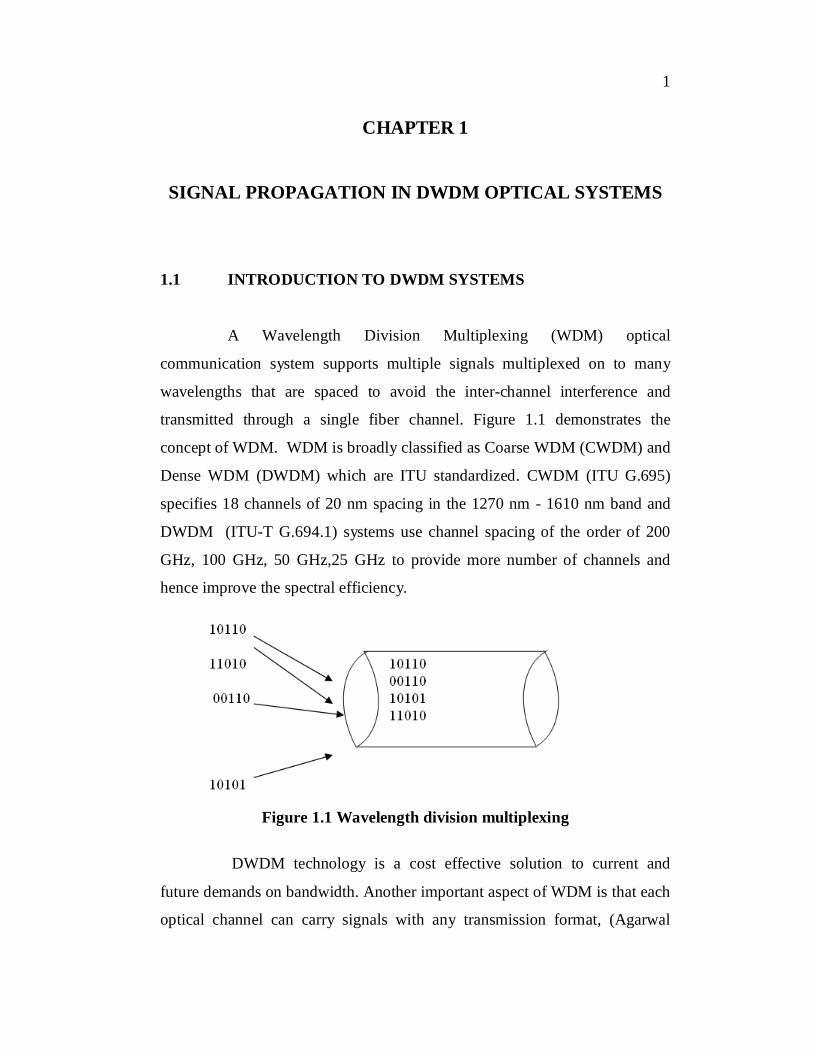
1 CHAPTER 1 SIGNAL PROPAGATION IN DWDM OPTICAL SYSTEMS 1.1 INTRODUCTION TO DWDM SYSTEMS A Wavelength Division Multiplexing (WDM) optical communication system supports multiple signals multiplexed on to many wavelengths that are spaced to avoid the inter-channel interference and transmitted through a single fiber channel. Figure 1.1 demonstrates the concept of WDM. WDM is broadly classified as Coarse WDM (CWDM) and Dense WDM (DWDM) which are ITU standardized. CWDM (ITU G.695) specifies 18 channels of 20 nm spacing in the 1270 nm - 1610 nm band and DWDM (ITU-T G.694.1) systems use channel spacing of the order of 200 GHz, 100 GHz, 50 GHz,25 GHz to provide more number of channels and hence improve the spectral efficiency. Figure 1.1 Wavelength division multiplexing DWDM technology is a cost effective solution to current and future demands on bandwidth. Another important aspect of WDM is that each optical channel can carry signals with any transmission format, (Agarwal
Transcript of CHAPTER 1 SIGNAL PROPAGATION IN DWDM OPTICAL...
1
CHAPTER 1
SIGNAL PROPAGATION IN DWDM OPTICAL SYSTEMS
1.1 INTRODUCTION TO DWDM SYSTEMS
A Wavelength Division Multiplexing (WDM) optical
communication system supports multiple signals multiplexed on to many
wavelengths that are spaced to avoid the inter-channel interference and
transmitted through a single fiber channel. Figure 1.1 demonstrates the
concept of WDM. WDM is broadly classified as Coarse WDM (CWDM) and
Dense WDM (DWDM) which are ITU standardized. CWDM (ITU G.695)
specifies 18 channels of 20 nm spacing in the 1270 nm - 1610 nm band and
DWDM (ITU-T G.694.1) systems use channel spacing of the order of 200
GHz, 100 GHz, 50 GHz,25 GHz to provide more number of channels and
hence improve the spectral efficiency.
Figure 1.1 Wavelength division multiplexing
DWDM technology is a cost effective solution to current and
future demands on bandwidth. Another important aspect of WDM is that each
optical channel can carry signals with any transmission format, (Agarwal

2
1997). In order to realize such high capacity, systems with spectral efficiency
beyond 0.4b/s/Hz and data rate higher than 40 Gb/s need to be designed using
the available bandwidth, (Fukuchi 2002, Bigo et al 2001).
1.1.1 Operational Principles of DWDM
A general setup for an optically amplified DWDM communication
system is shown in Figure 1.2.
Figure 1.2 An optically amplified DWDM system ( Binh 2003)
The transmitter consists of a laser source, modulation device and a
suitable line coding. Modulation can be either direct or external, direct
modulation causes change in the refractive index of the material for higher
input power and results in chirping effect (Binh 2003). In the case of external
modulation, the laser is operated with a constant bias current and modulation
is carried out using an external modulating device (Kaiser 2000). The external
modulator can be an electro-optic Lithium Niobate (LiNbO3) modulator used
in a Mach-Zehnder Interferometer (MZIM) configuration. Figure 1.3
illustrates this modulator.
3
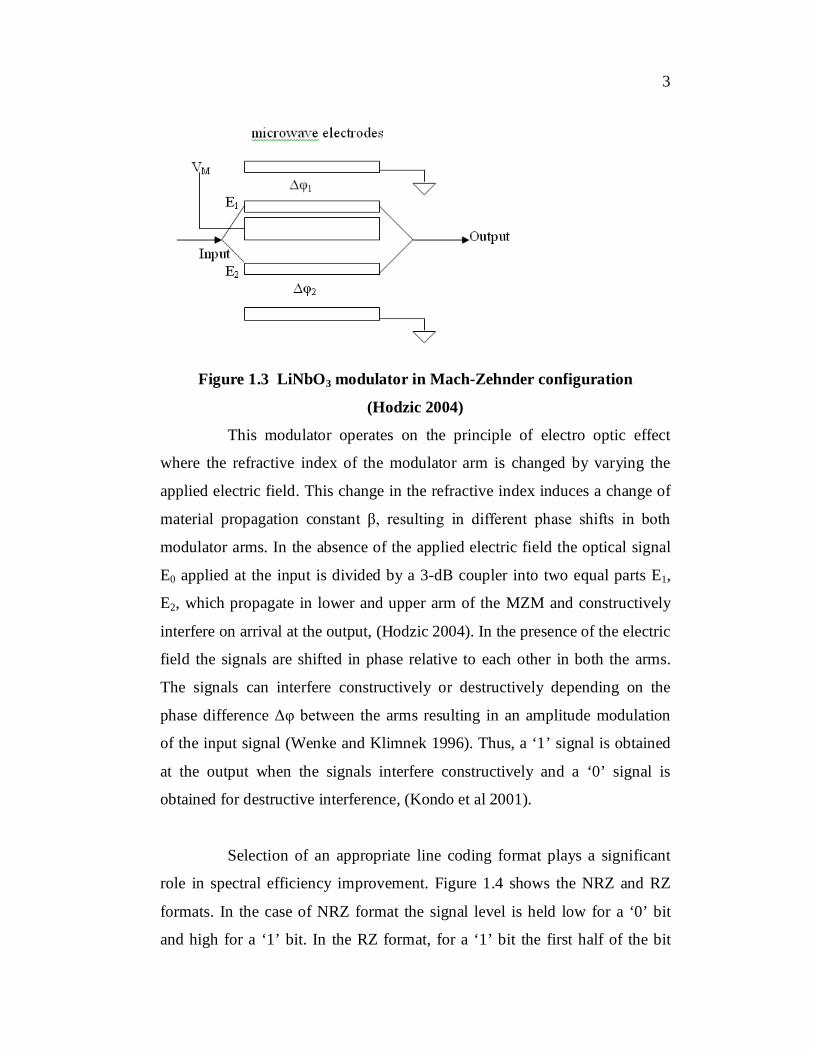
Figure 1.3 LiNbO3 modulator in Mach-Zehnder configuration
(Hodzic 2004)
This modulator operates on the principle of electro optic effect
where the refractive index of the modulator arm is changed by varying the
applied electric field. This change in the refractive index induces a change of
material propagation constant β, resulting in different phase shifts in both
modulator arms. In the absence of the applied electric field the optical signal
E0 applied at the input is divided by a 3-dB coupler into two equal parts E1,
E2, which propagate in lower and upper arm of the MZM and constructively
interfere on arrival at the output, (Hodzic 2004). In the presence of the electric
field the signals are shifted in phase relative to each other in both the arms.
The signals can interfere constructively or destructively depending on the
phase difference Δφ between the arms resulting in an amplitude modulation
of the input signal (Wenke and Klimnek 1996). Thus, a ‘1’ signal is obtained
at the output when the signals interfere constructively and a ‘0’ signal is
obtained for destructive interference, (Kondo et al 2001).
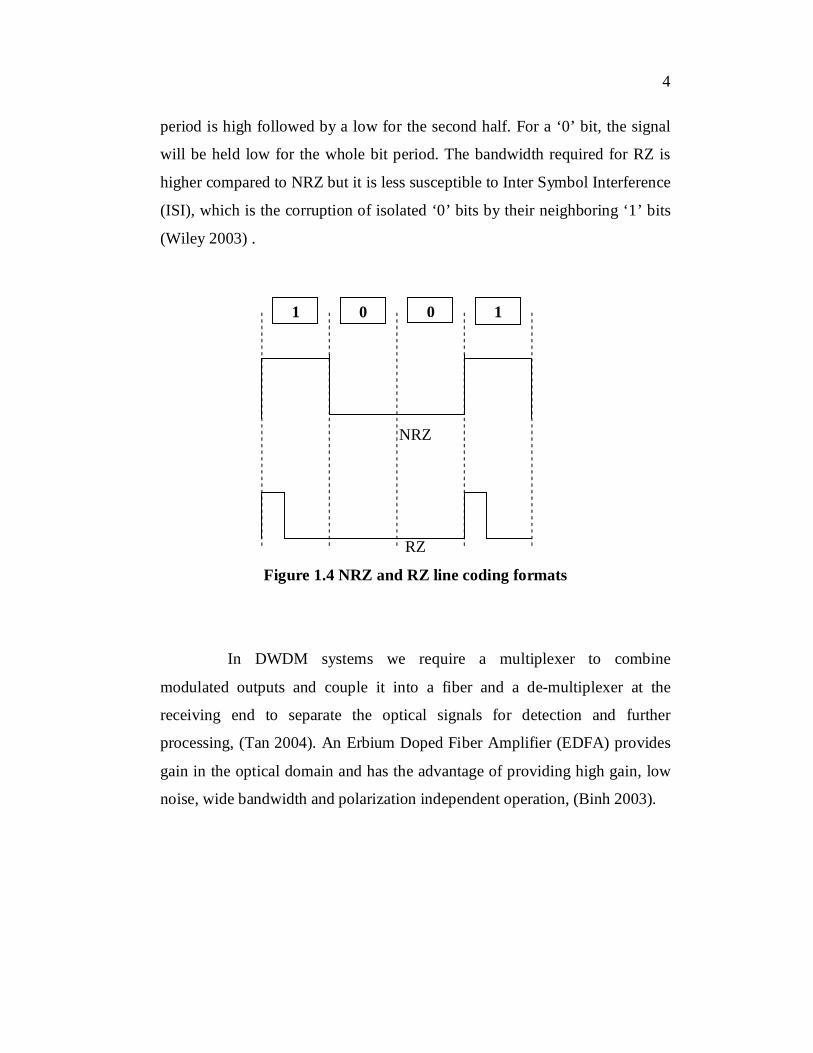
Selection of an appropriate line coding format plays a significant
role in spectral efficiency improvement. Figure 1.4 shows the NRZ and RZ
formats. In the case of NRZ format the signal level is held low for a ‘0’ bit
and high for a ‘1’ bit. In the RZ format, for a ‘1’ bit the first half of the bit
4
period is high followed by a low for the second half. For a ‘0’ bit, the signal
will be held low for the whole bit period. The bandwidth required for RZ is
higher compared to NRZ but it is less susceptible to Inter Symbol Interference
(ISI), which is the corruption of isolated ‘0’ bits by their neighboring ‘1’ bits
(Wiley 2003) .
NRZ
RZ
Figure 1.4 NRZ and RZ line coding formats
In DWDM systems we require a multiplexer to combine
modulated outputs and couple it into a fiber and a de-multiplexer at the
receiving end to separate the optical signals for detection and further
processing, (Tan 2004). An Erbium Doped Fiber Amplifier (EDFA) provides
gain in the optical domain and has the advantage of providing high gain, low
noise, wide bandwidth and polarization independent operation, (Binh 2003).
1 0 0 1
5
1.2 NON-LINEAR PHENOMENA IN OPTICAL FIBERS
Non-linearities in optical fibers can be classified as: (1) non-
linearities that arise from stimulated in-elastic scattering namely Stimulated
Raman Scattering (SRS) and Stimulated Brillouin Scattering (SBS), and
(2) non-linearities that arise from optically induced changes in the refractive
index which result either in phase modulation namely Self Phase Modulation
(SPM) and Cross Phase Modulation (XPM) or in the mixing of several waves
and generation of new frequencies namely Modulation Instability and Four-
Wave Mixing (FWM ), (Agarwal 1995).
1.2.1 Self Phase Modulation (SPM)
Increase in the input intensity changes the refractive index of the
medium which in turn results in a phase modulation of the optical beam. This
rate of phase modulation produces a frequency chirping resulting in spectral
broadening. This non-linear spectral broadening adds to the chromatic
dispersion of the fiber in the normal dispersion region of λ < λZDWL.. In the
anomalous dispersion region of λ > λZDWL the non-linear dispersion to some
extent cancels chromatic dispersion leading to pulse compression or when
exactly balanced results in the formation of solitons ( Agarwal 1995).
1.2.2 Cross Phase Modulation (XPM)
This effect arises when a change in the intensity of one beam
modulates the phase of a co-propagating wave. The chirp induced by the
XPM effect can combine with the different parts of the signal pulse traveling
with different GVD and result in a multi-peak temporal structure, (Sano et al
2000).
6
1.2.3 Solitons
Solitons are generated by the combined influence of SPM and
chromatic dispersion. This pulse retains its temporal and spectral shape as it
propagates and can travel undistorted over long distances Agarwal (1995).
The major type of soliton pulse that occurs in a non-linear fiber is the
Dispersion Managed Solitons (DMS), where the intrinsic dispersion of the
fiber can be overcome by periodically alternating the dispersion of the fiber so
that local GVD remains relatively large compared to average GVD and can
compensate for the non-linear dispersion, (Suzuki et al 1995, Jacob and Carter
1997). Hasegawa (2002) has developed the models for the optical solitons in
the higher data rate of transmission.
1.2.4 Parametric Processes and FWM
Parametric Processes in non-linear optics involve the energy
transfer between the waves leading to χ (3) non-linearity. When the phase
matching occurs where they have the same phase velocity this parametric
process is enhanced. In such conditions when three waves interact it produces
a fourth one and the interaction is between the fields and not between the
powers or intensities. The frequencies ‘’ and wave vectors ‘’ must be
conserved and wave vector conservation is called as phase matching. These
conditions are shown in Equations (1.1) and (1.2) , (Agarwal 1995).
±ω1 ± ω2 ± ω3 = ± ω4 (1.1)
± κ1 ± κ2 ± κ3 = ± κ 4 (1.2)
Four wave mixing (FWM) is a parametric process where three different
frequencies interact to produce a cross talk spectral component that may fall
in the desired signal frequency band, (Hill et al 1978).

7
1.3 LITERATURE REVIEW
The main challenges in the high power and the high data rate
optical transmissions especially in DWDM systems are the simultaneous
interaction of SPM and XPM, XPM and FWM, SRS and FWM which
changes the temporal and spectral characteristics of the pulses. Research on
fiber design, transmission modulation format, dispersion mapping, receiver
configuration, channel spacing technique, pulse propagation characteristics,
Filtering technique etc contribute towards reducing the linear and non-linear
distortions and improve system performance. In this thesis a detailed study
has been done to investigate the impact of FWM on the performance of
DWDM systems with reference to improvement in the spectral efficiency of
the optical system.
Impact of non-linear effects on pulse propagation and pulse
evolution in a fiber are usually analyzed using the classical Non-Linear
Schrödinger Equation (NLSE), (Agarwal 2001), which is a non-linear partial
differential equation, with a closed form analytical solution existing, only for
some specific cases. Several numerical methods were proposed for the
investigation of non-linear effects in optical fibers (Taha and Ablowitz 1984).
The most frequently used numerical method is the Split-Step Fourier Method
(SSFM) (Harvey et al 2002), which belongs to a group of pseudo-spectral
models characterized by small computing time with sufficient accuracy. The
principle of SSFM is based on separately considering the non-linear and
linear propagation effects in a single fiber segment.
The SSFM accuracy can be increased by choosing the step width
appropriately. A variety of step size selection criteria have been proposed for
optimizing the split step method. A constant step size through out the
transmission path is considered by Agrawal in 1995. The logarithmic step size
8
method is designed to efficiently suppress FWM products by Bosco et al
(2000). In the walk off method, the step size is chosen to be inversely
proportional to the product of the absolute value of dispersion and the spectral
bandwidth of the signal (Sinkin et al 2003). This method is efficient for low
power multi-channel systems. The proper step size has to be recognized
considering the system parameters such as channel spacing, power per
channel and number of channels.
In this thesis the NLSE is analyzed by keeping constant and
variable step sizes, the upper bound being set by the maximum non-linear
phase shift, using iterative and non-iterative techniques.
Limitations on light wave communications imposed by fiber non-
linearities like SPM, XPM, Stimulated Inelastic Scattering (SRS) effects and
FWM effects were studied for the first time by Chraplyvy in 1990, in which
the system power limitations has been plotted as a function of optical
channels. Each of these non-linearities will affect specific light wave systems
in different ways. The effect of fiber non-linearity on long distance
communication in which the losses are compensated by the fiber amplifiers
was studied by Marcuse (1991).
Chraplyvy in 1990, has shown that if two WDM channels are sent in a
uniform fiber without dispersion fluctuations, catastrophic build up of four
wave mixing occurs, if one of the channel wavelength is at the zero dispersion
wavelength. The location of any channel on the zero dispersion wave length is
to be avoided to reduce FWM effects (Marcuse 1991). Light modulated in
ASK format appears feasible at 2.5 Gb/s if two wavelengths in the normal
dispersion wavelength region having 2 nm to 3 nm spacing and show less
impact of non-linear effects (Tkach et al 1995).
9
In many multi-channel applications low dispersion fibers are
utilized which necessitates consideration of XPM effects. Several
experimental and analytical results have been presented in the literature
highlighting the influence of XPM on WDM networks (Eiselt et al 1999, Hui
et al 1999 and Cartaxo 1999). Furst et al (2001) has determined the maximum
XPM limited distance on a SSMF and a NZDSF. For both fibers all the fiber
spans are fully post compensated by inline DCF where the DCF is optimized
to minimize the XPM induced Q penalty for 100 GHz channel spacing.
Belloti et al (1998) discussed about the intensity distortion induced by cross
phase modulation and dispersion. The effect of Cross phase modulation in
multi span WDM optical system has been demonstrated by (Rongquing
2000).
In this thesis the emphasis is on the effect of FWM than XPM,
since, the influence of FWM quadruples when halving the channel spacing,
while XPM effects are approximately inversely proportional to the channel
spacing (Shtaif et al 1999). Furthermore signal distortion by XPM can be
mitigated by optimal dispersion compensation schemes (Saunders et al 1996),
whereas FWM distortions are resistant to dispersion compensation. Hence
FWM ultimately limits the channel density and capacity of a DWDM system.
An expression was formulated by Marcuse in 1991, for the power Pi j k (L)
existing in a fiber at length L denoting FWM effect generated due to
frequencies fi ,fj and fk and also the effect of the channel spacing was studied
and concluded that the impact of FWM is low for Unequally Spaced channels
(USC). The power loss Pi in one channel can be computed by adding the
power that has been transferred to frequency fi j k at the end of the fiber with
the power lost due to FWM during propagation (Tkach 1995). The effect of
FWM can be minimized by reducing the pulse overlapping in the WDM
systems (Matera et al 2000).
10
The value of Pi j k is dependent on the relation between the
propagation constants of interacting channels. The difference between
propagation constants Δβ for different channels governs the phase matching
and the efficiency of FWM (Forgheiri et al 1995) Forgheri(1997). The larger
the phase mismatch the smaller is the FWM efficiency and hence SMF
performs better than NZDSF considering FWM products.
The impact of FWM on the system performance depends on the
wavelength at which new spectral components are generated (Shibata et al
1987). Forghieri in 1997 has adapted a design methodology for unequal
spacing in which the frequency separation of any two channels is different
from that of any other pair of channels. The experimental and theoretical
results showed that Pi j k depends on the number of channels and becomes
constant if the number of channels exceeds a certain value, e.g. number of
channels > 24 (Inoue 1991). The FWM effect can also be reduced by using a
novel hybrid wavelength and Time division multiplexing techniques (Okada
et al 1998).
In this thesis the influence of FWM cross talk power in SSMF,
NZDSF and DSF is analyzed and compared when the DWDM channels are
equally and unequally spaced.
Intra-channel FWM (IFWM) is due to the correlation between the
spectral components of a single channel. The larger the time separation (bit
period) between the pulses, the smaller is the energy transfer (Kumar 2001).
This effect will be dominating in the equally spaced pulses (constant phase)
where the non-linear interaction between optical pulses is resonant. Therefore
it is essential that IFWM be suppressed by alternate phase modulation
between adjacent pulses. IFWM represents a dominant performance limitation
in systems with a short bit slot e.g. 40 Gb/s systems (Konrad and Petermann
11
2001) and a sequential dispersion compensation scheme in which the
dispersion compensation is done partly at the transmitter and partly at the
receiver side. Hence the optimization of dispersion compensation for example
by the use of a certain amount of a pre-compensation (Killey et al 2000) is
crucial for their efficient suppression. By pre-chirping of optical pulses at the
transmitter side (say by phase modulation), different spacing between pulses
and a reduction of the non-linear resonance can be accomplished.
In this thesis the effect of varying the DCF length for a fixed length
of SSMF fiber is studied under three dispersion compensating schemes
namely pre-, post-, and symmetrical compensation and the Q factor is
estimated to compare the performances.
Generally, In a DWDM system, the spectral efficiency is defined
as the ratio of the capacity per channel to the channel spacing. To decrease the
channel spacing in order to exploit the entire fiber bandwidth and to improve
the spectral efficiency of the system, a modulation format that has the highest
tolerance to non-linear effects need to be identified. Bergano et al (1999)
studied the wavelength division multiplexing for the long haul system at 900
km with 45 km spacing for the NRZ format at 5 Gb/s for 20 channels.
Vareille et al (2001) simulated 50 GHz spacing with 32 channels with 50 km
amplifier spacing and 1000 km and improved the Q factor performances using
RZ signal format. Since the terabit capacity per fiber has already become
commercially viable higher bit rates of either 20 Gb/s or 40 Gb/s is the way
forward.
Yano et al in 1998 showed that duo binary format together with
Polarization Division Multiplexing (PDM) can increase the spectral efficiency
up to 1 b/s/Hz for 100 km but resistance to non-linear effects like SPM is not
so large at 10 Gb/s. NRZ signal modulation format showed a spectral
12
efficiency of 0.8 b/s/Hz with PDM and 1.2 b/s/Hz with vestigial sideband
modulation when the de-multiplexer settings are adapted for suppressing
PDM (Bigo et al 2001). The results obtained proved to be much worse in the
case of long haul transmission systems where the impact of polarization mode
dispersion and Cross phase modulation dominated while using the
polarization division multiplexing technique.
Sano (2000) reduced the impact of non-linear effects by Chirped
RZ (CRZ) signal format. To further improve the performance Ohhira et al
(2001) discussed about the alternate chirp RZ (AC-RZ) format which
compensates the dispersion with alternate values and almost nullifies the
residual dispersion and mitigates the effect of SPM. Menyuk and Grigorian
(2002) studied the performance and the eye measurement diagram for CRZ
systems. Morita et al (2000) worked on the dispersion managed soliton (DM-
soliton) and found that in spite of larger resistance to SPM-GVD effect it
requires wider bandwidth. Hence this degrades the spectral efficiency of the
system at higher date rate and more number of channels. Cundiff et al (1999)
has studied the propagation of highly chirped pulses in the presence of the
non linear effects. Mingchia (2004) studied the fiber nonlinearity limitations
in DWDM systems. Sullivan (1997) presented the impact of modulation
instability in multi span optical amplified IMDD systems were pre
Blow and Wood (1989) derived a single wave equation relating the
transient Stimulated Raman effect in fiber, Also formula for small signal gain
spectrum which includes the effect of SRS ,FWM and modulation
instabilities are derived. Menyuk et al (1991) derived the equations governing
the Raman Effect in birefringent fibers both the parallel and perpendicular
Raman effects are taken into considerations. Bigo et al (1999) related the
effect of the power distribution over various types of fibers and Raman gain
coefficient is estimated for the same. Stolen et al (1989) described the
13
response function of the Raman gain in time domain and also the effect of
Raman gain in the region of anomalous and normal dispersion has been
studied.
Miyamoto et al (2000) introduced Carrier Suppressed Return to
Zero (CS-RZ) format whose performance is further improved by using narrow
band optical band pass filters (Miyakawa et al 2001). Vestigial Side Band-RZ
(VSB-RZ) format is employed by Tsuritani et al (2002) which can provide
large resistance to non-linear effect without increasing the spectral width.
Regarding modulation formats for 40 Gb/s DWDM applications,
Carrier Suppressed Return to Zero (CS-RZ) is a promising format, because it
could be implemented by using conventional balanced receiver, encoder /
decoder and so on (Rasmussen et al 2002). CS-RZ is more robust to non-
linearity and band limitation than RZ and NRZ formats. Therefore CSRZ with
optical filtering would be one of the solutions for highly spectral efficient
Ultra-long-haul (ULH) transmission. The improvement in spectral efficiency
has been determined for asymmetrical and symmetrical pre-filtering CSRZ
technique by Cai et al (2002) and Agata et al (2003).
Non-binary modulation has longer symbol duration than binary and
offers improved resistance to transmission impairments, including Chromatic
and Polarization Mode Dispersions (PMD) (Wang and Kahn 2004). DPSK
has been recently employed for fiber transmission with various formats
including NRZ, RZ and CRZ. In the absence of fiber non-linearity all these
formats achieve the same SNR performance. However when the input power
and data rate is increased the non-linear effects deteriorate the performance
and is usually assessed by changes in the Q factor and eye pattern. Tonguz
and Wagner (2001) showed that for DPSK, the performance with optical pre-
amplification and interferometric detection is equivalent to that of the
14
standard differentially coherent detection. Xu et al (2003) compared the
performances of RZ PSK and on off keying in long haul dispersion managed
transmissions. In this thesis, the interferometric detection is used for all the
subsequent studies on PSK based systems.
The impact of ASE and non-linear effects like SPM and XPM on
the channel capacity has been studied by Green et al (2002). Mitra and Stark
in 2001 argued that the capacity of the DWDM system is limited most
fundamentally by XPM; as the signal propagates, chromatic dispersion
converts XPM induced phase modulation to intensity noise. Capacity
limitations caused by XPM was further studied by Green et al (2002). Using
perturbation methods Narimanou and Mitra (2002) found the channel capacity
of a single channel system. To quantify the SNR in the presence of XPM
noise, The impact of non-linear effects can be reduced or cancelled using
phase conjugation (Brener et al 2000). The noise introduced by inter-
modulation products is equivalent to an increase in the number of ASE
photons (Desuvire et al 2002). The quantum limited spectral efficiency
depends on SNR and the number of signal photons and the effect of fiber non-
linearity is equivalent to an increase in the number of ASE photons.
The interaction of ASE noise with the non-linear phase noise
induced by SPM and XPM will affect the signal phase, limiting the
performance of systems using phase modulated signals such as DPSK (Kim
and Gnauck 2003). The statistical properties of non-linear phase noise depend
on the mean non-linear phase shift and SNR (Ho 2003). Xu and Brandt 2002
studied the behavior of asymmetric Gaussian and non Gaussian statistics of
the optical communication systems.
Song et al (1999) derived a phase matching factor considering the
impact of SPM and XPM which shifts the peak FWM efficiency away from
15
the zero dispersion wavelength. Distributed Raman amplifiers are used to
reduce the ASE noise and improve the OSNR. Neilsen in 2000 studied the
performance of an optical system using Raman amplifiers without considering
the fiber non-linear effects.
In this thesis, a Carrier Suppressed RZ (CSRZ) formatted DQPSK
modulated 40-Gb/s DWDM transmission system using Hybrid Raman /
Erbium-doped fiber Amplifiers (HREA) considering the non-linear effects, is
investigated by simulation and the OSNR and the Q factor are estimated. The
narrow line width modulation format like CSRZ-DQPSK is generated by the
use of Fiber Bragg filtering in which different transfer functions can be
devised by proper combinations of the apodization profile, intensity and pitch
of the grating, (Kashyap 1999).
Low dispersion filters (LDF) based on FBGs have attracted
increased interest over the past few years (Ibsen et al 1998) due to their very
high selectivity, flat top spectral response, steep spectral roll off, low insertion
loss and flattened in-band group delay profile which permits their use in high
speed networks. For these reasons, these filters have found widespread
applications in low channel spacing (<50 GHz) Optical Add/Drop
Multiplexers (OADM) and hence in this thesis FBG-based LDF DWDM
filters are used in our studies for channel spacing of 20 GHz.
Foresteri (2000) evaluated the error probability in light wave
systems with chromatic dispersion, pre- and post- detection filtering. Menyuk
(2003) used Multi-canonical Monte Carlo simulation to obtain accurate BER
in optical communication systems.
16
Sinkin (2003) studied the effect of non-linearites on various
modulation formats like RZ, NRZ and other ASK formats considering SPM,
XPM and its impact on BER. Mizuochi et al (2003) made a comparative study
of DPSK and OOK DWDM systems over transoceanic distances and their
performance degradations due to non-linear noise. Mecozzi (2004) predicted
the probability density function of the non-linear noise to be Gaussian
distributed in PSK systems. When the fiber non-linearities such as the self
phase modulation, cross phase modulation and four wave mixing are not
considered, the ASE noise is said to have a Gaussian distribution and when
the fiber non-linearities are taken into account the ASE noise is said to have
Chi-squared distribution (Ronald Holzlohner 2002) due to the complex
interactions between signal and noise components.
In this thesis, BER analysis is carried out with both Gaussian and
Chi-square noise distributions and comparisons made and the dependency of
BER versus SNR on the modulation format is studied.
1.4 THESIS OBJECTIVES
The major objectives of the research work presented in this thesis are,
To study the impact of non-linear effects on pulse propagation
by solving the Non-linear Schrödinger equation using Split
Step Fourier method considering constant and varying step
sizes and iterative and non-iterative procedures using
MATLAB, the proposed variable step size being bounded by
the non-linear phase shift.
To study the impact of SRS effect in terms of Full Raman
Response and Inter-Band Scattering, by modifying the NLSE
and to study the effect of step size in the generation of
17
spurious non-linear cross talk components bounded by non-
linear phase shift.
To explore the concept of unequal channel allocation for
reducing the impact of FWM in DWDM systems, wherein the
unequal channel allocation based on Optical Orthogonal
Codes is studied and its performance with respect to FWM
generation in SSMF, NZDSF and DSF based DWDM systems
is investigated.
To compare the performance of DWDM systems with equal
and unequal channel spacing in terms of Q factor for various
modulation formats like RZ, CSRZ-DPSK and CSRZ-
DQPSK, so as to identify the best format suitable for high bit
rate systems.
To model the Phase shift keying modulations CSRZ-DQPSK
after studying various formats like RZ /NRZ - DPSK and RZ
/NRZ DQPSK using MATLAB SIMULINK, and also
compares performances when using various filtering
techniques like Super Gaussian Higher Order, Arrayed
Waveguide Grating and Fiber Bragg Filter.
To analyze the effect of varying the DCF length for a fixed
length of SSMF under pre-, post-, and symmetrical dispersion
compensation schemes and to compare Q factor performance
for RZ, NRZ and DQPSK modulation formats so as to identify
the best dispersion compensation scheme.
To study the spectral efficiency performance of CSRZ
DQPSK with hybrid Raman amplification, fiber Bragg for
narrow bandwidth filtering and pre-dispersion compensation.
18
To compare the BER for various modulation formats,
computed using saddle point approximation method using
improved numerical techniques like secant method and golden
section algorithm and thereby identify the best modulation
format for long haul high bit rate DWDM systems, that is
robust to dispersion and non-linear impairments.
1.5 THESIS ORGANIZATION
The thesis is organized into the following chapters:
Chapter 1 presents a brief introduction about DWDM systems and
non-linear phenomena in optical fibers. The literature review is presented
followed by the objectives of the research work. The impact of non-linear
effects on signal/pulse propagation in an optical fiber is studied using the Split
Step Fourier method for solving the Non-linear Schrödinger equation
considering constant and varying step sizes and iterative and non-iterative
procedures.
In Chapter 2 the limitations imposed by FWM components on
DWDM systems has been studied for equal channel spacing and unequal
spacing channel scenarios and the performance towards mitigating the effect
of FWM is analyzed for SSMF, NZDSF and DSF fibers.
In Chapter 3, the system modeling of various phase shift keying
modulation formats have been analyzed under the impact of various filtering
techniques, dispersion compensating techniques, channel spacing, fiber type
and non-linear effects, with the aim of identifying a suitable modulation
format that is robust to linear and non-linear impairments.
19
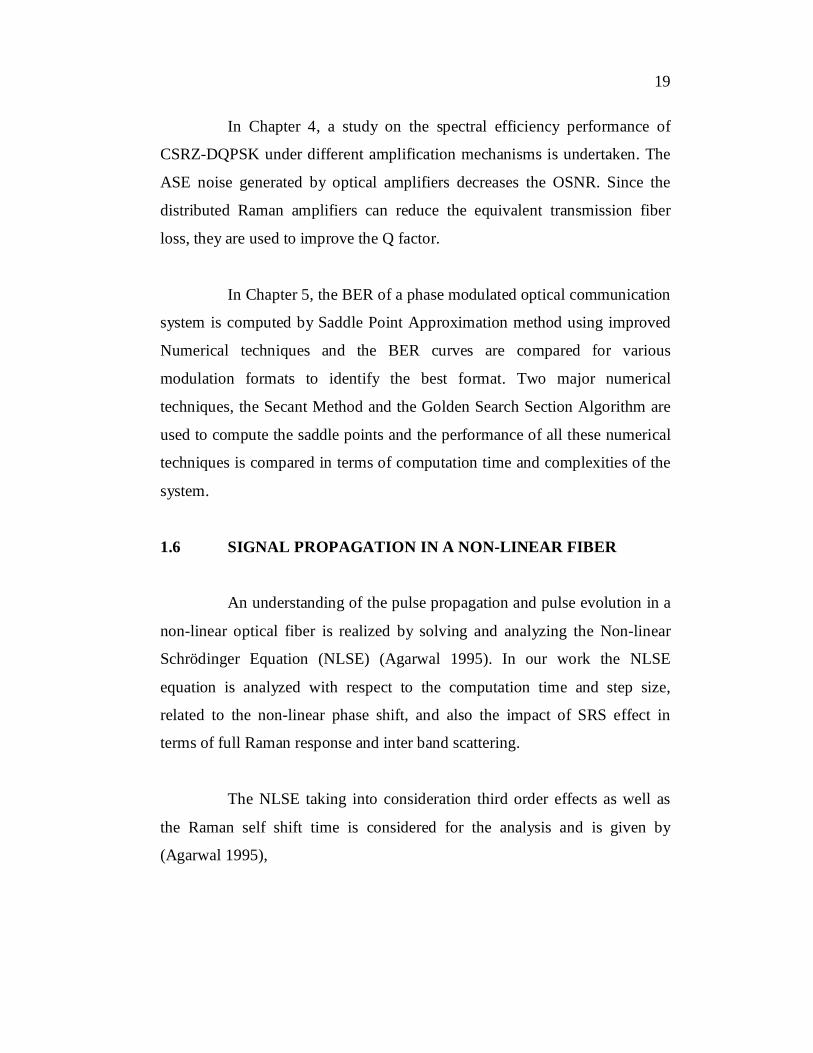
In Chapter 4, a study on the spectral efficiency performance of
CSRZ-DQPSK under different amplification mechanisms is undertaken. The
ASE noise generated by optical amplifiers decreases the OSNR. Since the
distributed Raman amplifiers can reduce the equivalent transmission fiber
loss, they are used to improve the Q factor.
In Chapter 5, the BER of a phase modulated optical communication
system is computed by Saddle Point Approximation method using improved
Numerical techniques and the BER curves are compared for various
modulation formats to identify the best format. Two major numerical
techniques, the Secant Method and the Golden Search Section Algorithm are
used to compute the saddle points and the performance of all these numerical
techniques is compared in terms of computation time and complexities of the
system.
1.6 SIGNAL PROPAGATION IN A NON-LINEAR FIBER
An understanding of the pulse propagation and pulse evolution in a
non-linear optical fiber is realized by solving and analyzing the Non-linear
Schrödinger Equation (NLSE) (Agarwal 1995). In our work the NLSE
equation is analyzed with respect to the computation time and step size,
related to the non-linear phase shift, and also the impact of SRS effect in
terms of full Raman response and inter band scattering.
The NLSE taking into consideration third order effects as well as
the Raman self shift time is considered for the analysis and is given by
(Agarwal 1995),
20
2 3
3 02 0 2 3
( )E E EE i ( )Z t 6 t
2
2 2R1 2
0
Ei{ E E E E Et t
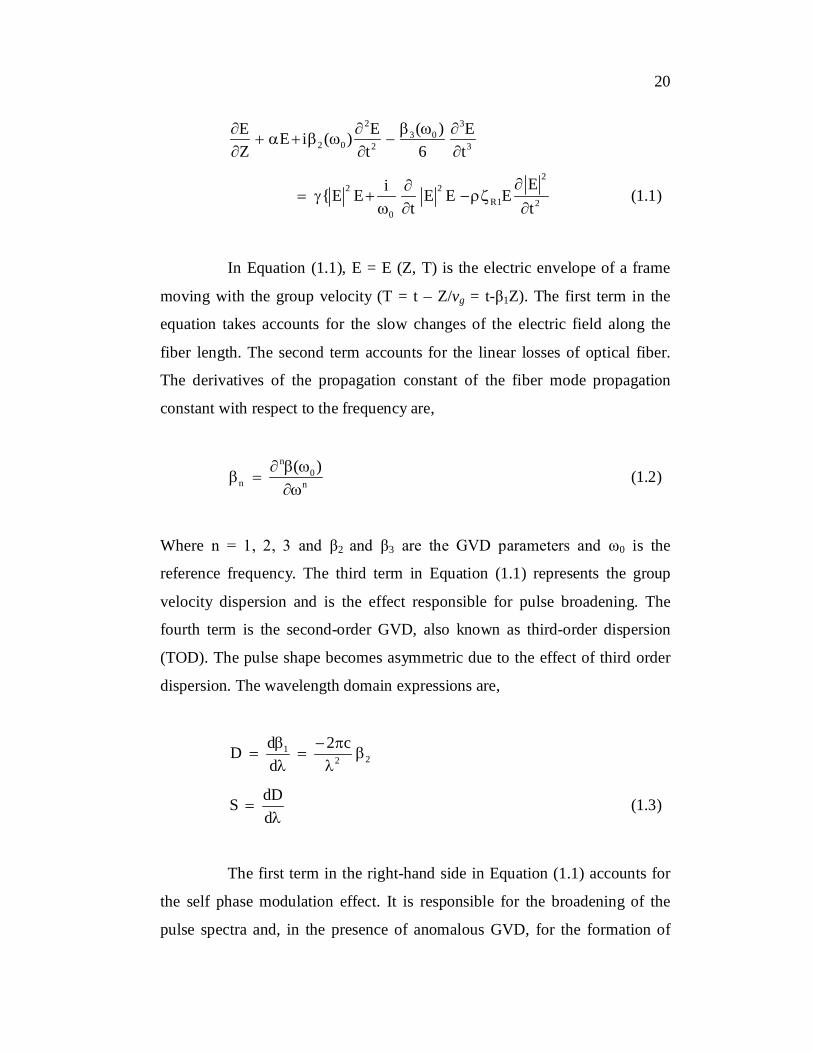
(1.1)
In Equation (1.1), E = E (Z, T) is the electric envelope of a frame
moving with the group velocity (T = t – Z/vg = t-β1Z). The first term in the
equation takes accounts for the slow changes of the electric field along the
fiber length. The second term accounts for the linear losses of optical fiber.
The derivatives of the propagation constant of the fiber mode propagation
constant with respect to the frequency are,
n
0n n
( )
(1.2)
Where n = 1, 2, 3 and β2 and β3 are the GVD parameters and ω0 is the
reference frequency. The third term in Equation (1.1) represents the group
velocity dispersion and is the effect responsible for pulse broadening. The
fourth term is the second-order GVD, also known as third-order dispersion
(TOD). The pulse shape becomes asymmetric due to the effect of third order
dispersion. The wavelength domain expressions are,
122
d 2 cDd
dDSd
(1.3)
The first term in the right-hand side in Equation (1.1) accounts for
the self phase modulation effect. It is responsible for the broadening of the
pulse spectra and, in the presence of anomalous GVD, for the formation of
21
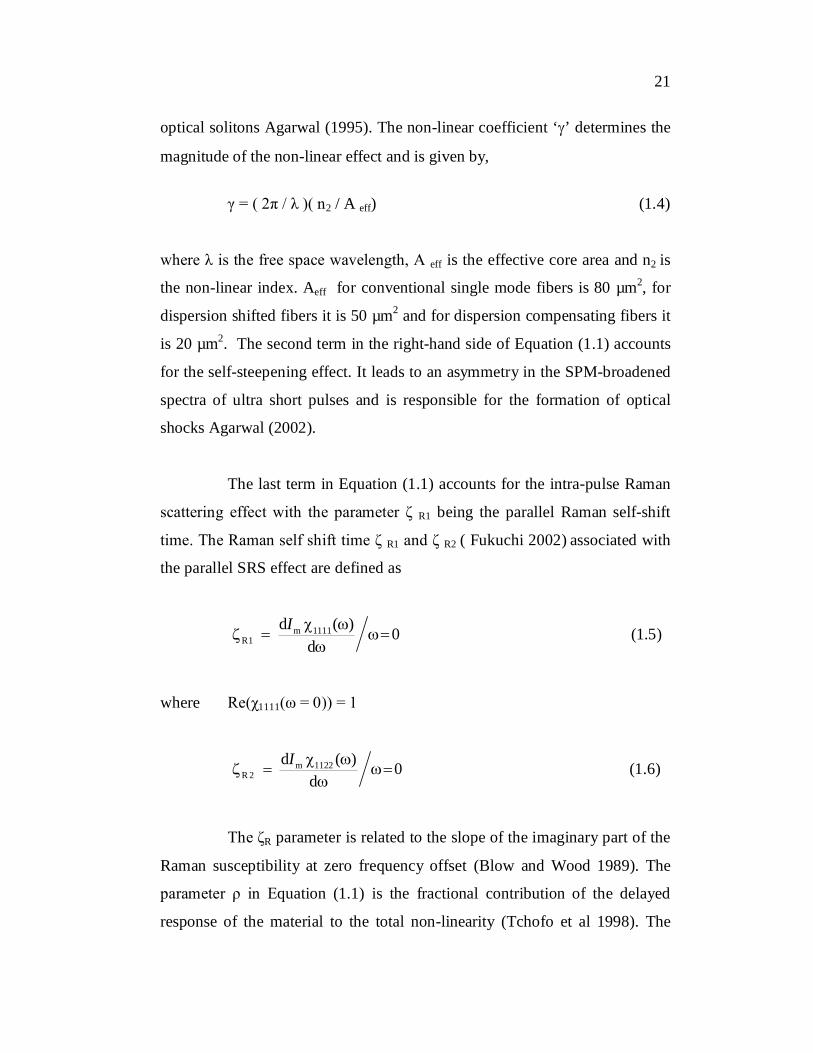
optical solitons Agarwal (1995). The non-linear coefficient ‘’ determines the
magnitude of the non-linear effect and is given by,
γ = ( 2π / λ )( n2 / A eff) (1.4)
where λ is the free space wavelength, A eff is the effective core area and n2 is
the non-linear index. Aeff for conventional single mode fibers is 80 µm2, for
dispersion shifted fibers it is 50 µm2 and for dispersion compensating fibers it
is 20 µm2. The second term in the right-hand side of Equation (1.1) accounts
for the self-steepening effect. It leads to an asymmetry in the SPM-broadened
spectra of ultra short pulses and is responsible for the formation of optical
shocks Agarwal (2002).
The last term in Equation (1.1) accounts for the intra-pulse Raman
scattering effect with the parameter ζ R1 being the parallel Raman self-shift
time. The Raman self shift time ζ R1 and ζ R2 ( Fukuchi 2002) associated with
the parallel SRS effect are defined as
m 1111R1
d ( ) 0d
I (1.5)
where Re(χ1111(ω = 0)) = 1
m 1122R 2
d ( ) 0d
I (1.6)
The ζR parameter is related to the slope of the imaginary part of the
Raman susceptibility at zero frequency offset (Blow and Wood 1989). The
parameter ρ in Equation (1.1) is the fractional contribution of the delayed
response of the material to the total non-linearity (Tchofo et al 1998). The
22
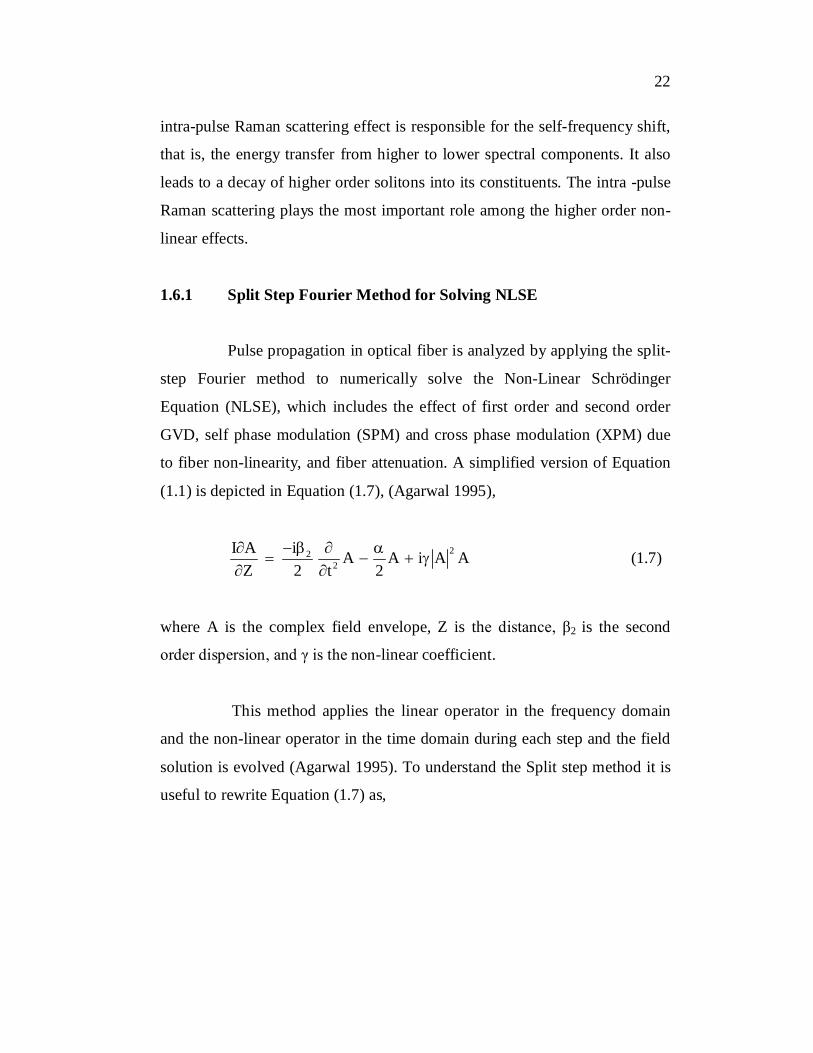
intra-pulse Raman scattering effect is responsible for the self-frequency shift,
that is, the energy transfer from higher to lower spectral components. It also
leads to a decay of higher order solitons into its constituents. The intra -pulse
Raman scattering plays the most important role among the higher order non-
linear effects.
1.6.1 Split Step Fourier Method for Solving NLSE
Pulse propagation in optical fiber is analyzed by applying the split-
step Fourier method to numerically solve the Non-Linear Schrödinger
Equation (NLSE), which includes the effect of first order and second order
GVD, self phase modulation (SPM) and cross phase modulation (XPM) due
to fiber non-linearity, and fiber attenuation. A simplified version of Equation
(1.1) is depicted in Equation (1.7), (Agarwal 1995),
222
I A i A A i A AZ 2 t 2
(1.7)
where A is the complex field envelope, Z is the distance, β2 is the second
order dispersion, and γ is the non-linear coefficient.
This method applies the linear operator in the frequency domain
and the non-linear operator in the time domain during each step and the field
solution is evolved (Agarwal 1995). To understand the Split step method it is
useful to rewrite Equation (1.7) as,

23
A(Z, t) (L N)A(Z, t)Z
(1.8)
where L is the linear part and N is the non-linear part. When the electric field
has propagated from Z to Z + h, the split step approximation is given by
A(Z + h,t)=exp(hL)exp(hN)A(Z,t) (1.9)
A schematic illustration of SSM method is shown in Figure 1.5.
First half
Dispersion only
(distance h/2)
Non-linear
Region
Symmetrical
Second half
Dispersion only
(distance h/2)
<----------------------------------------- h --------------------------------->
<--------------------- h/2 -------------- > <--------------- h/2 ------------ >
Z=0 Z+h/2 Z+h/2 Z+h
Figure 1.5 Schematic illustration of SSFM method (Agarwal 1995)
In our study the step size is bounded by the non-linear phase shift
and pulse propagation is analyzed based on Equation (1.1) using MATLAB.
The exponential propagation model is considered and the calculations are set
to be iterative with fixed or variable step size which is bounded by the non-
linear phase shift. The step size determines whether a particular non-linear
effect gets accounted for in the model. The step size ’h’ is determined through
the value of the parameter (Sinkin et al 2003),
2NLMAX max E h (1.10)
24
In the constant step size case, it is calculated once using the input signal’s
maximum intensity. In the variable step size case, ‘h’ is calculated at each
step ( Ramprasad and Meenakshi 2006).
1.6.2 Fiber Simulation Results Using NLSE
The study involves simulating the propagation of an optical field in
a single mode fiber with the dispersive and non-linear effects taken into
account by a direct numerical integration of the modified NLSE. In our
simulation using OPT SIMULATION software 4.6 and MATLAB, the effects
like attenuation, dispersion and non-linear effects are considered. Attenuation
is defined as a fixed constant value. Generally in frequency domain the Group
velocity dispersion (GVD) effects are included as β2 (ps2/km) and β3 (ps3/km)
and in wavelength domain as dispersion D (ps/nm.km ) and dispersion slope S
(ps / nm2.km).
The following two cases are considered for step size selection:
(1) Constant Step size with iterative calculations and (2) Variable Step size
bounded by the maximum non-linear phase shift with non-iterative
calculations. The non-iterative approach is the fastest but the iterative
approach with constant step size suppresses instability improving the quality
of the results, (Ramprasad and Meenakshi 2006).
A Single Gaussian pulse is assumed to be the input signal with
2 mW peak power and having zero chirp parameter. The Gaussian parameter
order is set to one for the case of Gaussian and greater than one for Super
Gaussian pulses. The initial pulse period is 50 pico-seconds and the
wavelength is 1550 nm. The dispersion parameter is -2 ps/nm.km. The length
of the fiber is 500 km and the maximum non-linear phase shift is 1 m radian.
The optical amplifier is assumed with a flat frequency response and no noise.
25
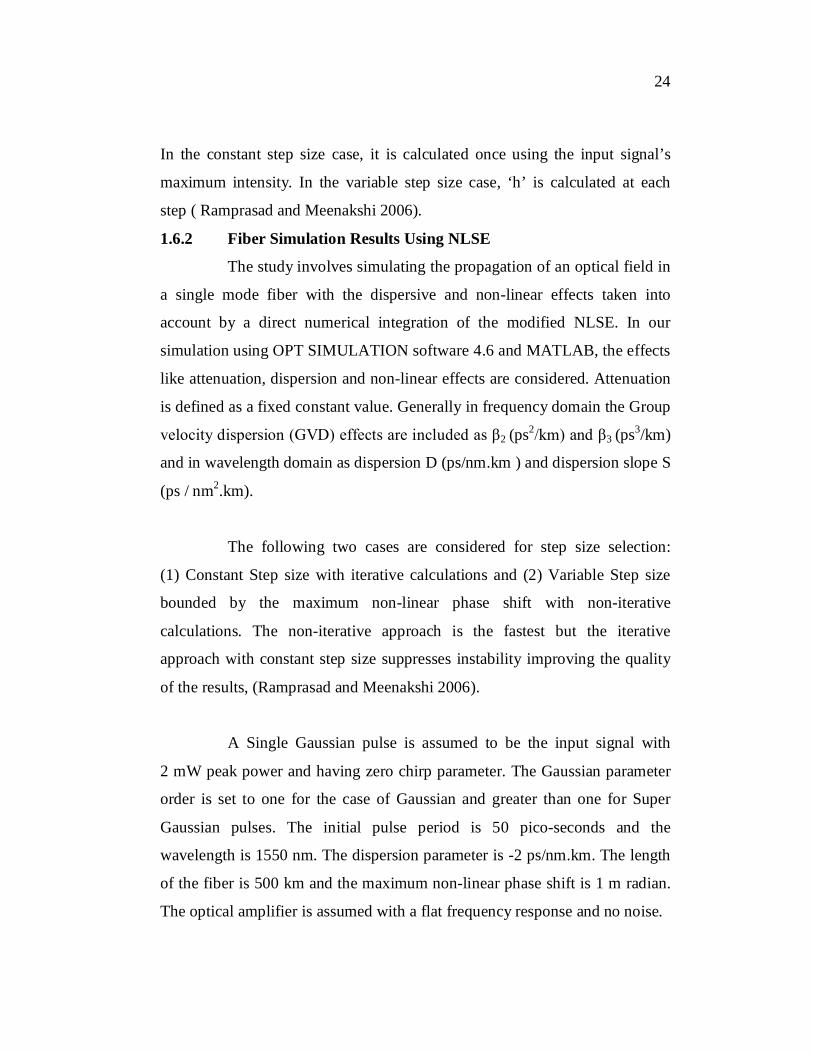
This simulation is carried out for the variable step size bounded by the non
linear phase shift using the MATLAB software and the received optical pulse
at the fiber output is shown in Figure 1.6. The received power can also be
improved by increasing the gain of the receiver amplifier.
Figure 1.6 Received power for a length of 500 km
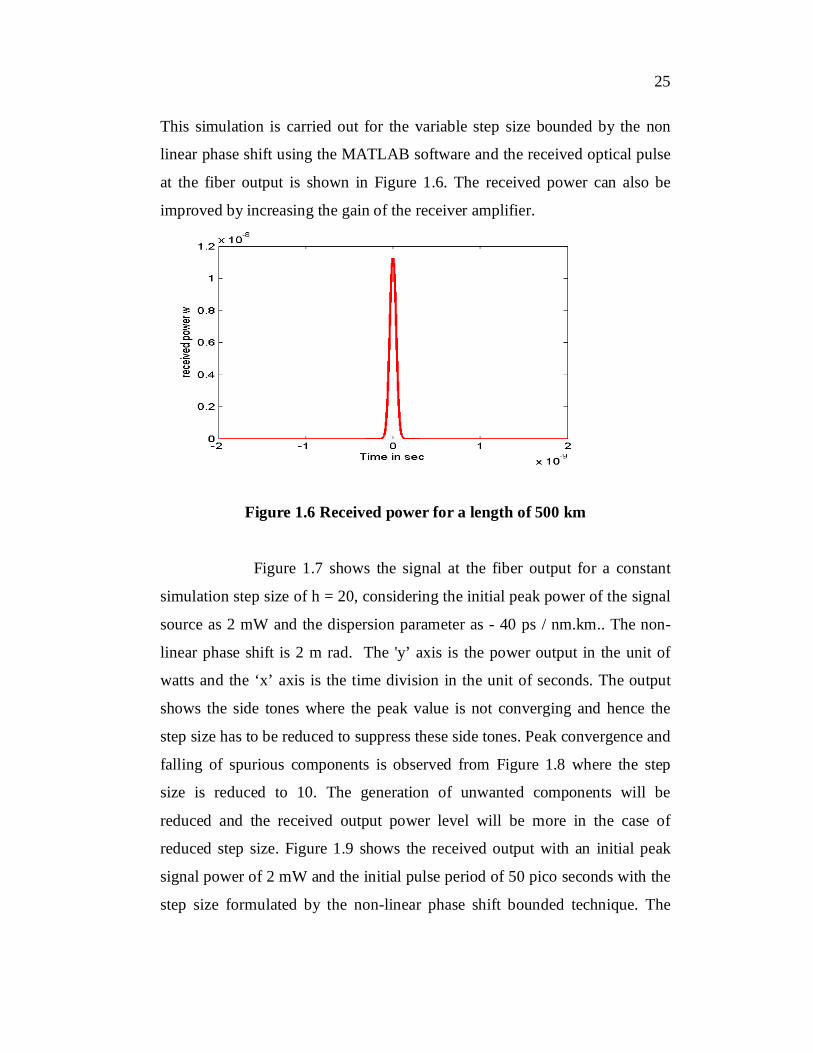
Figure 1.7 shows the signal at the fiber output for a constant
simulation step size of h = 20, considering the initial peak power of the signal
source as 2 mW and the dispersion parameter as - 40 ps / nm.km.. The non-
linear phase shift is 2 m rad. The 'y’ axis is the power output in the unit of
watts and the ‘x’ axis is the time division in the unit of seconds. The output
shows the side tones where the peak value is not converging and hence the
step size has to be reduced to suppress these side tones. Peak convergence and
falling of spurious components is observed from Figure 1.8 where the step
size is reduced to 10. The generation of unwanted components will be
reduced and the received output power level will be more in the case of
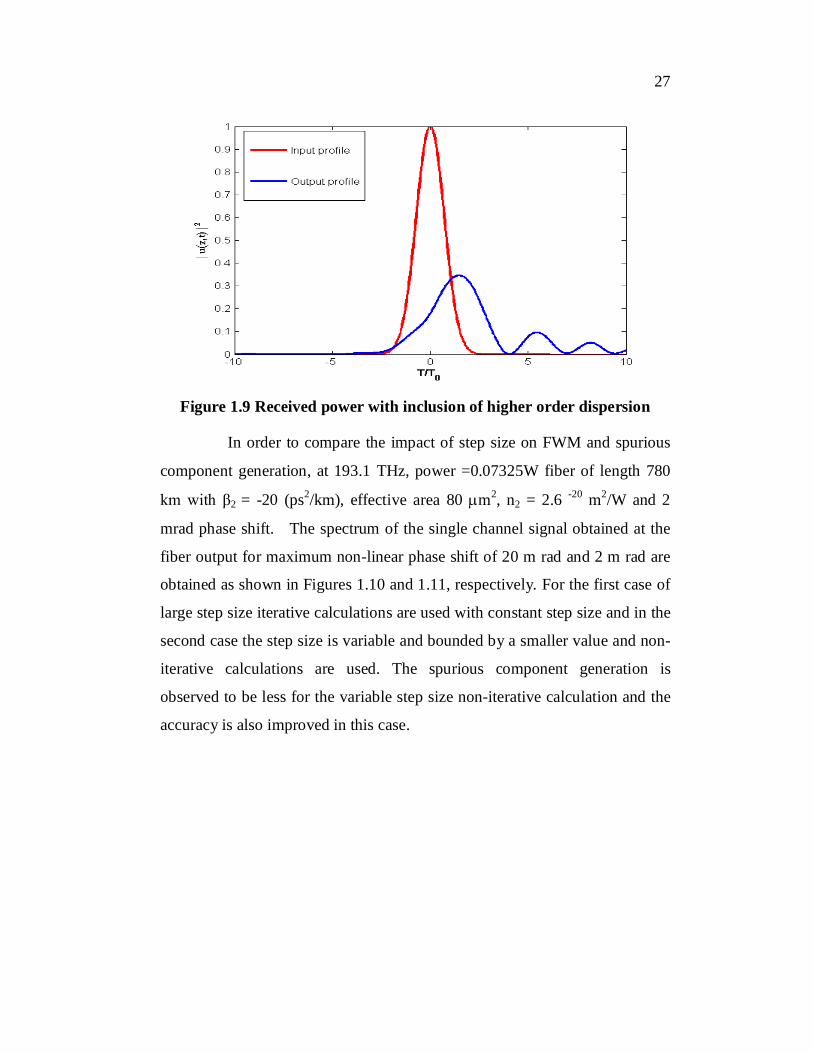
reduced step size. Figure 1.9 shows the received output with an initial peak
signal power of 2 mW and the initial pulse period of 50 pico seconds with the
step size formulated by the non-linear phase shift bounded technique. The
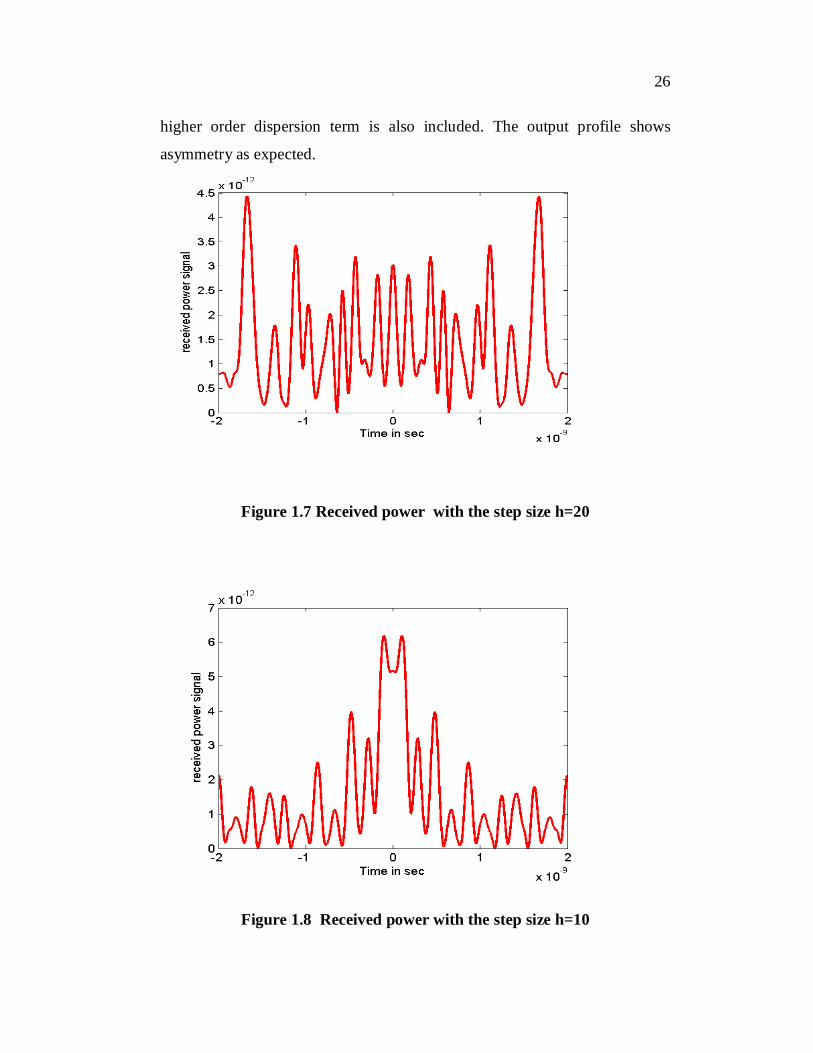
26
higher order dispersion term is also included. The output profile shows
asymmetry as expected.
Figure 1.7 Received power with the step size h=20
Figure 1.8 Received power with the step size h=10
27
Figure 1.9 Received power with inclusion of higher order dispersion
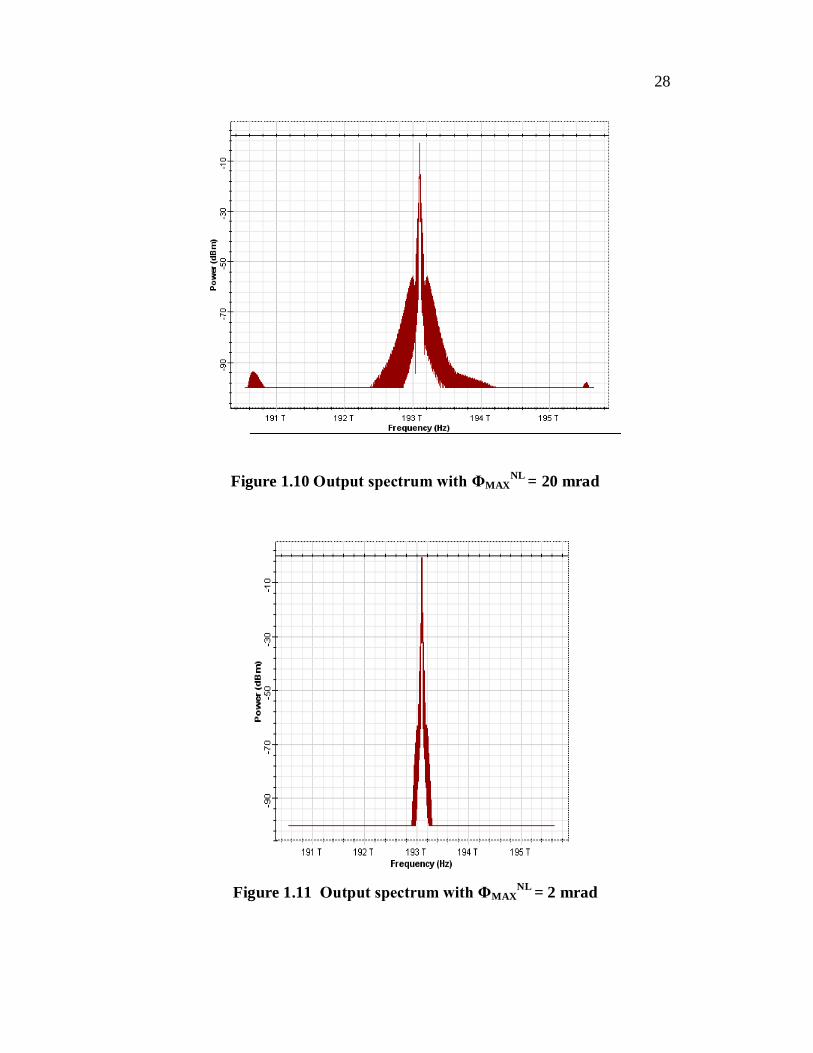
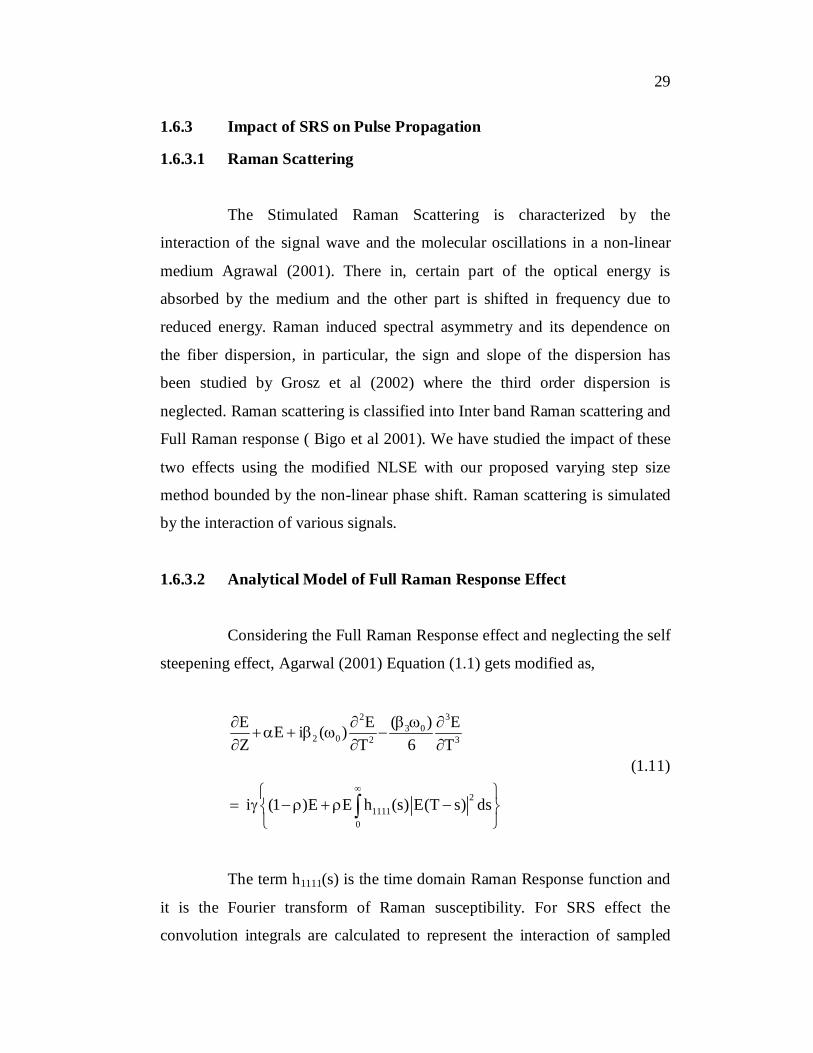
In order to compare the impact of step size on FWM and spurious
component generation, at 193.1 THz, power =0.07325W fiber of length 780
km with β2 = -20 (ps2/km), effective area 80 m2, n2 = 2.6 -20 m2/W and 2
mrad phase shift. The spectrum of the single channel signal obtained at the
fiber output for maximum non-linear phase shift of 20 m rad and 2 m rad are
obtained as shown in Figures 1.10 and 1.11, respectively. For the first case of
large step size iterative calculations are used with constant step size and in the
second case the step size is variable and bounded by a smaller value and non-
iterative calculations are used. The spurious component generation is
observed to be less for the variable step size non-iterative calculation and the
accuracy is also improved in this case.
28
Figure 1.10 Output spectrum with ΦMAXNL = 20 mrad
Figure 1.11 Output spectrum with ΦMAX
NL = 2 mrad
29
1.6.3 Impact of SRS on Pulse Propagation
1.6.3.1 Raman Scattering
The Stimulated Raman Scattering is characterized by the
interaction of the signal wave and the molecular oscillations in a non-linear
medium Agrawal (2001). There in, certain part of the optical energy is
absorbed by the medium and the other part is shifted in frequency due to
reduced energy. Raman induced spectral asymmetry and its dependence on
the fiber dispersion, in particular, the sign and slope of the dispersion has
been studied by Grosz et al (2002) where the third order dispersion is
neglected. Raman scattering is classified into Inter band Raman scattering and
Full Raman response ( Bigo et al 2001). We have studied the impact of these
two effects using the modified NLSE with our proposed varying step size
method bounded by the non-linear phase shift. Raman scattering is simulated
by the interaction of various signals.
1.6.3.2 Analytical Model of Full Raman Response Effect
Considering the Full Raman Response effect and neglecting the self
steepening effect, Agarwal (2001) Equation (1.1) gets modified as,
2 33 0
2 0 2 3
21111
0
( )E E EE i ( )Z T 6 T
i (1 )E E h (s) E(T s) ds
(1.11)
The term h1111(s) is the time domain Raman Response function and
it is the Fourier transform of Raman susceptibility. For SRS effect the
convolution integrals are calculated to represent the interaction of sampled
30
signals with sampled signals, noise bins and parameterized signals and vice
versa ( Ramprasad and Meenakshi 2006).
1.6.3.3 Analytical model of Inter band Raman Scattering
The Equation (1.12) given below considers the effect of Inter-band
Raman Scattering, (Agarwal 2001, Press 1992).
2 33 ii i 2 i i i
l i 1 0 i i 2 3z
( )E E i ( ) E E( ( ) ( )) ( )ET 2 T 6 T
Number of SS Number of PS
2 2k i
k 1 l 1
i iNumber of SS Number of PS
2(SS) (PS)ik k il l
k 1 l 1
(2 ) E (1 ) E (2 )
i E
R E p R P
(1.12)
In this chapter this equation (1.12) is analyzed with the proposed
variable step size bounded by the non linear phase shift and the effect of Full
Raman and inter-band scattering is studied. The meaning of the terms on the
left-hand side of the equation is the same as in the Full Raman approach fiber
model. The first term in the right hand side gives the SPM contribution of the
sampled signals, the second term gives XPM contributions of the sampled
signals and the third term is the XPM contribution of the Parameterized
signals. The fourth and the fifth terms describe the SRS induced interactions
between the sampled signal and rest of the sampled signals and with the
parameterized signals, respectively.
In our analysis it is assumed that the power of noise bins remains
much smaller compared to that of sampled and parametric samples of the
signal. The parameterized signals also assume the FWM effect. With multiple
31
sampled signals present in the fiber the SRS effect is represented through
Inter-band Raman Scattering.
1.6.3.4 Simulation results
In this section, the propagation of an arbitrary configuration of
optical signals in a single-mode fiber is simulated by taking into account of
Stimulated Raman Scattering (SRS) effects. In order to analyze the stimulated
effects, the NLSE equation is modified to represent the evolution of sampled
signals, parameterized signals and noise bin signals.
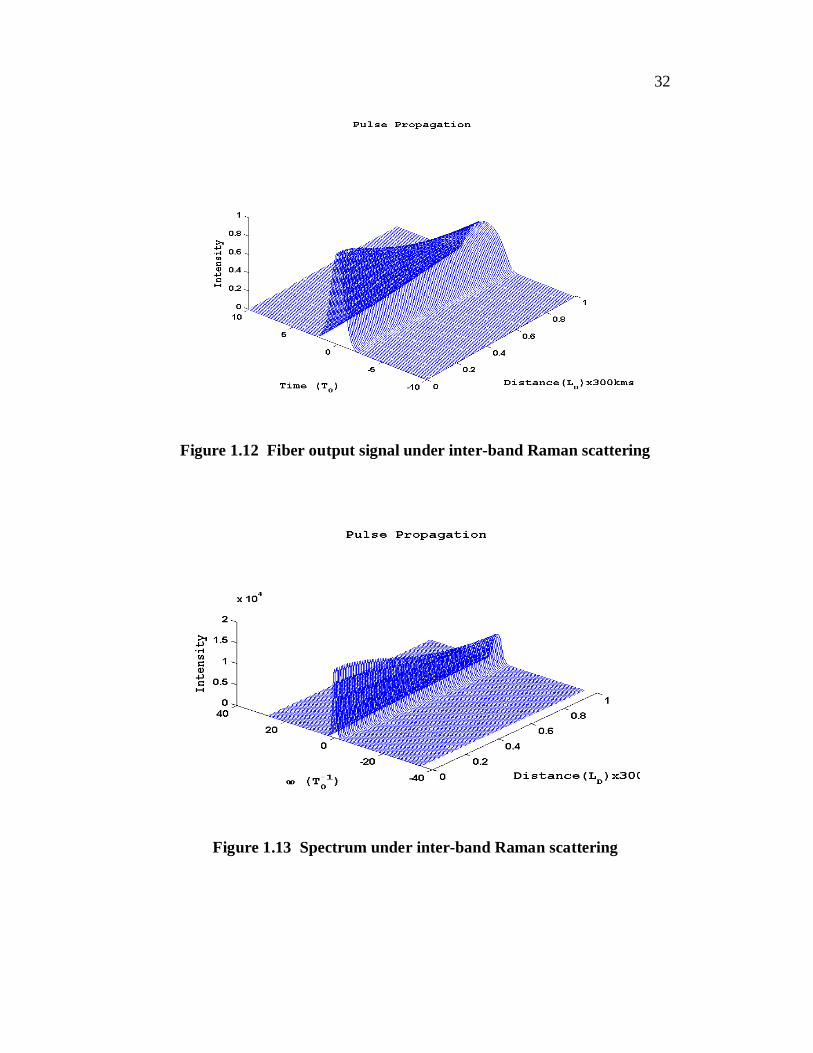
Figures 1.12 and 1.13 show the fiber output signal under Raman
Scattering and it’s spectrum obtained by solving the Equation (1.12). The step
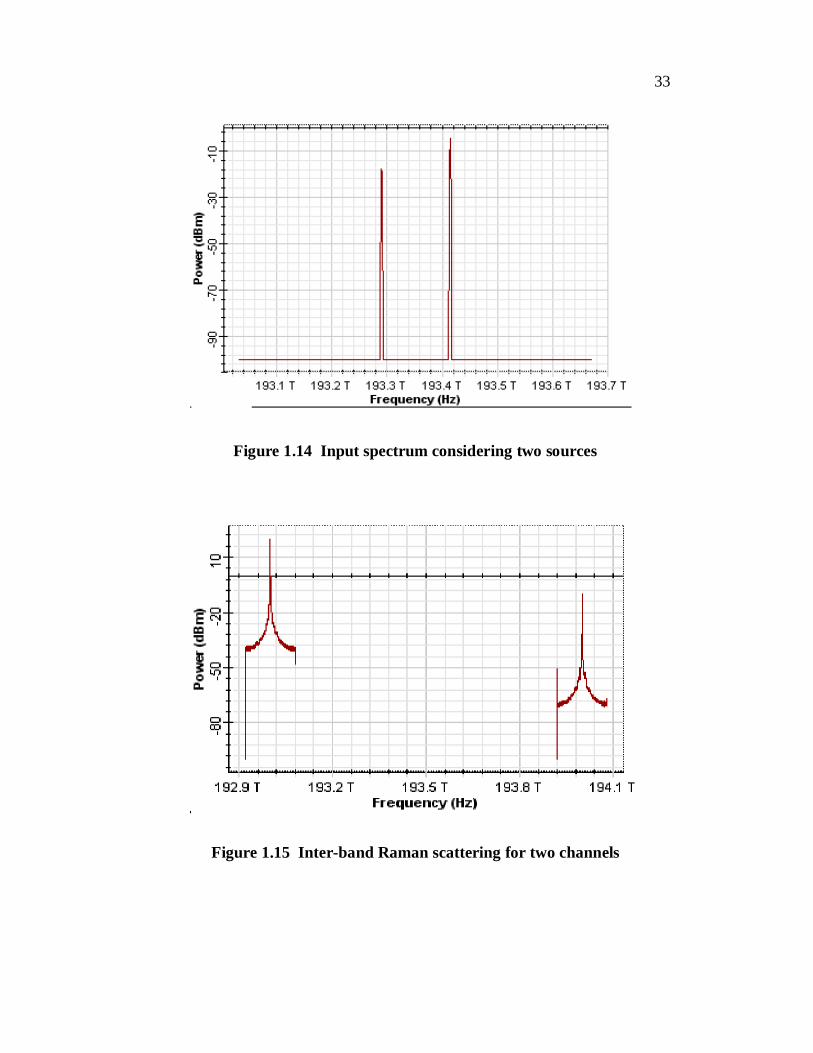
size is bounded by the phase shift 2 mrad. Figure 1.14 shows the simulation
result for two input pulses. The two sources are at 193.1 THz and 193.15 THz
with 50 GHz spacing. The input power is 20 dBm, group delay constant of the
fiber is 490000 ps/km, GVD constant is 4.5 ps/ nm /km, fiber length 300 km,
dispersion slope constant 0.11 ps/nm2 /km, effective area 60 m2, peak
Raman gain coefficient 9.9 e-014 m/W, pump wavelength of peak Raman
coefficient 1000 nm and Raman self shift time is 5 fsec. The other simulation
parameters are same as that used to solve Equation (1.1) in the above section.
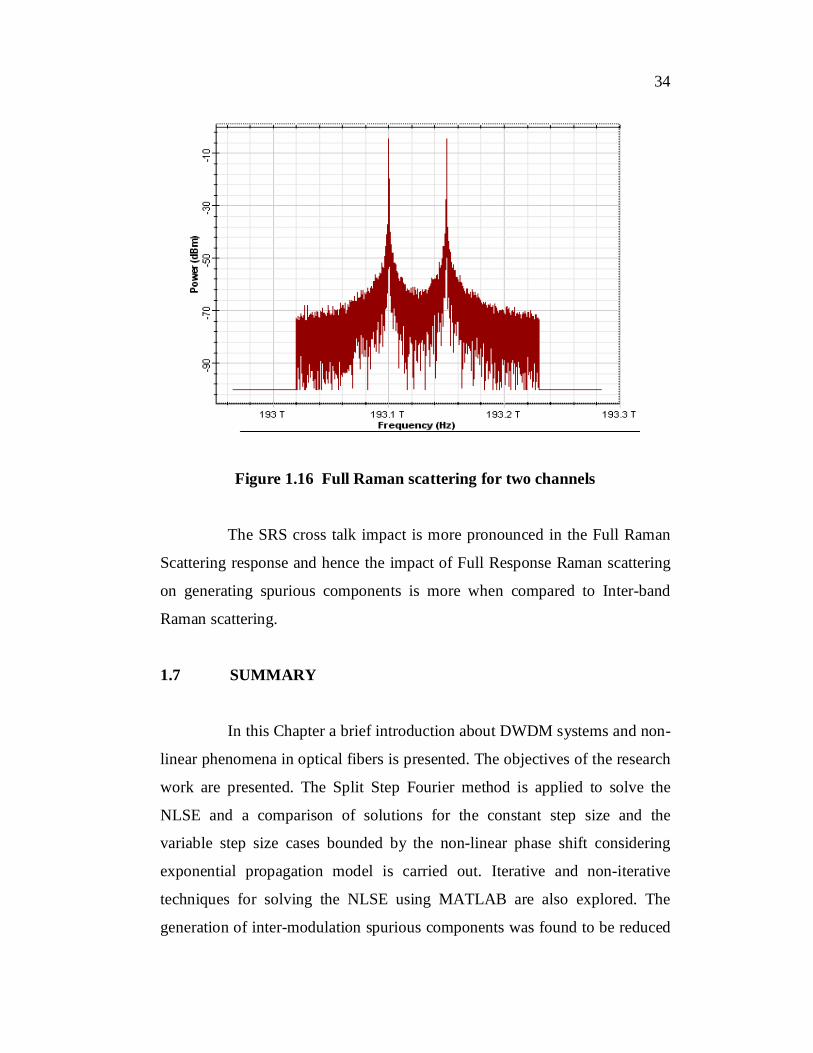
Raman scattering leads to the interactions among all sampled
signals, parameterized signals and noise bins. Inter-band Raman scattering is
an approximation to the full expression of the Raman polarization provided
that the frequency separation of the interacting signals is much larger than
their individual spectral bandwidths. In Full Raman response, SRS effect will
be represented through the convolution integral of time domain Raman
response function and the field intensity resulting in a single frequency band
confining all the sampled signals being formed. The Figures 1.15 and 1.16
show the Inter-band Raman Scattering and Full Raman Response.
32
Figure 1.12 Fiber output signal under inter-band Raman scattering
Figure 1.13 Spectrum under inter-band Raman scattering
33
Figure 1.14 Input spectrum considering two sources
Figure 1.15 Inter-band Raman scattering for two channels
34
Figure 1.16 Full Raman scattering for two channels
The SRS cross talk impact is more pronounced in the Full Raman
Scattering response and hence the impact of Full Response Raman scattering
on generating spurious components is more when compared to Inter-band
Raman scattering.
1.7 SUMMARY
In this Chapter a brief introduction about DWDM systems and non-
linear phenomena in optical fibers is presented. The objectives of the research
work are presented. The Split Step Fourier method is applied to solve the
NLSE and a comparison of solutions for the constant step size and the
variable step size cases bounded by the non-linear phase shift considering
exponential propagation model is carried out. Iterative and non-iterative
techniques for solving the NLSE using MATLAB are also explored. The
generation of inter-modulation spurious components was found to be reduced
35
in the case of the variable step size than the case of fixed large step size, the
step size being bounded by the non-linear phase shift in both cases. The
results are also verified using the simulation package OPTI SIMULATION
package. In order to analyze the impact of stimulated in-elastic effects, the
NLSE considering the evolution of sampled signals, parameterized signals
and noise bin signals, was modified with the proposed varying step size
method. Raman scattering is simulated by the interaction of various signals.
The effect of Inter-Band Raman scattering and Full Raman response was
studied. In terms of the generation of inter-modulation components the
Raman Effect due to Full Raman response is found to dominating compared
to the Inter-band scattering.