Changing Demographics: Impacts on Delivering Technical and Financial Assistance at the Field Level...
50
Changing Demographics: Changing Demographics: Impacts on Delivering Technical Impacts on Delivering Technical and Financial Assistance at the and Financial Assistance at the Field Level Field Level It’s the Water Workshop It’s the Water Workshop Hannibal, MO Hannibal, MO September 15, 2005 September 15, 2005 Michael Duffy Michael Duffy Iowa State University Iowa State University
-
date post
21-Dec-2015 -
Category
Documents
-
view
212 -
download
0
Transcript of Changing Demographics: Impacts on Delivering Technical and Financial Assistance at the Field Level...

Changing Demographics:Changing Demographics:Impacts on Delivering Technical and Impacts on Delivering Technical and
Financial Assistance at the Field LevelFinancial Assistance at the Field Level
It’s the Water WorkshopIt’s the Water Workshop
Hannibal, MOHannibal, MOSeptember 15, 2005September 15, 2005
Michael DuffyMichael DuffyIowa State UniversityIowa State University

OutlineOutline
Changing farm demographicsChanging farm demographics Changing farm land owner demographicsChanging farm land owner demographics ImplicationsImplications Questions and discussionQuestions and discussion
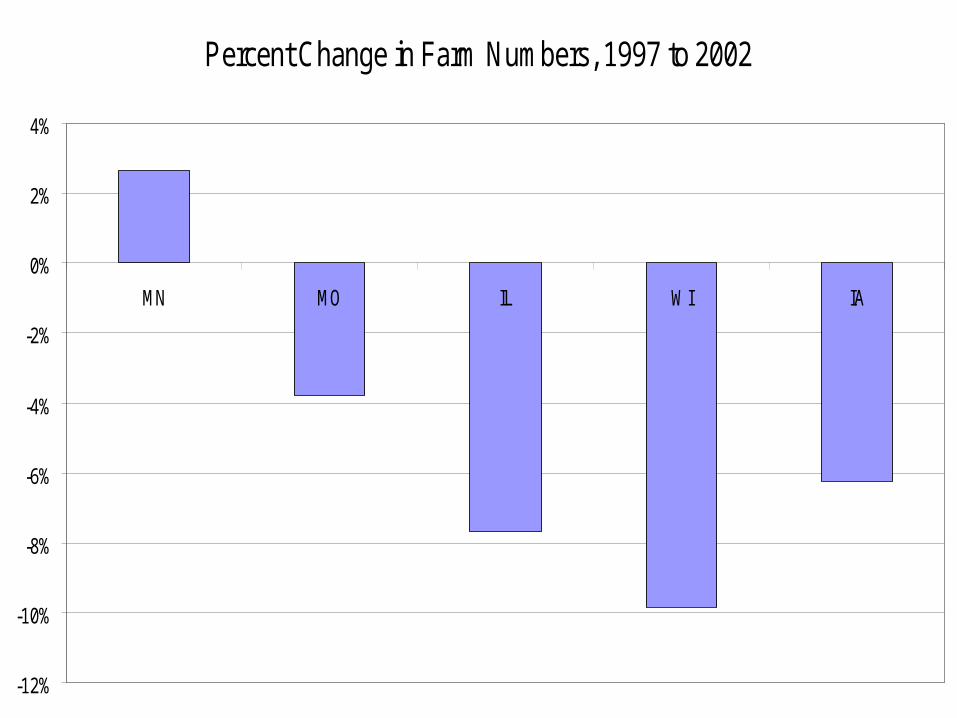
Percent Change in Farm Numbers, 1997 to 2002
-12%
-10%
-8%
-6%
-4%
-2%
0%
2%
4%
MN MO IL WI IA

Percent of IA Farms and Sales by Sales Class, 2002
0%
5%
10%
15%
20%
25%
30%
< $1
,000
$1 to
$2,
499
$2.5
to $
4,99
9
$5 to
$9,
999
$10
to $
19,9
99
$20
to $
24,9
99
$25
to $
39,9
99
$40
to $
49,9
99
$50
to $
99,9
99
$100
to $
249,
999
$250
to $
499,
999
$500
to $
999,
999
> $1
M

Percent of WI Farms and Sales by Sales Class, 2002
0%
5%
10%
15%
20%
25%
30%
35%
Farms Sales

Percent of MN Farms and Sales by Sales Class, 2002
0%
5%
10%
15%
20%
25%
30%
35%
Farms Sales

Percent of MO Farms and Sales by Sales Class, 2002
0%
5%
10%
15%
20%
25%
30%
Farms Sales

Percent of IL Farms and Sales by Sales Class, 2002
0%
5%
10%
15%
20%
25%
30%
Farms Sales

Percent Change in Farms by Sales Class, IA
-30%
-20%
-10%
0%
10%
20%
30%
40%
50%
60%
70%

Percent Change in Farms by Sales Class, WI
-30%
-20%
-10%
0%
10%
20%
30%
40%
50%
60%

Percent Change in Farms by Sales Class, MN
-20%
0%
20%
40%
60%
80%

Percent Change in Farms by Sales Category, MO
-30%
-20%
-10%
0%
10%
20%
30%

Percent Change in Farms by Sales Class, IL
-40%
-30%
-20%
-10%
0%
10%
20%
30%
40%
50%
60%

Percent of IA Farms and Land by Sales Class, 2002
0%
5%
10%
15%
20%
25%
30%
< $1,000 $1 to$2,499
$2.5 to$4,999
$5 to$9,999
$10 to$24,999
$25 to$49,999
$50 to$99,999
$100 to$249,999
$250 to$499,999
$500 to$999,999
> $1M
Farms Land

Percent of WI Farms and Land by Sales Class, 2002
0%
5%
10%
15%
20%
25%
30%
35%
Farms Land

Percent of MN Farms and Land by Sales Class, 2002
0%
5%
10%
15%
20%
25%
30%
35%
Farms Land

Percent of MO Farms and Land by Sales Class, 2002
0%
5%
10%
15%
20%
25%
Farms Land

Percent of IL Farms and Land by Sales Class, 2002
0%
5%
10%
15%
20%
25%
30%
Farms Land

Percent of Iowa Farmers Under 34 or Over 70 Years of Age by Sales Class, 2002
0%
5%
10%
15%
20%
25%
30%
35%
< $1,000 $1 to$2,499
$2.5 to$4,999
$5 to$9,999
$10 to$24,999
$25 to$49,999
$50 to$99,999
$100 to$249,999
$250 to$499,999
$500 to$999,999
> $1M
Under 34 Over 70

Percent of Wisconsin Farmers Under 34 or Over 70 Years of Age by Sales Class, 2002
0%
5%
10%
15%
20%
25%
30%
35%
40%
45%
< $1,000 $1 to$2,499
$2.5 to$4,999
$5 to$9,999
$10 to$24,999
$25 to$49,999
$50 to$99,999
$100 to$249,999
$250 to$499,999
$500 to$999,999
> $1M
Under 34 Over 70

Percent of IA Farms by Age Category
0%
2%
4%
6%
8%
10%
12%
14%
16%
18%
20%
Under 25years
25 to 34years
35 to 44years
45 to 49years
50 to 54years
55 to 59years
60 to 64years
65 to 69years
70 yearsand over

Percent of WI Farmers by Age Category, 2002
0%
5%
10%
15%
20%
25%
Under 25years
25 to 34 35 to 44 45 to 49 50 to 54 55 to 59 60 to 64 65 to 69 70 years andover

Percent of MN Farmers by Age Category, 2002
0%
5%
10%
15%
20%
25%
Under 25years
25 to 34 35 to 44 45 to 49 50 to 54 55 to 59 60 to 64 65 to 69 70 years andover

Percent of MO Farmers by Age Category
0%
2%
4%
6%
8%
10%
12%
14%
16%
18%
20%
Under 25years
25 to 34 35 to 44 45 to 49 50 to 54 55 to 59 60 to 64 65 to 69 70 years andover

Percent of IL Farmers by Age Category, 2002
0%
2%
4%
6%
8%
10%
12%
14%
16%
18%
20%
Under 25years
25 to 34 35 to 44 45 to 49 50 to 54 55 to 59 60 to 64 65 to 69 70 years andover

Percent of Iowa Farmers Over 65 and Under 35 Years Old
0%
5%
10%
15%
20%
25%
1959 1964 1969 1974 1978 1982 1987 1992 1997 2002
< 35 > 65

Percent of IA Farms by Days Worked Off the Farm, 2002
0%
5%
10%
15%
20%
25%
30%
35%
40%
45%
50%
None Some Over 200 Days

Percent of WI Farms by Days Worked Off the Farm, 2002
0%
5%
10%
15%
20%
25%
30%
35%
40%
45%
50%
None Some Over 200 Days

Percentage of MN Farmers by Days Worked Off the Farm, 2002
0%
5%
10%
15%
20%
25%
30%
35%
40%
45%
50%
None Some Over 200 Days

Percentage of MO Farmers by Days Worked Off the Farm, 2002
0%
5%
10%
15%
20%
25%
30%
35%
40%
45%
50%
None Some Over 200 Days

Percent of IL Farmers by Days Worked Off the Farm, 2002
0%
5%
10%
15%
20%
25%
30%
35%
40%
45%
50%
None Some Over 200 Days
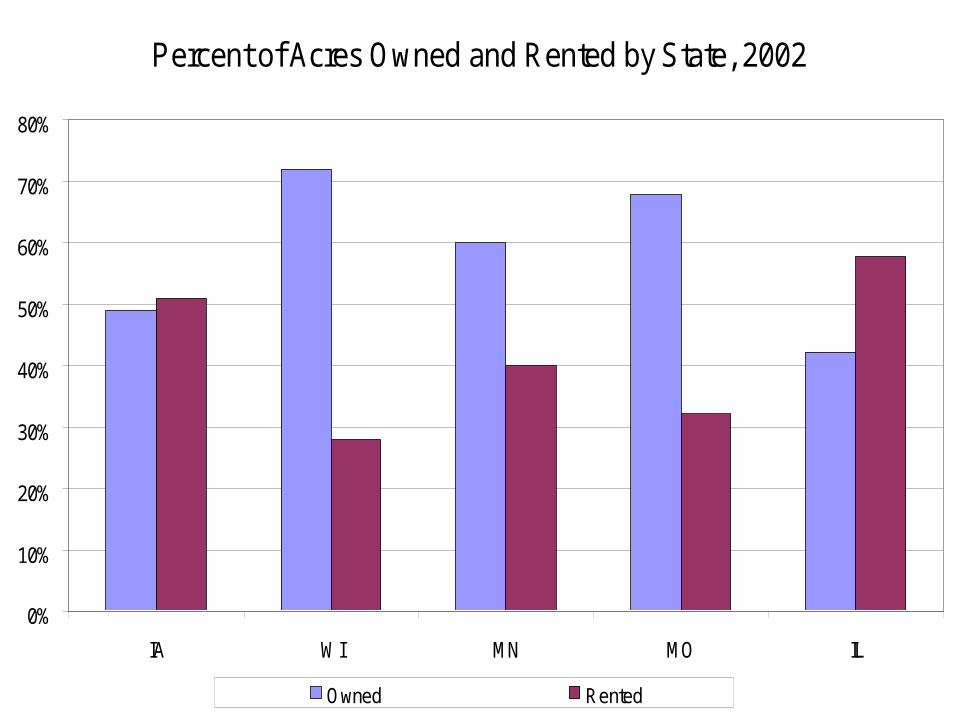
Percent of Acres Owned and Rented by State, 2002
0%
10%
20%
30%
40%
50%
60%
70%
80%
IA WI MN MO IL
Owned Rented

Percent of Farms by Tenancy and State, 2002
0%
10%
20%
30%
40%
50%
60%
70%
80%
IA WI MN MO IL
Full Owners Part Owners Tenants

Percent of Farms by Number of Operators
0%
10%
20%
30%
40%
50%
60%
70%
IA WI MN MO IL
1 operator 2 operators > 2

Distribution of Iowa Farmland by Age of Owner and Year
0%
5%
10%
15%
20%
25%
< 25 25-34 35-44 45-54 55-64 65-74 > 75
1982 1992 2002

Distribution of Iowa Farmland by Ownership Type and Year
0%
5%
10%
15%
20%
25%
30%
35%
40%
45%
Sole Owners Jointtennants
Tenants incommon
Pertnerships Estates Trusts Corporations
1982 1992 2002

Distribution of Iowa Farmland by Financing Method and Year
0%
10%
20%
30%
40%
50%
60%
70%
80%
Free of debt Under contract Mortgaged
1982 1992 2002

Percent of Iowa Farmland by Residence of Owner
0%
10%
20%
30%
40%
50%
60%
70%
80%
90%
100%
Iowa Resident Non-Iowa Resident
1982 1992 2002

Distribution of Iowa Farmland by Tenure Type
0%
10%
20%
30%
40%
50%
60%
Owner operator Cash rent Crop share rent Government
1982 1992 2002

Anticipated Method for Transfering Iowa Farmland
0
5
10
15
20
25
30
35
40
Will tofamily
Will toother
Give tofamily
Give toothers
Sell tofamily
Sell toothers
Put intrust
Other DK
Pe
rce
nt o
f Fa
rmla
nd

Who Purchased Iowa Farmland
0%
10%
20%
30%
40%
50%
60%
70%
80%
90%
1989 1990 1991 1992 1993 1994 1995 1996 1997 1998 1999 2000 2001 2002 2003 2004
Existing Farmers Investors New Farmers Other

Buyers Use of Farmland Purchased in MO, 2002
0%
10%
20%
30%
40%
50%
60%
Farm themselves Rent Non-ag. Use

Primary Reason for Owning Land in Greene County, Iowa
0%
5%
10%
15%
20%
25%
30%
35%
40%
45%
50%
Income Long Term Investment Portfolio Diversification Sentimental

Sources of Information Regarding Property Management Options, Greene Co. Iowa
0%
10%
20%
30%
40%
50%
60%
Mass media Magazines NRCS FSA State of Iowa Extension Farmmanager
Tenant

Best Way to Receive Property Management Information
0%
10%
20%
30%
40%
50%
60%
70%
80%
Direct mailing Fact sheets Radio/TV Newspapers Videos Dealers

Improvements That Have Been Made to the Property
0%
10%
20%
30%
40%
50%
60%
70%
80%
Fences Terraces Tile Removedbuildings
Removedfences
Removedtrees
Installedwaterways
Seededdown steam
banks
Other

Know about Cost-share Programs for Implementing Conservation Practices
0%
10%
20%
30%
40%
50%
60%
70%
80%
90%
Yes No

ImplicationsImplications
There is a very clear dichotomy with respect There is a very clear dichotomy with respect to farmers; there is a disappearing middle to farmers; there is a disappearing middle and they control most of the land at this timeand they control most of the land at this time
Society will need to decide where to put Society will need to decide where to put scarce dollars and timescarce dollars and time
Part time farmers receive information Part time farmers receive information differently and have different needsdifferently and have different needs

ImplicationsImplications
We can expect more rented acres, mostly We can expect more rented acres, mostly using cash rentsusing cash rents
We can expect to see more land owned by We can expect to see more land owned by non-farmers and those who do not live in the non-farmers and those who do not live in the areaarea
There will be a significant change in land There will be a significant change in land ownership over the next decade; most of the ownership over the next decade; most of the land will not enter the market but stay within land will not enter the market but stay within the familythe family

Thank you!Thank you!