Changes in storm tracks and energy transports in a warmer ...
20
Changes in storm tracks and energy transports in a warmer climate simulated by the GFDL CM2.1 model Yutian Wu • Mingfang Ting • Richard Seager • Huei-Ping Huang • Mark A. Cane Received: 12 November 2009 / Accepted: 22 February 2010 Ó Springer-Verlag 2010 Abstract Storm tracks play a major role in regulating the precipitation and hydrological cycle in midlatitudes. The changes in the location and amplitude of the storm tracks in response to global warming will have significant impacts on the poleward transport of heat, momentum and moisture and on the hydrological cycle. Recent studies have indi- cated a poleward shift of the storm tracks and the midlati- tude precipitation zone in the warming world that will lead to subtropical drying and higher latitude moistening. This study agrees with this key feature for not only the annual mean but also different seasons and for the zonal mean as well as horizontal structures based on the analysis of Geophysical Fluid Dynamics Laboratory (GFDL) CM2.1 model simulations. Further analyses show that the merid- ional sensible and latent heat fluxes associated with the storm tracks shift poleward and intensify in both boreal summer and winter in the late twenty-first century (years 2081–2100) relative to the latter half of the twentieth century (years 1961–2000). The maximum dry Eady growth rate is examined to determine the effect of global warming on the time mean state and associated available potential energy for transient growth. The trend in maxi- mum Eady growth rate is generally consistent with the poleward shift and intensification of the storm tracks in the middle latitudes of both hemispheres in both seasons. However, in the lower troposphere in northern winter, increased meridional eddy transfer within the storm tracks is more associated with increased eddy velocity, stronger correlation between eddy velocity and eddy moist static energy, and longer eddy length scale. The changing char- acteristics of baroclinic instability are, therefore, needed to explain the storm track response as climate warms. Diag- nosis of the latitude-by-latitude energy budget for the current and future climate demonstrates how the coupling between radiative and surface heat fluxes and eddy heat and moisture transport influences the midlatitude storm track response to global warming. Through radiative forcing by increased atmospheric carbon dioxide and water vapor, more energy is gained within the tropics and sub- tropics, while in the middle and high latitudes energy is reduced through increased outgoing terrestrial radiation in the Northern Hemisphere and increased ocean heat uptake in the Southern Hemisphere. This enhanced energy imbalance in the future climate requires larger atmospheric energy transports in the midlatitudes which are partially accomplished by intensified storm tracks. Finally a sequence of cause and effect for the storm track response in the warming world is proposed that combines energy budget constraints with baroclinic instability theory. Keywords Storm tracks Global warming 1 Introduction Mid-latitude storm tracks play an important role in the Earth’s climate system. Eddies within the storm tracks transport large amounts of energy poleward affecting the Y. Wu (&) Department of Applied Physics and Applied Mathematics, Columbia University, New York, NY, USA e-mail: [email protected] M. Ting R. Seager M. A. Cane Lamont-Doherty Earth Observatory, Columbia University, Palisades, NY, USA H.-P. Huang Department of Mechanical and Aerospace Engineering, Arizona State University, Tempe, AZ, USA 123 Clim Dyn DOI 10.1007/s00382-010-0776-4
Transcript of Changes in storm tracks and energy transports in a warmer ...
Changes in storm tracks and energy transports in a warmerclimate simulated by the GFDL CM2.1 model
Yutian Wu • Mingfang Ting • Richard Seager •
Huei-Ping Huang • Mark A. Cane
Received: 12 November 2009 / Accepted: 22 February 2010
� Springer-Verlag 2010
Abstract Storm tracks play a major role in regulating the
precipitation and hydrological cycle in midlatitudes. The
changes in the location and amplitude of the storm tracks in
response to global warming will have significant impacts
on the poleward transport of heat, momentum and moisture
and on the hydrological cycle. Recent studies have indi-
cated a poleward shift of the storm tracks and the midlati-
tude precipitation zone in the warming world that will lead
to subtropical drying and higher latitude moistening. This
study agrees with this key feature for not only the annual
mean but also different seasons and for the zonal mean as
well as horizontal structures based on the analysis of
Geophysical Fluid Dynamics Laboratory (GFDL) CM2.1
model simulations. Further analyses show that the merid-
ional sensible and latent heat fluxes associated with the
storm tracks shift poleward and intensify in both boreal
summer and winter in the late twenty-first century (years
2081–2100) relative to the latter half of the twentieth
century (years 1961–2000). The maximum dry Eady
growth rate is examined to determine the effect of global
warming on the time mean state and associated available
potential energy for transient growth. The trend in maxi-
mum Eady growth rate is generally consistent with the
poleward shift and intensification of the storm tracks in the
middle latitudes of both hemispheres in both seasons.
However, in the lower troposphere in northern winter,
increased meridional eddy transfer within the storm tracks
is more associated with increased eddy velocity, stronger
correlation between eddy velocity and eddy moist static
energy, and longer eddy length scale. The changing char-
acteristics of baroclinic instability are, therefore, needed to
explain the storm track response as climate warms. Diag-
nosis of the latitude-by-latitude energy budget for the
current and future climate demonstrates how the coupling
between radiative and surface heat fluxes and eddy heat
and moisture transport influences the midlatitude storm
track response to global warming. Through radiative
forcing by increased atmospheric carbon dioxide and water
vapor, more energy is gained within the tropics and sub-
tropics, while in the middle and high latitudes energy is
reduced through increased outgoing terrestrial radiation in
the Northern Hemisphere and increased ocean heat uptake
in the Southern Hemisphere. This enhanced energy
imbalance in the future climate requires larger atmospheric
energy transports in the midlatitudes which are partially
accomplished by intensified storm tracks. Finally a
sequence of cause and effect for the storm track response in
the warming world is proposed that combines energy
budget constraints with baroclinic instability theory.
Keywords Storm tracks � Global warming
1 Introduction
Mid-latitude storm tracks play an important role in the
Earth’s climate system. Eddies within the storm tracks
transport large amounts of energy poleward affecting the
Y. Wu (&)
Department of Applied Physics and Applied Mathematics,
Columbia University, New York, NY, USA
e-mail: [email protected]
M. Ting � R. Seager � M. A. Cane
Lamont-Doherty Earth Observatory, Columbia University,
Palisades, NY, USA
H.-P. Huang
Department of Mechanical and Aerospace Engineering,
Arizona State University, Tempe, AZ, USA
123
Clim Dyn
DOI 10.1007/s00382-010-0776-4

mean climate while much climate variability on seasonal to
decadal timescales is associated with changes in the storm
tracks. Previous studies have contributed greatly to our
understanding of the dynamics of the storm tracks in the
present climate (see a review by Chang et al. (2002)). It is
expected that the storm tracks will change as a conse-
quence of greenhouse warming. Yin (2005) found that the
zonal mean storm tracks tend to intensify and to shift
poleward and upward in climate projections from the
Intergovernmental Panel on Climate Change (IPCC) Fourth
Assessment Report (AR4) for the late twenty-first century.
However, the physical mechanism underlying such a shift
is not well understood. Recent studies using Reanalyses for
the latter half of the twentieth century (e.g., McCabe et al.
(2001); Fyfe (2003)) or general circulation models (GCMs)
forced with increased greenhouse gases (e.g., Lambert
(1995); Geng and Sugi (2003); Lambert and Fyfe (2006);
Gastineau and Soden (2009)) indicate an increase in
intensity of extratropical cyclones and a decrease in fre-
quency. Hall et al. (1994) found northward shifted and
downstream intensified storm tracks in a high-resolution
GCM with doubled carbon dioxide. However, some models
(e.g., Stephenson and Held (1993); Bengtsson et al. (2006);
Frierson et al. (2006); O’Gorman and Schneider (2008))
found a weakening or insignificant intensification of mid-
latitude transient eddies in the warming world.
The disagreement among models and analyses indicates
the complex dynamics of the storm track response to
increased greenhouse gases (Held (1993)). First of all, the
conversion of available potential energy in the atmosphere
supplies the energy for the growth of transient eddies
according to linear baroclinic instability theory. The linear
baroclinic instability growth rate is affected by both static
stability and meridional temperature gradients in the
atmosphere. In a warmer climate, temperature gradients
near the surface in northern winter are expected to weaken 1
due to strong high latitude warming whereas those in the
upper troposphere strengthen (e.g., Meehl et al. (2007)).
Consequently, the resulting baroclinicity tends to weaken in
the lower troposphere but strengthen in the upper tro-
posphere. It is unclear in the real atmosphere which of the
two opposing changes dominates the storm activity
although linear instability theory and numerical experi-
ments suggest that the lower-tropospheric baroclinicity has
a stronger influence on mid-latitude eddy activity (e.g.,
Held and O’Brien (1992); Pavan (1995); Lunkeit et al.
(1998)). However, the reduced lower-tropospheric baro-
clinicity in northern winter is not consistent with increased
eddy kinetic energy in previous studies (Yin (2005); Hall
et al. (1994)). Second, previous studies have noted the
strong influence of atmospheric moisture on the midlati-
tude dynamics and eddy energy fluxes (Emanuel et al.
(1987); Lapeyre and Held (2004); Frierson et al. (2007)),
which can occur in varying ways (e.g., Held (1993); Pavan
et al. (1999)). For example, increased latent heat release in
the warm sector of rising air in the storm system can
provide a source of available potential energy leading to
more intense storms (Emanuel et al. (1987); Held (1993));
on the other hand, less intense and less frequent storms
can be expected as the eddies in moist air are more efficient
in transferring energy poleward (Held (1993)). However,
Lorenz and DeWeaver (2007) suggested that the midlati-
tude circulation response to global warming is caused
by the rising tropopause height rather than increased
atmospheric moisture content and changes in low-level
baroclinicity.
The poleward energy transport in the midlatitudes is
dominated by the atmospheric component which contains a
significant contribution from the midlatitude storm tracks
(Trenberth and Caron (2001); Trenberth and Stepaniak
(2003)). It is expected that changes in storm track locations
and amplitudes can be related to changes in global plane-
tary (atmospheric plus oceanic) and atmospheric energy
balance and energy transports. This allows a further
exploration of the dynamics underlying the storm track
response as climate warms by connecting the midlatitude
storm systems with the planetary energy balance. Hall
et al. (1994) found that the zonal mean poleward energy
transport by transient eddies, particularly the contribution
from transient moisture flux, increases with doubled carbon
dioxide by using the UK Meteorological Office GCM with
a mixed-layer slab ocean model. However, they did not
explore the links to radiative and nonradiative energy
fluxes in the atmosphere.
In this study, we use the Geophysical Fluid Dynamics
Laboratory (GFDL) CM2.1 model simulations to analyze
the changes in the location and intensity of the storm tracks
in twentieth and twenty-first centuries. Focusing on one
single model allows an indepth analysis of the phenomenon.
Ultimately this work should be repeated with other models.
The GFDL CM2.1 global coupled climate model has been
widely used to study a variety of phenomena both in the
atmosphere and the ocean and for global anthropogenic
climate change projections (e.g., Meehl et al. (2007); Yin
(2005); Russell et al. (2006b); Held and Soden (2006); Lu
et al. (2007); Seager et al. (2007)). Furthermore, this model
is able to simulate not only the climatological storm track
state (shown in Sect. 3) but also the seasonal and inter-
annual variabilities (Delworth et al. (2006)). The future
storm track projections are also broadly consistent with those
previously identified Yin (2005). Yin (2005) pointed out the
consistent poleward and upward shift and intensification
1 The projected surface warming has a local minimum in the North
Atlantic region due to the weakening of the Atlantic Meridional
Overturning Circulation (MOC) predicted by climate models.
Y. Wu et al.: Changes in storm tracks and energy transports in a warmer climate
123

of the midlatitude storm tracks in 15 coupled IPCC
AR4 GCMs. These features are accompanied by the
enhanced warming in the tropical upper troposphere and the
associated change in midlatitude baroclinicity, as well as
the poleward shifts in surface wind stress and precipitation.
A brief description of the data and methods is given in
Sect. 2. Section 3 presents the storm track climatology as
well as the storm track response to warming in both sum-
mer and winter. The relevance of the changes in baroclinic
eddy energy transports to the changes in baroclinic insta-
bility and the time mean states is give in Sect. 4, followed
by the change in atmospheric and planetary energy budget
in Sect. 5. Conclusions and discussions are presented in
Sect. 6.
2 Data and methods
The model output analyzed in this paper is from GFDL’s
CM2.1 global coupled climate model developed at the
GFDL of the National Oceanic and Atmospheric Admin-
istration (NOAA) in 2004 (Delworth et al. (2006)). The
resolution of the land (LM2.1) and the atmospheric
(AM2.1) components is 2o latitude 9 2.5o longitude with
24 vertical levels in the atmosphere structured in a hybrid
coordinate. The dynamical core of AM2.1 uses the finite
volume method from Lin (2004). This model has been used
prominently for climate change experiments in the Inter-
governmental Panel on Climate Change Fourth Assessment
Report (IPCC AR4) and the US Climate Change Science
Program (US CCSP) reports. In a doubling CO2 concen-
tration scenario (A1B scenario), this model has a climate
sensitivity of 3.4 K in the global mean.2 In addition we use
the daily data from the National Centers for Environmental
Prediction-National Center for Atmospheric Research
(NCEP-NCAR) reanalysis (Kalnay et al. (1996)) to vali-
date the current climate transient eddy activity in the
GFDL CM2.1 global climate model.
We use both the twentieth and the twenty-first century
simulations in this study. For the twenty-first century
simulation, we use the daily data from the A1B scenario.
To identify the climate change response, we compare the
time mean of the late twenty-first century (years 2081–
2100) with that of the latter half of the twentieth century
(years 1961–2000) and define the trend of climate change
as the difference between the two periods. A 21-point
standard band-pass filter is applied to daily data to retain
the variability on synoptic time scales of 2–8 days
(Blackmon (1976)). All transient eddy statistics computed
in this study are based on band-pass filtered data.
3 Poleward shift and intensification of the storm tracks
The storm track activities in this study are represented by
several major transient eddy statistics (band-pass filtered)
including the transient momentum flux u0v0� �
and the
variance of eddy meridional velocity v0v0� �
at 250 mb, the
meridional sensible heat flux v0T 0� �
and moisture flux
v0q0� �
at 700 mb.
We first compare the transient eddy statistics in the
current climate simulations of the GFDL CM2.1 model to
that in the NCEP-NCAR reanalysis. Figure 1 shows the
climatology of v0v0 at 250 mb and the zonal mean ½v0v0� (the
square bracket denotes zonal average) as a function of
latitude and pressure levels in December–February (DJF)
averaged over the years 1961–2000 from the NCEP-NCAR
reanalysis and the GFDL CM2.1 model simulation. The
locations of the Pacific and Atlantic storm tracks are well
simulated as well as those in the Southern Hemisphere
(SH). But the North Atlantic storm track simulated in the
model is more zonally oriented than that in observations.
The Northern Hemisphere (NH) storm tracks are weaker in
the GFDL CM2.1 model than in observations while the
magnitude of the SH storm tracks is well simulated. Sim-
ilar results are found comparing other eddy statistics
between the model simulation and reanalysis in both DJF
and June–August (JJA) (not shown).
3.1 Horizontal structures
Figure 2 shows the twenty-first century trend in horizontal
structures of various eddy statistics in DJF and JJA (colors)
along with the twentieth century climatology (black con-
tours). The predominant features are the poleward and
eastward (downstream) intensifications of the storm activity
accompanied by a weak equatorward reduction for both the
North Pacific and North Atlantic storm tracks. These lead to
a slight poleward shift and a large poleward and eastward
expansion of the storm tracks in the late twenty-first cen-
tury. The response of the North Atlantic storm tracks is
much stronger than that of the North Pacific one in both
seasons. Take v0T 0 at 700 mb as an example: there is an
approximately 2o poleward shift and 20–30% increase in
maximum intensity in northern winter (Fig. 2e). At the
entrance regions of the two storm tracks, i.e. off the eastern
coasts of Asia and North America, there is a weakening of
2 The GFDL CM2.1 model included both stratospheric ozone
depletion in the twentieth century simulation and ozone recovery in
the A1B scenario simulation. Son et al. (2008, 2009) found that the
recent poleward shift of the midlatitude westerly jet and the poleward
expansion of the Hadley Cell in the Southern Hemisphere were
partially forced by ozone depletion and will be likely to be weakened
or even reversed (depending on models) by anticipated ozone
recovery in the current century. Ozone change and its effect are
almost negligible in the Northern Hemisphere.
Y. Wu et al.: Changes in storm tracks and energy transports in a warmer climate
123

the transient meridional sensible heat flux due to reduction
in land–sea temperature contrast and resulting reduction in
surface upward sensible heat flux from the ocean, while the
magnitude increases significantly in the downstream and
exit regions stretching northeastward to the west coast of
North America and into Western Europe (Fig. 2e). The
transient moisture flux v0q0 also intensifies in both seasons in
the two storm track regions (Fig. 2g, h). These changes in
eddy activity largely agree with Hall et al. (1994). In the
Southern Hemisphere, the intensification on the poleward
flank of the storm track regions is significant and zonally
symmetric in both seasons.
3.2 Zonal mean structures
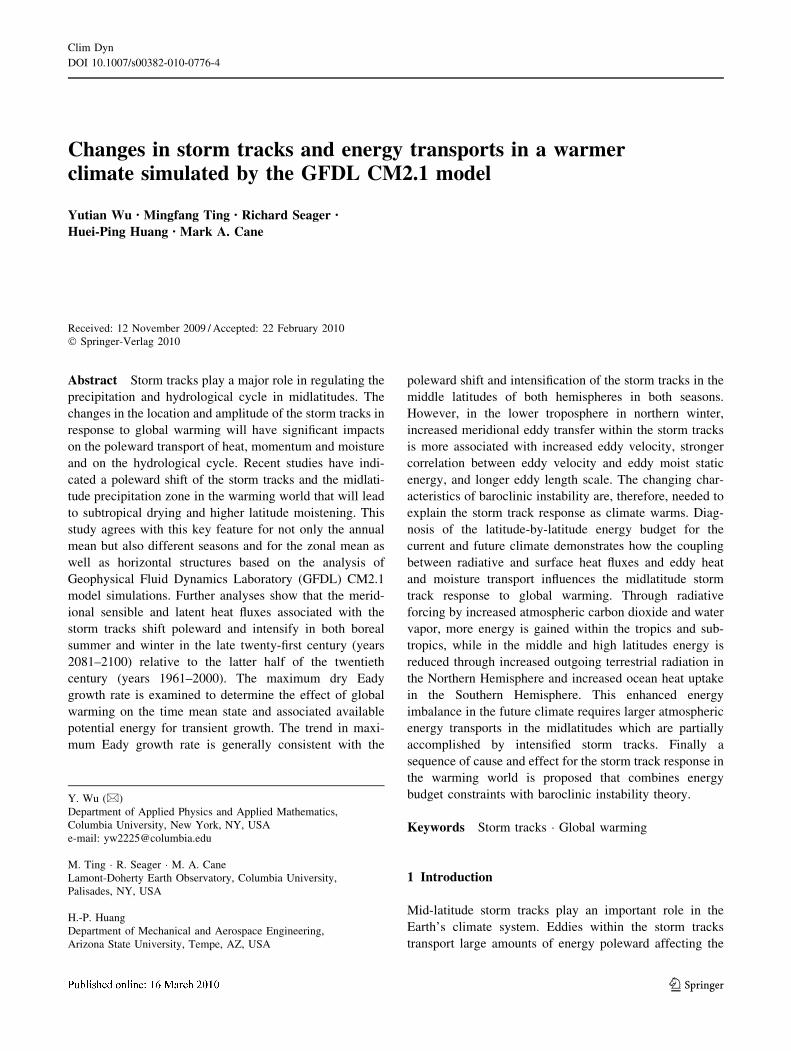
The zonal mean eddy statistics are shown in Fig. 3 with the
twentieth century climatology in contours and the twenty-
first century changes in colors. The consistent poleward
shift and intensification on the poleward flank of all the
eddy statistics can be seen in both seasons in both hemi-
spheres. In some eddy statistics, there is an upward shift as
well. Furthermore, the increased meridional moisture
transport in the future climate is consistent with the pole-
ward shift and intensification of the midlatitude precipita-
tion zone and the resulting poleward expansion and drying
of the subtropical dry zones (e.g., Seager et al. (2007)). It is
worth noting that the trend in zonal mean meridional heat
transport in southern winter (JJA) is a local intensification
rather than a poleward intensification and expansion
(Fig. 3f).
4 Relating changes in baroclinic eddy energy
transports to changes in instability
and the mean state
The maximum intensity in synoptic eddy activity in the
midlatitudes has long been related to the existence of
strong baroclinic zones and the associated baroclinic
instability which converts available potential energy of
the time mean flow to eddy kinetic energy (e.g., Lorenz
(1955); Eady (1949); Charney (1947)). One of the mea-
sures of linear baroclinic instability is the maximum Eady
growth rate, which has been mathematically simplified
and shown to be a useful estimate of the growth rate of
the most rapidly growing instability in a range of baro-
clinic instability problems (Lindzen and Farrell (1980)).
Hoskins and Valdes (1990) used the parameter to quantify
the geographical location and intensity of the storm
tracks.
Fig. 1 Comparison of band-
pass filtered variance of
meridional velocity, v0v0;produced in the GFDL CM2.1
model simulations (rightcolumn) with that derived in the
NCEP-NCAR reanalysis (leftcolumn). a Shows the
climatology of v0v0 at 250 mb
and c shows the zonal mean
½v0v0� as a function of latitude
and pressure (mb) in
December–February (DJF)
during the years 1961–2000
from the NCEP-NCAR
reanalysis. b and d Are the
counterparts from the model
simulations. Contour intervals
are 20 m2/s2. An 8-day band-
pass filter has been applied to
produce the variability of
2–8 days
Y. Wu et al.: Changes in storm tracks and energy transports in a warmer climate
123

Fig. 2 Global warming trends
in a and b u0v0 at 250 mb, c and
d v0v0 at 250 mb, e and f v0T 0 at
700 mb and g and h v0q0 at
700 mb, in DJF and JJA,
respectively, from the GFDL
CM2.1 model simulations,
plotted in colors, with the
twentieth century climatology in
contours. Contour intervals are
5 m2/s2 for a and b, 20 m2/s2 for
c and d, 2 m/s K for e and f and
1 9 10-3 m/s for g and h
Y. Wu et al.: Changes in storm tracks and energy transports in a warmer climate
123
Here we first apply the maximum Eady growth rate to
determine the changes in baroclinicity of the mean states in
the late twenty-first century from that in the latter half of
the twentieth century as simulated in the GFDL CM2.1
model. A simple approximate result for the maximum
growth rate of baroclinic instability is given by
Fig. 3 Same as Fig. 2 but for
the twenty-first century trend in
zonal mean eddy statistics as a
function of latitude and pressure
(mb), i.e. a and b ½u0v0�, c and d½v0v0�, e and f ½v0T 0�, g and h½v0q0�, in DJF and JJA,
respectively, plotted in colors,
with the 1961–2000 climatology
in contours
Y. Wu et al.: Changes in storm tracks and energy transports in a warmer climate
123

rD ¼ 0:31g1
N
1
T
o �T
oy
����
���� ð1Þ
(Lindzen and Farrell (1980)), where N is the Brunt–Vaisala
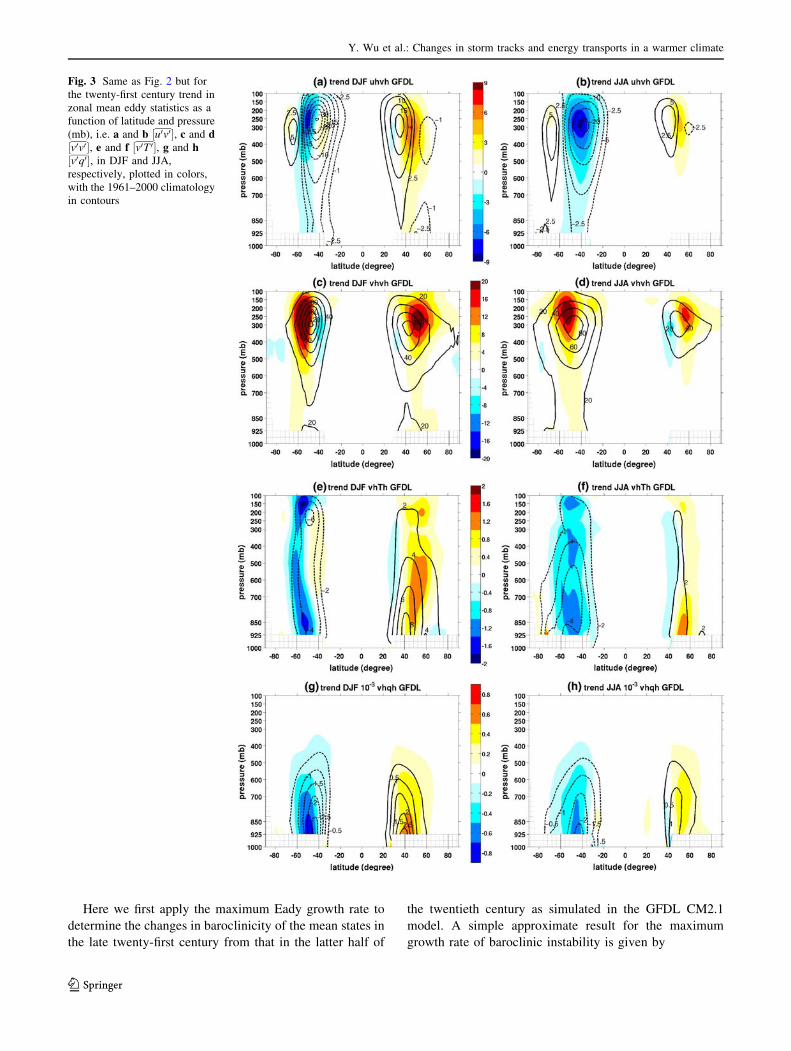
frequency, a measure of static stability. Figure 4a and b
show the twenty-first century trend in zonal mean tropo-
spheric temperature ½ �T � (colors) as well as the twentieth
century climatology (contours). It shows a strong upper
tropospheric warming in both seasons and an enhanced
Arctic warming in northern winter. The tropical upper
tropospheric warming is caused by enhanced tropical
convection which transports heat trapped by the additional
greenhouse gases upward with the tropical atmosphere
retaining a moist adiabatic lapse rate under a warmer
condition. The large warming located in the Arctic in
winter, where the ice-albedo feedback is weak, is largely a
result of large atmospheric static stability concentrating the
warming at low levels (Hansen et al. (1984)). The associ-
ated climatology and trend in zonal mean meridional
temperature gradients jo½ �T �oy j is given in Fig. 4e and f. Strong
gradients of temperature can be seen in the midlatitudes,
particularly in the vicinity of the subtropical jet (shown in
Figs. 4c, d). The trend in both seasons in both hemispheres
demonstrates a poleward shift and intensification in mid-
latitude meridional temperature gradients. The one excep-
tion is in the lower troposphere in northern winter when the
warming at the Arctic winter surface leads to a reduced
zonal mean meridional temperature gradient there.3 Fig-
ure 4g and h represent the climatology and trend of the
static stability in the atmosphere. The whole lower and
middle troposphere becomes more statically stable except
for the middle and high latitudes in northern winter. The
rising subtropical tropospheric static stability has been
related to the poleward expansion of the Hadley Cell by Lu
et al. (2007). The reduced static stability in the middle and
high latitudes in northern winter is again due to the strong
warming near the surface. The jet stream in a warmer
climate tends to shift poleward and upward and intensify
on the poleward and upward flank of the climatological jet
in both seasons in both hemispheres (Fig. 4c, d). This
change in the jet stream is consistent with that in the storm
tracks. These changes are representative of the changes in
the time-mean states of many GCMs with increased
greenhouse gases (e.g., Meehl et al. (2007)).
4.1 Zonal mean structures of baroclinic instability
As the dry Eady growth rate is determined by both the
meridional temperature gradient and static stability, future
changes in both terms will impact the change in the
baroclinic instability of the time-mean flow. The zonal
mean of the dry Eady growth rate is shown in Fig. 5a and b
for both DJF and JJA. The climatology maximizes in the
midlatitudes and is stronger in the winter hemisphere due
to stronger meridional temperature gradients. The change
in the dry Eady growth rate follows that in the meridional
temperature gradient, i.e. a poleward shift and an intensi-
fication on the poleward flank in the middle and upper
troposphere of the midlatitudes except for the lower tro-
posphere in northern winter. The contribution from the
static stability according to the dry Eady growth rate is
small, but the rising tropospheric static stability south of
40oN helps to stabilize the subtropical jet streams on the
equatorward flank whereas the reduced static stability north
of 40oN acts to enhance the instability of the jet streams on
the poleward flank, which would assist a poleward shift
of the storm tracks. Therefore, as can be seen in Fig. 5a and b,
the poleward shift and enhancement of the dry Eady
growth rate in the midlatitudes of both hemispheres in both
seasons (except for the lower troposphere in northern
winter) fully supports the storm track changes. The results
in Fig. 5a and b confirm the relevance of the changing
characteristics of baroclinic instability in driving the storm
track changes. The results further indicate that eddies are
influenced by the baroclinicity in the upper troposphere
rather than the surface instability, as the enhancement of
the instability growth rate in the upper troposphere from
225 to 550 mb well corresponds to the storm track response
in this region in terms of ½u0v0� and ½v0v0� . However, it is not
clear what role the decrease in instability growth rate in the
lower troposphere plays in explaining the storm track
response in northern winter.
4.2 Eddy transfer and mean state gradients
In order to explain that the transient eddy sensible heat
transport in the middle latitudes of both hemispheres in
both seasons increases as climate warms (Fig. 3e, f) despite
the decreased temperature gradients in the lower tropo-
sphere in northern winter, we apply mixing length theory in
this section to attribute the increasing transient eddy energy
transfer to eddy properties and mean state gradients in
boreal winter.
Based on the theoretical work of Charney (1947), Eady
(1949) and Green (1970) proposed a theory for the large-
scale eddy transfer, based on eddy mixing, by relating eddy
transfer properties to eddy motion and mean gradients as
follows:
v0m0 ¼ kjv0jjm0j ¼ kjv0j �Lmix
om
oy
� �¼ �D
om
oyð2Þ
where v0m0
is the meridional transport of any conserved
property m, D is defined as the eddy diffusivity, i.e. D = k
3 The zonal mean meridional temperature gradient reduces despite an
increase in temperature gradient in the North Atlantic region.
Y. Wu et al.: Changes in storm tracks and energy transports in a warmer climate
123
Lmix |v0| with k the correlation coefficient between v
0and m
0,
Lmix the mixing length scale, and |v0| and |m
0| rms ampli-
tudes of eddy velocity and m, and omoy is the time mean state
gradient. The complete form in Green (1970) for the
transfer in meridional-vertical section has additional con-
tribution from vertical mixing which is neglected here. We
apply Eq. 2 to the conserved quantity moist static energy,
band-pass filtered transients and zonal mean fields (with
Fig. 4 Same as Fig. 2 but for
the twenty-first century trend in
zonal mean climatological
states, i.e. a and b ½T �, c and d
½u�, e and f jo½ �T �oy j , g and h ½N�, in
DJF and JJA, respectively,
plotted in colors, with the
twentieth century climatology in
contours. Contour intervals are
225 K for a and b, 5 m/s for
c and d, 1 K/1,000 km for e and
f and 2.5/1,000 s-1 for g and h
Y. Wu et al.: Changes in storm tracks and energy transports in a warmer climate
123

square brackets denoting zonal averages neglected here)
and compute k and Lmix by definition, i.e. k ¼ v0m0
jv0 jjm0 j and
Lmix ¼ jm0 j
�omoy
for both the twentieth and twenty-first century
simulations. Here moist static energy (MSE) is defined as
m ¼ CpT þ Uþ Leq with Cp the specific heat capacity for
the atmosphere, U the geopotential height and Le the latent
heat of evaporation. Because of the quasi-geostrophic
nature of eddies, the zonally averaged eddy potential
energy transfer can be neglected and the transient eddy
MSE transport can be written as v0m0 � Cpv0T 0 þ Lev0q0 . It
is noted that the original intention of Eq. 2 is for para-
meterizing eddy transfer using large-scale quantities. Our
study here, however, is using Eq. 2 as a diagnostic tool for
understanding the change in transient eddy energy transfer
(v0m0) in terms of correlation coefficient (k), transient eddy
velocity (v0), mixing length scale (Lmix) and mean state
gradients (omoy).
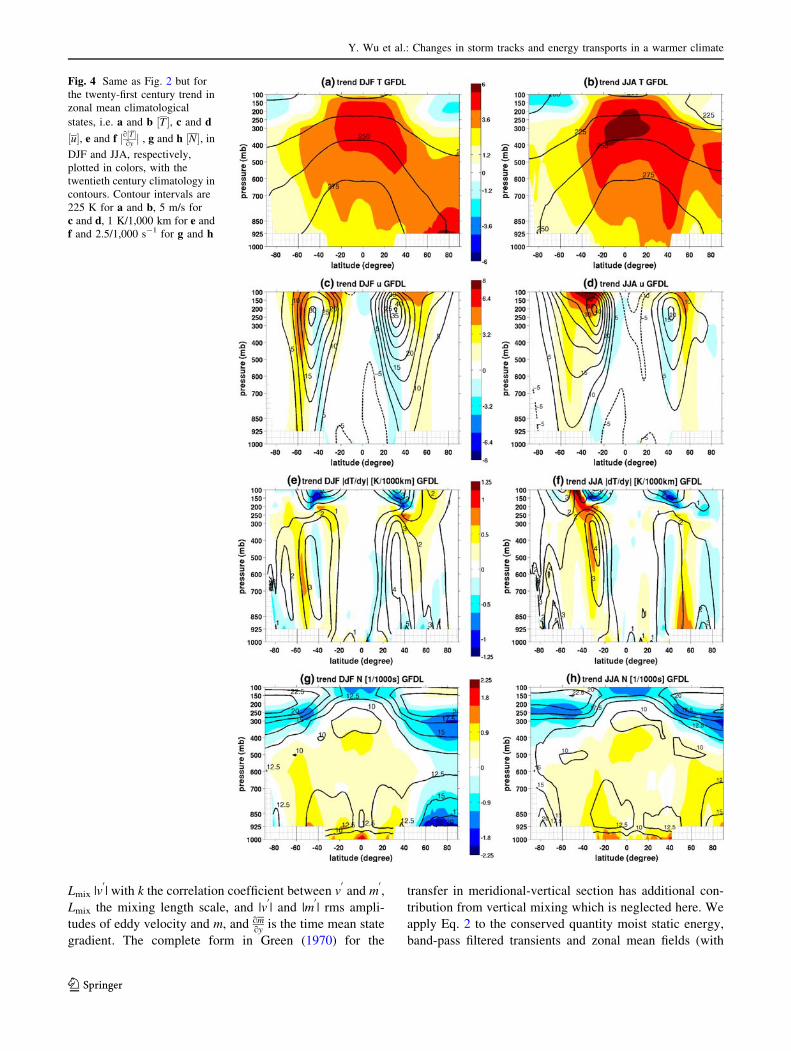
Therefore, the change in eddy MSE transport can be
written as
Dðv0m0Þ|fflfflfflffl{zfflfflfflffl}ðaÞ
¼ D kLmixjv0jð�om
oyÞ
� �
� DðkÞLmixjv0j �om
oy
� �
|fflfflfflfflfflfflfflfflfflfflfflfflfflfflfflffl{zfflfflfflfflfflfflfflfflfflfflfflfflfflfflfflffl}ðcÞ
þ kDðLmixÞjv0j �om
oy
� �
|fflfflfflfflfflfflfflfflfflfflfflfflfflfflfflffl{zfflfflfflfflfflfflfflfflfflfflfflfflfflfflfflffl}ðdÞ
þ kLmixDðjv0jÞ �om
oy
� �
|fflfflfflfflfflfflfflfflfflfflfflfflfflfflfflffl{zfflfflfflfflfflfflfflfflfflfflfflfflfflfflfflffl}ðeÞ
þ kLmixjv0jD �om
oy
� �
|fflfflfflfflfflfflfflfflfflfflfflfflfflffl{zfflfflfflfflfflfflfflfflfflfflfflfflfflffl}ðf Þ
ð3Þ
which decomposes the impact of the change in correlation
coefficient [term (c)], mixing length scale [term (d)], eddy
velocity [term (e)] and mean MSE gradient [term (f)] on the
change in total transient eddy MSE transport. Figure 6a
shows the DJF change in transient eddy MSE transport for
the late twenty-first century (colors), with the twentieth
century climatology shown in contours. It illustrates an
enhanced poleward transient eddy MSE transport in both
hemispheres. The sum of terms (c–f) in Eq. 3 is shown in
Fig. 6b in contours, with the twenty-first century trend in
v0m0 in colors. The agreement between contours and colors
in Fig. 6b indicates that the nonlinear contributions ignored
on the right hand side of Eq. 3 are insignificant.
When separating the total change in v0m0 into contribu-
tions from k, Lmix, |v0| and om
oy (Fig. 6c–f), it is found that all
of the terms contribute significantly. The colors in Fig. 6c–
f indicate the total change as shown in Fig. 6a. The most
dominant contribution in the midlatitudes of the Northern
Hemisphere comes from the increasing correlation between
transient eddy velocity and eddy MSE while in the
Southern Hemisphere it is the enhancement of mean state
gradients. As shown in Fig. 6f, the reduction in mean
energy gradient in the lower-troposphere of the middle and
high northern latitudes (caused by a decreased meridional
temperature gradient dominating over a specific humidity
gradient increase) would reduce the poleward energy
transport by the storm tracks. In contrast, in the midlati-
tudes of the Southern Hemisphere and the mid-troposphere
in the Northern Hemisphere, the increase in mean energy
gradient would lead to an increase in transient eddy energy
transport and this dominates the total in these regions. The
contribution from the other three terms in general is posi-
tive to the total. In particular, in the lower troposphere of
the midlatitude Northern Hemisphere, it is mainly the
increasing correlation coefficient, and to a lesser extent, the
increasing eddy velocity and mixing length scale that
overwhelms the decreasing contribution from the mean
gradient and leads to the intensified transient eddy energy
transport.
The question to be addressed in the following is what
causes the increasing correlation coefficient between
Fig. 5 Same as Fig. 2 but for the twenty-first century trend in zonal mean Eady growth rate rD in (a) DJF and (b) JJA, in colors, with the
twentieth century climatology in contours. Contour intervals are 0.5 day-1. Units are day-1
Y. Wu et al.: Changes in storm tracks and energy transports in a warmer climate
123
transient eddy motion and eddy energy and the increasing
mixing length scale as climate warms. It is found that the
wave packets in one-point correlation maps (Chang (1993))
become longer in the lower troposphere in the Northern
Hemisphere in future projections (not shown), which
implies more persistent wave structures and increasing
correlation over greater distances. This can also be viewed
through a cross-spectral analysis of the lower tropospheric
eddy MSE transfer as in Randel and Held (1991). Figure 7
shows a zonal wavenumber–frequency contour diagram for1
Cpv0m0 at 700 mb, averaged over the midlatitudes between
40oN and 60oN in DJF, with the twentieth century clima-
tology in black contours and the twenty-first century trend
in red. The climatological cross-spectrum shows a strong
covariance for eastward propagating waves of zonal
Fig. 6 Shown in contours are a the twentieth century climatology in
band-pass filtered transient meridional eddy moist static energy
(MSE) transfer ½v0m0� ; b sum of c, d, e and f as indicated by the
mixing length theory; changes in eddy MSE transfer caused by c the
change in correlation coefficient k between eddy motion v0
and eddy
MSE m0, d the change in mixing length scale Lmix, e the change in
eddy intensity |v0|, and f the change in mean MSE gradients. Contour
intervals are 2 9 103 m/s �J/kg for a, 0.5 9 103m/s �J/kg for b and
0.25 9 103 m/s �J/kg for c–f. Colors in a–f are the twenty-first century
trend in ½v0m0� . Units are m/s J/kg
Y. Wu et al.: Changes in storm tracks and energy transports in a warmer climate
123
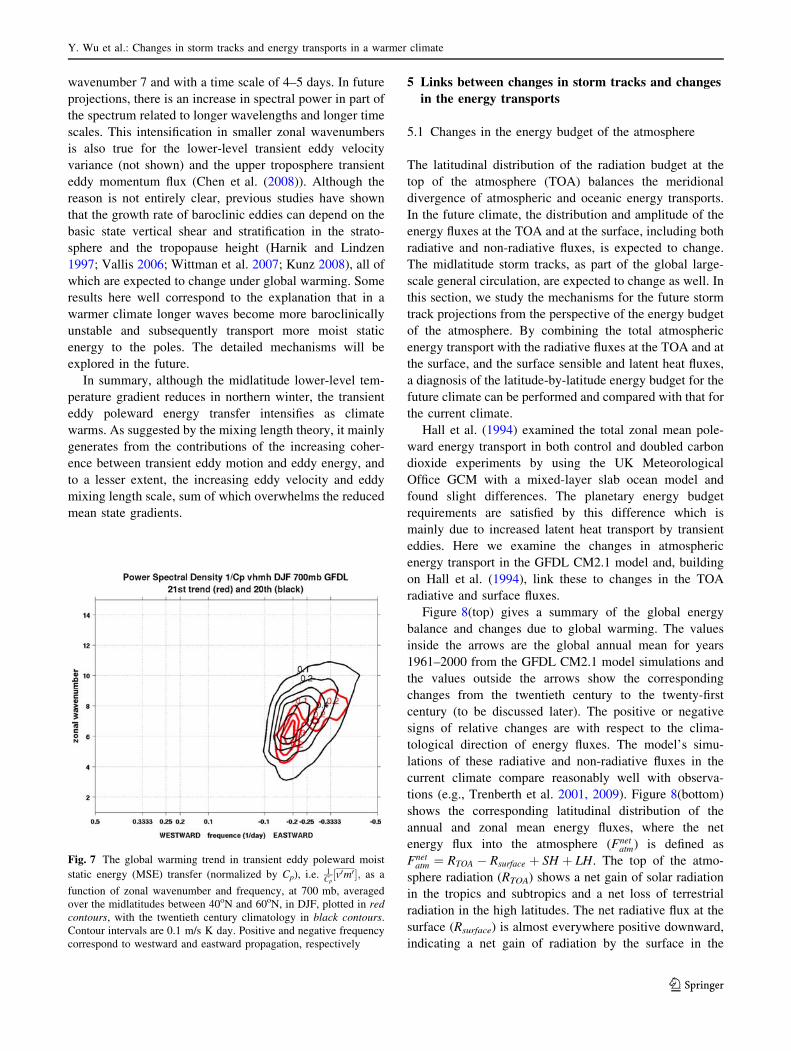
wavenumber 7 and with a time scale of 4–5 days. In future
projections, there is an increase in spectral power in part of
the spectrum related to longer wavelengths and longer time
scales. This intensification in smaller zonal wavenumbers
is also true for the lower-level transient eddy velocity
variance (not shown) and the upper troposphere transient
eddy momentum flux (Chen et al. (2008)). Although the
reason is not entirely clear, previous studies have shown
that the growth rate of baroclinic eddies can depend on the
basic state vertical shear and stratification in the strato-
sphere and the tropopause height (Harnik and Lindzen
1997; Vallis 2006; Wittman et al. 2007; Kunz 2008), all of
which are expected to change under global warming. Some
results here well correspond to the explanation that in a
warmer climate longer waves become more baroclinically
unstable and subsequently transport more moist static
energy to the poles. The detailed mechanisms will be
explored in the future.
In summary, although the midlatitude lower-level tem-
perature gradient reduces in northern winter, the transient
eddy poleward energy transfer intensifies as climate
warms. As suggested by the mixing length theory, it mainly
generates from the contributions of the increasing coher-
ence between transient eddy motion and eddy energy, and
to a lesser extent, the increasing eddy velocity and eddy
mixing length scale, sum of which overwhelms the reduced
mean state gradients.
5 Links between changes in storm tracks and changes
in the energy transports
5.1 Changes in the energy budget of the atmosphere
The latitudinal distribution of the radiation budget at the
top of the atmosphere (TOA) balances the meridional
divergence of atmospheric and oceanic energy transports.
In the future climate, the distribution and amplitude of the
energy fluxes at the TOA and at the surface, including both
radiative and non-radiative fluxes, is expected to change.
The midlatitude storm tracks, as part of the global large-
scale general circulation, are expected to change as well. In
this section, we study the mechanisms for the future storm
track projections from the perspective of the energy budget
of the atmosphere. By combining the total atmospheric
energy transport with the radiative fluxes at the TOA and at
the surface, and the surface sensible and latent heat fluxes,
a diagnosis of the latitude-by-latitude energy budget for the
future climate can be performed and compared with that for
the current climate.
Hall et al. (1994) examined the total zonal mean pole-
ward energy transport in both control and doubled carbon
dioxide experiments by using the UK Meteorological
Office GCM with a mixed-layer slab ocean model and
found slight differences. The planetary energy budget
requirements are satisfied by this difference which is
mainly due to increased latent heat transport by transient
eddies. Here we examine the changes in atmospheric
energy transport in the GFDL CM2.1 model and, building
on Hall et al. (1994), link these to changes in the TOA
radiative and surface fluxes.
Figure 8(top) gives a summary of the global energy
balance and changes due to global warming. The values
inside the arrows are the global annual mean for years
1961–2000 from the GFDL CM2.1 model simulations and
the values outside the arrows show the corresponding
changes from the twentieth century to the twenty-first
century (to be discussed later). The positive or negative
signs of relative changes are with respect to the clima-
tological direction of energy fluxes. The model’s simu-
lations of these radiative and non-radiative fluxes in the
current climate compare reasonably well with observa-
tions (e.g., Trenberth et al. 2001, 2009). Figure 8(bottom)
shows the corresponding latitudinal distribution of the
annual and zonal mean energy fluxes, where the net
energy flux into the atmosphere (Fnetatm) is defined as
Fnetatm ¼ RTOA � Rsurface þ SH þ LH. The top of the atmo-
sphere radiation (RTOA) shows a net gain of solar radiation
in the tropics and subtropics and a net loss of terrestrial
radiation in the high latitudes. The net radiative flux at the
surface (Rsurface) is almost everywhere positive downward,
indicating a net gain of radiation by the surface in the
Fig. 7 The global warming trend in transient eddy poleward moist
static energy (MSE) transfer (normalized by Cp), i.e. 1Cp½v0m0�; as a
function of zonal wavenumber and frequency, at 700 mb, averaged
over the midlatitudes between 40oN and 60oN, in DJF, plotted in redcontours, with the twentieth century climatology in black contours.
Contour intervals are 0.1 m/s K day. Positive and negative frequency
correspond to westward and eastward propagation, respectively
Y. Wu et al.: Changes in storm tracks and energy transports in a warmer climate
123

form of net solar and terrestrial radiation. It is balanced
by the loss of energy into the atmosphere in terms of
upward sensible (SH) and latent heat fluxes (LH). The net
energy flux into the atmosphere maximizes in the tropics
and has a local minimum around the equator due to the
presence of strong ocean heat divergence and suppressed
surface latent heat flux (Seager et al. 2003). The seasonal
energy fluxes are similar except for hemispheric shifts
(not shown).
In response to global warming it is expected that each
component of the energy fluxes will change as a conse-
quence of increased greenhouse gases. Figure 9 shows the
zonal mean trend from the twentieth to the twenty-first
century of all the energy fluxes. Figure 10, as an aid to
interpretation, shows the twenty-first century trend in
zonal mean precipitation and total cloud fraction. As
projected by the GFDL CM2.1 model simulations, the
downward radiative flux at the TOA (RTOA) increases by
about 2 W/m2 in the tropics and subtropics between 40oS
and 40oN in DJF (Fig. 9a). This is caused by a reduction
in solar reflection (except equatorial deep convective
region) due to reduced cloud cover (shown in Fig. 10a)
and a reduction in outgoing longwave radiation (OLR)
around the equator due to enhanced deep convection. On
the contrary, RTOA decreases at the middle and high lat-
itudes in both hemispheres. In the Northern Hemisphere,
the reduction in RTOA comes from the increased OLR
which follows the surface terrestrial radiation, whereas in
the Southern Hemisphere it is the increased cloudiness
and resulting increased solar reflection that reduces the
TOA radiation gain. This increase in radiative gain in the
tropics and subtropics and radiative loss in the middle and
high latitudes is an important factor in determining the
change in atmospheric poleward energy transport (to be
discussed).
At the surface, the downward radiative flux is expected
to increase almost everywhere on Earth because of the
increased downward longwave emission from the atmo-
sphere but is offset at the middle and high latitudes of the
summer hemispheres where increased cloudiness reflects
more solar radiation to space. A notable change in surface
non-radiative fluxes is the reduction in both upward sen-
sible and latent fluxes in both seasons over the Southern
Ocean. This is consistent with the results of Russell et al.
(2006a) who used the same model to show increased
ocean heat uptake in response to increased greenhouse
gases via increased ocean upwelling (forced by stronger
westerlies), which reduces the air–sea temperature and
humidity gradients. In addition, it is interesting to note
that the partition between surface sensible and latent heat
fluxes in response to global warming is seasonally and
geographically dependent in the Northern Hemisphere. In
northern winter, the evaporation over the ocean in general
(except the North Atlantic ocean) increases as a result of
increased greenhouse effect whereas the upward sensible
heat flux reduces up to 70oN due to reduced land–sea
temperature contrast and increases north of 70oN because
of the sea ice melting (Fig. 9b). In northern summer, the
increased subtropical drying (e.g., Gregory et al. 1996;
Held and Soden 2006; Seager et al. 2007) tends to
Fig. 8 Top summary of the global energy balance illustrating the
notation and direction of energy fluxes. At the top of the atmosphere
(TOA), the net downward radiative flux RTOA (positive downward) is
made up of the incoming and reflected solar radiation and the
outgoing longwave radiation (OLR). The surface flux is made up of
the net radiative flux Rsurface (positive downward), the surface sensible
heat flux SH (positive upward) and the surface latent heat flux LH
(positive upward). The surface radiative flux is comprised of the
downward solar radiation, the surface reflected solar radiation, the
surface emitted longwave radiation, the longwave radiation emitted
back from the atmosphere. The values inside and outside the arrows
are the global annual mean for years 1961–2000 and relative changes
from years 1961–2000 to 2081–2100, respectively, from the GFDL
CM2.1 model simulation. Positive or negative signs in relative
changes are with respect to the climatological direction of energy
fluxes. Bottom annual and zonal mean energy fluxes for years 1961–
2000. It comprises RTOA, Rsurface, SH, LH and the net energy flux into
the atmosphere Fnetatm. Units are W/m2
Y. Wu et al.: Changes in storm tracks and energy transports in a warmer climate
123
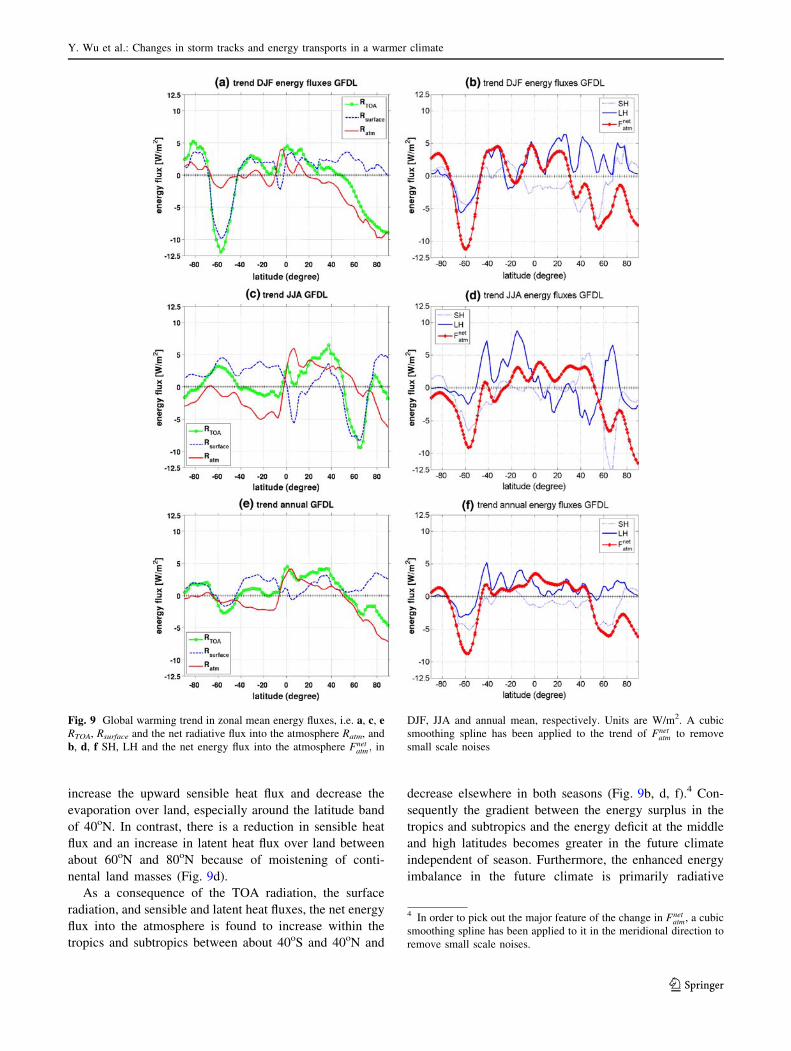
increase the upward sensible heat flux and decrease the
evaporation over land, especially around the latitude band
of 40oN. In contrast, there is a reduction in sensible heat
flux and an increase in latent heat flux over land between
about 60oN and 80oN because of moistening of conti-
nental land masses (Fig. 9d).
As a consequence of the TOA radiation, the surface
radiation, and sensible and latent heat fluxes, the net energy
flux into the atmosphere is found to increase within the
tropics and subtropics between about 40oS and 40oN and
decrease elsewhere in both seasons (Fig. 9b, d, f).4 Con-
sequently the gradient between the energy surplus in the
tropics and subtropics and the energy deficit at the middle
and high latitudes becomes greater in the future climate
independent of season. Furthermore, the enhanced energy
imbalance in the future climate is primarily radiative
Fig. 9 Global warming trend in zonal mean energy fluxes, i.e. a, c, eRTOA, Rsurface and the net radiative flux into the atmosphere Ratm, and
b, d, f SH, LH and the net energy flux into the atmosphere Fnetatm; in
DJF, JJA and annual mean, respectively. Units are W/m2. A cubic
smoothing spline has been applied to the trend of Fnetatm to remove
small scale noises
4 In order to pick out the major feature of the change in Fnetatm, a cubic
smoothing spline has been applied to it in the meridional direction to
remove small scale noises.
Y. Wu et al.: Changes in storm tracks and energy transports in a warmer climate
123

driven. To achieve an equilibrium state, the total atmo-
spheric energy transport from the equator to the poles must
increase. This can be accomplished, all or in part, by
intensified transient eddy heat transport.
5.2 Changes in the atmospheric energy transport
In this section we quantitatively measure the amount of
increased energy transport in the atmosphere required by
the energy budget change and examine how it is partitioned
among the mean meridional circulation and transient and
stationary eddies. We will demonstrate that the increased
atmospheric energy transport is concentrated in mid-lati-
tudes and is partially accomplished by the intensified
transient eddies, particularly the storm tracks in both sea-
sons in both hemispheres.
The total atmospheric energy transport was first esti-
mated based on the energy budget of the atmosphere as
follows:
SA ¼ Fnetatm �r � FA ð4Þ
where SA is the energy storage rate in the atmosphere and
FA is the total atmospheric energy transport. Although the
atmospheric heat content increases during the latter half of
the twentieth century due to anthropogenic warming (e.g.,
Levitus et al. (2001)), it is at least one order of magnitude
smaller than the net energy flux into the atmosphere and is
neglected. Averaged over a time period and over longitude
domain, ½FA� satisfies
1
R cos /d
d/ð½FA� cos /Þ ¼ ½Fnet
atm� ð5Þ
where R is the Earth’s radius and / is latitude. Integrating
from any specific latitude /o, the energy transport in the
atmosphere across any latitudinal wall /, denoted by ½TEBA �,
can therefore be written as
½TEBA � ¼2pR cos /½FA�
¼2pR2
Z/
/o
½Fnetatm� cos /d/þ ½TEB
A �j/o
ð6Þ
where ½TEBA �j/o
is an integral constant and is the total
atmospheric energy transport at latitude /o. The integral is
commonly taken from the North Pole where ½TEBA �j/o¼p
2¼ 0
(e.g., Hall et al. (1994)) and corrections are made to elimi-
nate the occurrence of spurious nonzero transports of energy
at both poles (Carissimo et al. (1985)). In this case, the
Fig. 10 Global warming trend in zonal mean total cloud fraction (in unit of %) and precipitation (in unit of mm/day), in a DJF, b JJA and c the
annual mean, from the GFDL CM2.1 model simulations
Y. Wu et al.: Changes in storm tracks and energy transports in a warmer climate
123

integral constant is determined with respect to the atmo-
spheric energy transport derived from daily data in the
model, for example, at the Equator, to ensure accurate
estimates. Figure 11 shows ½TEBA � for DJF, JJA and the
annual mean during the years 1961–2000 and is broadly
consistent with the estimates of the meridional atmosphere
heat transport in Trenberth and Caron (2001).
For the second method, the total atmospheric energy
transport is computed directly from the daily data of
velocity, temperature and humidity by integrating the
energy transport throughout the whole atmosphere column
on hybrid coordinates (Delworth et al. (2006); Lin (2004)).
It, denoted by ½TA� can be written as
½TA� ¼ 2pR cos /1
g
Zps
0
½FE/�dp ð7Þ
where ½FE/� ¼ ½vE� ¼ Cp½vT� þ ½vU� þ Le½vq� þ ½vK� which
comprises the meridional transport of sensible heat, geo-
potential energy, latent heat and kinetic energy K. It is also
shown in Fig. 11 and agrees well with the estimates from the
energy balance requirement. The total atmospheric energy
transport is furthermore decomposed into the contributions
from different dynamical processes such as the mean
meridional circulation (MMC), the transient eddies and the
stationary waves, i.e. ½vE� ¼ ½v�½E� þ ½v0E0� þ ½v�E��; where� denotes the deviation from zonal average. The storm tracks
are the high-frequency part of the transient eddies and the
low-frequency component in this study is defined as the
difference between the total transient eddies and the storm
tracks. The twentieth century climatology for each term is
shown in Fig. 11, in which the energy transport by transient
eddies in large part dominates the atmospheric energy
transport in mid-latitudes while the mean meridional cir-
culation transports a large amount of energy to the poles in
the tropics. It is also noted that the midlatitude heat transport
within the high-frequency transient eddies is as large as that
in stationary waves and is smaller than that in low-frequency
eddies. Figure 12 shows the corresponding trend for each
term. The total atmospheric energy transport increases
almost everywhere across the globe in the late twenty-first
century, especially in the regions of the mid-latitudes where
eddies dominate the energy transport in the atmosphere.
With respect to the contribution from each dynamical
process, the increased atmospheric energy transport, in part,
comes from the intensified storm tracks in both seasons in
both hemispheres; moreover, the location of the maximum
−80 −60 −40 −20 0 20 40 60 80−8
−6
−4
−2
0
2
4
6
8
latitude (degree)
ener
gy
tran
spo
rt [
PW
]
Atmospheric Energy Transport DJF 1961−2000 GFDL
total EBtotalMMCstorm trackslow−frequency eddiesstationary eddies
−80 −60 −40 −20 0 20 40 60 80−8
−6
−4
−2
0
2
4
6
8
latitude (degree)
ener
gy
tran
spo
rt [
PW
]
Atmospheric Energy Transport JJA 1961−2000 GFDL
−80 −60 −40 −20 0 20 40 60 80−8
−6
−4
−2
0
2
4
6
8
latitude (degree)
ener
gy
tran
spo
rt [
PW
]
Atmospheric Energy Transport annual 1961−2000 GFDL
(a)
(b)
(c)
Fig. 11 Estimates of the total atmospheric energy transport, i.e. ½TEBA �
derived from the energy budget of the atmosphere and ½TA� derived
directly from daily data (more in the text), and the energy transport in
the atmosphere from the mean meridional circulations (MMC), the
storm tracks (band-pass filtered transient eddies with period of 2–8
days), the low-frequency eddies (difference between total transient
eddies and the storm tracks) and the stationary waves, for
a December–February (DJF), b June–August (JJA) and c the annual
mean, respectively, during years 1961–2000 from the GFDL CM2.1
model simulations. Units are PW
c
Y. Wu et al.: Changes in storm tracks and energy transports in a warmer climate
123
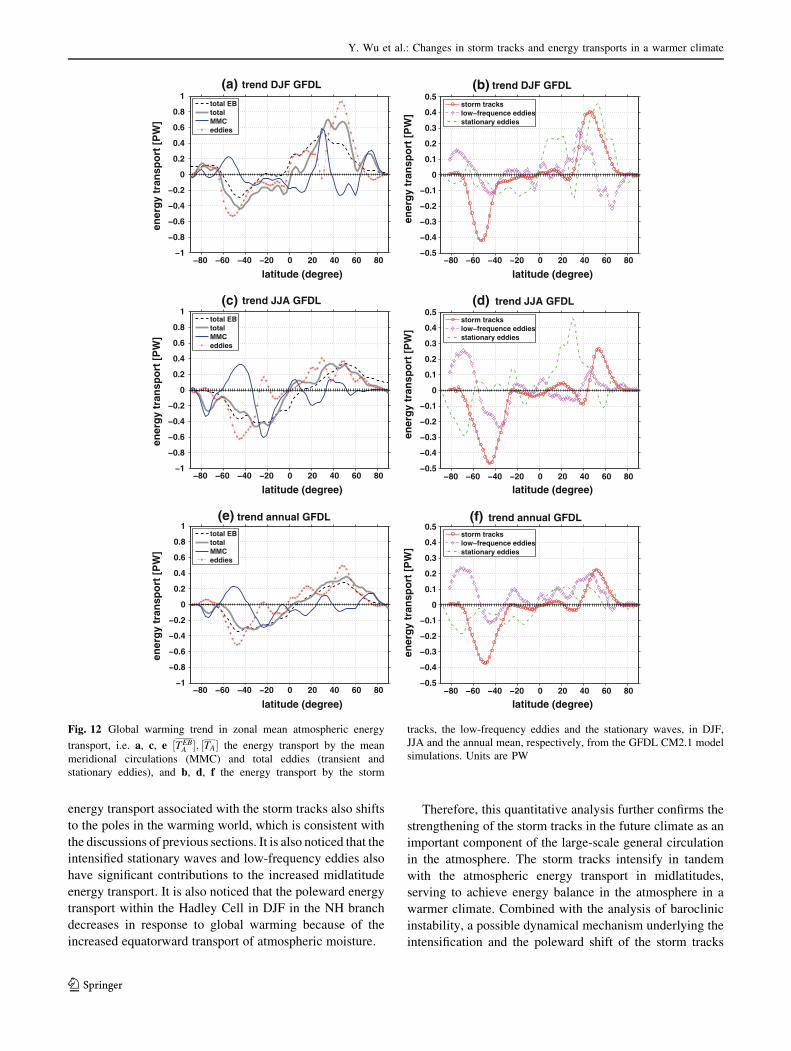
energy transport associated with the storm tracks also shifts
to the poles in the warming world, which is consistent with
the discussions of previous sections. It is also noticed that the
intensified stationary waves and low-frequency eddies also
have significant contributions to the increased midlatitude
energy transport. It is also noticed that the poleward energy
transport within the Hadley Cell in DJF in the NH branch
decreases in response to global warming because of the
increased equatorward transport of atmospheric moisture.
Therefore, this quantitative analysis further confirms the
strengthening of the storm tracks in the future climate as an
important component of the large-scale general circulation
in the atmosphere. The storm tracks intensify in tandem
with the atmospheric energy transport in midlatitudes,
serving to achieve energy balance in the atmosphere in a
warmer climate. Combined with the analysis of baroclinic
instability, a possible dynamical mechanism underlying the
intensification and the poleward shift of the storm tracks
−80 −60 −40 −20 0 20 40 60 80
−80 −60 −40 −20 0 20 40 60 80
−1
−0.8
−0.6
−0.4
−0.2
0
0.2
0.4
0.6
0.8
1
latitude (degree)
ener
gy
tran
spo
rt [
PW
]
trend DJF GFDL
total EBtotalMMCeddies
−80 −60 −40 −20 0 20 40 60 80
−80 −60 −40 −20 0 20 40 60 80
−80 −60 −40 −20 0 20 40 60 80 −80 −60 −40 −20 0 20 40 60 80
−0.5
−0.4
−0.3
−0.2
−0.1
0
0.1
0.2
0.3
0.4
0.5
latitude (degree)
ener
gy
tran
spo
rt [
PW
]
trend DJF GFDL
storm trackslow−frequence eddiesstationary eddies
−1
−0.8
−0.6
−0.4
−0.2
0
0.2
0.4
0.6
0.8
1
latitude (degree)
ener
gy
tran
spo
rt [
PW
]
trend JJA GFDL
total EBtotalMMCeddies
−0.5
−0.4
−0.3
−0.2
−0.1
0
0.1
0.2
0.3
0.4
0.5
latitude (degree)
ener
gy
tran
spo
rt [
PW
]
trend JJA GFDL
storm trackslow−frequence eddiesstationary eddies
−1
−0.8
−0.6
−0.4
−0.2
0
0.2
0.4
0.6
0.8
1
latitude (degree)
ener
gy
tran
spo
rt [
PW
]
trend annual GFDL
total EBtotalMMCeddies
−0.5
−0.4
−0.3
−0.2
−0.1
0
0.1
0.2
0.3
0.4
0.5
latitude (degree)
ener
gy
tran
spo
rt [
PW
]
trend annual GFDL
storm trackslow−frequence eddiesstationary eddies
(a) (b)
(c) (d)
(e) (f)
Fig. 12 Global warming trend in zonal mean atmospheric energy
transport, i.e. a, c, e ½TEBA �; ½TA� the energy transport by the mean
meridional circulations (MMC) and total eddies (transient and
stationary eddies), and b, d, f the energy transport by the storm
tracks, the low-frequency eddies and the stationary waves, in DJF,
JJA and the annual mean, respectively, from the GFDL CM2.1 model
simulations. Units are PW
Y. Wu et al.: Changes in storm tracks and energy transports in a warmer climate
123
can be summarized as the follows. As climate warms, the
planetary and atmospheric energy imbalance enhances
which is primarily radiative driven. This provides more
available potential energy in the atmosphere causing the
midlatitude storm tracks to intensify and to shift towards
the poles.
In addition to the thermal structure and the energy
transport in the atmosphere, the midlatitude ocean fronts
are also important in the formation and development of the
storm tracks. Although the oceanic heat transport in the
midlatitudes is smaller relative to the atmospheric com-
ponent (Trenberth and Caron (2001)), the coupling
between the atmosphere and the ocean in driving the
midlatitude storm tracks has been noticed in both obser-
vations and model experiments (see a review by Nakamura
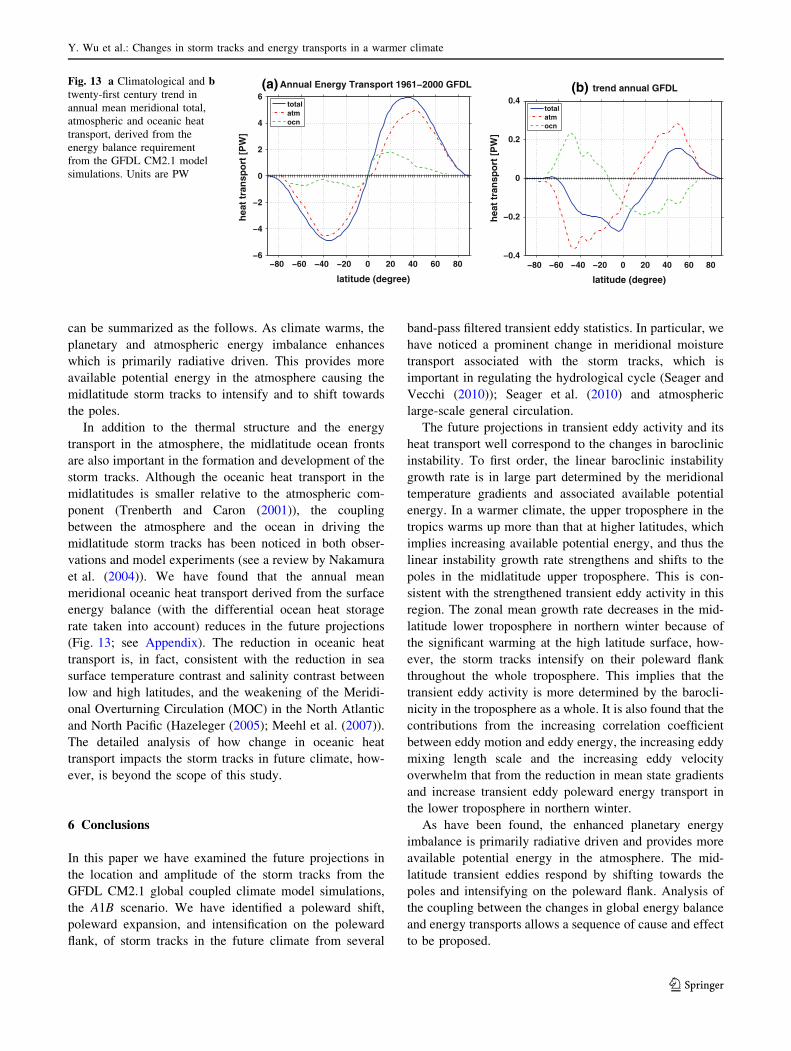
et al. (2004)). We have found that the annual mean
meridional oceanic heat transport derived from the surface
energy balance (with the differential ocean heat storage
rate taken into account) reduces in the future projections
(Fig. 13; see Appendix). The reduction in oceanic heat
transport is, in fact, consistent with the reduction in sea
surface temperature contrast and salinity contrast between
low and high latitudes, and the weakening of the Meridi-
onal Overturning Circulation (MOC) in the North Atlantic
and North Pacific (Hazeleger (2005); Meehl et al. (2007)).
The detailed analysis of how change in oceanic heat
transport impacts the storm tracks in future climate, how-
ever, is beyond the scope of this study.
6 Conclusions
In this paper we have examined the future projections in
the location and amplitude of the storm tracks from the
GFDL CM2.1 global coupled climate model simulations,
the A1B scenario. We have identified a poleward shift,
poleward expansion, and intensification on the poleward
flank, of storm tracks in the future climate from several
band-pass filtered transient eddy statistics. In particular, we
have noticed a prominent change in meridional moisture
transport associated with the storm tracks, which is
important in regulating the hydrological cycle (Seager and
Vecchi (2010)); Seager et al. (2010) and atmospheric
large-scale general circulation.
The future projections in transient eddy activity and its
heat transport well correspond to the changes in baroclinic
instability. To first order, the linear baroclinic instability
growth rate is in large part determined by the meridional
temperature gradients and associated available potential
energy. In a warmer climate, the upper troposphere in the
tropics warms up more than that at higher latitudes, which
implies increasing available potential energy, and thus the
linear instability growth rate strengthens and shifts to the
poles in the midlatitude upper troposphere. This is con-
sistent with the strengthened transient eddy activity in this
region. The zonal mean growth rate decreases in the mid-
latitude lower troposphere in northern winter because of
the significant warming at the high latitude surface, how-
ever, the storm tracks intensify on their poleward flank
throughout the whole troposphere. This implies that the
transient eddy activity is more determined by the barocli-
nicity in the troposphere as a whole. It is also found that the
contributions from the increasing correlation coefficient
between eddy motion and eddy energy, the increasing eddy
mixing length scale and the increasing eddy velocity
overwhelm that from the reduction in mean state gradients
and increase transient eddy poleward energy transport in
the lower troposphere in northern winter.
As have been found, the enhanced planetary energy
imbalance is primarily radiative driven and provides more
available potential energy in the atmosphere. The mid-
latitude transient eddies respond by shifting towards the
poles and intensifying on the poleward flank. Analysis of
the coupling between the changes in global energy balance
and energy transports allows a sequence of cause and effect
to be proposed.
−80 −60 −40 −20 0 20 40 60 80−6
−4
−2
0
2
4
6
latitude (degree)
hea
t tr
ansp
ort
[P
W]
Annual Energy Transport 1961−2000 GFDL
totalatmocn
−80 −60 −40 −20 0 20 40 60 80−0.4
−0.2
0
0.2
0.4
latitude (degree)
hea
t tr
ansp
ort
[P
W]
trend annual GFDL
totalatmocn
(a) (b)Fig. 13 a Climatological and btwenty-first century trend in
annual mean meridional total,
atmospheric and oceanic heat
transport, derived from the
energy balance requirement
from the GFDL CM2.1 model
simulations. Units are PW
Y. Wu et al.: Changes in storm tracks and energy transports in a warmer climate
123
1. Increased carbon dioxide and the associated water
vapor feedback cause increased radiative gain in the
atmosphere and warming in the tropics and subtropics
which strengthens the maximum baroclinicity and
shifts the latitude of maximum baroclinicity zone
poleward.
2. At the same time, accompanying the increased avail-
able atmospheric moisture, the poleward transport of
latent heat by transient eddies increases which to a
large extent balances the increased meridional gradient
in the planetary energy balance.
3. Due to intensified moisture divergence and resulting
reduced cloudiness, the subtropical radiative gain
increases.
4. At the same time, as a result of increased poleward
moisture transport, increased cloudiness is produced in
the middle and higher latitudes which reduces the solar
radiative gain. Additional radiative loss in these
regions results from the increased outgoing terrestrial
radiation emitted to space as a result of the surface
warming. The feedback from cloud over could further
enhance the pole-to-equator energy imbalance leading
to more intensified poleward energy transport by
transient eddies.
5. Over the Southern Ocean, the ocean heat uptake
increases as a consequence of increased greenhouse
gases which results in reduced surface fluxes from the
ocean. This atmosphere–ocean coupling enhances the
energy imbalance in the atmosphere leading to further
intensified transient eddy activity in the Southern
Hemisphere.
Our main objective in this paper is to understand the
dynamical mechanisms for the storm track response in a
warmer climate, both in terms of the change in baroclinic
instability and the change in global energy budget in the
atmosphere. The current study focuses on the GFDL
CM2.1 global coupled climate model simulations. Further
works include the extension to other IPCC models with
available daily data to confirm the connections between
eddy response and global atmospheric energy imbalance.
Simple atmospheric model experiments with doubled car-
bon dioxide will be used to confirm and refine the proposed
causality sequence of the transient eddy response in a
warmer climate. In addition, how the transient eddy wave
structures change under global warming and their con-
nections to the poleward energy transfer will be investi-
gated in future work.
Acknowledgments The authors would like to thank two anonymous
reviewers for their insightful comments which lead to significant
improvement of the paper. We also thank Nili Harnik for helpful
discussions. This work was supported by NOAA CPPA Program and
by NSF grant ATM-0543256. YW was also supported by NASA
Headquarters under the NASA Earth and Space Science Fellowship
Program -Grant NNX08AU80H.
Appendix
Change in oceanic heat transport
The meridional oceanic heat transport can be derived from
the surface energy balance and is written as
So ¼ Rsurface � SH � LH �r � Fo ð8Þ
where So denotes the rate of ocean heat storage, Rsurface is
the net downward radiative flux at the surface, SH and LH
are the surface upward sensible and latent heat fluxes, and
Fo denotes the oceanic heat transport. The difference from
the derivation in atmospheric energy transport is that the
ocean heat storage can’t be neglected in the long term as
climate warms. The heat storage rate is defined as the
oceanic potential temperature difference between years
1961–2000 and years 2081–2100 integrated over the ocean
depth, multiplying by the sea water density and heat
capacity, divided by the time period of 110 years. It is
quite uniformly distributed over latitude and is calculated
to be about 1.5 W/m2 on global average (consistent with
Russell et al. (2006a)). Increased heat storage is relatively
larger over the Southern Ocean and smaller over the North
Atlantic region (not shown). Figure 13a shows the cli-
matological meridional total, atmospheric and oceanic
energy transport derived from the energy balance
requirement. Taking the differential ocean heat storage
rate into account, Fig. 13b shows the change in total,
atmospheric and oceanic heat transport in the future cli-
mate. It is noted that the oceanic heat transport decreases
almost everywhere whereas the atmospheric heat transport
increases. Held and Soden (2006) pointed out that the
reduction in meridional ocean heat transport serves as a
compensation for the increased poleward latent heat
transport in the atmosphere.
References
Bengtsson L, Hodges KI, Roeckner E (2006) Storm tracks and climate
change. J Clim 19:3518–3543
Blackmon ML (1976) A climatological spectral study of the 500 mb
geopotential height of the Northern Hemisphere. J Atmos Sci
33:1607–1623
Carissimo BC, Oort AH, Haar THV (1985) Estimating the meridional
energy transports in the atmosphere and ocean. J Phys Oceanogr
15:82–91
Chang EK (1993) Downstream development of baroclinic waves as
inferred from regression analysis. J Atmos Sci 50:2038–2053
Chang EKM, Lee S, Swanson KL (2002) Storm track dynamics.
J Clim 15:2163–2183
Y. Wu et al.: Changes in storm tracks and energy transports in a warmer climate
123
Charney JG (1947) The dynamics of long waves in a baroclinic
westerly current. J Meteorol 4:135–162
Chen G, Lu J, Frierson DM (2008) Phase speed spectra and the
latitude of surface westerlies: interannual variability and global
warming trend. J Clim 21:5942–5959
Delworth TL et al (2006) GFDL’s CM2 global coupled climate
models. Part I. Formulation and simulation characteristics.
J Clim 19:643–674
Eady ET (1949) Long waves and cyclone waves. Tellus 1:33–52
Emanuel KA, Fantini M, Thorpe AJ (1987) Baroclinic instability in
an environment of small stability to slantwise moist convection.
Part I. Two-dimensional models. J Atmos Sci 44:1559–1573
Frierson DMW, Held IM, Zurita-Gotor P (2006) A gray-radiation
aquaplanet moist GCM. Part I. Static stability and eddy scale.
J Atmos Sci 63:2548–2566
Frierson DMW, Held IM, Zurita-Gotor P (2007) A gray-radiation
aquaplanet moist GCM. Part II. Energy transports in altered
climates. J Atmos Sci 64:1680–1693
Fyfe JC (2003) Extratropical Southern Hemisphere cyclones: Har-
bingers of climate change. J Clim 16:2802–2805
Gastineau G, Soden BJ (2009) Model projected changes of extreme
wind events in response to global warming. Geophys Res Lett
36:L10 810. doi:10.1029/2009GL037500
Geng Q, Sugi M, (2003) Possible change of extratropical cyclone
activity due to enhanced greenhouse gases and sulfate aerosols—
study with a high-resolution AGCM. J Clim 16:2262–2274
Green JSA (1970) Transfer properties of the large-scale eddies and
the general circulation of the atmosphere. Quart J Roy Meteorol
Soc 96:157–185
Gregory JM, Mitchell JFB, Brady AJ (1996) Summer drought in
Northern Midlatitudes in a time-dependent CO2 climate exper-
iment. J Clim 10:662–686
Hall NMJ, Hoskins BJ, Valdes PJ, Senior CA (1994) Storm tracks in a
high-resolution GCM with doubled carbon dioxide. Quart J Roy
Meteorol Soc 120:1209–1230
Hansen JE, Lacis A, Rind D, Russell G, Stone P, Fung I, Ruedy R,
Lerner J (1984) Climate sensitivity: analysis of feedback
mechanisms. In: Hansen JE, Takahashi T (eds) Climate processes
and climate sensitivity, AGU Geophysical Monograph 29,
Maurice Ewing vol 5. American Geophysical Union, pp 130–163
Harnik N, Lindzen RS (1997) The effect of basic-state potential
vorticity gradients on the growth of baroclinic waves and the
height of the tropopause. J Atmos Sci 55:344–360
Hazeleger W, (2005) Can global warming affect tropical ocean heat
transport?. Geophys Res Lett 32:L22 701. doi:10.1029/2005
GL023450
Held IM (1993) Large-scale dynamics and global warming. Bull Am
Meteorol Soc 74:228–241
Held IM, O’Brien E (1992) Quasigeostrophic turbulence in a three-
layer model: effects of vertical structure in the mean shear.
J Atmos Sci 49:1861–1870
Held IM, Soden BJ (2006) Robust response of the hydrological cycle
to global warming. J Clim 19:5686–5699
Hoskins BJ, Valdes PJ (1990) On the existence of storm-tracks.
J Atmos Sci 47:1854–1864
Kalnay E et al (1996) The NCEP/NCAR 40-year reanalysis project.
Bull Am Meteorol Soc 77:437–471
Kunz T (2008) The role of breaking synoptic scale Rossby waves for
the North Atlantic oscillation and its coupling with the strato-
sphere. Ph.D. thesis, der Universitat Hamburg
Lambert SJ (1995) The effect of enhanced greenhouse warming on
winter cyclone frequencies and strengths. J Clim 8:1447–1452
Lambert SJ, Fyfe JC (2006) Changes in winter cyclones frequencies
and strengths simulated in enhanced greenhouse warming
experiments: results from the models participating in the IPCC
diagnostic exercise. Clim Dyn 26:713–728
Lapeyre G, Held IM (2004) The role of moisture in the dynamics and
energetics of turbulent baroclinic eddies. J Atmos Sci 61:1693–
1710
Levitus S, Antonov JI, Wang J, Delworth TL, Dixon KW, Broccoli
AJ (2001) Anthropogenic warming of earth’s climate system. Sci
292:267–270
Lin SJ (2004) A vertically Lagrangian finite-volume dynamical core
for global models. Mon Wea Rev 132: 2293–2307
Lindzen RS, Farrell BF (1980) A simple approximation result for
maximum growth rate of baroclinic instabilities. J Atmos Sci
37:1648–1654
Lorenz EN (1955) Available potential energy and the maintenance of
the general circulation. Tellus 7:157–167
Lorenz DJ, DeWeaver ET (2007) Tropopause height and zonal wind
response to global warming in the IPCC scenario integrations.
J Geophys Res 112:D10 119. doi:10.1029/2006JD008087
Lu J, Vecchi GA, Reichler T (2007) Expansion of the Hadley cell
under global warming. Geophys Res Lett 34:L06 805. doi:
10.1029/2006GL028443
Lunkeit F, Fraedrich K, Bauer SE (1998) Storm tracks in a warmer
climate: sensitivity studies with a simplified global circulation
model. Clim Dyn 14:813–826
McCabe GJ, Clark MP, Serreze MC (2001) Trends in Northern
Hemisphere surface cyclone frequency and intensity. J Clim
14:2763–2768
Meehl GA et al (2007) Global climate projections. In: Solomon S,
Qin D, Manning M, Chen Z, Marquis M, Averyt KB, Tignor M,
Miller HL (eds) Climate Change 2007: The Physical Science
Basis. Contribution of Working Group I to the Fourth Assess-
ment Report of the Intergovernmental Panel on Climate Change,
Cambridge University Press, Chap. 10, pp 747–846
Nakamura H, Sampe T, Tanimoto Y, Shimpo A (2004) Observed
associations among storm tracks, jet streams and midlatitude
oceanic fronts, earth’s climate: the ocean–atmosphere interac-
tion. In: Wang C, Xie S-P, Carton JA (eds) Geophys Monogr,
147, American Geophysical Union, Washington, pp 329–346
O’Gorman PA, Schneider T (2008) Energy of midlatitude transient
eddies in idealized simulations of changed climates. J Clim
21:5797–5806
Pavan V (1995) Sensitivity of a multi-layer quasi-geostrophic
b-channel to the vertical structure of the equilibrium meridional
temperature gradient. Quart J Roy Meteorol Soc 122:55–72
Pavan V, Hall N, Valdes P, Blackburn M (1999) The importance of
moisture distribution for the growth and energetics of mid-
latitude systems. Ann Geophys 17:242–256
Randel WJ, Held IM (1991) Phase speed spectra of transient eddy
fluxes and critical layer absorption. J Atmos Sci 48:688–697
Russell JL, Dixon KW, Gnanadesikan A, Stouffer RJ, Toggweiler JR
(2006a) The Southern Hemisphere westerlies in a warming
world: propping open the door to the deep ocean. J Clim
19:6382–6390
Russell JL, Souffer RJ, Dixon KW (2006b) Intercomparison of the
Southern Ocean circulations in the IPCC coupled model control
simulations. J Clim 19:4560–4575
Seager R, Murtugudde R, Clement AC, Herweijer C (2003) Why is
there an evaporation minimum at the Equator. J Clim 16:3792–
3801
Seager R, et al (2007) Model projections of an imminent transition to
a more arid climate in southwestern North America. Science
316: 1181–1184
Seager R, Naik N, Vecchi G (2010) Thermodynamic and dynamic
causes of large-scale changes in the hydrological cycle in
response to global warming. J Clim (submitted)
Seager R. Vecchi G (2010) Global warming and the 21st century
climate of southwestern North America. Proc Natl Acad Sci
USA (submitted)
Y. Wu et al.: Changes in storm tracks and energy transports in a warmer climate
123

Son S-W et al (2008) The impact of stratospheric ozone recovery on
the Southern Hemisphere westerly jet. Science 320: 1486–1489
Son S-W, Tandon NF, Polvani LM, Waugh DW (2009) Ozone hole
and Southern Hemisphere climate change. Geophys Res Lett
36:L15 705. doi:10.1029/2009GL038671
Stephenson DB, Held IM, (1993) GCM response of northern winter
stationary waves and storm tracks to increasing amounts of
carbon dioxide. J Clim 6:1859–1870
Trenberth KE, Caron JM (2001) Estimates of meridional atmosphere
and ocean heat transports. J Clim 14:3433–3443
Trenberth KE, Stepaniak DP (2003) Seamless poleward atmospheric
energy transports and implications for the Hadley circulation.
J Clim 16:3705–3721
Trenberth KE, Caron JM, Stepaniak DP (2001) The atmospheric
energy budget and implications for surface fluxes and ocean heat
transports. Clim Dyn 17:259–276
Trenberth KE, Fasullo JT, Kiehl J (2009) Earth’s global energy
budget. Bull Am Meteorol Soc 90:311–323
Vallis GK, (2006) Atmospheric and oceanic fluid dynamics. Cam-
bridge University Press, Cambridge, p 745
Wittman MAH, Charlton AJ, Polvani LM (2007) The effect of lower
stratospheric shear on baroclinic instability. J Atmos Sci 64:479–
496
Yin H (2005) A consistent poleward shift of the storm tracks in
simulations of 21st century climate. Geophys Res Lett 32: L18
701. doi:10.1029/2005GL023684
Y. Wu et al.: Changes in storm tracks and energy transports in a warmer climate
123