The World Distribution of Income (from Log-Normal Country Distributions)
Upload
nguyenminhCategory
view
215download
0
DI
SC
US
SI
ON
P
AP
ER
S
ER
IE
S
Forschungsinstitut zur Zukunft der ArbeitInstitute for the Study of Labor
Changes in Income Distributions and the Role of Tax-Benefit Policy During the Great Recession:An International Perspective
IZA DP No. 7737
November 2013
Olivier BargainTim CallanKarina DoorleyClaire Keane

Changes in Income Distributions and the Role of Tax-Benefit Policy During the Great
Recession: An International Perspective
Olivier Bargain Aix-Marseille University, CNRS, EHESS and IZA
Tim Callan
ESRI, TCD and IZA
Karina Doorley IZA and CEPS/INSTEAD
Claire Keane
ESRI and TCD
Discussion Paper No. 7737 November 2013
IZA
P.O. Box 7240 53072 Bonn
Germany
Phone: +49-228-3894-0 Fax: +49-228-3894-180
E-mail: [email protected]
Any opinions expressed here are those of the author(s) and not those of IZA. Research published in this series may include views on policy, but the institute itself takes no institutional policy positions. The IZA research network is committed to the IZA Guiding Principles of Research Integrity. The Institute for the Study of Labor (IZA) in Bonn is a local and virtual international research center and a place of communication between science, politics and business. IZA is an independent nonprofit organization supported by Deutsche Post Foundation. The center is associated with the University of Bonn and offers a stimulating research environment through its international network, workshops and conferences, data service, project support, research visits and doctoral program. IZA engages in (i) original and internationally competitive research in all fields of labor economics, (ii) development of policy concepts, and (iii) dissemination of research results and concepts to the interested public. IZA Discussion Papers often represent preliminary work and are circulated to encourage discussion. Citation of such a paper should account for its provisional character. A revised version may be available directly from the author.

IZA Discussion Paper No. 7737 November 2013
ABSTRACT
Changes in Income Distributions and the Role of Tax-Benefit Policy During the Great Recession: An International Perspective* This paper examines the impact on inequality and poverty of the economic crisis in four European countries, namely France, Germany, the UK and Ireland, and the contribution of tax and benefit policy changes. The period examined, 2008 to 2010, was one of great economic turmoil, yet it is unclear whether changes in inequality and poverty rates over this time period were mainly driven by changes in market income distributions or by tax-benefit policy reforms. We disentangle these effects by producing counterfactual (“no reform”) scenarios using tax-benefit microsimulation and representative household surveys of each country. For the period under study, we find that the policy reaction has contributed to stabilizing or even decreasing inequality and relative poverty in the UK, France and especially in Ireland, a country where rising unemployment would have otherwise increased poverty. Market income inequality has nonetheless pushed up inequality and relative poverty in France. Relative poverty and, notably, child poverty, have increased in Germany due to policy responses combined with the increasing inequality of market income. JEL Classification: H23, H53, I32 Keywords: tax-benefit policy, inequality, poverty, decomposition, microsimulation, crisis Corresponding author: Tim Callan Economic and Social Research Institute (ESRI) Whitaker Square Sir John Rogerson’s Quay Dublin 2 Ireland E-mail: [email protected]
* We are grateful to the Observatoire National de la Pauvreté et de l’Exclusion Sociale (ONPES) for financial support. We are indebted to the EUROMOD consortium for the use of the model (version G1.0) and to the ESRI for the use of SWITCH. EU-SILC was made available by Eurostat and the FRS by the UK ONS through the Data Archive. Material from the FRS is Crown Copyright and is used by permission. The usual disclaimer applies.

1 Introduction
The current economic slowdown calls for a careful investigation of how to make tax-bene�tsystems more cost e¤ective and how to minimize welfare losses and limit the extension ofdeep poverty at a time of cuts in public spending. For this purpose, lessons from the veryrecent period, and, notably, the role of policy developments occurring during 2008-2010,the �rst "dip" in the Great Recession, must be learned. As yet, little is known aboutthe capacity of existing redistribution systems to soften the negative impacts of job andearnings losses,1 as well as the e¤ectiveness of the policy initiatives that quickly followedthe onset of the economic slump. This is not only due to the fact that microdata comewith an inevitable delay but also because the di¤erent factors a¤ecting the distribution ofdisposable income are intertwined.2 In particular, analysts should attempt to disentanglethe e¤ect of changes in market income inequality (due to wage cuts, job losses or workingtime reduction in the private sector, changes to the minimum wage etc.) and the e¤ectof tax-bene�t reforms. The latter may indeed have cushioned or exacerbated the e¤ectsof the crisis on the income distribution through income tax and social insurance reforms,changes in the generosity of family bene�ts or welfare programs, etc. Comparing Europeanexperiences in this context also seems highly relevant. The e¤ects of each of these factorsmay have been di¤erent across countries depending on how deeply they were a¤ected bythe crisis and on the speci�c nature of the policy responses.
In this paper, we provide some answers to these questions by studying the contributionof tax-bene�t policies to changes in inequality and poverty in Europe between 2008 and2010. We use tax-bene�t microsimulation to construct counterfactual situations thatshow what the post-tax and transfer income distribution would have looked like in 2010 ifeither tax-bene�t policies or the distribution of pre-tax and transfer incomes had remainedunchanged between the two years. In this way, we are able to disentangle the pure e¤ectof tax-bene�t policy changes occurring over the period from changes in the environment
1An exception is the study of Jenkins et al. (2013) on the short-term impact of the Great Recessionin twenty-one OECD countries. The authors �nd that the household sector was largely protected fromthe downturn through the tax and bene�t system. Among the six countries that the authors study indetail, the softest landings were found to be experienced by the countries with the strongest welfarestates, Germany and Sweden. For most of the countries studied, there was little change in the householdincome distribution between 2007 and 2009. They note, however, that in the medium- to longer-term,there is likely to be much greater change as a result of �scal consolidation.
2For instance, an approach that consists of measuring the contribution of taxes and transfers to overallinequality/poverty at di¤erent points in time, e.g. before and after the �rst "dip" of the Great Recession,does not allow us to extract the pure e¤ect of policy changes from their interaction with the underlyingpopulation. That is, this method cannot tell whether social assistance schemes, for example, may appearmore redistributive because of their increased generosity or because of automatic increases in welfarespending as unemployment rises.
1
in which these policies operate, particularly changes in market income inequality whichmay have occurred due to job losses or wage cuts.3 This analysis is carried out for fourEuropean countries which were a¤ected di¤erently by the economic crisis, namely France,Germany, Ireland and the UK. For each country, we isolate and quantify the e¤ect oftax-bene�t policy changes over 2008-2010 on a range of poverty and inequality measures.We use representative microdata for each country (EU-SILC data) from the beginning ofthe economic crisis (2007/2008) and from the latest period available (2009/2010), coupledwith microsimulation models (SWITCH for Ireland and EUROMOD for France, Germanyand the UK), i.e. models that transform gross income into disposable income for eachhousehold, taking into account all taxes, transfers and contributions in each period andcountry. Using these simulations, we can draw conclusions about the e¤ect of the economiccrisis on poverty and inequality across countries as well as the e¤ectiveness of tax-bene�tpolicies in responding to the economic crisis in each country.
We �nd that, while the policy response was actually comparable in the UK and France, ithas contributed to stabilize relative poverty only in the UK. Market income changes havepushed up inequality, child poverty and, especially, overall poverty depth more stronglyin France so that policy responses have only partly corrected this trend, resulting in anincrease in the intensity of poverty and in child poverty. Ireland, in the early part ofthe crisis, provided an even more progressive policy response than the UK and France,due mainly to sharp increases in income-related taxation with more limited reductionsin welfare payments. This policy e¤ect is responsible for an overall reduction in relativepoverty and inequality in this country. The UK, France and Ireland have managed toreduce absolute child poverty (i.e. poverty calculated with the poverty line anchored inreal terms at its initial level). In contrast, policy responses have been fairly regressive inGermany, with tax cuts and very slow uprating of social transfers resulting in an increase inrelative poverty, poverty depth and elderly poverty. Other e¤ects, which include changesin market incomes and non-simulated policies like changes in unemployment insurance inFrance, have had a relatively modest role despite rising unemployment in Ireland (and toa lesser extent in France and the UK) and work sharing in Germany. Among exceptionsare the large contributions of these other e¤ects to the increased poverty rate and depthin France and to child poverty in Germany. Overall, tax-bene�t policy responses have
3This approach is applied in the study of Clark and Leicester (2004) who carefully investigate thedistributional e¤ect of policy changes over the 1980s and 1990s in the UK. It is then embedded in amore formal decomposition framework in Bargain and Callan (2010) for France and Ireland and Bargain(2012) for the UK for the period 1999-2001. A related concept for the comparison of tax regimes withrespect to progressivity, the transplant-and-compare procedure (Dardanoni and Lambert 2002), is appliedby Lambert and Thoresen (2009) for Norway. They isolate the tax policy e¤ect by comparing pre-taxincome distributions which have been adjusted to a common base.
2

played an important role, sometimes explaining most of the time changes in poverty.Further research should make use of more recent years of data and uprated tax-bene�tmicrosimulations in order to identify the impact of policy factors and shifts in marketincome over the prolonged crisis.
2 Macroeconomic and Policy Background
2.1 Welfare Regimes before the Crisis and the MacroeconomicContext
Our study presents an original perspective by comparing trends in income distributionsand policy developments in four European countries which have been impacted di¤er-ently by the crisis. In the year preceding it, all four countries were relatively close interms of GDP per capita.4 France and Germany used to be classi�ed under the conser-vative/corporatist welfare regime (Esping-Andersen 1990) while the UK represented amore liberal model, although some nuance is required. Despite low income tax rates, theUK o¤ered a safety net in the form of income support schemes and a relatively generousfamily tax credit for working poor families. In parallel, France and Germany have expe-rienced a signi�cant cut in tax levels since the early 2000s while introducing or increasingtransfers to the working poor. In Germany, wage moderation and reforms of the socialsystem in the early 2000s may also have had some regressive impact on the distribution ofincome but there is no substantial evidence of this. Ireland was traditionally placed at asomewhat intermediary position, with a social protection system described sometimes as"catholic corporatist" (McLaughlin, 1993), due to the role of the Church and the centralrole of the family, or as competitive corporatist since transfers, taxation and labor marketinstitutions were broadly adapted to competitiveness objectives (Hardiman 2000).
The evolution observed during the �rst dip of the crisis is particularly contrasted, rangingfrom the German employment "miracle" (still accompanied by wage moderation) to astrong negative adjustment in the Irish economy, with the UK and France performingsomewhere in between. Given these di¤erent experiences, we may expect very di¤erenttrends in market incomes between 2008 and 2010 across these countries. We describethe macroeconomic context in detail below. The importance of automatic stabilizers anddiscretionary �scal policy in each country will also, ultimately, determine the extent to
4In 2007, France, Germany and the UK were 8%, 16% and 17% above the EU-27 average GDP percapita respectively while Ireland was 46% above the average (and the richest country after Luxembourg).Repatriation of multinational pro�ts from Ireland, however, means that GNP was about 80% of the levelof GDP, providing a better measure of the national income available to Irish residents �more comparableto that of our three other countries.
3

which the Great Recession a¤ected overall poverty and inequality measures during thistimespan. Policy options in each country are described in the next sub-section.
Germany and France. Germany experienced a strong macro shock in 2008-09 (�4:9%in real GDP) but a return to positive growth of over 4% in 2010 as shown in Figure 1,largely due to strong global demand for German exports (Jenkins et al, 2013). The useof short-time work in particular has prevented an increase in unemployment and, accord-ing to Bargain et al. (2012), has partly (fully) limited the increase in relative (absolute)poverty. Unemployment rates in Germany and France prior to 2008 were generally higherthan those in Ireland and the UK, as shown in Figure 2. German unemployment ratesresumed falling after 2009, reaching their lowest level in recent decades (5:5% in 2012).5
France was less internationally exposed than other countries like Germany due to a tra-ditionally strong reliance on its internal market. The macro shock was therefore slightlysmaller (�3:7% of GDP in 2009) but so was the return to growth in 2010 (+1:1%). Thiswas accompanied by a long-lasting deterioration of labor market conditions (Figure 2),showing an increase in unemployment from a low of 7:8% in 2008 to 9:7% in 2010.
Ireland and the UK. The period 2008 to 2010 saw a recession of unprecedentedseverity in the Irish economy. GDP had grown strongly over the preceding 15 years, withemployment almost doubling and unemployment rates falling sharply (Figure 2). Duringthis �Celtic Tiger�period, unemployment fell to just over 4% in 2000 and remained aroundthis level until 2008. Over the years 2008 to 2010, real national income fell by close to 10%�more than double the size of the fall in the UK, Germany and France. The economicdeterioration was driven by a collapse in the property sector and an accompanying sharpfall in employment in the construction sector, upon which the Irish economy had becomeheavily reliant, a banking crisis and the worldwide �nancial crisis.6 Unemployment morethan doubled between 2008 and 2010, increasing from 6:4% in 2008 to 13:9% in 2010.The UK, fuelled by the global �nancial crisis, also entered its deepest recession since theSecond World War in 2008. Signi�cant falls in real GDP were experienced between 2008
5Burda and Hunt (2011) attribute this �unemployment miracle�to a variety of factors such as employersreticence to hire in the preceding expansion, wage moderation and an increased adoption of �working timeaccounts�. Brenke et al. (2011) also give credit to the expansion of the short-term compensation scheme,which provides �nancial aid for �rms experiencing di¢ culties if they agree to reduce working hours andpay, describing it as the �German answer�to the great recession.
6The banking crisis resulted in the government guaranteeing both investors and bondholders andled to unsustainable yields on Irish bonds as government debt grew. These unsustainable yields led tothe Irish government seeking a �nancial �bailout�from the ECB and IMF in 2010. Firm commitmentsto �scal austerity formed part of the terms of the economic adjustment package, with further negativeconsequences for household disposable incomes (see Doorley et al (2013).
4

and 2010 with a decline of 1:6% in 2008 and 4:6% in 2009, followed by a return to positivegrowth in 2010 of 1%. A weak recovery was followed by the �rst double-dip recession inthe UK since the 1970s as a return to negative growth occurred in 2012. Unemploymentrose from 5:6% in 2008 to 7:8% in 2010.
Figure 1: GDP per capita Growth Rate, 1996-2012
Source:Eurostat8.0
6.0
4.0
2.0
0.0
2.0
4.0
6.0
8.0
10.0
12.0
1996
1997
1998
1999
2000
2001
2002
2003
2004
2005
2006
2007
2008
2009
2010
2011
2012
DE IE FR UK
Figure 2: Unemployment Rates, 2005-2012
Source:Eurostat
0.0
2.0
4.0
6.0
8.0
10.0
12.0
14.0
16.0
2005
2006
2007
2008
2009
2010
2011
2012
DE IE FR UK
5
2.2 Policy Reactions to the Great Recession
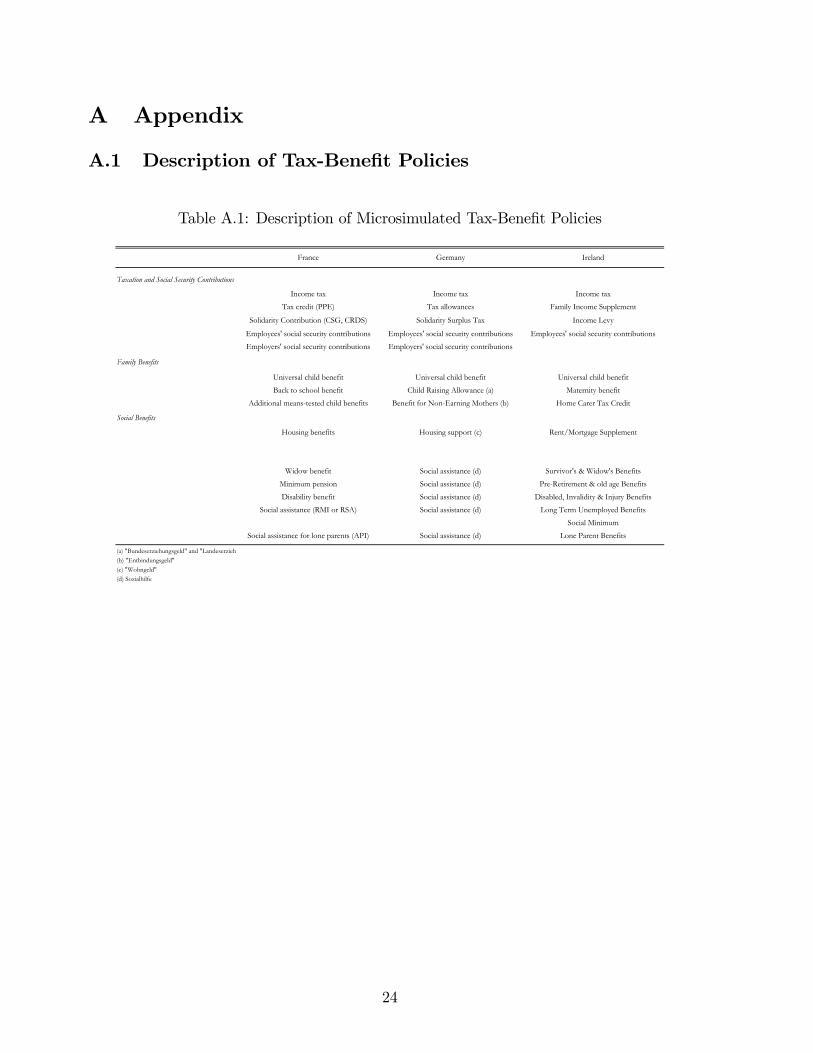
Our decomposition analysis aims at isolating "policy e¤ect" from "other e¤ects". By"policy e¤ect", we mean the e¤ect of changes in tax-bene�t policies related to directtaxation, social security contributions, non-contributory bene�ts (child and family bene�tsas well as social assistance) and, for the UK and Ireland, the contributory bene�ts whichare treated as redistribution (essentially Jobseeker�s allowances and public pensions). Theset of tax-bene�t policies which are actually simulated in our analysis and which constitutethe scope of our "policy e¤ect" is presented in Table A.1 in the Appendix. By "othere¤ects", we mean all the other factors that can a¤ect the distribution of disposable income:these are primarily changes in gross incomes due to market forces but they also accountfor other policies (changes in the minimum wage, changes in unemployment bene�t orpension rules in France and Germany, etc.). We shall de�ne these e¤ects in more detailin the methodological section and quantify them using our decomposition method. Fornow, we describe the main policy changes characterizing the period studied, 2008-2010.7
Tax-bene�t policy changes in all four countries are also summarized in Table A.2 in theAppendix.
France. A number of �scal and social policy reforms were enacted in France during thegreat recession. The most important structural changes to the welfare system concernsthe minimum income. In 2009, the minimum guaranteed income bene�t (RMI) and thelone parent means-tested bene�t (API) were replaced with a single means-tested bene�t(RSA, Revenu de Solidarité Active) which incorporates an in-work bene�t component.That is, the RSA ensures a minimum income per month, with larger amounts for eligiblelone parents, while providing permanent incentives to work due to the taper rate of 38%on earnings, replacing the 100% rate under API and RMI. While the RSA was in operationfor only a few months in 2009, our simulation of the 2010 situation should account forthe full year e¤ect of this reform compared to the 2008 system. The extension of socialassistance to the working poor thanks to the lower withdrawal rate � and despite thelow take-up of the "in-work" RSA (33%) �must contribute to decreasing poverty. Thereis also a progressive e¤ect of welfare payment uprating policies. Over the three yearsstudied, family bene�ts and social assistance payments have been uprated at around 3%,which is slightly faster than mean wage growth (+1:9%) and mean income growth (our� uprating factor, equal to 0:4% for France). However, the earned income tax credit on
7For more information on policy reforms during the period under study, see Doorley (2013) for France,Ochmann and Fossen (2013) for Germany, Doorley et al. (2013) and Callan et al (2012) for Ireland andSutherland (2013) for the UK.
6

low-wage earners (PPE) was frozen in nominal terms.8 On the side of income taxation andsocial contributions, a salient policy measure of the Sarkozy government, the tax rebateon paid overtime, should not impact on our results since it was put in place in August2007 and withdrawn in 2012, outside the period studied. Slightly progressive tax reformshave taken place in 2009 (the withholding tax on capital was increased from 16 to 18%,and the lowest earners were given relief on two-thirds of their tax bill, an "income taxholiday") and 2010 (the marginal income tax rate for the highest earners increased from40% to 41% while the RSA was �nanced with a further 1:1% tax on capital income).9
Germany. The period is characterized by very modest adjustments to social bene�ts.The basic amount of social assistance (ALGII) was uprated by just 1% between 2008-2010 while payments for rent and heating were frozen. More structural changes in familybene�ts are also observed in Germany. While the universal child bene�t (Kindergeld)was higher for each child after the third in 2008, rates increased from the second childonwards in 2009.10 That same year, education bene�ts were reformed. Students withchildren under 10 years of age are now entitled to a more generous top-up of e113 forthe �rst child and e198 for any subsequent children. Means-tested child allowances havealso been reformed.11 Reforms on the tax side also seem of a regressive nature. Taxationof capital income (Kapitaleinkommensteuer) was modi�ed in 2009. Until then, capitalincome was treated like any other income, except for a separate tax free allowance. From2009 onwards, capital income was taxed separately at a �at rate of 25%, except for a tax-free allowance, which was slightly increased (+6% in 2009). That same year, the lowestincome tax rate decreased from 15 to 14%.12
8Also, an exceptional bonus of e150 (Prime Exceptionnelle) for families eligible for the "Back toSchool" means-tested child bene�t and of e200 (Prime de solidarité active) for low income families werepart of a speci�c anti-crisis package which was not renewed in 2010 (and therefore not relevant for ouranalysis).
9Among other policy developments that may be captured in our "other e¤ects", let us emphasizereforms of the unemployment insurance system. While unemployment bene�t duration used to be relatedto the number of months that the individual had worked for in the previous three years, the 2009 reformswitched unemployment insurance to a "one day worked, one day of compensation" system, provided theindividual had worked at least 4 months in the last 28.10In addition, in 2009, there was an add-on to the general bene�t rate, of e100 per child, which was
subsequently abolished in 2010 so that it should not a¤ect our decomposition exercise over 2008-2010.11A child allowance, of a maximum of e140 per month per entitled child, was paid if household income
was deemed not to cover the needs of children younger than 25 who live in the same household. From2009 on, parental leave bene�ts are included in the income test. The income threshold used to de�ne thechildrens�needs is set at a �xed amount of e600 per lone parent and e900 per couple. The fraction ofown income that is withdrawn from the bene�t amount decreases in 2009 from 70% to 50%.12The "other e¤ects" component of our decomposition may re�ect reforms of unemployment insurance
in Germany. The period is notably characterized by the introduction of more �exible arrangements for
7

Ireland. Over the 2008 to 2010 period, austerity measures were focused mainly on taxincreases, with substantial increases in income-related taxes. These led to a stronglyprogressive impact over this period. Recall that the Irish government had become over-reliant on transitory taxes (such as stamp duty on property transactions) and, during theboom, had narrowed the tax base, removing many workers from the tax net entirely. In2009, an Income Levy was introduced, payable on gross income (excluding social welfarepayments). The initial rate was 1% on annual income up toe100; 100 and 2% on income inexcess of that. In a �supplementary�budget of 2009, necessitated by the rapid deteriorationin the public �nances, the income levy rates increased with an exemption for the �rste15; 028 of annual income (with a higher exemption limit, e20; 000, for the over 65�s),a rate of 2% charged on income from e75; 036 to e174; 980 and a rate of 6% charged inexcess of that level. In addition, the cap on the annual income above which no furthersocial insurance contributions (PRSI) were payable rose in 2009 while the Health Levy (apayment made to fund health services) was doubled (reaching 4%, and even 5% for incomesabove e75; 036) in 2010. On the welfare side, the overall reduction in working age bene�tsfor 2008-2010 was just under 1%.13 Rates paid to old age pensioners remained at theincreased level. Universal child bene�t was sharply reduced, falling by 10% between 2008and 2010 with a full o¤setting of the impact on welfare recipients through an increase in amore targeted form of child income support. Non-contributory unemployment payments(Jobseekers Allowance) for those aged 18-21 were reduced to e100 per week (comparedto e196 for older workers). Public servants experienced two reductions in pay via a�Pension Related Deduction� (PRD), introduced in 2009, whereby the �rst e15; 000 ofannual earnings were exempt, with 5% paid on the next e5; 000 of earnings, 10% paidon earnings between e20; 000 and e60; 000 and 10:5% on earnings above e60; 000. Thisa¤ected net pay. A further pay-cut for public sector workers, this time on gross pay, wasimplemented in 2010 with a reduction of 5% on the �rst e30; 000 of salary, 7:5% on thenext e40; 000 and a 10% reduction on the next e55; 000. These changes to public sectorwages are treated here as an extra �tax�on the public sector and, hence, are modelledexplicitly and will fall into our �policy e¤ect�.
UK. Most social welfare payments increased annually in real terms over the years 2008-2010 using the retail price index (RPI) or by the Rossi price index in the case of means-tested bene�ts. Since the Rossi index excludes housing costs and local taxes, welfare
unemployment bene�ts and policy reforms targeted at the older segment of the labour force, correspondingto a shift in the generosity of unemployment bene�t duration from those under 55 to those over 55.13The 2009 budget saw increases of 3%, before the full scale of the public �nance crisis was realised.
Budget 2010 reduced the payment rates of the social welfare schemes applicable to those of working ageby 4%.
8

payments have increased faster than overall prices and even faster than wages (IncomeSupport has increased by 8:2% while the mean wage has increased by 1:7%). Universalchild bene�ts have also increased rapidly (+8%). While the basic element of the ChildTax Credit was not uprated, the child increment was increased by 7:2%. Redistributiontowards the working poor was also accentuated, with an uprating of 6:7% of the workingtax credit. The basic rate limit of income taxation increased in 2009 to £ 37; 400 andremained constant in 2010 while a third rate of income tax was introduced that year(50% on incomes over £ 150; 000). The personal tax allowance was increased by £ 130for the tax years 2009-10 and removed for incomes above £ 100; 000 in April 2010. Withregards to social insurance rates and bands, the upper earnings limit increased in April2009 to align it with the threshold of the top income tax rate. The standard rate reducedfrom 17:5% to 15% in December 2009.
3 Methodology
We use tax-bene�t microsimulators linked to household surveys to simulate disposableincome distributions and, subsequently, inequality and poverty indices for one year atthe onset of the crisis (2008), for a more recent year based on the availability of themicrosimulation models (2010) and for counterfactual scenarios as described hereafter.
3.1 Microsimulation and Data
Simulations are performed using the tax-bene�t calculator EUROMOD for France, Ger-many and the UK and SWITCH for Ireland. Both of these microsimulation modelsnumerically simulate tax-bene�t rules, allowing the computation of all social contribu-tions, direct taxes and transfers to yield household disposable income. Microsimulatorsare linked to the Family Resources Survey (FRS) for years 2008/09 and 2009/10 for theUK (collected over the twelve months between April and March), to the EU-SILC data foryears 2008 (2007 incomes) and 2010 (2009 incomes) for France and Germany (EU-SILCdata is collected over the calendar year), and to EU-SILC data from 2008 (2008 incomes)and 2010 (2010 incomes) for Ireland.14 The income reference period for the German and
14The FRS is a well-known source for statistical studies in the UK, notably used in national microsim-ulation (see Sutherland, 2013). EU-SILC (statistics on income and life conditions) constitute the mostrecent and important source of microdata for comparative studies on income distribution in Europe.Started in 2003 for 6 member states (Belgium, Denmark, Greece, Ireland, Luxemburg and Austria), aswell as Norway, EU-SILC has been extended to other EU countries in 2004-2005, followed by Bulgaria,Rumania, Turkey and Swizerland from 2007. It gathers annual cross-sectional information on Europeanindividuals and households (incomes, socio-demographics, social exclusion, life condition). It was origi-nally created to provide the material for structural indices of social cohesion in Europe (Laeken indices).
9

French EU-SILC data is the previous year so that the 2008 data collects 2007 income andthe 2010 data collects 2009 income. We account for this delay by uprating all incomesources by speci�c factors in EUROMOD in order to be able to use the 2008 and 2010policy parameters with the corresponding data for each year. In the Appendix, we com-pare simulated disposable income distributions with actual distributions (i.e. those fromexternal statistics or directly observed in the data) and discuss the potential discrepanciescaused by delayed incomes for these two countries. Finally, notice that EU-SILC dataused in SWITCH for Ireland and FRS data used in EUROMOD for the UK make useof current income, i.e. household income in its labor market status at the date of datacollection, rather than annual income. Annual income is used for the two others countriesbut also in external statistics. In the Appendix, we extensively discuss how this othersource of di¤erences between observed and simulated distributions may be related to suchdi¤erences in terms of income de�nition.
3.2 Aggregate Changes in Incomes, Taxes and Bene�ts
Table 1 shows mean household gross income, taxes, transfers, social security contributions(SSC) and disposable income for the four countries investigated. These statistics givesome preliminary insight into potential tax-bene�t policy e¤ects on household disposableincome. Gross income decreases in all countries between 2008 and 2010, except for theUK which saw modest income rises. In France and Germany, however, disposable incomeincreases while in Ireland, it decreases less rapidly than gross income. In the UK, thereis a more rapid increase of disposable than of gross income. The main reason for thesephenomena is the stabilizing e¤ect of tax-bene�t systems over the 2008-2010 period, i.e.a decrease in market income for some households is partly compensated by an automaticdecrease (increase) in taxes paid (bene�ts received). On top of this stabilization providedby the initial policy set, there may be also the speci�c e¤ect of policy changes overthe period, the role of which is investigated in the rest of this paper. We can alreadycomment on this using trends in tax and bene�t aggregates in Table 1. Yet we must keepin mind that these trends combine the stabilization e¤ect (how taxes paid and bene�tsreceived vary due to changes in market incomes) and the e¤ect of policy reforms during theperiod. Tax changes in Germany and France seem regressive. In particular, in Germany,the tax bill falls substantially between the two periods (�11%), likely due to the changein taxation of capital income previously described. Conversely, tax payments increasein Ireland, following the exceptional measures described above and, in particular, theintroduction of a Tax Levy on all gross incomes. Social security contributions increase alot but mean changes hide the progressive structure of the Health Levy. The tax increasein the UK is small and in line with the gross income increase. In France (and the UK),
10

the transfer system contributes most to the increase in disposable income with householdsreceiving an average of 9% (11%) more in transfers in 2010 compared to 2008, probablyin�uenced by the uprating of social transfers and tax credits and the introduction of anin-work transfer, the RSA, in France as described above. A similar and even strongerredistributive e¤ect can be observed for Ireland, with a 24% increase in transfers between2008 and 2010 more than compensating for the sharp rise in employee contributionsand cushioning much of the dramatic decrease in mean gross income. Policy changeson the bene�t side are more modest in Germany, with transfer payments increasing byonly 1% over the period. Again, these trends combine the interaction of existing policieswith changes in market income, together with genuine tax-bene�t policy reforms over theperiod. The decomposition approach suggested hereafter allows us to disentangle thesetwo factors.
Table 1: Mean Household Income, Taxes and Transfers
2008 2010 % Δ 2008 2010 % Δ 2008 2010 % Δ 2008 2010 % Δ
Gross income 2,905 2,865 1.4% 2,693 2,684 0.4% 3,383 3,008 11.1% 2,156 2,177 1.0%Taxes 523 493 6% 589 525 11% 466 499 7% 461 472 2%Transfers 1,113 1,217 9% 986 993 1% 1,017 1,263 24% 527 587 11%Employees' contrib. 296 251 15% 396 409 3% 93 149 59% 152 155 2%Selfemployed contr. 50 48 4% 37 32 13% 21 29 38% 11 10 2%Disposable income 3,149 3,289 4.4% 2,585 2,638 2.1% 3,817 3,631 4.9% 2,059 2,126 3.3%No. of households 10,418 11,042 13,312 13,079 5,247 4,642 25,088 25,200Monetary values for Ireland, France and Germany are in current Euros. Monetary values for the UK are in current pounds sterling. German and French results from 2008 and 2010 Euromod systems used with2008 and 2010 EUSILC data. UK results from Euromod 2008 and 2010 systems using 2008/9 and 2009/10 FRS data. Irish results from SWITCH 2008 and 2010 using 2008 and 2010 EUSILC data
IrelandGermany UKFrance
3.3 De�nitions and the Decomposition Method
First, it is important to de�ne our terminology and the scope of the policy changesthat we intend to characterize in what follows. Our analysis focuses on changes in thedistribution of household disposable income (after equivalization to account for householdsize and composition, using the modi�ed OECD equivalent scale). �Disposable income�,as widely used to measure poverty and inequality, is de�ned as all household incomes netof taxes and social contributions and after receipt of all types of bene�ts. By household�gross income�or �market income�, we mean the total amount of labor income (includingreplacement incomes, i.e., public pensions and unemployment bene�ts, in France andGermany), capital income and private pensions before taxes and bene�ts. The onlydi¤erence of treatment between countries concerns the nature of replacement incomes(public pensions and unemployment bene�ts). They are considered as transfers in the
11

UK and Ireland because public pensions and unemployment insurance can be viewed aspart of the redistributive system (maximum bene�t levels are not tied to the amount ofpast contributions). For France and Germany, pensions and unemployment bene�ts areinsurance mechanisms, with payments closely related to contributions levels (even if thelatter are capped above a certain income level), so that we treat them as replacementincome among other sources of gross income.
Our decomposition analysis will isolate a "policy e¤ect" from "other e¤ects", as sketchedabove. The "policy e¤ect" denotes the contribution of changes in tax-bene�t policiesrelated to direct taxation (including tax allowances and tax credits), social security con-tributions, non-contributory bene�ts (child and family bene�ts as well as social assistance)and, for the UK and Ireland, the contributory bene�ts treated as redistribution (essen-tially Jobseeker�s allowances and public pensions).15 "Other e¤ects" correspond to allother factors in�uencing the disposable income distribution, i.e. changes in gross incomesdue to market forces but also non-simulated policies (changes in minimum wage, changesin unemployment bene�t in France and Germany etc.).16
We de�ne four main simulated distributions of disposable income in our analysis. The�rst two are simply the base and end period disposable income distributions, which wedenote (0) and (4) respectively, obtained by applying the tax-bene�t rules of base andend period to the corresponding household gross incomes. These income distributions aresimulated so Gini indices or poverty rates calculated on the basis of these distributionsmay not coincide precisely with o¢ cial data or with Gini and poverty rates calculatedfrom observed disposable incomes at base and end periods. In Appendix 3, we explainin detail how and why simulated inequality and poverty measures di¤er in levels fromobserved ones at any point in time. We show nonetheless that they are relatively close interms of time variation, which is the key aspect for the validity of our analysis (see FigureA.1 in the Appendix).The value added of our approach comes precisely from the ability to simulate actual aswell as possible income distributions and, essentially, counterfactual distributions. Wede�ne scenario (2) as the end year distribution under the assumption that tax-bene�tpolicies have not changed between the two years. Symmetrically, we characterize scenario(3) as the end year distribution assuming no change in all other factors, including thedistribution of market incomes (i.e. assuming that the only change over the period is
15Simulated policies, de�ning the scope of our policy e¤ect, are listed in Table A.1 in the Appendixwhile the actual changes in these policies over the period were described in section 2 and summarized inTable A.2 in the Appendix.16For Ireland, changes to public sector wages are also counted in our �policy e¤ect�, as discussed above.
Failure to model the pension related deduction a¤ecting public sector pay would mean that the e¤ect ofthis would not be picked up in the �other e¤ect�as it a¤ected net and not gross pay.
12
due to tax-bene�t policy reforms). We introduce some notation to describe the construc-tion of these counterfactuals. Denote y a matrix describing the population contained inthe data, i.e., each row contains all the information about a given household, includingvarious gross/market income sources and socio-demographic characteristics. Denote dthe �tax-bene�t function�transforming, for each household, gross incomes and householdcharacteristics into a certain level of disposable income. Tax-bene�t calculations alsodepend on a set of monetary parameters p (e.g., maximum bene�t amounts, thresholdlevel of tax brackets, etc.). Thus, the distribution of disposable income is representedhereafter by di(pj; yl), for a hypothetical scenario including the population of year l, thetax-bene�t parameters of year j and the tax-bene�t structure of year i. We are inter-ested in relative inequality/poverty indices I, computed as a function I
�di(p
j; yl)�of the
(simulated) distribution of disposable income. Denoting base and end years by 0 and 1respectively, we �rst simulate the base and end year situations (0) and (4) as describedabove, corresponding to d0(p0; y0) and d1(p1; y1) respectively.
To construct our key counterfactual scenarios (2) and (3), we must consider the possibilityof nominally adjusting income levels by the uprating factor �1, i.e., the income growthrate between year 0 and year 1. That is, �1y0 retains the structural characteristics ofyear 0 data (in particular, the distribution of gross income) but adopts the nominallevels prevailing in year 1. Policy changes can combine changes in policy structure dand changes in parameters p (the �policy uprating�). We de�ne counterfactuals wheretax-bene�t monetary parameters can be uprated using the same factor �1 that is used toscale up the distribution of gross income between period 0 and 1. Clearly, the nominallyadjusted system, denoted �1p0, is not identical to the actual set of parameters p1 asdecided by the authorities.17 Thus, scenario (2) is written d0(�1p0; y1), i.e. it is the no-reform counterfactual where the only policy change between years 0 and 1 is an upratingof money parameters in line with income growth, as explained above. It can be used in a�rst decomposition:
� =�I�d1(p
1; y1)�� I
�d0(�
1p0; y1)�
(policy e¤ect) (I)
+�I�d0(�
1p0; y1)�� I
�d0(�
1p0; �1y0)�
(other e¤ects)
+�I�d0(�
1p0; �1y0))�� I
�d0(p
0; y0)�
(income growth).
where the policy e¤ect is evaluated while holding the population constant at end year.Scenario (3) is written d1(p1; �1y0) and corresponds to the counterfactual where the marketincome distribution is hold constant (market incomes and policy parameters are just
17Bargain and Callan (2010) show that gross income in�ation is a distributionally neutral factor thatseems most appropriate for this decomposition exercise. The choice of the uprating factor is also discussedin length in Bargain (2012).
13

uprated using the same �1 factor). It is used in a second decomposition:
� =�I�d1(p
1; y1)�� I
�d1(p
1; �1y0)�
(other e¤ects) (II)
+�I�d1(p
1; �1y0)�� I
�d0(�
1p0; �1y0)�
(policy e¤ect)
+�I�d0(�
1p0; �1y0))�� I
�d0(p
0; y0)�
(income growth).
where the policy e¤ect is evaluated while holding the population constant at the baseyear.In both decompositions, the last term is identical. It depends on another counterfactualscenario d0(�1p0; �1y0), denoted situation (1) hereafter. Notice that tax-bene�t functionsd(p; y) are usually linearly homogeneous in p and y, i.e. a simultaneous change in nominallevels (e.g. switching from French Franc to Euro) of both gross incomes and monetary tax-bene�t parameters should not a¤ect the relative position of households in the distributionof disposable income. The direct consequence of this is that scenario (0), i.e. d0(p0; y0),should be equal to scenario (1). That is, the �income growth� component, the thirdterm in both decompositions, should be zero. While this should be the case in France,Ireland and the UK, part of the German system may not ful�ll this condition. Germany ischaracterized by a concave income tax function, in contrast to the piecewise linear incometax schedule of other countries and, therefore, a non-homogenous tax-bene�t function. Weshall check this empirically in the next section.Finally, since there is no compelling reason for preferring the �rst decomposition over thesecond, we also compute the Shorrocks-Shapley decomposition by averaging the contri-butions for the two decompositions above, which gives the average policy e¤ect, P , andthe average other e¤ect, O:
P = 1=2 � [I[d1(p1; y1)]� I[d0(�1p0; y1)]] + 1=2 � [I[d1(p1; �1y0)]� I[d0(p0; y0)]]O = 1=2 � [I[d0(�1p0; y1)]� I[d0(p0; y0)]] + 1=2 � [I[d1(p1; y1)]� I[d1(p1; �1y0)]]:
4 Results
The main results are shown in Figures 3 to 5 and we discuss each country separatelybelow. In each graph, we summarize the main trends, with bars representing base yearindices normalized to 100, end year indices and index levels under the counterfactual "pol-icy e¤ect" (if only policies had changed, i.e. market income uprated in a distributionallyneutral way) and the counterfactual "other e¤ects" (if policies were unchanged, i.e. onlyuprated in a distributionally neutral way). Tables A.4 to A.6 in Appendix A present thecomplete decomposition results for Germany, France, Ireland and the UK respectively. Inthese tables, we report poverty and inequality statistics relating to the base period 0 (cor-responding to year 2008) in column (0) of each table and the end period 1 (corresponding
14

to year 2010) in column (4). Three counterfactuals are also presented, as discussed above.Column (1) shows the base period indices where both the data and the policies are up-rated to the end period. The di¤erence between column (0) and column (1) is a checkof the linear homogeneity property discussed above. We observe that for all inequalityand poverty indices, this component is zero so that homogeneity holds and the third com-ponent of both decompositions can be ignored.18 Thus we can concentrate on the maincomponents of the decomposition method. Column (2) shows the poverty/inequality in-dices for end year data with (uprated) base year policies while column (3) shows indicesfor (uprated) base year data with end year policies. The di¤erence between columns (4)and (0) depicts the total change in each index between 2008 and 2010. This is decomposedinto the (negligible) income growth e¤ect, the tax-bene�t policy e¤ect and the "other"e¤ect which encompasses market income changes and all other potential in�uences. Wereport three decompositions, the end-period weighted decomposition I, the base-periodweighted decomposition II and the Shorrocks-Shapley decomposition, i.e the average ofthese two. We observe that all three decompositions lead to similar conclusions, whichreassures us that results are not sensitive to the decomposition path chosen. Therefore,and for conciseness, we shall base our comments on the Shapley decomposition results.The battery of indices we study includes the Gini, the Atkinson index and percentileratios for inequality. For the risk of poverty (which we simply denote poverty hereafterfor the sake of brevity), we report the headcount ratio (FGT0), the intensity of poverty(FGT1) and the depth of poverty when applying the principle of transfers among thepoor (FGT2). (Risk of) poverty is relative, i.e. measured as the proportion of householdsbelow a poverty line set at 60% or 50% of the median of equivalized income. We reportoverall poverty and poverty for sub-population. Child poverty is measured as the povertyrate of households with children under 18, according to the Eurostat de�nition and elderlypoverty is de�ned as poverty of households headed by adults over 60 years of age. We alsocalculate changes in a more absolute measure of poverty by simply anchoring the povertylines to their initial (base year) levels.19
18We have calculated bootstrapped standard errors and �nd that this di¤erence is not statisticallydi¤erent from zero for all countries (even for Germany where non-homogeneity could be expected due toincome taxation, as previously explained).19The anchored poverty measure consists of �xing the the poverty line at 60% of the median income of
the base year distribution and adjusting it nominally for the end year and the di¤erent counterfactuals.Adjustments are made using �1 to preserve the homogeneity of the absolute poverty measure, whichwould not be the case if we used CPI (EUROSTAT de�nition). In the latter case, the di¤erence between(1) and (0) would simply re�ects the people who switch from poor to nonpoor due to a poverty lineadjusted by in�ation rather than gross income growth (and not a check of the homogeneity property).In this case, nonetheless, results are similar at least in two ways: the sign of the total change (4)-(1) isunchanged and the relative contributions of the policy e¤ect versus other e¤ects are also very similar to
15
4.1 France
We �rst see that inequality has increased between 2008 and 2010 in France, with theGini index rising by 7:1% (from 26:5 to 28:4) and the Atkinson index increasing by 15:9%(from 6:1 to 7). These increases are almost entirely due to changes in market income.A small policy e¤ect working in the opposite direction is obtained with decompositionII but not with decomposition I. For the poorest, relative positions deteriorate since therelative poverty headcount has increased by 13:4%, from 10:3% to 11:7%. This is theresult of a strong shock to their market income ("other e¤ects") with just a very smallcompensation by policy e¤ects. The most spectacular result is the rise in the intensityof poverty, captured by the FGT1. It follows the same pattern as headcount poverty,i.e. the increase of 24:1% is almost entirely due to market income e¤ects, re�ecting howincreasing unemployment has a¤ected the lower part of the income distribution. Turningto "absolute" poverty changes, i.e. when �xing the poverty line at a constant level inreal (income in�ation adjusted) terms, we con�rm that the standard of living of the poorhas increased thanks mainly to the policy e¤ect. We can conjecture that the positivepolicy e¤ect is largely due to the RSA reform and its in-work component that providedan income top-up to the working poor. Absolute poverty has decreased by 9:9% whileit would have decreased by just 3% without actual policy changes. Child poverty isobserved to increase by 4:8% over the time period studied. This increase is driven bymarket income changes although policy e¤ects do compensate for these to some extent.The increase in child poverty would have been 10:5% in the absence of policy changes(notably, the introduction of the RSA). Absolute child poverty is reduced by 19:4% since,in this case, both policy and other e¤ects cumulate so that the living conditions of familywith children improve. Relative elderly poverty is stable over the period.
4.2 Germany
In terms of inequality, there have been some small changes between 2008 and 2010 inGermany. The Gini index decreased by 1:7%, from 27:5 to 27:1, over this period (theAtkinson index also decreased from 6:7 to 6:6). This is entirely due to the market incomee¤ect. The percentile ratios in Table A.4 show, however, a slight increase in inequalityat the bottom of the distribution driven by policy changes, i.e. the ratio of the 50thpercentile of income to the 10th percentile. A decline in the relative position of those atthe bottom of the distribution is con�rmed by the poverty measures. Headcount ratiopoverty, with a relative poverty line set at 60% of the median, increased by 6:6% between2008 and 2010, from 16:1% to 17:2% of the German population. This is mainly due to
our base results (complete tables using CPI instead of �1 are available from the authors).
16

Figure 3: Decomposing Inequality/Poverty Change (France, 2008-2010)
40
50
60
70
80
90
100
110
120
130
Gini headcount all (FGT0) poverty depth (FGT1) Child poverty (FGT0) Poverty age>60 (FGT0) headcount all (FGT0),fixed line
Child poverty (FGT0),fixed line
Policy Effect
Other Effects
Total Change
Measures based on the simulated distribution of disposable income using Euromod with 2008 and 2010 EUSILC data (incomes from 2007 and 2009); these indices are expressedrelatively to initial period values, normalized to 100.
policy changes, with a very small increase also attributable to market income. Like inFrance, one of the most pronounced changes is the increase in poverty depth (FGT1 andFGT2) over the period, attributable to market income changes for half and to tax-bene�treforms for the other half. These trends re�ect changes in the relative position of thelowest income groups but not changes in their absolute standard of living. When �xingthe poverty line in real terms, we observe a decrease in the headcount ratio due to thepolicy e¤ect. Turning to child poverty, we also observe a decrease in their relative positionwhile, this time, all of it is explained by market income changes. There is a compensatinge¤ect of policy, indicating that the increase in child poverty would be twice as high in theabsence of the policy e¤ect which is likely to be attributable to increases in child bene�tsand education allowances. When anchoring the poverty line, we see that these policies infavor of families with children had a large compensatory e¤ect and managed to increasethe absolute standard of living of these families, despite the negative shock to marketincome. By contrast, the increase of 4:3% in the headcount ratio for those aged over 60is entirely due to tax-bene�t policy changes. These are likely to include the change incapital income taxation which should disproportionately a¤ect the retired.20
20The "other e¤ects" includes unemployment insurance reforms which can explain some of the increasein absolute standard of living of this group.
17

Figure 4: Decomposing Inequality/Poverty Change (Germany, 2008-2010)
40
50
60
70
80
90
100
110
120
130
Gini headcount all (FGT0) poverty depth (FGT1) Child poverty (FGT0) Poverty age>60 (FGT0) headcount all (FGT0),fixed line
Child poverty (FGT0),fixed line
Policy Effect
Other Effects
Total Change
Measures based on the simulated distribution of disposable income using Euromod with 2008 and 2010 EUSILC data (incomes from 2007 and 2009); these indices are expressedrelatively to initial period values, normalized to 100.
4.3 Ireland
Changes in market income have led to an increase in both inequality and poverty in Ire-land. Yet the impact on poverty is relatively modest compared to France and, especially,compared to what could have been expected in a context of massive job losses. This isexplained in part by the fact that earnings in the worst hit sector (housing and construc-tion) were relatively high before the crisis. Interestingly, results for the policy e¤ects areparticularly clear cut with respect to the intuitions sketched in the policy descriptions ofsection 2.2. Indeed, policy changes have partly tempered the market e¤ect in the caseof inequality and more than compensated for it in the case of relative poverty. Moreprecisely, the Gini index has slightly increased between 2008 and 2010, from 29:1 to 29:2(+0:5%) as has the Atkinson index (+2:7%). These indices would have risen by 10:2%and 20:3% respectively, had actual tax-bene�t policy reforms not taken place, i.e. policychanges have neutralized around 95% of the inequality increase due to the e¤ect of thecrisis on the income distribution (see also O�Donoghue et al., 2013). In line with the smallchange in the Gini, there was little change in the percentile ratios. Regarding poverty, oursimulation results show a small, consistent decrease in all poverty measures. The key pointfrom the simulation results is that the decline in relative poverty is the result of a strongpolicy e¤ect counteracting market forces. In particular, the headcount ratio decreased by12:2% while it would have increased by 11:3% in the absence of actual policy changes. Thestrongest upward pressure on poverty from changes in market incomes a¤ects the over
18

sixties (42:1% increase in the absence of policy).21 The total e¤ect, �18:1%, nonethelessre�ects the impact of policy choices bene�ting the elderly.22 The poverty reducing e¤ectfor families with children is likely to be due to broadly stable welfare payments and theincreased targeting of family transfers, as described above, i.e. the compensation of cutsto the universal Child Bene�t by increased payments to welfare recipients.
Figure 5: Decomposing Inequality/Poverty Change (Ireland, 2008-2010)
30
40
50
60
70
80
90
100
110
120
130
140
150
Gini headcount all (FGT0) poverty depth (FGT1) Child poverty (FGT0) Poverty age>60 (FGT0) headcount all (FGT0),fixed line
Child poverty (FGT0),fixed line
Policy Effect
Other Effects
Total Change
Measures based on the simulated distribution of disposable income using SWITCH with 2008 and 2010 EUSILC data; these indices are expressed relatively to initial periodvalues, normalized to 100.
4.4 UK
The Gini measure fell from 32:8 to 31:5 in the UK during the period under analysis(�4:2%) and the Atkinson index also registered a decrease (�17:8%). The decline ininequality seems to occur mainly in the �rst half of the distribution, with a decreaseof the p50/p10 percentile ratio. These changes are driven mainly by tax-bene�t policyreforms of the period. Results are in the same line regarding poverty. Relative povertyhas slightly decreased (the headcount ratio decreases by 1:9%), driven by tax-bene�tpolicy changes such as the uprating policies for bene�ts and the working tax credit or the
21Between 2008 and 2010, a slightly higher proportion of the over sixties de�ne themselves as beingretired or unemployed, while a lower proportion report themsleves as being employed or self employed,thus impacting upon the proportion of the over sixties in receipt of employee or self employed income.22Bene�t recipients over 65 were the only group to receive an increase in social welfare payment rates
in 2009 and not see them decline in later budgets. Moreover, the Income Levy introduced in 2009 alsohad a higher exemption limit for the over 65�s.
19
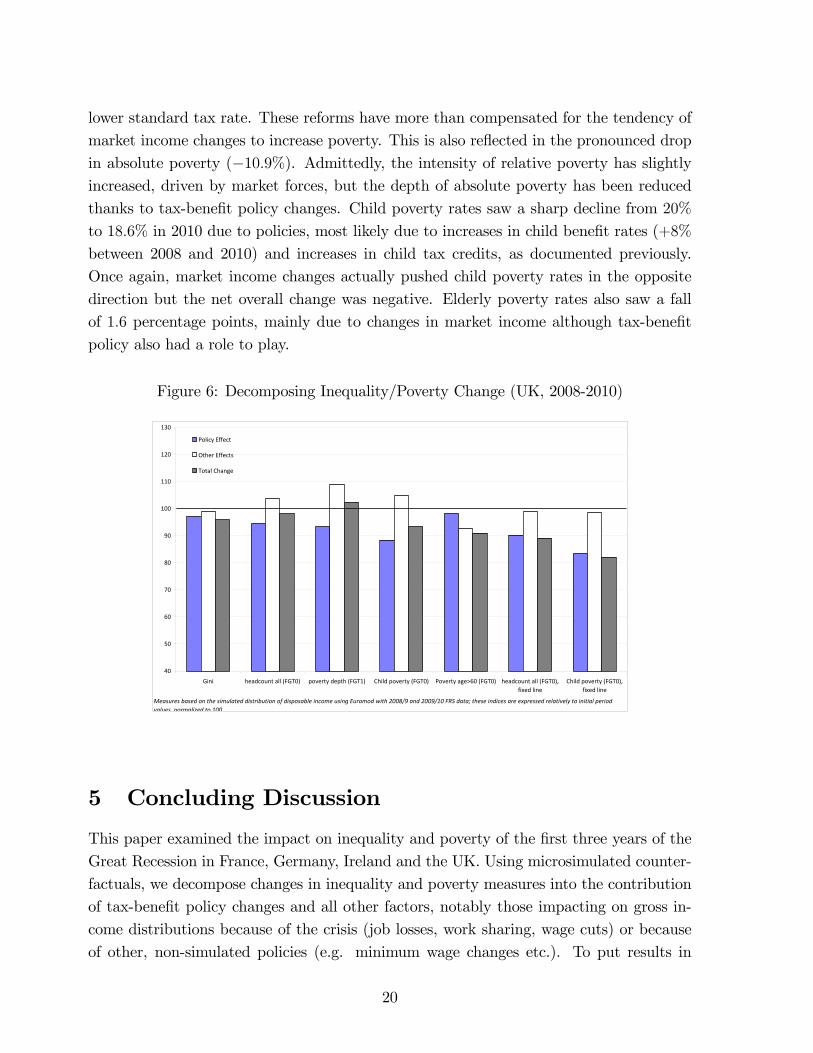
lower standard tax rate. These reforms have more than compensated for the tendency ofmarket income changes to increase poverty. This is also re�ected in the pronounced dropin absolute poverty (�10:9%). Admittedly, the intensity of relative poverty has slightlyincreased, driven by market forces, but the depth of absolute poverty has been reducedthanks to tax-bene�t policy changes. Child poverty rates saw a sharp decline from 20%
to 18:6% in 2010 due to policies, most likely due to increases in child bene�t rates (+8%between 2008 and 2010) and increases in child tax credits, as documented previously.Once again, market income changes actually pushed child poverty rates in the oppositedirection but the net overall change was negative. Elderly poverty rates also saw a fallof 1:6 percentage points, mainly due to changes in market income although tax-bene�tpolicy also had a role to play.
Figure 6: Decomposing Inequality/Poverty Change (UK, 2008-2010)
40
50
60
70
80
90
100
110
120
130
Gini headcount all (FGT0) poverty depth (FGT1) Child poverty (FGT0) Poverty age>60 (FGT0) headcount all (FGT0),fixed line
Child poverty (FGT0),fixed line
Policy Effect
Other Effects
Total Change
Measures based on the simulated distribution of disposable income using Euromod with 2008/9 and 2009/10 FRS data; these indices are expressed relatively to initial periodvalues, normalized to 100.
5 Concluding Discussion
This paper examined the impact on inequality and poverty of the �rst three years of theGreat Recession in France, Germany, Ireland and the UK. Using microsimulated counter-factuals, we decompose changes in inequality and poverty measures into the contributionof tax-bene�t policy changes and all other factors, notably those impacting on gross in-come distributions because of the crisis (job losses, work sharing, wage cuts) or becauseof other, non-simulated policies (e.g. minimum wage changes etc.). To put results in
20

Figure 7: Decomposing Inequality/Poverty Change: International Comparison
Other Effects
40
60
80
100
120
140
Gini headcount all(FGT0)
poverty depth(FGT1)
Child poverty(FGT0)
Poverty age>60(FGT0)
headcount all(FGT0), fixed
line
Child poverty(FGT0), fixed
line
FranceGermanyIrelandUK
Policy Effect
40
60
80
100
120
140
Gini headcount all(FGT0)
poverty depth(FGT1)
Child poverty(FGT0)
Poverty age>60(FGT0)
headcount all(FGT0), fixed
line
Child poverty(FGT0), fixed
line
Total Effect
40
60
80
100
120
140
Gini headcount all(FGT0)
poverty depth(FGT1)
Child poverty(FGT0)
Poverty age>60(FGT0)
headcount all(FGT0), fixed
line
Child poverty(FGT0), fixed
line
21

perspective, Figure 7 compares policy and other e¤ects for all countries, unveiling verycontrasted trends. Maybe counter to intuition, the country most a¤ected by the economicturmoil, Ireland, implemented a strong and very progressive set of policy responses overthis period. To a large extent, this policy response served to o¤set the rise in inequalityand relative poverty which would have arisen from changes in unemployment and marketincome. While policy e¤ects are comparable in France and the UK, they did not pre-vent a rise in the relative poverty count and intensity due to market forces in France,while they managed to stabilize or even reduce them in the UK. Another unexpectedresult is the relatively regressive policy response in Germany. While the period underinvestigation is too short to draw conclusions regarding a change in the German socialmodel, the years 2008-2010 have, nonetheless, witnessed a combination of regressive taxpolicy and slow uprating of social bene�ts for the poorest and these are responsible forincreased poverty in this country. Overall, a general conclusion from our analysis is thattax-bene�t policy e¤ects have had a very important role, sometimes larger than the shockon market incomes due to the crisis. For instance, policy e¤ects explain almost all of therelative poverty increase in Germany and of the decline in relative poverty in Ireland andthe UK. As stressed in the introduction, our analysis unfortunately stops in 2010 due tothe unavailability of combined microsimulation and data for more recent years in such acomparative framework as the one we use. It is, nonetheless, important to characterizethe policy responses that have followed the onset of the economic slump while our studyhas performed this for the �rst dip in the recent recession.
References
[1] Bargain, O., 2012. "The distributional e¤ects of tax-bene�t policies under New labor:A Shapley decomposition", Oxford Bulletin of Economics and Statistics, 74(6),856-874
[2] Bargain, O. & Callan, T., 2010. "Analysing the e¤ects of tax-bene�t reforms onincome distribution: a decomposition approach," Journal of Economic Inequality,Springer, 8(1), 1-21.
[3] Bargain, O., H. Immervoll, A. Peichl, S. Siegloch, 2012: "Distributional consequencesof labor-demand shocks: the 2008�2009 recession in Germany", International Taxand Public Finance, 19 (1), 118-138
[4] Brenke, K., Rinne, U. & Zimmermann, K., 2011. "Short-Time Work: The GermanAnswer to the Great Recession," IZA Discussion Papers 5780, Institute for theStudy of Labor (IZA).
22
[5] Bruckmeier, K. &Wiemers, J. , 2011 : A new targeting: a new take-up? Non-take-upof social assistance in Germany after social policy reforms. Empirical Economics,43(2), 565-580.
[6] Burda, M. & Hunt, J., 2011. "What Explains the German Labor Market Miracle inthe Great Recession," Brookings Papers on Economic Activity, Economic StudiesProgram, The Brookings Institution, 42(1), 273-335.
[7] Callan, T. & Keane, C. & Savage, M. & Walsh, J., 2012. "Distributional Impact ofTax, Welfare and Public Sector Pay Policies: 2009-2012," Quarterly EconomicCommentary: Special Articles, ESRI, vol. 2012(4-Winter ).
[8] Clark, T. & Leicester, A., 2004. "Inequality and two decades of British tax andbene�t reform", Fiscal Studies, 25 (2): 129-158.
[9] Dardanoni, V. & Lambert, P., 2002. "Progressivity comparisons", Journal of PublicEconomics, 86, 99-122.
[10] Doorley, K., 2013. "EUROMOD Country Report France, 2009-2012"
[11] Doorley, K., Eichhorst, W. & Kendzia, M., 2013."Report No. 52: The Social andEmployment Situation in Ireland (Update February 2013),"IZA Research Reports52, Institute for the Study of Labor (IZA).
[12] Esping-Andersen, G.1990. The three worlds of welfare capitalism. Cambridge: PolityPress
[13] Jenkins, S., Brandolini, A., Micklewright, J. & Nolan, B. (eds), 2013 "The GreatRecession and the Distribution of Household Income", UK: Oxford UniversityPress.
[14] Keane, C., Kelly, E., Timoney, K. & Callan, T., 2013. "EUROMOD Country Report:Ireland, 2009-2012"
[15] Lambert, P. & Thoresen, T., 2009. "Base independence in the analysis of tax policye¤ects: with an application to Norway 1992-2004", International Tax and PublicFinance, 16, 219-252.
[16] McLaughlin, E., 1993. "Ireland: Catholic Corporatism" in, A. Cochrane and J. Clarke(eds) Comparing welfare states: Britain in international context. London: Sage
[17] Ochmann, R. & Fossen, F., 2012. "EUROMOD Country Report Germany, 2009-2012"
[18] O�Donoghue, C., J. Loughrey & K. Morrissey, 2013. "Using the EU-SILC to Modelthe Impact of the Economic Crisis on Inequality", IZA Discussion Paper No. 7242
[19] Sutherland, H., 2013. "EUROMOD Country Report UK, 2009-2012"
23
A Appendix
A.1 Description of Tax-Bene�t Policies
Table A.1: Description of Microsimulated Tax-Bene�t Policies
France Germany Ireland
Taxation and Social Security Contributions
Income tax Income tax Income taxTax credit (PPE) Tax allowances Family Income Supplement
Solidarity Contribution (CSG, CRDS) Solidarity Surplus Tax Income Levy
Employees' social security contributions Employees' social security contributions Employees' social security contributionsEmployers' social security contributions Employers' social security contributions
Family Benefits
Universal child benefit Universal child benefit Universal child benefitBack to school benefit Child Raising Allowance (a) Maternity benefit
Additional meanstested child benefits Benefit for NonEarning Mothers (b) Home Carer Tax Credit
Social Benefits
Housing benefits Housing support (c) Rent/Mortgage Supplement
Widow benefit Social assistance (d) Survivor's & Widow's BenefitsMinimum pension Social assistance (d) PreRetirement & old age Benefits
Disability benefit Social assistance (d) Disabled, Invalidity & Injury BenefitsSocial assistance (RMI or RSA) Social assistance (d) Long Term Unemployed Benefits
Social MinimumSocial assistance for lone parents (API) Social assistance (d) Lone Parent Benefits
(a) "Bundeserziehungsgeld" and "Landeserziehungsgeld"(b) "Entbindungsgeld"(c) "Wohngeld"(d) Sozialhilfe
24
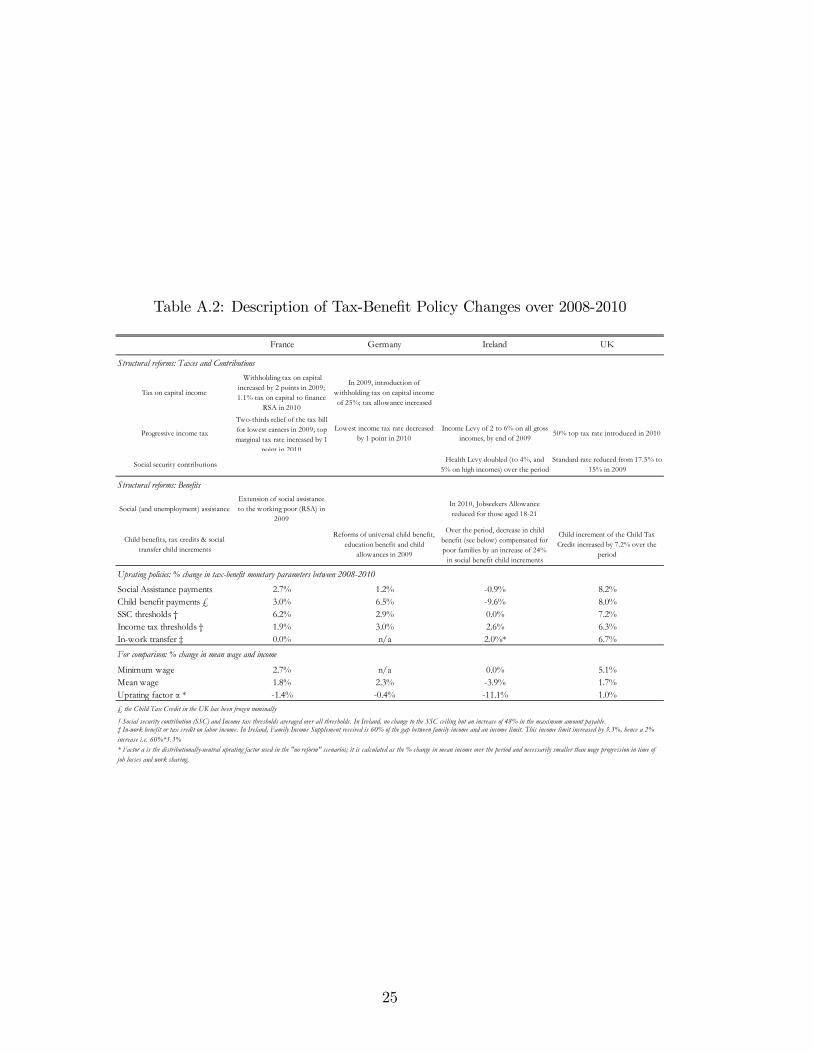
Table A.2: Description of Tax-Bene�t Policy Changes over 2008-2010
France Germany Ireland UK
Structural reforms: Taxes and Contributions
Tax on capital income
Withholding tax on capitalincreased by 2 points in 2009;1.1% tax on capital to finance
RSA in 2010
In 2009, introduction ofwithholding tax on capital incomeof 25%; tax allowance increased
Progressive income tax
Twothirds relief of the tax billfor lowest earners in 2009; topmarginal tax rate increased by 1
point in 2010
Lowest income tax rate decreasedby 1 point in 2010
Income Levy of 2 to 6% on all grossincomes, by end of 2009
50% top tax rate introduced in 2010
Social security contributionsHealth Levy doubled (to 4%, and
5% on high incomes) over the periodStandard rate reduced from 17.5% to
15% in 2009
Structural reforms: Benefits
Social (and unemployment) assistanceExtension of social assistanceto the working poor (RSA) in
2009
In 2010, Jobseekers Allowancereduced for those aged 1821
Child benefits, tax credits & socialtransfer child increments
Reforms of universal child benefit,education benefit and child
allowances in 2009
Over the period, decrease in childbenefit (see below) compensated forpoor families by an increase of 24%
in social benefit child increments
Child increment of the Child TaxCredit increased by 7.2% over the
period
Uprating policies: % change in taxbenefit monetary parameters between 20082010Social Assistance payments 2.7% 1.2% 0.9% 8.2%Child benefit payments £ 3.0% 6.5% 9.6% 8.0%SSC thresholds † 6.2% 2.9% 0.0% 7.2%Income tax thresholds † 1.9% 3.0% 2.6% 6.3%Inwork transfer ‡ 0.0% n/a 2.0%* 6.7%For comparison: % change in mean wage and income
Minimum wage 2.7% n/a 0.0% 5.1%Mean wage 1.8% 2.3% 3.9% 1.7%Uprating factor α * 1.4% 0.4% 11.1% 1.0%£ the Child Tax Credit in the UK has been frozen nominally
* Factor α is the distributionallyneutral uprating factor used in the "no reform" scenarios; it is calculated as the % change in mean income over the period and necessarily smaller than wage progression in time ofjob losses and work sharing.
† Social security contribution (SSC) and Income tax thresholds averaged over all thresholds. In Ireland, no change to the SSC ceiling but an increase of 48% in the maximum amount payable.‡ Inwork benefit or tax credit on labor income. In Ireland, Family Income Supplement received is 60% of the gap between family income and an income limit. This income limit increased by 3.3%, hence a 2%increase i.e. 60%*3.3%
25

A.2 Detailed Decomposition Results
Table A.3: Decomposition of Inequality/Poverty Changes (France, 2008-2010)
data year: 0 0 1 0 1uprated to: 1 1
policy year: 0 0 0 1 1uprated to: 1 1
Mean of Mean of(4)(2), (3)(1) (2)(1), (4)(3)
InequalityGini 26.5 26.5 27.8 26.1 28.4 1.9 0.0 0.5 1.4 0.4 2.3 0.1 1.8
Atkinson 0.5 6.1 6.1 6.8 5.9 7.0 1.0 0.0 0.2 0.7 0.2 1.1 0.0 0.9P90/P10 3.04 3.04 3.12 2.98 3.16 0.12 0.00 0.04 0.08 0.05 0.17 0.01 0.13P90/P50 1.81 1.81 1.82 1.80 1.84 0.03 0.00 0.02 0.01 0.01 0.04 0.00 0.03P50/P10 1.68 1.68 1.71 1.66 1.72 0.03 0.00 0.00 0.03 0.02 0.05 0.01 0.04
Total poverty (60% median income)FGT0 (%) 10.3 10.3 11.8 9.8 11.7 1.4 0.0 0.1 1.5 0.6 2.0 0.3 1.7FGT1 (%) 2.3 2.3 2.9 2.2 2.9 0.6 0.0 0.0 0.6 0.1 0.7 0.1 0.6FGT2 (%) 1.0 1.0 1.3 0.9 1.2 0.3 0.0 0.0 0.3 0.0 0.3 0.0 0.3
Total poverty (50% median income)FGT0 (%) 4.9 5.0 6.2 4.8 6.4 1.5 0.0 0.2 1.3 0.2 1.7 0.0 1.5FGT1 (%) 1.3 1.3 1.7 1.2 1.7 0.4 0.0 0.0 0.4 0.1 0.4 0.0 0.4FGT2 (%) 0.6 0.6 0.8 0.6 0.8 0.2 0.0 0.0 0.2 0.0 0.2 0.0 0.2
Total poverty (poverty line fixed at 60% median)FGT0 (%) 10.3 10.3 9.9 9.5 9.3 1.0 0.0 0.5 0.5 0.9 0.1 0.7 0.3FGT1 (%) 2.3 2.3 2.5 2.2 2.3 0.0 0.0 0.2 0.2 0.2 0.2 0.2 0.2FGT2 (%) 1.0 1.0 1.1 0.9 1.0 0.1 0.0 0.1 0.2 0.1 0.1 0.1 0.1
Child povertyFGT0 (%) 10.5 10.5 11.6 9.9 11.0 0.5 0.0 0.6 1.1 0.5 1.0 0.6 1.1FGT1 (%) 2.1 2.1 2.0 2.0 2.2 0.1 0.0 0.2 0.1 0.1 0.1 0.1 0.0FGT2 (%) 0.8 0.8 0.6 0.8 0.7 0.1 0.0 0.1 0.2 0.0 0.1 0.0 0.1
Child poverty (poverty line fixed)FGT0 (%) 10.5 10.5 9.1 9.6 8.4 2.0 0.0 0.6 1.4 0.9 1.1 0.8 1.3FGT1 (%) 2.1 2.1 1.6 1.9 1.6 0.5 0.0 0.0 0.5 0.1 0.4 0.0 0.4FGT2 (%) 0.8 0.8 0.5 0.8 0.5 0.3 0.0 0.0 0.3 0.1 0.2 0.0 0.3
Poverty age>60FGT0 (%) 10.5 10.5 9.9 9.4 10.4 0.1 0.0 0.5 0.6 1.1 1.1 0.3 0.2FGT1 (%) 1.7 1.7 1.9 1.5 1.9 0.1 0.0 0.1 0.2 0.2 0.4 0.2 0.3FGT2 (%) 0.5 0.5 0.6 0.4 0.6 0.1 0.0 0.1 0.2 0.1 0.2 0.1 0.2
Poverty age>60 (poverty line fixed)FGT0 (%) 10.5 10.5 8.2 8.8 7.5 3.0 0.0 0.7 2.3 1.7 1.3 1.2 1.8FGT1 (%) 1.7 1.7 1.6 1.4 1.3 0.4 0.0 0.2 0.2 0.3 0.1 0.3 0.1FGT2 (%) 0.5 0.5 0.5 0.4 0.4 0.1 0.0 0.1 0.0 0.1 0.0 0.1 0.0
Other poorFGT0 (%) 10.4 10.4 13.3 10.1 13.1 2.7 0.0 0.2 2.9 0.3 3.0 0.2 3.0FGT1 (%) 2.9 2.9 4.1 2.8 4.0 1.1 0.0 0.1 1.2 0.1 1.2 0.1 1.2FGT2 (%) 1.4 1.4 2.1 1.3 2.0 0.6 0.0 0.1 0.7 0.0 0.7 0.0 0.7
Contribution of child poverty to total poverty (%)FGT0 (%) 0.3 0.3 0.2 0.3 0.2 0.0 0.0 0.0 0.0 0.0 0.0 0.0 0.0FGT1 (%) 0.2 0.2 0.2 0.2 0.2 0.0 0.0 0.0 0.1 0.0 0.0 0.0 0.1FGT2 (%) 0.2 0.2 0.1 0.2 0.1 0.1 0.0 0.0 0.1 0.0 0.1 0.0 0.1
Contribution of old age poverty to total poverty (%)FGT0 (%) 0.3 0.3 0.3 0.3 0.3 0.0 0.0 0.0 0.1 0.0 0.0 0.0 0.0FGT1 (%) 0.2 0.2 0.2 0.2 0.2 0.0 0.0 0.0 0.0 0.0 0.0 0.0 0.0FGT2 (%) 0.2 0.2 0.2 0.1 0.1 0.0 0.0 0.0 0.0 0.0 0.0 0.0 0.0
Measures are based on equivalized income using the modified OECD scale. The poverty line is 60% of the median equivalized income. Gini, Atkinson index and FGTpoverty measures are multiplied by 100. Period 0 is 2008 (using 2008 data based on 2007 income) and period 1 is 2010 (using 2010 data based on 2009 income).
Decomposition II ShorrocksShapleyDecompositionTotal
change
Homogeneitycheck
(4)(0) (1)(0)(4) (2)(1) (3)(1)
Decomposition I
Policyeffect
Othereffects
(4)(3)(4)(2)
Other effectsOthereffects
(0) (1) (2)
Policyeffect
(3)
Policy effect
26

Table A.4: Decomposition of Inequality/Poverty Changes (Germany, 2008-2010)
data year: 0 0 1 0 1uprated to: 1 1
policy year: 0 0 0 1 1
uprated to: 1 1
Mean of Mean of(4)(2), (3)(1) (2)(1), (4)(3)
InequalityGini 27.5 27.5 27.0 27.5 27.1 0.5 0.0 0.0 0.5 0.0 0.4 0.0 0.5
Atkinson 0.5 6.7 6.7 6.6 6.7 6.6 0.1 0.0 0.0 0.1 0.0 0.1 0.0 0.1P90/P10 3.29 3.29 3.26 3.31 3.28 0.01 0.00 0.03 0.04 0.02 0.02 0.02 0.03P90/P50 1.80 1.80 1.79 1.79 1.79 0.01 0.00 0.00 0.01 0.01 0.01 0.01 0.01P50/P10 1.83 1.83 1.82 1.84 1.84 0.01 0.00 0.02 0.01 0.01 0.00 0.02 0.01
Total poverty (60% median income)FGT0 (%) 16.1 16.1 16.4 16.9 17.2 1.1 0.0 0.8 0.3 0.8 0.2 0.8 0.3FGT1 (%) 4.6 4.6 4.8 4.9 5.1 0.6 0.0 0.3 0.3 0.3 0.3 0.3 0.3FGT2 (%) 2.3 2.3 2.6 2.5 2.8 0.5 0.0 0.1 0.3 0.1 0.3 0.1 0.3
Total poverty (50% median income)FGT0 (%) 9.6 9.6 9.9 10.3 10.4 0.9 0.0 0.5 0.4 0.8 0.1 0.6 0.2FGT1 (%) 2.9 2.9 3.2 3.1 3.4 0.5 0.0 0.2 0.3 0.2 0.3 0.2 0.3FGT2 (%) 1.7 1.7 2.0 1.8 2.1 0.4 0.0 0.1 0.3 0.1 0.3 0.1 0.3
Total poverty (poverty line fixed at 60% median)FGT0 (%) 16.1 16.1 16.0 15.4 15.1 1.1 0.0 0.9 0.1 0.7 0.4 0.8 0.3FGT1 (%) 4.6 4.6 4.7 4.5 4.6 0.1 0.0 0.1 0.2 0.1 0.2 0.1 0.2FGT2 (%) 2.3 2.3 2.6 2.3 2.6 0.3 0.0 0.0 0.3 0.0 0.3 0.0 0.3
Child povertyFGT0 (%) 14.3 14.3 16.0 13.8 14.9 0.6 0.0 1.1 1.7 0.5 1.1 0.8 1.4FGT1 (%) 4.0 4.0 3.9 3.9 3.8 0.2 0.0 0.2 0.1 0.1 0.1 0.2 0.1FGT2 (%) 2.1 2.1 2.0 2.0 1.9 0.2 0.0 0.1 0.1 0.1 0.1 0.1 0.1
Child poverty (poverty line fixed)FGT0 (%) 14.3 14.3 15.3 12.2 12.1 2.2 0.0 3.1 1.0 2.1 0.0 2.6 0.5FGT1 (%) 4.0 4.0 3.8 3.6 3.3 0.7 0.0 0.5 0.2 0.5 0.2 0.5 0.2FGT2 (%) 2.1 2.1 1.9 1.9 1.7 0.4 0.0 0.2 0.1 0.2 0.2 0.2 0.2
Poverty age>60FGT0 (%) 15.3 15.3 14.1 16.7 15.9 0.7 0.0 1.8 1.2 1.4 0.8 1.6 1.0FGT1 (%) 3.6 3.6 3.5 4.0 3.9 0.3 0.0 0.4 0.1 0.4 0.1 0.4 0.1FGT2 (%) 1.6 1.6 1.6 1.7 1.7 0.2 0.0 0.2 0.0 0.2 0.0 0.2 0.0
Poverty age>60 (poverty line fixed)FGT0 (%) 15.3 15.3 13.9 15.3 13.9 1.4 0.0 0.1 1.3 0.0 1.4 0.0 1.4FGT1 (%) 3.6 3.6 3.4 3.6 3.4 0.2 0.0 0.0 0.2 0.0 0.2 0.0 0.2FGT2 (%) 1.6 1.6 1.5 1.6 1.6 0.0 0.0 0.0 0.0 0.0 0.0 0.0 0.0
Other poorFGT0 (%) 17.4 17.4 18.1 18.3 18.9 1.5 0.0 0.8 0.7 0.9 0.6 0.8 0.6FGT1 (%) 5.4 5.4 6.0 5.8 6.4 1.0 0.0 0.4 0.6 0.4 0.6 0.4 0.6FGT2 (%) 2.9 2.9 3.6 3.1 3.8 0.8 0.0 0.2 0.6 0.2 0.6 0.2 0.6
Contribution of child poverty to total poverty (%)FGT0 (%) 0.2 0.2 0.2 0.1 0.1 0.0 0.0 0.0 0.0 0.0 0.0 0.0 0.0FGT1 (%) 0.2 0.2 0.1 0.1 0.1 0.0 0.0 0.0 0.0 0.0 0.0 0.0 0.0FGT2 (%) 0.2 0.2 0.1 0.1 0.1 0.0 0.0 0.0 0.0 0.0 0.0 0.0 0.0
Contribution of old age poverty to total poverty (%)FGT0 (%) 0.3 0.3 0.3 0.3 0.3 0.0 0.0 0.0 0.0 0.0 0.0 0.0 0.0FGT1 (%) 0.3 0.3 0.2 0.3 0.2 0.0 0.0 0.0 0.0 0.0 0.0 0.0 0.0FGT2 (%) 0.2 0.2 0.2 0.2 0.2 0.0 0.0 0.0 0.0 0.0 0.0 0.0 0.0
(0) (1) (2) (4)(3)(4)(2)
Totalchange
Homogeneitycheck
(4)(0) (1)(0)
ShorrocksShapleyDecomposition
Policy effect Other effects
Measures are based on equivalized income using the modified OECD scale. The poverty line is 60% of the median equivalized income. Gini, Atkinson index and FGTpoverty measures are multiplied by 100. Period 0 is 2008 (using 2008 data based on 2007 income) and period 1 is 2010 (using 2010 data based on 2009 income).
Policyeffect
Othereffects
(3) (4) (2)(1) (3)(1)
Decomposition I
Policyeffect
Othereffects
Decomposition II
27

Table A.5: Decomposition of Inequality/Poverty Changes (Ireland, 2008-2010)
data year: 0 0 1 0 1uprated to: 1 1
policy year: 0 0 0 1 1uprated to: 1 1
Mean of Mean of(4)(2), (3)(1) (2)(1), (4)(3)
InequalityGini 29.1 29.1 32.0 26.2 29.2 0.2 0.0 2.8 3.0 2.8 3.0 2.8 3.0
Atkinson 0.5 7.1 7.1 8.6 5.9 7.3 0.2 0.0 1.3 1.5 1.2 1.4 1.2 1.4P90/P10 3.6 3.6 4.2 3.1 3.6 0.0 0.0 0.6 0.6 0.5 0.5 0.5 0.6P90/P50 1.9 1.9 2.1 1.8 2.0 0.1 0.0 0.1 0.3 0.1 0.2 0.1 0.2P50/P10 1.9 1.9 2.0 1.7 1.8 0.1 0.0 0.2 0.1 0.2 0.1 0.2 0.1
Total poverty (60% median income)FGT0 (%) 15.7 15.6 17.6 12.3 13.8 1.8 0.1 3.9 2.0 3.3 1.5 3.6 1.8FGT1 (%) 3.8 3.7 3.8 2.9 3.1 0.6 0.0 0.7 0.1 0.8 0.2 0.8 0.1FGT2 (%) 1.9 1.9 1.8 1.6 1.7 0.2 0.0 0.1 0.0 0.3 0.1 0.2 0.0
Total poverty (50% median income)FGT0 (%) 7.7 7.6 7.4 5.7 5.7 1.9 0.1 1.7 0.2 1.9 0.1 1.8 0.1FGT1 (%) 2.2 2.2 2.1 1.8 1.9 0.3 0.0 0.2 0.1 0.4 0.1 0.3 0.0FGT2 (%) 1.4 1.4 1.4 1.2 1.4 0.0 0.0 0.0 0.0 0.2 0.1 0.1 0.0
Total poverty (poverty line fixed at 60% median)FGT0 (%) 15.7 15.5 16.2 10.8 11.5 4.0 0.1 4.7 0.6 4.8 0.7 4.7 0.7FGT1 (%) 3.8 3.7 3.5 2.6 2.7 1.0 0.1 0.9 0.1 1.0 0.0 1.0 0.1FGT2 (%) 1.9 1.8 1.7 1.5 1.6 0.3 0.0 0.2 0.1 0.4 0.1 0.3 0.0
Child povertyFGT0 (%) 15.4 15.3 16.1 12.1 13.5 1.8 0.1 2.6 0.8 3.2 1.4 2.9 1.1FGT1 (%) 3.0 2.9 3.0 2.4 2.5 0.4 0.0 0.5 0.1 0.6 0.2 0.5 0.1FGT2 (%) 1.3 1.2 1.2 1.1 1.2 0.1 0.0 0.1 0.0 0.1 0.1 0.1 0.0
Child poverty (fixed poverty line)FGT0 (%) 15.4 15.2 15.6 10.0 11.4 3.8 0.2 4.2 0.4 5.2 1.4 4.7 0.9FGT1 (%) 3.0 2.9 2.8 2.1 2.1 0.8 0.1 0.7 0.1 0.8 0.0 0.7 0.1FGT2 (%) 1.3 1.2 1.2 1.0 1.1 0.2 0.0 0.1 0.1 0.2 0.0 0.1 0.0
Poverty age>60FGT0 (%) 10.6 10.6 17.7 6.9 8.7 1.9 0.1 9.0 7.1 3.7 1.8 6.3 4.5FGT1 (%) 1.9 1.9 2.7 1.3 1.9 0.1 0.0 0.8 0.8 0.6 0.6 0.7 0.7FGT2 (%) 0.7 0.7 1.2 0.6 1.0 0.3 0.0 0.2 0.5 0.2 0.5 0.2 0.5
Poverty age>60 (fixed poverty line)FGT0 (%) 10.6 10.5 11.9 5.7 6.4 4.1 0.1 5.5 1.4 4.8 0.7 5.2 1.1FGT1 (%) 1.9 1.8 2.4 1.2 1.6 0.2 0.0 0.8 0.5 0.7 0.4 0.7 0.5FGT2 (%) 0.7 0.7 1.1 0.5 1.0 0.2 0.0 0.2 0.4 0.2 0.4 0.2 0.4
Other poorFGT0 (%) 20.2 20.1 19.2 17.2 19.1 1.1 0.1 0.2 0.9 3.0 1.9 1.6 0.5FGT1 (%) 6.1 6.1 5.7 4.8 4.9 1.2 0.0 0.8 0.4 1.2 0.0 1.0 0.2FGT2 (%) 3.4 3.4 3.1 2.8 2.8 0.6 0.0 0.3 0.3 0.6 0.0 0.4 0.2
Contribution of child poverty to total poverty (%)FGT0 (%) 0.3 0.3 0.3 0.3 0.3 0.0 0.0 0.0 0.0 0.0 0.0 0.0 0.0FGT1 (%) 0.3 0.3 0.3 0.3 0.3 0.0 0.0 0.0 0.0 0.0 0.0 0.0 0.0FGT2 (%) 0.2 0.2 0.2 0.2 0.3 0.0 0.0 0.0 0.0 0.0 0.0 0.0 0.0
Contribution of old age poverty to total poverty (%)FGT0 (%) 0.2 0.2 0.3 0.2 0.2 0.0 0.0 0.1 0.1 0.0 0.0 0.1 0.1FGT1 (%) 0.2 0.2 0.2 0.1 0.2 0.0 0.0 0.0 0.1 0.0 0.1 0.0 0.1FGT2 (%) 0.1 0.1 0.2 0.1 0.2 0.1 0.0 0.0 0.1 0.0 0.1 0.0 0.1
(3)(1) (4)(3)
Measures are based on equivalized income using the modified OECD scale. The poverty line is 60% of the median equivalized income. Gini, Atkinson index and FGTpoverty measures are multiplied by 100. Period 0 is 2008 (using data with 2008 income) and period 1 is 2010 (using data with 2010 income).
Other effects
(0) (1) (2) (3) (4) (4)(1) (1)(0) (4)(2) (2)(1)
Totalchange
Homogeneitycheck
Decomposition I Decomposition II ShorrocksShapleyDecomposition
Policyeffect
Othereffects
Policyeffect
Othereffects Policy effect
28

Table A.6: Decomposition of Inequality/Poverty Changes (UK, 2008-2010)
data year: 0 0 1 0 1uprated to: 1 1
policy year: 0 0 0 1 1uprated to: 1 1
Mean of Mean of(4)(2), (3)(1) (2)(1), (4)(3)
InequalityGini 32.8 32.8 32.4 31.8 31.5 1.4 0.0 0.9 0.5 1.1 0.3 1.0 0.4
Atkinson 0.5 10.4 10.4 9.1 9.6 8.6 1.9 0.0 0.6 1.3 0.8 1.0 0.7 1.2P90/P10 3.95 3.95 4.04 3.80 3.91 0.04 0.00 0.13 0.09 0.15 0.11 0.14 0.10P90/P50 1.98 1.98 2.00 1.97 1.98 0.00 0.00 0.02 0.02 0.02 0.01 0.02 0.02P50/P10 1.99 1.99 2.02 1.93 1.98 0.02 0.00 0.05 0.03 0.06 0.04 0.05 0.04
Total poverty (60% median income)FGT0 (%) 17.6 17.6 18.2 16.6 17.3 0.3 0.0 1.0 0.6 1.0 0.7 1.0 0.7FGT1 (%) 4.9 4.9 5.3 4.5 5.0 0.1 0.0 0.3 0.4 0.3 0.5 0.3 0.4FGT2 (%) 2.4 2.4 2.7 2.2 2.5 0.2 0.0 0.2 0.3 0.2 0.3 0.2 0.3
Total poverty (50% median income)FGT0 (%) 10.3 10.3 11.0 8.9 10.1 0.2 0.0 0.8 0.7 1.4 1.2 1.1 1.0FGT1 (%) 3.1 3.1 3.4 2.9 3.2 0.2 0.0 0.2 0.4 0.2 0.4 0.2 0.4FGT2 (%) 1.7 1.7 2.0 1.6 1.9 0.2 0.0 0.1 0.3 0.1 0.3 0.1 0.3
Total poverty (poverty line fixed at 60% median)FGT0 (%) 17.6 17.6 17.4 15.8 15.7 1.9 0.0 1.7 0.2 1.8 0.1 1.7 0.2FGT1 (%) 4.9 4.9 5.1 4.3 4.6 0.3 0.0 0.5 0.2 0.5 0.2 0.5 0.2FGT2 (%) 2.4 2.4 2.6 2.1 2.4 0.0 0.0 0.2 0.2 0.2 0.2 0.2 0.2
Child povertyFGT0 (%) 20.0 20.0 21.0 17.7 18.6 1.3 0.0 2.4 1.1 2.2 0.9 2.3 1.0FGT1 (%) 5.4 5.4 5.6 5.0 5.0 0.4 0.0 0.5 0.1 0.4 0.0 0.5 0.1FGT2 (%) 2.6 2.6 2.6 2.4 2.4 0.2 0.0 0.2 0.0 0.2 0.0 0.2 0.0
Child poverty (fixed poverty line)FGT0 (%) 20.0 20.0 19.8 16.8 16.4 3.6 0.0 3.5 0.1 3.2 0.4 3.3 0.3FGT1 (%) 5.4 5.4 5.3 4.8 4.6 0.8 0.0 0.7 0.2 0.6 0.2 0.6 0.2FGT2 (%) 2.6 2.6 2.5 2.4 2.3 0.4 0.0 0.3 0.1 0.3 0.1 0.3 0.1
Poverty age>60FGT0 (%) 18.2 18.2 16.7 17.7 16.6 1.6 0.0 0.1 1.5 0.5 1.1 0.3 1.3FGT1 (%) 3.7 3.7 3.4 3.5 3.3 0.4 0.0 0.1 0.3 0.2 0.2 0.2 0.2FGT2 (%) 1.3 1.3 1.2 1.3 1.1 0.2 0.0 0.0 0.2 0.1 0.1 0.1 0.1
Poverty age>60 (fixed poverty line)FGT0 (%) 18.2 18.2 15.7 16.8 14.7 3.5 0.0 1.0 2.6 1.5 2.1 1.2 2.3FGT1 (%) 3.7 3.7 3.1 3.2 2.8 0.8 0.0 0.3 0.5 0.4 0.4 0.4 0.5FGT2 (%) 1.3 1.3 1.1 1.2 1.0 0.3 0.0 0.1 0.2 0.1 0.2 0.1 0.2
Other poorFGT0 (%) 16.0 16.0 17.6 15.3 17.0 1.0 0.0 0.6 1.6 0.7 1.7 0.7 1.7FGT1 (%) 5.3 5.3 6.3 4.9 6.0 0.7 0.0 0.3 1.0 0.4 1.1 0.3 1.1FGT2 (%) 2.9 2.9 3.7 2.6 3.5 0.6 0.0 0.2 0.8 0.2 0.8 0.2 0.8
Contribution of child poverty to total poverty (%)FGT0 (%) 0.3 0.3 0.3 0.3 0.3 0.0 0.0 0.0 0.0 0.0 0.0 0.0 0.0FGT1 (%) 0.3 0.3 0.3 0.3 0.3 0.0 0.0 0.0 0.0 0.0 0.0 0.0 0.0FGT2 (%) 0.3 0.3 0.2 0.3 0.2 0.0 0.0 0.0 0.0 0.0 0.0 0.0 0.0
Contribution of old age poverty to total poverty (%)FGT0 (%) 0.3 0.3 0.3 0.3 0.3 0.0 0.0 0.0 0.0 0.0 0.0 0.0 0.0FGT1 (%) 0.2 0.2 0.2 0.2 0.2 0.0 0.0 0.0 0.0 0.0 0.0 0.0 0.0FGT2 (%) 0.2 0.2 0.1 0.2 0.1 0.0 0.0 0.0 0.0 0.0 0.0 0.0 0.0
Measures are based on equivalized income using the modified OECD scale. The poverty line is 60% of the median equivalized income. Gini, Atkinson index and FGTpoverty measures are multiplied by 100. Period 0 is 2008 (using data with 2008/9 income) and period 1 is 2010 (using data with 2009/10 income).
(0) (1) (2) (3) (2)(1) (3)(1) (4)(3)
ShorrocksShapleyDecomposition
Policyeffect
Othereffects
Policyeffect
Othereffects Policy effect Other effects
Homogeneitycheck
Decomposition I Decomposition II
(4) (4)(0)
Totalchange
(1)(0) (4)(2)
29

A.3 Comparison of Simulated versus Observed Disposable In-come
As explained in the text, our decomposition exercise is based on simulated rather thanobserved data on disposable income. Simulations are precisely the added value of thisexercise since they allow us to produce counterfactual distributions to be used in thedecomposition to isolate tax-bene�t policy e¤ects from other e¤ects. The drawback, how-ever, is that simulated income distributions for actual situations (those of years 2008 and2010) do not always perfectly match external information. We explain why in what fol-lows. Nonetheless, the important aspect is that while inequality and poverty measuresmay di¤er in levels at any point in time, time variations point in the same directionfor both simulated and external data, as can be seen in Figure A.1. In this graph, wecompare our simulated trends with o¢ cial statistics (Eurostat for France and Germany,Households Below Average Income (HBAI) data for the UK and statistics from the CSOfor Ireland). The values used to produce these trends are detailed in Table A.7. As men-tioned above, we observe important discrepancies in levels in this table, which can beexplained by at least three groups of factors. First, these di¤erences may just reveal theimperfect comparison between simulated and external data to the extent that the de�ni-tion of disposable income, or the way it is calculated, di¤ers in the two sources �we givemore detailed explanations country by country below. Second, discrepancies can be at-tributed to data issues concerning disposable income for some countries where interviewsare used and, possibly, contaminated with measurement errors and recall errors (whenpeople are asked how much taxes were paid or bene�t received in a particular year). Thisis not a systematic source of errors: for France, for instance, income information in EU-SILC data is drawn from the Administrative Tax Revenue Data and is, therefore, veryaccurate. Third, and more likely, di¤erences can be attributed to simpli�cation assump-tions made in microsimulation, including (i) the assumption of full take-up of bene�tsor tax credits (although we do introduce basic take-up modeling for certain bene�ts, asdiscussed hereafter), (ii) the assumption of tax compliance (we do not assume any rate ofnon-compliance, fraud, error or tax evasion); (iii) the amount of tax modeled by higherearners is often larger than the amount of tax actually paid (as they may avail of certainsmaller tax relief schemes that are not possible to model in a microsimulation framework);(iv) timing issues such as the fact that reforms take place during the year (in addition,income data for France and Germany are provided with a delay, as discussed in section3.1 and below). We now provide more detailed explanations country by country (see alsoDoorley, 2013, Ochmann and Fossen, 2012, Keane et al., 2013, and Sutherland, 2013 fora thorough account of simulation assumptions for France, Germany, Ireland and the UKrespectively).
30

France. EUROMOD-simulated inequality and poverty rates are underestimated in France,as can be seen in Table A.7. To understand the discrepancies, it is important to bear inmind that no data adjustments are made in EUROMOD in situations where the policyyear does not correspond to the data year �except a nominal adjustment of the di¤erenttypes of income since they are recorded for year t � 1 in data of year t, as explained insection 3.1. In particular, no adjustment is made for changes in market income distribu-tion that have taken place between t� 1 and t. For instance, it is possible that losses inemployment may be driving the higher inequality observed in external statistics, but notshowing up in EUROMOD. Non-take-up of some means-tested bene�ts or administrativeerrors in the implementation of these bene�ts may play a role in poverty discrepancies.Only the non take-up of general social assistance (RMI/ RSA) is simulated in EURO-MOD and done by simple random draws of non-claiming households. If marginalized,peripheral groups are less likely to claim bene�ts to which they are theoretically entitled,incomes at the bottom will be in�ated in EUROMOD and poverty will be underestimated.Child poverty is also greatly understated in EUROMOD, for the same reason but alsofor additional factors. For instance, it is possible that non-take up of some means-testedfamily bene�ts also accounts for this pattern. Data limitations must also play a role inthe observed discrepancies. For instance, accurate simulation of the parental leave bene�twas not possible given the information available in SILC, resulting in a substantial overes-timation of this bene�t compared to external statistics (see Doorley, 2013). Importantly,these limitations are systematic across years so that they should a¤ect trends less thanlevels. Indeed, Figure A.1 con�rms that inequality trends according to our simulation arecomparable to external benchmarks. We �nd a larger increase in poverty risk calculatedusing the poverty line at 60% of the median (+1:4 percentage points versus +0:2 in ex-ternal statistics). With a poverty line at 50% of the median (not reported), results aremore comparable (+1:5 points versus +0:8 in external statistics).
Germany. Table A.7 shows that inequality is underestimated in EUROMOD simu-lations for Germany while poverty is slightly overestimated. Child poverty is largelycomparable to external benchmarks. As in the case of France, policy simulations for ayear t in Germany rely on income information from year t � 1. As a result, changes inwork duration or wage inequalities between 2007 and 2008 or 2009 and 2010 may explainthe higher inequality observed in the external benchmarks for our base and end years.Moreover, to render the 2008 and 2010 German data comparable, it was necessary todiscard the imputation of tax allowances which was introduced only in 2010. This resultsin an over-estimation of tax liabilities (of around 10% on average).23 As with the French
23Nonetheless, a robustness check which re-introduces the imputation of tax-allowances in 2010 doesnot qualitatively change the results of any of our decompositions for Germany.
31
social assistance scheme, we also model take-up of social assistance in Germany. Unem-ployment assistance, old-age assistance and general social assistance are assumed to havetake-up rates of 59%, following the available literature on bene�t take-up in Germany(Bruckmeier and Wiemers, 2011). It should also be noted that housing bene�ts havenot been simulated in EUROMOD, but simply imputed from the data, because reportedinformation on housing expenditures is not detailed enough. These factors are likely tocontribute to the overestimation of poverty observed in our results. These limitations areconsistent across years and Figure A.1 shows that simulated and actual trends in totalpoverty and inequality go in the same direction.
Ireland. External statistics are provided by the Central Statistics O¢ ce (CSO) in Ire-land but we also refer to information from Eurostat for comparability purposes. As inGermany, simulations for Ireland underestimate inequality and overestimate poverty ac-cording to Table A.7. Simulations acknowledge the low take-up levels of the Irish transferto working poor households (the Family Income Supplement, FIS), imputing a randomtake-up rate of 33%. As in the French case, however, random imputation may be a crudeapproximation. In addition, one driving factor for the di¤erence with external sources isthe fact that SWITCH is based on current income, while CSO results are based on annualincome. Lump sums, such as retirement and redundancy payments which are likely tohave increased in importance during the recession,24 will appear in annual income butnot current income. The issue of current compared to annual income will also in�uencewhere individuals are found in the income distribution given changes in their employmentstatus over time, especially during a period of rising unemployment. In terms of trends(Figure A.1), external statistics show a larger rise in the Gini (+0:9 percentage pointscompared to +0:1 in the simulation). Our simulations show a fall in the overall povertyrate (�12:2%) which is con�rmed by Eurostat statistics, even if it is substantially smaller(�1:9%).25 Poverty using 50% of the median also compares better (not reported) withEurostat indicating a decrease of 12% (starting from a "at risk of poverty" rate of 7:7%)while our simulations give a 25% decline (starting from 8:1%).
UK. External �gures for the UK (HBAI) are provided by the Department of Work andPension and based on the same underlying data source as for EUROMOD, the FRS. While
24Redundancy payments will have increased in importance as unemployment grew. In addition to this,the �Incentivised Early Retirement Scheme�will have resulted in larger numbers receiving retirementlump sum retirement payments.25CSO external statistics show a slight rise (+0:3). Note however that our simulation and Eurostat use
the modi�ed OECD equivalence scale (which gives a weight of 1 to the �rst adult in a household, .5 tosubsequent adults and .3 to children) while the CSO uses a national equivalence scale (giving a weight of.66 to subsequent adults and .33 to children), which reduces still the comparison possibilities.
32

the simulated poverty rate is close to the external statistics, the Gini coe¢ cient for thebase year is underestimated.26 In addition to the standard di¤erences mentioned above re-garding simulated versus actual data, Sutherland (2013) suggests a possible reason for thediscrepancy in the Gini. The external statistics (HBAI) correct for an insu¢ cient numberof high income households in the FRS data sample using administrative information fromtax statistics. As Sutherland (2013) point out, this will result in an increase in income atthe upper end of the income distribution and a¤ect the Gini measure. It is indicated thatresults from EUROMOD and external statistics become closer once this issue is taken intoaccount. Note also that non-take-up is modeled for the Working Tax Credit, with thesame limitation as emphasized above. Despite these potential caveats, simulated trendsin inequality and poverty are relatively similar to those based on external statistics for theUK. External statistics for the Gini show a sharper fall (3 percentage points) compared toEUROMOD simulations (1:4 points). The pattern in overall and child poverty rates pointin the same direction and are more similar, with the EUROMOD results being slightlylower than the external statistics.26Recall the particular nature of the data in the case of the UK, i.e. collected between April and March
of the following year, as discussed in Section 3. For comparison, we have simply used o¢ cial statisticsaveraged for each pair of years, 2008/09 and 2009/10.
33

Time Change in Gini Coefficient (points of %)
3,0
2,0
1,0
0,0
1,0
2,0
3,0
France Germany Ireland UK
Simulation
External
Time Change in Poverty Rate (points of %)
3,0
2,0
1,0
0,0
1,0
2,0
3,0
France Germany Ireland UK
Time Change in Child Poverty Rate (points of %)
3,0
2,0
1,0
0,0
1,0
2,0
3,0
France Germany Ireland UK
Figure A.1: Comparison of Changes in Income Distribution2008-2010 using Simulated versus Observed Incomes
34

Table A.7: Comparing Simulated and Observed Income Distribution: Levels and Trends
Δ Δ Δ% Δ%base end base end (S) (E) (S) (E)
FranceGini 26,5 28,4 28,2 29,9 1,9 1,7 7,1% 5,9%Poverty rate 10,3 11,7 12,9 13,1 1,4 0,2 13,4% 1,6%Child poverty rate 10,5 11,0 15,4 17,1 0,5 1,7 4,8% 10,7%GermanyGini 27,5 27,1 30,3 29,2 0,5 1,1 1,7% 3,6%Poverty rate 16,1 17,2 15,2 15,6 1,1 0,4 6,6% 2,3%Child poverty rate 14,3 14,9 14,3 15,9 0,6 1,6 4,2% 11,2%IrelandGini 29,1 29,2 30,7 31,6 0,1 0,9 0,5% 2,9%Poverty rate (a) 15,7 13,8 14,4 14,7 1,9 0,3 12,2% 2,1%Poverty rate (b) 15,7 13,8 15,5 15,2 1,9 0,3 12,2% 1,9%Child poverty rate* 15,4 13,5 18,8 18,4 1,9 0,4 12,3% 2,1%UKGini 32,8 31,5 36,0 33,0 1,4 3,0 4,2% 8,3%Poverty rate 17,6 17,3 17,3 16,6 0,3 0,7 1,9% 4,0%Child poverty rate 20,0 18,6 21,9 20,1 1,3 1,8 6,7% 8,2%
* External statistics are for those <17 for Ireland.
External (E)
External statistics taken from Eurostat for France and Germany, the Department of Work and Prensions for the UK and (a) the Central Statistics Office or (b)EUROSTAT for Ireland. Base year external statistics are for 2008 for Ireland, average over 200708 for France and Germany and 200809 for the UK.End year external statistics are for 2010 for Ireland, average over 200910 for France and Germany and 200910 for the UK. Poverty is calculated usingobserved or simulated disposable incomes after equivalization (modified OECD scale) and using the 60% median poverty line.
Simulation (S)
35