Change management in Dublin- based tour operators
125
Change management in Dublin- based tour operators Effective use of communication in change projects to prepare employees for upcoming change Tamara Bartl 10032071 MBA Project Management Dublin Business School August 2014
Transcript of Change management in Dublin- based tour operators
Change management in Dublin-
based tour operators
Effective use of communication in change projects to
prepare employees for upcoming change
Tamara Bartl
10032071
MBA Project Management
Dublin Business School
August 2014
Declaration
I, Tamara Bartl, declare that this dissertation is a result of my own work. It is being submitted to
fulfil the requirements of the MBA in Project Management at Dublin Business School. No part of the
work described on this dissertation has been submitted in support of an application for a degree or
qualification at this or any other college/university.
Further, all the work in this dissertation is entirely my own, except referenced in the text as a
specific source and included in the bibliography.
Signed: ___________________________
Tamara Bartl
22 August 2014

i
Table of Contents
List of Figures ........................................................................................................ iii
List of Tables ......................................................................................................... iii
List of Abbreviations ................................................................................................ iv
Acknowledgements ................................................................................................... v
Abstract ............................................................................................................... vi
1 Introduction ...................................................................................................... 1
1.1 Background ............................................................................................. 2
1.2 Research Specifics ..................................................................................... 3
2 Literature Review ............................................................................................... 4
2.1 Literature Introduction ............................................................................... 4
2.2 Travel and Tourism Industry ......................................................................... 5
2.2.1 Definitions ......................................................................................... 5
2.2.2 Tourism and Project Management ............................................................ 6
2.2.3 Changes and Challenges of the Industry ..................................................... 7
2.3 Management ............................................................................................ 8
2.4 Project Management ................................................................................. 10
2.4.1 Project Management Methods ................................................................ 11
2.4.2 Project Life Cycle ............................................................................... 13
2.4.3 Risk Management ................................................................................ 18
2.4.4 Stakeholder Management ...................................................................... 22
2.5 Communication ....................................................................................... 23
2.6 Change Management ................................................................................. 26
2.7 Resistance to Change ................................................................................ 31
2.8 Literature Conclusion ................................................................................ 34
3 Methodology .................................................................................................... 35
3.1 Methodology Introduction ........................................................................... 35
3.2 Research Design ....................................................................................... 36
3.2.1 Research Philosophy ............................................................................ 36
3.2.2 Research Approach.............................................................................. 37
3.2.3 Research Strategy ............................................................................... 38
3.2.4 Time Horizon ..................................................................................... 38
3.2.5 Selecting Participants .......................................................................... 39
3.2.6 Research Ethics .................................................................................. 41
3.3 Data Collection Instrument ......................................................................... 42
3.4 Limitations of Methodology ......................................................................... 44
ii
4 Data Analysis and Findings ................................................................................... 45
4.1 Data Analysis Procedures ............................................................................ 45
4.2 Research Analysis ..................................................................................... 46
4.2.1 General Questions / Information ............................................................. 47
4.2.2 Communication within the Company ........................................................ 48
4.2.3 Change and Projects ............................................................................ 50
4.2.4 Projects ........................................................................................... 59
4.2.5 Open Question ................................................................................... 61
5 Discussion ....................................................................................................... 64
5.1 Limitations of the Study ............................................................................. 67
6 Conclusion ...................................................................................................... 68
7 Recommendations ............................................................................................. 69
8 References...................................................................................................... 71
Appendix on self-reflection ....................................................................................... 79
Learning styles ................................................................................................. 79
Self-Appraisal .................................................................................................. 79
Problem Solving ............................................................................................... 80
Future application ............................................................................................ 81
Conclusion ...................................................................................................... 81
Appendices – Secondary Research ............................................................................... 82
Appendix 1: Project Success Factors – CHAOS report 1994 & 2010 .................................. 82
Appendix 2: PRINCE2 Process Model ....................................................................... 83
Appendix 3: ISO 31000 - Risk Management ............................................................... 84
Appendix 4: PM Methodologies (tools and techniques) and CM Models .............................. 85
Appendix 5: Resistance to Change – Two Paradigms .................................................... 86
Appendices - Primary Research .................................................................................. 87
Appendix 6: Revised Research Timetables ............................................................... 87
Appendix7: Questionnaire .................................................................................. 88
Appendix 8: Open Question Groups ........................................................................ 91
Appendix 9: Output SPSS .................................................................................... 92
iii
List of Figures
Figure 1: Generic Project Life Cycle Structure ................................................................ 13
Figure 2: Programming Project Life Cycle - Definition ....................................................... 13
Figure 3: Waterfall Model ......................................................................................... 14
Figure 4: Agile Method ............................................................................................. 15
Figure 5: Life Cycle Costing Profile .............................................................................. 16
Figure 6: Behaviour of Risks and Costs in the Project Life Cycle .......................................... 17
Figure 7: Risk Function ............................................................................................ 18
Figure 8: Plan Risk Management Data Flow Diagram ......................................................... 19
Figure 9: Prosci ADKAR Model .................................................................................... 28
Figure 10: Prosci ADKAR Influencing Factors ................................................................... 29
Figure 11: Selecting a Probability Sample ...................................................................... 40
Figure 12: Current Position in the Company ................................................................... 47
Figure 13: Topics Discussed in Meetings ........................................................................ 49
Figure 14: Occurrence of Changes ............................................................................... 50
Figure 15: Time of Information and Employment Position .................................................. 52
Figure 16: Explanation of Impacts on Daily Work ............................................................. 56
Figure 17: Explanation of Necessity of Changes ............................................................... 57
Figure 18: Exceedance of Schedule ............................................................................. 59
Figure 19: Improvements for Future Projects ................................................................. 61
Figure 20 Project Success Factors ............................................................................... 82
Figure 21 ISO 31000 Risk Management .......................................................................... 84
List of Tables
Table 1: Types of Meetings in the Company ................................................................... 48
Table 2: Change Occurrence and Types ........................................................................ 51
Table 3: Input in Projects ......................................................................................... 53
Table 4: Current Position and Input ............................................................................. 54
Table 5: Time of Information and Input ........................................................................ 55
Table 6: Budget Exceedance ...................................................................................... 60
Table 7: Specific Information and Project Completion in Time ............................................ 65
Table 8: Specific information and Budget ...................................................................... 66
iv
List of Abbreviations
ADKAR Awareness, Desire, Knowledge, Ability and Reinforcement – action-oriented
framework for controlling change
APM Association of Project Management
CM Change Management
COSO the Committee of Sponsoring Organisations of the Treadway Commission
ERM Enterprise Risk Management – Integrated Framework
IC Individualism/Collectivism (cultural dimension)
ICT Information and Communication Technologies
IFITT International Federation for Information Technologies in Travel and Tourism
ISO International Organisation for Standardisation
PD Power Distance (cultural dimension)
PM Project Management
PMBoK Guide to the Project Management Book of Knowledge
PMI Project Management Institute
PRINCE2 Projects Controlled Environments
SOI Service-Orientated Integration
SO-LO-MO Social-local-mobile marketing
UA Uncertainty Avoidance (cultural dimension)
UNWTO World Tourism Organisation
v
Acknowledgements
I would like to thank my supervisor Patrick Mongey for the time he dedicated, and his advice and
guidance during the process.
My gratitude also goes to all the participants for taking the time and sharing their experiences
with me.
I would like to thank my family. Most of all a big thank you to my parents Hans and Helga who
have always been my first support and without whom I would not have had the opportunity to
continue my studies. My gratitude also goes to my grandparents who believed and supported me.
Another big thank you goes to Peter who has been a strong support. His encouragement during
the entire period of my MBA course and especially during the dissertation period helped me to
realise this project.
vi
Abstract
Continuous developments in ICT or the challenges of globalisation are only some influences
businesses have to address and use to their advantage. To do so projects and changes are part of
the daily challenges of businesses. Lack of communication and resistance to change were
identified to influence the success of projects.
This dissertation aims to identify communication practices during change projects and their
value with regard to the success of these projects in Dublin-based tour operators.
Web-based questionnaires were sent out to tour operators to examine communication
techniques and effectiveness, employees‟ perception of lack of communication and employee
involvement in change projects. The findings of the empirical study were analysed and discussed
with regard to the hypotheses asked and the relevant literature.
The study finds that while general communication is perceived as being executed well, change-
specific information is not passed on to employees as efficient or accurate and change
communication could be improved. Furthermore it was shown that employees would like to be
more involved in company projects and changes.
Recommendations based on the primary research to improve the situation include the review of
the communication process within the company. The use of change agents, direct
communication between employees and their direct manager, and integrating employees early
in the collection of information and the decision-making process are among these
recommendations.
Finally implications for further research include the influence of cultural differences in
communication on change processes and change communication. Furthermore researching the
topic with the use of focus groups, observational studies or case studies is a recommendation for
future research.
Author‟s keywords: Change communication, project management, resistance to change, tour
operators, change in tourism
1
1 Introduction
The overall topic of this dissertation is communication during change. It evaluates literature
views on change management, the role of communication and the impact resistance to change
can have on employees, projects and companies.
Although the travel and tourism industry is such an important part of the economy and several
challenges are to be faced by the industry it is an under-researched field of study. Especially
connections between tourism and project management, and tourism and change management
exhibit gaps in a variety of areas. This dissertation attempts to help to close the research gap
concentrating on change and communication management.
The focus lies on tour operators in Dublin for a number of reasons. Firstly the author has a strong
background and interest in the tourism industry. Secondly this industry has a strong connection
with project management, the core focus of the author‟s MBA. Thirdly tour operators have not
been researched or assessed in depth yet. Fourthly the focus on companies based in Dublin
allows completing the study within the given time frame for this dissertation.
Limitations of the research are results of the restrictive time frame, accessibility of participants,
and the broadness of the topic. Therefore only tour operators in Dublin are part of this study
rather than nationwide tour operators or other types of tourism focused companies in Dublin.
Furthermore the topic „communication‟ was narrowed down to the focus on communication
during and in change processes because of the variety of topics in this area.
In the next chapters this dissertation will address current literature related and important for
the topic (chapter 2), followed by an explanation and evaluation of the methodology used
(chapter 3), and the analysis of the collected data, findings and a discussion of results (chapters
4 and 5). Lastly a conclusion and recommendations resulting of the findings will be presented
(chapters 6 and 7). A more precise introduction will be given at the beginning of each chapter.
In the following a brief introduction of the background will provide an insight on the topic,
before the overall research question, the resulting hypotheses and the research objective are
explained.
2
1.1 Background
Projects are an important part in an organisation‟s operations. Even though projects are unique,
separated from daily business at first with a definite start and ending (Project Management
Institute [PMI], 2013, p.3), they influence the daily operations and the company stakeholders,
especially its employees. As Parker et al. (2013, p.538) wrote “projects are invariably initiated
to bring about change”.
Projects are widely used to implement change in organisations (Anca, 2013, p.137) which “are
the pattern for nowadays” (Matos Marques Simoes and Esposito, 2014, p.324) rather than scarce
events.
A recent study of The Standish Group, a company which conducts research of IT projects,
showed a success rate of only 37% whereas 63% of the projects failed, or were late, over budget
and/or missed required features (The Standish Group, 2012, p.1).
One of the most challenging parts of projects includes the people who will be affected by the
project (Anca, 2013, p.137; Prosci, 2012). The challenge arises because these stakeholders face
some level of uncertainty that can lead to fear, which then can generate resistance to change
(Umble and Umble, 2014, p.17). This in the end can become the source of delays, cost increases
or the cancellation of the project (Anca, 2013, p.137). These are some reasons why resistance
has to be overcome (Umble and Umble, 2014).
Although the literature sees resistance to change as a negative „product‟ of changes (Ortiz,
2012; Umble and Umble, 2014) some authors start to point out the necessity of investigating the
reasons for resistance more closely and engage with it (Bareil, 2013; Burke, 2008, cited in Bareil,
2013, p.60; Ford and Ford, 2009; Matos Marques Simoes and Esposito, 2014; Smollan, 2011).
Involvement and communication are seen as important elements in organisational change to
minimise resistance and to reduce the possibility of failure of the project as a result of
resistance to change (Matos Marques Simoes and Esposito, 2014, p.325; The Standish Group,
2010, p.3).
Studies related to the travel and tourism industry and change are rare. Recent studies on change
focussed on the readiness to change (Lopa and Day, 2011) change management in SMEs (By and
Dale, 2008), or how sustainability or climate change effect tourism (Schwartz, Tapper and Font,
2008; Spasic, 2012; van der Duim and van Marwijk, 2006).
There are a number of research papers discussing resistance to change but empirical research
about this topic is limited (Bareil, 2013, p.61). In a specialised area of research on travel and
tourism industry it is even less (By and Dale, 2008, p.306).
3
1.2 Research Specifics
Overall Research Question
Are change projects and their processes communicated well in Irish tour operators in order to
overcome or minimise possible resistance to change and its possible negative effects on these
projects?
Research Hypotheses
The overall hypothesis is „Resistance to change of all level employees has an impact on the
change process and its outcome (overall success or failure). Effective and open communication
will minimise resistance and increase commitment to the project/change process.‟ In the
following four different hypotheses were formulated.
H1: Communication in tour operators can be improved.
H2: Employees want to be more involved.
H3: Employees are informed and updated regularly about projects/changes.
H4: Employees are informed about projects/changes before they start.
Overall Research Objectives
This dissertation study will examine how communication of projects and the changes they will
bring takes place in Irish tour operators with offices in the Dublin area, and if employees feel
included in the process to feel comfortable with the changes. This is to evaluate the employees‟
perception of lack of communication within the company and further on the possibility of
existence or generation of resistance to change.
To achieve the objectives set a project plan is followed and the advice of the supervisor is taken
into account. Focussed and efficient work is performed to present qualitative findings and
recommendations.
Research Contribution
This analysis will contribute to the literature on the importance of communication during change
processes and its influence on the success or failure of projects. Furthermore a comprehensive
analysis of literature about resistance to change will provide an insight of today‟s view on the
topic.
It will be beneficial not only for the participating companies and the travel and tourism sector
but also for people/organisations interested in change management and overcoming resistance
to change.

4
2 Literature Review
2.1 Literature Introduction
Chapter two will evaluate important and relevant literature for the present dissertation.
Over seven sections, divided according to their focus on a specific topic, the latest findings,
explanations, and studies are analysed. The connection between each topic and the research
focus on communication and change management, as well as the links between each section will
be highlighted accordingly.
The first three sections (2.2-2.4) will build an overall introduction to the topic and the last three
(2.5-2.7) will give background of the focus of the dissertation.
Firstly a section about the travel and tourism industry will give definitions of tourism and
specific tourism terms. This is followed by an outline of how tourism and project management
are connected. Lastly an overview of challenges the whole industry faced and will face is given
to show where project management and change management skills are required.
Secondly definitions and an overview of the term management and its meaning in today‟s
business environment will be given. Also the challenges faced nowadays will be pointed out.
Thirdly project management literature will be discussed to provide the reader with a background
and to initiate the topic. It will include statistics and up-to-date studies about project success
and failure rates, and success factors. Furthermore a comparison of project methodologies and
their suitability will be given in this part. Relevant topics and areas of project management will
build the end of the section to give explanations and to point out important information of
specific terms, concepts and parts of project management. This is to create a picture how these
processes can influence and are part of communication and change management.
In the next section a closer look will be taken on communication and its impact on projects. The
importance of internal communication and its influence on employee trust and engagement will
be highlighted.
The previous sections provide a preparation for the reader for the fourth part „change
management‟ where latest studies will be used to evaluate the theoretical and practical point of
view at the current state in research. Influencing factors of successful change management will
be pointed out.
The analysis of current articles and research findings about resistance to change will build the
last section of the literature review. The different positions on how to interpret resistance will
be evaluated and the methods to overcome or use employees‟ hesitance to change positively in
the company will be pointed out.
5
2.2 Travel and Tourism Industry
The travel and tourism industry represents an important part of the economy creating a big part
of a country‟s economy and providing a great amount of jobs (Hagiu and Tanascovici, 2012,
p.343; Saseanu, Dragusin and Petrescu, 2010, p.590; World Tourism Organisation (UNWTO),
2013, p.3).
This industry is very complex as it combines tourism specific products, which would not exist if
the tourist would not visit the destination, but also of tourism connected products, which
include services and products that are needed and used (mostly on a smaller scale) in a region
even if there were no tourists, e.g. public transport (UNWTO, 2014, pp.10-11).
This reveals a first connection to project management, as e.g. the successful installation of a
well working public transport system, that supplies the needs and the capacity to transport local
people at peak times to and from work, as well as the additional capacity of tourists in the peak
seasons, which needs to be planned, executed and controlled carefully.
2.2.1 Definitions
The definition of tourism was mainly influenced by the UNWTO and an early approved
characterisation was published in 1994: “The activities of persons travelling to and staying in
places outside their usual environment for less than a year, for any main purpose (leisure,
business or other personal purpose) other than to be employed by a resident entity in the
country or place visited” (cited in Candela and Figini, 2012, p.26).
In a publication of the UNWTO in 2013 tourism is defined as “a social, cultural and economic
phenomenon which entails the movement of people to countries or places outside their usual
environment for personal or business/professional purposes. These people are called visitors
(which may be either tourists or excursionists; residents or non-residents) and tourism has to do
with their activities, some of which imply tourism expenditure” (UNWTO Basic Glossary cited in
UNWTO, 2013, p.7).
Given the focus on tour operators in this dissertation these shall be defined as “(…) a firm that
organises holidays for customers, especially package holidays” („Tour operator‟, 2001)
or more specifically as a company that “buys (or owns in some cases) a high volume of travel
services across carriers, accommodation and services. These services are then assembled into
packages for purchase by the consumer. The packages are sold via travel agents (independent or
owned) or through the phone and internet” (Travel Trust Association, no date).
6
2.2.2 Tourism and Project Management
The previously mentioned tourism expenditure “refers to the amount paid for the acquisition of
consumption goods and services, as well as valuables, for own use or give away, for and during
tourism trips. It includes expenditures by visitors themselves, as well as expenses that are paid
for or reimbursed by others.” (UNWTO, 2014, p.11)
But as mentioned earlier when purchasing a tourism product not only the direct services or
products (tourism characteristic products) are bought, also the various parts of the
infrastructure of a destination (tourism connected products) are used by the buyer. For example
buildings and activity/entertainment places, roads and motorways, public transports, and water
supply, are part of the acquired holiday, trip or tour. (UNWTO, 2014, pp.10-11)
This highlights once more the strong connection of travel and tourism and project management.
A comparison of tasks from employees working in the tourism industry to the project definition
(see 2.4) shows similarities in the uniqueness and the narrow goal orientation (Lebe and Vrecko,
2014, p.363).
Furthermore Lebe and Vrecko say that “tourism has converted to one of the globally most
important project commissioners” (2014, p.364). “Superlative-destinations” like Dubai, where
complex and sophisticated engineering and architectural projects are performed successfully
and used to attract tourists; or China that plans to increase its number of hotel rooms fourfold,
resulting in 9.1billion by 2039, are given as two examples where complex project management
interferes with tourism (Lebe and Vrecko, 2014, p.364).
7
2.2.3 Changes and Challenges of the Industry
Tourism industries (including provision of accommodation, food and beverage serving activities,
passenger transportation, travel agencies, etc. (UNWTO, 2013, p.7)) had to face several big
changes and challenges in recent years. (Daniel and Rob, 2013; Hagiu and Tanascovici, 2012;
Saseanu, Dragusin and Petrescu, 2010)
One of the big topics that influences and will continue to do so in the future is e-tourism and
related topics. These are based on information and communication technologies (ICT) and the
development in the industry. At the ENTER conference 2013, the annual conference of the
International Federation for Information Technologies in Travel and Tourism (IFITT), future
innovations and influences on the travel and tourism industry were discussed. These include
augmented reality in tourism, social-local-mobile (SO-LO-MO) marketing, innovations in social
and mobile commerce, smart technologies, and others. (Daniel and Rob, 2013)
Furthermore social media is still a big topic in the industry because of its power to instantly
share views and opinions and the influence it has on customers (existing and potential ones)
(Daniel and Rob, 2013, p.273). This not only is true for hotels or restaurants, but also tour
operators. Social media makes it easy for customers to share their experience and satisfaction
with different service providers.
Furthermore a powerful and competitive environment (internal and external) makes it necessary
to strengthen the competitive advantage (Hagiu and Tanascovici, 2012, p.343) of
organisations/destinations/regions/etc. to stay attractive for customers.
Also the inter-connection of the world plays an important role in today‟s business, as crises,
unrests or other economic uncertainties can have influence not only in the country of origin of
the threat but also on the countries it does business with or even the greater world economy
(e.g. financial crisis, oil price rises, exchange rate fluctuation, etc.) (Saseanu, Dragusin and
Petrescu, 2010, pp.588-590).
All above mentioned challenges have or will lead to changes within the industry and
organisations. Therefore tourism can benefit from project management knowledge and
techniques when implementing change projects (Lebe and Vrecko, 2014, p.363).
8
2.3 Management
Before detailing the following topics the term management will be defined as it is included in
project management and sub topics, and most of all in change management. Furthermore a
closer look will be taken to the meaning of management and required skills for managers to be
successful. Through this the link to communication can be shown.
By definition management is “the process of dealing with or controlling things or people”
(Oxford dictionaries, 2014a).
Management can vary in size from an individual to multi-layered hierarchical organisation and is
installed to achieve the various goals and objectives of an organisation. Tasks of an
organisation‟s management include “planning, organising, budgeting, staffing, reporting,
directing, and coordinating” („Management‟, 2009).
Managing means “getting things done through people” (Mary Parker Follett (1868-1933) cited in
„Management‟, 2009).
To facilitate this it needs managers in different positions within an organisation. This is to
strengthen its possibilities to reach company objectives in an effective and efficient way. This
means that projects and other business actions are undertaken and completed within the
predetermined “constraints of scope, time, costs, quality, resources and risk [...]” to be
measured as successful (PMI, 2013, p.35). The managers assigned to these projects are
responsible to set actions and boundaries for their teams and employees to ensure a positive
completion.
Today‟s increased global business environment brings new challenges for managers. Different
skill sets are needed to address today‟s challenges which bring diversity in employees and create
highly technological influenced working environments. (Molinsky et al., 2012)
This is also discussed by Popescu et al. (2013) in the article „Human Resource management
practice in the hospitality and tourism industry‟ where it states that ICT and e-business
influenced the whole industry and brought both new opportunities but also new challenges.
Furthermore industry specific issues like high staff turnover, and people changing into other
sectors were mentioned. But also the variety of cultures, beliefs, languages, etc. form a
challenge for employees in the industry especially managers. (Popescu et al., 2013, pp.161-164)
9
According to an article in the Harvard Business Review successful managers in the 21st century
need to have three important skills, which also address the issues and challenges mentioned
above. These skills are “code switching between cultures, wielding digital influence, and
dividing attention deliberately” (Molinsky et al., 2012, pp.140-142).
Because communication is an important part when dealing with different cultures problems or
difficulties could arise from differences in communication styles when delegating work or giving
feedback. These are influenced by the cultural intelligence, values and beliefs of each manager.
(Molinsky et al., 2012, p.140)
Especially in tourism managers are needed, who possess this skill set as it is an industry where
locals and expatriates work together (Popescu et al., 2013, pp.161-162). Varying ways to
communicate, delegate, and execute tasks to achieve company objectives, satisfy customers,
and have a collaborating work force make the work of managers somewhat harder. To a certain
extent adaption to local behaviours or modifying the own in specific situations to adjust to
varying cultural norms is required of managers in order to be successful (Molinsky et al., 2012,
p.140).
A more detailed analysis and explanation of communication and related topics can be found in
section 2.5.
In conclusion it can be said that management nowadays is a task that requires interaction with,
and organisation of people. The purpose of management and managers is to delegate tasks to
reach achievements efficiently. Growing cultural diversity within the workforce, and a greater
influence of information technology create challenges for managers.
To reach the set company goals various ways of communication between each level of
management and its subordinates need to be used to avoid setbacks, slow-down or other
harming business developments. This will be explained further in the following sections.

10
2.4 Project Management
This part will give insights into project management and its position and importance within an
organisation. Furthermore it will set the frame concerning change management and relating
topics.
Projects are undertaken to create a unique outcome (product, service, or result), it has a
definite start and end and its impacts may outlive the project itself (Project Management
Institute [PMI], 2013, p.3). “Project Management is the application of knowledge, skills, tools
and techniques to project activities to meet project requirements” (PMI, 2013, p.5).
The management process includes but is not limited to strike a balance between project
limitations. The constraints include among other things scope, quality, schedule, budget, risks
and resources. Typically also stakeholder management is included. This is to set and meet
specified project requirements and create deliverables. (PMI, 2013, p.6)
Nowadays IT projects are the projects that have great influence on companies and their ability
to adapt to rapid developments and changes on the market. Also these are the projects that
create the most problems when companies try to increase their agility. (Stoica, Mircea and
Ghilic-Micu, 2013, pp. 64-70)
In the first CHAOS report produced 1994 by the Standish Group, a company that regularly
analyses IT projects, it is stated that 31.1% of projects will be cancelled before completion and
over 50% of projects will cost 189% of the original cost estimations. Only 16.2% of software
projects are completed on time and on budget. (The Standish Group, 1995, pp.1-2)
In the CHAOS manifesto of 2010 a success rate of 37% is shown, “the highest success rate in the
history of CHAOS research”. A project is considered successful when “delivered on time, on
budget, with required features and functions”. (The Standish Group, 2012, p.1)
Challenged projects (late, over budget, and/or with less than required features and functions)
made 42% and 21% were failed projects (cancelled prior to completion, or delivered and never
used) which showed a slight decrease compared to 2008 (The Standish Group, 2012, p.1).
The lowest percentage of successful projects was in 2000 (28%) which still represents an
improvement to the survey in the 1990s. The highest failure rate was 24% in 2008 (23% in 2000).
(The Standish Group, 2010, p.1; 2012, p.1)
The Standish Group produced 10 success factors which increase project success rates and
decrease failures. These factors are based on lessons learned and the CHAOS research. (The
Standish Group, 2010, p.2). The 10 factors did not change much from the first project success
factors published in CHAOS project 1994 (The Standish Group, 1995, p.4).
Most important points were User Involvement, Executive Support, and Clear Business Objectives
(The Standish Group, 1995, p.4; 2010, p.1). A comparison can be found in Appendix 1.
11
One of the 10 success factors in 2010 is Project Management Expertise (including project
management skills as described in the PMBoK) (The Standish Group, 2010, p.1; p.4). Therefore
an overview of different project management methods and methodologies will be given in the
next section.
Furthermore key terms, knowledge areas and process groups of project management of
relevance for this dissertation will be addressed in the following sub-sections.
2.4.1 Project Management Methods
In the project management literature and according to project management practitioners the
project management practices, tools and techniques are grouped for a better understanding and
for improved presentation in documents (Besner and Hobbs, 2012, pp.24-25).
There are two main traditional „schools‟ or methods of project management which provide
education and certification for project managers. The first to mention is the Project
Management Institute (PMI) which is the leading association for project management (PMI,
2014) and publishes the Guide to the Project Management Book of Knowledge (Guide to PMBok)
(PMI, 2013).
The second methodology is PRINCE2 (Projects IN Controlled Environments) which is primarily
used by the UK government and in the UK but also internationally recognised (PRINCE2, 2014).
Both provide knowledge and guidelines for professional project management, which will be
explained further in the following paragraphs.
There are ten Knowledge Areas and five Process Groups according to the Project Management
Institute (PMI, 2013, pp.60-61). When looking at the PRINCE2 process model (Appendix 2) it
displays seven process groups (PRINCE2, 2009). Both the Guide to PMBoK and PRINCE2 include
initiation and closing of a project. Processes before and between these are called and separated
differently (PMI, 2013, p.61; PRINCE2, 2009).
Whilst there are only three more processes, namely planning, executing and monitoring, and
controlling for the PMI, in the PRINCE2 model the first process is the starting process followed by
the direction of it before the initiating process. This is followed by controlling of project stages,
managing product delivery and managing a stage boundary before the closing of a project. (PMI,
2013, p.61; PRINCE2, 2009)
12
Although the process groups vary in number and names overall they include similar tasks and
activities, for example communications management. This is split into plan, manage and control
parts and set in the planning, executing and monitoring process groups by the PMI (PMI, 2013,
p.61). In PRINCE2 the first step is called „prepare the communication management strategy‟ as
part of the initiation process. This is then linked to processes like managing stage boundaries
and directing the project (PRINCE2, 2009).
In the end it can be said that there are overlaps and intersection with different practices and
project management standards and that the important components of projects and project
management are integrated in processes or areas in all major competency standards, which
include project management standards from “Australia, South Africa, the Association of Project
Management (APM) and the Project Management Institute (PMI)” (Besner and Hobbs, 2012, p.24).
There are alternatives to the traditional methods; one of them is the „Agile Methodology‟. This is
typically used in software development (Agilemethodology.org, no date). Differences in the way
of working with Agile can be found in the length of work cycles, evaluation processes and
addressing change in requirements. All of these areas are handled differently to support the
specific needs of software development projects. (Agilemethodology.org, no date)
More detailed information and explanations about Agile will be given in the next section 2.4.2
after the traditional project life cycle is explained and analysed.
13
2.4.2 Project Life Cycle
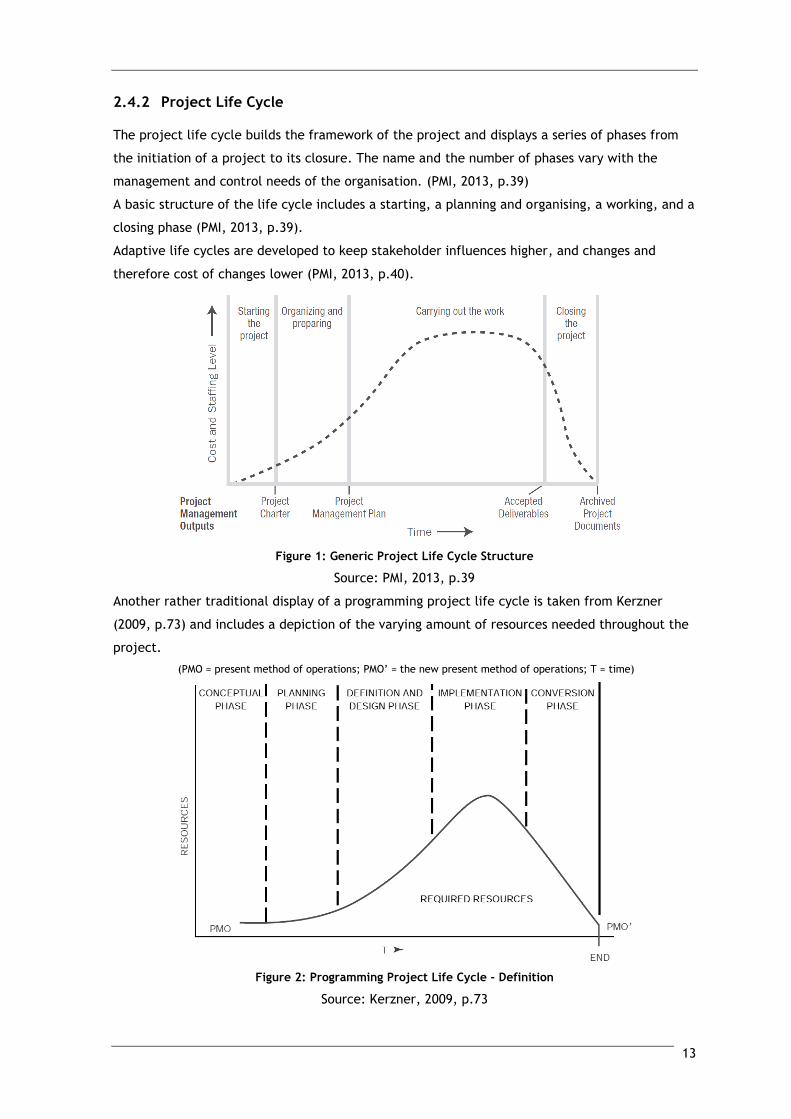
The project life cycle builds the framework of the project and displays a series of phases from
the initiation of a project to its closure. The name and the number of phases vary with the
management and control needs of the organisation. (PMI, 2013, p.39)
A basic structure of the life cycle includes a starting, a planning and organising, a working, and a
closing phase (PMI, 2013, p.39).
Adaptive life cycles are developed to keep stakeholder influences higher, and changes and
therefore cost of changes lower (PMI, 2013, p.40).
Figure 1: Generic Project Life Cycle Structure
Source: PMI, 2013, p.39
Another rather traditional display of a programming project life cycle is taken from Kerzner
(2009, p.73) and includes a depiction of the varying amount of resources needed throughout the
project.
(PMO = present method of operations; PMO‟ = the new present method of operations; T = time)
Figure 2: Programming Project Life Cycle - Definition
Source: Kerzner, 2009, p.73
14
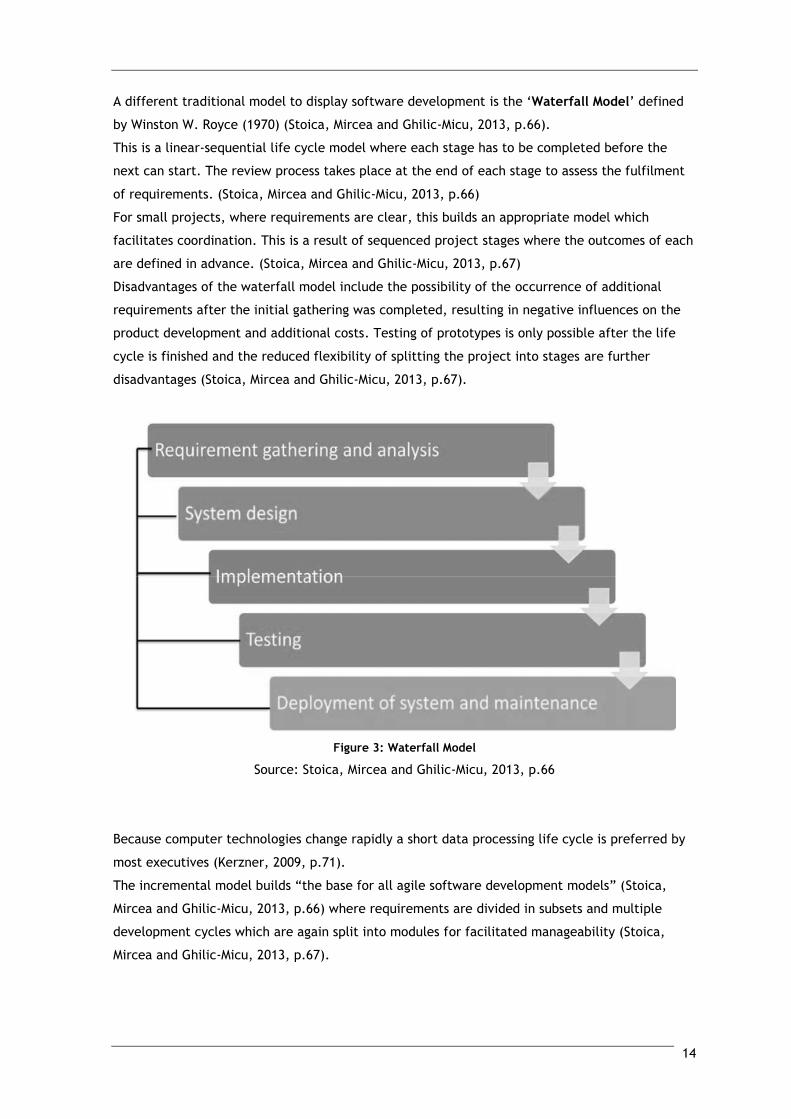
A different traditional model to display software development is the „Waterfall Model‟ defined
by Winston W. Royce (1970) (Stoica, Mircea and Ghilic-Micu, 2013, p.66).
This is a linear-sequential life cycle model where each stage has to be completed before the
next can start. The review process takes place at the end of each stage to assess the fulfilment
of requirements. (Stoica, Mircea and Ghilic-Micu, 2013, p.66)
For small projects, where requirements are clear, this builds an appropriate model which
facilitates coordination. This is a result of sequenced project stages where the outcomes of each
are defined in advance. (Stoica, Mircea and Ghilic-Micu, 2013, p.67)
Disadvantages of the waterfall model include the possibility of the occurrence of additional
requirements after the initial gathering was completed, resulting in negative influences on the
product development and additional costs. Testing of prototypes is only possible after the life
cycle is finished and the reduced flexibility of splitting the project into stages are further
disadvantages (Stoica, Mircea and Ghilic-Micu, 2013, p.67).
Figure 3: Waterfall Model
Source: Stoica, Mircea and Ghilic-Micu, 2013, p.66
Because computer technologies change rapidly a short data processing life cycle is preferred by
most executives (Kerzner, 2009, p.71).
The incremental model builds “the base for all agile software development models” (Stoica,
Mircea and Ghilic-Micu, 2013, p.66) where requirements are divided in subsets and multiple
development cycles which are again split into modules for facilitated manageability (Stoica,
Mircea and Ghilic-Micu, 2013, p.67).
15
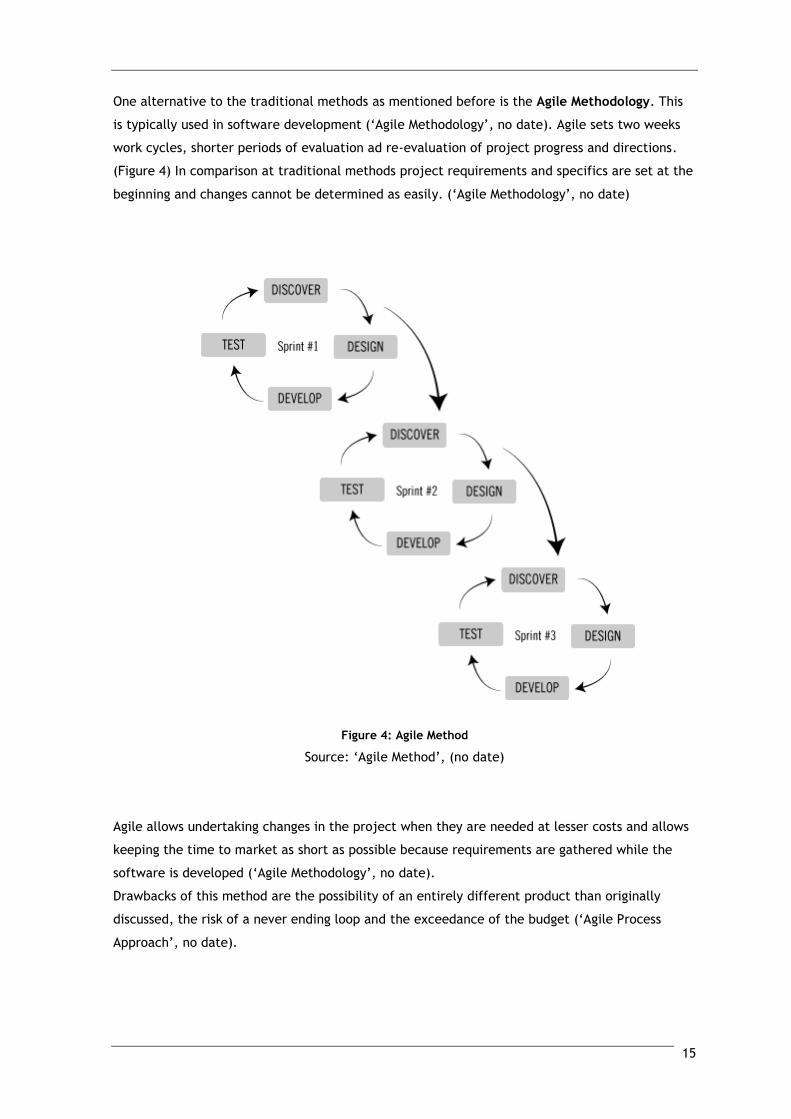
One alternative to the traditional methods as mentioned before is the Agile Methodology. This
is typically used in software development („Agile Methodology‟, no date). Agile sets two weeks
work cycles, shorter periods of evaluation ad re-evaluation of project progress and directions.
(Figure 4) In comparison at traditional methods project requirements and specifics are set at the
beginning and changes cannot be determined as easily. („Agile Methodology‟, no date)
Figure 4: Agile Method
Source: „Agile Method‟, (no date)
Agile allows undertaking changes in the project when they are needed at lesser costs and allows
keeping the time to market as short as possible because requirements are gathered while the
software is developed („Agile Methodology‟, no date).
Drawbacks of this method are the possibility of an entirely different product than originally
discussed, the risk of a never ending loop and the exceedance of the budget („Agile Process
Approach‟, no date).
16
Scrum is one of many agile software development methodologies (Stoica, Mircea and Ghilic-
Micu, 2013, p.72) and “the most popular way of introducing agility (…) [to a company] due to its
simplicity and flexibility” („Agile Methodology‟, no date).
It concentrates on projects, where initial planning is difficult and constant feedback is essential
(Stoica, Mircea and Ghilic-Micu, 2013, p.73). It further uses cross-functional, self-organising
teams including around seven people who create and adapt the processes within the scrum
framework. There are the two weeks to 30 days‟ time spans, called sprints, within which the
teams attempt to build a properly tested product. (James, 2014)
Business agility is important for companies for a “dynamic adaptation to the business
environment” (Stoica, Mircea and Ghilic-Micu, 2013, p.68).
A key element for agility is Service-Orientated Integration (SOI) which should have positive
effects on the agility of human resources, business management and information technology.
The agility of these three areas will be influenced by the organisational culture, the business
process management in the company and the decision management, like policies to raise quality
and consistency of decisions, while at “the same time lowering the time and costs associated
with the decision making process” (Stoica, Mircea and Ghilic-Micu, 2013, p.68).
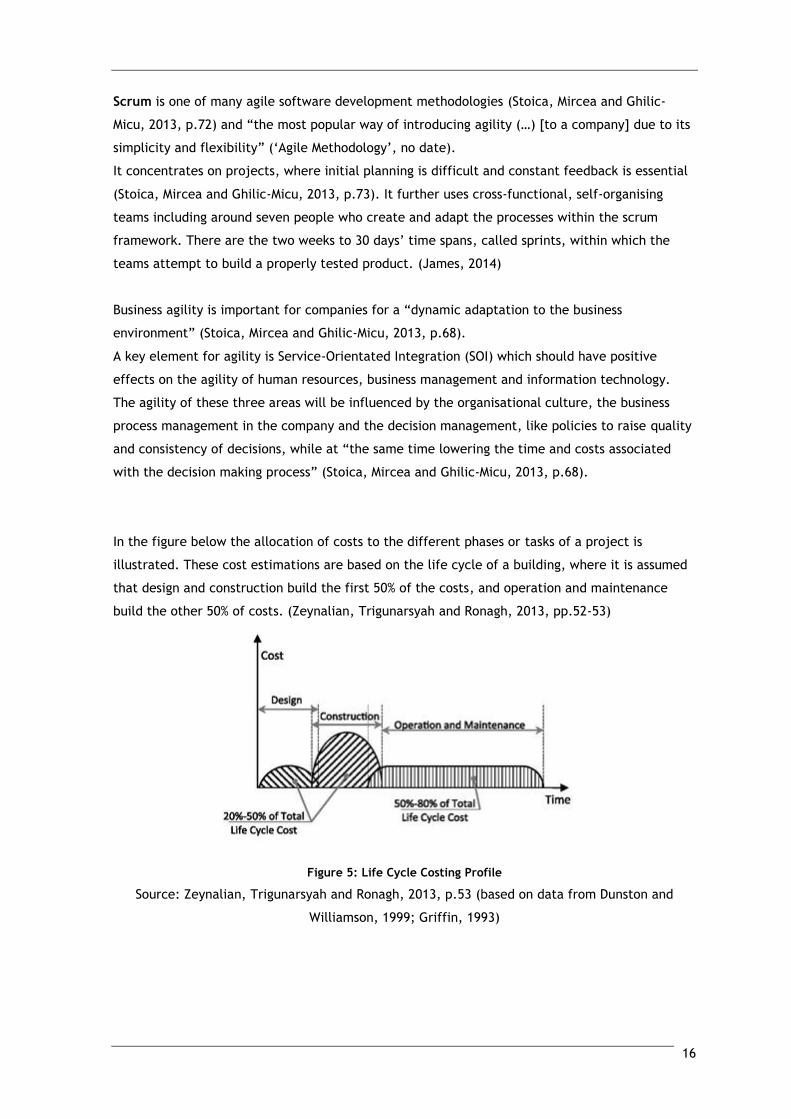
In the figure below the allocation of costs to the different phases or tasks of a project is
illustrated. These cost estimations are based on the life cycle of a building, where it is assumed
that design and construction build the first 50% of the costs, and operation and maintenance
build the other 50% of costs. (Zeynalian, Trigunarsyah and Ronagh, 2013, pp.52-53)
Figure 5: Life Cycle Costing Profile
Source: Zeynalian, Trigunarsyah and Ronagh, 2013, p.53 (based on data from Dunston and
Williamson, 1999; Griffin, 1993)

17
The allocation of costs varies with the types of projects. But what most projects have in
common is that the costs and the amount of money spent are higher in the first phases of the
project. This is because expenses have to be made for planning, organisation and procurement
at the beginning of the project to ensure resources are available in the necessary quantity and
quality at the time they are needed. (PMI, 2013, pp.355-360)
The appropriate allocation of costs through accurate planning and a change management plan
(see 2.6) is also a risk reducing procedure and necessary to keep the cost development as much
in line with the plan as possible (PMI, 2013, p.309).
Figure 6 depicts a project lifecycle in relation to costs and risks. Whereas the occurrence of risks
decrease the longer the project runs, costs to fix risk events increase drastically the more
advanced the project is (Larson and Gray, 2011, pp.211-212).
The earlier necessary amendments are identified and procedures are implemented the more
control the project team has on these. Furthermore the negative influence on the following
steps in the project is lower. (PMI, 2013, pp.309-354)
Figure 6: Behaviour of Risks and Costs in the Project Life Cycle
Source: Larson and Gray, 2011, p.212
18
2.4.3 Risk Management
Risk management should be a part of every project. It is important to review the project and its
risks regularly and continuously to be successful; also the continuous evaluation of new, changed
or out-dated risks is necessary. What types of risks a project may face varies with the type of
project. (PMI, 2013, pp.309-311; p.350)
Kutsch, Browning and Hall (2014, p.26) mention that risk management “is a reductionist,
predictive analysis that takes large problems and reduces them to smaller problems that can be
managed in isolation”. But they also point out that this approach does not work well for the
majority of projects as the complexity and uncertainties of projects increase, leading to
ineffectiveness of risk management. (Kutsch, Browning and Hall, 2014, p.26)
Project risks originate in the uncertainties present in all projects, and can be specified in known
and unknown risks, individual and overall project risks. (PMI, 2013, p.310)
Project teams should try to identify as many risks as possible, as known risks allow the planning
of responses specific to the analysed risks. If unknown the risks cannot be managed proactively
which leads to a delayed answer to possible negative risks and their influence on the project is
uncertain. Further on, the overall project risk is the uncertainty from all sources of the project
as a whole, “it is more than the sum of the individual risks within a project”. (PMI, 2013, p.310)
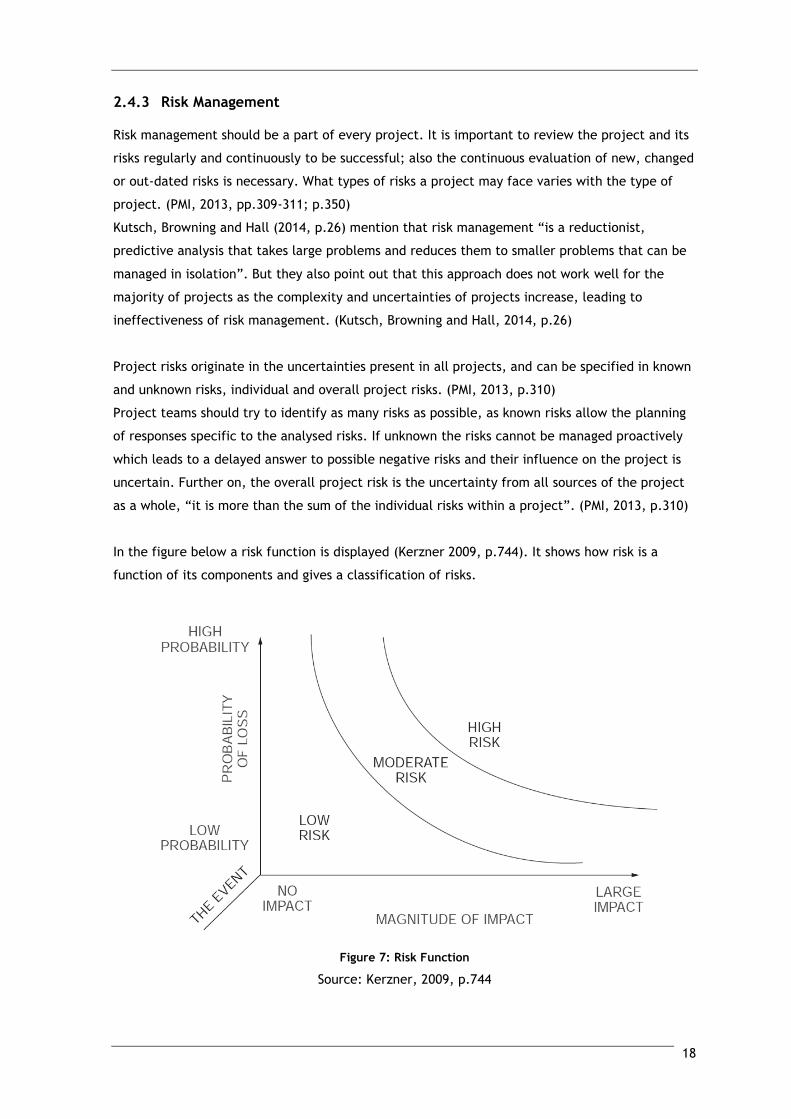
In the figure below a risk function is displayed (Kerzner 2009, p.744). It shows how risk is a
function of its components and gives a classification of risks.
Figure 7: Risk Function
Source: Kerzner, 2009, p.744
19
The following description and explanations of a risk management plan are based on the
recommendations of the PMI (2013). These also coincide with the descriptions of other project
management authors (Kerzner, 2009, pp.741-798; Larson and Gray, 2011, pp.210-234).
When compiling a risk management plan input from several sources is gathered, including
information from the project management plan, the project charter, the stakeholder register,
enterprise environmental factors, and organisational process assets (PMI, 2013, p.313).
Using different methods and techniques to analyse information, will result in a risk management
plan which states the allocation of resources, including the responsibilities of risk management
team members, as well as budgeting of assigned resources. Also the approach and timing of how
and when risk assessments will be performed throughout the project life cycle and the
specification of required activities are part of the risk management plan. Furthermore risk
probability and impact are defined in combination with project objectives, such as cost or
quality. Lastly documentation standards will be defined, e.g. how outcomes will be analysed and
communicated. (PMI, 2013, pp.316-318)
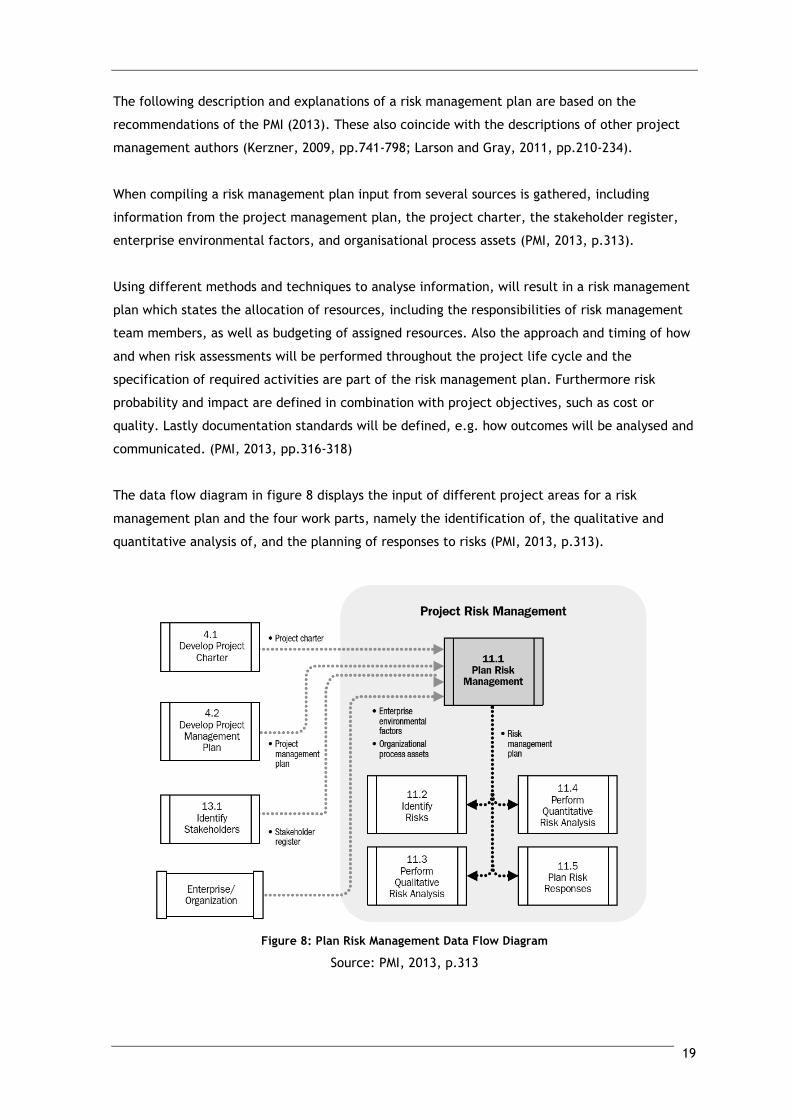
The data flow diagram in figure 8 displays the input of different project areas for a risk
management plan and the four work parts, namely the identification of, the qualitative and
quantitative analysis of, and the planning of responses to risks (PMI, 2013, p.313).
Figure 8: Plan Risk Management Data Flow Diagram
Source: PMI, 2013, p.313
20
Risks during a project can have positive influences (opportunities) and negative influences
(threats) on project objectives (PMI, 2013, p.311) and can fall in different categories; these
include internal, as well as external factors (PMI, 2013, p.310). Examples for internal risks are
the project or organisational environment, immature project management or limited resources
(PMI, 2013, p.310). External risks include events where a third party such as governmental
organisations or suppliers are involved, or influences like the market and inflation (Larson and
Gray, 2011, p.211; PMI, 2013, p.310).If the effects on objectives are negative changes may
result in amendments of project specifics, costs and/or resources, may lead to delays or even to
the cancellation of the whole project (Larson and Gray, 2011, p.211; PMI, 2013, p.310).
There are two approaches to risk management – traditional and strategic. The traditional
approach focuses on the negative impacts of risks; and actions are undertaken to reduce “the
loss frequency or loss severity” caused by “potential accidental losses” (Wieczorek-Kosmala,
2014, p.135). The strategic approach includes the possibilities of positive and negative
influences of risks. The interdependencies of risks are recognised and it values progressions in
risk analysis techniques and risk treatment techniques (Wieczorek-Kosmala, 2014, p.136).
In order to manage an organisation and projects with regard to risk (as opposed to managing risk
isolated) the International Organisation for Standardisation (ISO) recommendations (Wieczorek-
Kosmala, 2014, p.136) „ISO 31000 Risk Management‟ (Frigo and Anderson, 2014, pp.51-52) can be
followed.
The ISO recommendations are referring to the organisation as a whole (Frigo and Anderson,
2014, p.52), and the components are similar to the risk management processes for projects
recommended by the PMI (PMI, 2013, p.309). The ISO 31000 Risk Management standards are
depicted in Appendix 3 for further reference.
A third well recognised framework is the Enterprise Risk Management – Integrated Framework
(ERM). It was issued by the Committee of Sponsoring Organisations of the Treadway Commission
(COSO), an internationally recognised body of thought leadership (Frigo and Anderson, 2014,
p.51).
All three organisations see communication, consultation, and information as an important part of
risk management (Frigo and Anderson, 2014, pp.51-52; PMI, 2013, p.290, p.313; Wieczorek-
Kosmala, 2014, p.136).Also Kutsch, Browning and Hall re-quote that “inadequate integration of
stakeholders into risk management activities” can lead to ineffectiveness (Hubbard, 2009 and
Nelson, 2007 cited in Kutsch, Browning and Hall, 2014, p.26).
Despite which approach on risk management is taken within a company, these should only be
seen as frameworks, and practices should be adapted to the needs of each organisation.
Furthermore a clear risk management strategy should be developed. (Frigo and Anderson, 2014,
p.53)
21
Regular risk analysis is important. The risk management plan and its‟ items should be up-to-date
throughout the project life cycle. In order to manage this several tools and techniques can be
applied. One of these is meetings, which should take place regularly and where risks should be a
fixed point of the agenda. (PMI, 2013, p.352)
Two further processes can influence the successfulness of risk management. These are project
communications management and project change management.
Firstly communications management includes planning, managing and controlling
communications in a project. It is important to integrate all stakeholders of the project in the
risk communication. The group of stakeholders include “persons and organisation such as
customers, sponsors, the performing organisation, and the public who are actively in the
project, or whose interests may be positively or negatively affected by the execution or
completion of the project” (PMI, 2013, p.394).
Secondly effective communication can build a bridge between stakeholders with different
backgrounds, levels of knowledge and expertise, and interests (PMI, 2013, p.287).
A communications plan includes what information needs to be shared with whom and at what
time and in which format. This builds the organisational framework for communication during
the whole project, and ensures that information is “distributed to stakeholders based on their
requirements”. (Larson and Gray, 2011, p.643)
Similar a project change management plan is critical as it is part of the risk response control to
new risks, which require changes in the scope, the budget, and/or the schedule of the project
(Larson and Gray, 2011, p.229).
The change control process includes a submission of a formal change request after the change
originated. This will then be reviewed and after approval the plan of record will be updated and
the necessary actions will be undertaken. (Larson and Gray, 2011, p.231)
The importance of effective communication and change management will be discussed further in
the following sections. It was already shown that the costs to react to a risk and apply changes
increase the later they have to be implemented in the project life cycle (figure 6).

22
2.4.4 Stakeholder Management
Stakeholders and their roles in a project are critical for its success; this was already pointed out
in previous sections. This part focuses on stakeholders and their influences on projects.
Stakeholders are defined as “an individual, group, or organisation who may affect, be affected
by, or perceive itself to be affected by a decision, activity, or outcome of a project” (PMI, 2013,
p.30). The expectations of each stakeholder might not only differ but often also conflict with
each other (PMI, 2013, p.32).This can cause problems regarding the achievement of project and
organisational objectives. Stakeholder management and project governance are therefore an
important part of project management. (PMI, 2013, p.30)
Project stakeholders do not only include project sponsors, project managers and members of the
project team also users (employees or customers), business partners and other managers in the
organisation are stakeholders (PMI, 2013, p.31).
The levels of responsibility and authority vary, and also the involvement of different
stakeholders throughout the project life cycle differs. Continuous assessment of stakeholders
regarding their identification, the degree of influence and their attitude towards the project is
necessary throughout the project life cycle. (PMI, 2013, p.31)
Stakeholders can influence a project both positive and negative. Therefore it is necessary to
manage stakeholders and their needs and expectations to avoid changes in interests and the
degree of influence that may affect the success of the project negatively. Omission of
continuous stakeholder assessment can result in negative outcomes ranging from project delays,
and cost increases to project cancellation. (PMI, 2013, p.31)
As already mentioned at the beginning of this chapter „User Involvement‟ is the most important
factor to influence the success of a project (The Standish Group, 2010, p.1).
To ensure the continuous assessment of the position of stakeholders, communication with all
stakeholder groups and within the project team is necessary to be up-to-date regarding the next
project steps, changes, and developments.
The importance of communication will be explained in depth in the next section.
23
2.5 Communication
One definition of communication is “the imparting or exchanging of information by speaking,
writing, or using some other medium” (Oxford dictionaries, 2014b).
Communication itself can build a risk for projects and changes because of the different ways of
communicating and the impact of cultural differences reflected in “values, perceptions and
attitudes” on communication (Yüksek and Bekmeier-Feuerhahn, 2013, p.180).This was already
pointed out as one of the challenges for today‟s managers (section 2.3) but also for all
stakeholders involved.
Already in 2006 a study found that work environments where employees “trust the people they
work for, have pride in what they do and enjoy the people they work with” foster a positive
atmosphere and satisfied employees (Carroll, 2006). According to Mishra, Boynton and Mishra
(2014, p.184) this is attributed to “open communication” within an organisation. In a more
recent survey openness and trust are again mayor criteria for job satisfaction (Smith, 2013). It is
stated that “consistent communication” is one important part of why people want to work in the
organisation (Zupan 2013, cited in Smith, 2013).
Internal communication in the work place is important. It can be defined as “the communication
between the organization‟s leaders and (…) the employees” (Dolphin, 2005, cited in Mishra,
Boynton and Mishra, 2014, p.185).
Open internal communication will lead to employee trust and further on to employee
engagement (Mishra, Boynton and Mishra, 2014, p.184). Engagement is necessary for the
employees to create an ownership of their responsibilities in their company and to deliver a
consistent message to customers. This means that every customer receives the same message no
matter which employee he/she gets in contact with (Mishra, Boynton and Mishra, 2014, p.184).
This refers to all stakeholders the company might have.
It is important that internal and external communication send the same message and are not
“created in silos” (Mishra, Boynton and Mishra, 2014, p.185).
Whereas employees can be seen only as receivers of internal communication (Dolphin, 2005,
cited in Mishra, Boynton and Mishra, 2014, p.185) Mazzei (2014) gives a different point of view.
It is stated in the article about internal communication and employee enablement that
employees were not only receivers of internal communication. They are able to be actively
senders and exchangers of the internal communication. This enables employees to create
knowledge and resources, which are of importance for the company. (Mazzei, 2014, pp.82-83)
24
Realising that internal communication is not only a one way communication from top to bottom
to pass on information or to delegate work, but more a two way communication or the support
and exchange of communication, will assist the company to create valuable competitive
advantages. (Mazzei, 2014, p.83)
This includes a growing knowledge pool for the whole company and supports employees in
decision making.
As Rubin (2013, p.37) stated: “Learning not only involves avoiding past mistakes, but also
emphasises replication of past success – skills contained within a branch of knowledge
management known as lessons learned”.
By communicating company practices and creating documents like lessons learned reports or a
database with templates and process descriptions and making these available for employees at
all levels, companywide learning and standardised procedures will be implemented. Also
minimising of mistakes and reducing the undertaking of unnecessary risks when making business
decisions can be outcomes the implementation of lessons learned reports and other internal
communication. Not only does this save the company time and money, but also the employee
knows where to find a guideline to work and react according to company standards. Therefore
he/she can make advanced decisions and does not risk his/her position. (Rubin, 2013)
Beside the advantages of open internal communication regarding daily business operations and
decision making (use of templates, lessons learned reports) there are also advantages when
major changes in the business environment (internal and external) occur or when projects need
to be undertaken that have not been done before in a company.
When facing major changes and big projects where employee engagement and agreement is
essential communication and involvement from the beginning is essential. Systematic
communication is seen as crucial from researchers, as well as from practitioners (Yüksek and
Bekmeier-Feuerhahn, 2013, p.181). User involvement should take place in the “decision-making
and information-gathering process (…) including feedback, requirements review, basic research,
prototyping, and other consensus-building tools” (The Standish Group, 2010, p.3).

25
Internal communication is able to inform employees and help to create trust, commitment and
involvement; some authors say that this is not enough during severe change processes. Change
communication needs to be practiced to reach out to the emotional level of employees, because
change is realised when behaviour changes and when employees show positive affective
reactions to change. (Mazzei and Quaratino, 2013, p.168; Yüksek and Bekmeier-Feuerhahn,
2013, pp.181-182)
When comparing articles about change management and communication during change some
authors give the term “internal communication” the same meaning and power to influence
employees during change as “change communication” as it is seen by Yüksek and Bekmeier-
Feuerhahn (2013, p.180).
If employees face unknown situations there is a tendency to build a resistance to change and
show passive behaviour in order to be able to deal with the consequences on their daily tasks. An
open two way communication is therefore necessary to give employees “the possibility of
sharing a common point of reference” when there is the uncertainty of change. (Mazzei and
Quaratino, 2013, pp.174-176)
Beside communication, the adoption of change management with emphasis on participation is
important for successful change processes and projects, which furthermore ideally also reduces
resistance to change and enhances the support from employees for planned changes (Mazzei and
Quaratino, 2013).
The following two sections will discuss change management and resistance to change in detail to
evaluate the necessity and advantages of change management and to point out which issues
companies can face when resistance to change occurs and is not dealt with.
26
2.6 Change Management
The definition of change according to the Oxford dictionary of English is: “an act or process
through which something becomes different” or as a verb “(1) make or become different (2)
take or use another instead of” (Oxford dictionaries, 2014c).
“Change is inevitable and necessary to succeed” (Quiros, 2014, p.15) and “is no longer
happening sparsely, but (…) the pattern of nowadays” (Matos Marques Simoes and Esposito,
2014, p.324).
The human transition to change is however a complex procedure and it is important that
employees receive help to transform to reach a positive adaption of change (Quiros, 2014,
pp.15-16).
Change management “is the utilisation of processes to control an organisational change effort”
(Parker et al., 2013, p.535).
It can be found in different actions an organisation undertakes to fundamentally improve its
business operations to meet the demanding environment developments. These actions include
total quality management, restructuring or rightsizing, or organisational cultural change, and
others. (Parker et al., 2013, p.535).
Change management is identified as a process rather than a single event (Parker et al., 2013,
p.535) and an understanding of these processes to manage change is important to be able to
react to uncontrollable change of the external environment of an organisation (Parker et al.,
2013, p.537).
A high failure rate of “change interventions” suggests that there is a lack of management,
monitoring and control (Parker et al., 2013, p.542). Studies also found that employees oppose
change initiatives because of the possible shift in power structures and a change in the
established way of working (Battilana and Casciaro, 2013, p.62).
According to Mazzei and Quaratino (2013, p.168) change management can only be effective
when behaviours of members change.
And the CHAOS research of the Standish Group shows that a lack of involvement increases the
possibility of a failure (The Standish Group, 2010, p.3).
There are different ways in the literature which according to their authors improve and help
successful change.
One says communication is the key-element for successful change (Matos Marques Simoes and
Esposito, 2014, p.325). Top-down commitment and open communication is important. This
should create an environment where people have the possibility to exchange their thoughts and
can build up trust and commitment to upcoming changes (Mazzei and Quaratino, 2013).
27
Also Battilana and Casciaro (2013) recognise the importance of communication but use “change
agents” to transform change ideas to successful change initiatives. The importance of these
people in the informal network of an organisation was found to be the most influential on other
employees and to conciliate them towards the suggested change projects. (Battilana and
Casciaro, 2013, pp.64-65)
Mazzei and Quaratino recommend some principles for communication in a change process. These
are: “Communication should reach all employees, be interactive, transparent and complete,
without avoiding the mention of difficulties, (...) [furthermore it should] be continuous,
supported by actions, future orientated and centred on values” (2013, p.174). Additionally the
research showed that an intensive listening phase at the beginning brings multiple advantages
and helps to successfully adapt the change process (Mazzei and Quaratino, 2013).
Similarly Quiros (2014, p.15-16) gives some tips to facilitate the transition and adaption to
change for employees which again emphasises open communication.
He highlights the importance of informing employees directly (or through direct manager) and to
ensure that employees will learn about the change from an official statement or announcement
within the company and not through media or rumours. This will keep trust and avoids
speculations. Furthermore explanations of the reasons behind and the necessity of changes
should be explained to the employees to support their transition to acceptance of change. Also
the critical processes need to be highlighted to ensure the control on these is as high as possible
and impacts that could change these as low as possible. Lastly a respectful interaction is
necessary to give employees the chance to adapt to the new possibilities arising from the
intended change. (Quiros, 2014)
Yüksek and Bekmeier-Feuerhahn (2013) draw the attention to the influence of various cultural
dimensions (as identified by „Geert Hofstede‟, 2009) whereas individualism/collectivism (IC),
power distance (PD) and uncertainty avoidance (UA) are said to have the biggest influence on
communication through values, behaviour and attitude. As a result communication objectives
have to be adjusted accordingly. For example the creation of trust is a priority in cultures with
high PD and where collectivism is predominant. In individualistic cultures the generation of
commitment is the most important communication objective due to the relatively lower tie to
the company. Lastly the objective of communication in a culture with high UA is reducing
uncertainty for employees through transparency and clarity of the change objectives and
processes. (Yüksek and Bekmeier-Feuerhahn (2013, pp.184-186)
28
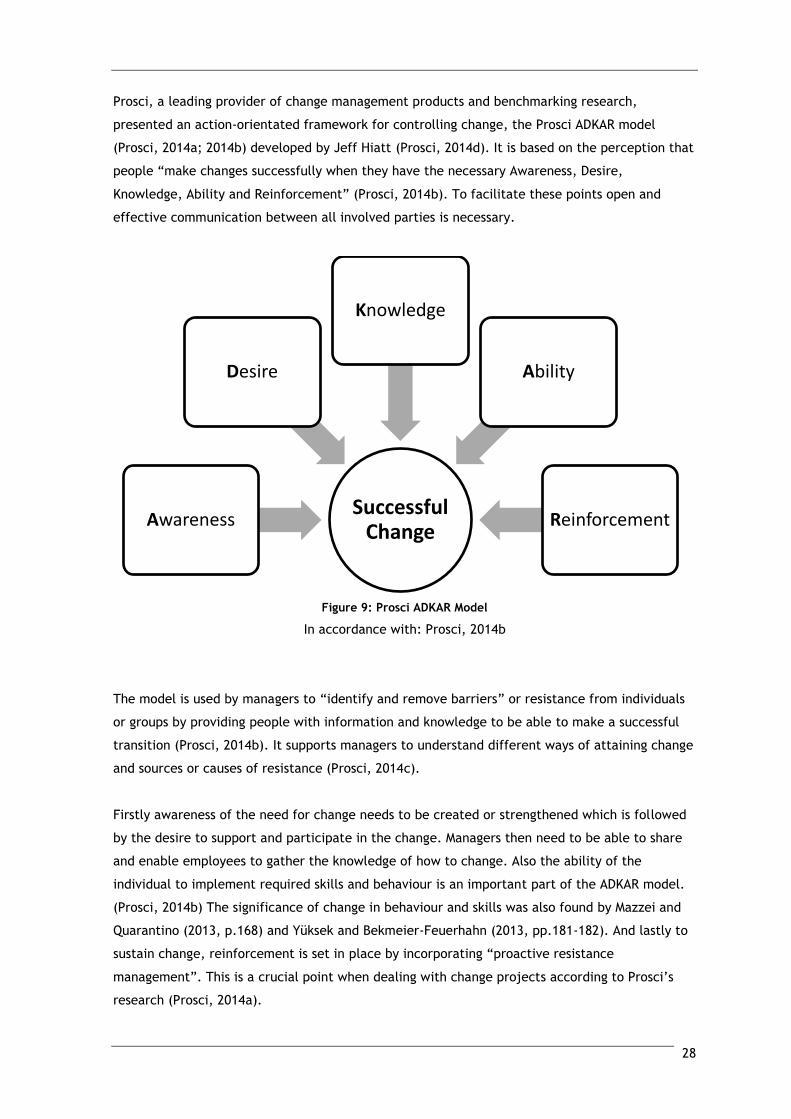
Prosci, a leading provider of change management products and benchmarking research,
presented an action-orientated framework for controlling change, the Prosci ADKAR model
(Prosci, 2014a; 2014b) developed by Jeff Hiatt (Prosci, 2014d). It is based on the perception that
people “make changes successfully when they have the necessary Awareness, Desire,
Knowledge, Ability and Reinforcement” (Prosci, 2014b). To facilitate these points open and
effective communication between all involved parties is necessary.
Figure 9: Prosci ADKAR Model
In accordance with: Prosci, 2014b
The model is used by managers to “identify and remove barriers” or resistance from individuals
or groups by providing people with information and knowledge to be able to make a successful
transition (Prosci, 2014b). It supports managers to understand different ways of attaining change
and sources or causes of resistance (Prosci, 2014c).
Firstly awareness of the need for change needs to be created or strengthened which is followed
by the desire to support and participate in the change. Managers then need to be able to share
and enable employees to gather the knowledge of how to change. Also the ability of the
individual to implement required skills and behaviour is an important part of the ADKAR model.
(Prosci, 2014b) The significance of change in behaviour and skills was also found by Mazzei and
Quarantino (2013, p.168) and Yüksek and Bekmeier-Feuerhahn (2013, pp.181-182). And lastly to
sustain change, reinforcement is set in place by incorporating “proactive resistance
management”. This is a crucial point when dealing with change projects according to Prosci‟s
research (Prosci, 2014a).
Successful Change
Awareness
Desire
Knowledge
Ability
Reinforcement
29
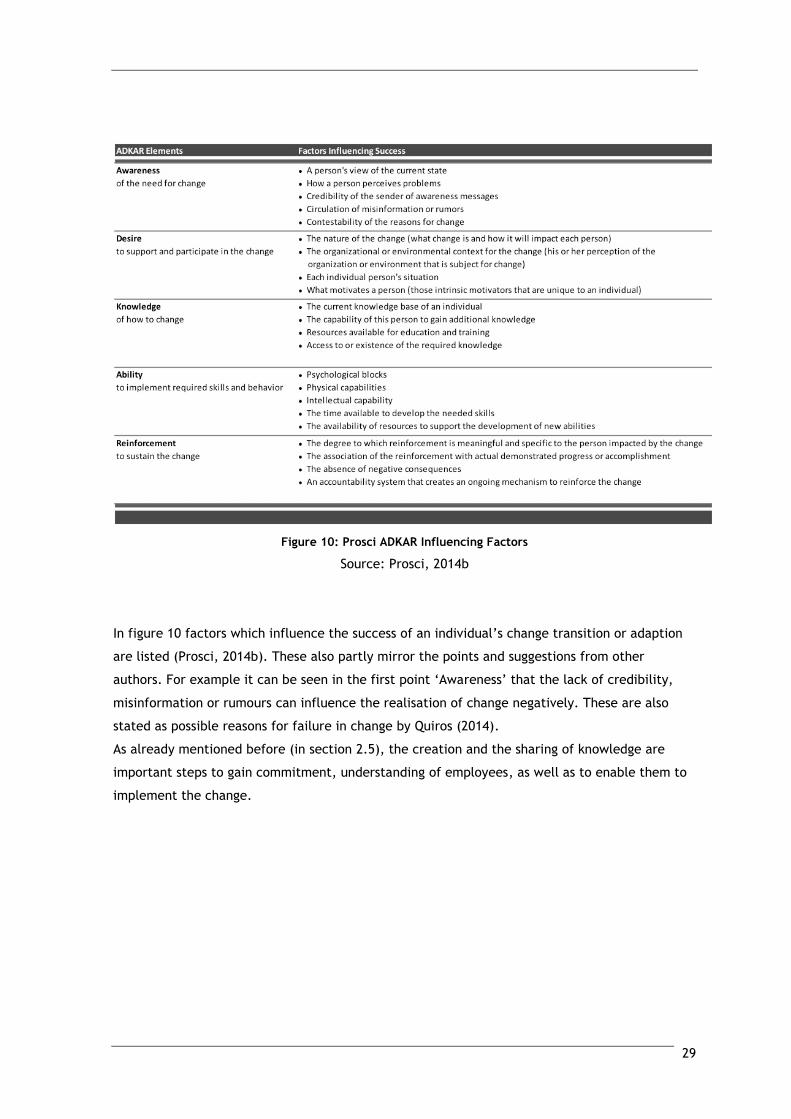
Figure 10: Prosci ADKAR Influencing Factors
Source: Prosci, 2014b
In figure 10 factors which influence the success of an individual‟s change transition or adaption
are listed (Prosci, 2014b). These also partly mirror the points and suggestions from other
authors. For example it can be seen in the first point „Awareness‟ that the lack of credibility,
misinformation or rumours can influence the realisation of change negatively. These are also
stated as possible reasons for failure in change by Quiros (2014).
As already mentioned before (in section 2.5), the creation and the sharing of knowledge are
important steps to gain commitment, understanding of employees, as well as to enable them to
implement the change.
30
Other authors find that project management and a project-based management are adopted
nowadays to maintain flexibility to construct solutions promptly to market/environment changes
and requirements. (Parker et al., 2013) Whereby the definition of „project‟ initiates that it is
undertaken to change the current state of a product/service/organisation/etc. into a more
successful state in the future through fulfilling a clearly stated outcome, by using project
management tools and techniques, and with assigned resources. (Parker et al., 2013, p.538)
Parker et al. (2013) focused on three frameworks of change management (Kanter, Stein and
Jick, 1992; Kotter, 1996; Luecke, 2003) and identified where project management tools and
techniques could contribute to the value of change processes. (Appendix 4)
There are several similarities between the three frameworks itself and compared to the Guide to
PMBoK. For example creating a vision and strategy are first important steps of the three
compared frameworks also communication and implementing structures and systems to enable
employees are steps and processes in the four compared frameworks. (Parker et al., 2013,
p.536)
Whereas measurement of the project success is only part in later frameworks like the “Seven
Steps” (Luecke, 2003) or the PMBoK (PMI, 2013), Kanter, Stein and Jick‟s (1992, cited in Parker
et al., 2013, p.536) “Ten commandments for executing change” does not include measurement
at all. Involvement and communication are the focus of this framework.
In conclusion it is to say that change management developed further in the last decades and is to
continue to be an interesting and evolving field of study; especially in combination with project
management theories.
This means, as well as project management could add value to change management processes,
change management could also improve parts of project management. Because project
management focuses on the management tasks, the application of change management could
improve “soft” issues related to projects, such as human, political or organisational change.
(Parker et al., 2013, p.541)
Although Parker et al. (2013) conclude that the different foci of project management (technical)
and change management (human aspects and softer skills) were results on their background and
by combining these two disciplines the gap could be closed, the developed and improved project
management education and literature was not taken into account (e.g. increased focus and
recognised value of stakeholder management in the Guide to PMBOK in edition 5, PMI, 2013).
31
2.7 Resistance to Change
The Resistance to change is commonly related to change management. It is a popular topic in
the literature, but less empirically researched (Bareil, 2013, p.61).
The way people react to change can be positive or negative. The optimistic reaction leads to
support, commitment and the predisposition (receptivity) for change. On the contrary people
reluctant to change might react with stress, withhold information, or take actions that aim to
keep the status quo. (McKay, Kuntz and Näswall, 2013, p.30)
One definition of resistance is: “opposition or insubordination that issues from relationships of
power and domination” („Resistance‟, 2004).
Another definition of resistance to change would be the “in-built opposition to change within an
organisation. (…) It is said to be a natural human reaction to the unknown” („Resistance to
change‟, 2014). This is coherent with most studies of resistance to change (Bao, 2009; Chen and
Chen, 2008; Lawrence and Robinson, 2007, cited in Bareil, 2013, p.61).
Resistance can be shown from all employment levels of the organisation. The management might
be hesitant to implement new ideas which bring change not only because of the risk of failure
and the loss of money, time and/or other opportunities, but also because failed initiatives
decrease motivation and lower the willingness to actively participate in future change projects
(Umble and Umble, 2014, p.18).
Employees at other positions might show resistance because of the uncertainty of the influence
changes might have on their work, their position, the power distribution within the company or
similar (Umble and Umble, 2014, p.18).
Negative implications for the change within the organisation can include doubts regarding the
change, sabotages and opposition, actions to retain the current situation and similar (McKay,
Kuntz and Näswall, 2013, p.30).
Bareil (2013) sees a need for a shift in the way resistance to change is seen. A more positive
approach to this resistance is necessary and not only the negative, passive side. The modern
paradigm of resistance should be interpreted as “an ambivalence, a resource, a concern or a
preoccupation that represents feedback of discomfort about the change initiative” (Bareil, 2013,
p.62). In Appendix 5 the traditional and the modern interpretation of resistance to change are
compared.
32
Also other authors say that resistance to change can be used to open a dialogue between the
affected parties (Matos Marques Simoes and Esposito, 2014) and to understand it as “feedback
(…) [to improve] the quality and clarity of the objectives and strategies at the heart of the
change proposal” (Ford and Ford, 2009, p.103).
As mentioned in earlier sections (2.5 and 2.6) communication is an important part of change
management (Matos Marques Simoes and Esposito, 2014, p.325) and for overcoming or using
resistance to change respectively, depending on the interpretation. Building awareness of why
change is needed and how individuals are affected by it is vital (Prosci, 2012). Searching for a
dialogue with stakeholders, especially employees, is necessary to find sources of resistance at an
early stage. By evaluating the type of resistance and understanding the concerns will not only
help to facilitate more rapid commitment to change (Bareil, 2013, p.65) but can also reveal a
different angle of the process or flaws in the change plan.
In contrast to Bareil the latest Prosci report presented that the primary obstacle of change
management was “ineffective change management sponsorship from senior leaders” followed by
“insufficient change management resourcing” (Prosci, 2012). Resistance to change from
employees and middle-management resistance were only the third and the fourth greatest
obstacle in the 2012 reports (Prosci, 2012).
Nevertheless is resistance to change a big hindrance when implementing change initiatives and
its power of impact should therefore not be underestimated.
Difficulties may arise when communication and exchange cannot take place in an environment of
“trust and collaboration” (Bareil, 2013, p.67). Furthermore if fast action is required or cost of
communication is too high the more traditional paradigm should be applied, where overcoming
or eliminating resistance is a priority. This according to Bareil (2013, p.67) should only happen if
the modern, open, communicative way does not work.
To overcome resistance it can be useful to point out consequences of a resistant behaviour
towards upcoming change on individual, group or organisational performance (Bareil, 2013,
p.68). New and strict guidelines of what behaviours can and will be accepted and what will
result in disciplinary actions. This will “send a powerful signal to the organisation about the
seriousness of this change and that resistance will not be tolerated” (Prosci, 2010; cited in
Bareil, 2013, p.68).
33
To conclude resistance to change is likely to appear during change processes in a company. Signs
of resistance can range from passive behaviour or slow reaction to change to sabotaging change
initiatives. This means delaying processes, declining proposed change initiatives or keeping
important information to oneself. (McKay, Kuntz and Näswall, 2013, p.30)
Different authors suggest to not only interpret resistance as negative and against change, they
rather suggest using it as feedback to improve change decisions and outcomes (Bareil, 2013;
Ford and Ford, 2009; Matos Marques Simoes and Esposito, 2014).
Open communication and support for employees to understand the projected outcomes and aims
of the change (McKay, Kuntz and Näswall, 2013, p.37), and to help them to adapt to the change
are methods to overcome or reduce resistance to change (in the traditional interpretation). In
the modern interpretation the use of feedback generated from discussions arising from
resistance to change is recommended. (Bareil, 2013)
34
2.8 Literature Conclusion
In conclusion it can be said that projects involve change, either for the whole organisation,
single departments or individuals. Whenever changes are happening in organisations one can
expect some sort and degree of resistance to change from stakeholders. Mostly employees or the
middle-management show resistance (Prosci, 2012).
With changes and challenges in the tourism industry (Daniel and Rob, 2013; Hagiu and
Tanascovici, 2012; Saseanu, Dragusin and Petrescu, 2010) a number of projects can be expected
to be initiated to keep competitive advantages and to be able to follow market developments
and customer needs.
Changes in the tourism industry can be expected from the continuing influence e-tourism and
ICT have (Daniel and Rob, 2013). Furthermore communication was identified especially to be a
challenge for people working in the industry because of variety in cultures and the influence
culture has on communication objectives (Yüksek and Bekmeier-Feuerhahn, 2013).
Different communication styles and expectations were also identified as one of the big
challenges faced in the daily operation of managers in any industry (Molinsky et al., 2012;
Popescu et al., 2013).
To increase the chance of project success excellent project management and the use of the
appropriate methodology are needed. Important success features are user involvement, clear
objectives, communication, and management support. (Matos Marques Simoes and Esposito,
2014, p.325; Prosci, 2012; The Standish Group, 2010)
Furthermore resistance was recognised as an influencing factor on project success. To avoid
harmful effects of resistance certain actions need to be taken. Depending on the interpretation
of resistance these differ.
When dealing with resistance in a traditional way, the goal is to help employees to overcome
and further on to eliminate resistance. In a modern paradigm, where resistance is seen as an
opportunity to get feedback, communication in dialogues from the earliest stage of the change
project is only one way to use it and to produce positive outcomes. (Bareil, 2013)
Despite which way of dealing is used it is important to identify those employees who show
resistance early and to deal with it before it affects the successful realisation of the project.
35
3 Methodology
3.1 Methodology Introduction
The following chapter will discuss details about the research design, data collection instruments
and analysis, as well as limitations of the applied methodology.
In the first section „Research Design‟ the applied research philosophy will be explained and
evaluated. Followed by an explanation why a deductive research approach was undertaken
rather than an inductive.
Thereafter the research strategy is outlined and the time frame of the study is explained.
In section 3.2.5 the theoretical background of the selecting process of participants is outlined.
In the last part research ethics including their importance and influence on research studies will
be discussed.
The second main section „Data Collection instrument‟ will give detailed information about the
data collection, including reasons for using web-based questionnaires, as well as advantages and
disadvantages of the used method.
Lastly the limitations of used the methodologies will be explained and an outline of how to
overcome these limitations is given.
36
3.2 Research Design
3.2.1 Research Philosophy
In order to apply the right philosophy to the research situation the necessity of applying more
than one research philosophies was found.
With regard to the ontology aspect of the research topic a subjectivist position describes the
author‟s assumptions about the way the world operates. With regard to this study it is believed
that employees, who are the research participants, have different interpretations of situations
they find themselves in. (Saunders, Lewis and Thornhill, 2009, pp.110-112)
Furthermore the subjectivist view of organisational culture, as described by Saunders, Lewis and
Thornhill (2009, p.111) is congruent with the authors perception of culture and its creation and
change respectively.
An interpretive and critical realism approach is applied. This is firstly seen appropriate because
of the inclusion of the strong focus on people in this dissertation research. Secondly these
approaches recognise that there are multiple realities that impact success or failure of change
processes in companies. (Collis and Hussey, 2014, pp.44-45; Saunders, Lewis and Thornhill, 2009,
pp.114-119)
Interpretivism recognises that people and their interpretation of situations are differently. Also
it recognises the existence of bias through the background of the author and the influence on
the interpretation of a situation. (Blumberg, Cooper and Schindler, 2008, p.21; Collis and
Hussey, 2014, pp.46-47) Interpretivism is seen to be suited to research the social or human
elements of business (Bryman and Bell, 2003, p.15). Furthermore features of interpretivism
include “small samples; have a natural location; produce „rich‟, subjective, qualitative data”
(Collis and Hussey, 2014, p.50).
The inclusion of critical realism is seen as important as this research philosophy understands that
the “knowledge of reality is a result of social conditioning and cannot be understood
independently of the social actor involved” (Saunders, Lewis and Thornhill, 2009, p.115).
Furthermore it recognises that the social world is constantly changing and the difficulty of
understanding it completely (Saunders, Lewis and Thornhill, 2009, p.115), but that it is possible
to get a reasonable understanding.
The positivist approach implies that objective facts need to be collected to observe the social
world and that this world consists of and can be reduced to simple elements (Blumberg, Cooper
and Schindler, 2008, p.20; Collis and Hussey, 2014, p.43). Because of these assumptions and the
understanding of the author that social sciences, in contrast to natural sciences, need a
different research philosophy a positivist approach is not used for this research.
37
3.2.2 Research Approach
The dissertation study falls into the category of „basic research‟, which means it contributes to
“general knowledge and theoretical understanding” and builds the “most academic form of
research” compared to „applied research‟ which intends to solve one specified problem (Collis
and Hussey, 2014, pp.6-7).
Two types of research approaches could be undertaken when developing a study, deductive and
inductive (Saunders, Lewis and Thornhill, 2009, pp.124-129).
In present dissertation the undertaken research approach is deductive. It follows the process of
deduction which is „Theory – Hypotheses – Data collection – Findings – Hypotheses confirmed or
rejected – Revision of Theory‟. On the basis of theoretical knowledge of the researched area,
hypotheses will be deducted. (Bryman and Bell, 2003, pp.9-11) This is followed by a research
strategy which is designed to test the hypotheses (Saunders, Lewis and Thornhill, 2009, pp.124-
129).
An inductive approach does not seem appropriate as quantitative data will be collected after the
theoretical background and framework is explored and evaluated. Furthermore given the
timeframe of the study an inductive approach seems not to be suitable as this approach
generally takes more time and flexibility in scheduling. (Saunders, Lewis and Thornhill, 2009,
pp.124-129)
Lastly the deductive approach is applied rather than the inductive approach because of the
relatively low research experience of the author.
38
3.2.3 Research Strategy
The adapted research strategy is a survey and is used to answer the research question and meet
the research objectives.
The overall research question is: “Are change projects and their processes communicated well in
Irish tour operators in order to overcome or minimise possible resistance to change and its
possible negative effects on these projects?”
And the research objectives include the examination of the use of communication to include
employees in projects and changes, the perception of employees of the quality of
communication in their company, and the possible existence of resistance to change.
A survey allows the collection of large data in an economical way and can then be quantitatively
analysed. Furthermore it allows working independently with the collected data, and the analysis
can be conducted with analysis software like IBM SPSS. (Saunders, Lewis and Thornhill, 2009,
p.144)
The survey consists of web-based self-completion questionnaires, which are developed using
Google Drive. This allows an unlimited number of questions and the questionnaires can be
formatted to the needs of the survey.
The unique link that is created is sent to the organisations via email, and is then shared within
the company network.
3.2.4 Time Horizon
There are two different time horizons timeframes for studies, namely longitudinal and cross-
sectional.
In cross-sectional studies the focus of the study of a situation lies on the explanation of the
relationship between variables (Saunders, Lewis and Thornhill, 2009, p.140).
These types of studies are often conducted when time constraints and/or limited budgets are
present. Limitations and problems regularly encountered in cross-sectional studies are the
selection of a large enough samples to be representative for the population within the given
timeframe, the isolation of a phenomena from influencing factors, and the examination of
existence of correlations rather than the explanation of any correlations, according to the
literature. (Collis and Hussey, 2014, p.63)
Longitudinal studies in contrary are “used to investigate variables (…) over a long period of
time” and also have several problems to face (time consuming, expensive, and losing
participants over time. The researcher has to be involved for a number of years for the study to
be successful. (Collis and Hussey, 2014, p.64)
Given the restricted timeframe of only several months a cross-sectional explanatory research
study design is be used in this research.
39
3.2.5 Selecting Participants
The questionnaires will be sent to holiday tour operators / travel agencies with offices in Dublin.
There it will be sent to every employee of the company regardless of position within it; this aims
to represent all company areas and point of views to evaluate differences in positions and
involvement. Furthermore it is to ensure a high rate of return of answers and a suitable sample
size.
To calculate the minimum sample size following formula is used: n = p% x q% x (z/e%)² 1
The chosen z value is 95% level of confidence, this equals 1.96 (Saunders, Lewis and Thornhill,
2009, p.581). The margin of error (e%) that can be tolerated is set at 5%. This is the most used
confidence level within business and management research (Saunders, Lewis and Thornhill,
2009, p.219).
The number of registered Travel agencies in Ireland on the Irish Travel Agent Association (ITAA)
is 163 (ITAA b, 2014) where agencies with different locations are listed more than once. The
number of agencies with locations in Dublin amounts to 40 (excluding double listed companies)
(ITAA a, 2014).
This produces a minimum sample size (n) of [30x70x (1.96/5)² =] 322.7. This builds the basis for
calculating the adjusted minimum (n‟).
The number of employees varies and could not be evaluated exactly. Therefore the assumption
of a total of 500 employees in the Dublin area (N) will be made (assuming an average of 12
employees per company as there are small family run businesses, as well as bigger companies
with several locations).
The adjusted minimum size therefore is 196. [Calculated: n‟= n / 1+ (n/N)]
Based on Saunders, Lewis and Thornhill (2009, pp.222-228) either a simple random sampling
technique or a systematic sampling technique could be used to obtain the representative
sample.
1 (n= minimum sample size required; p%= the % belonging to the specific category; q%= the % not belonging to the
specific category; z= z value corresponding to the level of confidence required; e%= margin of error required/allowed) (Saunders, Lewis and Thornhill, 2009, p.581)
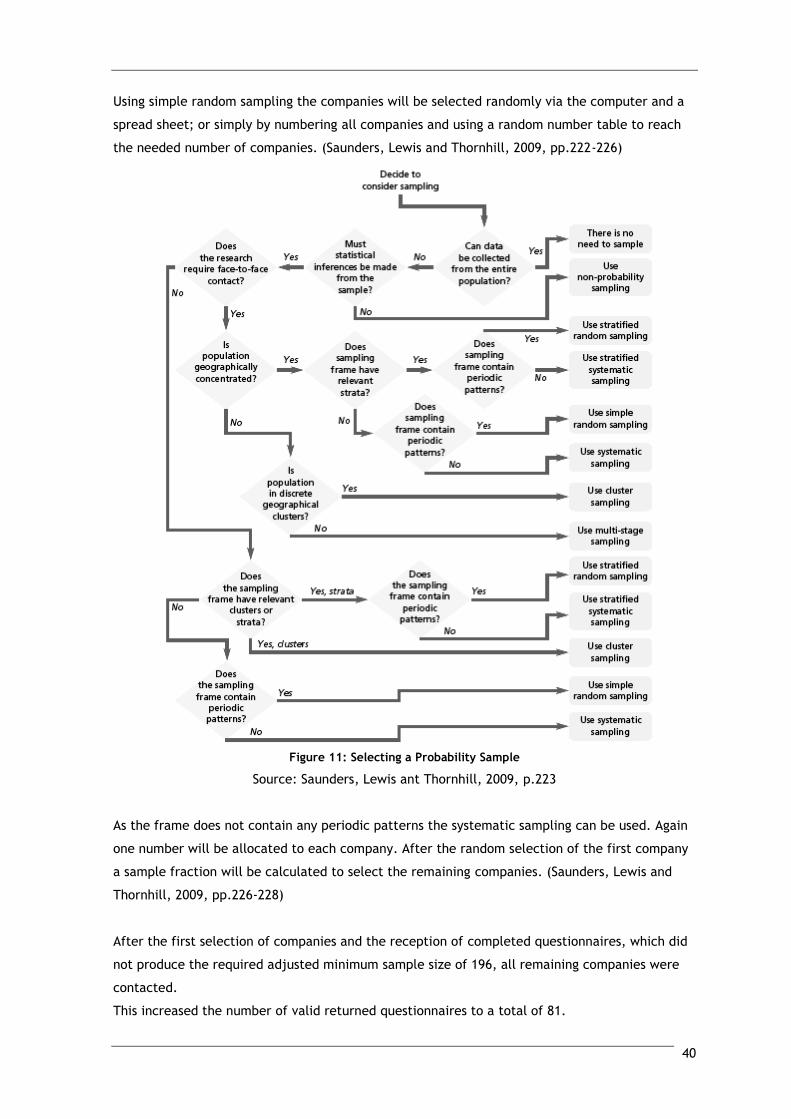
40
Using simple random sampling the companies will be selected randomly via the computer and a
spread sheet; or simply by numbering all companies and using a random number table to reach
the needed number of companies. (Saunders, Lewis and Thornhill, 2009, pp.222-226)
Figure 11: Selecting a Probability Sample
Source: Saunders, Lewis ant Thornhill, 2009, p.223
As the frame does not contain any periodic patterns the systematic sampling can be used. Again
one number will be allocated to each company. After the random selection of the first company
a sample fraction will be calculated to select the remaining companies. (Saunders, Lewis and
Thornhill, 2009, pp.226-228)
After the first selection of companies and the reception of completed questionnaires, which did
not produce the required adjusted minimum sample size of 196, all remaining companies were
contacted.
This increased the number of valid returned questionnaires to a total of 81.
41
3.2.6 Research Ethics
The research will be conducted under the guidelines of professional and ethical codes for socio-
economic research in the information society (Institute of Employment Studies, 2004).
Ethical issues that can be expected to arise across a research project include the privacy,
anonymity and voluntarily participation of respondents, effects on participants, maintenance of
the confidentiality of data provided, and behaviour and objectivity of the researcher (Saunders,
Lewis and Thornhill, 2009, pp.185-186).
Furthermore one might see ethical issues in the focus on an industry that the author has worked
for before and the possibility that the former employer company will be part of the survey, but
as the questionnaires were sent out to a number of different companies and the answers remain
anonymous this is not considered to influence the credibility of the research.
Throughout the research the author respects and protects the privacy and anonymity of possible
and actual participants. In the designed questionnaire only the first three questions are personal
to some extent (employment mode, duration of employment, and current position) but the
anonymity is still ensured as the questionnaire cannot be traced back to the single participant.
The companies also were asked for the permission of publication of the company name, which
no company gave specifically therefore the name of any contacted company will not be
mentioned.
Additionally the participants were made aware of the “purpose of the research, voluntary
participation, and the opportunity to withdraw at any time” as discussed in Collis and Hussey
(2014, p.32).
The collected data is kept securely and is not given to or shared with other people or
institutions.
Furthermore data is collected accurately and fully to ensure objectivity and avoid subjective
selectivity. This also relates to validity and reliability of this dissertation. (Saunders, Lewis and
Thornhill, 2009, pp.185-186)
Lastly every participant was informed that the findings can be shared with them if they are
interested.
42
3.3 Data Collection Instrument
The applied method to collect data is a web-based self-completion questionnaire. This is divided
in five sections with separate questions under different topics for clarity and consistency.
These sections are general questions, communication within the company, change and projects,
projects and an open question. Where it was appropriate or necessary short introductions and
explanations were given to prepare the participant for the following questions. (Appendix 7)
As with all data collection methods, also web-based self-completion questionnaires have
advantages and disadvantages. These will be listed and evaluated below using relevant business
research literature.
One advantage of this type of questionnaires is the relatively low costs. This is a result of the
savings in e.g. postal charges in comparison to postal questionnaires, or travel expenses in
comparison to face-to-face interviews.
Another point would be the time advantage as a large number of questionnaires can be sent out
at once or the link to the questionnaire respectively.
A further benefit of a web-based self-completion questionnaire is that it can be completed when
it is convenient for the participant.
Lastly it has to be mentioned that the absence of an interviewer removes the effects he/she can
have on the answers given by the participant. Such effects include gender, ethnicity or the
social background of the interviewer. Furthermore the variability in the order or way the
questions are asked by the interviewer are eliminated. (Bryman and Bell, 2003, p.142)
Issues that could occur by using self-completion questionnaires may be in relation to the
participants and the way questions are asked. To ensure correct and easy to understand and
answerable questions closed questions are used. Furthermore a type of design is used that
ensures that participants can follow the structure of the questionnaire easily and it is kept
relatively short to reduce the occurrence of „respondent fatigue‟. (Bryman and Bell, 2003,
p.142; Collis and Hussey, 2014, p.207, p.211)
Further disadvantages of questionnaires include the limited number of questions and elimination
of the possibility to ask additional questions. Also the possibility of the participant to read all
questions before answering the first question and then answering them in a different order can
affect the quality of the given answers. (Bryman and Bell, 2003, p.142) This is worked against by
marking questions to be answered first before the participant was able to go to the next page.
43
Another problem mentioned in relation to online questionnaires is their widely use and therefore
the possibility of biased results. Furthermore this also influences “obtaining of sufficient
responses” and might increase the time necessary to do so (Collis and Hussey, 2014, p.206).
A practical issue encountered was the access to the participants. This was because of the
restricted access to the company internal database of employees and their email addresses.
Therefore it was important to get a valuable contact in every company to ensure the link to the
questionnaire is sent on to every person working in the company. First contacts via email to a
single person are required to be able to spread the questionnaires.
Further on an issue which was taken into account was the rate of response and the possibility
that it is too low to reach the adjusted minimum sample size. As mentioned before steps were
undertaken to reduce this influence. When the minimum sample size was not reached firstly the
questionnaire was send to a greater number of companies rather than to a specific number of
tour operators. Furthermore additional effort to increase the number of response was
undertaken by handing in printed versions of the questionnaires into tour operator offices in the
Dublin area, which only resulted in little additional answers.
Despite the increase of effort the adjusted minimum sample size was not reached.
Other data collecting instruments could have been used for this dissertation, such as semi-
structured interviews, which are used under an interpretivist paradigm (Collis and Hussey, 2014,
pp.133-135). Other interview techniques that could have been applied are the critical incident
technique or focus groups (Collis and Hussey, 2014, pp.139-144).
Any type of interview was rejected as research instrument because of the limited number of
interviewees that could have taken part resulting of the limited time and the single researcher.
The objective of the study was to get insight from employees of all levels. This would not have
been possible through above mentioned techniques.
Another technique that could have been applied is observation. This was not used because there
was no co-operating company available by the time the research had to start. Furthermore this
method would have only allowed a focus on one company. Problems related with this technique
are ethics, objectivity, and the impact of the researcher on those observed. (Collis and Hussey,
2014, pp.148-150)
Lastly focus groups would have built an alternative to questionnaires. This method combines
interviews and observations and participants of every company and group (e.g. part-time/full-
time) are needed. (Collis and Hussey, 2014, pp.141-144) The availability of sufficient
participants was questionable and therefore this method was rejected.
44
3.4 Limitations of Methodology
In this last section of methodology the limitations of the methodology and the influence on the
research will be pointed out.
The cross-sectional timeframe does not allow a deeper insight into the projects and changes that
occurred in participating companies, but with the undertaken research a picture of the current
situation can be drawn, regarding level of communication and involvement.
Self-completion questionnaires should be kept short to increase the possibility of returns
(Bryman and Bell, 2003, p.142; Collis and Hussey, 2014, p.207, p.211). Therefore the number
questions asked do not exceed 19 and questions of importance are included. To avoid questions
not as significant for the study as firstly assumed pilot questionnaires were sent out to evaluate
the meaningfulness and the overall quality of the questionnaire as advised in research literature
(Collis and Hussey, 2014, p.205). Also knowledge gained through in-depth literature reviews is
included in the phrasing of questions.
A generalisation of tour operators and their communication process of changes will not be
reached with this study, due to the focus on Irish tour operators. Because of different cultures,
values and behaviours further studies would have to be conducted in other countries to take
these differences into account.
Also a generalisation on Dublin or Irish tour operators cannot drawn because the minimum
adjusted sample size was not reached.
To overcome this problem the study could be repeated at a different time of the year to
increase response volume and reach the required sample size. Although it is not expected that
the outcome will vary much, the validity of the study will increase and further insight can be
gained.
45
4 Data Analysis and Findings
4.1 Data Analysis Procedures
The self-completion questionnaire mostly contains 5 point questions, where the responses are
coded from 1 to 5 (similar to a Likert-scale rating) (Saunders, Lewis and Thornhill, 2009, p.378).
This allows statistical examination of e.g. frequency of specific responses to individual
questions, tendencies, and variability in relation to total scores.
The majority of questions are multiple response questions, this means that participants were
able to choose more than one answer if they wish. These include questions about the types of
meetings (Q4) and the frequency of meetings (Q5) and the content of the meetings (Q6). The
coding for these types of questions is different in order to be able to group and analyse the data
with IBM SPSS. Each answer was given the code yes = 1 and no = 0. This allowed counting only
those points which were answered with yes. E.g. If the participant said one-to-one and small
group meetings are used in the company these two answers were coded with one, whereas the
other answer options coded with zero. This was also necessary to distinguish where answers
were given and where not, as these result in missing values at the data analysis outcome.
Questions were the 5 point rating is not used corresponding coding is used e.g. employment
mode: part-time = 1; full-time = 2.
The questionnaire finished with an open question (Q18: If another project/change has to happen
in the company what should be done different?). Usually this type of question is used where the
response cannot be anticipated (Collis and Hussey, 2014, p.221). The reason for formulating this
question as an open question was to get peoples opinion without giving them options to choose
from. This eliminates the possibility of influencing their response. The answers are particularly
important as these results will show if people feel that there are improvements in
communication to be made or not, and what could be done better or different in change
processes.
In order to code the responses suitable groups were formed. This resulted in eight response
groups (see Appendix 8) which then could be filled into the software for further analysis.
The IBM software SPSS version 22 is used for the statistical analysis to examine connections
between communication, resistance to change and project/change success.
The complete analysis of the collected data can be found in Appendix 9.
46
4.2 Research Analysis
In this section the analysis of the survey will take place and most important conclusions and
implications will be discussed.
The analysis will be parted the same way the questionnaire was, first the analysis of the general
questions, second the analysis of the section communication within the company, followed by
the section change and projects and lastly the analysis of the open question.
The complete SPSS analysis of the questionnaire can be found in the Appendix 9.
The total number of responses was 89, 81 of which were found to be valid. The eight invalid
questionnaires included questionnaires which were not completed, where questionnaires were
returned twice, or where the credibility of the answers was questionable.
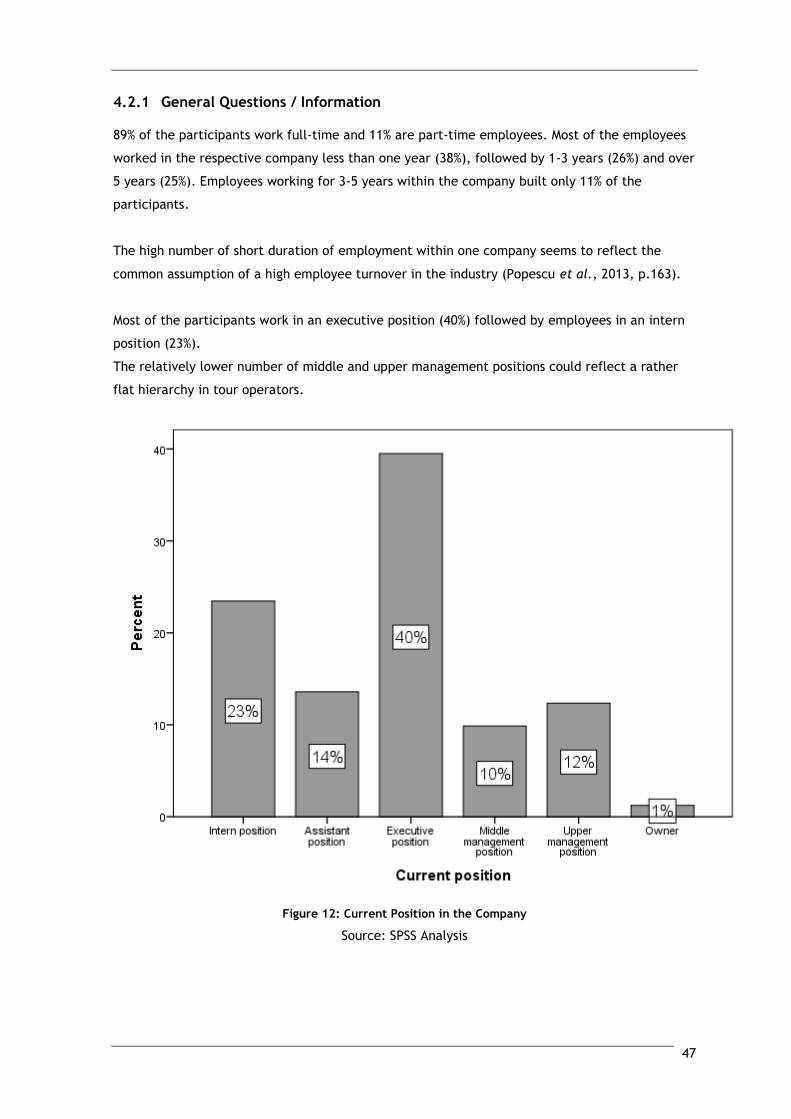
47
4.2.1 General Questions / Information
89% of the participants work full-time and 11% are part-time employees. Most of the employees
worked in the respective company less than one year (38%), followed by 1-3 years (26%) and over
5 years (25%). Employees working for 3-5 years within the company built only 11% of the
participants.
The high number of short duration of employment within one company seems to reflect the
common assumption of a high employee turnover in the industry (Popescu et al., 2013, p.163).
Most of the participants work in an executive position (40%) followed by employees in an intern
position (23%).
The relatively lower number of middle and upper management positions could reflect a rather
flat hierarchy in tour operators.
Figure 12: Current Position in the Company
Source: SPSS Analysis

48
4.2.2 Communication within the Company
The next part of the questionnaire approached the topic of communication within the company.
Here questions regarding meetings were asked to get an understanding of what is
communicated, how it is communicated and how often.
The first question of this part addressed the types of meetings held in the company (Table 1).
Because there are a variety of different meetings (PMI, 2013) and the assumption could be made
that more than one type of meeting takes place in a company multiple answers could be chosen.
Table 1: Types of Meetings in the Company
Source: SPSS Analysis
The response number indicates that most all participants stated that there were at least two
types of meetings held in the company (a total response number of 192 at 81 participants).
According to this study the majority builds small groups or intra-departmental meetings (39%)
followed by one-to-one meetings (33%). (Table 1)
Two participants also gave explanations of other meetings held in their company. One was
„trainings‟ which probably relates to internal programmes, products or similar. The other one
was „work with public‟ which was not specified further. It is assumed that regular public
information or public relations work could be meant.
Regarding the frequency of meetings 49% said that there are weekly meetings, followed by
monthly meetings (31%). Irregular meetings and quarterly meetings combined build 14%. The
option „other‟ frequencies included daily meetings of various types, informal, and planning
meetings, bi-weekly, and one-to-one meetings every 6 months, or upon request. These answers
were given by eight people (6% of the responses).
N Percent
One to one
meetings63 32.8% 77.8%
Small groups /
Intra/departmental75 39.1% 92.6%
Whole company /
Majority of staff52 27.1% 64.2%
Other 2 1.0% 2.5%
192 100.0% 237.0%
$Meetings Frequencies
What types of meetings take place?a
Responses Percent of
Cases
Total
a. Dichotomy group tabulated at value 1.
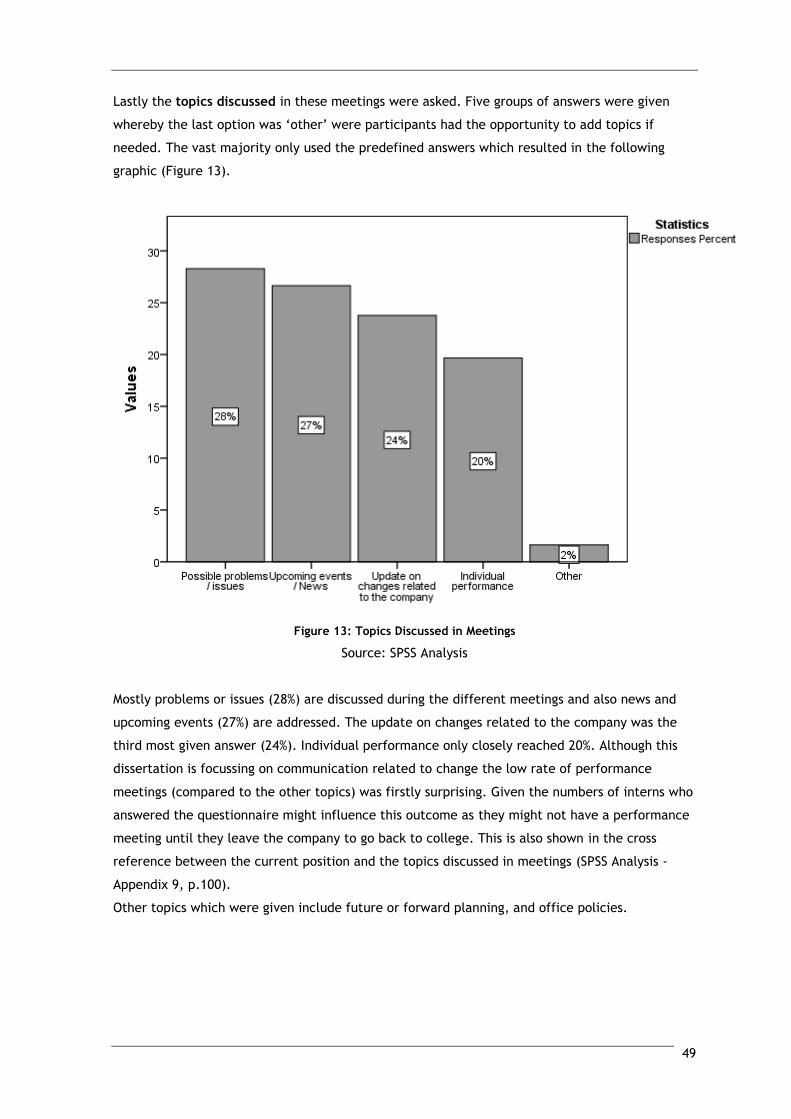
49
Lastly the topics discussed in these meetings were asked. Five groups of answers were given
whereby the last option was „other‟ were participants had the opportunity to add topics if
needed. The vast majority only used the predefined answers which resulted in the following
graphic (Figure 13).
Figure 13: Topics Discussed in Meetings
Source: SPSS Analysis
Mostly problems or issues (28%) are discussed during the different meetings and also news and
upcoming events (27%) are addressed. The update on changes related to the company was the
third most given answer (24%). Individual performance only closely reached 20%. Although this
dissertation is focussing on communication related to change the low rate of performance
meetings (compared to the other topics) was firstly surprising. Given the numbers of interns who
answered the questionnaire might influence this outcome as they might not have a performance
meeting until they leave the company to go back to college. This is also shown in the cross
reference between the current position and the topics discussed in meetings (SPSS Analysis -
Appendix 9, p.100).
Other topics which were given include future or forward planning, and office policies.
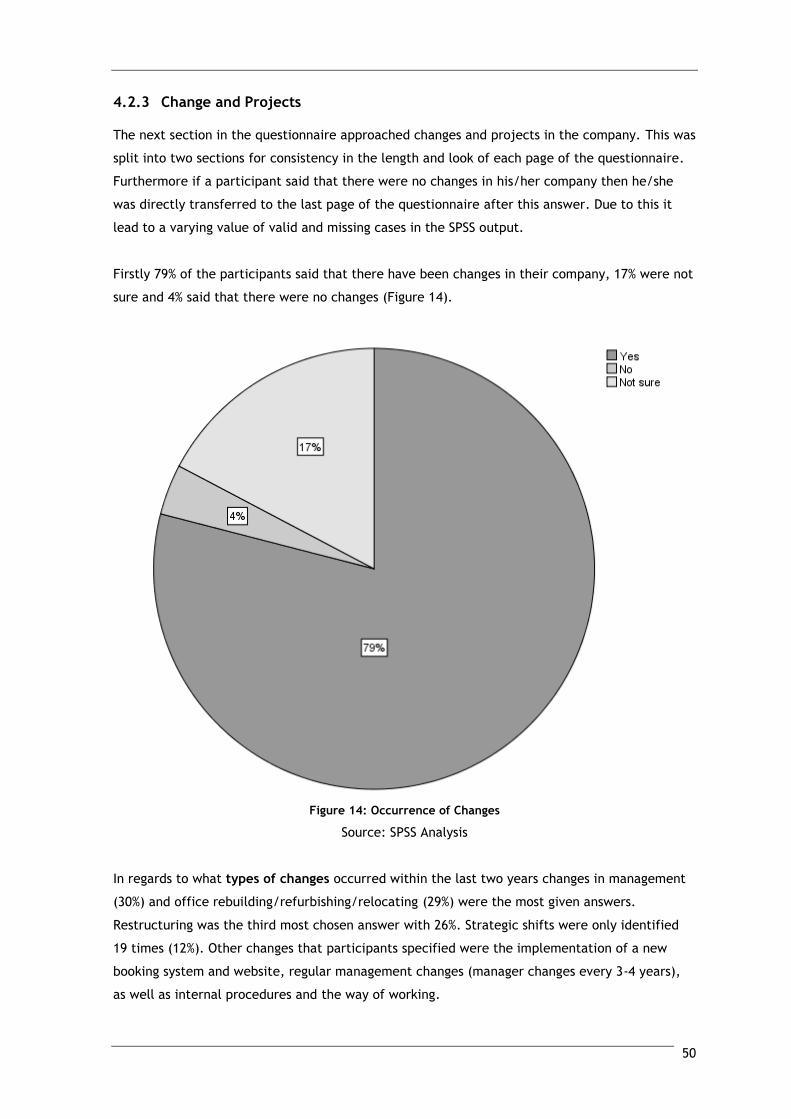
50
4.2.3 Change and Projects
The next section in the questionnaire approached changes and projects in the company. This was
split into two sections for consistency in the length and look of each page of the questionnaire.
Furthermore if a participant said that there were no changes in his/her company then he/she
was directly transferred to the last page of the questionnaire after this answer. Due to this it
lead to a varying value of valid and missing cases in the SPSS output.
Firstly 79% of the participants said that there have been changes in their company, 17% were not
sure and 4% said that there were no changes (Figure 14).
Figure 14: Occurrence of Changes
Source: SPSS Analysis
In regards to what types of changes occurred within the last two years changes in management
(30%) and office rebuilding/refurbishing/relocating (29%) were the most given answers.
Restructuring was the third most chosen answer with 26%. Strategic shifts were only identified
19 times (12%). Other changes that participants specified were the implementation of a new
booking system and website, regular management changes (manager changes every 3-4 years),
as well as internal procedures and the way of working.
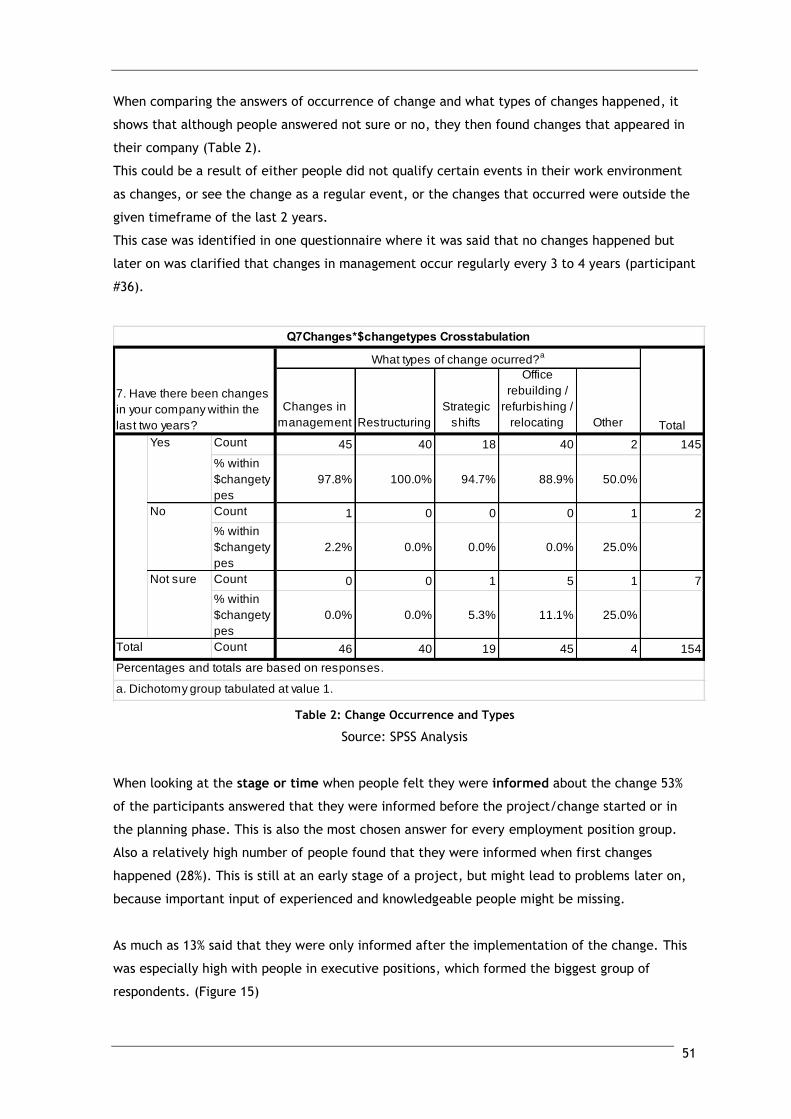
51
When comparing the answers of occurrence of change and what types of changes happened, it
shows that although people answered not sure or no, they then found changes that appeared in
their company (Table 2).
This could be a result of either people did not qualify certain events in their work environment
as changes, or see the change as a regular event, or the changes that occurred were outside the
given timeframe of the last 2 years.
This case was identified in one questionnaire where it was said that no changes happened but
later on was clarified that changes in management occur regularly every 3 to 4 years (participant
#36).
Table 2: Change Occurrence and Types
Source: SPSS Analysis
When looking at the stage or time when people felt they were informed about the change 53%
of the participants answered that they were informed before the project/change started or in
the planning phase. This is also the most chosen answer for every employment position group.
Also a relatively high number of people found that they were informed when first changes
happened (28%). This is still at an early stage of a project, but might lead to problems later on,
because important input of experienced and knowledgeable people might be missing.
As much as 13% said that they were only informed after the implementation of the change. This
was especially high with people in executive positions, which formed the biggest group of
respondents. (Figure 15)
Changes in
management Restructuring
Strategic
shifts
Office
rebuilding /
refurbishing /
relocating Other
Count 45 40 18 40 2 145
% within
$changety
pes
97.8% 100.0% 94.7% 88.9% 50.0%
Count 1 0 0 0 1 2
% within
$changety
pes
2.2% 0.0% 0.0% 0.0% 25.0%
Count 0 0 1 5 1 7
% within
$changety
pes
0.0% 0.0% 5.3% 11.1% 25.0%
Count 46 40 19 45 4 154Total
Percentages and totals are based on responses.
a. Dichotomy group tabulated at value 1.
Q7Changes*$changetypes Crosstabulation
7. Have there been changes
in your company within the
last two years?
What types of change ocurred?a
Total
Yes
No
Not sure

52
Some participants chose more than one point of time when they have been informed. This might
be because people could not identify a clear stage of when they have been informed, e.g.
people chose planning phase and when first changes happened. Or it was an on-going,
continuous information process, which could be the case of participants who have selected all
four answer options. Another reason could be that participants were referring to different
projects for each answer option they chose.
It is expected that a person‟s position in a company can affect the point of time when he/she
gets informed about projects and changes. This means the higher in the company hierarchy the
more important people are and the earlier they get informed and involved.
Although this expectation exists the link between the time of information and the position of a
person within a company could not be verified with this study. Chi-Square tests were conducted
to assess if the hypothesis that there is a relation between the position and the time of
information is true or not. Due to the limited sample number no reliable outcome of the test
could be made (SPSS Analysis – Appendix 9, pp.113-116)
A greater number of participants would be needed and the question would have to be changed
to a single answer option only to get valuable results.
Figure 15: Time of Information and Employment Position
Source: SPSS Analysis
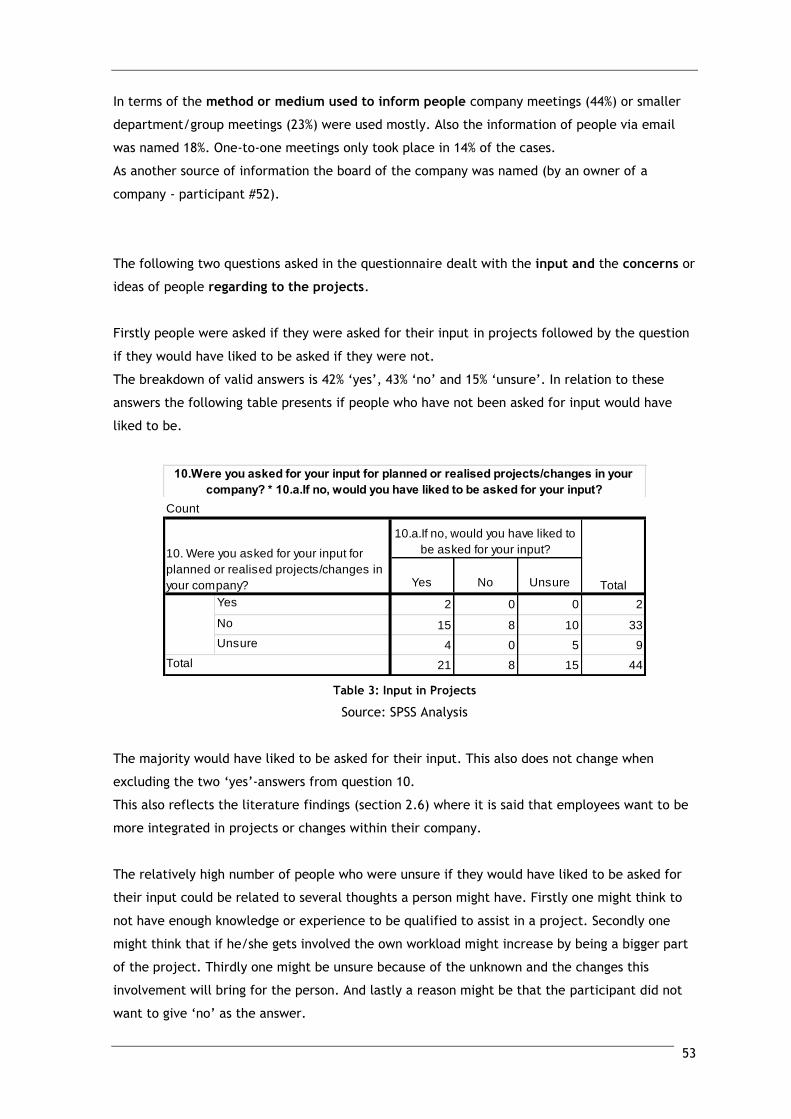
53
In terms of the method or medium used to inform people company meetings (44%) or smaller
department/group meetings (23%) were used mostly. Also the information of people via email
was named 18%. One-to-one meetings only took place in 14% of the cases.
As another source of information the board of the company was named (by an owner of a
company - participant #52).
The following two questions asked in the questionnaire dealt with the input and the concerns or
ideas of people regarding to the projects.
Firstly people were asked if they were asked for their input in projects followed by the question
if they would have liked to be asked if they were not.
The breakdown of valid answers is 42% „yes‟, 43% „no‟ and 15% „unsure‟. In relation to these
answers the following table presents if people who have not been asked for input would have
liked to be.
Table 3: Input in Projects
Source: SPSS Analysis
The majority would have liked to be asked for their input. This also does not change when
excluding the two „yes‟-answers from question 10.
This also reflects the literature findings (section 2.6) where it is said that employees want to be
more integrated in projects or changes within their company.
The relatively high number of people who were unsure if they would have liked to be asked for
their input could be related to several thoughts a person might have. Firstly one might think to
not have enough knowledge or experience to be qualified to assist in a project. Secondly one
might think that if he/she gets involved the own workload might increase by being a bigger part
of the project. Thirdly one might be unsure because of the unknown and the changes this
involvement will bring for the person. And lastly a reason might be that the participant did not
want to give „no‟ as the answer.
Yes No Unsure
Yes 2 0 0 2
No 15 8 10 33
Unsure 4 0 5 9
21 8 15 44
Count
10. Were you asked for your input for
planned or realised projects/changes in
your company?
10.a.If no, would you have liked to
be asked for your input?
Total
Total
10.Were you asked for your input for planned or realised projects/changes in your
company? * 10.a.If no, would you have liked to be asked for your input?
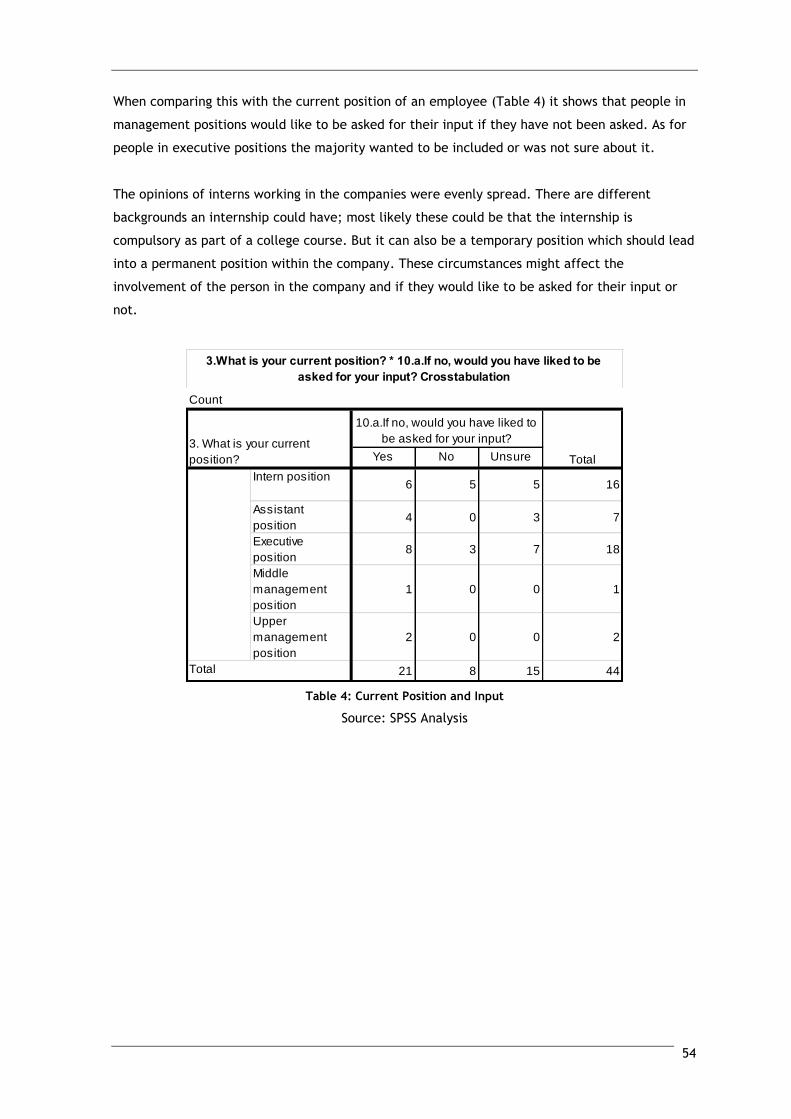
54
When comparing this with the current position of an employee (Table 4) it shows that people in
management positions would like to be asked for their input if they have not been asked. As for
people in executive positions the majority wanted to be included or was not sure about it.
The opinions of interns working in the companies were evenly spread. There are different
backgrounds an internship could have; most likely these could be that the internship is
compulsory as part of a college course. But it can also be a temporary position which should lead
into a permanent position within the company. These circumstances might affect the
involvement of the person in the company and if they would like to be asked for their input or
not.
Table 4: Current Position and Input
Source: SPSS Analysis
Yes No Unsure
Intern position6 5 5 16
Assistant
position4 0 3 7
Executive
position8 3 7 18
Middle
management
position
1 0 0 1
Upper
management
position
2 0 0 2
21 8 15 44Total
3.What is your current position? * 10.a.If no, would you have liked to be
asked for your input? Crosstabulation
Count
3. What is your current
position?
10.a.If no, would you have liked to
be asked for your input?
Total

55
As stated earlier most people were informed at an early stage of projects. When paring the
answers from question 8 (time of information) with question 10 (input for projects) the following
table can be produced.
Table 5: Time of Information and Input
Source: SPSS Analysis
Based on the responses given 67% of the people who found that they were asked for their input
in projects were also informed at the planning phase. The other 33% were informed at a later
stage of the project, this either implies that their knowledge was specifically required at a
certain stage of the project and they were intentionally only asked at this point or the project
encountered difficulties or a change in specifications that required the inclusion of these
participants at this particular stage.
Because the number of people who were not asked for their input but were still informed at an
early stage of the project is relatively high (77%) it cannot be said certainly that early
information automatically results in a direct involvement in the project. This can also be seen
when the actual numbers of answers of early stage information are compared; 40 people were
asked for their input and 33 were not asked for their input.
Yes No Unsure
Count 31 17 7 55
% within
Q10Input67% 40% 50%
Count 9 16 4 29
% within
Q10Input20% 37% 29%
Count 3 2 2 7
% within
Q10Input7% 5% 14%
Count 3 8 1 12
% within
Q10Input7% 19% 7%
Count 46 43 14 103Total
Percentages and totals are based on responses.
a. Dichotomy group tabulated at value 1.
$Q8Timeofinformation*Q10Input Crosstabulation
When were you informed?a
10.Were you asked for your input for
planned or realised projects/changes
in your company?
Total
Before it started /
planning phase
When first
changes
happened
During testing
phase
After
implementation
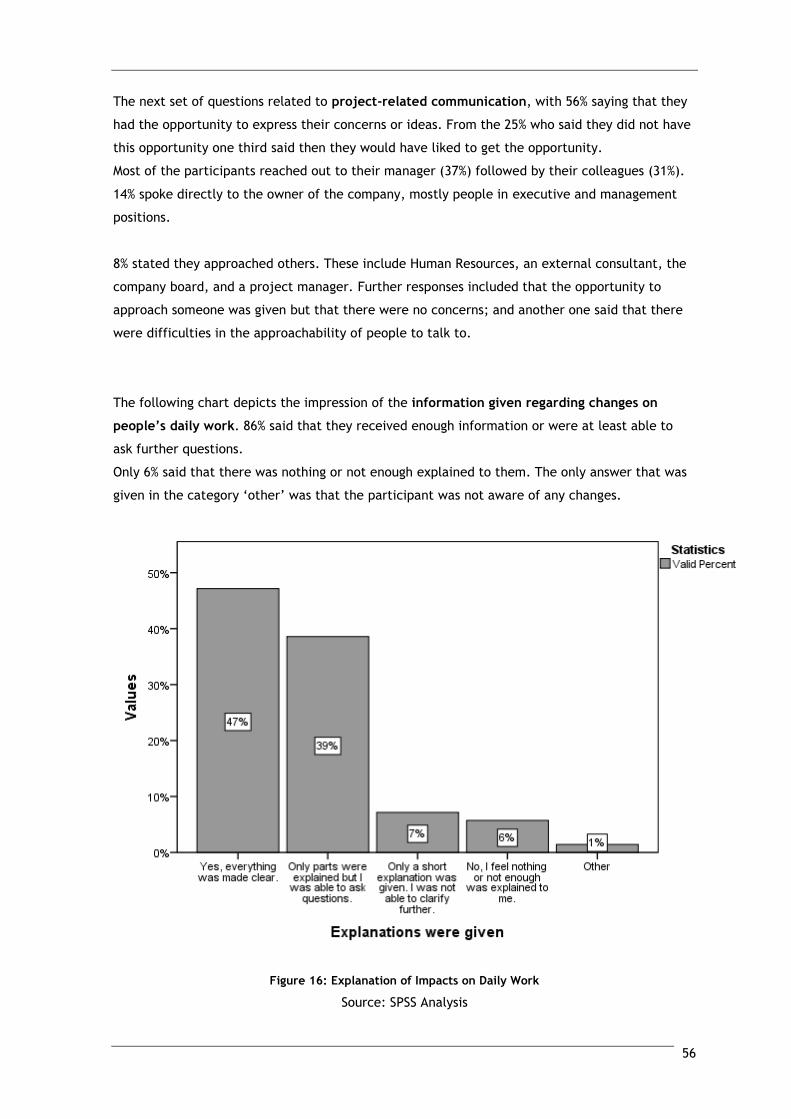
56
The next set of questions related to project-related communication, with 56% saying that they
had the opportunity to express their concerns or ideas. From the 25% who said they did not have
this opportunity one third said then they would have liked to get the opportunity.
Most of the participants reached out to their manager (37%) followed by their colleagues (31%).
14% spoke directly to the owner of the company, mostly people in executive and management
positions.
8% stated they approached others. These include Human Resources, an external consultant, the
company board, and a project manager. Further responses included that the opportunity to
approach someone was given but that there were no concerns; and another one said that there
were difficulties in the approachability of people to talk to.
The following chart depicts the impression of the information given regarding changes on
people’s daily work. 86% said that they received enough information or were at least able to
ask further questions.
Only 6% said that there was nothing or not enough explained to them. The only answer that was
given in the category „other‟ was that the participant was not aware of any changes.
Figure 16: Explanation of Impacts on Daily Work
Source: SPSS Analysis
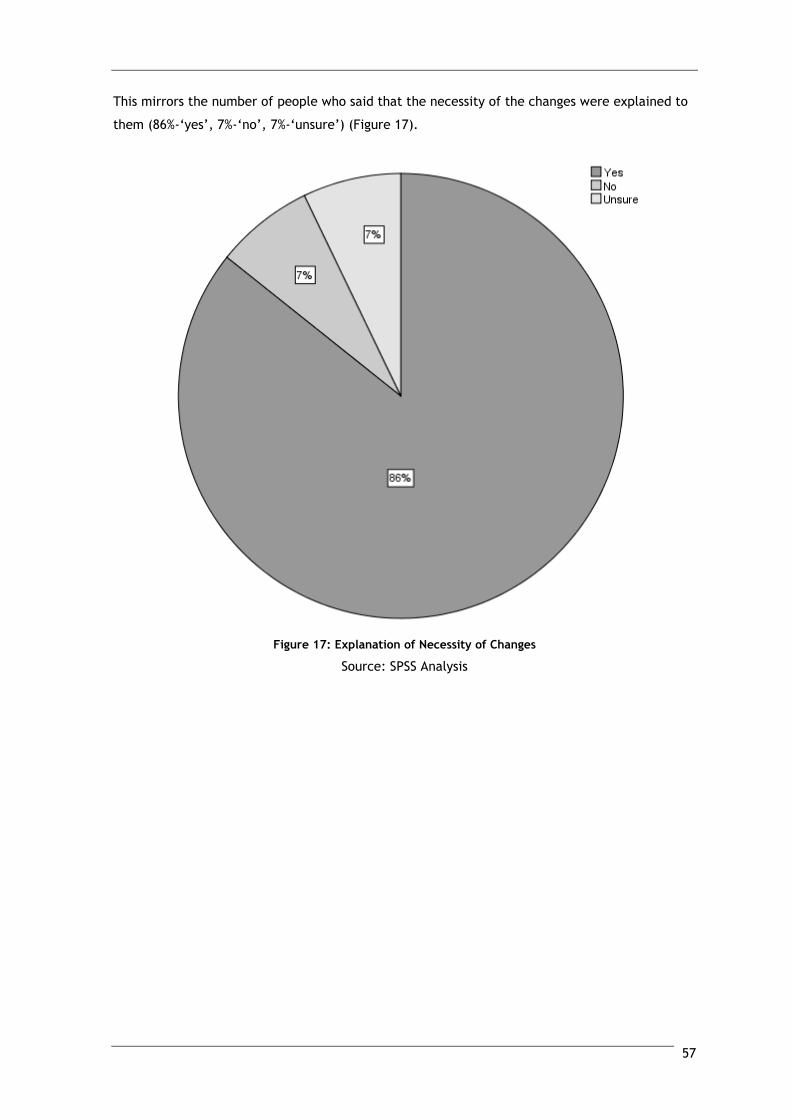
57
This mirrors the number of people who said that the necessity of the changes were explained to
them (86%-„yes‟, 7%-„no‟, 7%-„unsure‟) (Figure 17).
Figure 17: Explanation of Necessity of Changes
Source: SPSS Analysis
58
To conclude the sections about communication, and projects and changes in the companies the
reference to Prosci‟s ADKAR model needs to be made (Prosci, 2014b). Although employees are
informed of and integrated in changes a real transition and time to adapt seems not to be given.
Following the ADKAR model a real awareness of the need to change needs to be created. This
seems to take place in the participating companies; 86% (of valid responses) felt that the
necessities were explained (Q13). 89% of the participants who identified changes in the company
(Q7) stated that they have been informed about it before it started (Q8).
In relation to their own work the majority was able to ask and clarify the changes and impacts
(Q14).
The desire to take part in the change seems exist within the employees as almost half of the
people who were not included would have liked to participate. Not only would participation
create a greater amount of input but most importantly it creates support for the change which is
a strong influencing factor for change to be successful (Bareil, 2013; Matos Marques Simoes and
Esposito, 2014; Prosci, 2012; The Standish Group, 2010).
The use of the last steps of the ADKAR model (knowledge, ability and reinforcement) could not
be identified and no assumptions want to be undertaken at this point.
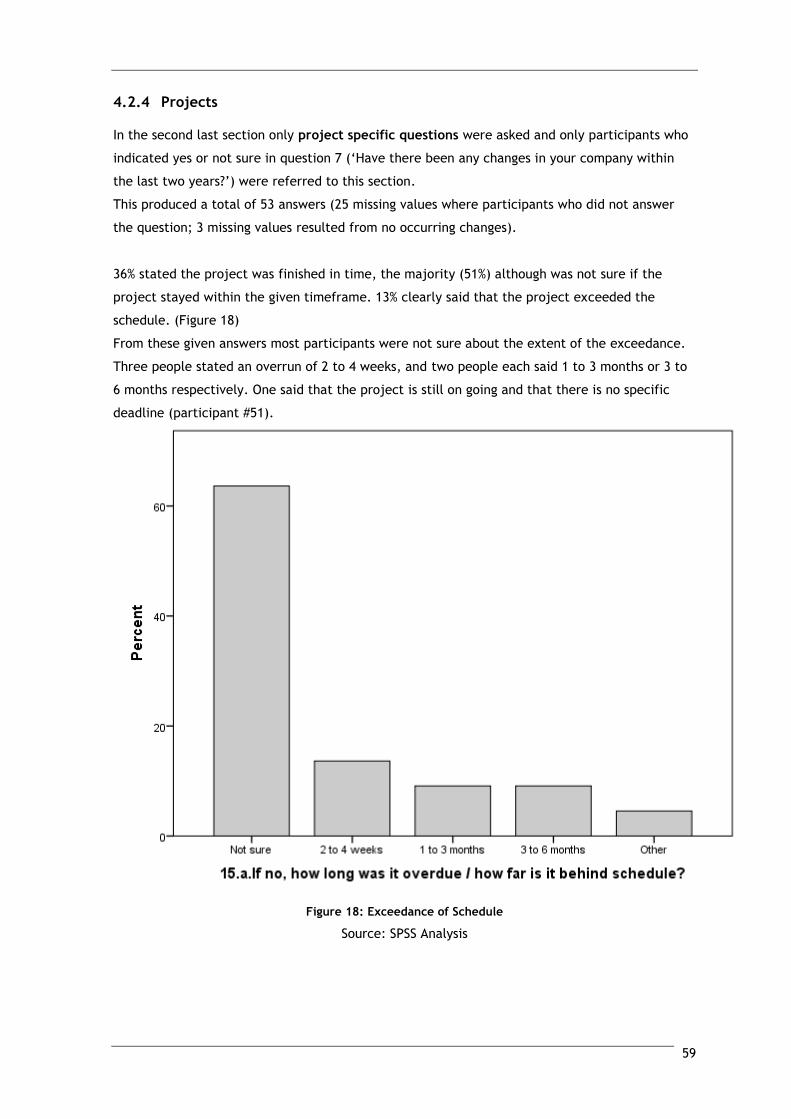
59
4.2.4 Projects
In the second last section only project specific questions were asked and only participants who
indicated yes or not sure in question 7 („Have there been any changes in your company within
the last two years?‟) were referred to this section.
This produced a total of 53 answers (25 missing values where participants who did not answer
the question; 3 missing values resulted from no occurring changes).
36% stated the project was finished in time, the majority (51%) although was not sure if the
project stayed within the given timeframe. 13% clearly said that the project exceeded the
schedule. (Figure 18)
From these given answers most participants were not sure about the extent of the exceedance.
Three people stated an overrun of 2 to 4 weeks, and two people each said 1 to 3 months or 3 to
6 months respectively. One said that the project is still on going and that there is no specific
deadline (participant #51).
Figure 18: Exceedance of Schedule
Source: SPSS Analysis
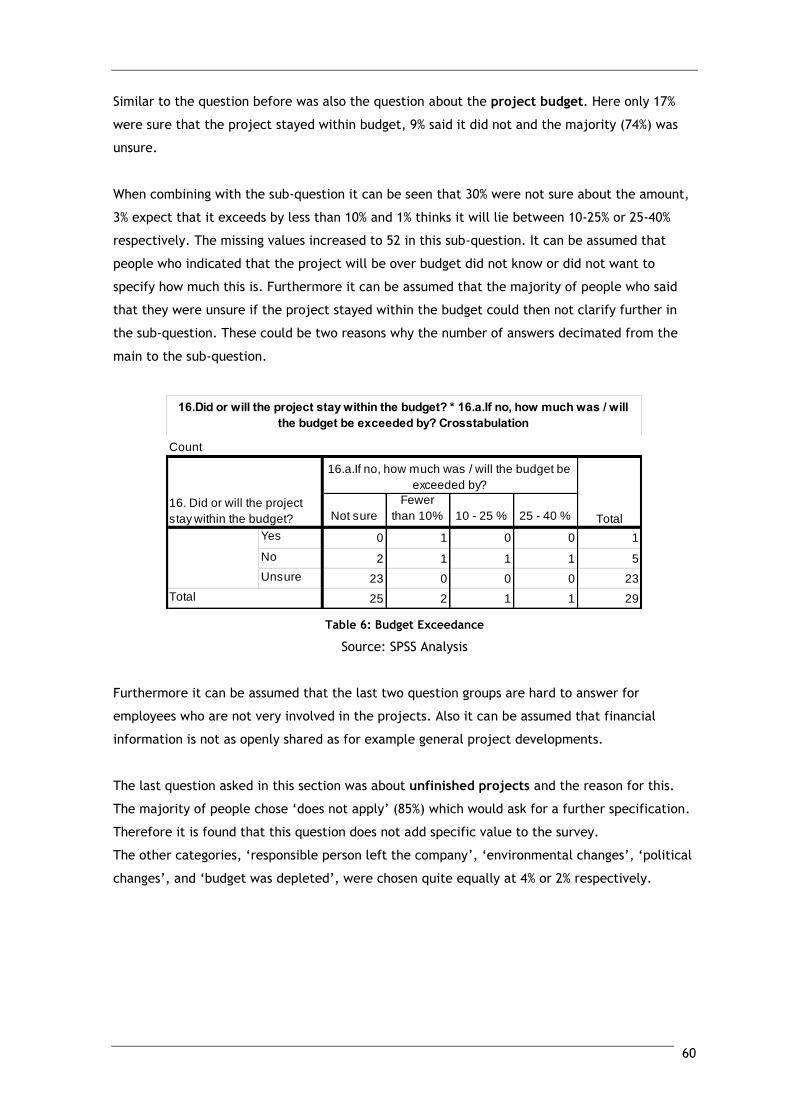
60
Similar to the question before was also the question about the project budget. Here only 17%
were sure that the project stayed within budget, 9% said it did not and the majority (74%) was
unsure.
When combining with the sub-question it can be seen that 30% were not sure about the amount,
3% expect that it exceeds by less than 10% and 1% thinks it will lie between 10-25% or 25-40%
respectively. The missing values increased to 52 in this sub-question. It can be assumed that
people who indicated that the project will be over budget did not know or did not want to
specify how much this is. Furthermore it can be assumed that the majority of people who said
that they were unsure if the project stayed within the budget could then not clarify further in
the sub-question. These could be two reasons why the number of answers decimated from the
main to the sub-question.
Table 6: Budget Exceedance
Source: SPSS Analysis
Furthermore it can be assumed that the last two question groups are hard to answer for
employees who are not very involved in the projects. Also it can be assumed that financial
information is not as openly shared as for example general project developments.
The last question asked in this section was about unfinished projects and the reason for this.
The majority of people chose „does not apply‟ (85%) which would ask for a further specification.
Therefore it is found that this question does not add specific value to the survey.
The other categories, „responsible person left the company‟, „environmental changes‟, „political
changes‟, and „budget was depleted‟, were chosen quite equally at 4% or 2% respectively.
Not sure
Fewer
than 10% 10 - 25 % 25 - 40 %
Yes 0 1 0 0 1
No 2 1 1 1 5
Unsure 23 0 0 0 23
25 2 1 1 29Total
16.Did or will the project stay within the budget? * 16.a.If no, how much was / will
the budget be exceeded by? Crosstabulation
Count
16. Did or will the project
stay within the budget?
16.a.If no, how much was / will the budget be
exceeded by?
Total
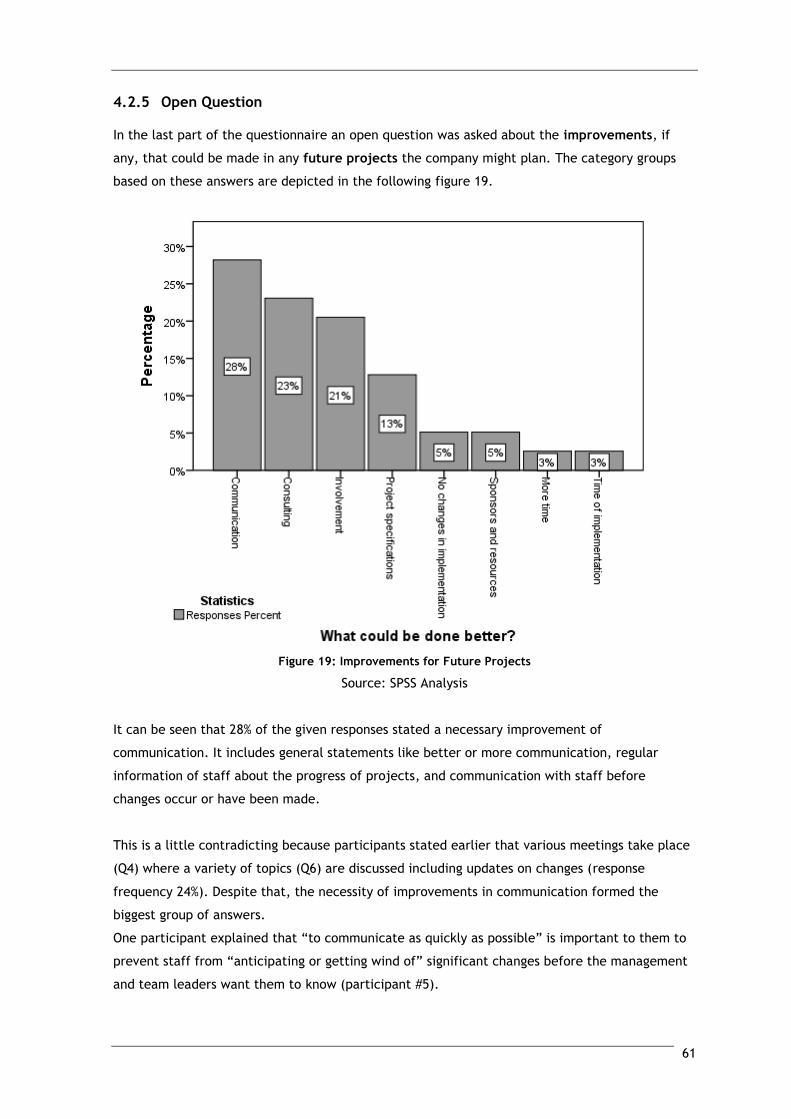
61
4.2.5 Open Question
In the last part of the questionnaire an open question was asked about the improvements, if
any, that could be made in any future projects the company might plan. The category groups
based on these answers are depicted in the following figure 19.
Figure 19: Improvements for Future Projects
Source: SPSS Analysis
It can be seen that 28% of the given responses stated a necessary improvement of
communication. It includes general statements like better or more communication, regular
information of staff about the progress of projects, and communication with staff before
changes occur or have been made.
This is a little contradicting because participants stated earlier that various meetings take place
(Q4) where a variety of topics (Q6) are discussed including updates on changes (response
frequency 24%). Despite that, the necessity of improvements in communication formed the
biggest group of answers.
One participant explained that “to communicate as quickly as possible” is important to them to
prevent staff from “anticipating or getting wind of” significant changes before the management
and team leaders want them to know (participant #5).
62
This firstly seems to be the opposite of how communication in a company especially during
change processes should be handled (Mishra, Boynton and Mishra, 2014; Mazzei and Quaratino,
2013). But as it is further stated in this comment the company is very small (15 employees) and
general communication is working well but significant changes need to be worked out in small
groups first so that all relevant questions can be worked on and the important objectives of
projects are made clear to the management or team leaders. This allows sharing complete plans
and steps with the rest of the company according to participant #5. Furthermore it prepares the
management or team leaders for any question employees might have and it also enables them to
assess if suggestions and other inputs employees might have are relevant or not for the specific
objective of the project.
The next most frequent suggestion was regarding the consultation of staff (23%). Mostly it said to
consult and gather the opinion of staff members, get their input, especially from staff that are
affected by the changes on a daily basis (e.g. participant #50 “changing the booking system is
too expensive but really necessary as it is extremely hard to work with it on a daily basis”; or
participant #64 “input from the day-to-day users”).
One said that senior members of staff should be consulted when junior members are promoted
over them to prevent ill feeling (participant #1). Due to the explanation that ill-feeling
occurred, it can be assumed that „consultation‟ rather than a „lack of communication‟ was
mentioned in this particular case because of hurt feelings or egos, or the disturbance of a
certain power distribution within the company. Whereas it would be more helpful for the
company to use the experience of senior staff and their impression of the junior member, who is
in question for promotion, to consider his/her fit for the position. Through the consultation and
inclusion of senior members of staff in certain types of decisions negative and unconstructive
behaviour could be prevented or diminished as these will feel respected. And a resistance to
accept to the change in the power structure could be reduced and adaption of senior employees
to it could be supported. This mirrors Battilana and Casciaro (2013, p.62) who say that a change
in the power structure can lead to denial or opposition of change initiatives.
The third most occurring improvement mentioned was involvement of staff (21%), ranging from
an early involvement to involvement of regular or all levels of staff and not only management to
collect ideas before the implementation.
Also improving involvement to help employees to understand why projects and changes are
undertaken was mentioned.
All the above cited improvements are coherent with the suggestions and findings of various
authors about change management and the reduction of resistance to change (among others
Bareil, 2013; McKay, Kuntz and Näswall, 2013).
63
The next highest grouped answer was project specifications (13%). In this combined group
“anticipate the objection and have answers and reassurance for staff” (participant #5) was one
of the explanations given. A further answer listed specifically was “1)Produce clear specification
and objectives of project, 2)Identify benefits, 3)Plan project process and resources” (participant
#42). From the same participant also “having a clear strategic direction and future plan” was
stated to be important.
Other answers were regarding research and product knowledge before starting or implementing
the project.
5% stated that no changes in the way of working should be made; participant #19 clarified this
further. In his/her case keeping staff members informed, on-going involvement, and
communication with the project committee are already in place in the company and work well,
therefore no changes in the procedures and implementations should be made.
Likewise 5% mentioned sponsors and resources are important for projects. “Ineffective change
management sponsorship from senior leaders” was also identified as the main hindrance in
change management by Prosci (2012) as pointed out in section 2.7.
Specifically dedicated resources or training teams are mentioned to be needed for the change.
Also identified to be very critical for successful change implementations were strong sponsors to
support the changes and stand behind decisions that needed to be made (participant #68). This
implies that difficulties in the implementation were encountered and support from sponsors was
missing and the project was endangered, hindered, delayed or negatively influenced in other
ways.
The last two categories with 3% respectively of the given answers are time related. Firstly it was
stated that more time is needed, specifically for the studying of the project and all the given
options, and also more time to test the project.
Secondly the specific time of implementation was specified as an improvement for future
projects. It was said that changes in the company should be made “during low season rather
than peak season”. This would make more sense to participant #8, because people could be
more involved and could find more time to work and participate in projects during low season,
as it would be wiser to introduce changes to the company during this time. But certain changes
or projects cannot be timed this specifically, and especially when circumstances from outside
affect and influence the company and actions need to be taken fast.
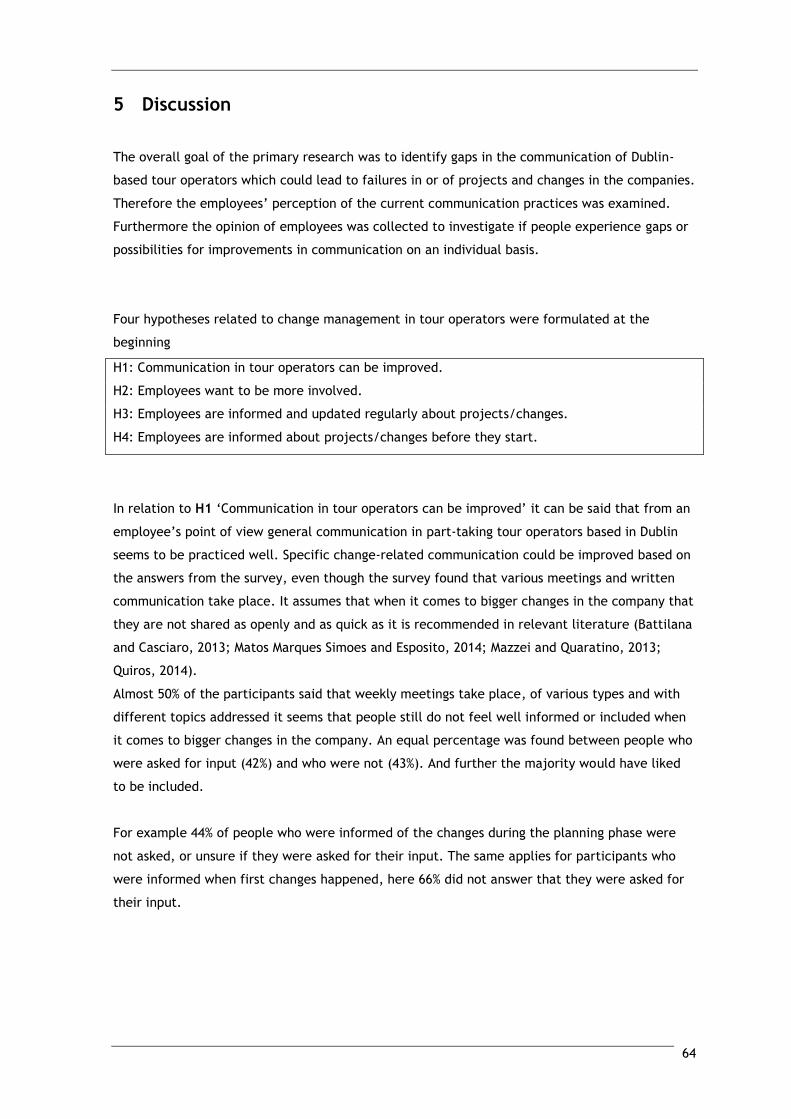
64
5 Discussion
The overall goal of the primary research was to identify gaps in the communication of Dublin-
based tour operators which could lead to failures in or of projects and changes in the companies.
Therefore the employees‟ perception of the current communication practices was examined.
Furthermore the opinion of employees was collected to investigate if people experience gaps or
possibilities for improvements in communication on an individual basis.
Four hypotheses related to change management in tour operators were formulated at the
beginning
H1: Communication in tour operators can be improved.
H2: Employees want to be more involved.
H3: Employees are informed and updated regularly about projects/changes.
H4: Employees are informed about projects/changes before they start.
In relation to H1 „Communication in tour operators can be improved‟ it can be said that from an
employee‟s point of view general communication in part-taking tour operators based in Dublin
seems to be practiced well. Specific change-related communication could be improved based on
the answers from the survey, even though the survey found that various meetings and written
communication take place. It assumes that when it comes to bigger changes in the company that
they are not shared as openly and as quick as it is recommended in relevant literature (Battilana
and Casciaro, 2013; Matos Marques Simoes and Esposito, 2014; Mazzei and Quaratino, 2013;
Quiros, 2014).
Almost 50% of the participants said that weekly meetings take place, of various types and with
different topics addressed it seems that people still do not feel well informed or included when
it comes to bigger changes in the company. An equal percentage was found between people who
were asked for input (42%) and who were not (43%). And further the majority would have liked
to be included.
For example 44% of people who were informed of the changes during the planning phase were
not asked, or unsure if they were asked for their input. The same applies for participants who
were informed when first changes happened, here 66% did not answer that they were asked for
their input.
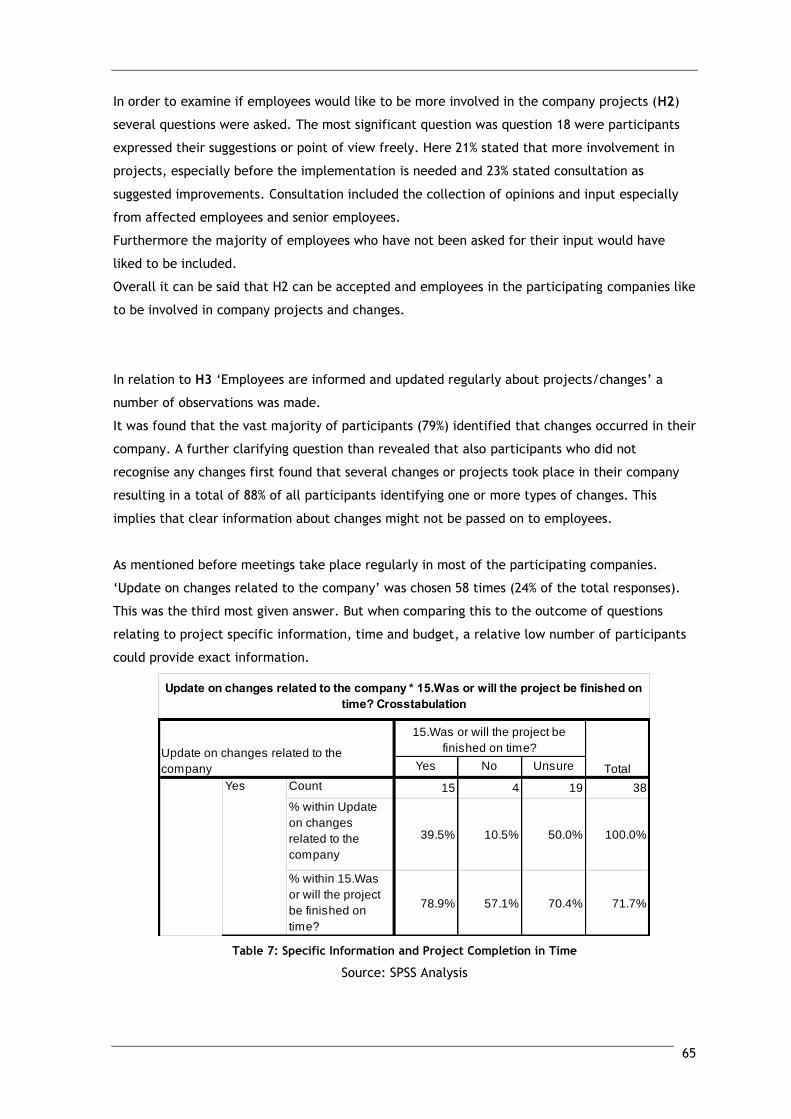
65
In order to examine if employees would like to be more involved in the company projects (H2)
several questions were asked. The most significant question was question 18 were participants
expressed their suggestions or point of view freely. Here 21% stated that more involvement in
projects, especially before the implementation is needed and 23% stated consultation as
suggested improvements. Consultation included the collection of opinions and input especially
from affected employees and senior employees.
Furthermore the majority of employees who have not been asked for their input would have
liked to be included.
Overall it can be said that H2 can be accepted and employees in the participating companies like
to be involved in company projects and changes.
In relation to H3 „Employees are informed and updated regularly about projects/changes‟ a
number of observations was made.
It was found that the vast majority of participants (79%) identified that changes occurred in their
company. A further clarifying question than revealed that also participants who did not
recognise any changes first found that several changes or projects took place in their company
resulting in a total of 88% of all participants identifying one or more types of changes. This
implies that clear information about changes might not be passed on to employees.
As mentioned before meetings take place regularly in most of the participating companies.
„Update on changes related to the company‟ was chosen 58 times (24% of the total responses).
This was the third most given answer. But when comparing this to the outcome of questions
relating to project specific information, time and budget, a relative low number of participants
could provide exact information.
Table 7: Specific Information and Project Completion in Time
Source: SPSS Analysis
Yes No Unsure
Count 15 4 19 38
% within Update
on changes
related to the
company
39.5% 10.5% 50.0% 100.0%
% within 15.Was
or will the project
be finished on
time?
78.9% 57.1% 70.4% 71.7%
Yes
Update on changes related to the company * 15.Was or will the project be finished on
time? Crosstabulation
Update on changes related to the
company
15.Was or will the project be
finished on time?
Total
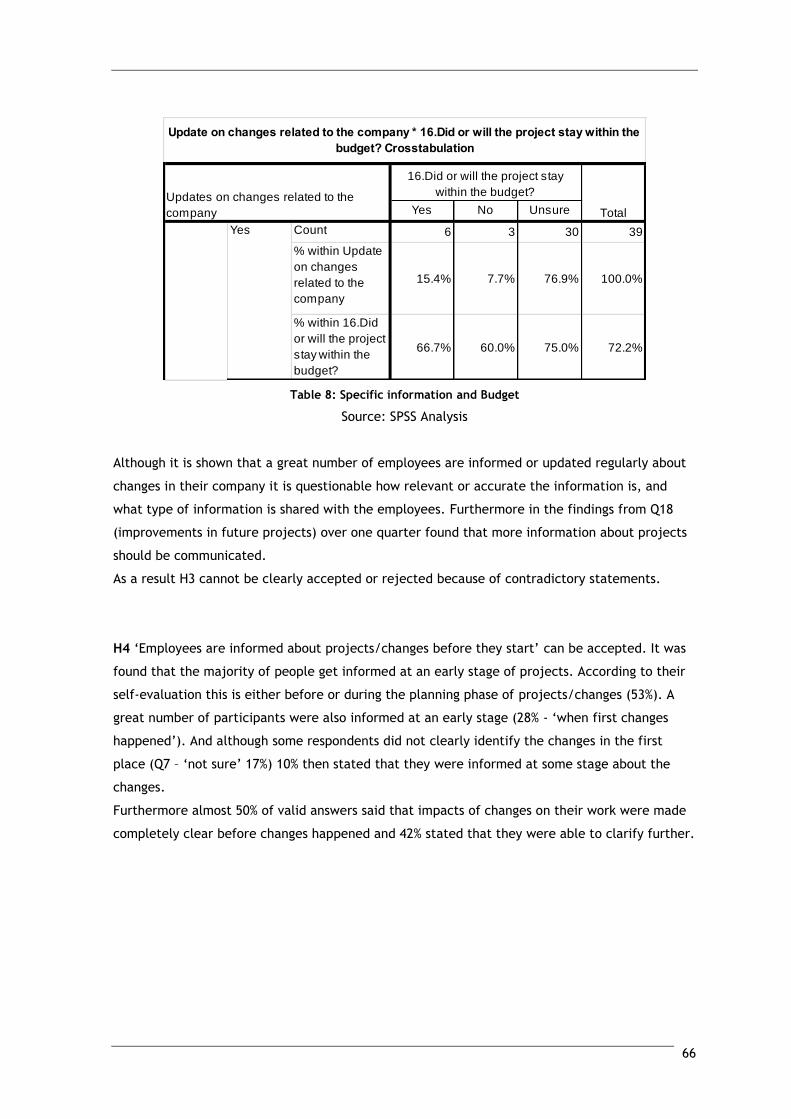
66
Table 8: Specific information and Budget
Source: SPSS Analysis
Although it is shown that a great number of employees are informed or updated regularly about
changes in their company it is questionable how relevant or accurate the information is, and
what type of information is shared with the employees. Furthermore in the findings from Q18
(improvements in future projects) over one quarter found that more information about projects
should be communicated.
As a result H3 cannot be clearly accepted or rejected because of contradictory statements.
H4 „Employees are informed about projects/changes before they start‟ can be accepted. It was
found that the majority of people get informed at an early stage of projects. According to their
self-evaluation this is either before or during the planning phase of projects/changes (53%). A
great number of participants were also informed at an early stage (28% - „when first changes
happened‟). And although some respondents did not clearly identify the changes in the first
place (Q7 – „not sure‟ 17%) 10% then stated that they were informed at some stage about the
changes.
Furthermore almost 50% of valid answers said that impacts of changes on their work were made
completely clear before changes happened and 42% stated that they were able to clarify further.
Yes No Unsure
Count 6 3 30 39
% within Update
on changes
related to the
company
15.4% 7.7% 76.9% 100.0%
% within 16.Did
or will the project
stay within the
budget?
66.7% 60.0% 75.0% 72.2%
Update on changes related to the company * 16.Did or will the project stay within the
budget? Crosstabulation
Updates on changes related to the
company
16.Did or will the project stay
within the budget?
Total
Yes
67
5.1 Limitations of the Study
There are certain limitations in this study, some resulting out of the nature of this study and
some are given due to the execution of it.
As mentioned earlier there are several limitations, resulting of the methodologies used in this
dissertation (section 3.4 „Limitations of Methodology‟).
These are the cross-sectional timeframe of the study which results in the collection of data at
only one point in time, the use of self-completing web-based questionnaires as opposed to other
data collecting methods, which only allowed a certain number of questions.
The generalisation of the results of the study to tour operators in Ireland or worldwide is not
possible. Firstly and most influential is the fact that the adjusted minimum sample size was not
reached. The result of only 81 valid questionnaires builds 41% of the needed sample size. This
low number of respondents had effects on the calculations and analyses of SPSS. Several tests
(such as the Chi-square test) did not produce valid results because this.
Secondly differences in cultural intelligence, values and beliefs influence communication styles,
therefore studies with specific focus on different culture groups would be needed to identify
similarities within those groups.
Lastly it has to be said that due to the lack of participants not only a generalisation of the study
results is not possible also the validity and significance is questionable when based on the
calculated values.
But due to the consistency of answers it is assumed that the overall outcome of the study would
not change drastically if the minimum size would have been reached.
68
6 Conclusion
In conclusion the overall hypothesis that „resistance to change of all level employees has an
impact on the change process and its outcome (overall success or failure) and that effective and
open communication will minimise resistance and increase commitment to the project/change
process, was only supported to a certain extent through combined findings of secondary data.
The primary data did not give enough information to accept or reject this specific hypothesis.
While not all hypotheses could be confirmed, the study showed that based on the participating
companies and employees, communication in general and project or change-related
communication is perceived to be good but can be improved, especially regarding more specific
information on changes within the company.
It was found that employees would like to be informed about changes and get involved in
projects at an early stage, especially when they are directly affected which is congruent with
the general literature findings. Improved communication in participating tour operators can lead
to a higher success rate in projects, e.g. staying within budget and the given time frame.
Furthermore the early open communication within the company can create a higher sense of
certainty and involvement of employees in these companies which can result in an increased
company loyalty and proudness.
69
7 Recommendations
Recommendations for tour operators
Based on the findings of this dissertation firstly the importance of recognising, identifying and
responding to resistance was shown to be an important factor when changes are occurring in a
company. As stated by a number of authors communication can be an effective way to reduce
negative influences of resistance and increase the use of opportunities it can bring (Bareil, 2013;
Matos Marques Simoes and Esposito, 2014; McKay, Kuntz and Näswall, 2013).
Secondly findings of the primary research show that specifically change communication can be
improved in the tour operators. Open and informative communication at an early stage is
desired or preferred by employees.
Therefore it is recommended to review the communication process within the company, identify
ways of how communication about change projects can be more effective and targeted.
Investing some time at the beginning to find a suitable way for the company and its employees
will bring results like increased commitment and understanding, less resistance and more
support amongst and from the employees. Companies might use different methods to do this,
which could include direct communication between employees and their direct manager, or the
application of the Prosci‟s ADKAR model. Furthermore garner support of people important in the
internal network of a company and using them as change agents to convince other people of the
necessity and positive implications of change projects, is one way to lower resistance.
All of these where found to be supportive and successful during change periods as mentioned in
the sections 2.5 and 2.6.
Another recommendation for participating companies would be to contract or employ a project
manager or consultant with experience to improve the quality and success rate of undertaken
projects. Within the whole study only once a project manager was mentioned which implies that
the majority of companies either do not employ professional project managers or the project
manager does not have a valuable position within them. The knowledge and experience of a
project manager combines a variety of disciplines, such as time and cost management, project
procurement, quality and risk management and human resource management.
Using a project manager for major projects in the company can improve small projects through
knowledge and experience employees gained during the time the project manager worked
with/in the company.
70
Recommendations for further research
Tourism forms a big part of the economy and only specific areas are widely researched.
Tour operators facilitate people to travel to different places and are therefore responsible for a
big part of the creation of tourism related income. Nevertheless they are one of the areas which
are not as widely researched. Therefore it is recommended to execute a similar study to get
further insight in their operation practices regarding change projects to be able to create more
specific recommendations for performance improvement.
In relation to this it is recommended to undertake the research at a different time of the year to
guarantee a higher number of participants.
Also the expansion into other regions of Ireland could be interesting as to evaluate if there are
differences within the country.
As mentioned before culture is influencing communication styles and objectives. Furthermore
the tourism industry is an employer where different cultures work together. Therefore two
research areas could be of interest. Firstly the influence of expatriates on the communication
style within a company or respectively the influence of the „home-culture‟ on expatriates would
be an interesting field of research.
Secondly the research of communication in change projects to prepare employees for it in other
countries could be valuable. This would allow comparing the results and finding similarities or
differences which allow suggestions for improvements during change projects. Project
management in general would also benefit from these findings.
A further research recommendation for studies focusing on tour operators or tourism in general
is the use of case studies or observational studies to examine resistance to change more closely.
Collaboration with companies could bring more valuable insight.
Another area of interest, which was found during this research, builds the employees working as
interns in companies. Because of the high number of interns employed in tour operators a study
focusing on this group might be interesting to investigate further.
The assumption can be made that interns are not as involved as full time employees (although
this could not be proven in this study due to a limited number of participants) it is interesting to
evaluate their position, integration, opinions, etc. further. Possible methods could be
questionnaires followed by focus groups to get insight.
This study identified some support for theories and techniques in the project, communication,
and change management literature. But it is still necessary to further investigate and explore
these topics with a tourism focus. Therefore the above recommendations where given to
indicate areas for further research.
71
8 References
„Agile Methodology‟ (no date), Available at: http://agilemethodology.org/ (Accessed: 7 July
2014).
„Agile Method‟ (no date), Available at:
http://www.commonplaces.com/sites/commonplaces.com/files/Agile_method.png
(Accessed: 7 July 2014).
„Agile Process Approach‟ (no date), Available at: http://www.commonplaces.com/who-we-
are/our-process (Accessed: 7 July 2014).
Anca, V. (2013) 'Project management – A tool for implementing change in organizations', Studies
In Business & Economics, 8(2), pp. 137-144, Business Source Complete, EBSCOhost
[Online], (Accessed: 27 March 2014).
Bareil, C. (2013) 'Two Paradigms about Resistance to Change', Organization Development
Journal, 31(3), pp.59-71, Business Source Complete, EBSCOhost [Online], (Accessed: 23
April 2014).
Battilana, J. and Casciaro, T. (2013) 'The Network Secrets of Great Change Agents', Harvard
Business Review, 91 (7/8), pp.62-68, Business Source Complete, EBSCOhost [Online],
(Accessed: 23 April 2014).
Besner, C. and Hobbs, B. (2012) 'An Empirical Identification of Project Management Toolsets and
a Comparison among Project Types', Project Management Journal, 43(5), pp.24-46,
Business Source Complete, EBSCOhost [Online], (Accessed: 16 May 2014).
Blumberg, B., Cooper, D.R. and Schindler, P.S. (2008) Business Research Methods, 2nd European
edn. Berkshire: McGraw-Hill Education.
Bryman, A. and Bell, E. (2003) Business research methods, Oxford: Oxford University Press.
By, R. and Dale, C. (2008) 'The successful management of organisational change in tourism SMEs:
Initial findings in UK visitor attractions', International Journal Of Tourism Research,
10(4), pp.305-313, Business Source Complete, EBSCOhost [Online], (Accessed: 24 April
2014).
72
Candela, G. and Figini, P. (2012) The Economics of Tourism Destinations. www.springer.com.
Available at:
http://www.google.ie/url?sa=t&rct=j&q=&esrc=s&source=web&cd=10&ved=0CGEQFjAJ
&url=http%3A%2F%2Fwww.springer.com%2Fcda%2Fcontent%2Fdocument%2Fcda_downlo
addocument%2F9783642208737-c2.pdf%3FSGWID%3D0-0-45-1344805-
p174120361&ei=JNDcU8y3C4Oy7Abp7ICQCQ&usg=AFQjCNGSmik8eVXK4pw-
VBwq909TN_eH5A&bvm=bv.72197243,d.ZGU (Accessed: 2 August 2014).
Carroll, A. (2006) Trust is the key when rating great workplaces, Available at:
http://onlineathens.com/stories/073006/business_20060730047.shtml (Accessed: 6
June 2014).
Collis, J. and Hussey, R. (2014) Business research - a practical guide for undergraduate and
postgraduate students, 4th edn. Hampshire: Palgrave Macmillan Higher Education.
Daniel, L. and Rob, L. (2013) 'The 20th International Conference on Information Technology and
Travel and Tourism: "eTourism: Opportunities and Challenges for the Next 20 Years"',
Anatolia, 24(2), pp.272-275, Hospitality & Tourism Complete, EBSCOhost [Online],
(Accessed: 25 April 2014).
Ford, J.D. and Ford, L.W. (2009) 'Decoding Resistance to Change', Harvard Business Review,
87(4), pp.99-103, Business Source Complete, EBSCOhost [Online], (Accessed: 4 July
2014).
Frigo, M. and Anderson, R. (2014) 'Risk Management Framework: Adapt, Don't Adopt', Strategic
Finance, 96(1), pp.49-53, Business Source Complete, EBSCOhost [Online], (Accessed: 6
June 2014).
'Geert Hofstede' (2009) in BUSINESS: The ultimate resource, A&C Black, London, United
Kingdom. Credo Reference [Online], (Accessed: 6 August 2014).
Hagiu, A. and Tanascovici, M. (2012) 'Competitive position of the European Union Tourism
Industry. Strategies for maintaining it‟, Agricultural Management / Lucrari Stiintifice
Seria I, Management Agricol, 14(2), pp.343-350, Business Source Complete, EBSCOhost
[Online], (Accessed: 25 April 2014).
Institute of Employment Studies (2004) „respect- professional and ethical codes for socio-
economic research in the information society - RESPECT code of practice for socio-
economic research‟, Available at:
http://www.respectproject.org/code/respect_code.pdf (Accessed: 22 April 2014).
73
Irish Travel Agent Association [ITAA] (2014a) „Members Directory Dublin’, Available at:
http://itaa.ie/members/?s=Dublin (Accessed: 25 April 2014).
Irish Travel Agent Association [ITAA] (2014b) „Members Directory Ireland‟, Available at:
http://itaa.ie/members/?s= (Accessed: 25 April 2014).
James, M. (2014) „Scrum Reference Card‟, Available at: http://scrumreferencecard.com/scrum-
reference-card/ (Accessed: 7 July 2014).
Kerzner, H. (2009) Project Management – A Systems Approach to Planning, Scheduling, and
Controlling. 10th edn. Hoboken, NJ: John Wiley & Sons, Inc.
Khairat, G. and Maher, A. (2012) 'Integrating sustainability into tour operator business: an
innovative approach in sustainable tourism', Tourismos, 7(1), pp.213-233, Hospitality &
Tourism Complete, EBSCOhost [Online], (Accessed: 15 May 2014).
Kutsch, E., Browning, T. and Hall, M. (2014) 'Bridging the Risk Gap', Research Technology
Management, 57(2), pp.26-32, Business Source Complete, EBSCOhost [Online],
(Accessed: 5 August 2014).
Larson, E.W. and Gray, C.F. (2011) Project Management - The Managerial Process. 5th edn. New
York: McGraw-Hill Companies Inc.
'Learning style' in BUSINESS: The ultimate resource, A&C Black, London. Credo Reference
[Online], (Accessed: 12 August 2014).
Lebe, S. and Vrecko, I. (2014) „Systemic integration of holistic project- and hospitality
management‟, Kybernetes, 43 (3/4), pp.363-376, Emerald Insight [Online], (Accessed:
24 April 2014).
Lopa, J. and Day, J. (2011) 'Pilot Study to Assess the Readiness of the Tourism Industry in Wales
to Change to Sustainable Tourism Business Practices', Journal Of Hospitality & Tourism
Management, 18(1), pp. 130-139, Hospitality & Tourism Complete, EBSCOhost [Online],
(Accessed: 24 April 2014).
'Management' (2009) in The SAGE glossary of the social and behavioural sciences, Sage
Publications, Thousand Oaks, USA. Credo Reference [Online], (Accessed: 1 June 2014).
74
Matos Marques Simoes, P. and Esposito, M. (2014) „Improving change management: how
communication nature influences resistance to change‟, Journal of Management
Development, 33(4), pp.324-341, Emerald Insight [Online], (Accessed: 24 April 2014).
Mazzei, A. (2014) „Internal communication for employee enablement: Strategies in American and
Italian companies‟, Corporate Communications: An International Journal, 19(1), pp.82-
95, Emerald Insight [Online], (Accessed: 24 June 2014).
Mazzei, A. and Quaratino, L. (2013) 'Designing Organizational Change: Learning from a Grounded
Research Project', Journal of Management & Change, 30/31 (1/2), pp.166-179,
Business Source Complete, EBSCOhost [Online], (Accessed: 23 April 2014).
McKay, K., Kuntz, J. and Näswall, K. (2013) 'The Effect of Affective Commitment,
Communication and Participation on Resistance to Change: The Role of Change
Readiness', New Zealand Journal Of Psychology, 42(2), pp.29-40, Academic Search
Complete, EBSCOhost [Online], (Accessed: 4 July 2014).
Mishra, K., Boynton, L. and Mishra, A. (2014) 'Driving Employee Engagement: The Expanded Role
of Internal Communications', Journal of Business Communication, 51(2), pp.183-202,
Business Source Complete, EBSCOhost [Online], (Accessed: 6 June 2014).
Molinsky, A., Davenport, T., Iyer, B. and Davidson, C. (2012) 'Three skills every 21st-century
manager needs', Harvard Business Review, 1-2, pp.139-143, Academic OneFile, Business
Source Complete, EBSCOhost [Online], (Accessed: 1 June 2014).
Oxford dictionaries (2014a) „Management‟ Available at:
http://www.oxforddictionaries.com/definition/english/management?q=management
(Accessed: 1 June 2014).
Oxford dictionaries (2014b) „Communication‟ Available at:
http://www.oxforddictionaries.com/definition/english/communication?q=communicati
on (Accessed: 8 June 2014).
Oxford dictionaries (2014c) „Change‟ Available at:
http://www.oxforddictionaries.com/definition/english/change (Accessed: 1 June
2014).
75
Parker, D., Charlton, J., Ribeiro, A. and Pathak, R.D. (2013) „Integration of project-based
management and change management: Intervention methodology‟, International
Journal of Productivity and Performance Management, 62(5), pp.534–544, Emerald
Insight [Online], (Accessed: 16 April 2014).
Popescu, L., Iancu, A., Popescu, V. and Vasile, T. (2013) 'Human Resource Management Practice
in the Hospitality and Tourism Industry', Economics, Management & Financial Markets,
8(4), pp.160-165, Business Source Complete, EBSCOhost [Online], (Accessed: 2 August
2014).
PRINCE2 (2009) „Process Map‟, Available at:
http://www.prince2.com/system/files/downloads/prince2-2009-process-model.pdf
(Accessed: 16 May 2014).
PRINCE2 (2014) „What is PRINCE2?‟, Available at: http://www.prince2.com/what-is-prince2
(Accessed: 2 June 2014).
Project Management Institute [PMI] (2013) A guide to the project management body of
knowledge (PMBOK guide). 5th edn. Pennsylvania: Project Management Institute Inc.
Project Management Institute [PMI] (2014) „About us‟, Available at: http://www.pmi.org/About-
Us.aspx (Accessed: 2 June 2014).
Prosci (2012) „Top change management obstacles’, Available at: http://www.change-
management.com/tutorial-2012-bp-obstacles.htm (Accessed: 23 April 2014).
Prosci, (2014a) „About Prosci‟, Available at: http://www.prosci.com/about-prosci/overview/
(Accessed: 3 July 2014).
Prosci (2014b) „ADKAR MODEL‟, Available at: http://www.prosci.com/adkar-model/overview-3/
(Accessed: 3 July 2014).
Prosci, (2014c) „Applications for ADKAR‟, Available at: http://www.prosci.com/adkar-
model/applications-for-adkar/ (Accessed: 4 July 2014).
Prosci, (2014d) „The ADKAR Book‟, Available at: http://www.prosci.com/adkar-model/the-
adkar-book/ (Accessed: 4 July 2014).
76
Quiros, E. (2014) 'Leading People Through Change', Strategic Finance, 96(5), pp.15-16, Business
Source Complete, EBSCOhost [Online], (Accessed: 3 July 2014).
'Resistance' (2004) in The SAGE dictionary of cultural studies, Sage UK, London. [Online],
(Accessed: 23 April 2014).
'Resistance to change' (2014) in The Hutchinson unabridged encyclopedia with atlas and weather
guide, Helicon, Abington, United Kingdom. Credo Reference [Online], (Accessed: 23
April 2014).
Rubin, E. (2013) 'Know-How in the Bank: Instituting a Lessons Learned System to Capitalize on
Intellectual Assets', Global Business & Organizational Excellence, 32(4), pp.36-48,
Business Source Complete, EBSCOhost [Online], (Accessed: 3 July 2014).
Saseanu, A., Dragusin, M. and Petrescu, R. (2010) 'Main influences of the economic crisis on the
Romanian entrepreneurial ventures in the tourism industry: The case of travel
agencies', Tourism & Hospitality Management (2010), pp.587-598, Hospitality &
Tourism Complete, EBSCOhost [Online], (Accessed: 25 April 2014).
Saunders, M., Lewis, P. and Thornhill, A. (2009) Research methods for business students.
Harlow: Pearson Education Ltd.
Schwartz, K., Tapper, R. and Font, X. (2008) 'A Sustainable Supply Chain Management Framework
for Tour Operators', Journal of Sustainable Tourism, 16(3), pp.298-314, Business Source
Complete, EBSCOhost [Online], (Accessed: 24 April 2014).
Smith, J. (2013) „The best companies to work for in 2014‟, Forbes.com. Available at:
http://www.forbes.com/sites/jacquelynsmith/2013/12/11/the-best-companies-to-
work-for-in-2014/ (Accessed: 6 June 2014).
Smollan, R. (2011) 'Engaging with Resistance to Change', University Of Auckland Business Review,
13(1), pp.12-15, Business Source Complete, EBSCOhost [Online], (Accessed: 24 April
2014).
Spasić, V. (2012) 'Integrating sustainable tourism in tour operators‟ supply chain', Singidunum
Journal Of Applied Sciences, 9(1), pp.60-66, Business Source Complete, EBSCOhost
[Online], (Accessed: 24 April 2014).
77
Stoica, M. Mircea, M. and Ghilic-Micu, B. (2013) 'Software Development: Agile vs. Traditional',
Informatica Economica, 17(4), pp.64-76, Business Source Complete, EBSCOhost
[Online], (Accessed: 7 July 2014).
The Standish Group (1995) „The CHAOS Report‟, Available at:
www.standishgroup.com/sample_research/showfile.php?File=chaos_report_1994.pdf
(Accessed: 8 July 2014).
The Standish Group (2010) „The CHAOS Manifesto‟, Available at:
www.standishgroup.com/sample_research/showfile.php?File=CHAOSManifesto2010.pdf
(Accessed: 8 July 2014).
The Standish Group (2012) „The True Cost of a Project‟, Available at:
www.standishgroup.com/sample_research/showfile.php?File=TrueCost.pdf (Accessed:
8 July 2014).
Togna, G. (2014) „Does internal communication to generate trust always increase commitment?:
A study at Micron Technology‟, Corporate Communications: An International Journal,
19(1), pp.64-81, Emerald Insight [Online], (Accessed: 24 June 2014).
'Tour operator' (2001), in Chambers 21st Century dictionary, Chambers Harrap, London. Credo
Reference [Online], (Accessed: 1 August 2014).
Travel Trust Association (no date) „Tour operator‟, Available at:
http://www.traveltrust.co.uk/Default.aspx?tabid=67 (Accessed: 1 August 2014).
Umble, M. and Umble E. (2014) 'Overcoming resistance to change', Industrial Management,
56(1), pp.16-21, Business Source Complete, EBSCOhost [Online], (Accessed: 24 April
2014).
van der Duim, R. and van Marwijk, R. (2006), 'The Implementation of an Environmental
Management System for Dutch Tour Operators: An Actor-network Perspective', Journal
Of Sustainable Tourism, 14(5), pp.449-472, Business Source Complete, EBSCOhost
[Online], (Accessed: 24 April 2014).
Wieczorek-Kosmala, M. (2014) 'Risk management practices from risk maturity models
perspective', Journal for East European Management Studies, 19(2), pp.133-159,
Business Source Complete, EBSCOhost [Online], (Accessed: 6 June 2014).
78
World Tourism Organisation [UNWTO] (2013) „Economic Crisis, International Tourism Decline and
its impact on the poor‟, Available at: http://www.ilo.org/wcmsp5/groups/public/---
ed_dialogue/---sector/documents/publication/wcms_214576.pdf (Accessed: 25 April
2014).
World Tourism Organisation [UNWTO] (2014) Glossary of tourism terms, Available at: https://s3-
eu-west-1.amazonaws.com/staticunwto/Statistics/Glossary+of+terms.pdf (Accessed: 2
August 2014).
Yüksek, S. and Bekmeier-Feuerhahn, S. (2013) 'Culture-Specific Objectives of Change
Communication: An Intercultural Perspective', Journal of Management & Change, 30/31
(1/2), pp.180-193, Business Source Complete, EBSCOhost [Online], (Accessed: 6 August
2014).
Zeynalian, M., Trigunarsyah, B. and Ronagh, H. (2013) 'Modification of Advanced Programmatic
Risk Analysis and Management Model for the Whole Project Life Cycle's Risks', Journal
Of Construction Engineering & Management, 139(1), pp.51-59, Business Source
Complete, EBSCOhost [Online], (Accessed: 4 June 2014).

79
Appendix on self-reflection
This chapter focuses on my learning and development process. It is separated into learning
styles, self-appraisal, problem solving, added value, and plans to sustain and apply the learning.
Learning styles
At the beginning of the first semester the learning styles test from Honey and Mumford (1982,
cited in „Learning Styles‟, 2009) was undertaken as part of a course. The result showed a very
strong preference for „Theorist‟ and a strong preference for „Pragmatist‟. Both of which styles I
found were true, e.g. I am a logical thinker who acts rational, and also prefers to act practical,
realistic, and straight to the point.
A repetition of the test after working on the dissertation for some time showed a slight change. I
now had a strong preference for three of the learning styles. The preference for the „Reflector‟
style increased in this test. The „Reflector‟ is said to collect data extensively, which results in a
longer research and postpones the formulation of a conclusion for as long as possible.
This I had experienced a lot especially at the beginning of the literature review. I felt that
although I was satisfied with a part I kept searching for more sources or different angles. I kept
chapter findings unfinished to add as I kept working. After the test I was more aware of this and
I understood that I did not finish chapters because of the influence of the „Reflector‟ learning
style rather than the under-researched area. It helped me to reach conclusions faster where I
had researched sufficiently.
Self-Appraisal
The additional knowledge acquired while preparing for and writing the dissertation allowed me
to get deeper understanding and additional insight in specific areas of project management. The
content of the courses of the MBA programme especially project management and international
management pointed out some business issues faced today, which created first ideas of the topic
and direction of the dissertation. Focusing on change management and studying various articles
and studies the core topic of communication during change process was found to be important
and interesting. The concentration on tour operators was suitable because of my background in
and knowledge of tourism.
Overall I found that the research has broadened my knowledge in these specific areas. The
individual secondary research I undertook allowed comparing and understanding the current
point of views, e.g. the development in the perception of resistance of change, the most
occurring issues during change and recommendations to reduce or overcome them. Also the
practical studies used showed that the application of recommendations in the literature mirror
the problems faced in practice, but that the techniques or tools are not used or used correctly in
daily business. This was surprising to a certain extent as it was assumed that the practice would
make more use of the theoretical knowledge available.
80
Problem Solving
Due to my focus on tourism in previous studies I had sufficient background to be aware of
problems that could be encountered during the dissertation. One was the availability of specific
research. Although tourism research is a growing field of study there are a lot of specific areas
which are not widely investigated. To overcome this problem multiple sources were used (such
as the databases EBSCO or Emerald) and a variety of search terms were used to increase the
chance of finding relevant articles and studies.
Another problem that was taken into account was the accessibility of participants and the time
when questionnaires where sent. Because the study was close to the summer, one of the busiest
seasons for the industry the questionnaire was sent as early as possible, which resulted in a good
first number of responses. Unfortunately the adjusted minimum sample size was not reached and
additional attempts to increase the responses (e.g. reminders were sent, personal contact was
made and details of further contact persons were collected) where only of minimal impact. For
future research I would try to set it in a less busy time of the year or change the research
method to e.g. a case study which would give more insight into the communication practices in a
company. In order to increase the number of responses the time allocated for the collection of
the data was expanded, which created a backlog in activities. This was worked against with
extra working hours and additional effort to reduce it and stay within the planned timetable.
As experienced in my Bachelor studies it is important to have a balance in the literature used.
This means to be open-minded and objective to not only use sources that support your own
perceptions of a topic or way of thinking. An objective and unbiased point of view has to be
presented in the literature review. I tried to achieve this through extensive research, multiple
databases, and actively searching for the availability of articles that present a different point of
view.
Lastly I want to mention my experience and learning regarding undertaking a survey through
questionnaires. Retrospective I would take more time to compile the questionnaire. Although I
tested and re-phrased questions I found during the analysis that some questions were asked
either too broad or not general enough. Furthermore I would give less multiple answer
questions, as this affected the analysis and the tools that had to be used.
I also learned that although shorter questionnaires are more attractive to respondents and
increase the chance of answers, a researcher should use the amount of questions needed to
reach a valuable outcome. I think that if people are willing to take part they will answer a
questionnaire with any reasonable amount of questions.
In future research I would apply rating-style questions with single answer options which change
the phrasing of questions and should therefore make them easier to understand. This would
allow a higher number of questions without creating a questionnaire that takes too much time to
fill in.
81
Future application
The experience and learning of undertaking the MBA and writing a dissertation had an influence
on skills and knowledge that I regard as important in today‟s work environment. These critical
skills include strategic and analytical thinking, and self-management.
The Project Management stream provided me with important knowledge of all angles of
managing projects, from the technical side to the people side of projects. The deep knowledge
about communication in projects will be valuable in any future career positions.
Furthermore my research skills have improved and developed further. Challenge sources and
statements, synthesise information, and developing and following a research plan are some of
the skills that were developed during this time and which will be useful for my professional and
private future.
Conclusion
The MBA programme was valuable for my personal and professional growth and development. I
am sure that the skills and knowledge gained through the study will be useful for any future
challenges.
The experience of undertaking the MBA and writing the dissertation was challenging but very
valuable and rewarding at the end.
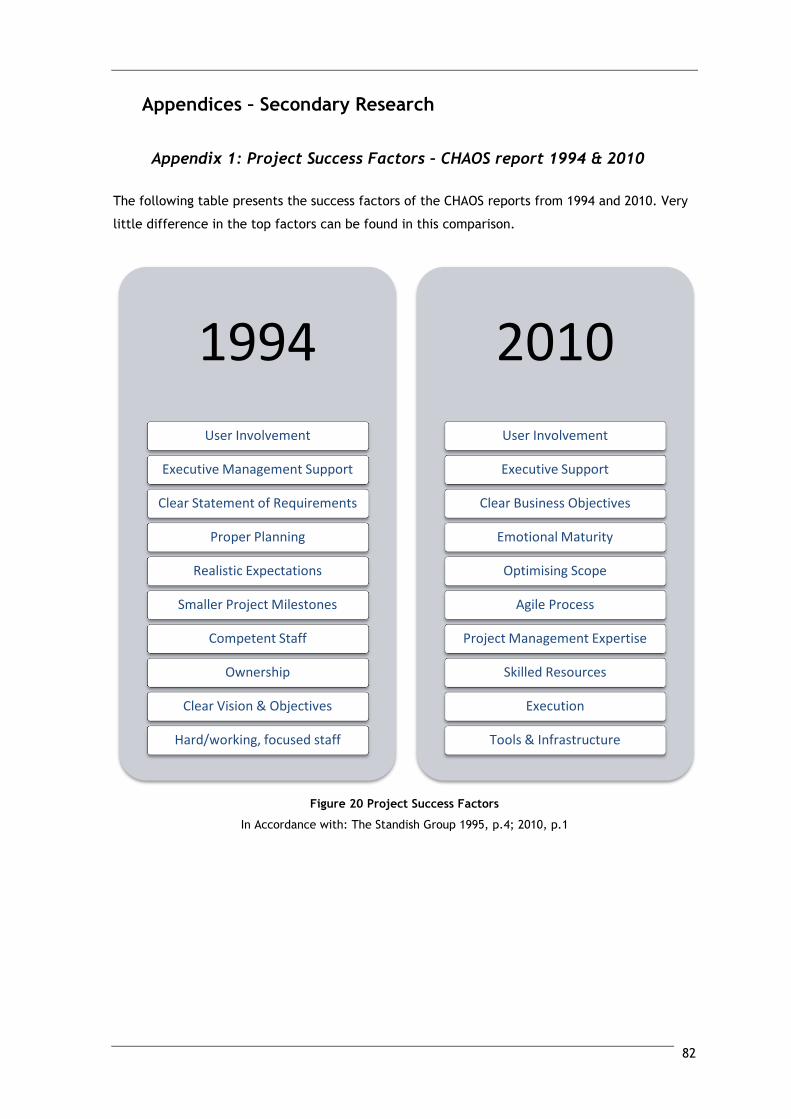
82
Appendices – Secondary Research
Appendix 1: Project Success Factors – CHAOS report 1994 & 2010
The following table presents the success factors of the CHAOS reports from 1994 and 2010. Very
little difference in the top factors can be found in this comparison.
Figure 20 Project Success Factors
In Accordance with: The Standish Group 1995, p.4; 2010, p.1
1994
User Involvement
Executive Management Support
Clear Statement of Requirements
Proper Planning
Realistic Expectations
Smaller Project Milestones
Competent Staff
Ownership
Clear Vision & Objectives
Hard/working, focused staff
2010
User Involvement
Executive Support
Clear Business Objectives
Emotional Maturity
Optimising Scope
Agile Process
Project Management Expertise
Skilled Resources
Execution
Tools & Infrastructure
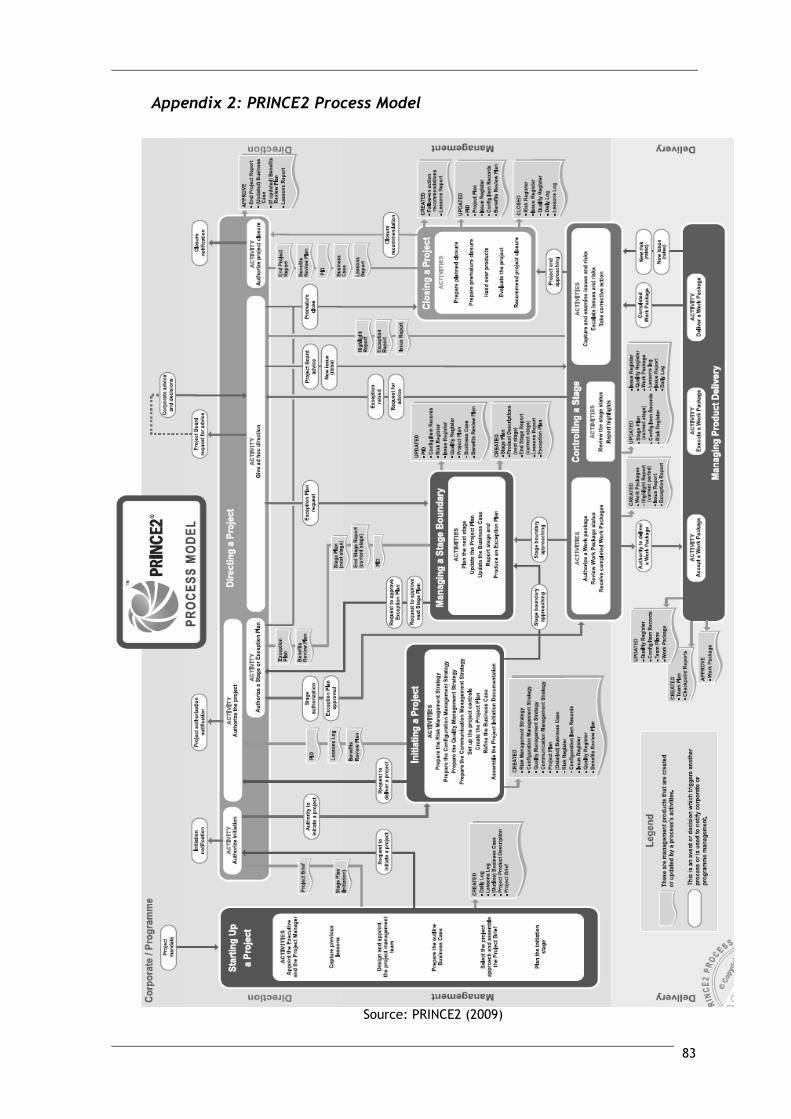
83
Appendix 2: PRINCE2 Process Model
Source: PRINCE2 (2009)
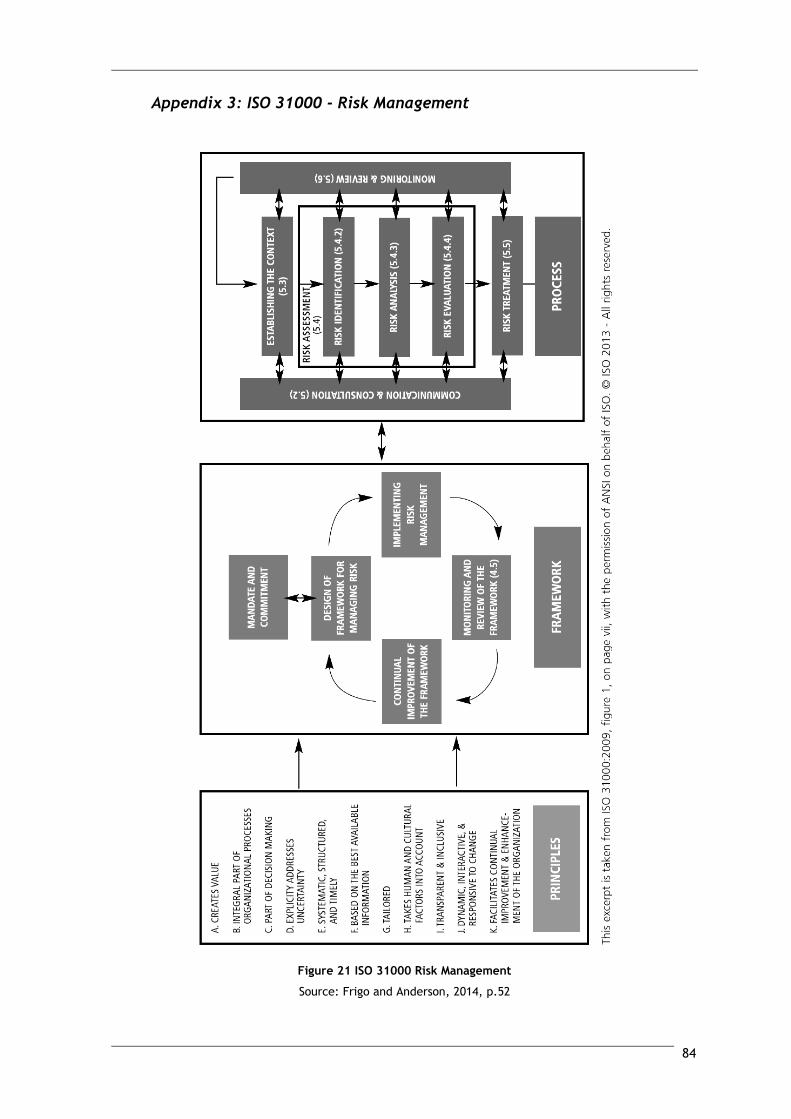
84
Appendix 3: ISO 31000 - Risk Management
Figure 21 ISO 31000 Risk Management
Source: Frigo and Anderson, 2014, p.52
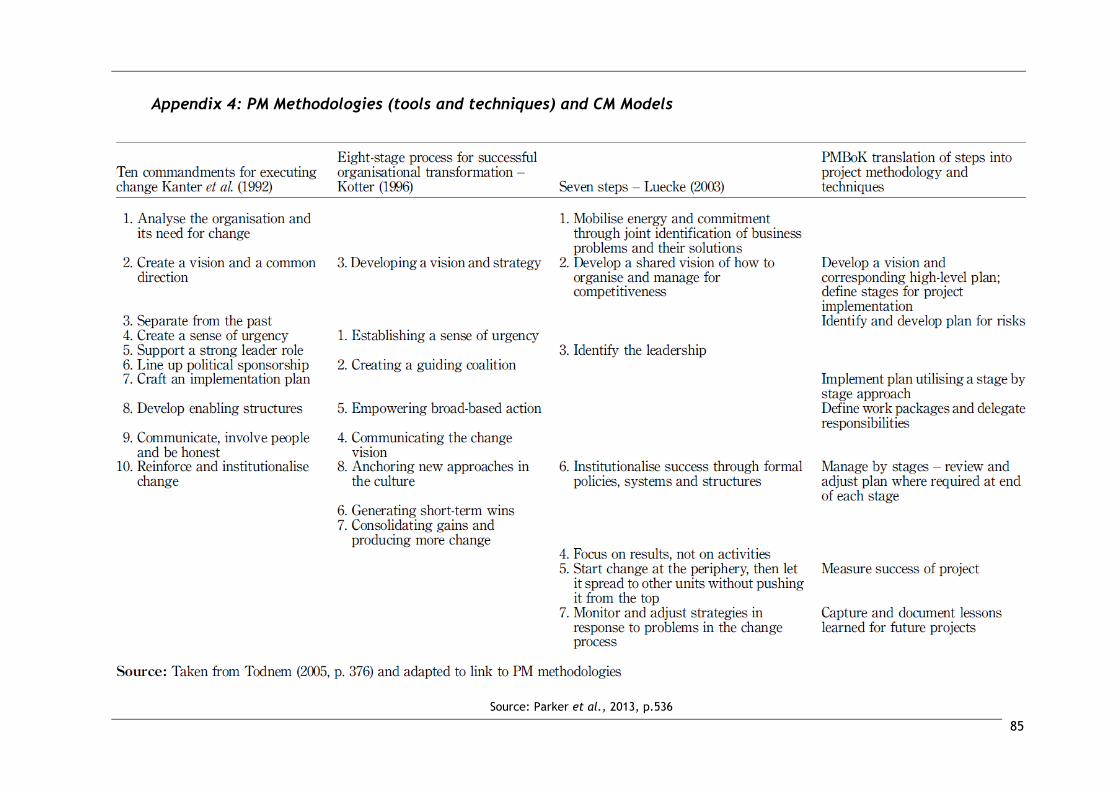
85
Appendix 4: PM Methodologies (tools and techniques) and CM Models
Source: Parker et al., 2013, p.536
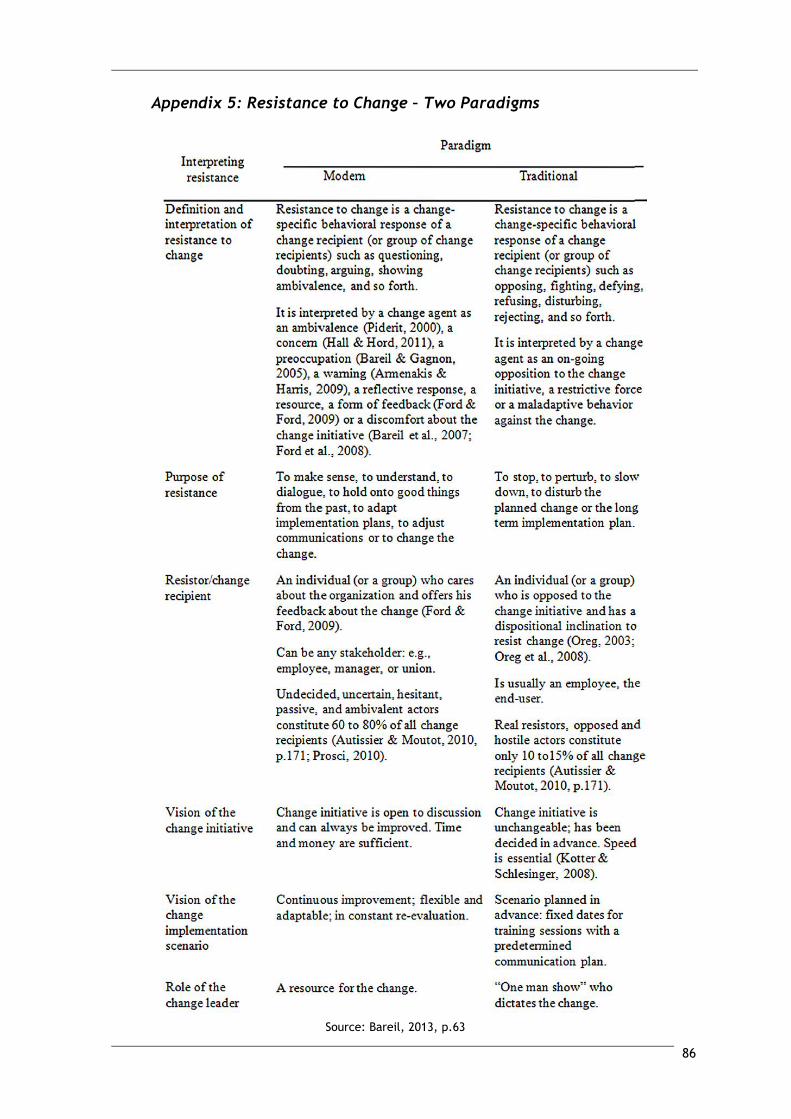
86
Appendix 5: Resistance to Change – Two Paradigms
Source: Bareil, 2013, p.63
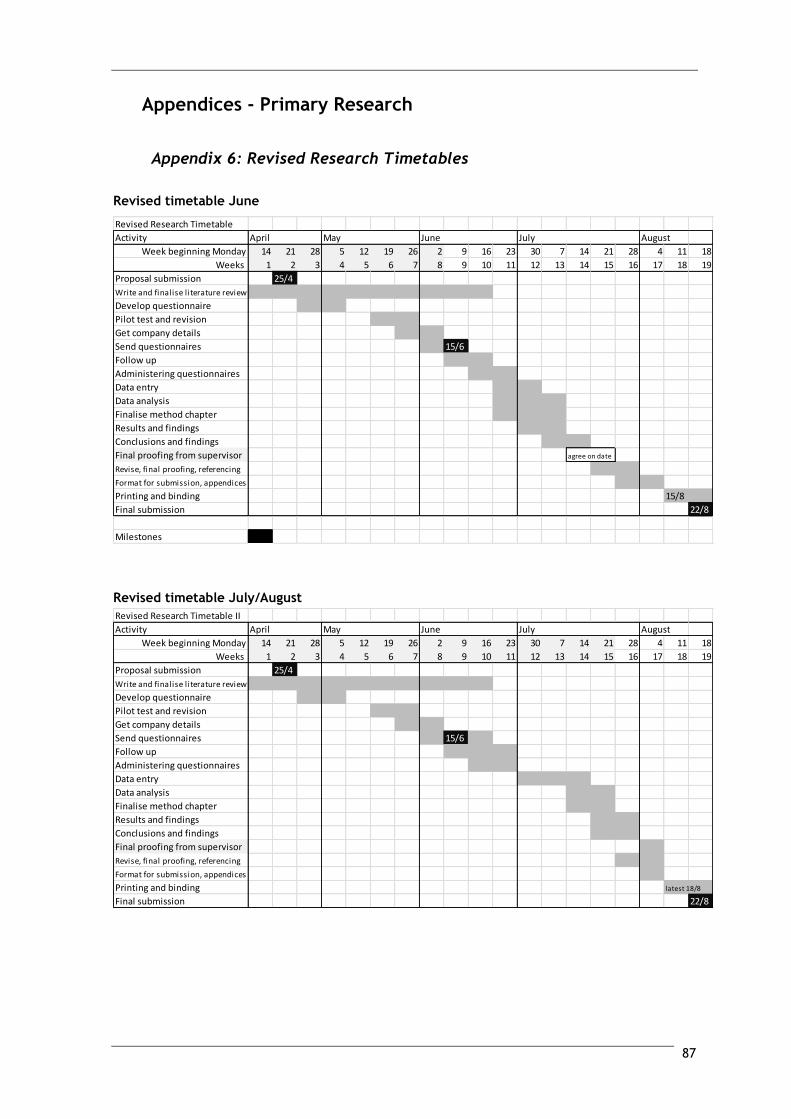
87
Appendices - Primary Research
Appendix 6: Revised Research Timetables
Revised timetable June
Revised timetable July/August
Revised Research Timetable
Activity August
Week beginning Monday 14 21 28 5 12 19 26 2 9 16 23 30 7 14 21 28 4 11 18
Weeks 1 2 3 4 5 6 7 8 9 10 11 12 13 14 15 16 17 18 19
Proposal submission 25/4
Write and finalise l iterature review
Develop questionnaire
Pilot test and revision
Get company details
Send questionnaires 15/6
Follow up
Administering questionnaires
Data entry
Data analysis
Finalise method chapter
Results and findings
Conclusions and findings
Final proofing from supervisor agree on date
Revise, final proofing, referencing
Format for submission, appendices
Printing and binding 15/8
Final submission 22/8
Milestones
April May June July
Revised Research Timetable II
Activity August
Week beginning Monday 14 21 28 5 12 19 26 2 9 16 23 30 7 14 21 28 4 11 18
Weeks 1 2 3 4 5 6 7 8 9 10 11 12 13 14 15 16 17 18 19
Proposal submission 25/4
Write and finalise l iterature review
Develop questionnaire
Pilot test and revision
Get company details
Send questionnaires 15/6
Follow up
Administering questionnaires
Data entry
Data analysis
Finalise method chapter
Results and findings
Conclusions and findings
Final proofing from supervisor
Revise, final proofing, referencing
Format for submission, appendices
Printing and binding latest 18/8
Final submission 22/8
April May June July

88
Appendix7: Questionnaire
This survey has been designed to provide information for my MBA thesis examining the impact of communication on change. All research conducted by Dublin Business School students is done for the purpose of meeting course requirements. In completing the survey, please try to be as honest and accurate as possible, and do not pause for too long over any one question. All responses will be treated with the strictest sensitivity and are anonymous. You may withdraw from participation at any time (take note of the exact time and date when you filled out this survey to facilitate removal of your responses if required). I am available at [email protected] if you have any questions or queries. My supervisor is Patrick Mongey and can be contacted at [email protected] Thank you for your cooperation. (Tamara Bartl)
General questions 1. Employment mode
o Part time o Full time
2. How long have you been working for the company? o Less than one year o 1-3 years o 3-5 years o Over 5 years
3. What is your current position? o Intern position o Assistant position o Executive position o Middle management position o Upper management position o Owner
Communication within the company
4. What types of meetings take place in your company? Please choose at least one answer. o One-to-one o Small groups/ intra-departmental o Whole company/ majority of staff o Other: _____________________________
5. How often do they take place? Please choose at least one answer. o Once a week o Once a month o Every three months o Not regularly o Other: _______________________________
6. What topics are discussed in these meetings? Please choose at least one answer. o Individual performance o Upcoming events / news o Possible problems / issues o Update on changes related to the company o Other: ________________________________
Change and projects In the following section the term project relates to company projects which have brought or lead to changes for the company.
7. Have there been changes in your company within the last two years? If yes/not sure, please continue with the next question. If no, please go to question 17.
o Yes o No o Not sure
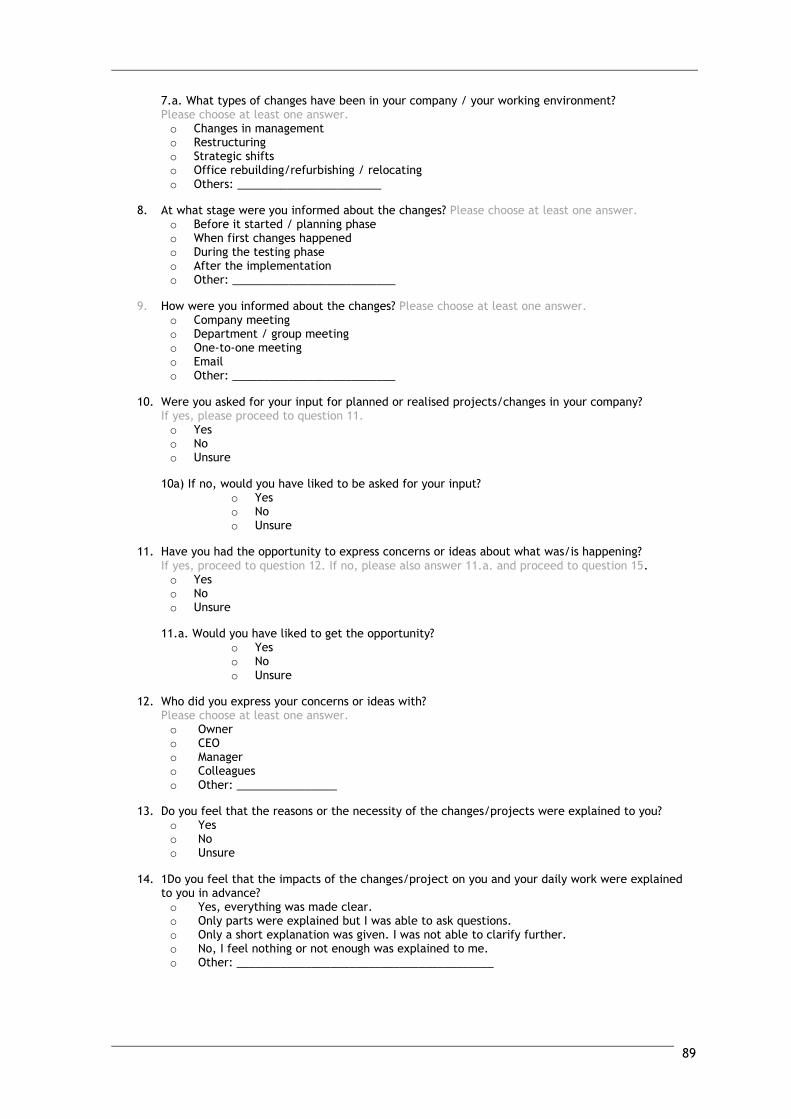
89
7.a. What types of changes have been in your company / your working environment? Please choose at least one answer. o Changes in management o Restructuring o Strategic shifts o Office rebuilding/refurbishing / relocating o Others: _______________________
8. At what stage were you informed about the changes? Please choose at least one answer. o Before it started / planning phase o When first changes happened o During the testing phase o After the implementation o Other: __________________________
9. How were you informed about the changes? Please choose at least one answer. o Company meeting o Department / group meeting o One-to-one meeting o Email o Other: __________________________
10. Were you asked for your input for planned or realised projects/changes in your company? If yes, please proceed to question 11. o Yes o No o Unsure
10a) If no, would you have liked to be asked for your input? o Yes o No o Unsure
11. Have you had the opportunity to express concerns or ideas about what was/is happening? If yes, proceed to question 12. If no, please also answer 11.a. and proceed to question 15. o Yes o No o Unsure
11.a. Would you have liked to get the opportunity? o Yes o No o Unsure
12. Who did you express your concerns or ideas with? Please choose at least one answer. o Owner o CEO o Manager o Colleagues o Other: ________________
13. Do you feel that the reasons or the necessity of the changes/projects were explained to you? o Yes o No o Unsure
14. 1Do you feel that the impacts of the changes/project on you and your daily work were explained to you in advance? o Yes, everything was made clear. o Only parts were explained but I was able to ask questions. o Only a short explanation was given. I was not able to clarify further. o No, I feel nothing or not enough was explained to me. o Other: _________________________________________
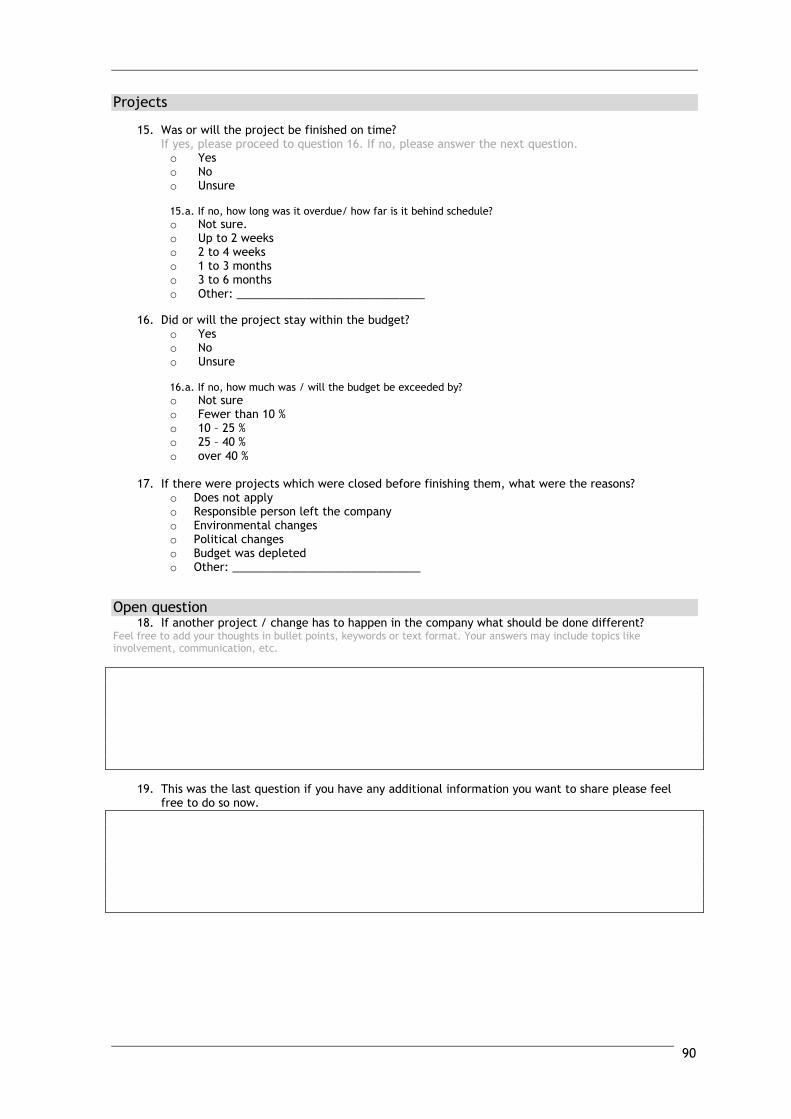
90
Projects
15. Was or will the project be finished on time? If yes, please proceed to question 16. If no, please answer the next question. o Yes o No o Unsure
15.a. If no, how long was it overdue/ how far is it behind schedule?
o Not sure. o Up to 2 weeks o 2 to 4 weeks o 1 to 3 months o 3 to 6 months o Other: ______________________________
16. Did or will the project stay within the budget? o Yes o No o Unsure
16.a. If no, how much was / will the budget be exceeded by?
o Not sure o Fewer than 10 % o 10 – 25 % o 25 – 40 % o over 40 %
17. If there were projects which were closed before finishing them, what were the reasons?
o Does not apply o Responsible person left the company o Environmental changes o Political changes o Budget was depleted o Other: ______________________________
Open question 18. If another project / change has to happen in the company what should be done different?
Feel free to add your thoughts in bullet points, keywords or text format. Your answers may include topics like involvement, communication, etc.
19. This was the last question if you have any additional information you want to share please feel free to do so now.
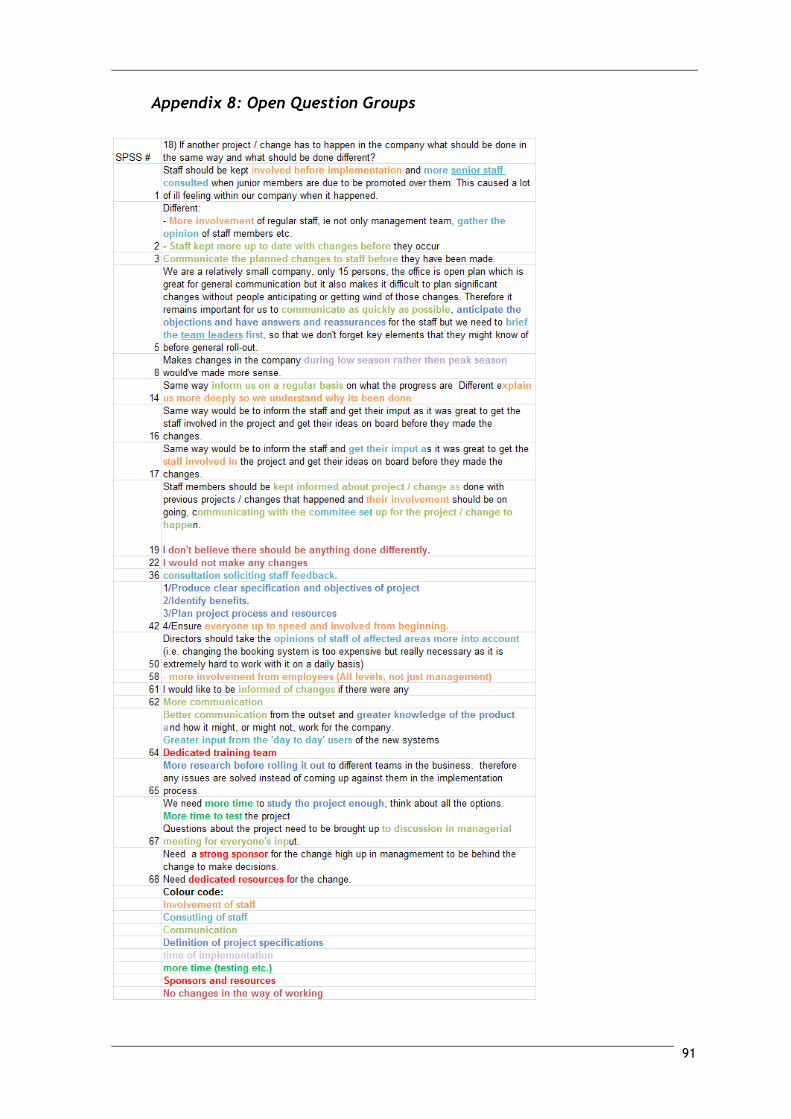
91
Appendix 8: Open Question Groups
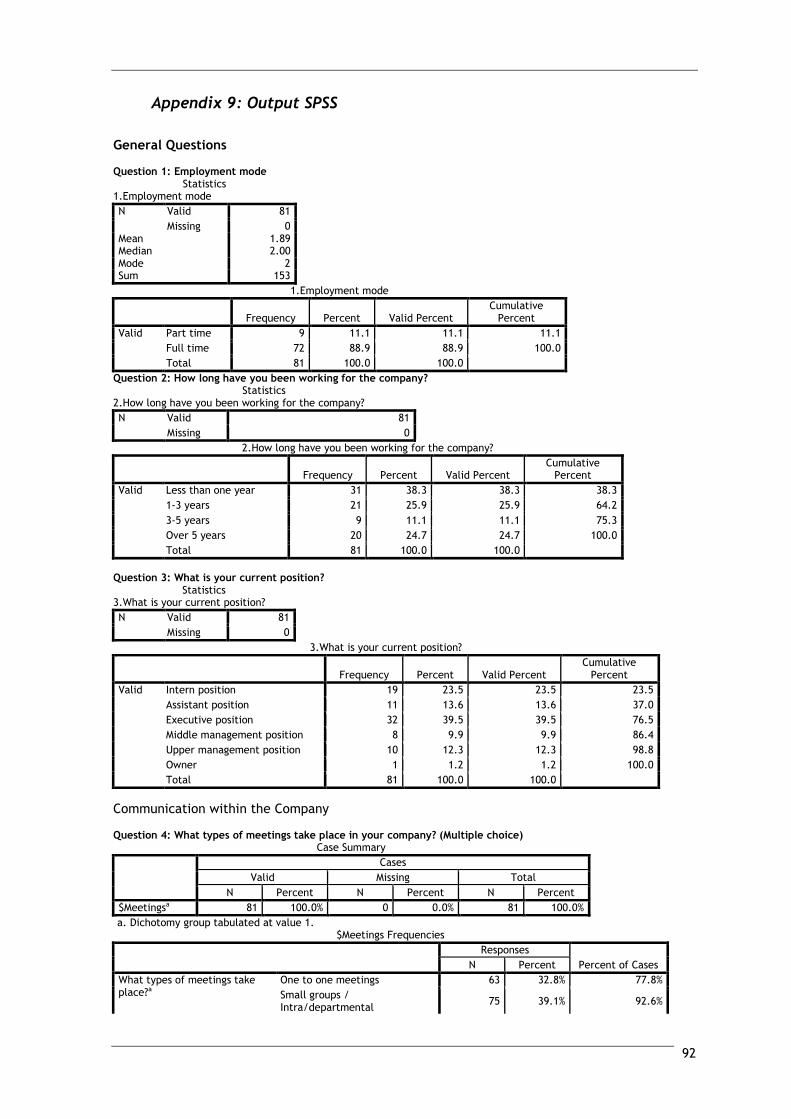
92
Appendix 9: Output SPSS
General Questions Question 1: Employment mode
Statistics 1.Employment mode
N Valid 81
Missing 0 Mean 1.89 Median 2.00 Mode 2 Sum 153
1.Employment mode
Frequency Percent Valid Percent Cumulative
Percent
Valid Part time 9 11.1 11.1 11.1
Full time 72 88.9 88.9 100.0
Total 81 100.0 100.0
Question 2: How long have you been working for the company? Statistics
2.How long have you been working for the company?
N Valid 81
Missing 0
2.How long have you been working for the company?
Frequency Percent Valid Percent Cumulative
Percent
Valid Less than one year 31 38.3 38.3 38.3
1-3 years 21 25.9 25.9 64.2
3-5 years 9 11.1 11.1 75.3
Over 5 years 20 24.7 24.7 100.0
Total 81 100.0 100.0
Question 3: What is your current position?
Statistics 3.What is your current position?
N Valid 81
Missing 0
3.What is your current position?
Frequency Percent Valid Percent Cumulative
Percent
Valid Intern position 19 23.5 23.5 23.5
Assistant position 11 13.6 13.6 37.0
Executive position 32 39.5 39.5 76.5
Middle management position 8 9.9 9.9 86.4
Upper management position 10 12.3 12.3 98.8
Owner 1 1.2 1.2 100.0
Total 81 100.0 100.0
Communication within the Company Question 4: What types of meetings take place in your company? (Multiple choice)
Case Summary
Cases
Valid Missing Total
N Percent N Percent N Percent
$Meetingsa 81 100.0% 0 0.0% 81 100.0%
a. Dichotomy group tabulated at value 1. $Meetings Frequencies
Responses
Percent of Cases N Percent
What types of meetings take place?a
One to one meetings 63 32.8% 77.8%
Small groups / Intra/departmental
75 39.1% 92.6%

93
Whole company / Majority of staff
52 27.1% 64.2%
Other 2 1.0% 2.5% Total 192 100.0% 237.0%
a. Dichotomy group tabulated at value 1. Question 5: How often do they take place? (Multiple choice)
Case Summary
Cases
Valid Missing Total
N Percent N Percent N Percent
$MeetingsFrequencya 81 100.0% 0 0.0% 81 100.0%
a. Dichotomy group tabulated at value 1. $MeetingsFrequency Frequencies
Responses
Percent of Cases N Percent
How often do they take placea Once a week 62 48.8% 76.5%
Once a month 39 30.7% 48.1%
Every three months 10 7.9% 12.3%
Not regularly 8 6.3% 9.9%
Other 8 6.3% 9.9% Total 127 100.0% 156.8%
a. Dichotomy group tabulated at value 1. Question 6: What topics are discussed in these meetings? (Multiple choice)
Case Summary
Cases
Valid Missing Total
N Percent N Percent N Percent
$Topica 81 100.0% 0 0.0% 81 100.0%
a. Dichotomy group tabulated at value 1. $Topic Frequencies
Responses
Percent of Cases N Percent
What is discussed?a Individual performance 48 19.7% 59.3%
Upcoming events / News 65 26.6% 80.2%
Possible problems / issues 69 28.3% 85.2%
Update on changes related to the company
58 23.8% 71.6%
Other 4 1.6% 4.9% Total 244 100.0% 301.2%
a. Dichotomy group tabulated at value 1.
Change and Projects Question 7: Have there been changes in your compnay within the last two years?
Statistics 7.Have there been changes in your company within the last two years?
N Valid 81
Missing 0
7.Have there been changes in your company within the last two years?
Frequency Percent Valid Percent Cumulative
Percent
Valid Yes 64 79.0 79.0 79.0
No 3 3.7 3.7 82.7
Not sure 14 17.3 17.3 100.0
Total 81 100.0 100.0
Question 7a: What types of changes have been in your company / your working environment?
Case Summary
Cases
Valid Missing Total
N Percent N Percent N Percent
$changetypesa 71 87.7% 10 12.3% 81 100.0%
a. Dichotomy group tabulated at value 1.
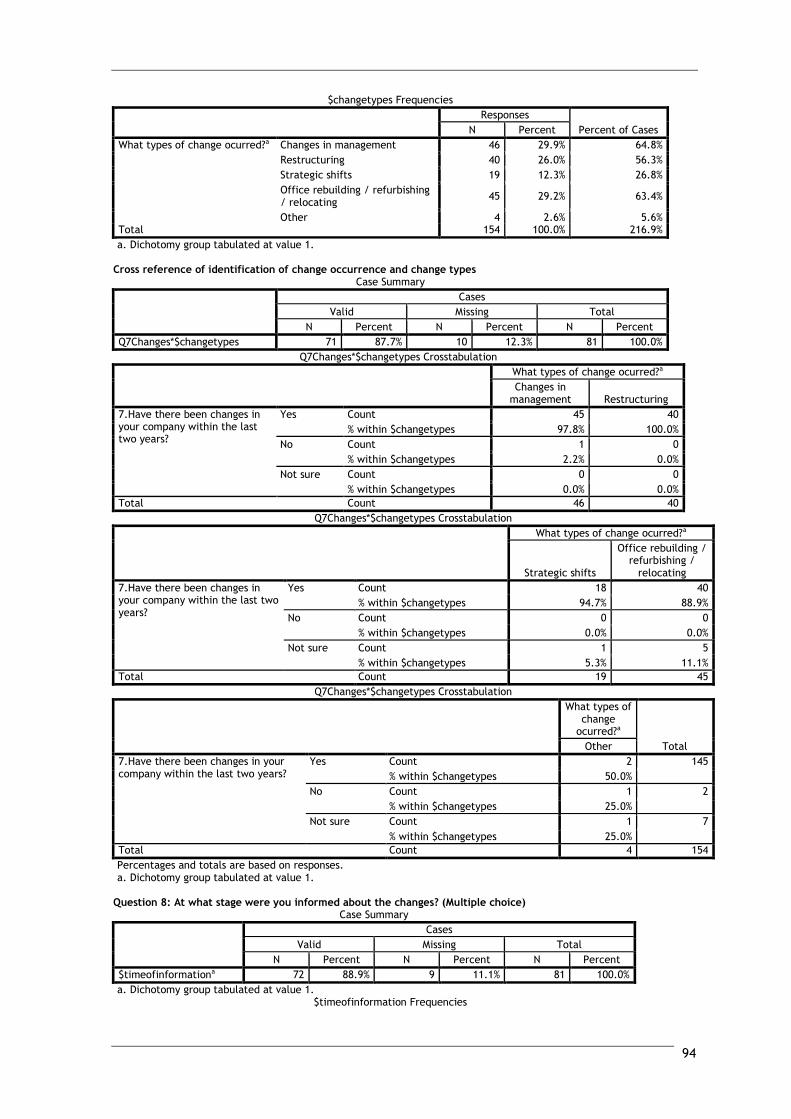
94
$changetypes Frequencies
Responses
Percent of Cases N Percent
What types of change ocurred?a Changes in management 46 29.9% 64.8%
Restructuring 40 26.0% 56.3%
Strategic shifts 19 12.3% 26.8%
Office rebuilding / refurbishing / relocating
45 29.2% 63.4%
Other 4 2.6% 5.6% Total 154 100.0% 216.9%
a. Dichotomy group tabulated at value 1. Cross reference of identification of change occurrence and change types
Case Summary
Cases
Valid Missing Total
N Percent N Percent N Percent
Q7Changes*$changetypes 71 87.7% 10 12.3% 81 100.0%
Q7Changes*$changetypes Crosstabulation
What types of change ocurred?a
Changes in management Restructuring
7.Have there been changes in your company within the last two years?
Yes Count 45 40
% within $changetypes 97.8% 100.0%
No Count 1 0
% within $changetypes 2.2% 0.0%
Not sure Count 0 0
% within $changetypes 0.0% 0.0%
Total Count 46 40
Q7Changes*$changetypes Crosstabulation
What types of change ocurred?a
Strategic shifts
Office rebuilding / refurbishing /
relocating
7.Have there been changes in your company within the last two years?
Yes Count 18 40
% within $changetypes 94.7% 88.9%
No Count 0 0
% within $changetypes 0.0% 0.0%
Not sure Count 1 5
% within $changetypes 5.3% 11.1%
Total Count 19 45
Q7Changes*$changetypes Crosstabulation
What types of change
ocurred?a
Total Other
7.Have there been changes in your company within the last two years?
Yes Count 2 145
% within $changetypes 50.0%
No Count 1 2
% within $changetypes 25.0%
Not sure Count 1 7
% within $changetypes 25.0%
Total Count 4 154
Percentages and totals are based on responses. a. Dichotomy group tabulated at value 1.
Question 8: At what stage were you informed about the changes? (Multiple choice)
Case Summary
Cases
Valid Missing Total
N Percent N Percent N Percent
$timeofinformationa 72 88.9% 9 11.1% 81 100.0%
a. Dichotomy group tabulated at value 1. $timeofinformation Frequencies
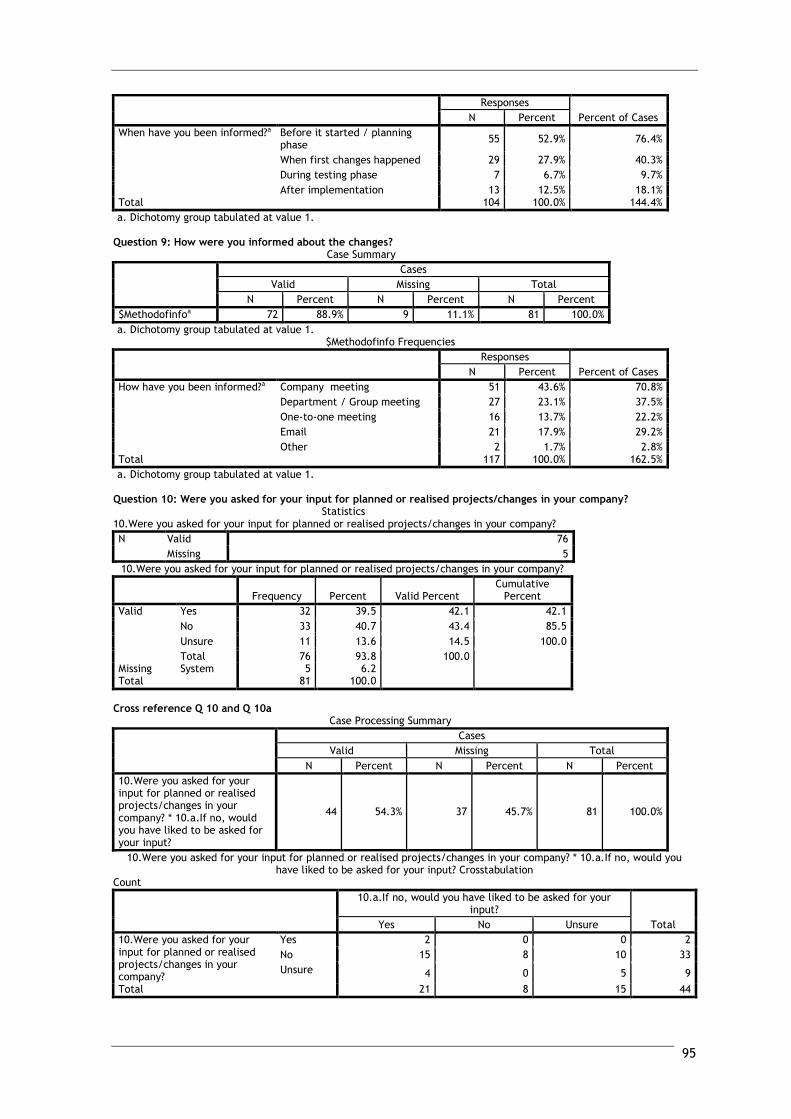
95
Responses
Percent of Cases N Percent
When have you been informed?a Before it started / planning phase
55 52.9% 76.4%
When first changes happened 29 27.9% 40.3%
During testing phase 7 6.7% 9.7%
After implementation 13 12.5% 18.1% Total 104 100.0% 144.4%
a. Dichotomy group tabulated at value 1. Question 9: How were you informed about the changes?
Case Summary
Cases
Valid Missing Total
N Percent N Percent N Percent
$Methodofinfoa 72 88.9% 9 11.1% 81 100.0%
a. Dichotomy group tabulated at value 1. $Methodofinfo Frequencies
Responses
Percent of Cases N Percent
How have you been informed?a Company meeting 51 43.6% 70.8%
Department / Group meeting 27 23.1% 37.5%
One-to-one meeting 16 13.7% 22.2%
Email 21 17.9% 29.2%
Other 2 1.7% 2.8% Total 117 100.0% 162.5%
a. Dichotomy group tabulated at value 1. Question 10: Were you asked for your input for planned or realised projects/changes in your company?
Statistics 10.Were you asked for your input for planned or realised projects/changes in your company?
N Valid 76
Missing 5
10.Were you asked for your input for planned or realised projects/changes in your company?
Frequency Percent Valid Percent Cumulative
Percent
Valid Yes 32 39.5 42.1 42.1
No 33 40.7 43.4 85.5
Unsure 11 13.6 14.5 100.0
Total 76 93.8 100.0 Missing System 5 6.2 Total 81 100.0
Cross reference Q 10 and Q 10a
Case Processing Summary
Cases
Valid Missing Total
N Percent N Percent N Percent
10.Were you asked for your input for planned or realised projects/changes in your company? * 10.a.If no, would you have liked to be asked for your input?
44 54.3% 37 45.7% 81 100.0%
10.Were you asked for your input for planned or realised projects/changes in your company? * 10.a.If no, would you have liked to be asked for your input? Crosstabulation
Count
10.a.If no, would you have liked to be asked for your input?
Total Yes No Unsure
10.Were you asked for your input for planned or realised projects/changes in your company?
Yes 2 0 0 2
No 15 8 10 33
Unsure 4 0 5 9
Total 21 8 15 44
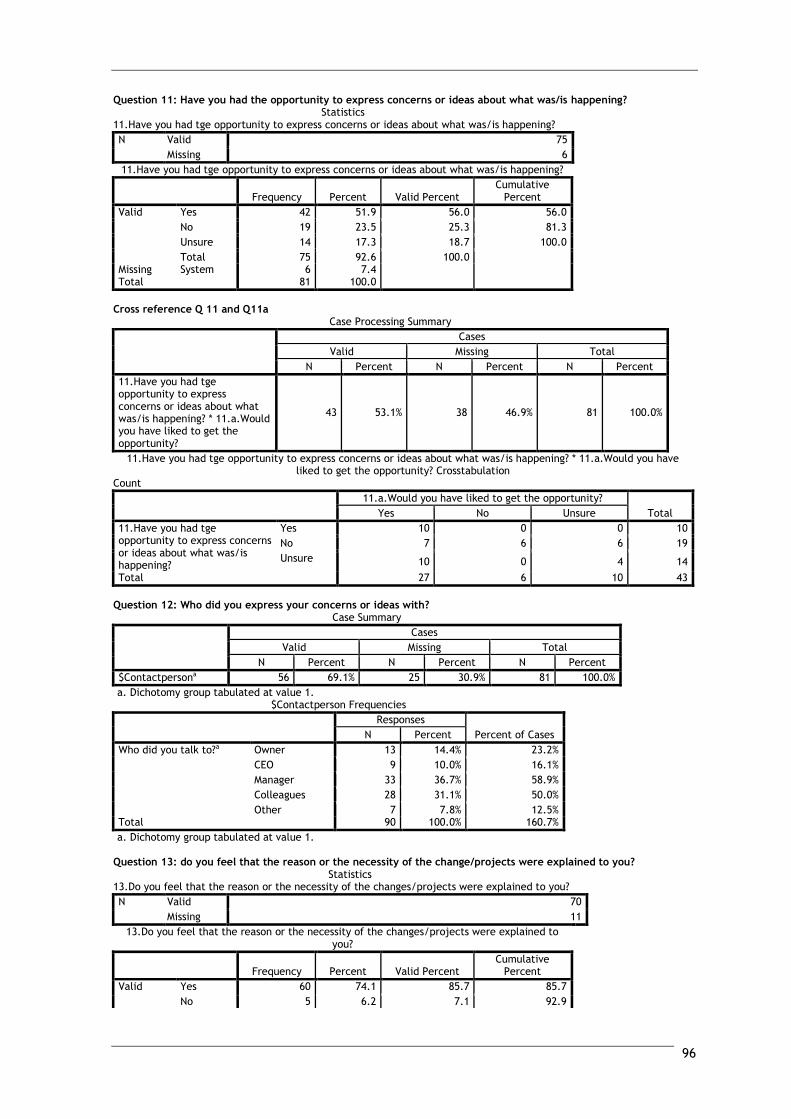
96
Question 11: Have you had the opportunity to express concerns or ideas about what was/is happening? Statistics
11.Have you had tge opportunity to express concerns or ideas about what was/is happening?
N Valid 75
Missing 6
11.Have you had tge opportunity to express concerns or ideas about what was/is happening?
Frequency Percent Valid Percent Cumulative
Percent
Valid Yes 42 51.9 56.0 56.0
No 19 23.5 25.3 81.3
Unsure 14 17.3 18.7 100.0
Total 75 92.6 100.0 Missing System 6 7.4 Total 81 100.0
Cross reference Q 11 and Q11a
Case Processing Summary
Cases
Valid Missing Total
N Percent N Percent N Percent
11.Have you had tge opportunity to express concerns or ideas about what was/is happening? * 11.a.Would you have liked to get the opportunity?
43 53.1% 38 46.9% 81 100.0%
11.Have you had tge opportunity to express concerns or ideas about what was/is happening? * 11.a.Would you have liked to get the opportunity? Crosstabulation
Count
11.a.Would you have liked to get the opportunity?
Total Yes No Unsure
11.Have you had tge opportunity to express concerns or ideas about what was/is happening?
Yes 10 0 0 10
No 7 6 6 19
Unsure 10 0 4 14
Total 27 6 10 43
Question 12: Who did you express your concerns or ideas with?
Case Summary
Cases
Valid Missing Total
N Percent N Percent N Percent
$Contactpersona 56 69.1% 25 30.9% 81 100.0%
a. Dichotomy group tabulated at value 1. $Contactperson Frequencies
Responses
Percent of Cases N Percent
Who did you talk to?a Owner 13 14.4% 23.2%
CEO 9 10.0% 16.1%
Manager 33 36.7% 58.9%
Colleagues 28 31.1% 50.0%
Other 7 7.8% 12.5% Total 90 100.0% 160.7%
a. Dichotomy group tabulated at value 1. Question 13: do you feel that the reason or the necessity of the change/projects were explained to you?
Statistics 13.Do you feel that the reason or the necessity of the changes/projects were explained to you?
N Valid 70
Missing 11
13.Do you feel that the reason or the necessity of the changes/projects were explained to you?
Frequency Percent Valid Percent Cumulative
Percent
Valid Yes 60 74.1 85.7 85.7
No 5 6.2 7.1 92.9
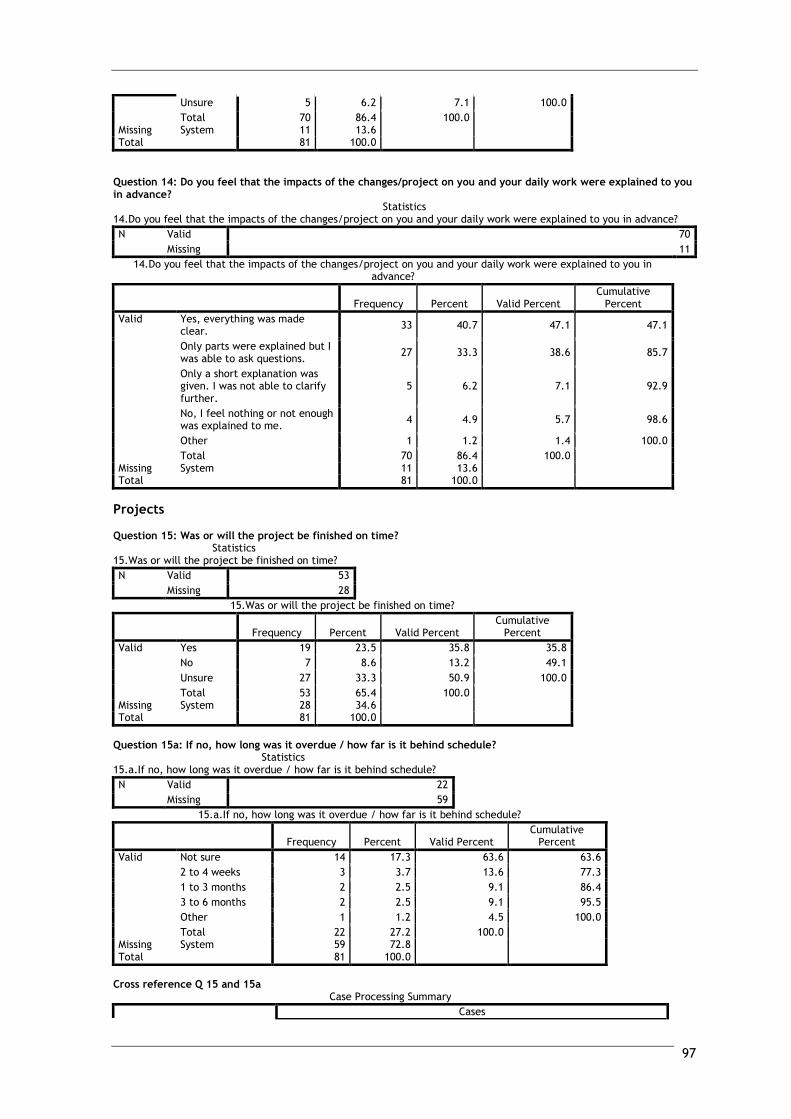
97
Unsure 5 6.2 7.1 100.0
Total 70 86.4 100.0 Missing System 11 13.6 Total 81 100.0
Question 14: Do you feel that the impacts of the changes/project on you and your daily work were explained to you in advance?
Statistics 14.Do you feel that the impacts of the changes/project on you and your daily work were explained to you in advance?
N Valid 70
Missing 11
14.Do you feel that the impacts of the changes/project on you and your daily work were explained to you in advance?
Frequency Percent Valid Percent Cumulative
Percent
Valid Yes, everything was made clear.
33 40.7 47.1 47.1
Only parts were explained but I was able to ask questions.
27 33.3 38.6 85.7
Only a short explanation was given. I was not able to clarify further.
5 6.2 7.1 92.9
No, I feel nothing or not enough was explained to me.
4 4.9 5.7 98.6
Other 1 1.2 1.4 100.0
Total 70 86.4 100.0 Missing System 11 13.6 Total 81 100.0
Projects Question 15: Was or will the project be finished on time?
Statistics 15.Was or will the project be finished on time?
N Valid 53
Missing 28
15.Was or will the project be finished on time?
Frequency Percent Valid Percent Cumulative
Percent
Valid Yes 19 23.5 35.8 35.8
No 7 8.6 13.2 49.1
Unsure 27 33.3 50.9 100.0
Total 53 65.4 100.0 Missing System 28 34.6 Total 81 100.0
Question 15a: If no, how long was it overdue / how far is it behind schedule?
Statistics 15.a.If no, how long was it overdue / how far is it behind schedule?
N Valid 22
Missing 59
15.a.If no, how long was it overdue / how far is it behind schedule?
Frequency Percent Valid Percent Cumulative
Percent
Valid Not sure 14 17.3 63.6 63.6
2 to 4 weeks 3 3.7 13.6 77.3
1 to 3 months 2 2.5 9.1 86.4
3 to 6 months 2 2.5 9.1 95.5
Other 1 1.2 4.5 100.0
Total 22 27.2 100.0 Missing System 59 72.8 Total 81 100.0
Cross reference Q 15 and 15a
Case Processing Summary
Cases
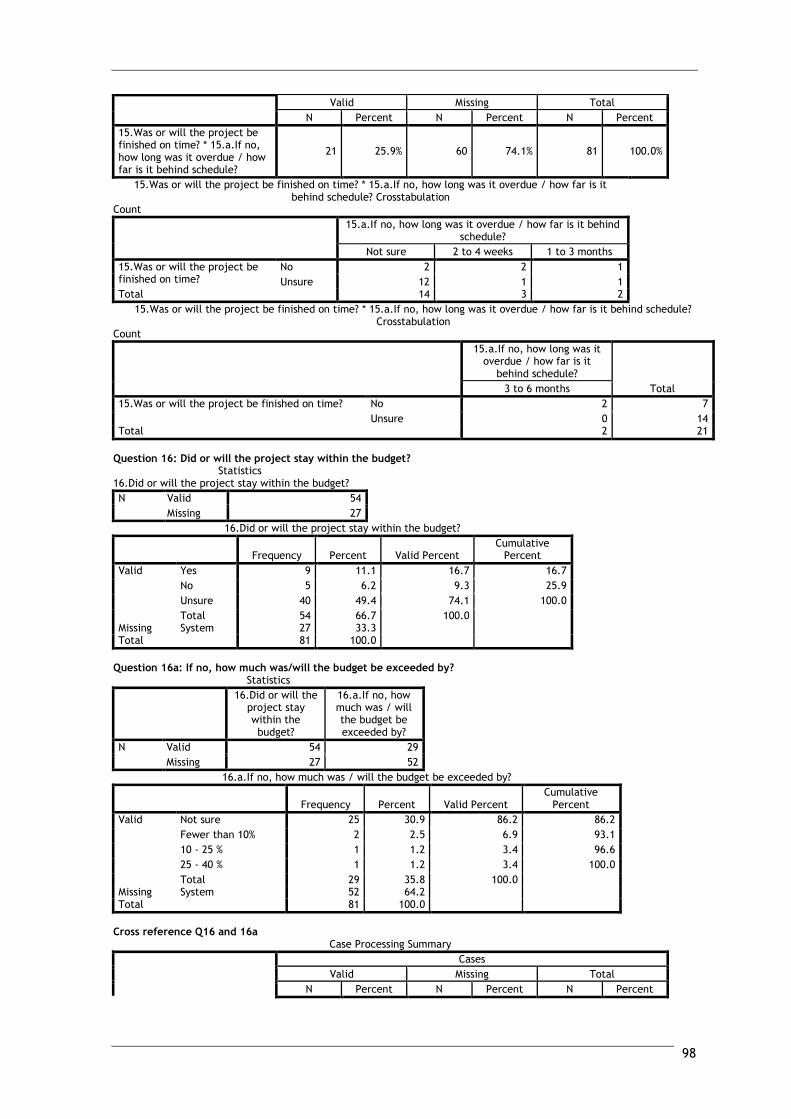
98
Valid Missing Total
N Percent N Percent N Percent
15.Was or will the project be finished on time? * 15.a.If no, how long was it overdue / how far is it behind schedule?
21 25.9% 60 74.1% 81 100.0%
15.Was or will the project be finished on time? * 15.a.If no, how long was it overdue / how far is it behind schedule? Crosstabulation
Count
15.a.If no, how long was it overdue / how far is it behind schedule?
Not sure 2 to 4 weeks 1 to 3 months
15.Was or will the project be finished on time?
No 2 2 1
Unsure 12 1 1 Total 14 3 2
15.Was or will the project be finished on time? * 15.a.If no, how long was it overdue / how far is it behind schedule? Crosstabulation
Count
15.a.If no, how long was it overdue / how far is it
behind schedule?
Total 3 to 6 months
15.Was or will the project be finished on time? No 2 7
Unsure 0 14 Total 2 21
Question 16: Did or will the project stay within the budget?
Statistics 16.Did or will the project stay within the budget?
N Valid 54
Missing 27
16.Did or will the project stay within the budget?
Frequency Percent Valid Percent Cumulative
Percent
Valid Yes 9 11.1 16.7 16.7
No 5 6.2 9.3 25.9
Unsure 40 49.4 74.1 100.0
Total 54 66.7 100.0 Missing System 27 33.3 Total 81 100.0
Question 16a: If no, how much was/will the budget be exceeded by?
Statistics
16.Did or will the project stay within the budget?
16.a.If no, how much was / will the budget be exceeded by?
N Valid 54 29
Missing 27 52
16.a.If no, how much was / will the budget be exceeded by?
Frequency Percent Valid Percent Cumulative
Percent
Valid Not sure 25 30.9 86.2 86.2
Fewer than 10% 2 2.5 6.9 93.1
10 - 25 % 1 1.2 3.4 96.6
25 - 40 % 1 1.2 3.4 100.0
Total 29 35.8 100.0 Missing System 52 64.2 Total 81 100.0
Cross reference Q16 and 16a
Case Processing Summary
Cases
Valid Missing Total
N Percent N Percent N Percent
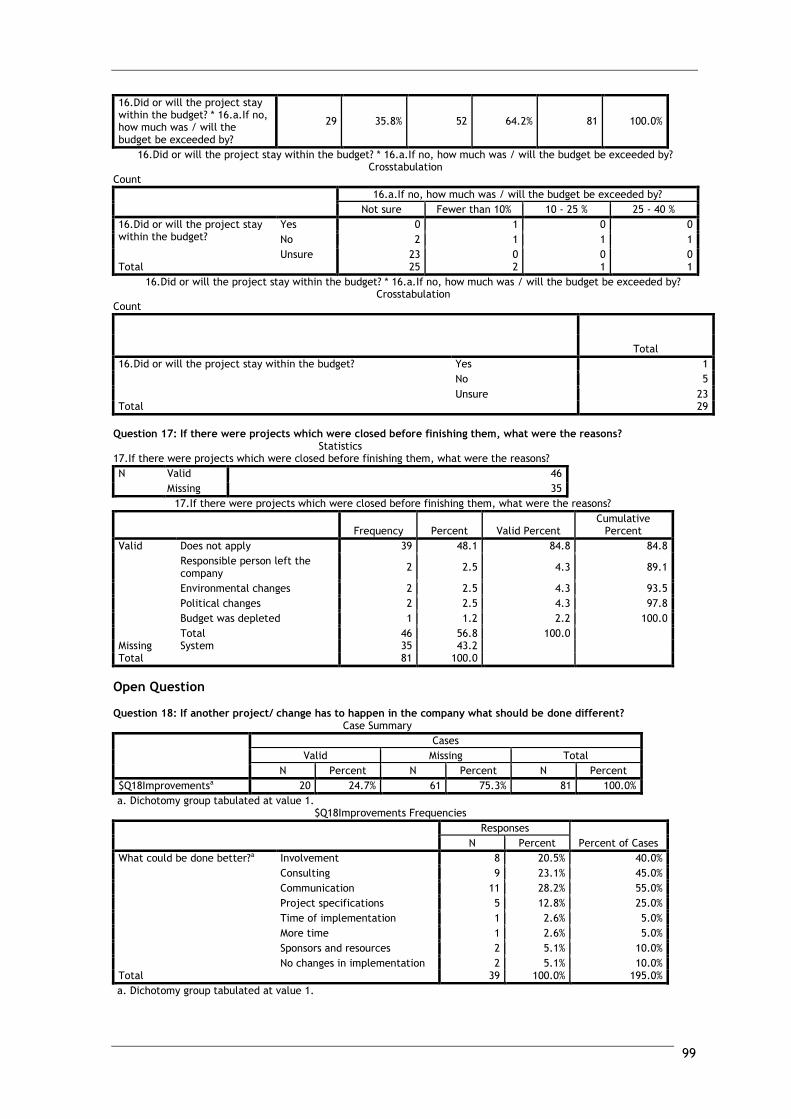
99
16.Did or will the project stay within the budget? * 16.a.If no, how much was / will the budget be exceeded by?
29 35.8% 52 64.2% 81 100.0%
16.Did or will the project stay within the budget? * 16.a.If no, how much was / will the budget be exceeded by? Crosstabulation
Count
16.a.If no, how much was / will the budget be exceeded by?
Not sure Fewer than 10% 10 - 25 % 25 - 40 %
16.Did or will the project stay within the budget?
Yes 0 1 0 0
No 2 1 1 1
Unsure 23 0 0 0 Total 25 2 1 1
16.Did or will the project stay within the budget? * 16.a.If no, how much was / will the budget be exceeded by? Crosstabulation
Count
Total
16.Did or will the project stay within the budget? Yes 1
No 5
Unsure 23 Total 29
Question 17: If there were projects which were closed before finishing them, what were the reasons?
Statistics 17.If there were projects which were closed before finishing them, what were the reasons?
N Valid 46
Missing 35
17.If there were projects which were closed before finishing them, what were the reasons?
Frequency Percent Valid Percent Cumulative
Percent
Valid Does not apply 39 48.1 84.8 84.8
Responsible person left the company
2 2.5 4.3 89.1
Environmental changes 2 2.5 4.3 93.5
Political changes 2 2.5 4.3 97.8
Budget was depleted 1 1.2 2.2 100.0
Total 46 56.8 100.0 Missing System 35 43.2 Total 81 100.0
Open Question Question 18: If another project/ change has to happen in the company what should be done different?
Case Summary
Cases
Valid Missing Total
N Percent N Percent N Percent
$Q18Improvementsa 20 24.7% 61 75.3% 81 100.0%
a. Dichotomy group tabulated at value 1. $Q18Improvements Frequencies
Responses
Percent of Cases N Percent
What could be done better?a Involvement 8 20.5% 40.0%
Consulting 9 23.1% 45.0%
Communication 11 28.2% 55.0%
Project specifications 5 12.8% 25.0%
Time of implementation 1 2.6% 5.0%
More time 1 2.6% 5.0%
Sponsors and resources 2 5.1% 10.0%
No changes in implementation 2 5.1% 10.0% Total 39 100.0% 195.0%
a. Dichotomy group tabulated at value 1.
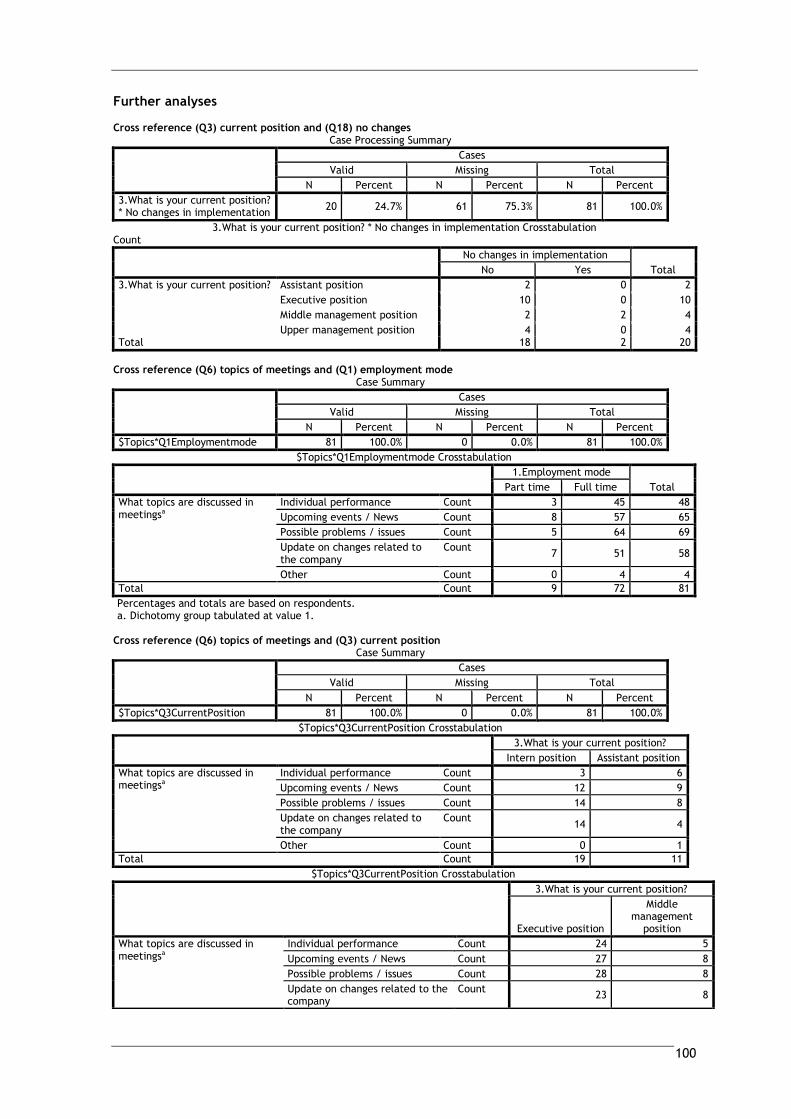
100
Further analyses Cross reference (Q3) current position and (Q18) no changes
Case Processing Summary
Cases
Valid Missing Total
N Percent N Percent N Percent
3.What is your current position? * No changes in implementation
20 24.7% 61 75.3% 81 100.0%
3.What is your current position? * No changes in implementation Crosstabulation Count
No changes in implementation
Total No Yes
3.What is your current position? Assistant position 2 0 2
Executive position 10 0 10
Middle management position 2 2 4
Upper management position 4 0 4 Total 18 2 20
Cross reference (Q6) topics of meetings and (Q1) employment mode
Case Summary
Cases
Valid Missing Total
N Percent N Percent N Percent
$Topics*Q1Employmentmode 81 100.0% 0 0.0% 81 100.0%
$Topics*Q1Employmentmode Crosstabulation
1.Employment mode
Total Part time Full time
What topics are discussed in meetingsa
Individual performance Count 3 45 48
Upcoming events / News Count 8 57 65
Possible problems / issues Count 5 64 69
Update on changes related to the company
Count 7 51 58
Other Count 0 4 4
Total Count 9 72 81
Percentages and totals are based on respondents. a. Dichotomy group tabulated at value 1.
Cross reference (Q6) topics of meetings and (Q3) current position
Case Summary
Cases
Valid Missing Total
N Percent N Percent N Percent
$Topics*Q3CurrentPosition 81 100.0% 0 0.0% 81 100.0%
$Topics*Q3CurrentPosition Crosstabulation
3.What is your current position?
Intern position Assistant position
What topics are discussed in meetingsa
Individual performance Count 3 6
Upcoming events / News Count 12 9
Possible problems / issues Count 14 8
Update on changes related to the company
Count 14 4
Other Count 0 1
Total Count 19 11
$Topics*Q3CurrentPosition Crosstabulation
3.What is your current position?
Executive position
Middle management
position
What topics are discussed in meetingsa
Individual performance Count 24 5
Upcoming events / News Count 27 8
Possible problems / issues Count 28 8
Update on changes related to the company
Count 23 8
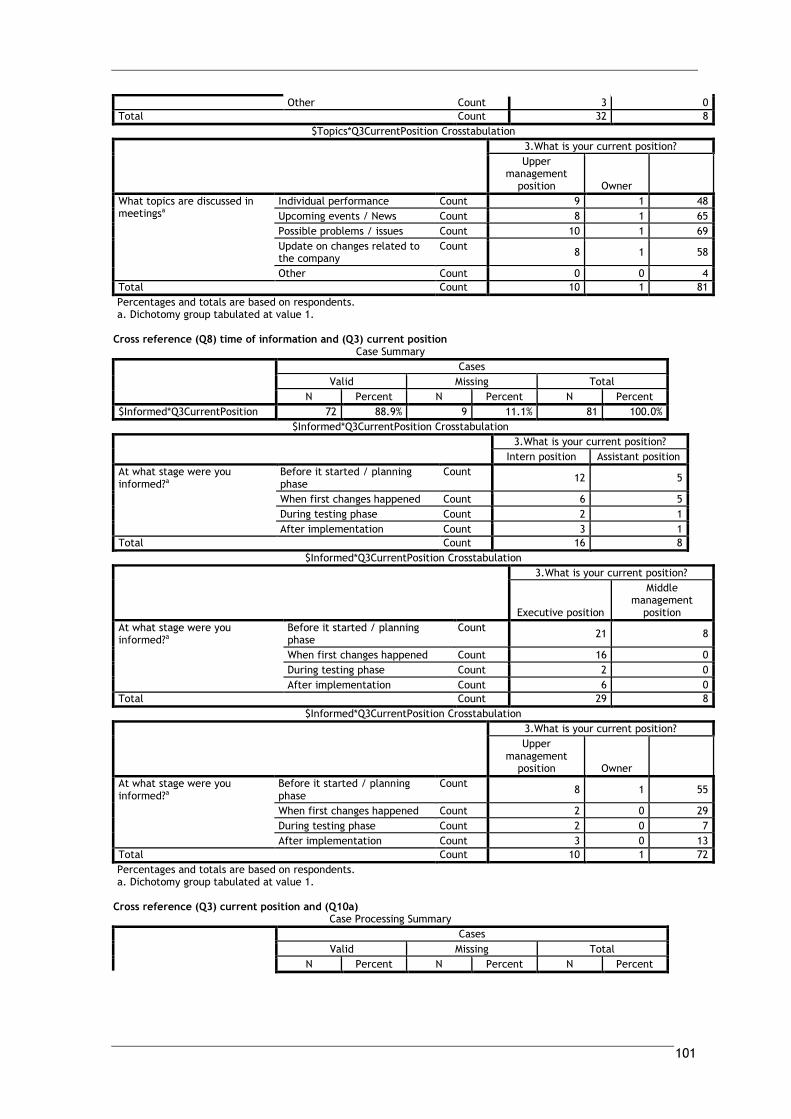
101
Other Count 3 0
Total Count 32 8
$Topics*Q3CurrentPosition Crosstabulation
3.What is your current position?
Upper management
position Owner
What topics are discussed in meetingsa
Individual performance Count 9 1 48
Upcoming events / News Count 8 1 65
Possible problems / issues Count 10 1 69
Update on changes related to the company
Count 8 1 58
Other Count 0 0 4
Total Count 10 1 81
Percentages and totals are based on respondents. a. Dichotomy group tabulated at value 1.
Cross reference (Q8) time of information and (Q3) current position
Case Summary
Cases
Valid Missing Total
N Percent N Percent N Percent
$Informed*Q3CurrentPosition 72 88.9% 9 11.1% 81 100.0%
$Informed*Q3CurrentPosition Crosstabulation
3.What is your current position?
Intern position Assistant position
At what stage were you informed?a
Before it started / planning phase
Count 12 5
When first changes happened Count 6 5
During testing phase Count 2 1
After implementation Count 3 1
Total Count 16 8
$Informed*Q3CurrentPosition Crosstabulation
3.What is your current position?
Executive position
Middle management
position
At what stage were you informed?a
Before it started / planning phase
Count 21 8
When first changes happened Count 16 0
During testing phase Count 2 0
After implementation Count 6 0
Total Count 29 8
$Informed*Q3CurrentPosition Crosstabulation
3.What is your current position?
Upper management
position Owner
At what stage were you informed?a
Before it started / planning phase
Count 8 1 55
When first changes happened Count 2 0 29
During testing phase Count 2 0 7
After implementation Count 3 0 13
Total Count 10 1 72
Percentages and totals are based on respondents. a. Dichotomy group tabulated at value 1.
Cross reference (Q3) current position and (Q10a)
Case Processing Summary
Cases
Valid Missing Total
N Percent N Percent N Percent
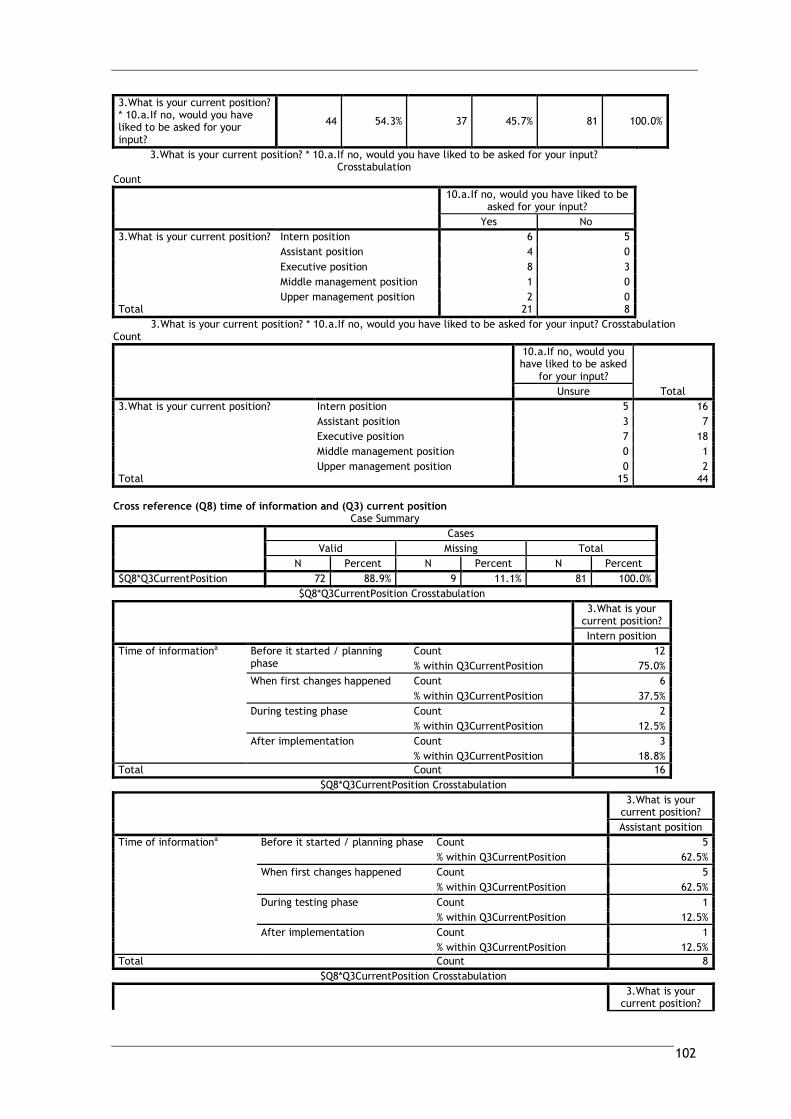
102
3.What is your current position? * 10.a.If no, would you have liked to be asked for your input?
44 54.3% 37 45.7% 81 100.0%
3.What is your current position? * 10.a.If no, would you have liked to be asked for your input? Crosstabulation
Count
10.a.If no, would you have liked to be asked for your input?
Yes No
3.What is your current position? Intern position 6 5
Assistant position 4 0
Executive position 8 3
Middle management position 1 0
Upper management position 2 0 Total 21 8
3.What is your current position? * 10.a.If no, would you have liked to be asked for your input? Crosstabulation Count
10.a.If no, would you have liked to be asked
for your input?
Total Unsure
3.What is your current position? Intern position 5 16
Assistant position 3 7
Executive position 7 18
Middle management position 0 1
Upper management position 0 2 Total 15 44
Cross reference (Q8) time of information and (Q3) current position
Case Summary
Cases
Valid Missing Total
N Percent N Percent N Percent
$Q8*Q3CurrentPosition 72 88.9% 9 11.1% 81 100.0%
$Q8*Q3CurrentPosition Crosstabulation
3.What is your current position?
Intern position
Time of informationa Before it started / planning phase
Count 12
% within Q3CurrentPosition 75.0%
When first changes happened Count 6
% within Q3CurrentPosition 37.5%
During testing phase Count 2
% within Q3CurrentPosition 12.5%
After implementation Count 3
% within Q3CurrentPosition 18.8%
Total Count 16
$Q8*Q3CurrentPosition Crosstabulation
3.What is your current position?
Assistant position
Time of informationa Before it started / planning phase Count 5
% within Q3CurrentPosition 62.5%
When first changes happened Count 5
% within Q3CurrentPosition 62.5%
During testing phase Count 1
% within Q3CurrentPosition 12.5%
After implementation Count 1
% within Q3CurrentPosition 12.5%
Total Count 8
$Q8*Q3CurrentPosition Crosstabulation
3.What is your
current position?
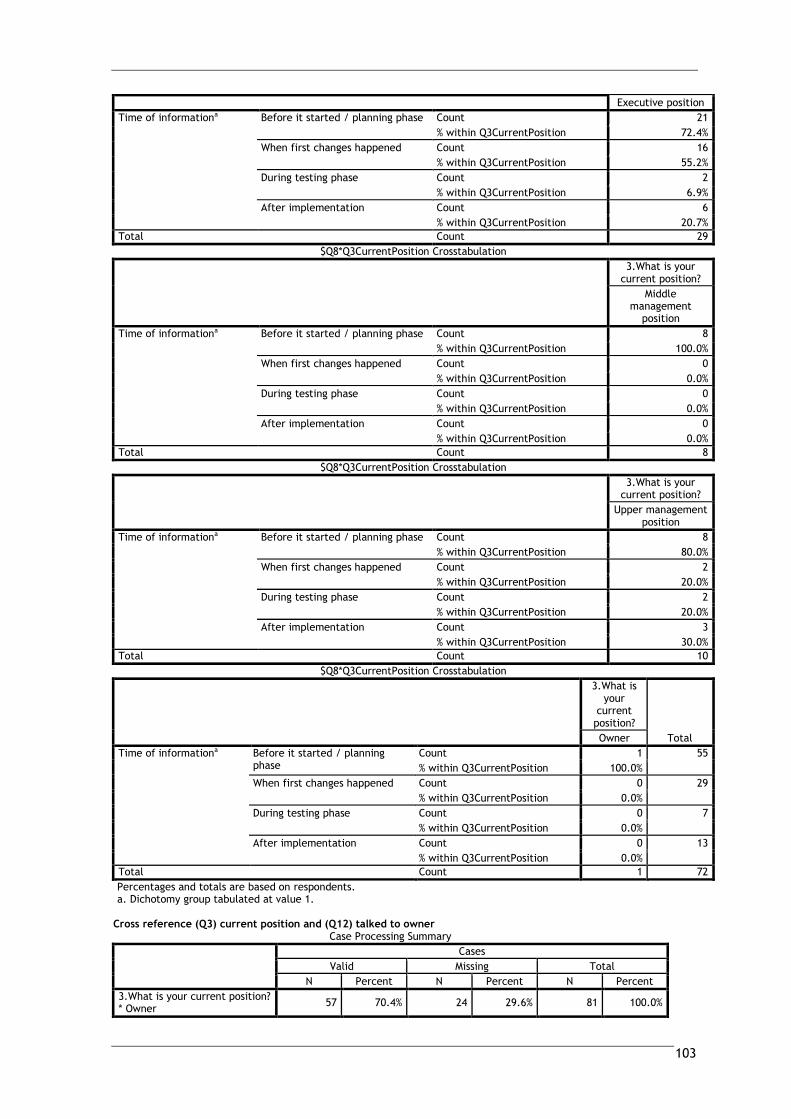
103
Executive position
Time of informationa Before it started / planning phase Count 21
% within Q3CurrentPosition 72.4%
When first changes happened Count 16
% within Q3CurrentPosition 55.2%
During testing phase Count 2
% within Q3CurrentPosition 6.9%
After implementation Count 6
% within Q3CurrentPosition 20.7%
Total Count 29
$Q8*Q3CurrentPosition Crosstabulation
3.What is your current position?
Middle management
position
Time of informationa Before it started / planning phase Count 8
% within Q3CurrentPosition 100.0%
When first changes happened Count 0
% within Q3CurrentPosition 0.0%
During testing phase Count 0
% within Q3CurrentPosition 0.0%
After implementation Count 0
% within Q3CurrentPosition 0.0%
Total Count 8
$Q8*Q3CurrentPosition Crosstabulation
3.What is your current position?
Upper management position
Time of informationa Before it started / planning phase Count 8
% within Q3CurrentPosition 80.0%
When first changes happened Count 2
% within Q3CurrentPosition 20.0%
During testing phase Count 2
% within Q3CurrentPosition 20.0%
After implementation Count 3
% within Q3CurrentPosition 30.0%
Total Count 10
$Q8*Q3CurrentPosition Crosstabulation
3.What is your
current position?
Total Owner
Time of informationa Before it started / planning phase
Count 1 55
% within Q3CurrentPosition 100.0%
When first changes happened Count 0 29
% within Q3CurrentPosition 0.0%
During testing phase Count 0 7
% within Q3CurrentPosition 0.0%
After implementation Count 0 13
% within Q3CurrentPosition 0.0%
Total Count 1 72
Percentages and totals are based on respondents. a. Dichotomy group tabulated at value 1.
Cross reference (Q3) current position and (Q12) talked to owner
Case Processing Summary
Cases
Valid Missing Total
N Percent N Percent N Percent
3.What is your current position? * Owner
57 70.4% 24 29.6% 81 100.0%
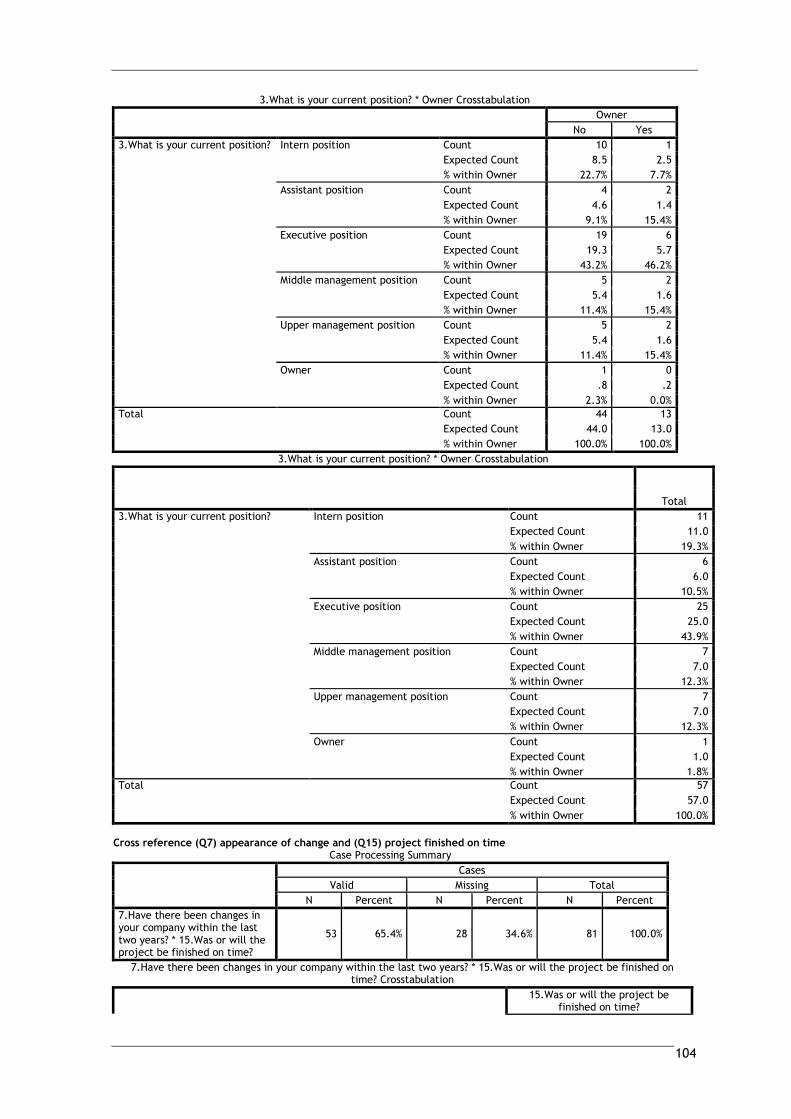
104
3.What is your current position? * Owner Crosstabulation
Owner
No Yes
3.What is your current position? Intern position Count 10 1
Expected Count 8.5 2.5
% within Owner 22.7% 7.7%
Assistant position Count 4 2
Expected Count 4.6 1.4
% within Owner 9.1% 15.4%
Executive position Count 19 6
Expected Count 19.3 5.7
% within Owner 43.2% 46.2%
Middle management position Count 5 2
Expected Count 5.4 1.6
% within Owner 11.4% 15.4%
Upper management position Count 5 2
Expected Count 5.4 1.6
% within Owner 11.4% 15.4%
Owner Count 1 0
Expected Count .8 .2
% within Owner 2.3% 0.0%
Total Count 44 13
Expected Count 44.0 13.0
% within Owner 100.0% 100.0%
3.What is your current position? * Owner Crosstabulation
Total
3.What is your current position? Intern position Count 11
Expected Count 11.0
% within Owner 19.3%
Assistant position Count 6
Expected Count 6.0
% within Owner 10.5%
Executive position Count 25
Expected Count 25.0
% within Owner 43.9%
Middle management position Count 7
Expected Count 7.0
% within Owner 12.3%
Upper management position Count 7
Expected Count 7.0
% within Owner 12.3%
Owner Count 1
Expected Count 1.0
% within Owner 1.8%
Total Count 57
Expected Count 57.0
% within Owner 100.0%
Cross reference (Q7) appearance of change and (Q15) project finished on time
Case Processing Summary
Cases
Valid Missing Total
N Percent N Percent N Percent
7.Have there been changes in your company within the last two years? * 15.Was or will the project be finished on time?
53 65.4% 28 34.6% 81 100.0%
7.Have there been changes in your company within the last two years? * 15.Was or will the project be finished on time? Crosstabulation
15.Was or will the project be
finished on time?
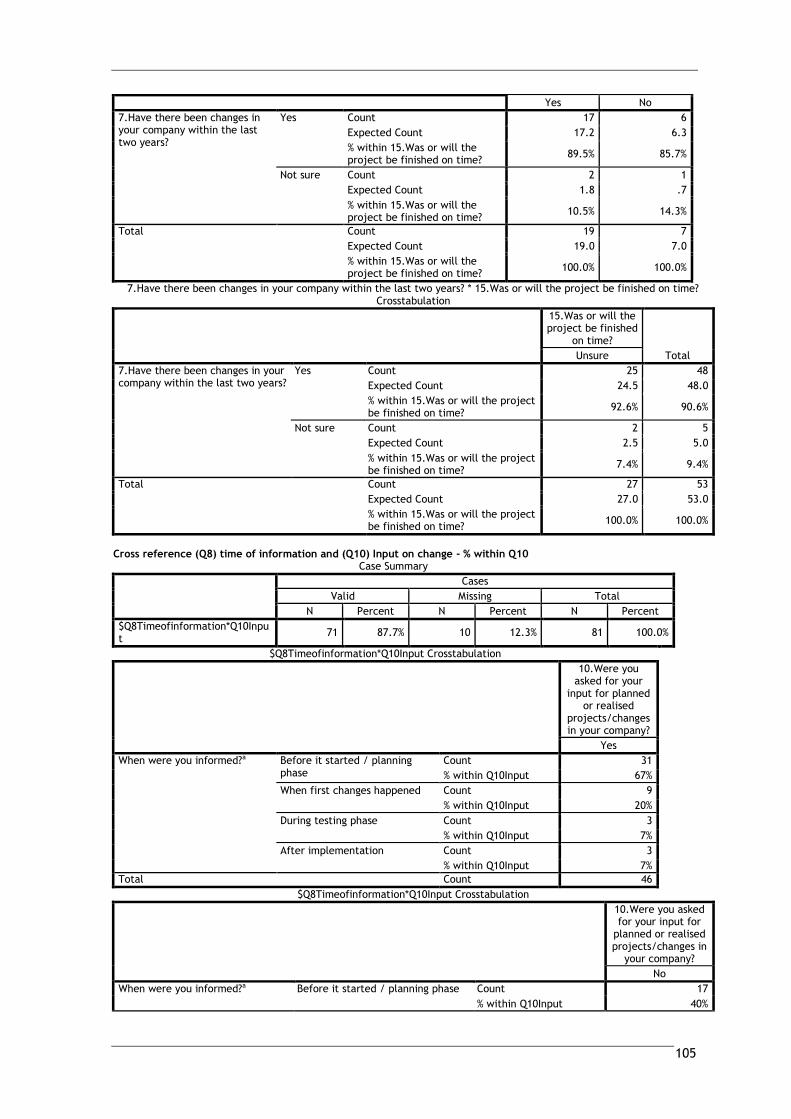
105
Yes No
7.Have there been changes in your company within the last two years?
Yes Count 17 6
Expected Count 17.2 6.3
% within 15.Was or will the project be finished on time?
89.5% 85.7%
Not sure Count 2 1
Expected Count 1.8 .7
% within 15.Was or will the project be finished on time?
10.5% 14.3%
Total Count 19 7
Expected Count 19.0 7.0
% within 15.Was or will the project be finished on time?
100.0% 100.0%
7.Have there been changes in your company within the last two years? * 15.Was or will the project be finished on time? Crosstabulation
15.Was or will the project be finished
on time?
Total Unsure
7.Have there been changes in your company within the last two years?
Yes Count 25 48
Expected Count 24.5 48.0
% within 15.Was or will the project be finished on time?
92.6% 90.6%
Not sure Count 2 5
Expected Count 2.5 5.0
% within 15.Was or will the project be finished on time?
7.4% 9.4%
Total Count 27 53
Expected Count 27.0 53.0
% within 15.Was or will the project be finished on time?
100.0% 100.0%
Cross reference (Q8) time of information and (Q10) Input on change - % within Q10
Case Summary
Cases
Valid Missing Total
N Percent N Percent N Percent
$Q8Timeofinformation*Q10Input
71 87.7% 10 12.3% 81 100.0%
$Q8Timeofinformation*Q10Input Crosstabulation
10.Were you asked for your
input for planned or realised
projects/changes in your company?
Yes
When were you informed?a Before it started / planning phase
Count 31
% within Q10Input 67%
When first changes happened Count 9
% within Q10Input 20%
During testing phase Count 3
% within Q10Input 7%
After implementation Count 3
% within Q10Input 7%
Total Count 46
$Q8Timeofinformation*Q10Input Crosstabulation
10.Were you asked for your input for
planned or realised projects/changes in
your company?
No
When were you informed?a Before it started / planning phase Count 17
% within Q10Input 40%
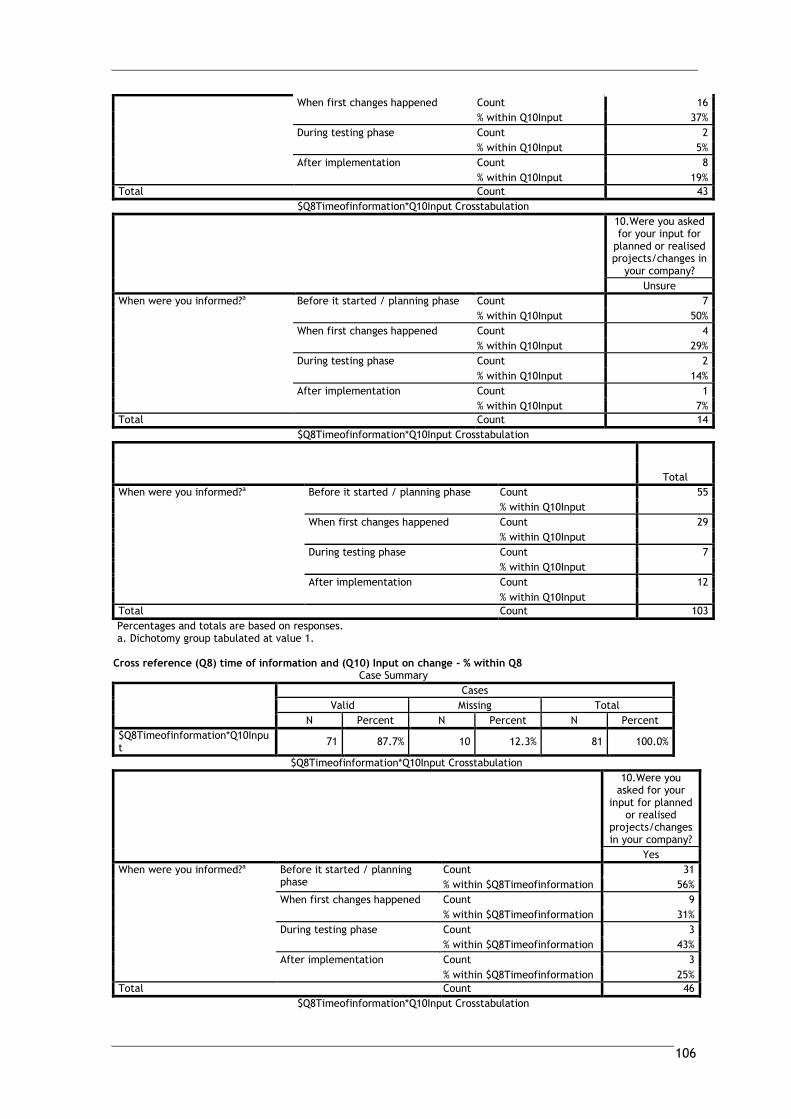
106
When first changes happened Count 16
% within Q10Input 37%
During testing phase Count 2
% within Q10Input 5%
After implementation Count 8
% within Q10Input 19%
Total Count 43
$Q8Timeofinformation*Q10Input Crosstabulation
10.Were you asked for your input for
planned or realised projects/changes in
your company?
Unsure
When were you informed?a Before it started / planning phase Count 7
% within Q10Input 50%
When first changes happened Count 4
% within Q10Input 29%
During testing phase Count 2
% within Q10Input 14%
After implementation Count 1
% within Q10Input 7%
Total Count 14
$Q8Timeofinformation*Q10Input Crosstabulation
Total
When were you informed?a Before it started / planning phase Count 55
% within Q10Input
When first changes happened Count 29
% within Q10Input
During testing phase Count 7
% within Q10Input
After implementation Count 12
% within Q10Input
Total Count 103
Percentages and totals are based on responses. a. Dichotomy group tabulated at value 1.
Cross reference (Q8) time of information and (Q10) Input on change - % within Q8
Case Summary
Cases
Valid Missing Total
N Percent N Percent N Percent
$Q8Timeofinformation*Q10Input
71 87.7% 10 12.3% 81 100.0%
$Q8Timeofinformation*Q10Input Crosstabulation
10.Were you asked for your
input for planned or realised
projects/changes in your company?
Yes
When were you informed?a Before it started / planning phase
Count 31
% within $Q8Timeofinformation 56%
When first changes happened Count 9
% within $Q8Timeofinformation 31%
During testing phase Count 3
% within $Q8Timeofinformation 43%
After implementation Count 3
% within $Q8Timeofinformation 25%
Total Count 46
$Q8Timeofinformation*Q10Input Crosstabulation
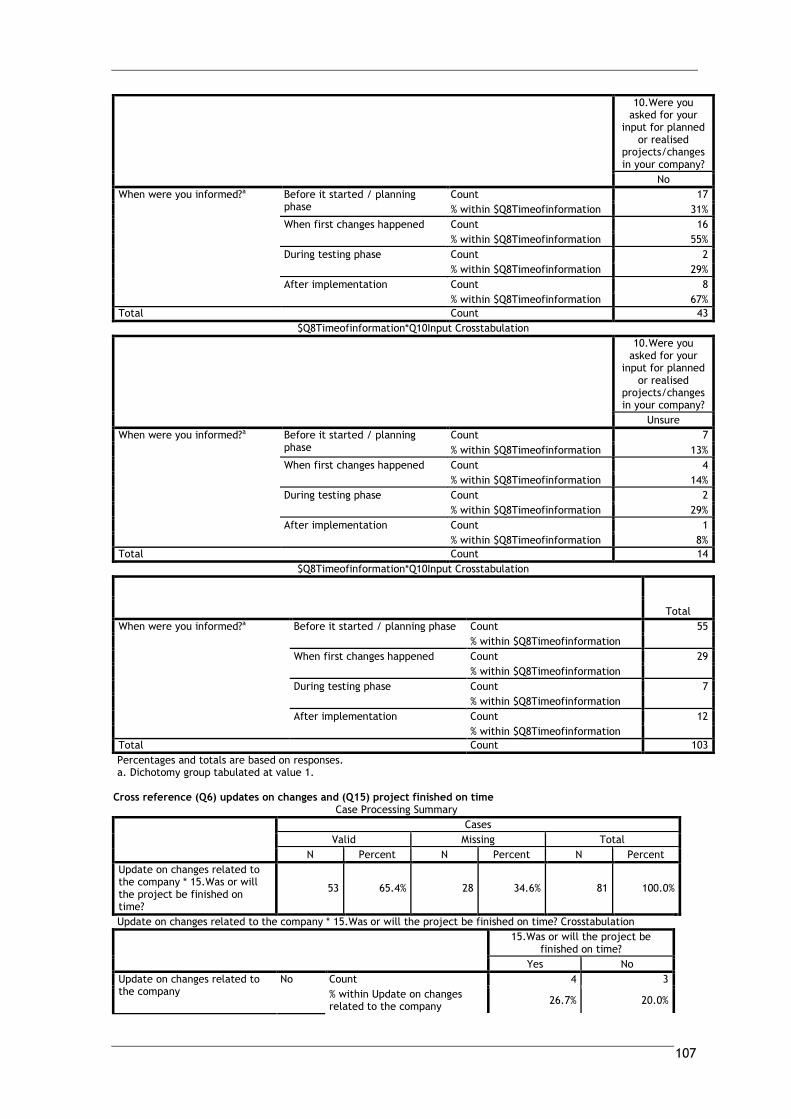
107
10.Were you asked for your
input for planned or realised
projects/changes in your company?
No
When were you informed?a Before it started / planning phase
Count 17
% within $Q8Timeofinformation 31%
When first changes happened Count 16
% within $Q8Timeofinformation 55%
During testing phase Count 2
% within $Q8Timeofinformation 29%
After implementation Count 8
% within $Q8Timeofinformation 67%
Total Count 43
$Q8Timeofinformation*Q10Input Crosstabulation
10.Were you asked for your
input for planned or realised
projects/changes in your company?
Unsure
When were you informed?a Before it started / planning phase
Count 7
% within $Q8Timeofinformation 13%
When first changes happened Count 4
% within $Q8Timeofinformation 14%
During testing phase Count 2
% within $Q8Timeofinformation 29%
After implementation Count 1
% within $Q8Timeofinformation 8%
Total Count 14
$Q8Timeofinformation*Q10Input Crosstabulation
Total
When were you informed?a Before it started / planning phase Count 55
% within $Q8Timeofinformation
When first changes happened Count 29
% within $Q8Timeofinformation
During testing phase Count 7
% within $Q8Timeofinformation
After implementation Count 12
% within $Q8Timeofinformation
Total Count 103
Percentages and totals are based on responses. a. Dichotomy group tabulated at value 1.
Cross reference (Q6) updates on changes and (Q15) project finished on time
Case Processing Summary
Cases
Valid Missing Total
N Percent N Percent N Percent
Update on changes related to the company * 15.Was or will the project be finished on time?
53 65.4% 28 34.6% 81 100.0%
Update on changes related to the company * 15.Was or will the project be finished on time? Crosstabulation
15.Was or will the project be finished on time?
Yes No
Update on changes related to the company
No Count 4 3
% within Update on changes related to the company
26.7% 20.0%
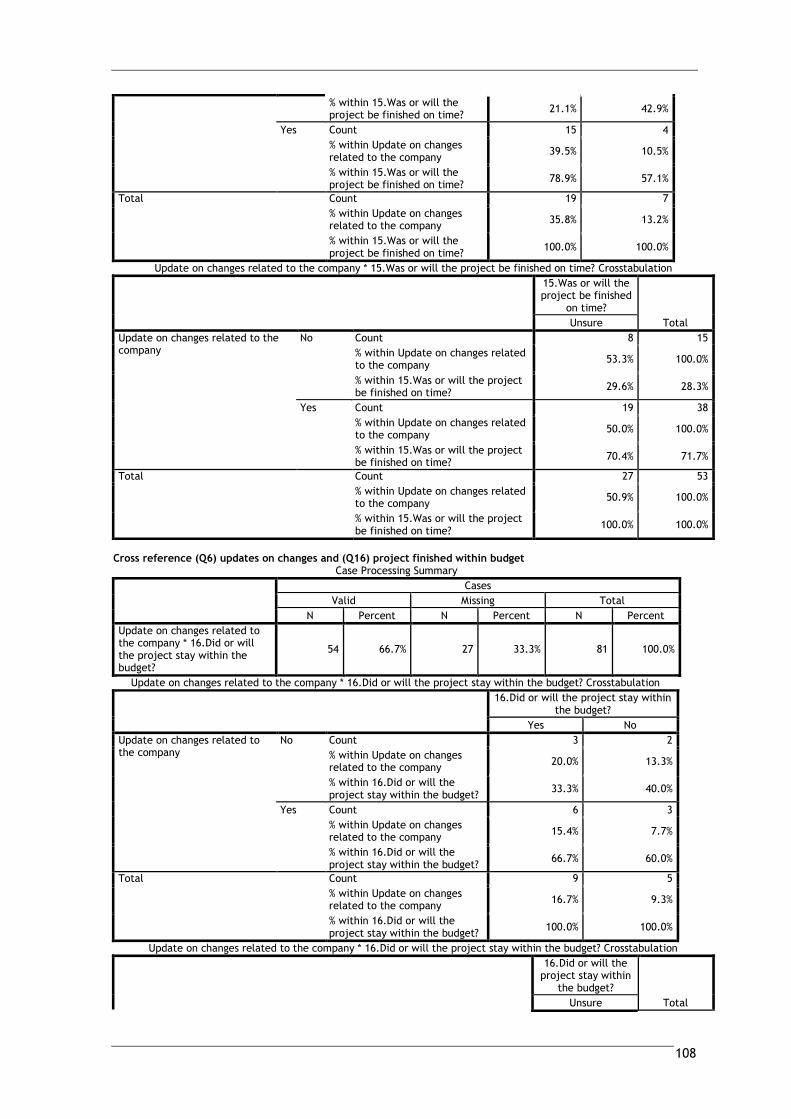
108
% within 15.Was or will the project be finished on time?
21.1% 42.9%
Yes Count 15 4
% within Update on changes related to the company
39.5% 10.5%
% within 15.Was or will the project be finished on time?
78.9% 57.1%
Total Count 19 7
% within Update on changes related to the company
35.8% 13.2%
% within 15.Was or will the project be finished on time?
100.0% 100.0%
Update on changes related to the company * 15.Was or will the project be finished on time? Crosstabulation
15.Was or will the project be finished
on time?
Total Unsure
Update on changes related to the company
No Count 8 15
% within Update on changes related to the company
53.3% 100.0%
% within 15.Was or will the project be finished on time?
29.6% 28.3%
Yes Count 19 38
% within Update on changes related to the company
50.0% 100.0%
% within 15.Was or will the project be finished on time?
70.4% 71.7%
Total Count 27 53
% within Update on changes related to the company
50.9% 100.0%
% within 15.Was or will the project be finished on time?
100.0% 100.0%
Cross reference (Q6) updates on changes and (Q16) project finished within budget
Case Processing Summary
Cases
Valid Missing Total
N Percent N Percent N Percent
Update on changes related to the company * 16.Did or will the project stay within the budget?
54 66.7% 27 33.3% 81 100.0%
Update on changes related to the company * 16.Did or will the project stay within the budget? Crosstabulation
16.Did or will the project stay within the budget?
Yes No
Update on changes related to the company
No Count 3 2
% within Update on changes related to the company
20.0% 13.3%
% within 16.Did or will the project stay within the budget?
33.3% 40.0%
Yes Count 6 3
% within Update on changes related to the company
15.4% 7.7%
% within 16.Did or will the project stay within the budget?
66.7% 60.0%
Total Count 9 5
% within Update on changes related to the company
16.7% 9.3%
% within 16.Did or will the project stay within the budget?
100.0% 100.0%
Update on changes related to the company * 16.Did or will the project stay within the budget? Crosstabulation
16.Did or will the project stay within
the budget?
Total Unsure
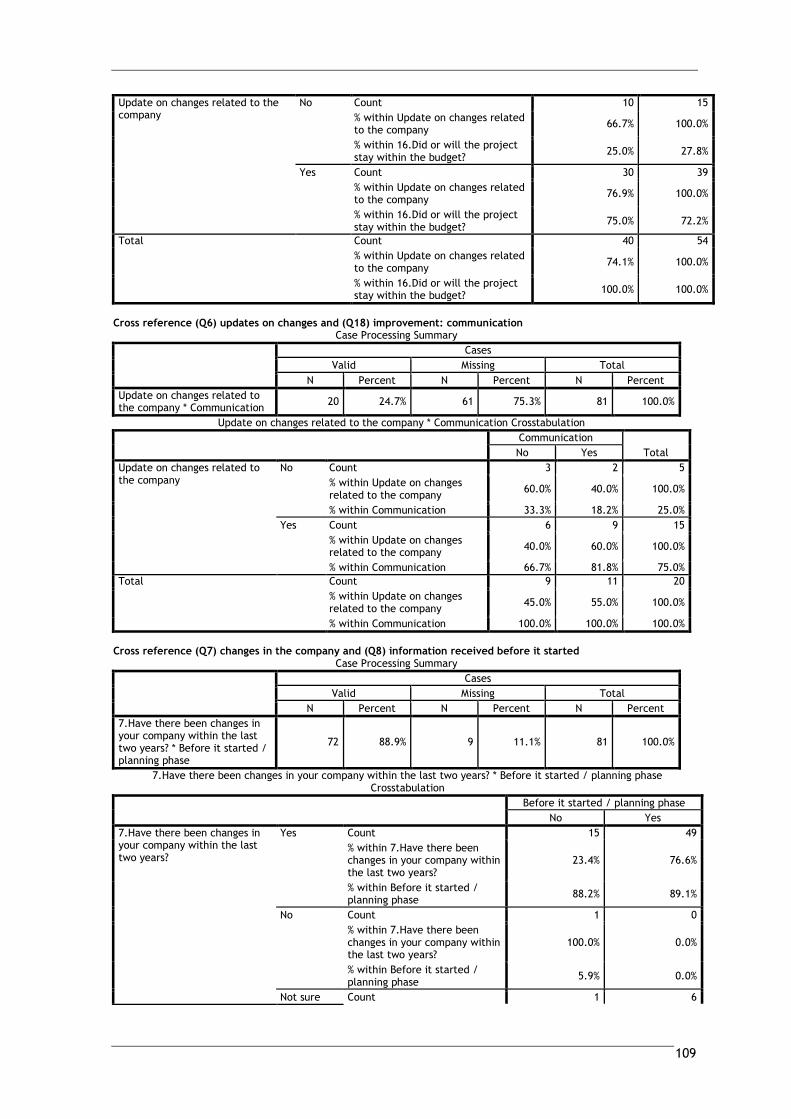
109
Update on changes related to the company
No Count 10 15
% within Update on changes related to the company
66.7% 100.0%
% within 16.Did or will the project stay within the budget?
25.0% 27.8%
Yes Count 30 39
% within Update on changes related to the company
76.9% 100.0%
% within 16.Did or will the project stay within the budget?
75.0% 72.2%
Total Count 40 54
% within Update on changes related to the company
74.1% 100.0%
% within 16.Did or will the project stay within the budget?
100.0% 100.0%
Cross reference (Q6) updates on changes and (Q18) improvement: communication
Case Processing Summary
Cases
Valid Missing Total
N Percent N Percent N Percent
Update on changes related to the company * Communication
20 24.7% 61 75.3% 81 100.0%
Update on changes related to the company * Communication Crosstabulation
Communication
Total No Yes
Update on changes related to the company
No Count 3 2 5
% within Update on changes related to the company
60.0% 40.0% 100.0%
% within Communication 33.3% 18.2% 25.0%
Yes Count 6 9 15
% within Update on changes related to the company
40.0% 60.0% 100.0%
% within Communication 66.7% 81.8% 75.0%
Total Count 9 11 20
% within Update on changes related to the company
45.0% 55.0% 100.0%
% within Communication 100.0% 100.0% 100.0%
Cross reference (Q7) changes in the company and (Q8) information received before it started
Case Processing Summary
Cases
Valid Missing Total
N Percent N Percent N Percent
7.Have there been changes in your company within the last two years? * Before it started / planning phase
72 88.9% 9 11.1% 81 100.0%
7.Have there been changes in your company within the last two years? * Before it started / planning phase Crosstabulation
Before it started / planning phase
No Yes
7.Have there been changes in your company within the last two years?
Yes Count 15 49
% within 7.Have there been changes in your company within the last two years?
23.4% 76.6%
% within Before it started / planning phase
88.2% 89.1%
No Count 1 0
% within 7.Have there been changes in your company within the last two years?
100.0% 0.0%
% within Before it started / planning phase
5.9% 0.0%
Not sure Count 1 6
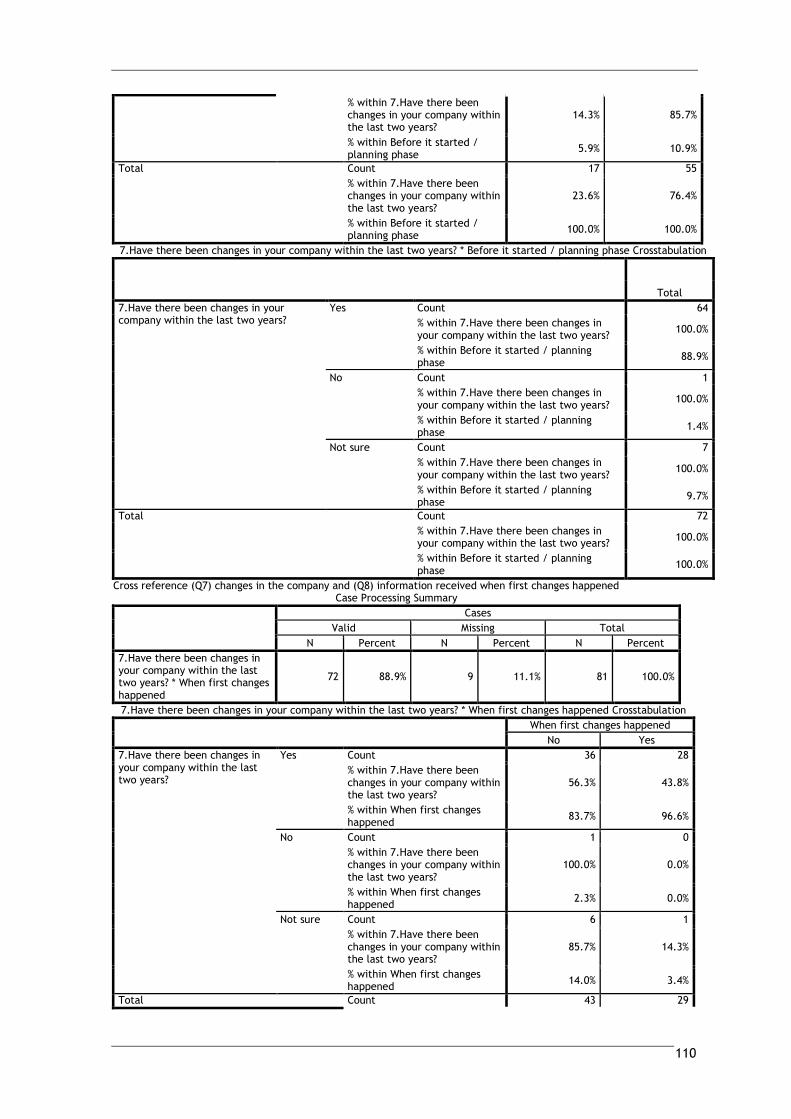
110
% within 7.Have there been changes in your company within the last two years?
14.3% 85.7%
% within Before it started / planning phase
5.9% 10.9%
Total Count 17 55
% within 7.Have there been changes in your company within the last two years?
23.6% 76.4%
% within Before it started / planning phase
100.0% 100.0%
7.Have there been changes in your company within the last two years? * Before it started / planning phase Crosstabulation
Total
7.Have there been changes in your company within the last two years?
Yes Count 64
% within 7.Have there been changes in your company within the last two years?
100.0%
% within Before it started / planning phase
88.9%
No Count 1
% within 7.Have there been changes in your company within the last two years?
100.0%
% within Before it started / planning phase
1.4%
Not sure Count 7
% within 7.Have there been changes in your company within the last two years?
100.0%
% within Before it started / planning phase
9.7%
Total Count 72
% within 7.Have there been changes in your company within the last two years?
100.0%
% within Before it started / planning phase
100.0%
Cross reference (Q7) changes in the company and (Q8) information received when first changes happened Case Processing Summary
Cases
Valid Missing Total
N Percent N Percent N Percent
7.Have there been changes in your company within the last two years? * When first changes happened
72 88.9% 9 11.1% 81 100.0%
7.Have there been changes in your company within the last two years? * When first changes happened Crosstabulation
When first changes happened
No Yes
7.Have there been changes in your company within the last two years?
Yes Count 36 28
% within 7.Have there been changes in your company within the last two years?
56.3% 43.8%
% within When first changes happened
83.7% 96.6%
No Count 1 0
% within 7.Have there been changes in your company within the last two years?
100.0% 0.0%
% within When first changes happened
2.3% 0.0%
Not sure Count 6 1
% within 7.Have there been changes in your company within the last two years?
85.7% 14.3%
% within When first changes happened
14.0% 3.4%
Total Count 43 29

111
% within 7.Have there been changes in your company within the last two years?
59.7% 40.3%
% within When first changes happened
100.0% 100.0%
7.Have there been changes in your company within the last two years? * When first changes happened Crosstabulation
Total
7.Have there been changes in your company within the last two years?
Yes Count 64
% within 7.Have there been changes in your company within the last two years?
100.0%
% within When first changes happened 88.9%
No Count 1
% within 7.Have there been changes in your company within the last two years?
100.0%
% within When first changes happened 1.4%
Not sure Count 7
% within 7.Have there been changes in your company within the last two years?
100.0%
% within When first changes happened 9.7%
Total Count 72
% within 7.Have there been changes in your company within the last two years?
100.0%
% within When first changes happened 100.0%
Cross reference (Q7) changes in the company and (Q8) information received during testing phase // after implementation
Case Processing Summary
Cases
Valid Missing Total
N Percent N Percent N Percent
7.Have there been changes in your company within the last two years? * During testing phase
72 88.9% 9 11.1% 81 100.0%
7.Have there been changes in your company within the last two years? * After implementation
72 88.9% 9 11.1% 81 100.0%
7.Have there been changes in your company within the last two years? * During testing phase Crosstabulation
During testing phase
Total No Yes
7.Have there been changes in your company within the last two years?
Yes Count 57 7 64
% within 7.Have there been changes in your company within the last two years?
89.1% 10.9% 100.0%
% within During testing phase 87.7% 100.0% 88.9%
No Count 1 0 1
% within 7.Have there been changes in your company within the last two years?
100.0% 0.0% 100.0%
% within During testing phase 1.5% 0.0% 1.4%
Not sure Count 7 0 7
% within 7.Have there been changes in your company within the last two years?
100.0% 0.0% 100.0%
% within During testing phase 10.8% 0.0% 9.7%
Total Count 65 7 72
% within 7.Have there been changes in your company within the last two years?
90.3% 9.7% 100.0%
% within During testing phase 100.0% 100.0% 100.0%
7.Have there been changes in your company within the last two years? * After implementation Crosstabulation
After implementation
Total No Yes
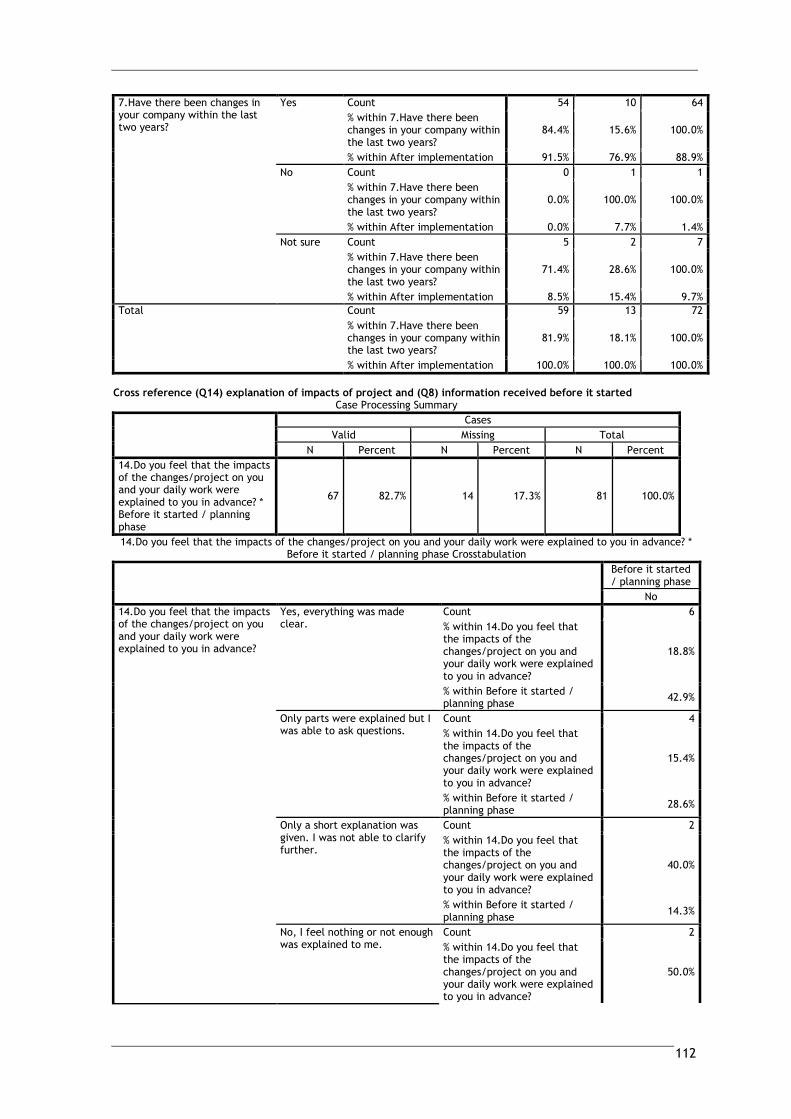
112
7.Have there been changes in your company within the last two years?
Yes Count 54 10 64
% within 7.Have there been changes in your company within the last two years?
84.4% 15.6% 100.0%
% within After implementation 91.5% 76.9% 88.9%
No Count 0 1 1
% within 7.Have there been changes in your company within the last two years?
0.0% 100.0% 100.0%
% within After implementation 0.0% 7.7% 1.4%
Not sure Count 5 2 7
% within 7.Have there been changes in your company within the last two years?
71.4% 28.6% 100.0%
% within After implementation 8.5% 15.4% 9.7%
Total Count 59 13 72
% within 7.Have there been changes in your company within the last two years?
81.9% 18.1% 100.0%
% within After implementation 100.0% 100.0% 100.0%
Cross reference (Q14) explanation of impacts of project and (Q8) information received before it started
Case Processing Summary
Cases
Valid Missing Total
N Percent N Percent N Percent
14.Do you feel that the impacts of the changes/project on you and your daily work were explained to you in advance? * Before it started / planning phase
67 82.7% 14 17.3% 81 100.0%
14.Do you feel that the impacts of the changes/project on you and your daily work were explained to you in advance? * Before it started / planning phase Crosstabulation
Before it started / planning phase
No
14.Do you feel that the impacts of the changes/project on you and your daily work were explained to you in advance?
Yes, everything was made clear.
Count 6
% within 14.Do you feel that the impacts of the changes/project on you and your daily work were explained to you in advance?
18.8%
% within Before it started / planning phase
42.9%
Only parts were explained but I was able to ask questions.
Count 4
% within 14.Do you feel that the impacts of the changes/project on you and your daily work were explained to you in advance?
15.4%
% within Before it started / planning phase
28.6%
Only a short explanation was given. I was not able to clarify further.
Count 2
% within 14.Do you feel that the impacts of the changes/project on you and your daily work were explained to you in advance?
40.0%
% within Before it started / planning phase
14.3%
No, I feel nothing or not enough was explained to me.
Count 2
% within 14.Do you feel that the impacts of the changes/project on you and your daily work were explained to you in advance?
50.0%
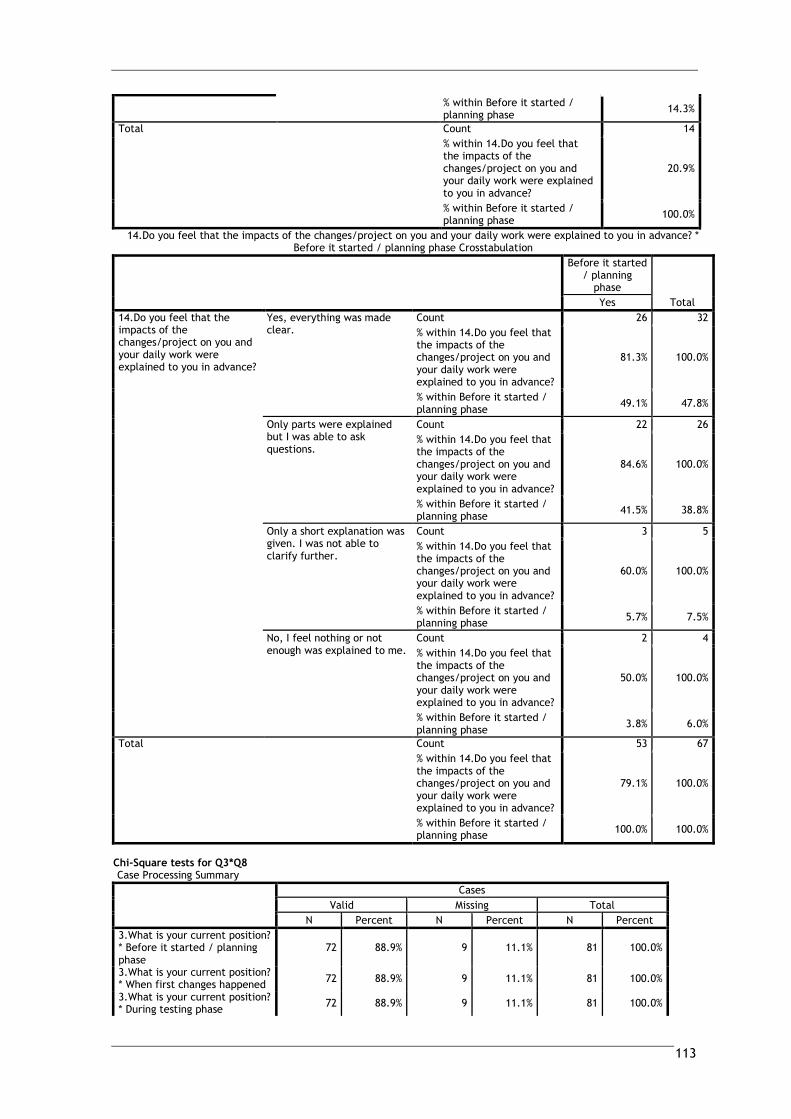
113
% within Before it started / planning phase
14.3%
Total Count 14
% within 14.Do you feel that the impacts of the changes/project on you and your daily work were explained to you in advance?
20.9%
% within Before it started / planning phase
100.0%
14.Do you feel that the impacts of the changes/project on you and your daily work were explained to you in advance? * Before it started / planning phase Crosstabulation
Before it started / planning
phase
Total Yes
14.Do you feel that the impacts of the changes/project on you and your daily work were explained to you in advance?
Yes, everything was made clear.
Count 26 32
% within 14.Do you feel that the impacts of the changes/project on you and your daily work were explained to you in advance?
81.3% 100.0%
% within Before it started / planning phase
49.1% 47.8%
Only parts were explained but I was able to ask questions.
Count 22 26
% within 14.Do you feel that the impacts of the changes/project on you and your daily work were explained to you in advance?
84.6% 100.0%
% within Before it started / planning phase
41.5% 38.8%
Only a short explanation was given. I was not able to clarify further.
Count 3 5
% within 14.Do you feel that the impacts of the changes/project on you and your daily work were explained to you in advance?
60.0% 100.0%
% within Before it started / planning phase
5.7% 7.5%
No, I feel nothing or not enough was explained to me.
Count 2 4
% within 14.Do you feel that the impacts of the changes/project on you and your daily work were explained to you in advance?
50.0% 100.0%
% within Before it started / planning phase
3.8% 6.0%
Total Count 53 67
% within 14.Do you feel that the impacts of the changes/project on you and your daily work were explained to you in advance?
79.1% 100.0%
% within Before it started / planning phase
100.0% 100.0%
Chi-Square tests for Q3*Q8 Case Processing Summary
Cases
Valid Missing Total
N Percent N Percent N Percent
3.What is your current position? * Before it started / planning phase
72 88.9% 9 11.1% 81 100.0%
3.What is your current position? * When first changes happened
72 88.9% 9 11.1% 81 100.0%
3.What is your current position? * During testing phase
72 88.9% 9 11.1% 81 100.0%
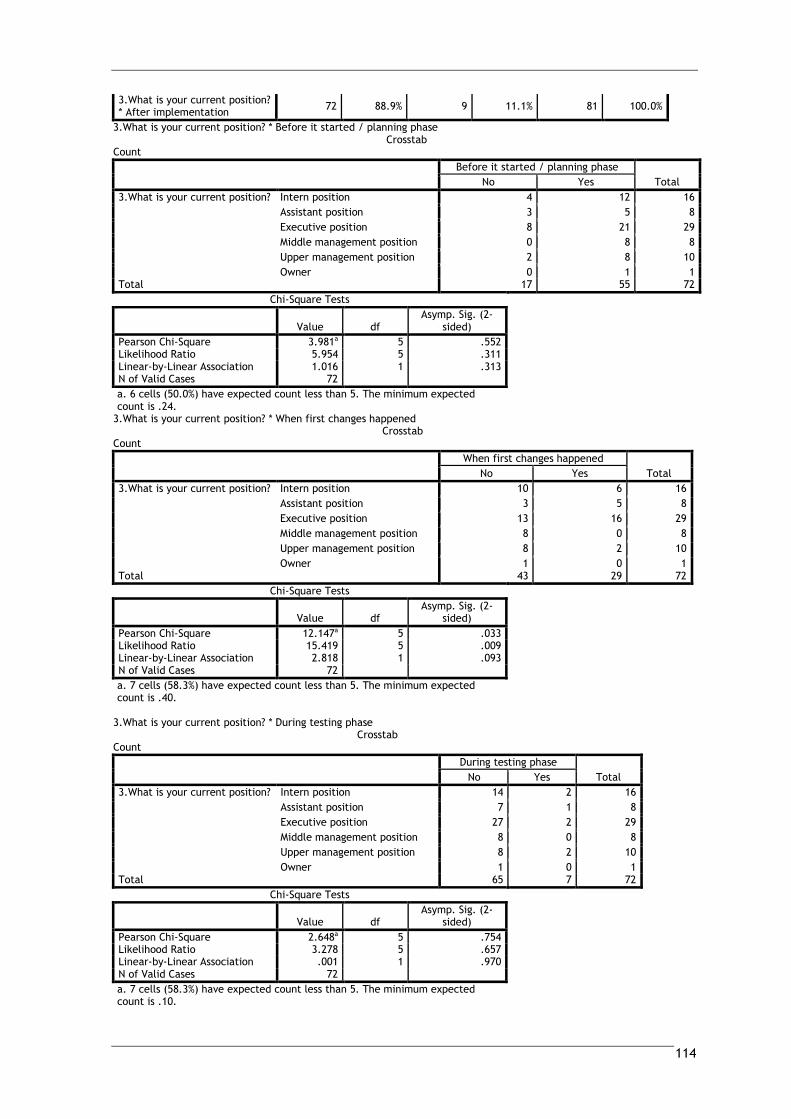
114
3.What is your current position? * After implementation
72 88.9% 9 11.1% 81 100.0%
3.What is your current position? * Before it started / planning phase Crosstab
Count
Before it started / planning phase
Total No Yes
3.What is your current position? Intern position 4 12 16
Assistant position 3 5 8
Executive position 8 21 29
Middle management position 0 8 8
Upper management position 2 8 10
Owner 0 1 1 Total 17 55 72
Chi-Square Tests
Value df Asymp. Sig. (2-
sided)
Pearson Chi-Square 3.981a 5 .552 Likelihood Ratio 5.954 5 .311 Linear-by-Linear Association 1.016 1 .313 N of Valid Cases 72
a. 6 cells (50.0%) have expected count less than 5. The minimum expected count is .24.
3.What is your current position? * When first changes happened Crosstab
Count
When first changes happened
Total No Yes
3.What is your current position? Intern position 10 6 16
Assistant position 3 5 8
Executive position 13 16 29
Middle management position 8 0 8
Upper management position 8 2 10
Owner 1 0 1 Total 43 29 72
Chi-Square Tests
Value df Asymp. Sig. (2-
sided)
Pearson Chi-Square 12.147a 5 .033 Likelihood Ratio 15.419 5 .009 Linear-by-Linear Association 2.818 1 .093 N of Valid Cases 72
a. 7 cells (58.3%) have expected count less than 5. The minimum expected count is .40.
3.What is your current position? * During testing phase
Crosstab Count
During testing phase
Total No Yes
3.What is your current position? Intern position 14 2 16
Assistant position 7 1 8
Executive position 27 2 29
Middle management position 8 0 8
Upper management position 8 2 10
Owner 1 0 1 Total 65 7 72
Chi-Square Tests
Value df Asymp. Sig. (2-
sided)
Pearson Chi-Square 2.648a 5 .754 Likelihood Ratio 3.278 5 .657 Linear-by-Linear Association .001 1 .970 N of Valid Cases 72
a. 7 cells (58.3%) have expected count less than 5. The minimum expected count is .10.
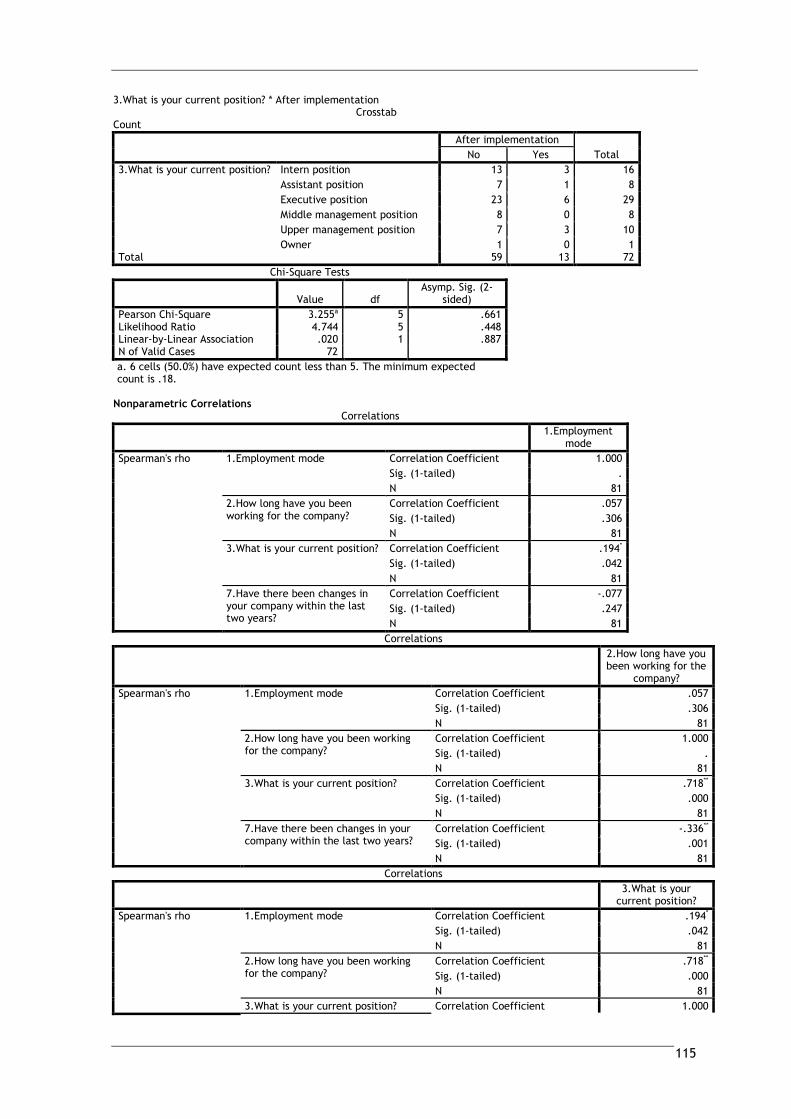
115
3.What is your current position? * After implementation Crosstab
Count
After implementation
Total No Yes
3.What is your current position? Intern position 13 3 16
Assistant position 7 1 8
Executive position 23 6 29
Middle management position 8 0 8
Upper management position 7 3 10
Owner 1 0 1 Total 59 13 72
Chi-Square Tests
Value df Asymp. Sig. (2-
sided)
Pearson Chi-Square 3.255a 5 .661 Likelihood Ratio 4.744 5 .448 Linear-by-Linear Association .020 1 .887 N of Valid Cases 72
a. 6 cells (50.0%) have expected count less than 5. The minimum expected count is .18.
Nonparametric Correlations
Correlations
1.Employment
mode
Spearman's rho 1.Employment mode Correlation Coefficient 1.000
Sig. (1-tailed) .
N 81
2.How long have you been working for the company?
Correlation Coefficient .057
Sig. (1-tailed) .306
N 81
3.What is your current position? Correlation Coefficient .194*
Sig. (1-tailed) .042
N 81
7.Have there been changes in your company within the last two years?
Correlation Coefficient -.077
Sig. (1-tailed) .247
N 81
Correlations
2.How long have you been working for the
company?
Spearman's rho 1.Employment mode Correlation Coefficient .057
Sig. (1-tailed) .306
N 81
2.How long have you been working for the company?
Correlation Coefficient 1.000
Sig. (1-tailed) .
N 81
3.What is your current position? Correlation Coefficient .718**
Sig. (1-tailed) .000
N 81
7.Have there been changes in your company within the last two years?
Correlation Coefficient -.336**
Sig. (1-tailed) .001
N 81
Correlations
3.What is your
current position?
Spearman's rho 1.Employment mode Correlation Coefficient .194*
Sig. (1-tailed) .042
N 81
2.How long have you been working for the company?
Correlation Coefficient .718**
Sig. (1-tailed) .000
N 81
3.What is your current position? Correlation Coefficient 1.000
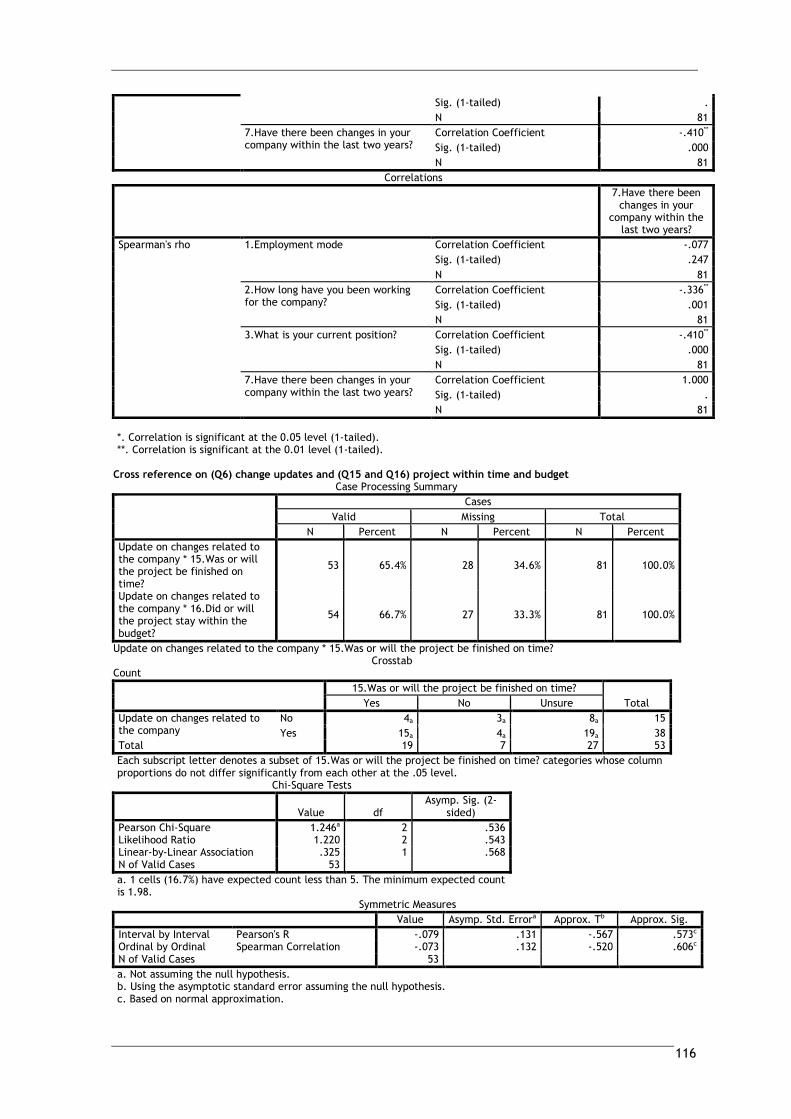
116
Sig. (1-tailed) .
N 81
7.Have there been changes in your company within the last two years?
Correlation Coefficient -.410**
Sig. (1-tailed) .000
N 81
Correlations
7.Have there been changes in your
company within the last two years?
Spearman's rho 1.Employment mode Correlation Coefficient -.077
Sig. (1-tailed) .247
N 81
2.How long have you been working for the company?
Correlation Coefficient -.336**
Sig. (1-tailed) .001
N 81
3.What is your current position? Correlation Coefficient -.410**
Sig. (1-tailed) .000
N 81
7.Have there been changes in your company within the last two years?
Correlation Coefficient 1.000
Sig. (1-tailed) .
N 81
*. Correlation is significant at the 0.05 level (1-tailed). **. Correlation is significant at the 0.01 level (1-tailed).
Cross reference on (Q6) change updates and (Q15 and Q16) project within time and budget
Case Processing Summary
Cases
Valid Missing Total
N Percent N Percent N Percent
Update on changes related to the company * 15.Was or will the project be finished on time?
53 65.4% 28 34.6% 81 100.0%
Update on changes related to the company * 16.Did or will the project stay within the budget?
54 66.7% 27 33.3% 81 100.0%
Update on changes related to the company * 15.Was or will the project be finished on time? Crosstab
Count
15.Was or will the project be finished on time?
Total Yes No Unsure
Update on changes related to the company
No 4a 3a 8a 15
Yes 15a 4a 19a 38 Total 19 7 27 53
Each subscript letter denotes a subset of 15.Was or will the project be finished on time? categories whose column proportions do not differ significantly from each other at the .05 level.
Chi-Square Tests
Value df Asymp. Sig. (2-
sided)
Pearson Chi-Square 1.246a 2 .536 Likelihood Ratio 1.220 2 .543 Linear-by-Linear Association .325 1 .568 N of Valid Cases 53
a. 1 cells (16.7%) have expected count less than 5. The minimum expected count is 1.98.
Symmetric Measures
Value Asymp. Std. Errora Approx. Tb Approx. Sig.
Interval by Interval Pearson's R -.079 .131 -.567 .573c Ordinal by Ordinal Spearman Correlation -.073 .132 -.520 .606c N of Valid Cases 53
a. Not assuming the null hypothesis. b. Using the asymptotic standard error assuming the null hypothesis. c. Based on normal approximation.
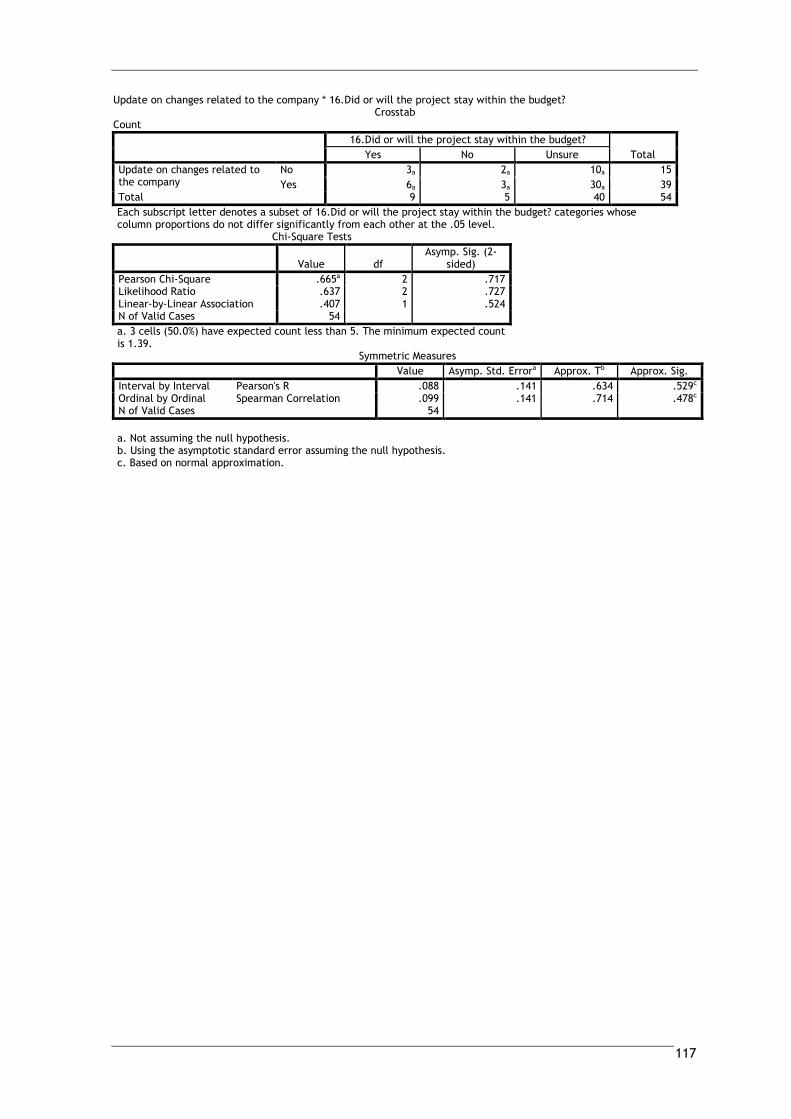
117
Update on changes related to the company * 16.Did or will the project stay within the budget? Crosstab
Count
16.Did or will the project stay within the budget?
Total Yes No Unsure
Update on changes related to the company
No 3a 2a 10a 15
Yes 6a 3a 30a 39 Total 9 5 40 54
Each subscript letter denotes a subset of 16.Did or will the project stay within the budget? categories whose column proportions do not differ significantly from each other at the .05 level.
Chi-Square Tests
Value df Asymp. Sig. (2-
sided)
Pearson Chi-Square .665a 2 .717 Likelihood Ratio .637 2 .727 Linear-by-Linear Association .407 1 .524 N of Valid Cases 54
a. 3 cells (50.0%) have expected count less than 5. The minimum expected count is 1.39.
Symmetric Measures
Value Asymp. Std. Errora Approx. Tb Approx. Sig.
Interval by Interval Pearson's R .088 .141 .634 .529c Ordinal by Ordinal Spearman Correlation .099 .141 .714 .478c N of Valid Cases 54
a. Not assuming the null hypothesis. b. Using the asymptotic standard error assuming the null hypothesis. c. Based on normal approximation.