Change before you have to. Display ads conversion rates in Central Eastern Europe. Gemius, 2015
25
Change before you have to Radosław Gołąb www.gemius.com
-
Upload
dmytro-lysiuk -
Category
Documents
-
view
104 -
download
0
Transcript of Change before you have to. Display ads conversion rates in Central Eastern Europe. Gemius, 2015

Change before you have to
Radosław Gołąb
www.gemius.com

2
Preparing!

3
CTR by country
0.89%
0.71%
0.52% 0.52% 0.47% 0.45% 0.44% 0.41%
0.37% 0.36% 0.31% 0.27%
0.21%
0,00%0,10%0,20%0,30%0,40%0,50%0,60%0,70%0,80%0,90%1,00%
Sources: gemiusDirectEffect, gemiusProfileEffect, September 2014 , TG: 16-69
4
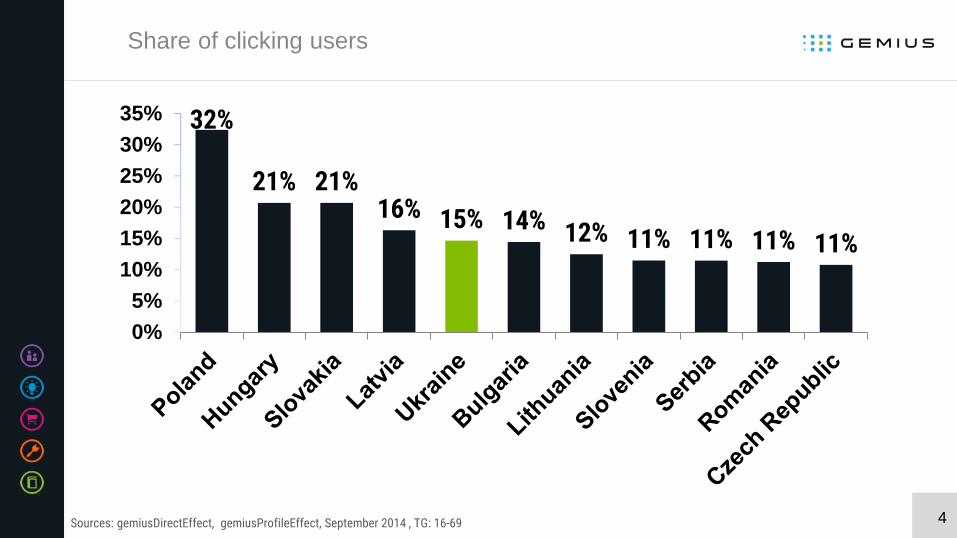
Share of clicking users
32%
21% 21% 16% 15% 14% 12% 11% 11% 11% 11%
0%
5%
10%
15%
20%
25%
30%
35%
Sources: gemiusDirectEffect, gemiusProfileEffect, September 2014 , TG: 16-69

5
Profile of users generating impressions by country – gender
50% 48% 50% 53% 52% 54% 54% 51% 52% 49% 51% 48% 52%
50% 52% 50% 47% 48% 46% 46% 49% 48% 51% 49% 52% 48%
0%
10%
20%
30%
40%
50%
60%
70%
80%
90%
100%
female maleSources: gemiusDirectEffect, gemiusProfileEffect, September 2014 , TG: 16-69
6
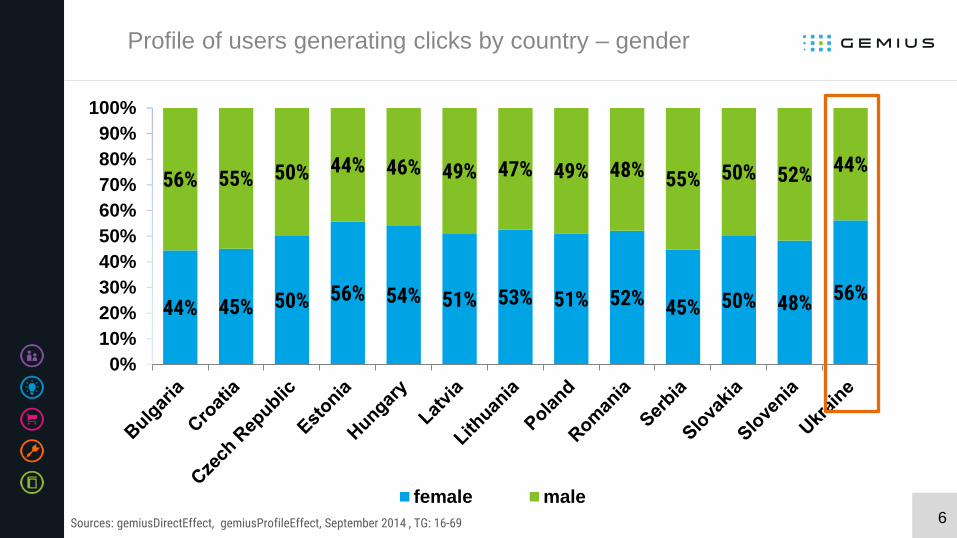
Profile of users generating clicks by country – gender
44% 45% 50% 56% 54% 51% 53% 51% 52% 45% 50% 48% 56%
56% 55% 50% 44% 46% 49% 47% 49% 48% 55% 50% 52% 44%
0%
10%
20%
30%
40%
50%
60%
70%
80%
90%
100%
female male
Sources: gemiusDirectEffect, gemiusProfileEffect, September 2014 , TG: 16-69
7
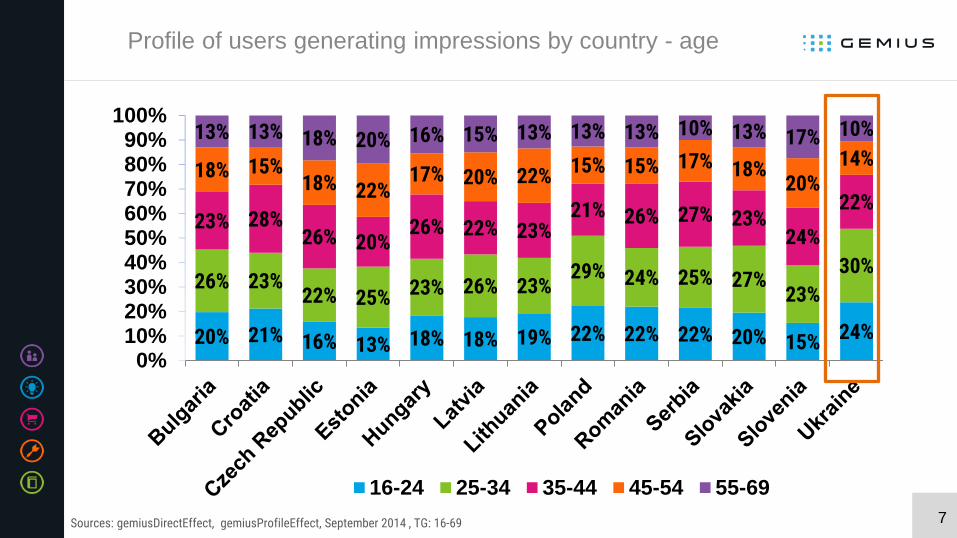
Profile of users generating impressions by country - age
20% 21% 16% 13% 18% 18% 19% 22% 22% 22% 20% 15% 24%
26% 23% 22% 25% 23% 26% 23%
29% 24% 25% 27% 23%
30%
23% 28% 26% 20%
26% 22% 23% 21% 26% 27% 23%
24%
22%
18% 15% 18% 22%
17% 20% 22% 15% 15% 17% 18% 20%
14%
13% 13% 18% 20% 16% 15% 13% 13% 13% 10% 13% 17% 10%
0%10%20%30%40%50%60%70%80%90%
100%
16-24 25-34 35-44 45-54 55-69
Sources: gemiusDirectEffect, gemiusProfileEffect, September 2014 , TG: 16-69

8
Profile of users generating clicks by country - age
21% 8% 14% 18% 13% 16% 17% 21% 26% 19% 17% 17%
27%
25%
20% 21% 15% 19%
26% 25% 28% 21%
26% 24% 23%
33%
24%
30% 23% 22% 28% 25% 22%
21% 22% 22% 24% 22%
19% 17%
22% 19% 21% 18%
19% 21% 15% 16% 21% 19% 20%
12% 13% 20% 23% 24% 21% 15% 16% 14% 14% 13% 16% 17% 9%
0%10%20%30%40%50%60%70%80%90%
100%
16-24 25-34 35-44 45-54 55-69
Sources: gemiusDirectEffect, gemiusProfileEffect, September 2014 , TG: 16-69
9
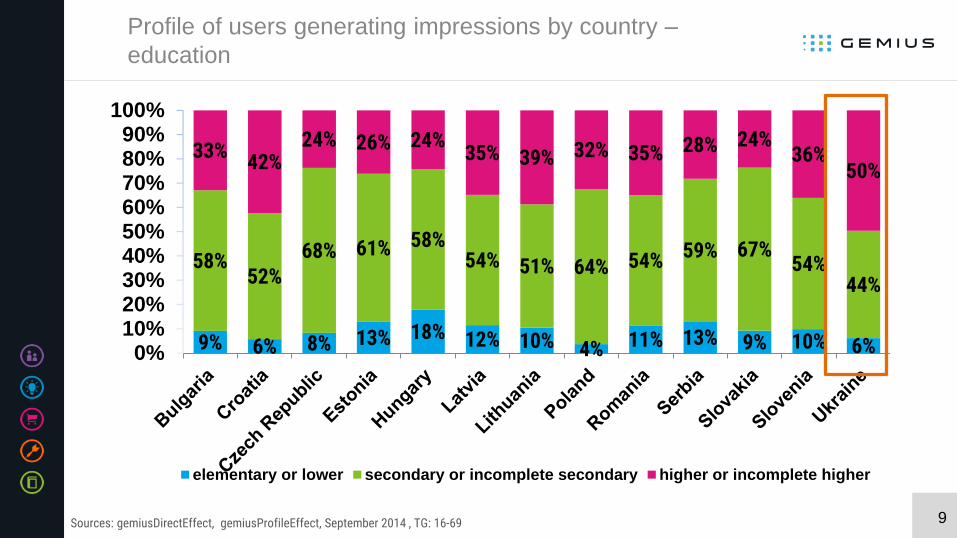
Profile of users generating impressions by country –
education
9% 6% 8% 13% 18% 12% 10% 4% 11% 13% 9% 10% 6%
58% 52%
68% 61% 58% 54% 51% 64% 54% 59% 67%
54% 44%
33% 42%
24% 26% 24% 35% 39% 32% 35% 28% 24%
36% 50%
0%10%20%30%40%50%60%70%80%90%
100%
elementary or lower secondary or incomplete secondary higher or incomplete higher
Sources: gemiusDirectEffect, gemiusProfileEffect, September 2014 , TG: 16-69
10
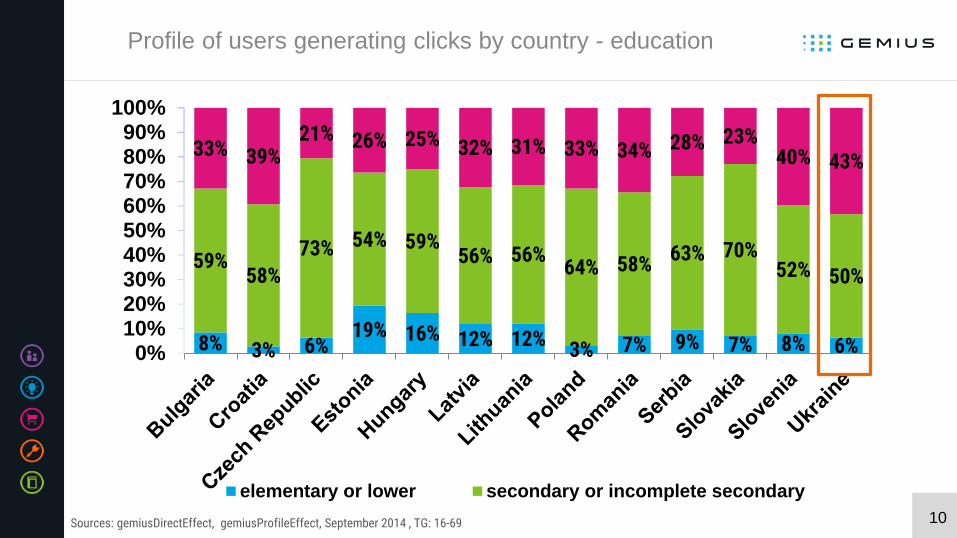
Profile of users generating clicks by country - education
8% 3% 6% 19% 16% 12% 12%
3% 7% 9% 7% 8% 6%
59% 58%
73% 54% 59% 56% 56%
64% 58% 63% 70%
52% 50%
33% 39% 21% 26% 25% 32% 31% 33% 34% 28% 23%
40% 43%
0%10%20%30%40%50%60%70%80%90%
100%
elementary or lower secondary or incomplete secondary
Sources: gemiusDirectEffect, gemiusProfileEffect, September 2014 , TG: 16-69

11
In the face of change
He was chairman and CEO of GE (General Electric)
for 20 years. During his tenure at GE, the company's
value rose 4 000%.
Jack Welch
12
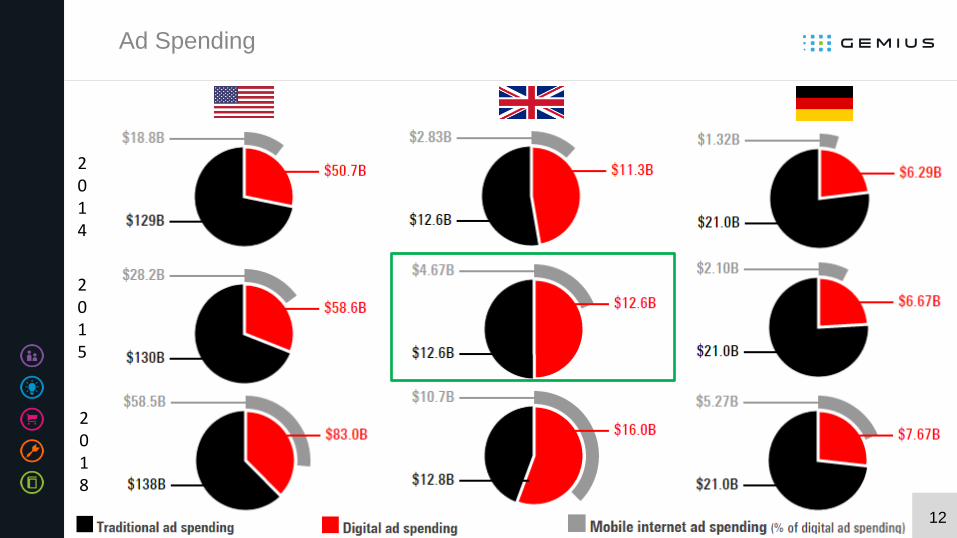
Ad Spending
2014
2015
2018

13
Mobile is the KING… soon will be the KING!
Mobile
2012 2013 2014 2015 2016 2017 2018
178,3% 122,0% 83,0% 46,0% 35,0% 26,5% 23,0%
2012 2013 2014 2015 2016 2017 2018
6,6% 2,3% -2,4% -2,1% -5,0% -7,1% -10,6%
Desktop
Source: emarketer.com
14
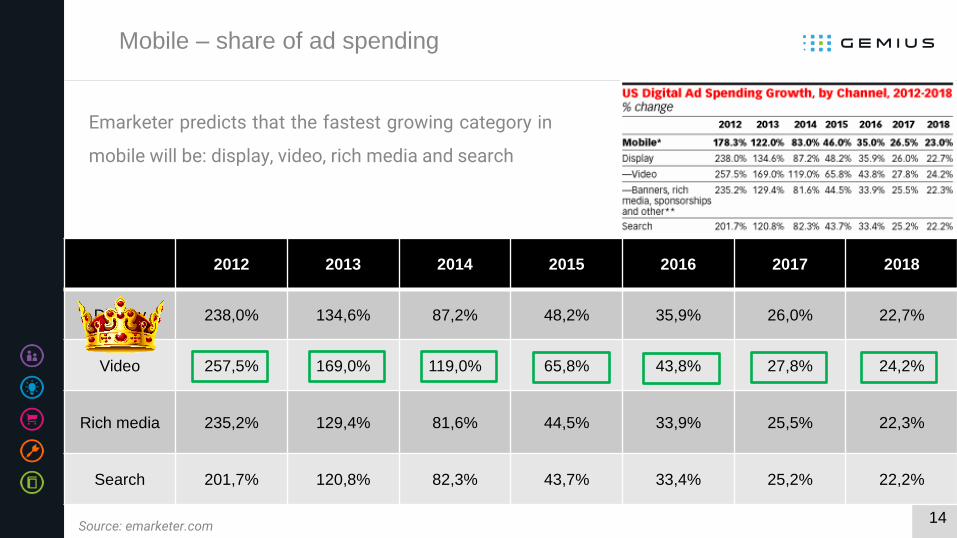
Mobile – share of ad spending
Emarketer predicts that the fastest growing category in
mobile will be: display, video, rich media and search
2012 2013 2014 2015 2016 2017 2018
Display 238,0% 134,6% 87,2% 48,2% 35,9% 26,0% 22,7%
Video 257,5% 169,0% 119,0% 65,8% 43,8% 27,8% 24,2%
Rich media 235,2% 129,4% 81,6% 44,5% 33,9% 25,5% 22,3%
Search 201,7% 120,8% 82,3% 43,7% 33,4% 25,2% 22,2%
Source: emarketer.com
15
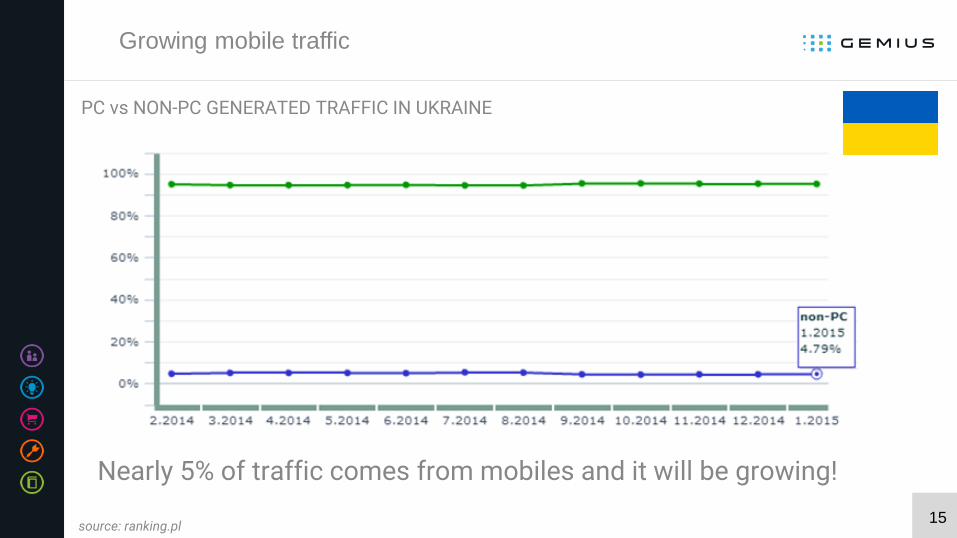
Growing mobile traffic
Nearly 5% of traffic comes from mobiles and it will be growing!
PC vs NON-PC GENERATED TRAFFIC IN UKRAINE
source: ranking.pl
16
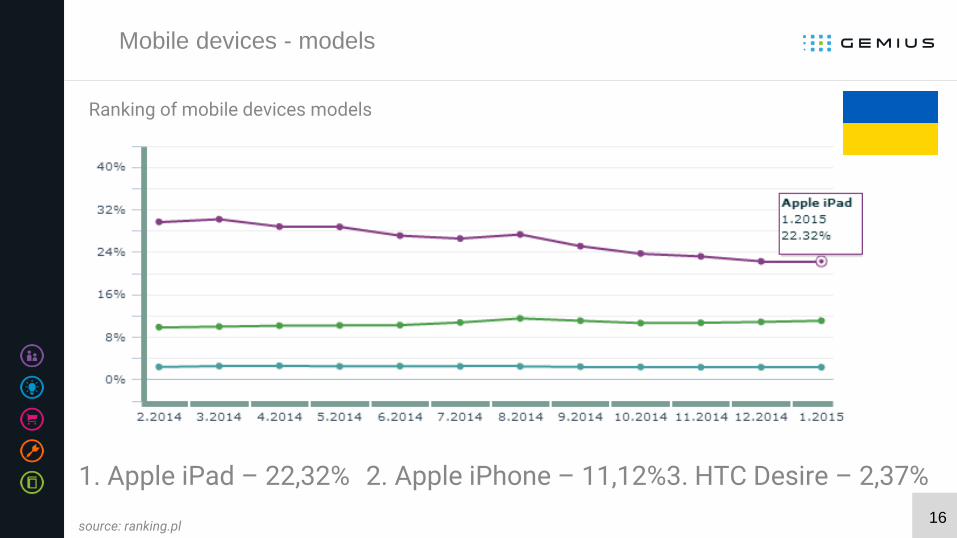
Mobile devices - models
source: ranking.pl
1. Apple iPad – 22,32% 2. Apple iPhone – 11,12%3. HTC Desire – 2,37%
Ranking of mobile devices models
17
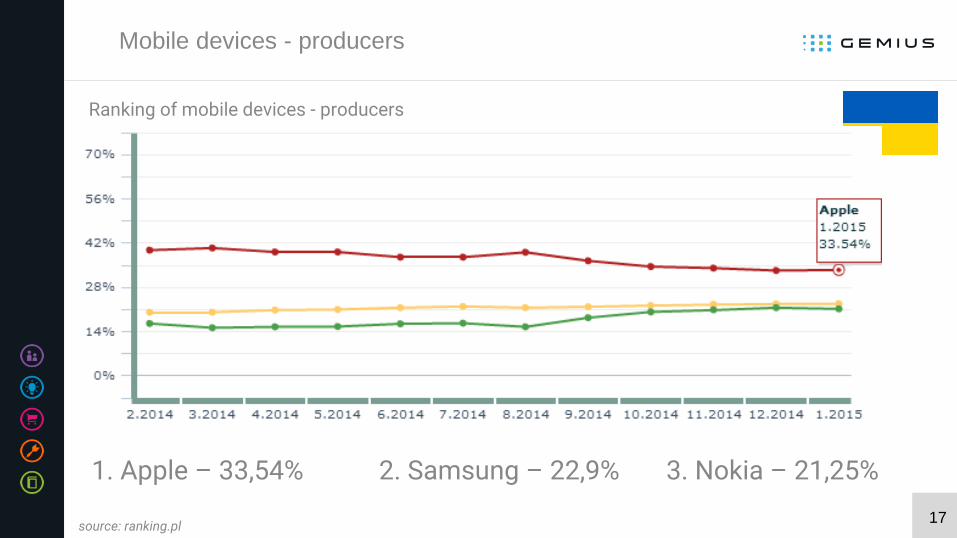
Mobile devices - producers
source: ranking.pl
1. Apple – 33,54% 2. Samsung – 22,9% 3. Nokia – 21,25%
Ranking of mobile devices - producers
18
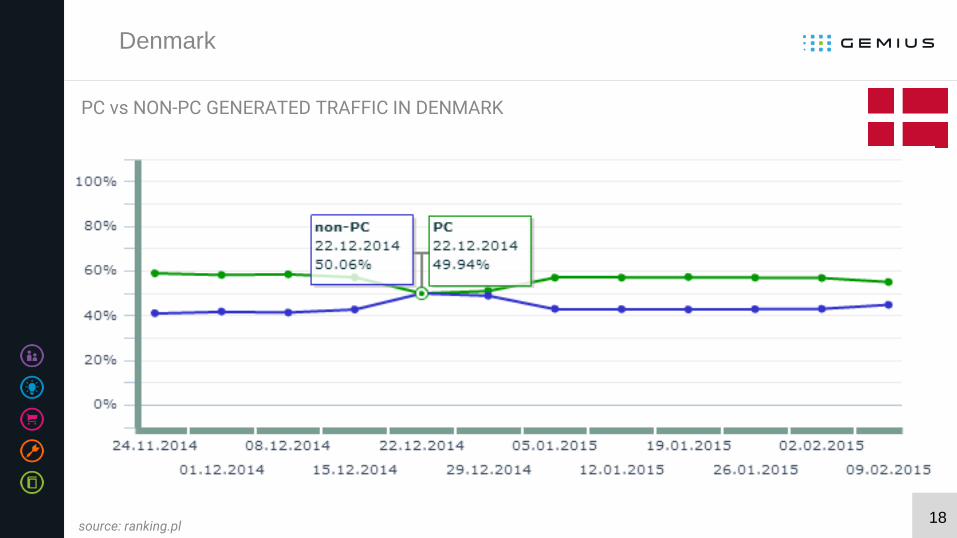
Denmark
PC vs NON-PC GENERATED TRAFFIC IN DENMARK
source: ranking.pl
19
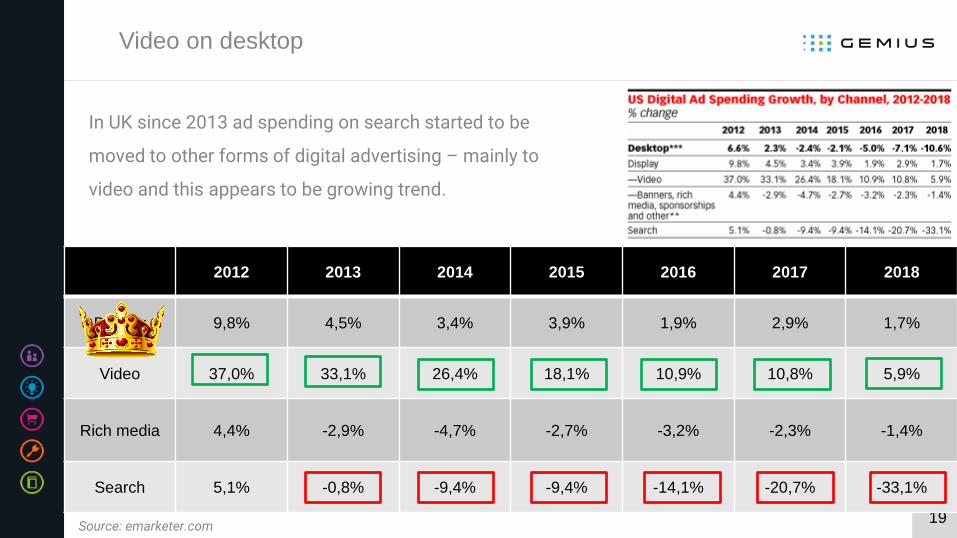
Video on desktop
2012 2013 2014 2015 2016 2017 2018
Display 9,8% 4,5% 3,4% 3,9% 1,9% 2,9% 1,7%
Video 37,0% 33,1% 26,4% 18,1% 10,9% 10,8% 5,9%
Rich media 4,4% -2,9% -4,7% -2,7% -3,2% -2,3% -1,4%
Search 5,1% -0,8% -9,4% -9,4% -14,1% -20,7% -33,1%
Source: emarketer.com
In UK since 2013 ad spending on search started to be
moved to other forms of digital advertising – mainly to
video and this appears to be growing trend.
20
Advertising
21
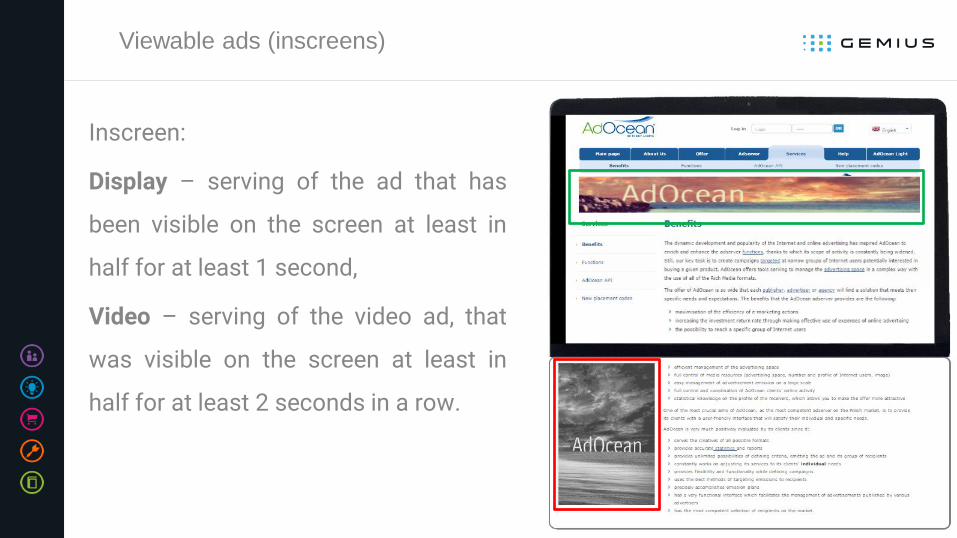
Viewable ads (inscreens)
Inscreen:
Display – serving of the ad that has
been visible on the screen at least in
half for at least 1 second,
Video – serving of the video ad, that
was visible on the screen at least in
half for at least 2 seconds in a row.
22
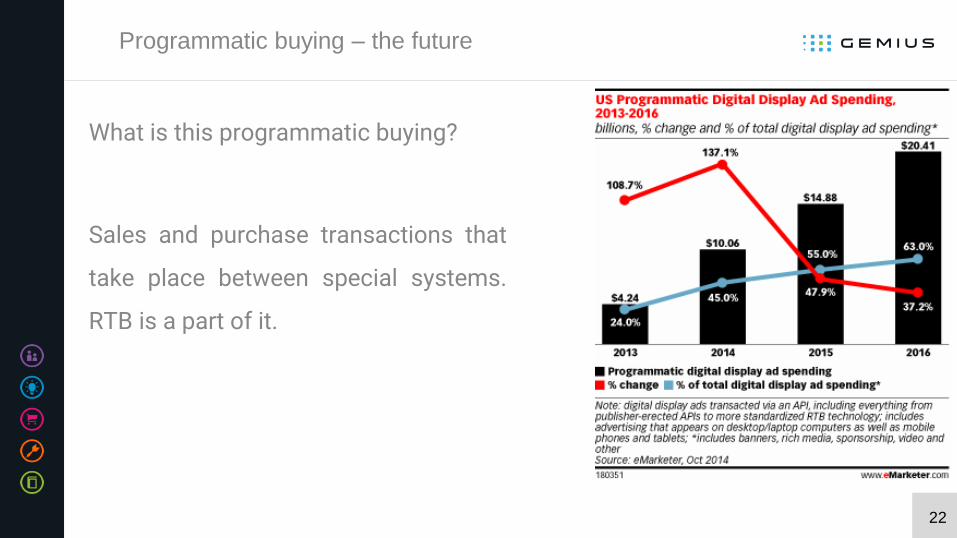
Programmatic buying – the future
What is this programmatic buying?
Sales and purchase transactions that
take place between special systems.
RTB is a part of it.
23
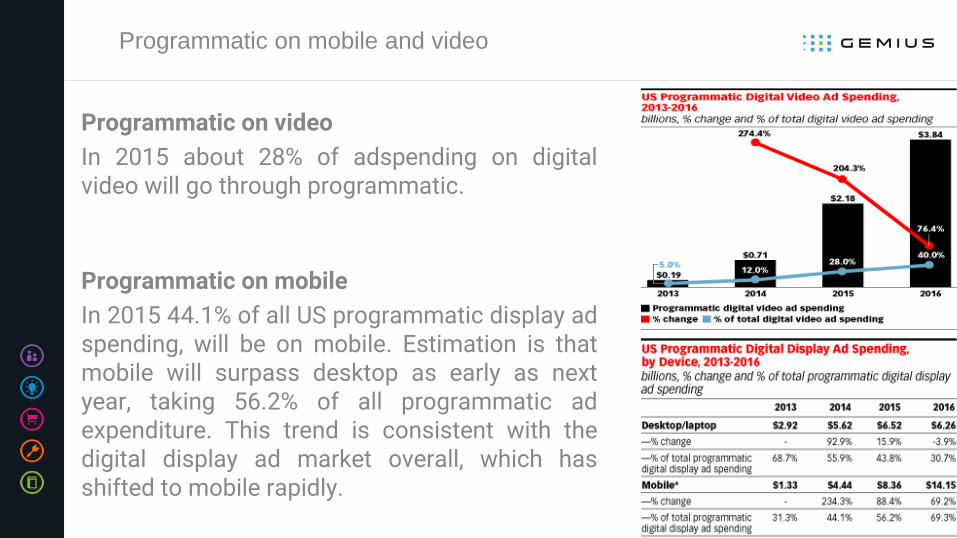
Programmatic on mobile and video
Programmatic on video
In 2015 about 28% of adspending on digital video will go through programmatic.
Programmatic on mobile
In 2015 44.1% of all US programmatic display ad spending, will be on mobile. Estimation is that mobile will surpass desktop as early as next year, taking 56.2% of all programmatic ad expenditure. This trend is consistent with the digital display ad market overall, which has shifted to mobile rapidly.

24

Thank you!
Gemius SA
18 B Postępu Street
02-676 Warsaw
Radosław Gołąb
Product Owner
www.gemius.com