chandan wadhwa 170-197 - International Seminarinternationalseminar.org/XVIII_AIC/TS4/chandan...
28
XVIII Annual International Conference Proceedings; January 2017 ISBN no. 978-81-923211-9-6 http://www.internationalseminar.org/XVIII_AIC/INDEX.HTM Page 170 Social Parity a Distant Dream: An Exploratory study on Disabled People in India Chandan Wadhwa Research Assistant PHFI MA Economics Plot No. 47 Haryana- 122002, India Richa Singh Independent Researcher Ambedkar University, Delhi Institutional Area, Gurgaon Abstract Poverty, stigmatization and social exclusion are terms which best describes people suffering from any form of disability. This is a silent epidemic that has been pushing people to pauperization and further feeding into disintegration of the social fabric. The main aim of this paper is to study the literacy and employment rates of the disabled population which characterises their daily life functioning. We did a cross-sectional study of Census of India, 2011, a decadal survey, and looked into the literacy levels and employment structure of disabled population which are affected by the factors such as age group, sex, place of residence and types of disabilities. According to Indian Census 2011, 26814994 persons (2.21%) were reported to constitute the disabled population, majority of which resided in the rural areas. Amidst the disabled population, only 55% were found to be literate, of which, majority were males. Literacy rate was highest among the movement disability (22%),while it was least for mental illness (2%). Nearly 50% of the disabled male population were working as main workers for in seeing,in speech, hearing and movement disability. It was found that 63% of disabled were non-workers, out of which 45% were dependent individuals and 27% were students. The data collected on disability is an underestimate due to its narrow definition.Further, there is under-reporting because of the fear of social ostracization and stigmatization. The study helps us to unveil the grim situation of disabled people which can be seen from low levels of employment and literacy rates. Thus, it becomes the prerogative of the government to empower these marginalized communities through proper implementation of progressive policies and thereby kick-start a virtuous cycle. The study points at the inability of government interventions in alleviating the suffering of this vulnerable population effectively. So it becomes imperative to have policies which target the direct needs of the disabled people though usage of advanced technology,sensitization of general public and private players; and self-esteem uplifting and empowerment workshops all around the nation. Key words- disability, employment, inclusive development, literacy rate
Transcript of chandan wadhwa 170-197 - International Seminarinternationalseminar.org/XVIII_AIC/TS4/chandan...
XVIII Annual International Conference Proceedings; January 2017
ISBN no. 978-81-923211-9-6 http://www.internationalseminar.org/XVIII_AIC/INDEX.HTM Page 170
Social Parity a Distant Dream: An Exploratory study on Disabled People in
India
Chandan Wadhwa Research Assistant
PHFI MA Economics
Plot No. 47
Haryana- 122002, India
Richa Singh
Independent Researcher
Ambedkar University, Delhi
Institutional Area, Gurgaon
Abstract Poverty, stigmatization and social exclusion are terms which best describes people suffering
from any form of disability. This is a silent epidemic that has been pushing people to
pauperization and further feeding into disintegration of the social fabric. The main aim of this
paper is to study the literacy and employment rates of the disabled population which
characterises their daily life functioning. We did a cross-sectional study of Census of India,
2011, a decadal survey, and looked into the literacy levels and employment structure of disabled
population which are affected by the factors such as age group, sex, place of residence and types
of disabilities. According to Indian Census 2011, 26814994 persons (2.21%) were reported to
constitute the disabled population, majority of which resided in the rural areas. Amidst the
disabled population, only 55% were found to be literate, of which, majority were males. Literacy
rate was highest among the movement disability (22%),while it was least for mental illness (2%).
Nearly 50% of the disabled male population were working as main workers for in seeing,in
speech, hearing and movement disability. It was found that 63% of disabled were non-workers,
out of which 45% were dependent individuals and 27% were students. The data collected on
disability is an underestimate due to its narrow definition.Further, there is under-reporting
because of the fear of social ostracization and stigmatization. The study helps us to unveil the
grim situation of disabled people which can be seen from low levels of employment and literacy
rates. Thus, it becomes the prerogative of the government to empower these marginalized
communities through proper implementation of progressive policies and thereby kick-start a
virtuous cycle. The study points at the inability of government interventions in alleviating the
suffering of this vulnerable population effectively. So it becomes imperative to have policies
which target the direct needs of the disabled people though usage of advanced
technology,sensitization of general public and private players; and self-esteem uplifting and
empowerment workshops all around the nation.
Key words- disability, employment, inclusive development, literacy rate
XVIII Annual International Conference Proceedings; January 2017
ISBN no. 978-81-923211-9-6 http://www.internationalseminar.org/XVIII_AIC/INDEX.HTM Page 171
Introduction
Our contemporary times have seen a growing expression to kindle a hope of egalitarian society
where the disadvantaged and the marginalized are given a chance to lead a conventional lifestyle.
This is what is supposed to be, but the actual picture is rather gloomy when we tried to canvas
the plight of the people with disabilities (PWDs) in case of India.Poverty,stigmatization and
social exclusion are terms that best describes people suffering from any form of disability.This is
asilent epidemic that has been pushing people to pauperization and further feeding into
disintegration of the social fabric.
It will ratherbe an understatement, if we say that the potential of the disabled people remains
largely untapped and under-utilized only due to lack of employability of this marginalized
segment of the population, but also because of other socio-economic conditions such as of
increased health expenditure, low level of education attainment, poverty, low self-esteem and
personality development. These factors hence lead to low level of employment for PWDs which
forms the hunch of the paper.
The paper is divided into four sections; first section includes the definitional aspect of
disability,prevalence in Indian context,the bidirectional link between poverty and disability
andlegislative framework for PWDs in India; second sectionentails literature review and data
analysis on disabled people in India using Census of India,2001 and 2011; third section deals
with various initiatives taken up by the government, private sector, and PWDs themselves to
create opportunities for work; and the fourth section will conclude the paper.
Section 1: General Overview of Disability
1.1 Defining Disability
Disability is a multifaceted phenomenon and thereby it has been defined in many ways by
various organizations and also differently under the different acts passed by the GOI. In the
present context, we will be using the definition put forward under the Persons with Disabilities
(Equal Opportunities, Protection of Rights and Full Participation) Act, 1995. As per the section 2
(I) of the Act, Disability is defined as:
i) Blindness; ii) Low-Vision; iii) Leprosy-cured; iv) Hearing impairment; v) Locomotor
disability; vi) Mental retardation; vii) Mental Illness
As per Section 2(t) of the Act, ‘persons with disability’ means a person suffering from not less
than forty per cent of any disability as certified by medical authority.
Government of India ratified the United Nations Convention on the Rights of the Persons with
Disabilities (UNCRPD) in October 2007. Article(1) of the convention states that , ‘persons
with disabilities include those who have long term physical, mental, intellectual or sensory
impairments which in interaction with various barriers may hinder their full and effective
participation in the society on an equal basis with others’.
XVIII Annual International Conference Proceedings; January 2017
ISBN no. 978-81-923211-9-6 http://www.internationalseminar.org/XVIII_AIC/INDEX.HTM Page 172
“Disability is therefore not defined as a standalone medical condition, but rather the product
of the interaction between the environment broadly defined and the health conditions of
particular persons”(p.20).1
While these definitions only point at the disability as being a problem of impairment or
abnormality with the individual being the medical model, the social model of disability looks at
the way the regular societal organization overlooks the proper functioning of PWDs. 2 For
example,a wheel chair basketball player wants to go to play basketball at a nearby court. Under a
social model, arrangements of coaching and play time would be allotted for him but under a
medical model he has few options available.
According to the World Bank Report 2009, approximately 6 per cent of Indian population had
some form of disability. Moreover, the World Health Organizationfigure is stated as 10 per cent
of the total population. Thus,these varying estimates of disabled persons are itself testimony to
the fact that there are definitional issues with the measurement of the exact number of disabled
people in the total population. To top it, there are various diseases and ailments which will put a
person in the list of disabled category in many developed countries, for which they are not
legible in developing countries. Hence, defining disability becomes a relative concept and further
this can be considered as a centerpiece determining the variations observed over time and space.3
1.2 Prevalence of Disability in India
According to the 2001 Census, there were 21,906,769 (approximately 22 million) people with
disabilities in India who constituted 2.13 per cent of the total population. Further they were
classified into five categories namely: seeing (47per cent), hearing (5per cent), speech (8per
cent), movement (28per cent) and mental (12per cent). These figures increased to 26,814,994
(approximately 27 million) people who constituted 2.21% of the total population in Census 2011.
These were classified into eight categories namely: seeing (19per cent), hearing (19per cent),
speech (7per cent), movement (20per cent), mental retardation (6per cent), mental illness (3per
cent), any other (18per cent) and multiple disability (8per cent).
In a nutshell, literacy rate was highest among the movement disability (22%) while it was least
for mental illness (2%). Nearly 50% of the disabled male population were working as main
workers for in seeing,in speech, hearing and movement disability. On the contrary less than 20%
of disabled female population were working as main workers for the same set of disabilities. It
was found that 63% of disabled were non-workers, out of which 45% were dependent
individuals and 27% were students. The Work Participation Ratio (WPR) of the normal
population is significantly higher than that of disabled population as found in this Census data
for 2001 and 2011. These will be discussed in the forthcoming analysissection.
1Bahl R., Ghosh S. and Ghosh A (2012) .Livelihood Opportunities for Persons with Disabilities.
2 Website: http://www.scope.org.uk/about-us/our-brand/social-model-of-disability,August,2016
3Bahl R., Ghosh S. and Ghosh A (2012) .Livelihood Opportunities for Persons with Disabilities.
XVIII Annual International Conference Proceedings; January 2017
ISBN no. 978-81-923211-9-6 http://www.internationalseminar.org/XVIII_AIC/INDEX.HTM Page 173
1.3 Poverty and Disability
Disability combined with poverty can be seen as a double disadvantage,pushing the odds further
against the PWDs.Both disability and poverty negatively feeds into each other as the opportunity
for persons with disabilities to earn is much less and their expenses are more, resulting in people
with disabilities and their families being poorer than the others, and people suffering from
extreme poverty are unable to access proper services to prevent disability.There is gamut of
issues which are perversely affected by the presence of poverty, which includes lack of access to
proper food and nutrition, education, basic hygiene and sanitation, health care,self-esteem and
confidence. Lack of sufficient funds means direct cost of disability to get treated is very high
which includes costs of medical treatment, purchase and maintenance of special devices and
travelling costs, to name a few, which further exacerbates the process of economic and social
exclusion. While PWDs constitute a huge population, they are rarely seen as productive human
capital of the state. The direct correlation between disability and poverty needs special emphasis
while formulating policies for their upliftment. According to Kandamuthan and Kandamuthan
(2004), the mean expenditure of the families with a disabled child was $254 per year compared
with an expenditure of $181 per year of families with normal children. Moreover, parents of
disabled children estimated that they would require, on average, an additional amount of $203
per year as social security payments from the Government to meet the essential necessities of
their disabled children.4 Thus it can be averred that-
‘Poor people are disproportionately disabled …and people with disabilities are
disproportionatelypoor’~~ Robert Holzmann (President World Bank)
1.4 Legislative Frameworks in India
Here we discuss the four main landmark Acts that has been passed by the government to benefit
the people with disability:
a. Rehabilitation Council of India (RCI) Act, 19925
The Rehabilitation Council of India was setup under the 1992 Act of the Parliament and
further amended in 2000 to broaden its basis. The council regulates and monitors the training
of rehabilitation professionals and personnel and promotes research in the rehabilitation and
runs special educational programs for the disabled. The main objectives of this council are to
regulate the programs for training professionals that transact with PWDs, maintain uniform
standards of such programs across the country, to get qualifications provided by these
rehabilitation centers recognized by the center and maintain a Central record of PWDs
possessing such qualification. The mains functions of the council are to make sure that
qualifications from a university under the Schedule is recognized for PWDs, prescribe
standards, etiquette, code for trainers, to set minimum standards of education required from
4Kandamuthan, M, and Kandamuthan,S (2004), "The economic burden of disabled children on families in Kerala in
South India," Centre for Development Studies Discussion Paper 91
5Department of Empowerment of Persons with Disabilities, Ministry of Social Justice and Empowerment.
Swavalamban, Annual Report2015-16
XVIII Annual International Conference Proceedings; January 2017
ISBN no. 978-81-923211-9-6 http://www.internationalseminar.org/XVIII_AIC/INDEX.HTM Page 174
universities granting such qualifications, to grant approval and recognition for
institutes/universities for training rehabilitation professionals or withdraw of the recognition
with the center, etc.Presently, “553 institutions and 12 Open Universities are approved to run
RCI approved courses from Certificate, Diploma, P.G. Diploma, Bachelors, Masters, M.Phil.
andPsy. D. level courses”(p.32) and 62 courses are operating under the regular mode.
b. Persons with Disabilities (Equal Opportunities, Protection of Rights and Full
Participation) Act, 19956
The Act was enacted in order to give effect to the Proclamation on the Full Participation and
Equality of the People with Disabilities (PWDs) in the Asian and Pacific Region since India
is a signatory of the Proclamation4.Few main provisions of the Act are as mentioned as
follows:
1. Prevention and early detection of disability through research, screening tests, awareness
campaigns, etc.
2. Provision of free and compulsory education to children upto the age of 18 years under
Right to Education of PWDs.
3. 3% of government jobs are reserved for PWDs with 1% each for in seeing, in hearing and
locomotor disability/Cerebral Palsy.
4. Affirmative Action through granting of lands at concessional rates; aids and appliances to
be made available.
5. Research and manpower development through promotion of research in prevention,
rehabilitation and creation of assistive devices and provision for financial assistance for
the same.
c. National Trust for the Welfare of Persons with Autism, Cerebral Palsy, Mental
Retardation and Multiple Disabilities Act, 19997
The National Trust is a statutory body setup under the Act of Parliament. This Act is
concerned with enabling and empowering PWDs to live independently and as fully and close
to their community as possible, to extend need based support to families with PWD in
difficult times, to take care of the PWDs in times of death of parent/guardian and further
appoint a guardian for the protection, to evolve procedures for appointments of guardians and
trustees for PWDs,, to facilitate realization of equal opportunities, protection of rights and
full participation of PWDs.
d. Mental Health Act 19878
6Sightsavers. Policies and Schemes for Central and State Governments for People with Disabilities.Nature (2011)
7Department of Empowerment of Persons with Disabilities, Ministry of Social Justice and Empowerment.
Swavalamban, Annual Report2015-16, p.16
XVIII Annual International Conference Proceedings; January 2017
ISBN no. 978-81-923211-9-6 http://www.internationalseminar.org/XVIII_AIC/INDEX.HTM Page 175
Mental Illness is one of the disabilities mentioned in the PwD Act, 1995. However, treatment
and care of mentally ill persons is governed by this act, which is administered by the
Ministry of Health and Family Welfare. The Act grants right to mentally ill to be admitted to
psychiatry hospitals/nursing hospitals established by the government, safeguard the property
of the mentally ill through appointment of a guardian, allow the State Government to borne
the cost of in patient custodian, provides for legal aid to mentally illand disallows
permission to make the ill participate in any form of research without their consent.
National Policy for People with Disability, 20069
“The National Policy recognizes that PWDs are a valuable human resource for the country and
seeks to create an environment that provides them with equal opportunities, protection of their
rights and full participation in society” (Government of India, MOSPI. It is in spirit with the
basic fundamental rights of equality and freedom that are enshrined in the constitution of India.
The policy has taken into consideration every aspect that could further the vision of inclusive
society for all and recognizes the fact that a majority of persons with disabilities can lead a better
quality of life if they have equal opportunities and effective access to rehabilitation measures.
The major focus of the policy hinges on adopting programs for prevention of diseases that
directly sources disability and spreading its awareness, adopting rehabilitation measures through
physical rehabilitation that tasks on early detection and therapies for disability, education
rehabilitation which provides for free education to children upto 18 years of age and economic
rehabilitation through reservation in government and PSUs jobs and encouraging self-
employment and wage employment in private sector; and special rehabilitation measures for
women and children, who are most vulnerable and at the receiving end. The policy also calls for
providing effective social security, creating a barrier-free environment, undertaking research and
encouraging sports and recreational activities for PWDs.
Accessible India Campaign,201510
More recently, on December 2015, Government of India has launched Accessible India
Campaign or Sugamya Bharat Abhiyan with the virtuous aim of providing universal accessibility
for the PWDs. It’s a leap forward in taking the cause of inclusive development by providing
PWDs with equal opportunity and accessibility in three major categories: “Built Environment;
Public Transportation and Information & Communication Technologies”. ‘Built environment’
focuses on recognizing and making the most important government buildings accessible, ‘Public
transportation’ caters to enhancing the number of airports, railway stations and public transport
accessible while ‘ICT’ focuses on increasing the number of public documents and website which
are accessible, enlarging the number of sign language interpreters and promoting daily
captioning and usage of sign language interpretation on television news program. Accessibility
8Sightsavers. Policies and Schemes for Central and State Governments for People with Disabilities.Nature (2011),
p.23
9Department of Empowerment of Persons with Disabilities, Ministry of Social Justice and Empowerment.
Swavalamban, Annual Report2015-16, p.19 10
Ibid, p.163
XVIII Annual International Conference Proceedings; January 2017
ISBN no. 978-81-923211-9-6 http://www.internationalseminar.org/XVIII_AIC/INDEX.HTM Page 176
for PWDs is a recognized right in India under the PWD Act(1995) and while India is a signatory
to United Nations Convention on the Rights of Persons with Disabilities (UNCRPD) which
provided for the signatory governments to take appropriate measures to implement the right,
India is already set to make accessibility for PWDs as equal with the other people.
Section 2: Literacy and Employability of PWDs
2.1 Literature Review
Work or employment remains one of the key avenues which makes people independent and is a
prerequisite to lead a dignified life. This, then becomes even more important when we talk in
context of people with disabilities (PWDs). The labor market theory suggests, for reasons of both
supply and demand, that the employment rate of PWDs will be lower than that of people without
disabilities. On the supply side, PWDs will experience a higher cost of working, because more
effort may be required to reach the workplace and to perform the work. In countries with more
generous disability allowances, employment may result in a loss of benefits and health care
coverage, whose value is greater than the wages that could be earned 11 by PWDs so their
“reservation wages” are likely to be higher than that of a person without a disability. The
resulting “benefit trap” is a source of concern in many high-income countries12. In developing
and underdeveloped countries, the lack of adequate infrastructural and supportive services to
assist the disabled acts as an added disadvantage for them to supply labor power. On the demand
side, the “undesirable characteristics”(physical or mental impairment) possessed by this
disfavored group make it more expensive to employ them. Therefore, the employer either refuses
to hire the members of the group, or hires them if they are willing to work at a lower wage13.
Since the disabled are excluded from certain work, they are crowded into limited number of
occupations thereby lowering the wage in those occupations. Thus, the higher reservation wage
and lower market wage make a person with disability less likely to be employed14.
While considering the employment condition of the disabled in the Indian perspective, we came
across some important points: first, average annual GDP Growth rate of India is 8.45 per cent
(2004-2011) and employment opportunities have increased in the last two decades. The
employment rate of disabled has fallen from 43 per cent in 1991 to 38 per cent in 2002 despite
the galloping economic growth15. Second, one may find plethora of programs to promote the
employment of the PWDs, though their impact has been negligible and mostly confined to the
urban areas. Third, public sector employment reservations have also yielded poor outcomes due
to design and implementation problems.
11
Stapleton et al., 1997, as cited in ‘Employment of People with Disabilities: An Analysis of Nature and Determinants’ by Manju S. Nair, Labor & Development, Vol. 21, No. 1, June 2014 12
Kemp et al., 2006, ibid. 13
Becker, 1971,‘Employment of People with Disabilities: An Analysis of Nature and Determinants’ by Manju S. Nair, Labor & Development, Vol. 21, No. 1, June 2014 14
Mitra and Sambamoorthy, 2006, ibid 15
World Bank Report, ‘People with Disabilities in India From Commitments to Outcomes, 2007, http://siteresources.worldbank.org/INDEXTN/Resources/295583-1171456325808/Chapter05.pdf

XVIII Annual International Conference Proceedings; January 2017
ISBN no. 978-81-923211-9-6 http://www.internationalseminar.org/XVIII_AIC/INDEX.HTM Page 177
These above arguments can be reconciled by empirical evidences from both the developed and
developing countries. “Analysis of World Health Survey (2002-04) results from 51 countries
gives employment rates of 52.8 per cent for men with disability and 19.6 per cent for women
with disability, compared to 64.9 per cent for non-disabled men, 29.9 per cent of non-disabled
women”(p.237)16.A study by International Labor Organization in the Asia and Pacific region
indicates that there are 370 million persons with disabilities and 238million of them are in the
‘working age’. Their unemployment rate is usually double that of the general population and is
often as high as 80 per cent or more.
Therefore, it become clear from the brief review that is crucial to report evidences about the
literacy rates with the corresponding educational levels attained across different kinds of
disabilities. These figures become pivotal for unraveling the plight of disabled people as latter
forms a crucial cog in the wheel to attain employment which forms the basis of the following
section.
2.2 Findings and Analysis
In Census 2001, the data was collected across five kinds of disabilities namely: seeing, speech,
hearing, movement and mental disability, whereas in Census 2011 this was increased to eight
kinds of disabilities namely: seeing, speech, hearing, movement, mental retardation, mental
illness, any other and multiple disability. Therefore, this makes the data sets non-comparable
over time. But we can still use analysis done with the Census 2001 data as a vantage point to see
how the overall disabled people in the country have fared over a decade.
The results of the subsequent analysis pertain to the data collected in 2011 on overall literacy
rates and employment levels across different kinds of disabilities and male/female. We further go
on to analyze the educational levels attained within the literates across different kinds of
disabilities and male/female. This will give us holistic understanding about the level of education
attained by the disabled people. The other strand is employability of disabled which is captured
by closely analyzing information for disabled individuals working as Main workers, who are
employed for more than six months in a year; Marginal Workers, who are employed for less than
six months in a year (further broken up into two categories in Census 2011: marginal worker
working for less than three months and working between 3-6 months); and Non- workers, who
are not employed at all, for both Census 2001 and 2011. We have restricted our whole study for
analysing the question of employment to the age group (15-59 years) because this represents the
working age group.
2.2.1 All India Level
A. Literacy Analysis of Disabled Population
16
ILO,2006, as citied in ‘Employment of People with Disabilities: An Analysis of Nature and Determinants’ by Manju S. Nair, Labor & Development, Vol. 21, No. 1, June 2014
XVIII Annual International Conference Proceedings; January 2017
ISBN no. 978-81-923211-9-6 http://www.internationalseminar.org/XVIII_AIC/INDEX.HTM Page 178
We would closely study the literacy trend across each kind of disability using latest Census 2011
data.
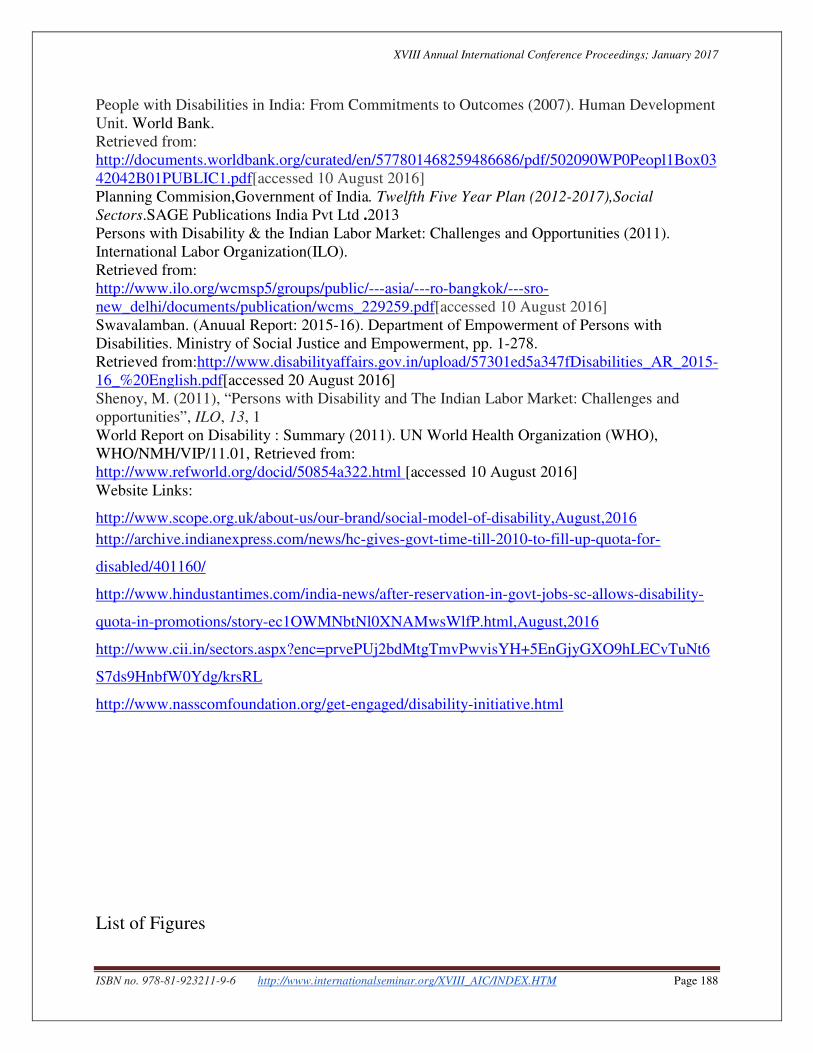
Figure 1 as given here, highlights the distribution of literacy rates across different kinds of
disabilities: seeing (53per cent), hearing (57per cent), speech (58per cent), movement (60per
cent), mental retardation (41per cent), mental illness (49 per cent), any other (60 per cent) and
multiple disability (33 per cent). Thus maximum literacy rates were attained by people suffering
from movement disability and the least by the people having multiple disabilities.
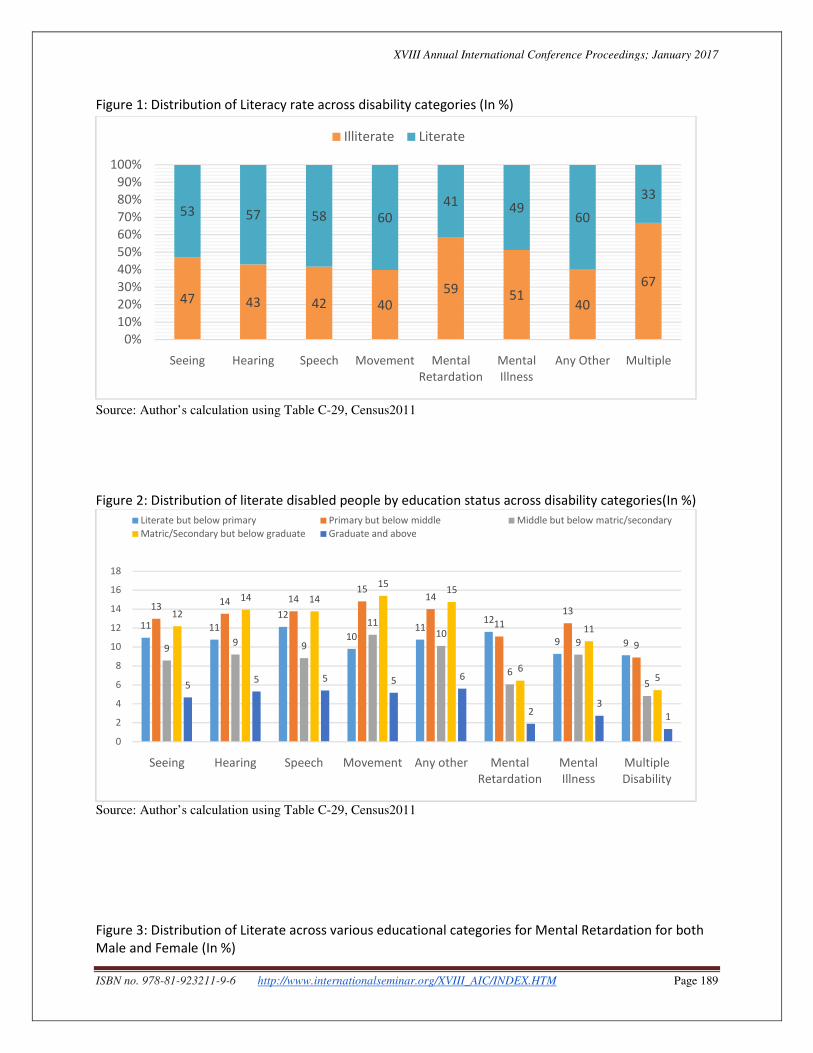
Figure 2 given here, encapsulates the percentage distribution of literate disabled people by
educational status across each kind of disability. For instance within seeing disability: 11 per
cent were literate up to primary level, 13 per cent up to middle level, 9 per cent completed the
middle level but were below matric/secondary, 12 per cent completed matric/secondary but were
below graduate and 5 per cent were graduate and above. A similar trend in attainment of
educational levels was depicted by the disability categories: speech, movement, hearing, and any
other, where the percentage of people attaining education level up to middle level goes up for all
three compared to up to primary level education category. This is followed by a fall across the
disabilities in question for the education level between middle and matric and then a spike for
education level till matric/secondary but were below graduate. But a little different trend was
observed for disability categories of mental retardation and multiple disability: the percentage of
disabled people declined as we moved from educational status of below primary to below
matric/secondary. Further there was a marginal increase in the percentage of disabled people
attaining additional education level till matric/secondary but below graduate. Common to all is
that a sharp decline was recorded in the percentage of literate disabled people attaining
educational level at graduation and above.
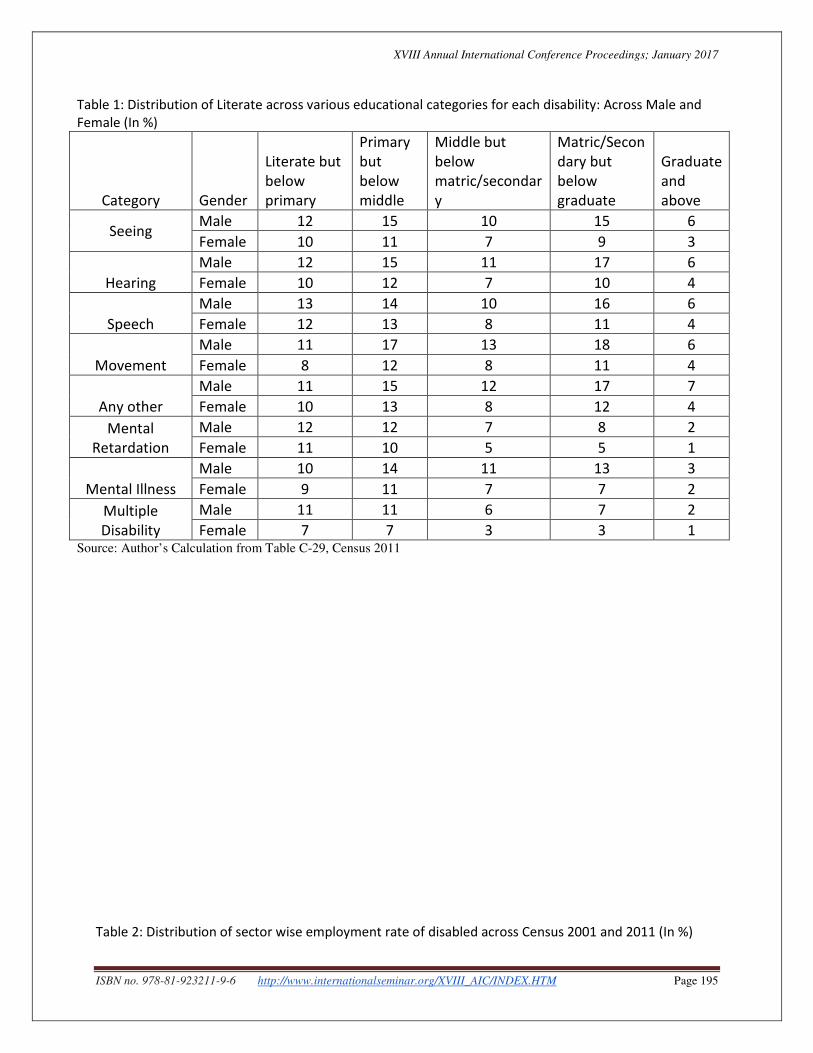
Table 1 given here, investigates further if there are variabilities in the educational levels
distributed across the types of disabilities for across sex, that is, male and female. And one clear
observation is that disabled male literate percentage is significantly higher than disabled female
literate percentage across all five educational levels for the eight listed disability categories.
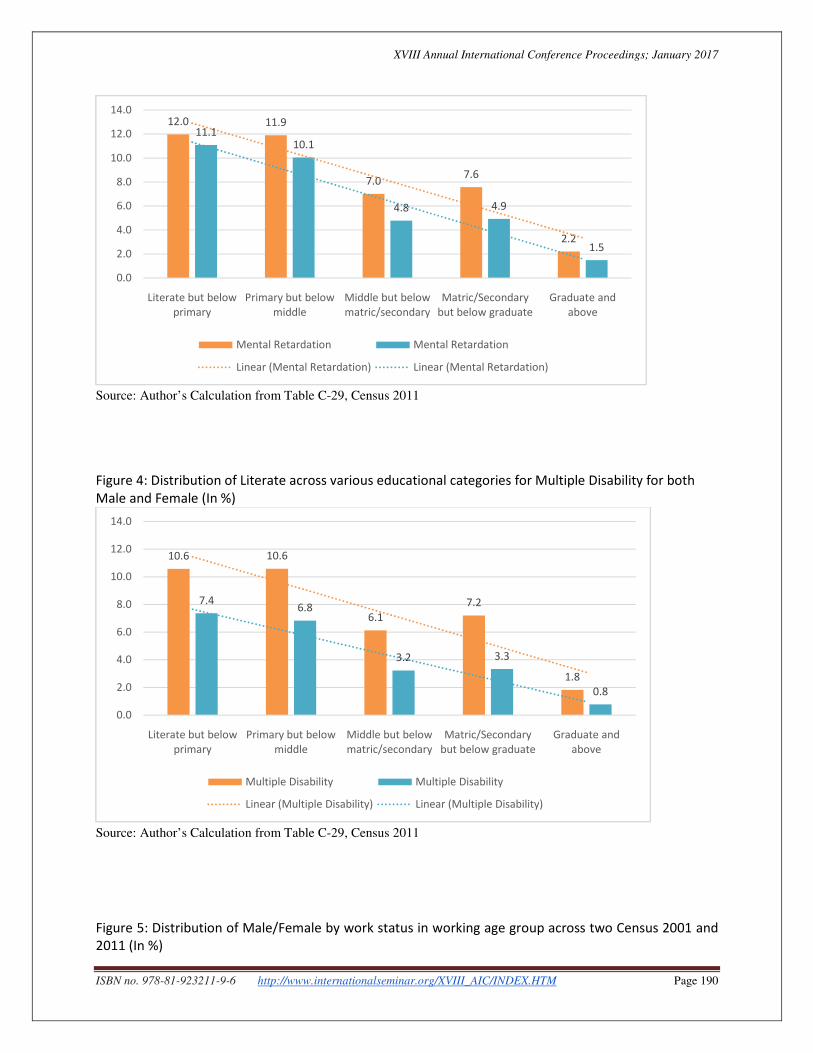
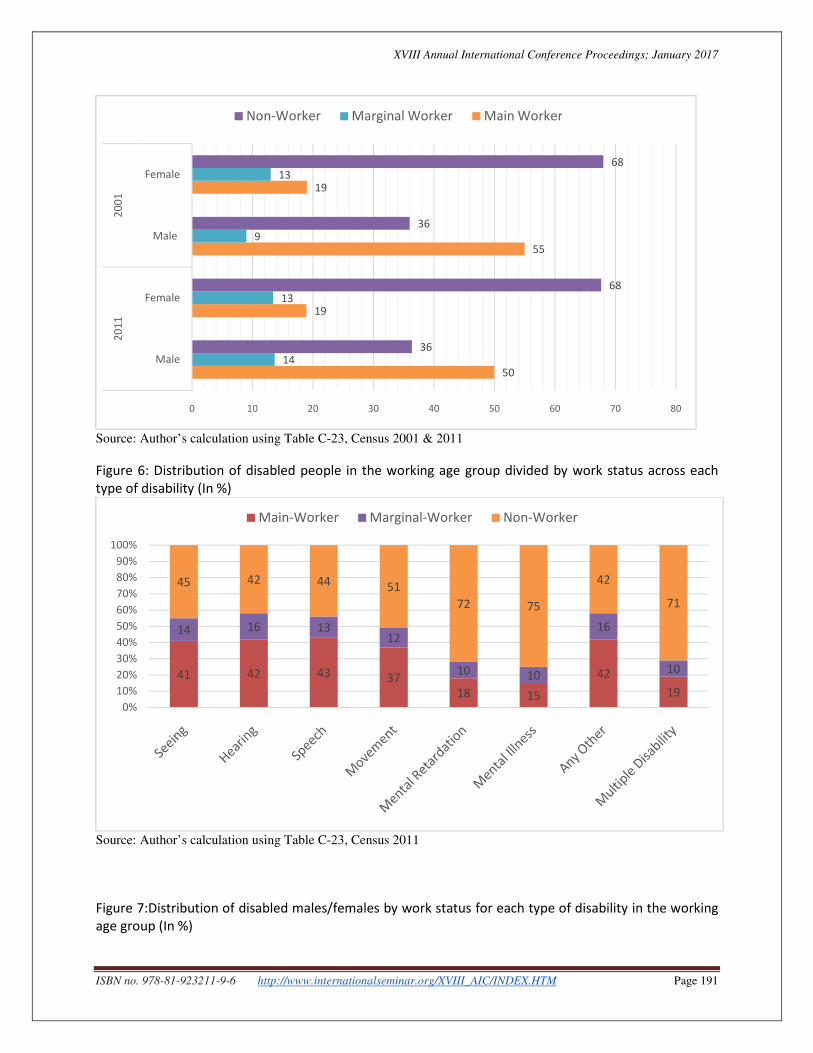
Moreover,figures 3 and 4 given here, show the percentage of people in two categories of
disability, that is mental retardation and multiple disability, spread across five levels of
educational levels for both male and female separately. And we get an interesting result that with
increase in the educational levels, the percentage of people in the respective categories decline
for both the disability categories in question. Further the fall in female participation to attain
higher education was more than fall in male participation.
B. Employment analysis for disabled people
We would like to closely analyze the employment trends in Census 2011 by incorporating the
disabled people lying in the working age group (15-59 years). The distribution of disabled people
in the working age group across different kinds of disability was: seeing (17per cent), hearing
(18per cent), speech (8per cent), movement (22per cent), any other (19per cent), mental
retardation (6per cent), mental illness (4per cent) and multiple disability (6per cent). We found
XVIII Annual International Conference Proceedings; January 2017
ISBN no. 978-81-923211-9-6 http://www.internationalseminar.org/XVIII_AIC/INDEX.HTM Page 179
that nearly half of the disable population in the working age group were non-workers (49per
cent). The remaining 51per cent were distributed among main workers (37per cent) and marginal
workers (14per cent).
Figure 5 given here captures the discrimination in gaining employment for female workers in
the working age group which is prevalent in both Census 2001 and 2011. One unambiguous
conclusion is that there are more male workers than female workers. Within male, 5 per cent
main workers shifted to become marginal workers in 2011, as compared to 2001. The position of
female is unchanged across both Census 2001 and 2011, as almost twice the number of females
(68 per cent) constituted the proportion of non-workers as compare to males (36 per cent). This
carves out the extremely disadvantageous position of a woman having disability.
There are eight categories of disabled people in Census 2011, and next step is to see the
proportion of disabled people in the working age group (15-59 years) divided by work status
(Main-worker, Marginal-worker and Non-worker) for each type of disabilities: seeing, hearing,
speech, movement, mental retardation, mental illness, any other and multiple disability.
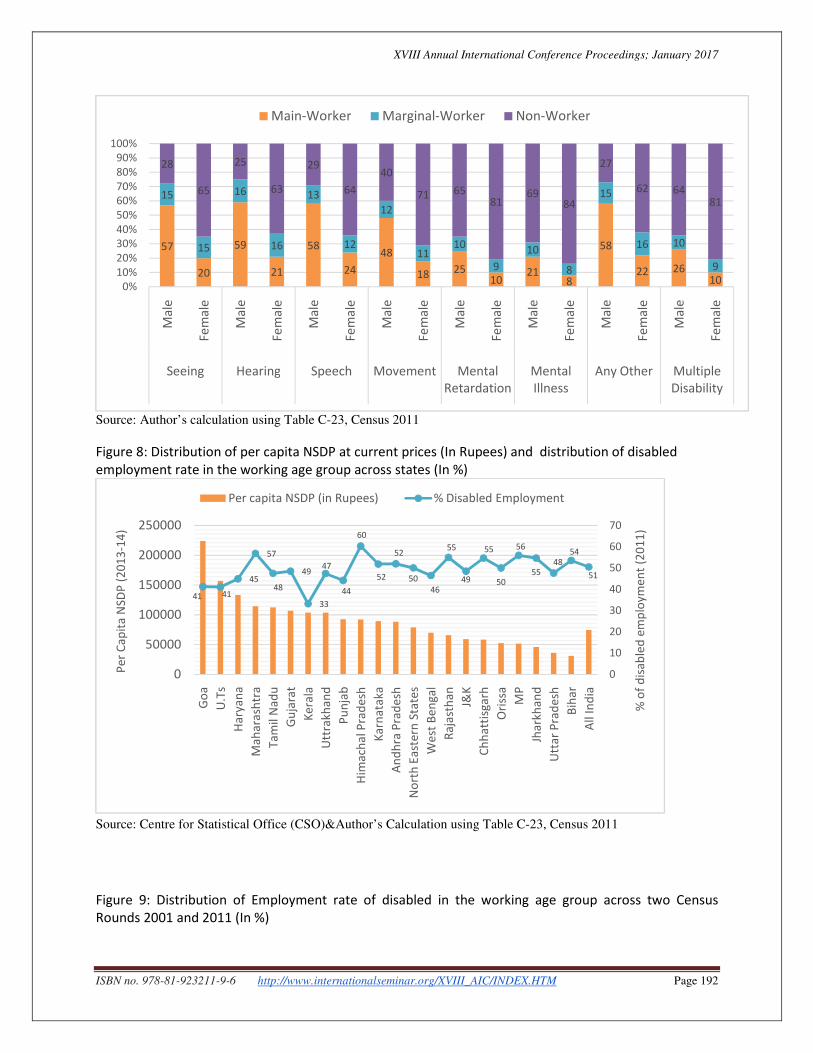
This is encapsulated by figure 6, given here, which further summarizes that people suffering
from seeing, hearing, speech, movement and any other form of disability have nearly more than
40per cent of their population working as main workers. On the contrary, almost three-fourth of
the population lies in the category of non-workers for people suffering from mental retardation
(72per cent), mental illness (75per cent) and multiple disability (71per cent). The distribution of
marginal workers remains in the range of 10-16per cent, maximum being for disability category
‘any other’ (16per cent) and minimum 10per cent for disability categories ‘mental retardation’,
‘mental illness’ and ‘multiple disability’ (MMM). These results points at the fact even among the
disability types, these three categories denoted as 3Ms employ the least number of people as
compared to the rest of the five disability categories.
The next step is to see if there is any gender bias within these eight disability categories arranged
according to the work status. This is captured by figure 7, given here, which depicts the
alarming disparities against the disabled females vis-à-vis disabled males, falling in the working
age group, in getting employment across all the eight disability categories. Employment in this
paper will be defined as people who are classified as main and marginal workers together. There
is a wide gap of employment rate between male and female. Male employment is almost twice
that of females and this holds true across all the eight disability categories, except the ‘any-other’
category where the difference between male and female is less than twice.
Therefore, the preceding analysis points to two major findings: firstly, more proportion of
disabled people lie in the category of non-workers as very less find gainful employment across
eight kinds of disability, and secondly even within these tapering employment opportunities,
females lag behind males to get employment and hence are more underprivileged. These
conclusions give prudence to the employability of disabled in India. Further to get a holistic
picture of the current situation we have analyzedeach state individually and tried to encapsulate
the question of employability of disabled on a broader canvas in the succeeding sub-section.
XVIII Annual International Conference Proceedings; January 2017
ISBN no. 978-81-923211-9-6 http://www.internationalseminar.org/XVIII_AIC/INDEX.HTM Page 180
2.2.2 State Wise Analysis
Figure 8, given here, is an attempt to get a snapshot of how different states fair in terms of
development. We have taken per capita Net State Domestic Product (NSDP) as a proxy for the
level of development which are then superimposed by the level of disabled employment across
each of the states. We get a very interesting finding that the level of development across the
states tend to play a minimal role in ensuring employment to the disabled people. The share of
employment of disabled is reported to more in the bottom most in five states (Bihar, Uttar
Pradesh, Jharkhand, Madhya Pradesh and Orissa) [52per cent] in comparison to the five states
(Haryana, Maharashtra, Tamil Nadu, Gujarat and Kerala) [46per cent] lying in ten highest per
capita NSDP cohort.The latter figure even surpasses the All India average level of disabled
employment which stands at 51per cent.
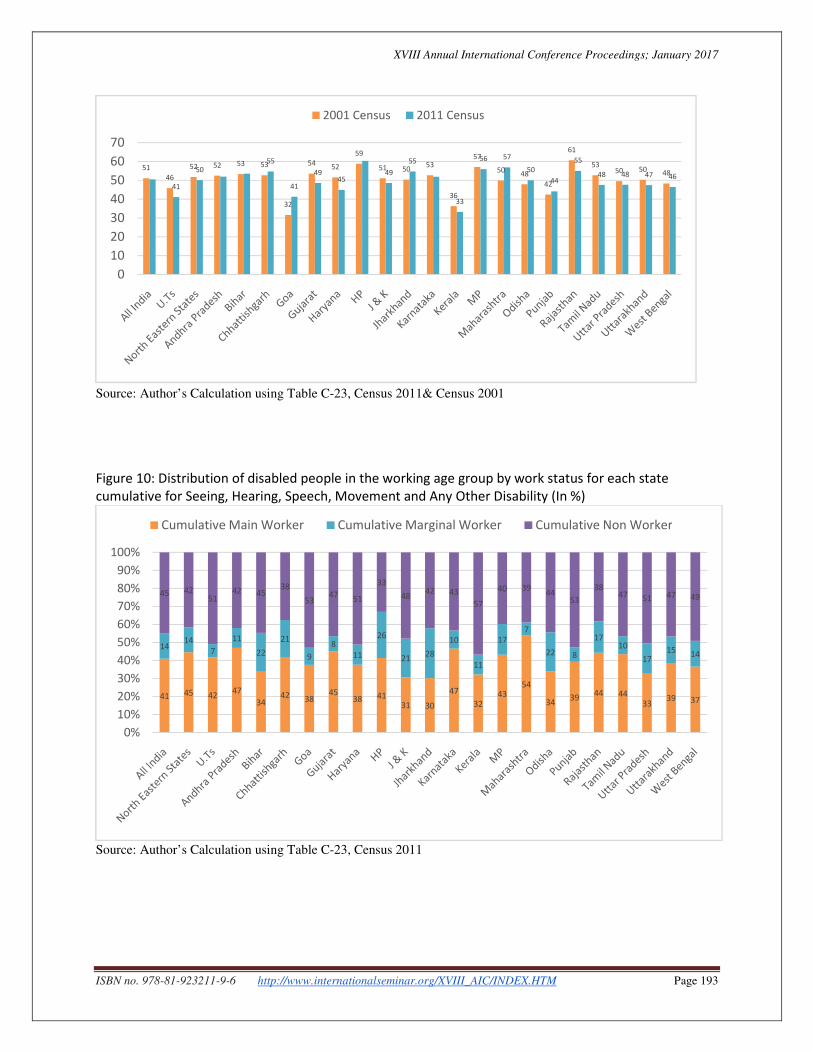
Figure 9, given here, gives us the comparison of how the states have performed providing
employment to the disabled people across the two Census periods. Though the all India average
employment rate remains the same but there have been changes recorded in some particular
states. There were some seemingly startling results. For instance, take the state of Kerala which
has excellent human development indicators, on one hand, but it has the least percentage of
disabled employment (33per cent) in the whole country. Some states like Maharashtra and
Jharkhand have shown more than a five percentage point increase in the employment of disabled
in the working age group from 2001 to 2011. On the other, there are states like Rajasthan and
Haryana which have shown a more than five percentage fall in the employment of disabled in the
same reference period.
Rate of disabled employment patterns by region, states and Union Territories are presented in
Table 2, given here, across the two census periods. A clear unambiguous trend is that rural area
employ more disabled people than urban area. This fact is reflected by the distribution of rural
national average of disabled employment across spread across the two census years which was
reported to be 55 per cent and 53 per cent for 2001 and 2011 respectively. These figures were
found to be significantly more than urban national average which stood at 42 per cent and 45per
cent for the same two periods respectively. There has been a more than two and a half percentage
point decline on an average across the three regions of Central, North and South of India in rural
disabled employment. On the other hand, there was three and a half percentage point increase
recorded in urban disabled employment across the five regions of North, Central, East, West and
South. The highest increase was recorded by West region (8per cent) and within this highest
increase was recorded by Goa (11per cent).
Figure 10, given here, depicts the distribution of disabled people across the work status for the
five disabilities (seeing, speech, hearing, movement and any other) clubbed together for all the
Indian states. The national average of percentage of disabled people working as main workers
stood at 41 per cent, percentage of disabled people working as marginal workers stood at 14 per
cent and percentage of disabled people in non-worker category stood at 45 per cent. The state
which employed least number of people as main workers is Jharkhand (30 per cent) followed by
Jammu and Kashmir (31 per cent) and Kerala (32 per cent). The state which employed least
XVIII Annual International Conference Proceedings; January 2017
ISBN no. 978-81-923211-9-6 http://www.internationalseminar.org/XVIII_AIC/INDEX.HTM Page 181
number of as marginal workers is Maharashtra (7 per cent) but it employed maximum percentage
of main workers (54 per cent). High focused states like Bihar, Uttar Pradesh Odisha and Madhya
Pradesh had 19 per cent, 18 per cent, 14 per cent and 19 per cent of disabled people working as
main workers respectively.
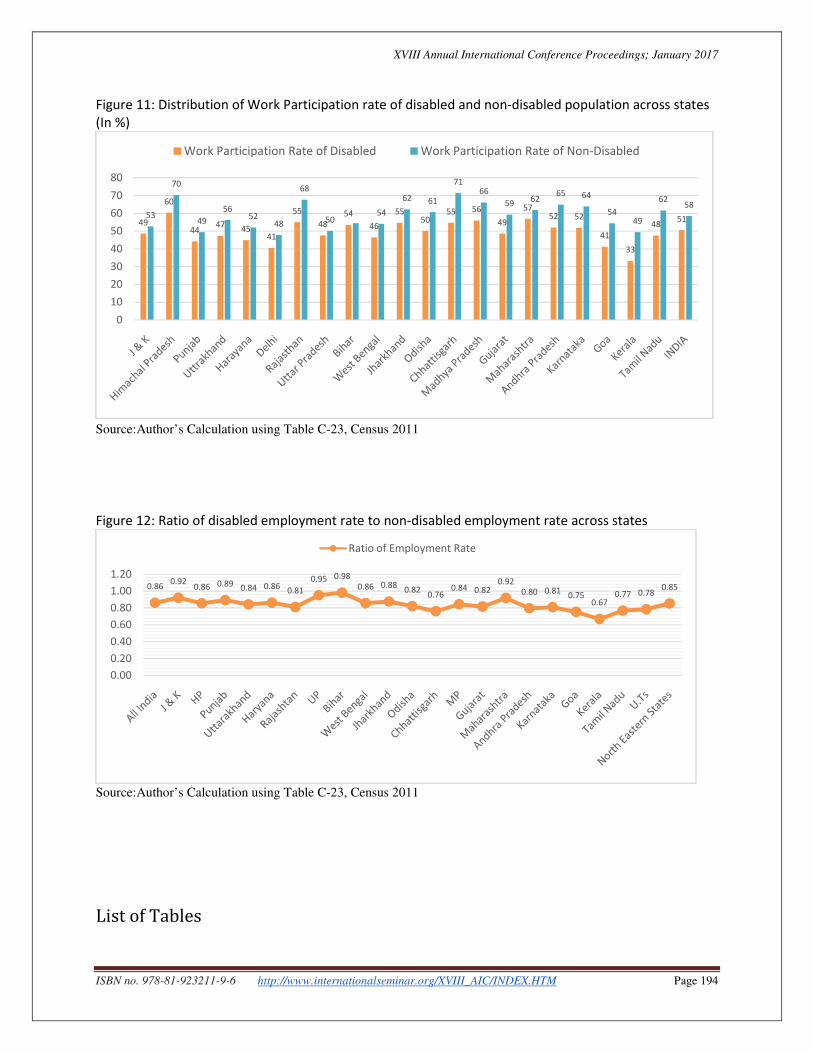
To get a clear picture about the standing of disabled people vis-à-vis non-disabled people, we
look at the work participation rate for both as it is considered to be the basic indicator of
measuring labor market status. The results of the same are captured in figure 11 given here.
From the data we get that WPR of disabled people is lower than the WPR of non-disabled people
across all the states and all India level. Kerala is still one of the worst performing states when it
comes to providing employment to the disabled as the gap between the respective WPR of
disabled and non-disabled is the maximum. This variation in the work participation ratios takes
us a step forward to calculate the ratio of employment rate of disabled to non-disabled across all
the states.
Figure 12 given here gives us the ratio of employment rate calculated by taking the ratio of
employed disabled to employed non-disabled. Value one indicates that both the disabled and
non-disabled have the same proportion of employment in their respective categories. We can
clearly see that none of the Indian state achieve perfect equality. The national rate of 0.86 implies
that disabled people in India are 14 per cent less likely to be employed as compared to non-
disabled people. Ratio of employment rate for state of Bihar was the highest and stood at 0.98.
On the other hand, Kerala had lowest rate of 0.67, implying that disabled people in Kerala are 33
per cent less likely to be employed as compared to non-disabled people in the state.
But the major limitation of these findings is that Census of India only looks into the work
participation and occupational patterns. Other important aspectsof discrimination faced, work
satisfaction, nature, determinants andimpact of employment are not analyzed. An understanding
of theseaspects becomes necessary for proper design and implementation of policies to improve
the labor market status of the disabled and toinclude them in the mainstream development path.
We are now well acquainted with the difficulties faced by PWDs to be involved as an equal
member of the society and thus drafting viable solution is the need of the hour. Hence the next
section will entail a discussion to look into different avenues that will assist in alleviating the
problems ofPWDs by effectively answering important questions surrounding the employability
in the form of;
What should be done?
Why it should be done?
How can it be done?
Section 3: Initiatives
The barriers to the inclusion of disabled people are physical (access to buildings, infrastructural,
etc.), institutional (discriminatory practices) and attitudinal (stigma and bias). Many traditional
approaches towards disabilities are patronizing, exclusive and only reach a small number of
PWDs. In order to ensure a dignified livelihood for this marginalized section of the society, it
XVIII Annual International Conference Proceedings; January 2017
ISBN no. 978-81-923211-9-6 http://www.internationalseminar.org/XVIII_AIC/INDEX.HTM Page 182
becomes imperative on the part of the society as a whole to look at them as people who are
endowed with an equivalent potential and capabilities. And so, some of the most forward and
necessary initiatives has been taken, so as to ensure that this potential is reckoned upon in the
best possible way. This would ensure that PWDs are equally competitive, self-dependent,and in
turn make them motivated and confident to progress and prosper even in their dire
circumstances. This answers the ‘Why’ part of the question.
The following section would analyze the various initiatives that have been taken up by these
sector – government, private, and disabled people themselves. The analysis will depict both the
positives and the negatives of these policies and initiatives and provide uswith the dual answers
to ‘What should be done’ and ‘How it is actually done’.
3.1 Government and Public Sector
There have been several provisions by the government for the disabled people but effective
implementation on the ground remains the key. It wouldn’t be wrong to say that Government
departments and Public Sector undertakings remains an important employer of the disabled. In
fact, the first Special Employment Exchange was set up way back in 1959 in Mumbai.There are
42 special employment exchanges and 38 special cells for PWDs in regular employment exchanges
as of 2005. These are mainly to register job seekers and provide them with employment mainly in
public sector. However, private sector and NGOs catering to skill development and employment
generation for PWDs have remained aloof from these exchanges.17
According to Employment Exchange Statistics, 2015, the percentage of placement to registration for
special employment exchanges has fallen from 6.6 per cent in 2009 to 3.5 per cent in 2013 and the
figure for percentage of placement to live register has fallen from 0.6per cent to 0.2per cent18. These
figures point serious questions in the efficacy of these employment exchanges.
GovernmentofIndiainitiatedthepolicyof3%reservationinjobsthrough the PWD Act,1995 in
government sector and Public sector undertakings. “The status of reservation for Government in
various Ministries/ Departments against identified posts in Group A, B, C & D is 3.07%, 4.41%,
3.76% and 3.18% respectively. In PSUs, the reservation status in Group A, B, C & D is 2.78%,
8.54%, 5.04% and 6.75%, respectively”(p.9)19.
However, there are some shortcomings in the implementation of this Act, namely:
1. The jobs are identified in an arbitrary manner by a Central Level committee who have
less knowledge of exact jobs in each department and so every department is
recommended to have their own committees for this purpose.
17People with Disabilities in India: From Commitments to Outcomes; Document of the World Bank; Human Development Unit; South Asia Region; May 2007
18
Ministry of Labour and Employment. Government of India.Employment Exchange Statistics2015. 19
Ministry of Social Justice and Empowerment,Government of India.National Policy for Persons With
Disabilities.2006.No.3-1/1993-DD
XVIII Annual International Conference Proceedings; January 2017
ISBN no. 978-81-923211-9-6 http://www.internationalseminar.org/XVIII_AIC/INDEX.HTM Page 183
2. Though 2011 census recognizes disability over eight forms, the PWD Act provides for
3per cent reservations in the job list for just three categories of loco motor, visual and
hearing having 1per cent each; leaving out 42per cent the population with disabilities.
Challenges to employment
Backlog Vacancies:
Disability sector has been demanding fulfillment of 3% quota for disabled people for a long time
which makes the policy itself futile, so necessary steps must be taken for its time bound
clearance.
The Delhi High Court has also ruled, “the Centre to conduct a “special recruitment drive” to fill
thebacklog in posts reserved for this category by December 2010"20.In lieu of low number of
filling up these vacancies, the supreme court has extended the reservation of 3% to promotions as
well in July,201621.
Accessibility:
It is a major issue in Government offices. When we spoke to some Government employees, they
said there are now some facilities in the Head Offices but in smaller offices there are no facilities
atall. There are no ramps, washrooms, etc. for persons with disabilities. A major breakthrough to
negate this challenge has been through the launching of Accessible India Campaign in 2015.
3.2 Private Sector
Privatesectorhas been evergrowinginourcountry. The recent years have seen an upsurge in the
employment of PWDs in the private sector. Despite negative attitudes and perceptions, private
sector is now hiring disabled workers due to social reasons such as corporate social responsibility
and economic reasons such as increased demand for labor force. In 2008, Government of India
launched The Scheme of Incentives to Employers in the Private Sector for Providing
Employment to Persons with Disabilities22. The scheme is made to encourage private sector
employment of PWDs by providing employer’s contribution to Employees Provident Fund(EPF)
and Employees State Insurance (ESI) for first three years for the PWD employed after 1st
April,2008 with a monthly salary of upto Rs.25,000.Till September 2010,392 and 918 persons
have been registered by Employees Provident Fund Organization (EPFO) and Employees State
Insurance Corporation (ESIC) respectively.More and more companies are pitching in inclusive
HR practices as they are recognizing the fact that PWDS are likely to be as productive, are more
dedicated and loyal, have lower rate of attrition and absenteeism, workforce morale is
boosted23.Still though, the private sector forms a very tiny part of employment of PWDs.
20
Website: http://archive.indianexpress.com/news/hc-gives-govt-time-till-2010-to-fill-up-quota-for-disabled/401160/ 21
Website: http://www.hindustantimes.com/india-news/after-reservation-in-govt-jobs-sc-allows-disability-quota-in-
promotions/story-ec1OWMNbtNl0XNAMwsWlfP.html,August,2016
22Planning Commision,Government of India. Twelfth Five Year Plan (2012-2017),Social Sectors.SAGE
Publications India Pvt Ltd .2013
23 Best Practices in Employment of People with Disabilities in the Private Sector in India, An Employer Survey,
American India Foundation 2014
XVIII Annual International Conference Proceedings; January 2017
ISBN no. 978-81-923211-9-6 http://www.internationalseminar.org/XVIII_AIC/INDEX.HTM Page 184
3.2.1 Industry Initiatives24
In lieu of promotion of employment of PWDs in private sector, primary industrial units-CII,
FICCI and NASSCOM were encouraged by National Centre for Promotion of Employment for
Disabled People (NCPEDP) in 1998 to further the cause of PWDs. This development marked a
breakthrough since the difficulties faced by the marginalized group got acknowledged as social
and human resource issue.
1. Confederation of Indian Industry (CII): In order to promote employment of PWDs,CII
advanced a ‘Corporate Code on Disability’ in 2006 where companies were asked to make
their policies on disability. The core groups which have been setup in Delhi and
Bangalore are obligated to promote PWDs’ employment through job fairs, awareness
programs, etc.CII has also setup PWD Sectoral Skill Council which acts as a conduit
between the skill needs of the industry and the actual skills imparted to PWDs25.
2. National Association of Software and Services Companies (NASSCOM): One of the core
functionary of NASSCOM foundation is its ‘Disability Initiative’, wherein they promote
the employment of PWDs in IT-BPM industry26. Their three focus area of work are:“(1)
Web Accessibility (2) Employment of Differently abled (3) Affordability of ICT
applications and tools”. The foundation acts as a bridge between companies and qualified
PWDs by engaging with the HR agenda of companies on one hand and skill imparting
institutes on the other to showcase their workforce.
3.2.2 Individual Company Initiatives
On individual front, many companies have begun to understand the need to employ disabled
people in their organization both socially and economically. As JavedAbidi remarked regarding
disabled people, “These are isolated islands that show that linking disabled to jobs is doable, not
from a charity perspective but looking at the company profits”.
1. ITC: At ITC Hotels, differently-abled people are engaged in core functions like finance,
HR, housekeeping, reservations and concierge services. The company has 292
differently-abled employees across all its hotels.27
2. MphasiS: MphasiS states that it fundamentally necessary to recruit PWDs because it
brings in diversity which creates systems advantageous to both PWDs and clients.
Remarkably, from 2007 to 2010, the number of disabled workers within the company
grew from 56 to 350, now comprising 1 per cent of its workforce.28
24
‘Employment of Disabled People in India’, Baseline Report 2009, prepared for National Centre for Promotion of Employment of Disabled People (NCPEDP), prepared by Diversity and Equal Opportunity Sector (DEOS)
25 Website:
http://www.cii.in/sectors.aspx?enc=prvePUj2bdMtgTmvPwvisYH+5EnGjyGXO9hLECvTuNt6S7ds9HnbfW0Ydg/
krsRL 26 Website: http://www.nasscomfoundation.org/get-engaged/disability-initiative.html 27‘Persons with Disability & the Indian Labor Market: Challenges and Opportunities’, ILO, December 2011 28
Bureau for Employers’ Activities and Skills and Employability Department. Disability in the Workplace: Company Practices. ILO 2010.
XVIII Annual International Conference Proceedings; January 2017
ISBN no. 978-81-923211-9-6 http://www.internationalseminar.org/XVIII_AIC/INDEX.HTM Page 185
3. Titan: In the early 1980s,Titan became one the first few enterprises to hire PWDs and
now they comprise of 4% of its total workforce. Titan undertook careful hiring of PWDs
by finding the right job for the various kinds. It also took onto itself to create a nurturing
workforce environment by providing counselling sessions to the employees, their
families, and training the other employees to effectively communicate with them; they
taught sign language to their employees where it became difficult to tell hearing
compromised from the other.29
Challenges to employment
• The mindset: Corporates have insufficient knowledge and preconceived notions of which
makes it difficult to entice corporates to look at the disabled as viable employment profiles.
• The private sector employment only tends to hire PWDS in hearing,seeing and
orthopedically challenged wherein they are usually stuck to entry level stage with little
hope of rising the ladder. People with mental illnesses find negligible employment in
private sector.30
• Workplace accessibility and adjustments: the problem of accessibility (ramps, washrooms,
etc.) remains a serious problem and corporate houses are reluctant to invest in accessible
infrastructure. Also, at times disabled people do not find it easy to adjust in the normal
workplace.
• Corporate social responsibility: Many companies hire a few persons with disability or fund
some training as a part of corporate social responsibility (CSR). Unless companies hire
persons with disability because it makes business or commercial sense, the initiative will
not be sustainable.
3.2.3 Self Employed
In a scenario,where public and private sector have a ceiling to employment of PWDs, the only
positive option is to promote self-employment.Fruitful self-employment depends on
attainment of proper education or training in vocational courses and also availability of credit
finance. For this, the National Policy(2006) advocates propelling through vocational education
and management training.The World Report on Disability(2011) points out four factors for
successful self-employment of PWDs:
1.“ a self-directed identity (self-confidence, energy, risk-taking);
2.relevant knowledge (literacy and numeracy, technical skills, business skills);
3.availability of resources (advice, capital, marketing assistance);
4.an enabling social and policy environment (political support, community development,
29
World Report on Disability : Summary, WHO 2011, WHO/NMH/VIP/11.01 30
Best Practices in Employment of People with Disabilities in the Private Sector in India, An Employer Survey. American India Foundation 2014
XVIII Annual International Conference Proceedings; January 2017
ISBN no. 978-81-923211-9-6 http://www.internationalseminar.org/XVIII_AIC/INDEX.HTM Page 186
disability rights)”(p.247)31.
National Initiative:To promote self- employment among disabled people, the role of micro-
finance or loans is important. In India, National Handicapped Finance and Development
Corporation (NHFDC), MSJEwhich promotes economic development activities, self-
employment ventures, higher education and marketing for the benefit of persons with disabilities,
has been granting loans and scholarships for such ventures at softer terms through state
channelizing agencies. During the financial year 2015-16, NHFDC disbursed Rs.69.75crores to
10552 beneficiaries. Also,to spread the outreach of this program, lending policies have been
liberalized. Furthermore, the scheme of GyanPrabha launched in Novermber,2011 aims to
provide educational support in graduation, professional or vocational training courses for people
with Autism, Cerebral Palsy, Mental Retardation and Multiple Disabilities to help them find
gainful employment or self-employment.32
Challenges to employment
However, this type of employment too is not highly feasible or remunerative for PWDs. Self-
Employment is not just about providing loans/grants. There are many related issues
whichcontribute to the success of the venture. NGOs have been providing vocationaltrainings in
chalk making, candle making, etc. However, many of these initiatives have either failed or have
not yielded the desired result. These will not become income generating activities, unless there is
market for the products / services. Disabled people also find it difficult to take the materials to
the urban market due to lack of accessible transportation, accommodation, excessive expenditure
and other issues.The challenges faced include lack of information or business skills, poor access
to NHFDC loans, remote access to centers providing vocational training and skill upgradation
etc.
Section 4: Concluding Remarks
The approach that is adopted while addressing the problems and plight of disabled becomes
pivotal. The policy makers should ideally transcend the ‘charity model’ and view their case as
the ‘rights’ of the disabled which is being widely prophesized around the world. Therefore, it
should not be seen as favor that any government in the world does while addressing critical
aspects of dealing with disabled people, rather it should be seen as collective responsibility of all
to make sure that the system is made equitable, and opportunities are provided to disabled and
non-disabled people alike. But the irony remains even after being aware of what’s desirable.
Severe bottlenecks in the implementation of the policies which are targeted for the people with
disabilities are prevalent and even the concerned authorities remain oblivious to this fact. People
with special needs must be provided with special entitlements, and so it is important to break free
from the stereotypical thinking of considering these people as a liability just because they are
31
World Report on Disability : Summary, WHO 2011, WHO/NMH/VIP/11.01
32
Department of Empowerment of Persons with Disabilities, Ministry of Social Justice and Empowerment. Swavalamban, Annual Report2015-16

XVIII Annual International Conference Proceedings; January 2017
ISBN no. 978-81-923211-9-6 http://www.internationalseminar.org/XVIII_AIC/INDEX.HTM Page 187
having certain impairments. Or lest, this will carry a lot of socio-economic repercussions, which
will in turn exacerbate the stigmatization of PWDs.
References
Bahl R., Ghosh S. and Ghosh A (2012). .Livelihood Opportunities for Persons with Disabilities. pp.1-234 Retrieved from:http://www.undp.org/content/dam/india/docs/pub-povertyreduction/livelihood-opportunities-for-persons-with-disabilities.pdf[accessed 7 August 2016] Best Practices in Employment of People with Disabilities in the Private Sector in India, An Employer Survey (2014). American India Foundation. Retrieved from: http://aif.org/wp-content/uploads/2015/03/DisabilityManual_3-2015.pdf [accessed 5 August 2016] Bureau for Employers’ Activities and Skills and Employability Department. Disability in the Workplace: Company Practices (2010). International Labor Organization(ILO) Retrieved from: http://www.ilo.org/skills/pubs/WCMS_150658/lang--en/index.htm [accessed 7 August 2016] Employment of Disabled People in India, Baseline Report (2009). Diversity and Equal Opportunity Sector (DEOS), National Centre for Promotion of Employment of Disabled People (NCPEDP). Retrieved from: https://www.researchgate.net/file.PostFileLoader.html?id=5500f589ef97138e428b456c&assetKey=AS%3A273731035828225%401442273972535. [accessed 7 August 2016] Employment Exchange Statistics (2015). Ministry of Labour and Employment. Government of India Retrieved from: http://employment.gujarat.gov.in/images/publication/employment-exchange-statistics-2015.pdf [accessed 30 August 2016] Kandamuthan, M, and Kandamuthan,S (2004), "The economic burden of disabled children on
families in Kerala in South India," Centre for Development Studies Discussion Paper 91 Mitra,S. and Sambamoorthi U (2005), The Employment of Persons with Disabilities: Evidence from the National Sample Survey Retrieved from: http://papers.ssrn.com/sol3/papers.cfm?abstract_id=2338104 [accessed on 30 August,2016] National Policy for Persons with Disabilities (2006). Ministry of Social Justice and Empowerment, Government of India..No.3-1/1993-DD.III. Retrieved from: http://svayam.com/pdf/English-national_disability_policy.pdf[accessed 25 August 2016] Nair, Manju S (2014). Employment of People with Disabilities: An Analysis On Nature and
Determinants."Labour& Development 28(11) Policies and Schemes for Central and State Governments for People with Disabilities (2011), Sightsavers, pp.1-128 Retrieved from: http://www.sightsaversindia.in/wp-content/uploads/2014/06/17581_Policies-and-Schemes-of-Central-and-State-Governments-for-People-with-Disabilities.pdf[accessed 10 August 2016]
XVIII Annual International Conference Proceedings; January 2017
ISBN no. 978-81-923211-9-6 http://www.internationalseminar.org/XVIII_AIC/INDEX.HTM Page 188
People with Disabilities in India: From Commitments to Outcomes (2007). Human Development Unit. World Bank. Retrieved from: http://documents.worldbank.org/curated/en/577801468259486686/pdf/502090WP0Peopl1Box0342042B01PUBLIC1.pdf[accessed 10 August 2016] Planning Commision,Government of India. Twelfth Five Year Plan (2012-2017),Social
Sectors.SAGE Publications India Pvt Ltd .2013 Persons with Disability & the Indian Labor Market: Challenges and Opportunities (2011). International Labor Organization(ILO). Retrieved from: http://www.ilo.org/wcmsp5/groups/public/---asia/---ro-bangkok/---sro-new_delhi/documents/publication/wcms_229259.pdf[accessed 10 August 2016] Swavalamban. (Anuual Report: 2015-16). Department of Empowerment of Persons with Disabilities. Ministry of Social Justice and Empowerment, pp. 1-278. Retrieved from:http://www.disabilityaffairs.gov.in/upload/57301ed5a347fDisabilities_AR_2015-16_%20English.pdf[accessed 20 August 2016] Shenoy, M. (2011), “Persons with Disability and The Indian Labor Market: Challenges and opportunities”, ILO, 13, 1 World Report on Disability : Summary (2011). UN World Health Organization (WHO), WHO/NMH/VIP/11.01, Retrieved from: http://www.refworld.org/docid/50854a322.html [accessed 10 August 2016] Website Links:
http://www.scope.org.uk/about-us/our-brand/social-model-of-disability,August,2016
http://archive.indianexpress.com/news/hc-gives-govt-time-till-2010-to-fill-up-quota-for-
disabled/401160/
http://www.hindustantimes.com/india-news/after-reservation-in-govt-jobs-sc-allows-disability-
quota-in-promotions/story-ec1OWMNbtNl0XNAMwsWlfP.html,August,2016
http://www.cii.in/sectors.aspx?enc=prvePUj2bdMtgTmvPwvisYH+5EnGjyGXO9hLECvTuNt6
S7ds9HnbfW0Ydg/krsRL
http://www.nasscomfoundation.org/get-engaged/disability-initiative.html
List of Figures
XVIII Annual International Conference Proceedings; January 2017
ISBN no. 978-81-923211-9-6 http://www.internationalseminar.org/XVIII_AIC/INDEX.HTM Page 189
Figure 1: Distribution of Literacy rate across disability categories (In %)
Source: Author’s calculation using Table C-29, Census2011
Figure 2: Distribution of literate disabled people by education status across disability categories(In %)
Source: Author’s calculation using Table C-29, Census2011
Figure 3: Distribution of Literate across various educational categories for Mental Retardation for both
Male and Female (In %)
47 43 42 40
59 5140
67
53 57 58 60
41 4960
33
0%
10%
20%
30%
40%
50%
60%
70%
80%
90%
100%
Seeing Hearing Speech Movement Mental
Retardation
Mental
Illness
Any Other Multiple
Illiterate Literate
11 11
12
1011
12
9 9
1314 14
1514
11
13
999 9
1110
6
9
5
12
14 14
1515
6
11
55
5 5 5 6
23
1
0
2
4
6
8
10
12
14
16
18
Seeing Hearing Speech Movement Any other Mental
Retardation
Mental
Illness
Multiple
Disability
Literate but below primary Primary but below middle Middle but below matric/secondary
Matric/Secondary but below graduate Graduate and above
XVIII Annual International Conference Proceedings; January 2017
ISBN no. 978-81-923211-9-6 http://www.internationalseminar.org/XVIII_AIC/INDEX.HTM Page 190
Source: Author’s Calculation from Table C-29, Census 2011
Figure 4: Distribution of Literate across various educational categories for Multiple Disability for both
Male and Female (In %)
Source: Author’s Calculation from Table C-29, Census 2011
Figure 5: Distribution of Male/Female by work status in working age group across two Census 2001 and
2011 (In %)
12.0 11.9
7.07.6
2.2
11.110.1
4.8 4.9
1.5
0.0
2.0
4.0
6.0
8.0
10.0
12.0
14.0
Literate but below
primary
Primary but below
middle
Middle but below
matric/secondary
Matric/Secondary
but below graduate
Graduate and
above
Mental Retardation Mental Retardation
Linear (Mental Retardation) Linear (Mental Retardation)
10.6 10.6
6.1
7.2
1.8
7.46.8
3.2 3.3
0.8
0.0
2.0
4.0
6.0
8.0
10.0
12.0
14.0
Literate but below
primary
Primary but below
middle
Middle but below
matric/secondary
Matric/Secondary
but below graduate
Graduate and
above
Multiple Disability Multiple Disability
Linear (Multiple Disability) Linear (Multiple Disability)
XVIII Annual International Conference Proceedings; January 2017
ISBN no. 978-81-923211-9-6 http://www.internationalseminar.org/XVIII_AIC/INDEX.HTM Page 191
Source: Author’s calculation using Table C-23, Census 2001 & 2011
Figure 6: Distribution of disabled people in the working age group divided by work status across each
type of disability (In %)
Source: Author’s calculation using Table C-23, Census 2011
Figure 7:Distribution of disabled males/females by work status for each type of disability in the working
age group (In %)
50
19
55
19
14
13
9
13
36
68
36
68
0 10 20 30 40 50 60 70 80
Male
Female
Male
Female
20
11
20
01
Non-Worker Marginal Worker Main Worker
41 42 43 37
18 15
42
19
14 16 1312
10 10
16
10
45 42 44 51
72 75
42
71
0%
10%
20%
30%
40%
50%
60%
70%
80%
90%
100%
Main-Worker Marginal-Worker Non-Worker
XVIII Annual International Conference Proceedings; January 2017
ISBN no. 978-81-923211-9-6 http://www.internationalseminar.org/XVIII_AIC/INDEX.HTM Page 192
Source: Author’s calculation using Table C-23, Census 2011
Figure 8: Distribution of per capita NSDP at current prices (In Rupees) and distribution of disabled
employment rate in the working age group across states (In %)
Source: Centre for Statistical Office (CSO)&Author’s Calculation using Table C-23, Census 2011
Figure 9: Distribution of Employment rate of disabled in the working age group across two Census
Rounds 2001 and 2011 (In %)
57
20
59
21
58
24
48
18 2510
218
58
22 2610
15
15
16
16
13
12
12
1110
9
10
8
15
16 10
9
28
65
25
63
29
64
40
71 6581
6984
27
62 6481
0%
10%
20%
30%
40%
50%
60%
70%
80%
90%
100%
Ma
le
Fe
ma
le
Ma
le
Fe
ma
le
Ma
le
Fe
ma
le
Ma
le
Fe
ma
le
Ma
le
Fe
ma
le
Ma
le
Fe
ma
le
Ma
le
Fe
ma
le
Ma
le
Fe
ma
le
Seeing Hearing Speech Movement Mental
Retardation
Mental
Illness
Any Other Multiple
Disability
Main-Worker Marginal-Worker Non-Worker
41 41
45
57
48
49
33
47
44
60
52
52
50
46
55
49
55
50
56
5548
54
51
0
10
20
30
40
50
60
70
0
50000
100000
150000
200000
250000
Go
a
U.T
s
Ha
rya
na
Ma
ha
rash
tra
Ta
mil
Na
du
Gu
jara
t
Ke
rala
Utt
rak
ha
nd
Pu
nja
b
Him
ach
al P
rad
esh
Ka
rna
tak
a
An
dh
ra P
rad
esh
No
rth
Ea
ste
rn S
tate
s
We
st B
en
ga
l
Ra
jast
ha
n
J&K
Ch
ha
ttis
ga
rh
Ori
ssa
MP
Jha
rkh
an
d
Utt
ar
Pra
de
sh
Bih
ar
All
In
dia
% o
f d
isa
ble
d e
mp
loy
me
nt
(20
11
)
Pe
r C
ap
ita
NS
DP
(2
01
3-1
4)
Per capita NSDP (in Rupees) % Disabled Employment
XVIII Annual International Conference Proceedings; January 2017
ISBN no. 978-81-923211-9-6 http://www.internationalseminar.org/XVIII_AIC/INDEX.HTM Page 193
Source: Author’s Calculation using Table C-23, Census 2011& Census 2001
Figure 10: Distribution of disabled people in the working age group by work status for each state
cumulative for Seeing, Hearing, Speech, Movement and Any Other Disability (In %)
Source: Author’s Calculation using Table C-23, Census 2011
51
46
52 52 53 53
32
5452
59
51 5053
36
57
5048
42
61
5350 50 48
41
5055
41
4945
49
55
33
56 57
50
44
55
48 48 47 46
0
10
20
30
40
50
60
70
2001 Census 2011 Census
41 45 4247
3442 38
4538 41
31 30
47
3243
54
3439
44 4433
39 37
1414
7
11
22
21
9
8
11
26
2128
10
11
17
7
22 8
1710
1715
14
45 4251
42 4538
5347
51
33
4842 43
57
40 3944
53
3847 51 47 49
0%
10%
20%
30%
40%
50%
60%
70%
80%
90%
100%
Cumulative Main Worker Cumulative Marginal Worker Cumulative Non Worker
XVIII Annual International Conference Proceedings; January 2017
ISBN no. 978-81-923211-9-6 http://www.internationalseminar.org/XVIII_AIC/INDEX.HTM Page 194
Figure 11: Distribution of Work Participation rate of disabled and non-disabled population across states
(In %)
Source:Author’s Calculation using Table C-23, Census 2011
Figure 12: Ratio of disabled employment rate to non-disabled employment rate across states
Source:Author’s Calculation using Table C-23, Census 2011
List of Tables
49
60
4447
4541
55
48
54
46
5550
55 56
49
5752 52
41
33
485153
70
49
5652
48
68
5054
62 61
7166
5962
65 64
5449
6258
0
10
20
30
40
50
60
70
80
Work Participation Rate of Disabled Work Participation Rate of Non-Disabled
0.860.92
0.86 0.890.84 0.86
0.81
0.95 0.98
0.86 0.880.82
0.760.84 0.82
0.92
0.80 0.810.75
0.670.77 0.78
0.85
0.00
0.20
0.40
0.60
0.80
1.00
1.20
Ratio of Employment Rate
XVIII Annual International Conference Proceedings; January 2017
ISBN no. 978-81-923211-9-6 http://www.internationalseminar.org/XVIII_AIC/INDEX.HTM Page 195
Table 1: Distribution of Literate across various educational categories for each disability: Across Male and
Female (In %)
Category Gender
Literate but
below
primary
Primary
but
below
middle
Middle but
below
matric/secondar
y
Matric/Secon
dary but
below
graduate
Graduate
and
above
Seeing Male 12 15 10 15 6
Female 10 11 7 9 3
Hearing
Male 12 15 11 17 6
Female 10 12 7 10 4
Speech
Male 13 14 10 16 6
Female 12 13 8 11 4
Movement
Male 11 17 13 18 6
Female 8 12 8 11 4
Any other
Male 11 15 12 17 7
Female 10 13 8 12 4
Mental
Retardation
Male 12 12 7 8 2
Female 11 10 5 5 1
Mental Illness
Male 10 14 11 13 3
Female 9 11 7 7 2
Multiple
Disability
Male 11 11 6 7 2
Female 7 7 3 3 1 Source: Author’s Calculation from Table C-29, Census 2011
Table 2: Distribution of sector wise employment rate of disabled across Census 2001 and 2011 (In %)

XVIII Annual International Conference Proceedings; January 2017
ISBN no. 978-81-923211-9-6 http://www.internationalseminar.org/XVIII_AIC/INDEX.HTM Page 196
Census 2001 Census 2011
State Rural Urban Rural Urban
India 55 42 53 45
Union Territories 49 45 44 41
NORTH-EAST 53 46 52 43
NORTH 53 42 50 45
Jammu and Kashmir 54 44 49 48
Haryana 55 42 47 42
Punjab 44 39 44 44
Himachal Pradesh 60 48 62 48
Uttarakhand 53 39 50 41
CENTRAL 59 42 57 44
Rajasthan 66 45 59 43
Uttar Pradesh 52 41 49 43
Chhattishgarh 56 38 58 44
Madhya Pradesh 63 42 61 45
EAST 53 39 53 43
Jharkhand 55 36 60 40
West Bengal 51 43 47 45
Odisha 49 40 52 42
Bihar 55 38 55 43
WEST 49 38 52 46
Gujarat 59 43 52 45
Goa 32 31 40 42
Maharashtra 56 41 63 50
SOUTH 52 42 48 43
Andhra Pradesh 56 43 55 46
Karnataka 56 45 53 50
Kerala 36 36 34 32
Tamil Nadu 59 44 50 45
Source:Author’s Calculation using Table C-23, Census 2011& Census 2001
XVIII Annual International Conference Proceedings; January 2017
ISBN no. 978-81-923211-9-6 http://www.internationalseminar.org/XVIII_AIC/INDEX.HTM Page 197
Table 3: Distribution of disabled employment across various regions for each disability in the working age group (In %)
State Seeing Hearing Speech Movement Any Other Mental
Retardation Mental
Illness Multiple
Disability
India 55 58 56 49 58 28 25 29
U.Ts 49 52 45 48 52 15 16 25
NORTH-EAST(8
States) 61 68 55 46 62 37 30 36
NORTH (5 States) 54 58 50 49 57 28 27 27
CENTRAL(4
States) 58 63 57 52 63 35 28 31
EAST(4 States) 57 59 53 47 58 35 28 30
WEST (3 States) 54 55 56 48 56 21 21 26
SOUTH (4 States) 52 57 52 47 55 20 20 27
Source: Author’s Calculation using Table C-23, Census 2011