CHALLENGING EQUAL TEMPERAMENT: PERCEIVED …
97
CHALLENGING EQUAL TEMPERAMENT: PERCEIVED DIFFERENCES BETWEEN TWELVE-TONE EQUAL TEMPERAMENT AND TWELVE FIFTH-TONES TUNING Mikko Leimu Master’s Thesis Music, Mind & Technology Department of Music 5 January 2017 University of Jyväskylä
Transcript of CHALLENGING EQUAL TEMPERAMENT: PERCEIVED …

CHALLENGING EQUAL TEMPERAMENT:
PERCEIVED DIFFERENCES BETWEEN TWELVE-TONE EQUAL
TEMPERAMENT AND TWELVE FIFTH-TONES TUNING
Mikko Leimu
Master’s Thesis
Music, Mind & Technology
Department of Music
5 January 2017
University of Jyväskylä

JYVÄSKYLÄN YLIOPISTO
Tiedekunta – Faculty
Faculty of Humanities
Laitos – Department
Department of Music
Tekijä – Author
Mikko Leimu
Työn nimi – Title
Challenging equal temperament: Perceived differences between twelve-tone equal
temperament and twelve fifth-tones tuning.
Oppiaine – Subject
Music, Mind & Technology
Työn laji – Level
Master’s Thesis
Aika – Month and year
December 2016
Sivumäärä – Number of pages
90+7
Tiivistelmä – Abstract
A listening experiment was arranged to evaluate perceptual preferences between two musical
tuning systems: twelve-tone equal temperament (i.e. the current international standard) and
twelve fifth-tones tuning. The latter being a system that, according to its author Maria Renold,
provides a more accurate and aurally genuine reproduction of musical harmonics. Hence, it is
considered a superior tuning method compared to the equal temperament tuning.
34 participants (mainly experienced musicians) evaluated realistic musical stimuli consisting
of intervals, chords and simple musical sequences using a grand piano timbre. Results showed
that the standard twelve-tone equal temperament system was found overall more in-tune, with
ca. 68% of the participants preferred it over the twelve fifth-tones tuning. This is considered
to be most likely due to enculturation affects, i.e. people have preferred the tonality that is
more familiar to them. No evidence for the supposed aural genuineness of the Renold’s tuning
systems was found. Instead, it may be concluded that intonation preferences in perceptual
context are subject to high amounts of individual variation and clear definition of tonality
preferences is often a difficult task.
Asiasanat – Keywords
Tuning, intonation, temperament, equal temperament, scale of twelve fifths, twelve fifth-tones
tuning, harmonics
Säilytyspaikka – Depository Department of Music, University of
Jyväskylä
Muita tietoja – Additional information

CONTENTS
1 INTRODUCTION .............................................................................................................. 5
2 THEORETICAL BACKGROUND ................................................................................... 8
2.1 Sound, frequency & pitch ...................................................................................................................... 8
2.2 Harmonic series ................................................................................................................................... 10
2.3 Intervals ............................................................................................................................................... 12
2.4 Perception of frequency and pitch ....................................................................................................... 14
2.5 Consonance and dissonance ................................................................................................................ 17
2.6 Perception of intervals ......................................................................................................................... 20
2.7 Tuning and temperament ..................................................................................................................... 23
2.8 Natural tunings .................................................................................................................................... 25
2.8.1 Pythagorean tuning .................................................................................................................... 25
2.8.2 Just intonation ............................................................................................................................ 28
2.9 Temperament systems ......................................................................................................................... 29
2.9.1 Meantone temperament ............................................................................................................. 30
2.9.2 Equal temperament .................................................................................................................... 31
2.9.3 Origins of the equal temperament.............................................................................................. 33
2.9.4 Equal temperament criticism ..................................................................................................... 35
2.10 The scale of twelve true fifths ............................................................................................................. 39
2.10.1 Aural genuineness ...................................................................................................................... 40
2.10.2 Mathematics of the scale of twelve true fifths ........................................................................... 43
2.10.3 Comparison with other tuning systems...................................................................................... 47
2.10.4 Auditory roughness comparison ................................................................................................ 49
3 RESEARCH TOPIC ........................................................................................................ 51
3.1.1 Previous research ....................................................................................................................... 51
3.1.2 Current study ............................................................................................................................. 53
3.1.3 About comparative research ...................................................................................................... 54
3.1.4 Hypothesis ................................................................................................................................. 55
4 METHOD ......................................................................................................................... 56
4.1 Participants .......................................................................................................................................... 57
4.2 Stimuli ................................................................................................................................................. 57
4.3 Design .................................................................................................................................................. 60
4.4 Pilot ..................................................................................................................................................... 62

5 RESULTS......................................................................................................................... 63
5.1 Experiment part 1 ................................................................................................................................ 63
5.2 Experiment part 2 ................................................................................................................................ 65
5.3 Experiment part 3 ................................................................................................................................ 69
5.4 Discussion ........................................................................................................................................... 73
5.4.1 Tonality preferences .................................................................................................................. 73
5.4.2 Evaluation consistency .............................................................................................................. 75
5.4.3 Aural genuineness ...................................................................................................................... 77
5.4.4 Just noticeable frequency differences ........................................................................................ 78
5.4.5 Enculturation affects .................................................................................................................. 79
5.4.6 Methodology and design............................................................................................................ 80
5.5 Conclusions ......................................................................................................................................... 81
REFERENCES ......................................................................................................................... 82
APPENDICES .......................................................................................................................... 91
Appendix A ........................................................................................................................................................ 91
Appendix B ........................................................................................................................................................ 92
Appendix C ........................................................................................................................................................ 93
Appendix D ........................................................................................................................................................ 95

5
1 INTRODUCTION
In music, a system of tuning is a specification that defines the frequency relationships of
different pitches of a scale. Although the practical execution of musical pitches is often
dependent on musician’s own expertise and instrument, the tuning system nevertheless
determines largely how intervals, scales and music actually sound like when performed.
Various tuning systems have been proposed and used in the history of Western music culture,
but the most significant “big four” include the Pythagorean tuning (PT), just intonation (JI),
meantone temperament and equal temperament. Of these the equal temperament, or more
precisely the twelve-tone equal temperament (12-TET), has been the international standard
tuning method since 1917. One would of course like to think that the scale that we primarily
use for creating music would be sonically some sort of ideal construction that would allow
most natural way to tune our instruments. However, a fact is that only Pythagorean tuning and
just intonation are systems that preserve the natural vibrations of sound, and only JI offers
musician a complete set of acoustically pure intervals, which are truly accurate
representations of harmonic relationships. On the contrary, temperament systems, such as the
12-TET, that we use and listen to on daily basis, are constructions where harmonic
relationships deviate from their natural form. Essentially this means that the system that all
our music is based on is not perfectly in tune, but is more of a controlled mistuning. The
reason for this deliberate mistuning of is a combination of factors, but is in short due to the
fact that the properties of sound and the requirements of our music culture (i.e. 12-tone pitch
structure and free modulation between all key signatures) simply don’t allow a perfect sonic
match. Hence, the natural tuning systems become quickly limits for musical expression,
which is the reason why the Pythagorean tuning or just intonation have not been used widely
since the 16th century. Temperament systems, which their compromised tonality, however
allow more flexibility and practical convenience, as basically any combination of instruments
can be used and musicians are free to modulate without restrictions (White, 1917; Partch,
1974; Rossing, Moore & Wheeler, 2002; Renold, 2004; Duffin, 2007, Burkholder, Grout &
Palisca, 2010; Steck, 2015).
Musical tuning and intonation practices have been studied extensively during the last century,
with the main purpose of discovering the mechanisms by which we perceive and discriminate

6
minor tonal differences, but also to find how people perceive different tuning systems and
whether some perceptually optimal system exist. In this regard, a juxtaposition is often
created between natural tunings and temperament systems, with the assumption that pure
intervals, albeit not being used widely, would be perceptually optimal solution, whereas
temperament systems, being tonal compromises, are inherently worse solutions that provide
unauthentic musical harmonics. The evidence supporting the natural preference of natural
tonality is however scarce and research has often shown the equal temperament tonality to be
more preferred, or that musician deviate from it the least. Hence, it is likely that intonation
practices and perception are only partly determined by the physiological factors, but even
more by cultural conditioning and person’s own musical expertise, and experiences. We
simply become encultured to the prevailing tonality of the surrounding culture and the ear is,
within certain limits, very acceptable to intonation variations. Hence, natural tonality/just
intonation, which technically should be the most ear-pleasing form of tuning, is not perceived
in any way more “special”, because it is not used in practical music making and therefore
unfamiliar to us (Helmholtz, 1895/1912; Barbour, 1951; Hall & Hess, 1984; Parncutt, 1989;
Loosen, 1994, 1995; Burns, 1999; Krumhansl, 2000; Hahn & Vitouch, 2002; Sethares, 2005;
Grenfell, 2005; Thompson, 2013).
Although equal temperament system has been criticized for being a tonal compromise that
narrows the tonal palette of music (Doty, 2002; Renold, 2004; Duffin, 2007; Jorgensen,
2009), no other system has been truly able to challenge it since it was accepted as the standard
tuning method. The practical functionality it offers seems to be too much for the other
systems to compete with and nowadays its status looks more or less carved in stone. Still,
despite its unwavering position, it is still intriguing to contemplate whether any better, or less
compromising alternatives would exist. Something that would allow more accurate
reproduction of musical harmonics. Possibly something that has been left unnoticed, or has
been overlooked. Of course, the necessity of such speculation may be disputable as equal
temperament works extremely well and outperforms all other tuning methods in convenience.
Besides, the tonal differences are such small that majority of people would not know the
difference anyway. Still, it can be argued that a more accurate tuning system would lead to
overall higher quality of music and musical performances. Even though the people who listen
and enjoy music are not necessarily experienced musicians, the ones who create and perform
music often are. Therefore, the better the musician’s instrument is in tune, and the better it

7
produces musical harmonics, the better the musician would feel the tones and tonal
relationships and so on would be overall more at ease when performing. Hence, the musician
would be also able to convey the musical content and emotions better to the audience. As a
consequence, also the listener would enjoy the performance more and have more appreciation
for the music. This reasoning can be considered to be in line with the theoretical evaluations
of Hall (1973, cited by Vos, 1986) and Rasch (1983 cited by Vos, 1986), who have suggested
that the appreciation of a tuning system, or its suitability for performance is related to the
amount of tempering that the intervals deviate from pure intervals and that “tempering should
be minimized as much as possible” (p. 222) as even small amount of will affect the degree of
out-of-tune experience.
One such alternative tuning system was introduced in 1970 by German/American
musicologist Maria Renold (1917 - 2003), who discovered a tuning a scale/tuning called the
scale of twelve true fifths/twelve fifth-tones tuning. Renold’s system is based on using natural
fifths for constructing the twelve-tone scale, similarly to the Pythagorean tuning, with the
exception that Renold’s scale can be used throughout all major and minor keys. According to
its author, the system also has a unique quality of providing aurally genuine intervals, i.e.
intervals that sound “right” to the human ear, and thereby Renold considers the system to be a
superior solution compared to any other tuning system (Renold, 2004). These are of course
very bold claims, which makes it intriguing to find out more about it and how people would
actually perceive this tuning when used in music. Throughout her career Renold experimented
with her tuning system and carried out private listening experiments, which strengthened her
opinion about the excellence the tuning system, but so far, to the best of my knowledge, no
objective research has carried out to find out peoples’ preferences. Therefore, instead of
focusing on the classic Western tuning systems, the current study targets the differences
between the scale of twelve fifths and the standard 12-tone equal temperament system, and
aims to find out whether the Renold’s tuning systems could be a potential alternative for the
12-TET system.
In order to investigate this, the current study examines first the theoretical concepts of sound,
musical perception and tuning systems, after which a listening experiment, carried out to
examine the perceptual differences between the two tuning systems, is described and
discussed.

8
2 THEORETICAL BACKGROUND
2.1 Sound, frequency & pitch
In physical sense sound is wave-like movement of molecules in the medium surrounding a
sound source. In our daily lives this medium is most often air1 and the molecular movement,
aka soundwaves, are air pressure changes, which can ignite an auditory sensation when
reaching the auditory periphery. Musical sounds are always produced by some kind of
vibrating system (e.g. a string, a membrane, an air-filled pipe), that in turn makes the air
vibrate. These vibrations typically occur repeatedly at some specific rate, which is known as
frequency (f). The more these repetitions, or cycles, occur within a second, the higher the
frequency of sound is. The measure of frequency is Hertz (Hz) and in theory the human
auditory system is capable of perceiving frequencies between 20Hz and 20000Hz. This range
of hearing is however subject to individual variation and will typically become narrower with
age. In addition to frequency, other important physical properties of sound include intensity
(power amplitude), intensity at which a sound occurs) and phase/time (the occurrence of a
sound event in time) (Krumhansl, 2000; Rossing et al., 2002; Sethares, 2005; Wollenberg,
2006; Oxenham, 2013; Steck, 2015).
If a sound consists of one single frequency component, it is considered to be a pure tone.
These are however quite rare as a natural occurrence and are nearly always artificially
produced with a signal generator or a synthesizer. Most sounds we hear in our daily lives are
however complex, irregular mixtures of various simultaneously occurring frequency
components with varying amplitude and phase relations, and are not necessarily perceived as
musical. What sets musical tones apart from other “noises”, is their periodicity, which means
that the frequency content is somewhat regular, at least momentarily, which in turn results in
a defined sense of musical pitch (Helmholtz, 1985/1912; 8; Cheveigné, 2004; Wollenberg,
2006; Zwicker & Fastl, 2007; Wright, 2009; Oxenham, 2013).
Pitch is a fundamental element of musical expression and can be defined as that property of
sound by which musical tones can be arranged into an ascending or descending order
1 Besides air (i.e. gas), sound can pass through liquids and solids as well (Rossing et al. 2002).

9
according to their tonal height. The sensation of pitch is primarily affected by the frequency2
of sound, and higher the frequency, higher also the pitch, but the two are however not
synonymous with each other, because whereas frequency is a physical property of sound,
pitch is not; it is simply an attribute used in music for describing the perceived tonal height.
Sound is therefore a psychophysical phenomenon, i.e. in a physical sense it is energy, which
qualities can be measured objectively in various ways, e.g. frequency, amplitude,
time/duration. However, at the same time we perceive sound with our senses, its various
characteristics also become subject to our personal, subjective evaluation and interpretation.
Because the physical properties are not always appropriate for expressing the perceived
characteristics, various attributes such as pitch, loudness, or timbre are typically used as
perceptual correlates of the physical qualities. Hence, for example frequency itself does not
have pitch, but neither can pitch be measured or expressed by physical means, it is purely a
psychoacoustic concept existing only in our heads. While the physical qualities are subject to
the laws of nature/physics, the ideas of the perceptual correlates are subject to peoples’ own
interpretations, cultural surroundings and musical traditions (Krumhansl, 2000; Rossing et al.,
2002; Levitin, 2006; Oxenham, 2012, 2013; Steck, 2015).
Perception of frequency and pitch differs also in that every change in frequency does not
result in change of pitch. This is because frequency is linear by nature, but pitch is logarithmic
and about 6% increase/decrease in frequency is required to produce a semitone pitch change
(i.e. the smallest pitch relationship in Western music culture). The amount of audible
frequencies (ca. 20000) is also much higher than the amount of commonly used musical
pitches (about 88). Even though the ear’s frequency range spans roughly ten octaves (20Hz to
20000Hz), the usable musical pitch range is limited to approximately on the range 25Hz to
5000Hz (ca. 7 - 8 octaves) as the ear quickly loses its ability for proper pitch definition above
this. Thereby it is not an accident that conventional instruments don’t typically produce
pitches at this height; e.g. a standard piano has its limit at 4186 Hz (White, 1917; Krumhansl,
2000, Rossing et al, 2002; Levitin, 2006; Oxenham, 2012; Heller, 2013; Thompson, 2013).
In the Western musical tradition, twelve distinctive pitch classes are used, which are labeled
using letters from A to G, with accidentals ♯ and ♭ to indicate sharp and flat pitches/notes,
2 Also the loudness, duration and spectral content of the sound have been shown to affect the pitch perception
(Rossing et al. 2002).

10
respectively (Levitin, 2006; Steck, 2015). In some cultures, the letter H is used in place of B,
and B in place of B♭ , but to avoid possible confusion regarding this terminology, in this
study B is B and B-flat is B♭ .
2.2 Harmonic series
If the pitch C2 is played on a standard piano, its fundamental frequency (F0) is 65,4 Hz.
Although we can measure the frequency of this particular pitch to be 65,4 Hz, and we most
likely perceive it as a single tone, it is however not the only frequency component that is
being produced and is audible. Instead, several other frequency vibrations known as harmonic
overtones occur together with the fundamental. These overtones however blend in with the
fundamental so seamlessly that the ear does not usually perceive them as separate pitches, but
as a one single tone. Together the fundamental and the overtones form a tone sequence known
as the harmonic series 3 , which is essentially a mathematical construction, where each
frequency partial is a whole-number multiple of the fundamental frequency: f0, 2f0, 3f0, 4f0,
etc. (see Score Example 1 and Table 1) (Helmholtz, 1895/1912; Rossing et al., 2002; Renold,
2004; Levitin, 2006; Wollenberg, 2006; Wright, 2009).
SCORE EXAMPLE 1. Harmonic series of pitch C2.
All musical instruments produce a unique sequence of overtones, which is determined by the
instrument’s build and used materials. And even though we don’t always perceive the
harmonics as separate pitches, they all contribute to the overall tonal character, or timbre, of
the instrument. This is why e.g. trumpet and clarinet output completely different sounding
tones even if they were playing the same notes (Helmholtz, 1895/1912; Krumhansl, 2000;
Rossing et al., 2002; Renold, 2004; Levitin, 2006; Duffin, 2007; Oxenham, 2013).
3 Also the term overtone series is often used. The difference between these is that overtones refer only to the
frequency partials after the fundamental.
11
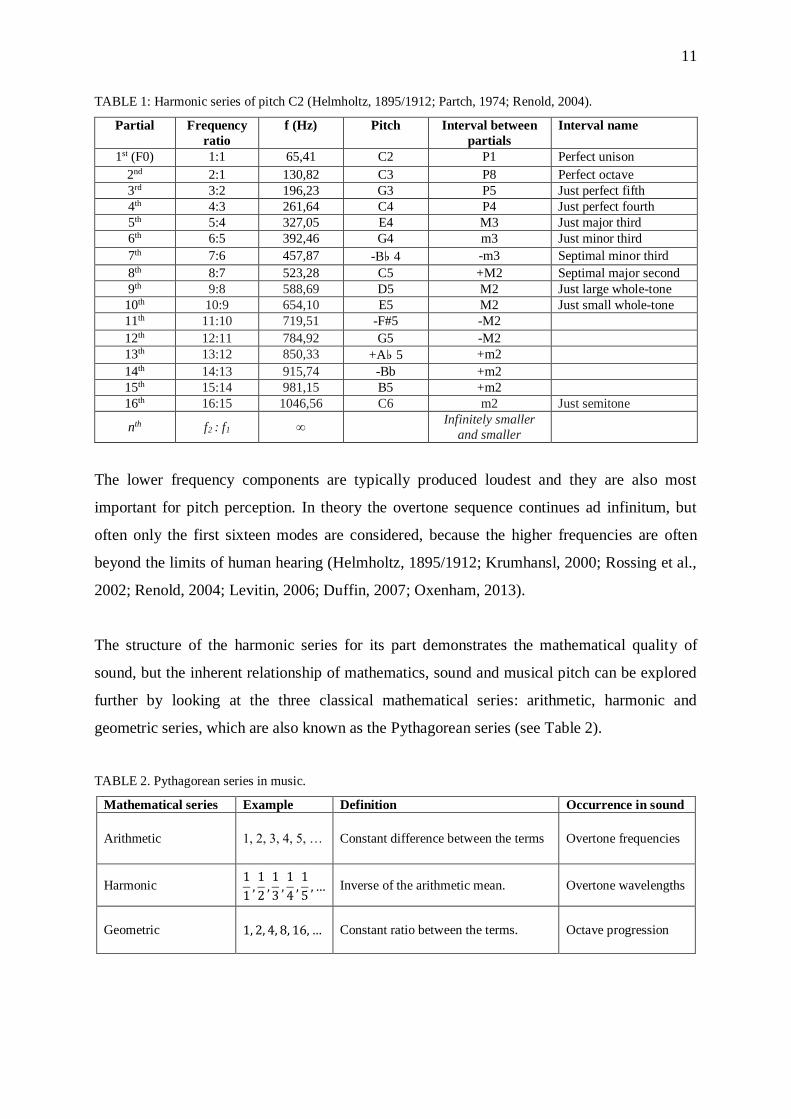
TABLE 1: Harmonic series of pitch C2 (Helmholtz, 1895/1912; Partch, 1974; Renold, 2004).
Partial Frequency
ratio
f (Hz) Pitch Interval between
partials
Interval name
1st (F0) 1:1 65,41 C2 P1 Perfect unison
2nd 2:1 130,82 C3 P8 Perfect octave
3rd 3:2 196,23 G3 P5 Just perfect fifth
4th 4:3 261,64 C4 P4 Just perfect fourth
5th 5:4 327,05 E4 M3 Just major third
6th 6:5 392,46 G4 m3 Just minor third
7th 7:6 457,87 -B♭ 4 -m3 Septimal minor third
8th 8:7 523,28 C5 +M2 Septimal major second
9th 9:8 588,69 D5 M2 Just large whole-tone
10th 10:9 654,10 E5 M2 Just small whole-tone
11th 11:10 719,51 -F#5 -M2
12th 12:11 784,92 G5 -M2
13th 13:12 850,33 +A♭ 5 +m2
14th 14:13 915,74 -Bb +m2
15th 15:14 981,15 B5 +m2
16th 16:15 1046,56 C6 m2 Just semitone
nth f2 : f1 ∞ Infinitely smaller
and smaller
The lower frequency components are typically produced loudest and they are also most
important for pitch perception. In theory the overtone sequence continues ad infinitum, but
often only the first sixteen modes are considered, because the higher frequencies are often
beyond the limits of human hearing (Helmholtz, 1895/1912; Krumhansl, 2000; Rossing et al.,
2002; Renold, 2004; Levitin, 2006; Duffin, 2007; Oxenham, 2013).
The structure of the harmonic series for its part demonstrates the mathematical quality of
sound, but the inherent relationship of mathematics, sound and musical pitch can be explored
further by looking at the three classical mathematical series: arithmetic, harmonic and
geometric series, which are also known as the Pythagorean series (see Table 2).
TABLE 2. Pythagorean series in music.
Mathematical series Example Definition Occurrence in sound
Arithmetic 1, 2, 3, 4, 5, … Constant difference between the terms Overtone frequencies
Harmonic 1
1,1
2,1
3,1
4,1
5, … Inverse of the arithmetic mean. Overtone wavelengths
Geometric 1, 2, 4, 8, 16, … Constant ratio between the terms. Octave progression
12
These demonstrate how the overtone frequencies form an arithmetic series (e.g. 100 Hz, 200
Hz, 300 Hz, 400 Hz etc.) and the wavelengths of these overtone frequencies form a harmonic
series (e.g. 3,4m, 1,7m, 1,13m, 0,85m, etc.). The octave progression in turn forms a geometric
series, where the frequency is doubled with each octave, i.e. the ratio between the terms is
constant (e.g. 100Hz, 200Hz, 400Hz, 800Hz, etc.) (Helmholtz, 1895/1912; Krumhansl, 2000;
Renold, 2004; Wollenberg, 2006; Duffin, 2007).
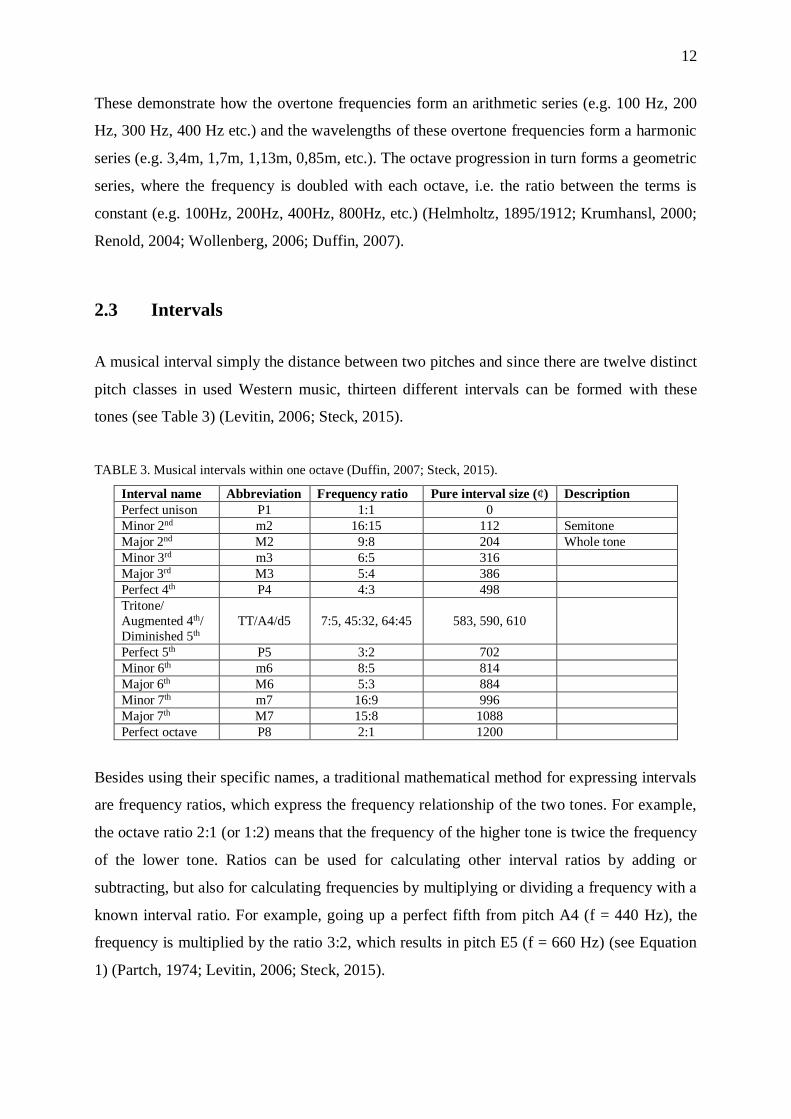
2.3 Intervals
A musical interval simply the distance between two pitches and since there are twelve distinct
pitch classes in used Western music, thirteen different intervals can be formed with these
tones (see Table 3) (Levitin, 2006; Steck, 2015).
TABLE 3. Musical intervals within one octave (Duffin, 2007; Steck, 2015).
Interval name Abbreviation Frequency ratio Pure interval size (¢) Description
Perfect unison P1 1:1 0
Minor 2nd m2 16:15 112 Semitone
Major 2nd M2 9:8 204 Whole tone
Minor 3rd m3 6:5 316
Major 3rd M3 5:4 386
Perfect 4th P4 4:3 498
Tritone/
Augmented 4th/
Diminished 5th
TT/A4/d5 7:5, 45:32, 64:45 583, 590, 610
Perfect 5th P5 3:2 702
Minor 6th m6 8:5 814
Major 6th M6 5:3 884
Minor 7th m7 16:9 996
Major 7th M7 15:8 1088
Perfect octave P8 2:1 1200
Besides using their specific names, a traditional mathematical method for expressing intervals
are frequency ratios, which express the frequency relationship of the two tones. For example,
the octave ratio 2:1 (or 1:2) means that the frequency of the higher tone is twice the frequency
of the lower tone. Ratios can be used for calculating other interval ratios by adding or
subtracting, but also for calculating frequencies by multiplying or dividing a frequency with a
known interval ratio. For example, going up a perfect fifth from pitch A4 (f = 440 Hz), the
frequency is multiplied by the ratio 3:2, which results in pitch E5 (f = 660 Hz) (see Equation
1) (Partch, 1974; Levitin, 2006; Steck, 2015).

13
440 𝐻𝑧 ×3
2 = 660 𝐻𝑧 (1)
If going down, e.g. a perfect fourth from the A4, the frequency is divided by the ratio 4:3,
which yields the pitch E4 (f = 293,3Hz) (see Equation 2).
440 𝐻𝑧 ÷4
3 = 293,333 … 𝐻𝑧 (2)
Nowadays the most common measure for intervals is the cent (¢) (see example in Table 1),
which is a logarithmic unit, independent of pitch, and uses one single number for expressing
the distance between two tones. The size of the octave is 1200 cents, equal temperament
semitone is 100 cents, and one cent is 1/100 of the semitone. The cent became popularized
along with the equal temperament tuning system, but can be used for expressing any intervals.
Overall it is simpler and more straightforward unit than frequency ratios and makes the
comparison of intervals and tuning systems more convenient (Helmholtz, 1895/1912; Partch,
1974; Rossing et al., 2002; Sethares, 2005; Duffin, 2007; Steck, 2015). Conversion from
frequency ratios to cents, and vice versa, can be done using the following formulas (Rossing
et al., 2002; Sethares, 2005).
A frequency ratio (R) into an interval size in cents I(¢):
𝐼(¢) = (1200
log10(2)) log10(𝑅)
An interval size in cents I(¢) into frequency ratio R:
𝑅 = 10(𝐼(¢) 𝑙𝑜𝑔10(2)
1200)
And to convert a frequency difference (f2, f1) in Hertz to cents (¢) (Sengpielaudio, 2015):
¢ = 1200 ×𝑙𝑛(
𝑓2𝑓1
)
𝑙𝑛2,
where f1 and f2 are the two frequencies of interest.

14
2.4 Perception of frequency and pitch
Like all auditory perception, also the perception of frequency and pitch requires processing of
both acoustic (low-level) and neural (high-level) information. While the high-level processing
is subject to several cognitive influences and can vary between individuals, the low-level
functions, which take place in the auditory periphery, are technically identical processes with
all humans and are therefore covered here in more detail.
The basic operation of the auditory periphery is that, as the time-pressure waveform of sound
passes through the outer and middle ear, it becomes converted from air pressure changes into
mechanical vibrations. Eventually these vibrations reach the inner ear and the cochlea and
become in contact with the basilar membrane, which receives the mechanical vibrations on
one side and transforms them into neural firings on the other side. The impulses are then
received by the auditory nerve, which passes them further on into the brain. Hence, the whole
purpose of the auditory periphery is to function as a signal transformer, i.e. it converts the
low-level acoustic information into neural activity, suitable for high-level cognitive
processing (Rossing et al., 2002; Sethares, 2005; Heller, 2013).
Just as sound occurs in two domains simultaneously: spectral and temporal, also the main
theories in explaining pitch perception phenomenon are based on these same categories. More
commonly these are known as place coding and temporal coding theories (Plomp, 1968;
Rossing et al., 2002; Sethares, 2005; Zwicker & Fastl, 2007; Yost, 2009; Oxenham, 2013).
Place coding theory originates from Helmholtz’s (1895/1912) frequency/location theory and
emphasizes the importance of the sound’s frequency content for the perceived pitch. The
concept is based on the discovery that different frequencies activate different parts of the
basilar membrane and then ignites corresponding neural activity for pitch processing. The
location of strongest activation is therefore directly related to the perceived pitch. Temporal
coding theory (periodicity theory, phase locking theory, volley theory) however puts
emphasis on the notion that sound is first and foremost a time-pressure waveform signal for
which the ear performs constant temporal analysis and the periodicity of the waveform is used
for determining its frequency content. After all, both frequency and time are inverse functions
of each other and therefore one can be achieved from the other. In practice this occurs in an

15
autocorrelation process in which the frequency information is decoded from the firing pattern
(i.e. time distribution) of neural signals (Helmholtz, 1985/1912; Plompt 1968; Rossing et al.,
2002; Cheveigné, 2004; Sethares, 2005; Heller 2013; Yost 2009; Oxenham, 2013).
While the place coding theory has been shown to function best on high frequency content, it
seems to lack in accuracy on low and middle ranges. It is also limited regarding fine
frequency discrimination and cannot explain some of the more complex aspects of pitch
detection such as virtual pitch or why a single complex tone is heard as a single pitch and not
as separate tones. On the other hand, temporal theories have been shown to work best on low
frequency content, but are limited in high frequency processing. Although often viewed as
conflicting theories, neither of the models has been able to fully explain all the complex
details of the hearing phenomenon and it is likely that the two processes actually complement
each other, even though one of the processes can dominate over the other depending on
circumstances. Temporal theory has been shown to apply more for lower and middle
frequencies (f < 5000 Hz), while the spectral theories can explain the perception of high
frequencies (f > 5000 Hz) better (Plomp, 1968; Rossing et al., 2002; Cheveigné, 2004;
Sethares, 2005; Yost; 2009; Heller, 2013; Oxenham, 2013).
An important operator for frequency and pitch perception are considered to be the so called
critical bands, which Rossing et al. (2002) refer to as “data collection units on the basilar
membrane” (p.88). When two frequencies become closer to each other, also their responses
on the basilar membrane will be at closer proximity. If the tones are close enough for their
amplitude envelopes to overlap significantly, they are considered to occupy the same critical
band and it becomes difficult (or impossible) for the ear to treat the tones as separate
occurrences and they will be analyzed as a unity. There are about 24 bands covering the
whole audible frequency range and the size of the bands varies depending on the frequency
range and is almost constant 100 Hz on the low frequencies (f < 500 Hz), but becomes
proportional to the center frequency above this (f > 500 Hz) (see Figure 1) (Plomp, 1968;
Rossing et al. 2002; Sethares 2005; Zwicker & Fastl, 2007).

16
FIGURE 1. Critical bandwidth in relation to the center frequency (Rossing et al., 2002, p.88).
Critical bands are important in fine frequency perception, i.e. how well we can discriminate
between nearby frequencies. This ability is typically assessed with the just noticeable
difference4 in frequency (JND(f)) parameter, which defines the smallest possible frequency
difference that the ear can detect between a reference frequency (f) and a difference frequency
(± Δf). JND(f) is measured using sequential pure tones and it is shown to be roughly 1/30 of
the critical bandwidth on the range 20 Hz to 10000 Hz (see Figure 2).
FIGURE 2. Just noticeable difference (Rossing et al. 2002, p.123).
4 Just noticeable difference (or difference limen) is an often-used parameter in psychophysical studies assessing
the smallest possible difference between two nearly equal stimuli (Rossing et al., 2002; Akin & Belgin, 2009).

17
This means that e.g. at 200 Hz it is about 3 Hz (ca. 26 cents), and at 10000 Hz about 70 Hz
(ca. 12 cents). Still, the fact that regardless of the frequency range the JND(f) is always much
smaller than the critical bandwidth means the critical bands cannot explain all there is to the
frequency discrimination phenomenon (Zwicker, Flottorp & Stevens 1957; Rossing et al.,
2002; Zwicker & Fastl, 2007; Sethares, 2005; Heller, 2013).
JND(f) experiments have shown that threshold can vary from as low as two or three cents
(Zwicker & Fastl, 2007, cited by Sethares, 2005; Micheyl et al., 2006) to 8 to 10 cents
(Madsen, Edmondson & Madsen, 1969, citing Karrick, 1998; Rossing et. al, 2002; Levitin,
2006), to around 20 to 30 cents (Parker, 1983, citing Karrick, 1998; Heller, 2013). The exact
threshold can vary depending on the properties of the tones (e.g. frequency range, duration,
amplitude), but is also subject to individual variation. (Vos, 1986; Zwicker & Fastl, 2007;
Rossing et al., 2002; Akin & Belgin, 2009). Several studies have also shown that musicians
have lower discrimination threshold compared to non-musicians (Spiegel & Watson, 1984;
Micheyl, Delhommeay, Kishon-Rabin, Amir, Vexler & Zaltz, 2001; Tervaniemi et al, 2005;
Perrot & Oxenham, 2006; Carey, Rosen, Krishnan, Pearce, Shepherd, Aydelott, & Dick,
2015). According to Akin & Belgin (2009), this is due to cortical reorganization, that
extensive instrument practice induces in the brain.
If contrasting the discrimination threshold with musical pitch, it is obvious that the ear is
sufficiently accurate for operating in any common musical setting. Even the semitone is
frequency wise such a large unit (100 cents), that the ear has no problem in recognizing it.
2.5 Consonance and dissonance
One of the most common attributes used for assessing the harmonic/tonal quality of tone
combinations such intervals and chords is their consonance and dissonance. If the perceived
sonic quality is somehow pleasant, stable or tensionless, it is typically considered to be
consonant, whereas the tenser, harsher, or unpleasant combinations are considered dissonant.
The ideas of consonance and dissonance have varied in different cultures and times, but the
most traditional explanation for the phenomenon is based on the complexity of intervals, i.e.
the simpler the frequency ratio is, the more consonant the interval (see Table 4). In the context
of music theory this is still the most used method for defining the degree of consonance and

18
dissonance with intervals (Geer, Levelt & Plomp, 1962; Partch, 1974; Terhardt, 1974; 1984
Vos, 1982, 1984; Rossing et al., 2002; Sethares, 2005; Levitin, 2006; Zwicker & Fastl, 2007;
Thompson, 2013; Steck, 2015).
TABLE 4. Degree of interval consonance/dissonance (Rossing et al., 2002; Krumhansl, 2000).
Interval Frequency ratio, p:q Complexity, p+q Description
Unison 1:1 2 Absolute consonance
Octave 2:1 3
Perfect 5th 3:2 5 Perfect consonance
Perfect 4th 4:3 7
Major 6th 5:3 8
Imperfect consonance Major 3rd 5:4 9
Minor 3rd 6:5 11
Minor 6th 8:5 13
Major 7th 15:8 23
Most dissonant Minor 2nd 16:15 31
Tritone 45:32 77
However, a significant amount of research has been carried out to further explain the
underlying physiological factors for the perceived consonance, and what actually makes
certain intervals more dissonant than others. Presumably the most noteworthy modern theory
is the one of sensory dissonance, which aims to explain the non-musical, psychoacoustic
aspect of consonance (Rossing et al. 2002; Sethares, 2005). The term sensory dissonance is
used to distinguish it from the musical notions of consonance/dissonance, and it is often
understood as perception of certain roughness or harshness qualities in sound when two tones
do not blend well together. Conversely in consonance these roughness qualities are missing.
Several theories have been developed to explain the sensory dissonance, including e.g.
auditory roughness (Helmholtz, 1895; Plomp & Levelt, 1965), sharpness, tonalness (Zwicker
& Fastl, 2007), tonal fusion and harmonicity (Thompson, 2013) and it is likely that none of
these alone can explain the phenomenon, but they all contribute to some degree. Still, the
theory of auditory roughness is to be seen as an especially valid concept and is therefore
discussed here in more detail (Helmholtz, 1895/1912; Plomp & Levelt, 1965; Terhardt, 1974,
1984; Rossing et al., 2002; Sethares, 2005; Zwicker & Fastl, 2007; Levitin, 2007, Oxenham,
2013).

19
Early ideas of sensory dissonance (Helmholtz, 1895/1912) linked it directly with the
complexity of an interval and the phenomenon called harmonic beating5. If the interval ratio
is simple, the harmonics of the two tones either line-up or are sufficiently far away from each
other, which leads to more consonant tonal interaction. With more complex ratios the
harmonics will coincide poorly, which leads to more intense beating between the frequency
components, which then becomes perceived as roughness and dissonance. Later research by
Plomp & Levelt (1965) and Kameoka & Kuriyagawa (1969a, 1969b, cited by Rossing et al.,
2002) however showed that instead of frequency ratios, roughness/dissonance was more
dependent on the actual frequency difference between the tones, the frequency range and the
operation of the critical bands. If the two tones are sufficiently far apart (i.e. more than the
critical bandwidth), they are consonant, whereas if they are such close proximity that the
excitation areas occupy the same critical band, they produce roughness and unpleasant
dissonance. Being dependent on the operation of critical bands also means that the dissonance
qualities of musical intervals actually vary depending on the frequency range. For example,
the size of the fifth C4 – G4 is 130Hz, but on an octave lower range (C3 – G3) the fifth is
65Hz. Because the critical bandwidth in this range is approximately 90Hz, the fifth is more
dissonant in the lower register. With extremely low range pitches this can make distinction
between nearby tones difficult, because the roughness has rumbling qualities that can blur the
borders of the tones (Rossing et al. 2002; Levitin, 2006; Sethares 2005; Thompson, 2013).
Plomp & Levelt (1965) also found that the dissonance maximum occurs at about ¼ of the
critical bandwidth, which is about a semitone’s distance (see Figure 3). (Plomp & Levelt,
1965; Rossing et al., 2002, Sethares, 2005; Levitin, 2006; Thompson, 2013).
FIGURE 3. Sensory dissonance (Plomp & Levelt, 1965, cited by Sethares, 2005, p. 47).
5 Beats are rapid amplitude fluctuations occurring between two nearby frequencies (Helmholtz 1895/1912;
Partch 1974; Rossing et al., 2002).

20
Still, pure tones alone cannot explain the consonance/dissonance qualities of musical
intervals, because e.g. Figure 3 would suggest that all intervals larger than fifth would be
equally consonant, which of course is not true. The actual reason for the varying levels of
dissonance with complex tone intervals is that roughness/dissonance can occur also between
the harmonic overtones, not just fundamental frequencies. The more consonant intervals
simply have less roughness inducing overtone pairs. To predict this phenomenon, Plomp &
Levelt (1965) calculated the expected consonances of two complex tones with six overtones.
The result (see Figure 4) show rather good correlation with the typical ideas of musical
consonance. The only real anomaly being that the major sixth (5:3) appears to be more
consonant than perfect fourth (4:3), which suggests that roughness and dissonance summation
alone can’t explain the entire phenomenon, but still this overall “musical validity” is one of
the reasons why auditory roughness theory has been considered successful in explaining the
consonance/dissonance phenomenon. (Plomp & Levelt, 1965; Rasch & Plomp 1982; Rossing
et al., 2002, Sethares, 2005; Levitin, 2006; Thompson, 2013).
FIGURE 4. Expected consonance between two complex tones (Plomp & Levelt 1965; Sethares 2005, p.90).
2.6 Perception of intervals
Just as the phenomenon of sound is psychophysical, perception of musical intervals (or any
other musical features) is also dependent on both physical/acoustical and cognitive factors.
Hall & Hess (1984) considered interval perception to consist of four distinct phases, of which
the first can be seen as more dependent on physical qualities of sound and the operation of the
auditory system, whereas the latter two are more based on cognitive processing. First of all,
the hearing mechanism must recognize the occurrence of two tones, which can be either

21
simultaneous (harmonic) or sequential (melodic). Secondly, attention is given to the closeness
of the tones and whether the interval is small/narrow or large/wide. Interval’s size is the main
physical quality that is used for identifying intervals. These tonal relationships are however
rarely identified with absolute accuracy, but most musicians develop a so-called relative pitch
hearing, i.e. they learn to recognize e.g. an octave, or a fifth as particular frequency/pitch
relationships (Siegel & Siegel,1977; Burns, 1999). Last, a judgment is made about the overall
quality of the interval. For this one reflects on personal musical experiences and the standards
set by the surrounding culture to decide whether the perceived interval is tonally good
representation of that interval type.
As harmonic and melodic intervals result in different kind of acoustic outputs, also their
perception differs slightly. Thompson (2013) considers that harmonic perception is more
subject to the principles of sensory dissonance perception, as different harmonic combinations
result in varying amounts of roughness and beats, which are important in providing sensory
cues about the tonal quality. Melodic intervals on the other hand are more subject to the
principles of auditory stream processing as the identification is based on the recognition of
pitch change and direction of change (i.e. pitch contour) (Levelt, Geer & Plomp, 1966; Vos,
1982; Burns, 1999; Thompson, 2013). Although the tonal consonance phenomenon is
associated more with harmonic combinations, Thompson (2013) considers that melodic
intervals can also “connote different levels of dissonance and consonance” (p. 117), because
the neural responses of the initial and subsequent tones may interact even though they don’t
occur physically at the same time. Also, the fact that the tone combinations that blend well in
harmony work also well in melodic context implies shared underlying mechanisms
(Thompson, 2013).
The ear, albeit being able to distinguish very small frequency differences, is shown to be
rather tolerant for intonation variations. Interval adjustment experiments have shown 15 to 45
cents variation in the adjusted interval size, and a significant amount of variation between
individuals (Burns, 1999). Perceptual experiments have however shown that people are able
to discern very small, 2 cents differences, but with certain intervals the discrimination
threshold can be even in the magnitude of 80 cents. Levitin (2006) suggests that most of us
can recognize the “off” sounding quality, if the tuning deviates a semitone (100 cents) or a
quarter of a semitone (25 cents). Similar estimate was also given by Vurma & Ross (2006),

22
who found the discrimination threshold to be about 20 to 25 cents with melodic intervals.
Kopiez (2003) considers that musicians’ tolerance for mistuning is about 10 to 30 cents.
Several perceptual experiments (Levelt et al., 1966; Terhardt, 1978; Vos, 1982, 1984, 1986;
Vos & van Vianen, 1984, 1985a) have shown that the discrimination threshold is mainly
dependent on the complexity of the interval’s frequency ratio and tonal consonance. A
significant factor are harmonic beats, which provide important sensory cues for discrimination
between pure and tempered intervals and mistuning. Vos (1982) postulates that “for complex
tones, mistuned intervals are characterized by small frequency differences between those
harmonics, which coincide completely in pure intervals” and “the interference of these just-
noncoinciding harmonics give rise to the perception of beats and roughness” (p. 297). Both
Vos (1982) and Hahn & Hess (1984) however consider that harmonic beatings/roughness are
possibly used for detecting minor mistuning, whereas large mistuning judgments are more
based on the perceived interval width. On the other hand, Burns (1999) concludes that
roughness and beats are possibly used in laboratory experiments, but in real musical situations
musicians rely more on their own expertise and learned intonation standards.
Although the operation of auditory system functions as the basis of hearing, the perception of
intervals does not only depend on the physical qualities of sound, but musicians also evaluate
the musical auditory information on the basis of their own musical experiences and against
the standards of surrounding culture. Often the learned musical skills and cultural
conditioning are considered to be even more important factor for the perception of musical
features than any properties of auditory mechanism (Vos, 1982; Hall & Hess, 1984; 167;
Loosen, 1994, 1995; Nordmark and Ternström, 1996; Hahn & Vitouch, 2002; Stevens, 2004;
Arthurs & Timmers, 2013).

23
2.7 Tuning and temperament
In the context of music, tuning is often understood as the manual process of adjusting the
strings, keys, skins etc. of an instrument to some desired pitch height. Besides this basic
tuning practice, a more profound tuning concept is the system of tuning, which is the tuning
specification of musical scales. More precisely, a tuning system is a standard that defines the
exact frequency relationships between musical pitches. Hence, whatever system is being used,
it directly affects how intervals, scales, and further on the music itself actually sounds like
when performed (Rossing et al., 2002; Duffin, 2007; Burkholder et al., 2010; Steck, 2015).
The construction of a tuning system can be based on either some mathematical/physical
principles or perceived aural/aesthetic qualities, or it can be some kind of amalgamation of
these two approaches. Technically anyone can use their own tuning system if desired, but
typically their application is based on some cultural agreement, because it allows musicians of
different instruments to tune according to some widely accepted common standard. Several
tuning systems have been proposed and used throughout the times, but the four most
significant Western tunings concepts for constructing the twelve-tone chromatic scale have
been: (Rossing et al., 2002; Duffin, 2007; Burkholder et al., 2010; Steck, 2015):
1. Pythagorean tuning (ca. 500 BCE ~ 1500 CE)
2. Just intonation (ca. 1400 ~ 1500 CE)
3. Meantone temperament (ca. 1500 ~ 1900 CE)
4. Equal temperament (ca. 1850 - )
The first two systems are so-called natural tunings, because they apply acoustically pure
intervals, i.e. intervals that retain the natural vibrational properties of sound, for scale
construction. The latter two are temperament systems, in which intervals have been modified
somehow from their natural form. Regardless of the foundations, these all systems have
puzzled musicians, instrument manufacturers, mathematicians, churchmen and philosophers
throughout the history on the quest to find the most functional, yet artistically satisfying
method for tuning instruments (Partch 1974; Rossing et al., 2002; Duffin, 2007; Renold,
2004).

24
How a tuning system actually affects the everyday instrument tuning practice is that e.g. the
Pythagorean tuning system dictates that all fifths must be tuned according to the 3:2
frequency ratio (ca. 702 cents). Therefore, one can tune e.g. a guitar using any desired
reference frequency, but in order to stay true to Pythagorean tuning, the fifths must follow this
3:2 ratio rule. The equal temperament system on the other hand specifies that each semitone
must be 100 cents in size, which makes the fifths precisely 700 cents. Because the different
tuning systems are based on different core principles, they cannot be combined
simultaneously together in a performance without the overall sound becoming dissonant and
out-of-tune sounding.
The practical application of tuning standards, i.e. forming intervals on an instrument, is often
referred to as intonation. While intonation is governed by cultural tuning standards, it can also
be considered a skill, an ability to play “in tune”, which depends on musician’s (or instrument
tuner’s) personal expertise, but also on the instrument itself. In this regard, instruments can be
separated into two groups: fixed pitch, and non-fixed pitch instruments. The difference
between the two is that with fixed pitch instruments (e.g. keyboard instruments, tuned
percussions), the musician is given a set of pre-tuned notes, which cannot be adjusted during a
performance. Intonation accuracy with these is therefore determined by the instrument’s
tuner. With non-fixed pitch instruments (e.g. non-fretted string instruments, human voice)
however, each note must be intonated anew and can be adjusted almost limitlessly while
performing. Intonation accuracy is therefore solely musician’s (and instrument manufacture’s)
responsibility (White, 1917; Doty, 2002; Kopiez, 2003; Renold, 2004; Duffin, 2007; Carey et
al., 2015; Steck; 2015).
Next the basic concepts of these four principal tuning systems of Western music are
explained. Not all of them are the focus of this study per se, but understanding the basic
functioning of these systems is beneficial for overall understanding of tuning and the various
issues that are encountered with it.

25
2.8 Natural tunings
2.8.1 Pythagorean tuning
Pythagorean tuning is often regarded as the first truly significant tuning system in the Western
world and as the origin of the twelve-tone pitch system. It is typically credited for the Greek
mathematician/philosopher Pythagoras of Samos (ca. 570 – 495 BCE), who’s experiments
with vibrating strings led him to discover the relationship between the mathematical string
proportions and musical pitch. It is not entirely clear whether Pythagoras’ experiments
provided entirely novel knowledge or only enhanced theories already being used, but his main
finding was that certain string divisions harmonized especially well with the original long
string. These so-called “perfect” proportions were based on the first four integers and resulted
in musical intervals of the unison (1:1), the octave (2:1), the fifth (3:2), and the fourth (4:3),
which are also the foundation of the Pythagorean scale and tuning system (Rossing et al.,
2002; Doty, 2002; Duffin, 2007; Partch, 1974; Rossing et al., 2002; Thompson, 2013).
Construction of the Pythagorean scale follows a simple principle of multiplying pure fifths
(3:2) one after another to obtain the note/interval ratios of the scale. For example, if
constructing a scale in C: C = 1, G = 1 x 3/2 = 3/2, D = 3/2 x 3/2 = 9/4, etc. If this procedure
is done twelve times, one arrives again at the same pitch class where the scale started, but
seven octaves higher. Altogether this process yields the following tone sequence: C, G, D, A,
E, B, F#, C#, G#, D#, A#, F, (C), which is also known as the circle of fifths (see Figure 5)
(Barbour, 1951; Rossing et al., 2002; Steck, 2015).
FIGURE 5. Circle of fifths. (Steck, 2015, p. 29)
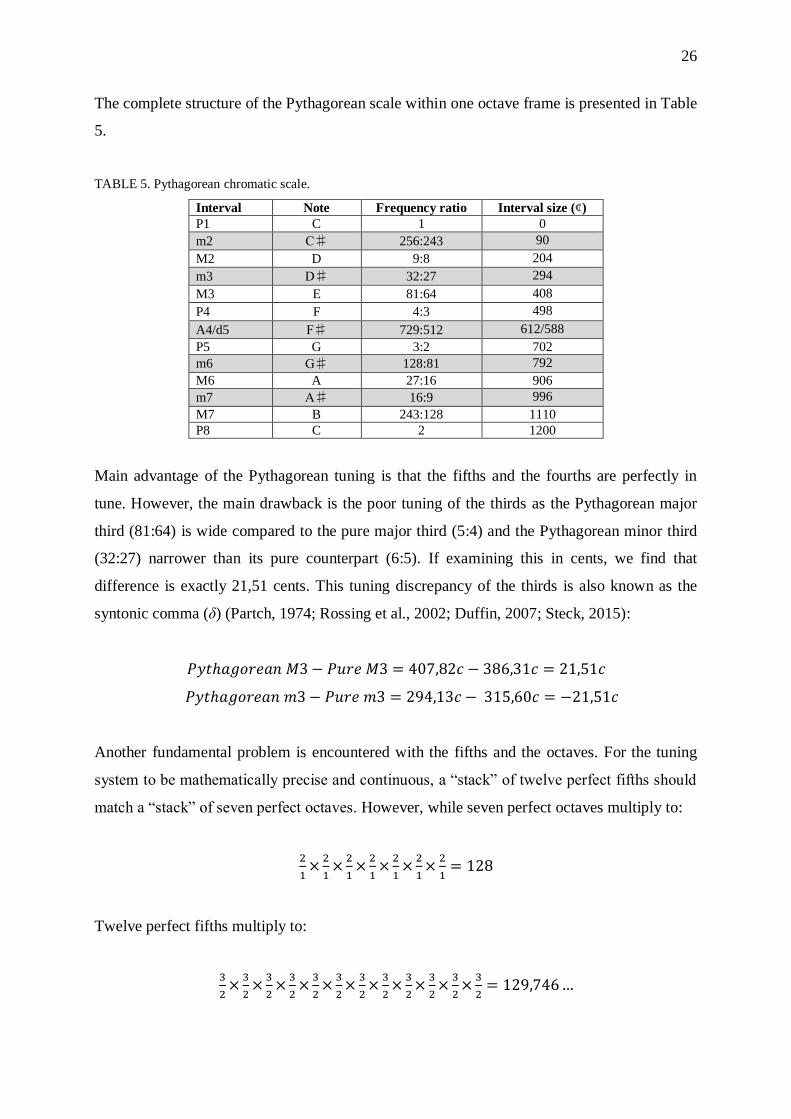
26
The complete structure of the Pythagorean scale within one octave frame is presented in Table
5.
TABLE 5. Pythagorean chromatic scale.
Interval Note Frequency ratio Interval size (¢)
P1 C 1 0
m2 C♯ 256:243 90
M2 D 9:8 204
m3 D♯ 32:27 294
M3 E 81:64 408
P4 F 4:3 498
A4/d5 F♯ 729:512 612/588
P5 G 3:2 702
m6 G♯ 128:81 792
M6 A 27:16 906
m7 A♯ 16:9 996
M7 B 243:128 1110
P8 C 2 1200
Main advantage of the Pythagorean tuning is that the fifths and the fourths are perfectly in
tune. However, the main drawback is the poor tuning of the thirds as the Pythagorean major
third (81:64) is wide compared to the pure major third (5:4) and the Pythagorean minor third
(32:27) narrower than its pure counterpart (6:5). If examining this in cents, we find that
difference is exactly 21,51 cents. This tuning discrepancy of the thirds is also known as the
syntonic comma (δ) (Partch, 1974; Rossing et al., 2002; Duffin, 2007; Steck, 2015):
𝑃𝑦𝑡ℎ𝑎𝑔𝑜𝑟𝑒𝑎𝑛 𝑀3 − 𝑃𝑢𝑟𝑒 𝑀3 = 407,82𝑐 − 386,31𝑐 = 21,51𝑐
𝑃𝑦𝑡ℎ𝑎𝑔𝑜𝑟𝑒𝑎𝑛 𝑚3 − 𝑃𝑢𝑟𝑒 𝑚3 = 294,13𝑐 − 315,60𝑐 = −21,51𝑐
Another fundamental problem is encountered with the fifths and the octaves. For the tuning
system to be mathematically precise and continuous, a “stack” of twelve perfect fifths should
match a “stack” of seven perfect octaves. However, while seven perfect octaves multiply to:
2
1×
2
1×
2
1×
2
1×
2
1×
2
1×
2
1= 128
Twelve perfect fifths multiply to:
3
2×
3
2×
3
2×
3
2×
3
2×
3
2×
3
2×
3
2×
3
2×
3
2×
3
2×
3
2= 129,746 …

27
The stack of fifths is therefore wide by 1,0136… If examining this in cents, we find that the
sum of seven octaves is 8400 cents:
1200𝑐 + 1200𝑐 + 1200𝑐 + 1200𝑐 + 1200𝑐 + 1200𝑐 + 1200𝑐 = 8400𝑐
But the sum of twelve perfect fifths is 8423,46 cents:
701,955𝑐 + 701,955𝑐 + 701,955𝑐 + 701,955𝑐 + 701,955𝑐 + 701,955𝑐
+701,955𝑐 + 701,955𝑐 + 701,955𝑐 + 701,955𝑐 + 701,955𝑐 + 701,955𝑐 = 8423,46𝑐
This particular tuning discrepancy of 23,46 cents between the octave and fifths is known as
the Pythagorean comma (ditonic comma). It is also the difference between all sharp and flat
notes of the scale as upon reaching the seventh octave one does not arrive on C, at which the
scale started, but on its enharmonic equivalent B♯, which is higher in pitch. Altogether this
means that, instead of being a proper circle, the Pythagorean circle of fifths is in fact an
unclosing spiral. In order to fix this problem, the last fifth must be tuned 23,46 cents flat,
which however leads to it becoming tuning wise unacceptable “wolf” 6 interval compared to
the other eleven fifths (Rossing et al., 2002; Duffin, 2007; Steck, 2015).
Besides being a disadvantage with the Pythagorean tuning, the comma (both syntonic and
ditonic) is actually a fundamental problem with the Western twelve-tone pitch system in
general. The fact that fifths, thirds and octaves cannot all exist in their pure form within the
same system means that it is impossible to construct a “perfect” fixed tuning system, that
would cover the range of seven octaves and still have all intervals remain acoustically pure
throughout all twelve key signatures (Rossing et al., 2002; Renold, 2004; Duffin, 2007; Steck,
2015).
6 The term “wolf” is also often used for any intervals, which tuning deviates significantly from other similar
intervals (Duffin, 2007; Steck, 2015).

28
2.8.2 Just intonation
Although suggested already in the 2nd century7, the just intonation (JI) tuning system wasn’t
properly defined until the late Middle Ages/early Renaissance, when it became necessary to
take action against the poorly tuned Pythagorean thirds and instead of being based on pure
fifths only, just intonation in fact aims for acoustical purity with all intervals. Technically any
tuning that uses only small integer ratio intervals can be considered a “just” tuning, but the
tuning system that is mostly associated as being the just intonation is based on using the
major triad as a tonal reference and tuning both major and minor thirds optimally consonant
using their pure interval ratios 5:4 and 6:5. To construct the scale, the tonic (e.g. C-E-G) is
tuned first, then the dominant (G-B-D), and last the subdominant (F-A-C), which together
provide the interval ratios for the major scale. To complete the system, the sharp and flat note
ratios are obtained from the inversions of diatonic intervals. For example, the minor second
(16:15) is the inversion of major seventh (15:8), etc. The complete structure of chromatic just
intonation scale is presented in Table 6 (Doty, 2002; Rossing et al., 2002; Duffin, 2007;
Barbour, 1951; Partch, 1974; Grout, 2001; Duffin, 2007; Burkholder et al., 2010; Steck,
2015).
TABLE 6. Just intonation chromatic scale.
Interval Note Frequency ratio Interval size (¢)
P1 C 1 0
m2 C♯ 16:15 112
M2 D 9:8 204
m3 D♯ 6:5 294
M3 E 5:4 386
P4 F 4:3 498
TT F♯ 45:32 590
P5 G 3:2 702
m6 G♯ 8:5 792
M6 A 5:3 884
m7 A♯ 16:9 996
M7 B 15:8 1088
P8 C 2 1200
Just intonation should of course be the ultimate tuning system as it is based on simple
mathematic proportions and coincides with the interval ratios found in the harmonic series,
7 A similar system called “syntonic diatonic tuning” was originally proposed by the Greco-Egyptian
mathematician Claudius Ptolemy (ca. 100 – 170) (Barbour, 1951; Partch, 1974; Burkholder et al., 2010)

29
which means that it should be optimally consonant and therefore pleasing to the ear.
However, just like the Pythagorean tuning, also just intonation has several disadvantages. The
most fundamental problem is that the diatonic scale includes three types of intervals between
the notes: the major whole tone (9:8), the minor whole tone (10:9), and the semitone (16:15)
(see Table 7).
TABLE 7. Just intonation diatonic major scale (Rossing et al. 2002, 179).
C D E F G A B C
1 9:8 5:4 4:3 3:2 5:3 15:8 2
9:8 10:9 16:15 9:8 10:9 9:8 16:15
In practice this means that only the intervals related to the tonic will sound good. For
example, the fifth C–G is pure with ratio 3:2 (702¢), but the fifth D–A is flat with ratio 40:27
(680¢). The whole system is therefore key specific, i.e. every key change in music would
require the instrument to be re-tuned to match the new scale. Hence, just intonation has had
very little practical use in music and it can be considered more of an idealistic concept. Its
practical applications are basically limited to non-fixed pitch instruments such as human voice
or strings, with which the musician can flexibility vary pitch according to musical needs.
With keyboards, or in any mixed instrument setting performing polyphonic music, its use
however becomes too cumbersome to be of any broader use (Barbour, 1951; Rossing et al.,
2002; Duffin, 2007; Steck, 2015).
2.9 Temperament systems
While both Pythagorean tuning and just intonation aim to retain the natural acoustical
behavior of sound for tuning the twelve-tone scale, the most fundamental problem with these
systems is that they cannot provide the same perfect tonality for all intervals throughout the
twelve key signatures, which makes both systems limited in practical use. In order to make
tuning systems more versatile and universally applicable, various tuning modifications called
temperaments were begun to develop. Basically, a temperament is any tuning system, in
which the interval tuning is somehow modified (i.e. tempered) from their acoustically pure
form. The principal aim of tempering is to spread the comma tuning imbalance over several
intervals instead of having one unusable “wolf” interval among the other good ones.
Therefore, by sacrificing the natural tonality, it is possible to craft a tuning system that is

30
overall more acceptable and functional. Typically, the tempering process is performed on
either thirds or fifths, but the process actually affects all intervals (excluding the octaves) in
one way or another. Hence, temperaments are always systems of compromises, which try to
balance between practicality and good, or acceptable, tonality (White, 1917; Partch, 1974;
Krumhansl, 2000; Rossing et al., 2002; Renold, 2004; Duffin, 2007).
It has been difficult to trace the exact origins of the temperament practice, buy a fairly good
estimate is to date the more serious use of tuning modifications to the 15th and the 16th
centuries, which was a period when the European musical environment started to become
increasingly more complex than before. First of all, the use of thirds and sixths in music was
increasing, which naturally added a new harmonic dimension that had to be taken into
account, and secondly, performing groups were becoming more diverse as people wanted to
mix e.g. vocals, keyboards, and strings together. While the Pythagorean tuning had been the
main tuning system with keyboard instruments and just intonation was more preferred among
vocalists and string players, these two could not be mixed together in a performance, because
of the poor tuning of the Pythagorean thirds. Some sort of compromise tuning was therefore
required. This concerned mainly keyboards (e.g. organ, harpsichord, piano), which, being
fixed-pitch instruments, are more challenging and limited in how tuning systems can be
applied, but the fact that keyboard instruments have taken such a large role in the Western
music culture, has led to that other instruments have had to conform to keyboard tunings in
order to make combined performances possible (Barbour, 1951; Doty, 2002; Duffin, 2007;
Burkholder et al., 2010; Steck, 2015).
2.9.1 Meantone temperament
First significant keyboard tuning modifications were the so-called meantone temperaments.
They aimed for a compromise between the Pythagorean tuning and just intonation by
allowing the fifths to be flattened, but having the thirds remain pure. In practice the meantone
tempering was achieved by taking a certain fraction (e.g. 1/4, 1/2, 3/4, 5/4) of the syntonic
comma (21,51¢) and lowering the pitch of selected notes by the given amount. Meantone
temperaments have existed in various forms, but the most common, and theoretically most
important method is the quarter-comma meantone temperament, which is based on narrowing
the fifths by one fourth of the syntonic comma (ca. 5,4¢). Typical alternatives to the quarter-

31
comma system were e.g. 1/5-comma, or 1/6-comma meantone temperaments, which tempered
the fifths slightly less. The main problem with the meantone systems was that they favored
certain key signatures over the others too much and got increasingly out of tune as sharps and
flats were added. Neither could they get rid of the Pythagorean comma, which meant that
tunings were characterized by the presence of one particularly wide (737,64¢) and harsh
“wolf” fifth that was more like a diminished sixth rather than a fifth. First attempts in solving
this problem were the so-called well temperaments, or irregular temperaments, which gained
popularity in the late 17th century (Rossing et al. 2002; Renold 2004; Duffin 2007; Burkholder
et al. 2010; Steck, 2015)
Contrary to a regular temperament, where all fifths or thirds are of same size, an irregular
tuning system includes varying size fifths and thirds. The benefit of these systems was that,
while the regular meantone temperaments generally favored one key or another, some of the
irregular temperaments could actually be used in wider range of key signatures without
having to be constantly adjusted. Because of this, some of the tunings became also known as
“good temperaments” or “well temperaments”. If they could be used in all keys around the
circle of fifths, they were called “circulating temperaments”. This didn’t necessarily mean that
all key signatures sounded the same, but were nevertheless usable to some extent (Duffin,
2007; Steck, 2015). Because irregular temperaments were mixtures of different size intervals,
chords sounded different depending on the key signature they were played in. This also meant
that different key signatures had their own characteristic tonality, which was one reason that
properly executed circulating temperaments were very popular among musicians. Various
meantone and well temperaments were being used till the late 19th century, but were slowly
being overridden by the equal temperament, which was working better in the increasingly
complex musical environment (Doty, 2002; Burkholder et al., 2010).
2.9.2 Equal temperament
Alongside the various meantone temperaments, the equal temperament tuning system was
also slowly developing. Contrary to the other tuning systems, in which the semitone size
varies, equal temperament is based on making each semitone equal in size. In the twelve-tone
equal temperament system (12-TET) this is achieved by distributing the Pythagorean comma

32
evenly over the twelve fifths, which leads to each fifth becoming flat by 1/12 of the comma,
i.e. about 2 cents:
23,46𝑐
12= 1,955𝑐
This procedure allows the stack of twelve fifths to match the stack of seven pure octaves (see
Table 8), hence making a proper circle of fifths. In addition to the fifths, also the major and
minor thirds now match the octave perfectly (Barbour, 1951; Rossing et al., 2002; Steck,
2015).
TABLE 8. Pure fifths vs. ET fifths vs. perfect octaves.
12 pure fifths
(701,955¢):
701,955𝑐 + 701,955𝑐 + 701,955𝑐 + 701,955𝑐 + 701,955𝑐 + 701,955𝑐 +701,955𝑐 + 701,955𝑐 + 701,955𝑐 + 701,955𝑐 + 701,955𝑐 + 701,955𝑐 =8423,46𝑐
12 tempered fifths
(700¢):
700𝑐 + 700𝑐 + 700𝑐 + 700𝑐 + 700𝑐 + 700𝑐 + 700𝑐 + 700𝑐 + 700𝑐 +700𝑐 + 700𝑐 + 700𝑐 = 8400𝑐
7 perfect octaves
(1200¢):
1200𝑐 + 1200𝑐 + 1200𝑐 + 1200𝑐 + 1200𝑐 + 1200𝑐 + 1200𝑐 = 8400𝑐
Instead of relying on any musical exercise or aesthetic qualities, the equal temperament
system is entirely a scientific/mathematical construction, in which the octave (1200 cents) is
divided into twelve logarithmically equal segments (i.e. semitones). The frequency ratio of a
semitone is obtained by applying the 12th root of two to the octave (see Equation 3) (White
1917; Rossing et al. 2002):
√212
= 1,0594 … (3)
Any 12-TET interval ratio (RI) can be calculated using the Equation 4.
𝑅𝐼 = 2𝐼/12, (4)
where I is a number between 1 to 12 corresponding to the running number of the desired
interval (e.g. 1 = the unison, 2 = minor second, 3 = major second, etc.).

33
The main benefit of the system is the convenience of having twelve tonally similar key
signatures, that allow the musician to modulate freely between them without a need to retune
the instrument. Neither does one have to worry about wolf intervals or enharmonic equivalent
pitches being of different frequencies, because all sharps and flats fall on the same
frequencies. The system is also universal as it is applicable for a wide range of instruments,
which allows performing in practically limitless instrument combinations (White, 1917). A
detailed structure of the equal temperament system is presented in Table 9.
TABLE 9. Tuning system of twelve-tone equal temperament.
Interval Note Semitone ratio Interval ratio Semitone (¢) Interval (¢)
P1 C - 20/12 = 1 0 0
m2 C♯/D♭ √212
21/12 100 100
M2 D √212
22/12 100 200
m3 D♯/E♭ √212
23/12 100 300
M3 E √212
24/12 100 400
P4 F √212
25/12 100 500
A4/d5, TT F♯3 / G♭ 3 √212
26/12 100 600
P5 G √212
27/12 100 700
m6 G♯/A♭ √212
28/12 100 800
M6 A √212
29/12 100 900
m7 A♯/B♭ √212
210/12 100 1000
M7 B √212
211/12 100 1100
P8 C √212
212/12 = 2 100 1200
2.9.3 Origins of the equal temperament
Earliest records of equal temperament originate from ancient China, where a numerical
approximation of the system was created already ca. 400 CE, but the first printed proof of the
method wasn’t available until 1000 years later when Prince Chu Tsai-yü supposedly created
the first nearly accurate presentation of the tuning system in the late 16th century (Barbour,
1951; Partch, 1974; Steck, 2015). Still, regarding the equal temperament’s early development
in Europe, Barbour does not consider the Chinese discoveries to have been an influence, but
instead gives credit to the trio of Vincenzo Galilei, Simon Stevin and Marin Mersenne
(Barbour, 1951).
Whereas Galilei (ca. 1520 - 1591) and Stevin (1548 - 1620) were important figures in
developing the concept of equal temperament and promoting its benefits, the most significant
early figure was Marin Mersenne (1588 - 1648), a French monk, whose book L’Harmonie

34
Universelle (1637) helped greatly in popularizing the system. According to Barbour (1951),
Mersenne recommended the systems to be used with “all fretted instruments, all wind
instruments, all keyboard instruments, and even percussion instruments (bells)” (p. 49), but
also presented the number theory behind it. Although Stevin had already connected equal
temperament with the mathematics of the twelfth root of the two, Mersenne was the first
Westerner, who provided the correct calculations and presented the geometric and mechanical
solutions for achieving the system (Barbour, 1951; Partch, 1974).
Although equal temperament was conceptualized in the 17th century, and its various
approximations were applied on lutes, it took 100 to 150 years for the system to become more
widely known and be used on organs and pianos. The first practical keyboard
implementations were made around mid-18th century in central Europe, first in Germany and
then in France (Helmholtz, 1895). Still, it took another 100 to 150 years for the system to
really gain wider attention, and it wasn’t until the latter part of the 19th century that equal
temperament had become known around Europe (Barbour, 1951). One reason for the fairly
long development period was that equal temperament system lacked exact definition for quite
long. Jorgensen (2009) stresses that all early, pre-20th century formations of ET should be
regarded as quasi-equal approximations, because the knowledge of correct tuning method did
not exist before 1887 and the correct mathematic solution, as we know it today, was not
perfected until 1917. Various well temperament systems (developed by e.g. Werckmeister,
Neidthardt, or Vallotti) were also widely used till the end of the 19th century and many of the
early ET systems were possibly mixtures of equal and well tempered intervals (Duffin, 2007).
Many of the problems faced with equal temperament system were solved with the publication
of Modern Piano Tuning and Allied Arts by William Braid White in 1917. The book
presented scientifically precise instructions for tuning to equal temperament, which meant that
now keyboards could be always tuned in exactly similar fashion (White, 1917; Duffin, 2007).
This is in fact a distinctive difference between, not only the tuning systems, but the tuning
cultures in general. Whereas the earlier tuning practices could be considered an art form, with
different tuners having their unique style of tuning, the equal temperament system was
different in that it was completely a scientific method. Hence its introduction turned the whole
practice of tuning from an exquisite art form to scientific execution, which could be repeated
regardless of the executioner or the location, as long as the person learned the required skills

35
to do it. This also led to the 12-tone equal temperament system being adopted as the
international standard for tuning in Western music culture (Sethares, 1995; Duffin, 2007;
Burkholder et al., 2010).
Ultimately the main reason for being pushed forward as universal tuning concept was that by
the mid-19th century, both musical compositions and performing groups, had become so
complex and diverse that the other tuning systems simply could not cope with it well enough.
Hence the change to equal temperament based music culture was clearly a forced move;
something that just had to be done to make musicians’ life easier. Even White (1917), the
author of Modern Piano Tuning and Allied Arts, acknowledged the artificiality of the system
and understood very well that it was not based on musical values, but simply on necessity.
Although the apparent tonal drawbacks were known, many considered it to be the best overall
compromise compared to other systems, which favored certain key signatures too much over
others (Grenfell, 2005).
2.9.4 Equal temperament criticism
Although equal temperament system is nowadays mostly greeted with appreciation due to its
general convenience, it has not been without critics as not everyone has found it sonically
satisfying enough. In 1732 German music theorist and composer Johann Georg Neidhardt
wrote:
“Most people do not find in this tuning that which they seek. It lacks, they say, variety in the beating of
its major 3rds and, consequently, a heightening of emotion. In a triad everything sounds bad enough,
but if the major 3rds alone, or minor 3rds alone, are played, the former sounds much too high, the latter
much too low.” (cited by Duffin, 2007, p. 43)
Neidhardt’s tirade summarizes the general critique aimed at equal temperament rather well.
Albeit being a convenient and practical system, some find it just too much of a compromise at
the cost of proper intonation as the tempering of the fifths affects all intervals (excluding the
octaves) and as a result they become slightly detuned from their acoustically pure form. While
some have concentrated more on criticizing the lost quality of the fifths (Renold, 2004),
others have considered the thirds to be the real “sufferer” of the system (Helmholtz,
1895/1912; Duffin, 2007). Simple interval comparison shows that the changes are not that
dramatic with the fourths and the fifths as these deviate only 2 cents from the pure intervals,
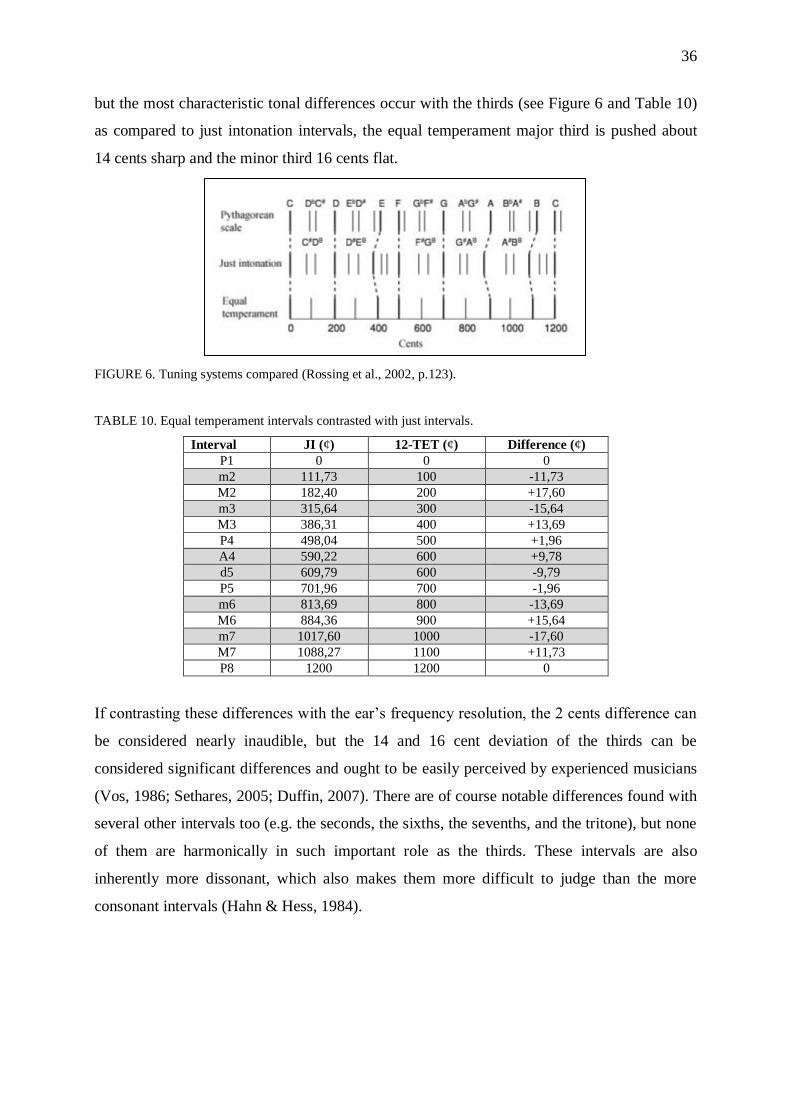
36
but the most characteristic tonal differences occur with the thirds (see Figure 6 and Table 10)
as compared to just intonation intervals, the equal temperament major third is pushed about
14 cents sharp and the minor third 16 cents flat.
FIGURE 6. Tuning systems compared (Rossing et al., 2002, p.123).
TABLE 10. Equal temperament intervals contrasted with just intervals.
Interval JI (¢) 12-TET (¢) Difference (¢)
P1 0 0 0
m2 111,73 100 -11,73
M2 182,40 200 +17,60
m3 315,64 300 -15,64
M3 386,31 400 +13,69
P4 498,04 500 +1,96
A4 590,22 600 +9,78
d5 609,79 600 -9,79
P5 701,96 700 -1,96
m6 813,69 800 -13,69
M6 884,36 900 +15,64
m7 1017,60 1000 -17,60
M7 1088,27 1100 +11,73
P8 1200 1200 0
If contrasting these differences with the ear’s frequency resolution, the 2 cents difference can
be considered nearly inaudible, but the 14 and 16 cent deviation of the thirds can be
considered significant differences and ought to be easily perceived by experienced musicians
(Vos, 1986; Sethares, 2005; Duffin, 2007). There are of course notable differences found with
several other intervals too (e.g. the seconds, the sixths, the sevenths, and the tritone), but none
of them are harmonically in such important role as the thirds. These intervals are also
inherently more dissonant, which also makes them more difficult to judge than the more
consonant intervals (Hahn & Hess, 1984).

37
Together the modifications of course change the way how different frequencies and their
harmonic overtones interact with each other and as the natural sound propagation patterns are
broken, also the overall harmonic quality of music becomes deteriorated (Sethares, 2005;
Doty, 2002). According to Duffin (2007) this is why many other temperaments, especially the
well temperaments, were kept being favored for quite long (until the end of the 19th century)
even though musicians were aware of the “new” tuning method early on. Another reason for
being rejected could be that, besides affecting single intervals, equal tempering also changes
tonality on a larger scale and using equal sized semitones leads to different key signatures
losing their unique tonal characteristics as they are sonically unified (Rossing et al., 2002;
Duffin, 2007; Jorgensen, 2009). Doty (2002) sees that the system has led to overall narrowed
understanding of musical harmonics as it “supplies composers with an artificially simplified,
one-dimensional model of musical relationships” (p. 1), which has not only “impoverished
the sonic palette of Western music, but also deprived composers and theorists of the means
for thinking clearly about tonal relationships.”
The ear’s supposed preference for natural intervals over the inferior tempered tunings has
been a major interest in intonation/tuning research for a long time. Despite the well-known
impracticalities of natural tunings, researchers have not stopped pondering whether the ear
would still have some sort of innate preference for pure intervals (Helmholtz, 1895/1912;
Barbour, 1938, cited by Parncutt, 1989; Revesz, 1954 cited by Mason, 1960; Vogel, 1961
cited by Kopiez, 2003; O’Keeffe, 1975; Burns 1999). While there are studies showing such
tendencies (Helmholtz, 1895/1912; O´Keeffe, 1975; Hall & Hess, 1984; Hahn & Vitouch,
2002; Howard, 2007a), there is still lack of hard evidence supporting the assumption. Besides,
at least an equal amount of research shows the exact opposite, and that just intonation is not
preferred more than any other tuning method, or that musicians actually deviate most from JI
standards (Greene, 1936; Nickerson, 1946; Mason, 1960; Lottermoser & Meyer, 1960, cited
by Nordmark & Ternström, 1996; Ward & Martin, 1961, cited by O’Keeffe, 1975; Hagerman
and Sundberg, 1980; Loosen, 1994; Karrick, 1998; Hahn & Vitouch, 2002; Kopiez, 2003;
Ballard, 2011). Neither studies with infants (i.e. supposedly the least accultured human
beings) have found clear proof for the pure interval tonality preference (Schellenberg &
Trehub, 1996).

38
Still, not everyone has shared the concern about the degraded harmonic quality and some
considered the slight detuning an advantage. First of all, because it helped to overcome the
problem of the wolf interval (i.e. the completely unusable keys among the good ones) and
allowed the use of all key signatures, but also because it was thought that the ear would
actually prefer the equal out-of-tuneness. Poole (1850; cited by Duffin, 2007) in fact
considered it a system that is perfectly out of tune. Also Helmholtz (1895; 321) saw that it is
far more disturbing “to hear very falsely tuned thirds amidst correct intervals, than to hear
intervals which are equally out of tune and are not contrasted with others in perfect
intonation.” Composer Arnold Schönberg was also a strong proponent of temperament as he
insisted string players to use it whenever possible and expected that “a musical ear must have
assimilated the tempered scale” and even considered “a singer who produces natural pitches
unmusical” (Yasser, 1953).
Regarding the somewhat forceful manner that equal temperament was pushed forward, first as
an ideal in the late 19th century and then as a necessity after 1917, Duffin (2007) argues that
the system was embraced too hastily and there not enough effort was put for choosing the
sonically best tuning system for our culture and instead of musical values, an easier solution
for instrument manufactures was chosen. Barbour (1951) however sees that the progression to
equal temperament based culture occurred rather smoothly, although there may have been
some regional differences. For example, in Germany and France the change occurred over a
long period of time as the knowledge about system slowly spread around and its popularity
increased. However, the situation may have been different in England, where meantone
temperaments were favored far longer, up till mid-19th century. Therefore, once the new
tuning method became more universal and eventually spread around very quickly around the
turn of the century, the change may have been more of a radical shift. (Barbour, 1951; Doty,
2002).
Nowadays equal temperament critics can be considered to be a large minority as our whole
music culture has become so used to the system during last 100 years that hardly no one
bothers to look for alternatives. Or maybe it can be argued that hardly no one knows any
alternatives. Any modern-day ET criticism is most likely to come from early music
connoisseurs, who criticize its use in the performances of the music of Middle Ages,
Renaissance or Baroque, arguing that the music of these eras just doesn’t sound right when

39
forced in a modern tonality. Instead the performances should be done using the tunings and
instruments that were in use when the music was composed to preserve harmonic authenticity
(Rossing et al., 2002; Levitin, 2006; Duffin, 2007).
2.10 The scale of twelve true fifths
Since the adoption of equal temperament as the main tuning system in Western music culture,
no other system has been seriously proposed to displace it. Despite its undisputed benefit of
universal practicality, it is still intriguing to question if the system could be perfected
somehow to allow more accurate reproduction of harmonics. Or could some alternative
system exist that could challenge the equal temperament a bit.
One such “challenger” was discovered in 1962 by a German-American musicologist Maria
Renold, who discovered a twelve-tone chromatic scale that was constructed using non-
tempered intervals. Contrary to the Pythagorean tuning or Just intonation, this method
however gave access to all major and minor keys without the need to retune, just like equal
temperament. Renold’s findings were published in 1970 in Das Goetheanum, where the scale
was named as “The Scale of Twelve Fifths” and the tuning system the “Twelve fifth-tones
tuning”8 (Renold, 2004). Not lacking in self-confidence, the author considers the scale to be
superior to any other tuning system and “it makes the unsatisfying and false-sounding equal-
tempered tuning unnecessary” (Renold, 2004; 57). Such an assertive boasting naturally rouses
questions about how can it actually work, and could this be the answer that equal
temperament critics have been waiting for?
The basic idea of the scale of twelve fifths is that it is constructed of two note groups: a
diatonic scale and a geometric meantone scale. Both scales are based on the use of pure
Pythagorean fifths, but have different root notes. The diatonic scale is the standard
Pythagorean major scale consisting of notes F, C, G, D, A, E and B (see Score Example 4),
8 In the mid-1980’s Renold (2004) developed the tuning method further and came up with a revised version of
the system, which applied more open intervals, i.e. intervals that are tuned slightly wide, which supposedly
provides “a further enrichment of the sound” (p.140). Discussion and experimentation in this study however
focuses solely on the original version of the twelve fifth-tones tuning; also referred to as Renold 1 tuning.

40
and has its root in C3 = 128 Hz. The geometric meantone scale on the other hand is based on
the geometric mean point of the octave C3 – C4 and consists of notes F♯, C♯, G♯, D♯ and A♯
(see Score Example 4) (Renold, 2004).
SCORE EXAMPLE 4. The two note groups forming the scale of twelve true fifths.
When combined, “these two rows of tones form a genuine, aurally correct sounding chromatic
scale and 24 equally genuine-sounding major and minor scales that are suitable for the
realization of all works of music on instruments of fixed tuning” (Renold, 2004, p. 57). Being
based on pure fifths, the scale can be considered to fall in the category of natural tuning
systems as a modification of the Pythagorean tuning.
Renold (2004) stresses that the geometric midpoint between the two C’s is actually neither F♯
nor G♭ , but the true tonal center of the octave and preferred to call it "Gelis". This new term
was used to emphasize the novelty of the tonal material, but also fact that this particular tone
was not be thought as flat or sharp, but as the geometric mean point of the octave. The name
“Gelis” originates from German language, where G-sharp is known as "Gis" and G-flat is
"Ges". Hence "Gelis" aims to combine the meaning of the two. The same applies to all
“sharps” and “flats” of the scale of twelve fifths, which are called "Delis", “Elis”, “Gelis”,
"Alis" and "Belis". However, to avoid possible confusion and excess of terminology, standard
Western enharmonic note nomenclature is used in this study instead of the formed interval
names. Thereby, Renold’s “Gelis” = F♯/G♭ , “Delis” = C♯/D♭ , “Elis” = D♯/E♭ , “Alis” =
G♯/A♭ , and “Belis” = A♯/B♭ .
2.10.1 Aural genuineness
Probably the most interesting and controversial argument that Renold (2004) uses to justify
the excellence and validity of the scale is that it consists of intervals that are aurally genuine,
i.e. they sound “right” to human ear. Unsurprisingly Renold finds the aural quality of the
equal temperament system to be inferior and only four of the 12-TET intervals are considered
41
aurally genuine: the octave, the tritone, the minor third and the major sixth. The rest eight
intervals are non-genuine, i.e. sound “wrong”. These are definitely interesting claims as often
in the tuning discussion just intonation is considered to be the system in which intervals
appear in their most accurate form. Hence, it would be logical to assume that just intervals
would also be aurally most ideal. What is interesting however, is that the four 12-TET
intervals, that the ear supposedly experiences as genuine, don’t appear in either just intonation
or Pythagorean tuning (Renold, 2004).
But what is aural genuineness? The whole notion that a tone or interval is “aurally genuine”
and sounds “right” seems rather odd and highly subjective in a scientific setting where
something more objective and quantifiable proof is typically preferred. Would there be
anything to actually support such claims? At least something more tangible than just
proclaiming that something sounds “genuine” and expect it to be accepted as a fact? To
support the allegations, Renold (2004) makes a point that the scale was initially found
experimentally by ear and the supporting mathematics were discovered later, which
supposedly makes the tuning system truly special. As mathematical support the author
suggests applying so-called form principles of the scales to the musical octave, which “help in
gaining more intellectual understanding of the scales” (p. 43) and explains why some tones
are perceived as genuine and some are not, even though they are mathematically or
acoustically very similar. In practice these form principles mean applying the three classical
Pythagorean means on the musical octave. These are the arithmetic mean (AM, see Equation
5), the harmonic mean (HM, see Equation 6) and the geometric mean (GM, see Equation 7)
(Renold, 2004; Cantrell, 2003).
𝐴𝑀(𝑓1, 𝑓2) =𝑓1+𝑓2
2 (5)
𝐻𝑀(𝑓1, 𝑓2) =2∗𝑓1∗𝑓2
𝑓1+𝑓2 (6)
𝐺𝑀(𝑓1, 𝑓2) = √𝑓1 ∗ 𝑓2, (7)
where f1 and f2 are the two frequencies of interest.

42
The arithmetic and the harmonic means divide the octave (2:1) into perfect fifth (3:2) and
perfect fourth (4:3) (see Equations 8 & 9). If this division is performed twice, a just major
second (9:8) is left in between the fifth and fourth (see Figure 6).
𝐴𝑀 =1+2
2=
3
2 (8)
𝐻𝑀 =2∗1∗2
1+2=
4
3 (9)
FIGURE 6. Arithmetic and harmonic mean divisions of the musical octave (Renold, 2004, p.21).
The geometric mean (see Equation 10) results in the exact tonal center point of the octave,
which happens to be the triton. This is in fact the same tritone that appears in the equal
temperament system.
𝐺𝑀 = √1 ∗ 2 = 1,414 … (10)
According to Renold (2004) these five intervals (octaves, fifths, fourths, major seconds and
the tritone) are experienced genuine without exception. However, if any other intervals are
derived from these five intervals, using these same form principles or by adding/subtracting,
they will be equally genuine intervals as well. Just as sound and frequency are inherently
connected with the three Pythagorean series, also these three mean formations belong to the
basic laws of music (cf. 2.3 Harmonic series) and therefore Renold considers this to be a
mathematical proof of the aurally experienced genuineness of these tones.

43
It is also necessary to understand that aural genuineness is not a proprietary quality of one
specific form of an interval, but an interval can exist in various sizes, and yet they all can be
aurally genuine. For example, the minor third (ratio 1:1932.) in Renold’s tuning system is
obtained by progressing in series of perfect fifths from the tritone (i.e. the geometric mean of
the octave c – C). As both tritone (GM) and fifth (AM) are genuine intervals, also the minor
third will be. In the 12-TET system minor third has a different frequency ratio (1:1892) so
how can this be genuine as well? The reason is that the ET minor third occurs at the geometric
mean point of the tritone C – F#, which is one of the four genuine intervals in the 12-TET
system (see Table 11). Therefore, also the minor third is aurally genuine, because it can be
calculated using the form principles (Renold, 2004).
TABLE 11. Aurally genuine intervals in the 12-TET system.
12-TET
interval
Pitch Frequency ratio f2:f1 (Hz) Description
Octave C5 – C4 2:1 523,26 : 261,63 Perfect octave
Tritone F♯4/G♭ 4 √2 :1 370 GM of the octave
Minor 3rd D♯4/E♭ 4 √1 ∗ √2 = 1,1892 : 1 311,13 GM between P1 and TT
Major 6th A4 √√2 ∗ 2 = 1,6818 : 1 440,00 GM between TT and P8
However, the reason why the rest of the 12-TET intervals are not considered genuine, is that
they originate from the 12th root of the octave (i.e. the cube root of the minor 3rd). This
method yields the non-genuine minor 2nd and as a result all other intervals derived from this
are also perceived as non-genuine. The scale of twelve fifths however follows the form
principles with all intervals and therefore results in aural genuineness throughout the system
(Renold, 2004).
2.10.2 Mathematics of the scale of twelve true fifths
It was already explained briefly how the scale of twelve true fifths is formed of two separate
tone sequences, but the mathematical construction of the scale requires more detailed
explanation. First of all, one starts by forming the diatonic scale by progressing in steps of
pure fifths beginning from the root note C (see Table 12). This is same as the Pythagorean
diatonic major scale.

44
TABLE 12. Renold 1 diatonic scale.
Note Frequency ratio Description
C 1
F 4
3 Harmonic mean of the octave c–C
G 3
2 Arithmetic mean of the octave c–C
D 𝐺×3
2=
9
4÷ 2 =
9
8
A 𝐷×3
2=
27
16
E 𝐴×3
2=
81
32÷ 2 =
81
64
B 𝐸×3
2=
243
128
The pentatonic scale intervals are however not achieved by continuing onwards from the
diatonic B. Instead, their root is the geometric mean point of the octave c – C, i.e. the tritone:
𝐺𝑀 = √𝑓1 ∗ 𝑓2 = √1 ∗ 2 = 1,414 …
From here on the process is again similar, i.e. the interval ratios are obtained by progressing
in steps of pure fifths from the geometric mean (F♯/G♭ ) of the octave (see Table 13). The
complete structure of the scale of twelve true fifths is presented in the Table 14.
TABLE 13. Renold 1 pentatonic scale.
Note Frequency ratio Description
F♯/G♭ √2 Geometric mean of the octave c–C
C♯/D♭ (√2×3
2) ÷ 2 =
3
4√2
G♯/A♭ 3
4√2 ×
3
2=
9
8√2
D♯/E♭ (9
8√2 ×
3
2) ÷ 2 =
27
32√2
A♯/B♭ 27
32√2 ×
3
2=
81
64√2

45
TABLE 14. Complete structure of the scale of twelve fifths.
Interval Ratio Note f (Hz) Alt. name Description
P1 1 C3 128
m2 3
4√2 C♯/3 / D♭ 3 135,77 “Delis”
M2 9
8 D3 144
m3 27
32√2 D♯3 / E♭ 3 152,74 “Elis”
M3 81
64 E3 162
P4 4
3 F3 170,67 Harmonic mean of 8va
TT √2 F♯3 / G♭ 3 181,02 “Gelis” Geometric mean of 8va
P5 3
2 G3 192 Arithmetic mean of 8va
m6 9
8√2 G♯3 / A♭ 3 203,65 “Alis”
M6 27
16 A3 216
m7 81
64√2 A♯3 / B♭ 3 229,1 “Belis”
M7 243
128 B3 243
P8 2 C4 256
To clarify the scale representation in Table 14, it is necessary point out that Renold was a
strong advocate of using reference pitch C3 = 128Hz (equals to A4 = 432Hz) instead of the
standard concert reference pitch A4 = 440Hz. Preference for this so called “Philosopher’s C”
originated from suggestions given to Renold by Austrian philosopher/anthropologist Rudolf
Steiner and a thorough discussion about it is found in Renold’s (2004) book.
Technically (and sonically) the most unique feature that differentiates Renold’s scale from
other tuning systems is that it incorporates so-called “formed” intervals, which occur between
the “true” diatonic tones and the geometric mean tones (i.e. sharps/flats) (see Table 15).

46
TABLE 15. Renold 1 scale fifths.
Interval Size (¢) Description
C – G 701,955 True 5th
G – D 701,955 True 5th
D – A 701,955 True 5th
A – E 701,955 True 5th
E – B 701,955 True 5th
B – F♯ 690,225 Formed 5th
F♯– C♯ 701,955 True 5th
C♯– G♯ 701,955 True 5th
G♯– D♯ 701,955 True 5th
D♯– A♯ 701,955 True 5th
A♯– F 690,225 Formed 5th
Initially Renold discovered this special fifth (B – F♯, B♭ – F) by ear and decided to call it
formed fifth, because its qualities differed from any other fifth that had been classified
(Renold, 2004). Being 690,225 cents in size, the formed fifth is considerably narrower
compared to both the true Pythagorean fifth (701,955¢) and the equal temperament fifth
(700¢). Discovery of the formed fifth was essential, because it allows the stack of twelve
fifths match the stack of seven octaves (see Table 16), thereby making the entire tuning
system possible (Renold, 2004).
TABLE 16. Perfect octaves vs. Renold 1 fifths.
7 octaves 1200¢ + 1200¢ + 1200¢ + 1200¢ + 1200¢ + 1200¢ + 1200¢ + 1200¢ = 8400¢
12 fifths 701,955¢ + 701,955¢ + 701,955¢ + 701,955¢ + 701,955¢ + 701,955¢ + 701,955¢ + 701,955¢ +
701,955¢ + 701,955¢ + 690,225¢ + 690,225¢ = 8400¢
The presence of these two different sized fifth means that every interval (excluding the
octave) in the scale appears in two sizes; as a “true” Pythagorean intervals between the
diatonic tones, and as a “formed” variant between the diatonic and geometric tones (see Table
17 for details). The size difference between the true and formed intervals is a constant 11,73
cents, i.e. half of the Pythagorean comma. Furthermore, the tritone in fact appears in three
sizes: as “formed” tritone, but also as “true” Pythagorean augmented fourth and as diminished
fifth.

47
TABLE 17. Renold 1 intervals.
Interval Renold 1 “true” (¢) Renold 1 ”formed” (¢) JI (¢) 12-TET (¢)
P1 0 0 0 0
m2 90,225 101,955 112 100
M2 203,910 192,180 182 200
m3 294,135 305,865 316 300
M3 407,820 396,090 386 400
P4 498,045 509,775 498 500
d5 588,270 - 590 -
TT - 600 600
A4 611,730 - 610 -
P5 701,955 690,225 702 700
m6 792,180 803,910 814 800
M6 905,865 894,135 884 900
m7 996,090 1007,82 1018 1000
M7 1109,775 1098,045 1088 1100
P8 1200 1200 1200 1200
The augmented fourth occurs between B and F, the diminished fifth occurs between F and B,
while the rest are formed tritones. The size difference between the augmented fourth and the
diminished fifth is the Pythagorean comma (611,73¢ – 588,27¢ = 23,46¢). Despite these
variations and sometimes large differences compared to e.g. pure intervals, the formed
intervals are still aurally genuine as they are based on the previously demonstrated form
principles and Renold (2004) considers them to “harmonize with the true intervals to make
well-sounding harmonies and characteristic dissonances” (p. 57).
2.10.3 Comparison with other tuning systems
Contrasting the Renold scale intervals with pure intervals (Table 18) shows that the
differences are quite significant. Although fifths and fourths remain pure, the rest of the
intervals deviate mainly ±22 cents. With formed intervals the differences are approximately
half of this, varying between ±10 and ±12 cents. If comparing these differences with the ones
found between 12-TET and pure intervals, equal temperament can be considered to fall in
between the true and formed interval tonality.

48
TABLE 18. Renold 1 contrasted with just intonation intervals.
Interval JI (¢) Renold
“true” (¢)
Renold
”formed” (¢)
JI vs. Renold 1 “true”
difference (¢)
JI vs. Renold 1
“formed” difference (¢)
P1 0 0 0 0 0
m2 112 90 102 -22 -10
M2 182 204 192 +22 +10
m3 316 294 306 -22 -10
M3 386 408 396 +22 +10
P4 498 498 510 0 +12
d5 590 588 - -2 -
TT - 600 - ±12
A4 610 612 - +2 -
P5 702 702 690 0 -12
m6 814 792 804 -22 -10
M6 884 906 894 +22 +10
m7 1018 996 1008 -22 -10
M7 1088 1110 1098 +22 +10
P8 1200 1200 1200 0 0
Comparison between the 12-TET and Renold 1 scales shows that the differences between the
two systems are actually very small, only ±12 cents at maximum (see Table 19), and this even
occurs with the tritone, which is inherently so dissonant that tonality judgment is difficult in
any case.
TABLE 20. Renold 1 intervals contrasted with the 12-TET.
Interval 12-TET
(¢)
Renold
“true” (¢)
Renold
”formed” (¢)
12-TET vs. Renold 1
“true” difference (¢)
12-TET vs. Renold 1
“formed” difference (¢)
P1 0 0 0 0 0
m2 100 90 102 -10 +2
M2 200 204 192 +4 -8
m3 300 294 306 -6 +6
M3 400 408 396 +8 -4
P4 500 498 510 -2 +10
A4 - 588 - -12 -
TT 600 - 600 - 0
d5 - 612 - +12 -
P5 700 702 690 +2 -10
m6 800 792 804 -8 +4
M6 900 906 894 +6 -6
m7 1000 996 1008 -4 +8
M7 1100 1110 1098 +10 -2
P8 1200 1200 1200 0 0
Regarding the harmonically most significant intervals (i.e. the thirds, the fourth and the fifth),
the differences vary from 2 to 8 cents with the true intervals, and from 4 to 10 cents with
formed intervals. If contrasted with the ear’s frequency discrimination threshold, these are
possibly distinguishable differences in controlled laboratory conditions with isolated

49
intervals, but are more on the borderline in a more realistic and complex musical context.
Still, it is reasonable to expect that for musicians, who supposedly have developed a more
finely tuned ear for sensing minor tonal changes (Akin & Belgin, 2009; Carey et al., 2015),
even these extremely minor differences could alter the overall tonal character of
intervals/chords, which then could result in e.g. increased or decreased openness, clarity,
dullness, dissonance, etc.
2.10.4 Auditory roughness comparison
To gain preliminary insight about the quality of intervals in these two tuning systems,
auditory roughness estimates of selected intervals were calculated. First, the interval stimuli
were created in Logic Pro audio sequencer software using a virtual grand piano instrument,
with the tuning system variants being implemented using sequencer’s internal tuning table (a
more detailed explanation about the process is given in 4.2 Stimuli). Then auditory roughness
estimates were calculated using MIRToolbox 9 , and its mirroughness function with
‘Vassilakis’ algorithm (Lartillot, 2014). According to Vassilakis (2001), this model fixes
inaccuracies found with the Sethares model (also available in MIRToolbox) and provides a
good correlation with roughness values obtained from perceptual experiments.
Results in Figure 710 and Table 19 show that roughness values are extremely similar between
the tuning variants. The only clear differences are found with fifths (P5), with which the
Renold’s true fifths is the least rough of the three, and the formed fifth the roughest. This is of
course, because the true fifth (i.e. the pure Pythagorean fifth) is as pure as a fifth can be,
whereas the formed fifth is much narrower compared to the other two, hence providing
increased auditory roughness.
9 MIRToolbox is a Matlab toolbox designed for musical feature extraction (Lartillot & Toiviainen 2007).
10 Neither P1, m2, or P8 are focus of this study, but are included on the graph to demonstrate the minimum and
maximum roughness amplitudes.

50
FIGURE 7. Auditory roughness comparison of intervals.
TABLE 19. Auditory roughness values of intervals.
Tonality P1 m2 m3 M3 P5 m7 P8
12-TET 0,0027 0,9661 0,5370 0,5551 0,2950 0,5392 0,0393
Renold 1, True 0,0027 0,9604 0,5187 0,5805 0,2042 0,5789 0,0393
Renold 1, Formed 0,0027 0,9953 0,5228 0,5682 0,4454 0,5277 0,0393
Regarding Renold’s aural genuineness claims, these dissonance estimates don’t seem to offer
any significant information to draw strong conclusion. First of all, because the differences are
so small, generally within 0,01 on the roughness scale. Secondly, even if one-hundredth of a
roughness value would make a difference, only Renold’ minor thirds (m3) yield consistently
smaller roughness values. With major thirds and fifths these are either mixed or the 12-TET
offers less rough combinations.
51
3 RESEARCH TOPIC
3.1.1 Previous research
A considerable amount of research has been carried out on intonation practices and perception
in order to to explain the mechanisms/factors affecting intonation choices and preferences.
Typical experimental approaches have included interval adjustment and tuning (Platt &
Racine, 1985; Rakowski, 1976; Loosen, 1994; Nordmark & Ternström, 1996), interval
measurement from real performances (Helmholtz, 1895/1912; Greene, 1937; Nickerson,
1949; Mason, 1960; Geringer, 1978; Loosen, 1994; Karrick, 1998; Kopiez, 2003; Jers &
Ternström, 2005; Vurma & Ross, 2006; Howard, 2007a, 2007b), perception of isolated
intervals (Lindqvist-Gauffin & Sundberg, 1971; Hall & Hess, 1984; Vos, 1986; Schellenberg
& Trehub, 1996; Vurma & Ross, 2006), discrimination between intonation variables (Madsen
& Geringer, 1981; Vos, 1982, 1984; Vos & van Vianen, 1985a, 1985b) and general
intonation/tuning system preferences (O’Keeffe, 1975; Geringer, 1976, 1978; Vos, 1988;
Loosen; 1995; Hahn & Vitouch, 2002). Studies applying both perceptual and performance
approaches (Geringer, 1978; Ely, 1992; Ballard, 2011) have found that the tonality
preferences don’t correlate, i.e. what a musician prefers shile performing is not necessarely
what the listener finds more preferred.
General trends found in previous studies inlude e.g. the tendency to prefer streched intervals,
i.e. smaller intervals are preferred slightly smaller and larger intervals slightly wider relative
to the equal temperament standards (Mason, 1960; Loosen 1995; Karrick, 1998; Burns, 1999;
Jers & Ternström, 2005). Hagerman & Sundberg (1980) suggest that this is because stretched
intervals seem to sound more active or expressive. Also, musicians, who are free of fixed-
pitch structures, can show large variability in performance intonation and don’t necessarely
conform to any particular tuning system standards, but tend to play in-between the tunings
and rely more on their own tuning standards and musical taste (Mason 1960; Ward, 1970;
Parncutt, 1989; Loosen 1994). Still, it is likely that equal temperament is used as the primary
tonal template, because the least deviation often occurs from it.

52
While the majority of previous research has focused on studying intonation of isolated
intervals, considerably less attention has been given on tuning system preferences with more
holistic approach, i.e. how the different systems are perceived in actual musical context.
Regarding the current study, most infuencial research has been carrie out by Hahn & Vitouch
(2002), who studied perceived preferences of four different tuning systems (just intonation,
Pythagorean tuning, meantone temperament and equal temperament) in a forced-choise
experiment using realistic musical stimuli that included chord sequences and musical excerpts
from real compositions with varying instrument timbres (piano, organ, choir). Responses
from three participant groups (pianists, string players, non-musicians) were overall quite
mixed and could be considered lacking in consistency and strong significances as the
preferences varied, not only between participant groups, but also between stimuli types and
between instrument timbres. On few occasions the ratings showed some support for the
“familiarization effect” suggested by Loosen (1994, 1995), i.e. that musicians identify best
with the tonality of their main instruments, but on the other hand the responses provided also
completely unexpected results depending on the stimuli. The main conclusion of the study
was that “tuning preferences in a realistic musical context are moderated by musical
expertise, familiarity, timbre, and musical content of the piece (e.g., in terms of melodic
plausibility and strength of beatings)” (p. 760).
Vos (1988) had 24 musically trained participants to evaluate the acceptability of seven
different tuning systems, which had the fifths tempered in varying amounts from -10 to +2
cents. Results showed that, if the fifths were tempered between -5,4 and 0 cents, no real
difference was perceived, but the Pythagorean tuning, equal temperament, 1/4-comma, and
1/6-comma meantone temperaments were all equally acceptable and for example equal
temperament was not found worse than any other system. The results were in line with Van
Esbroeck and Monfort (1946, cited by Vos, 1988), who did not discover “differences worth
mentioning between harmonic musical fragments played in equal temperament, Pythagorean,
and just tuning” (p.2390), but also confirmed previous findings (Vos, 1982, 1984) that
judgment becomes more difficult with small or moderate tempering.
O´Keeffe (1975) had a large group of music students (n=102), who were asked to rate their
preference for the better in-tune sounding musical stimuli, which included pieces played on
an electric organ and implemented two tuning variations (just intonation and equal

53
temperament). 56% of the participants showed overall preference for just intonation, but only
two participants gave consistent enough ratings were free of chance. Researchers nevertheless
considered the results as a proof of preferability of natural tuning.
Loosen (1994) conducted an experiment, where pianists, violin players and non-musicians
were asked to adjust the tonality of ascending and descending C-major scales to match their
personal preferences. The aim was to find support for the assumption that intonation
preferences and decicions are more determined by one’s musical expertise rather than by any
mathematical definitions of frequency relationships.
Although several perceptual experiments have shown that people are indeed able to perceive
small tonality differences, such as ones found between different tuning systems (Geringer,
1974; Madsen & Geringer, 1981; Vos, 1982, 1984, 1986, 1988; Vos & van Vianen, 1984;
Hall & Hess, 1984; Hahn & Vitouch, 2002), it is clear that providing clear and consistent
evaluations is a more difficult task, which is why preference ratings have often been very
mixed. (O’Keeffe, 1975; Geringer, 1976; Madsen & Geringer, 1981; Hahn & Vitouch, 2002).
This is most likely because the differences between tunings system are often very small
compared to tolerance that the ear has for intonation variations. While the ear’s discrimination
threshold can be even 100 cents (Levitin, 2006), the differences between tuning systems are
typically only a fraction of this, usually well below 20 cents (e.g. 12-TET vs. JI). Hence, even
if one could hear differences between intonation variations, it can be difficult to make clear
judgment about superiority of one over another.
3.1.2 Current study
Instead of focusing on the differences between the classic Western tuning systems (i.e.
Pythagorean tuning, just intonation or meantone temperament), the current study concentrates
on the differences between the 12-tone Equal Temperament and Maria Renold’s Twelve
Fifth-tones Tuning (i.e. the Scale of Twelve Fifths). The principal difference between these
two systems is that, whereas the ET tuning system is based on using equal sized semitones
(100 cents) for constructing the twelve-tone scale, the twelve fifth-tones tuning is based on
the application of pure fifth (3:2) for determining the interval relationships of the scale. This
particular system however applies the fifths in such way that a circulating twelve-tone scale

54
can be constructed. A particularly interesting quality of this tuning system is that it
supposedly offers superior, aurally genuine harmonic reproduction of intervals compared to
tempered tunings. This system has however remained fairly unknown throughout the years,
and therefore deserves more attention. Hence, this study aims to fill some of the gaps in
knowledge by targeting the perceptual differences between these two tuning systems and aims
to answer the following questions:
1. Are there significant perceptual differences between the equal temperament and
twelve fifth-tones tuning systems?
2. Is one of the systems found more preferred over the other?
3. Is there anything to support the aural genuineness claims of the scale of twelve true
fifths?
4. Would the Renold’s tuning system be a viable alternative for equal temperament.
3.1.3 About comparative research
The author of the scale of twelve fifths points out that in order to preserve the true ethos of the
tones and for it to be correctly perceivable, comparative research can be made only with real
instruments, tuned by a professional tuner using appropriate tuning forks. It is also stressed
that electronic instruments or electronic amplification are not suitable for creating the tones,
because they become “contaminated” by electricity and as a consequence lose their genuine
aural qualities (Renold, 2004).
The first remark is of course tenable as accurate tuning should be always strived for, but the
second one makes one question the validity of the entire system. How can it be a superior
method, if it only works in a certain kind of setting? If one was to hold on to these principles,
it would be rather difficult to arrange an ideal experiment setup that would allow objective
comparison between different intonations. For example, if considering a grand piano, this
would first of all require two identical instruments, one tuned to equal temperament and the
other one according to Renold’s scale, both with utmost accuracy and checked regularly. Both
instruments should be MIDI capable as well to have the stimuli playback occur exactly
similar every time the experiment is run. As this kind of setup was unattainable for the

55
purposes of current research, these deficiencies are acknowledged, but the experimental
design is still solely based on electronic and digital devices. This is simply, because:
1. Modern audio sequencer allows easy implementation of alternative tunings.
2. MIDI provides consistency, i.e. the stimuli will be performance wise identical every
time, and the used tuning system is the only differentiating factor between the stimuli.
3. Electronic and virtual instruments are an integral part of modern musical environment.
If the Renold’s tuning system was to outweigh the equal temperament, it should also
work in electronic environment just as well as in purely acoustic one.
3.1.4 Hypothesis
Based on the previous findings on intonation and tuning perception, it can be assumed that:
1. People are able to perceive the tonal differences between the two tunings, as it has
been shown that people can distinguish very small frequency differences.
2. The equal temperament system will be overall more preferred, because people are
used to hearing it and will reject everything unfamiliar, even if it was somehow more
“correct” or aurally genuine. It is however possible that some single intervals stimuli
can show opposite preferences.
3. No proof of aural genuineness of Renold’s tuning system will be discovered. This is
also due to the unfamiliar tonality of the scale of twelve true fifths.
4. Overall Renold’s system cannot be regarded as a replacement option for equal
temperament.
In addition to tonality preference evaluations, the experiment includes also a frequency
discrimination test, where participants evaluated small frequency differences between two
successive complex tones. Based on the JND(f) definitions of Rossing et al. (2002) and
Levitin (2006), it can be expected that:
1. The ability to recognize the tones as different increases as the frequency difference
between the tones increases.

56
2. The overall discrimination threshold is at about ¼ of a semitone, i.e. everyone will
recognize the ±24 cents differences.
3. Frequency differences larger than ±9,775 cents are recognized by majority of the
participants. Smaller frequency differences (i.e. Δf < ±9,8 cents) will be recognized,
but general inconsistency and randomness in responses will increase as the frequency
difference between the tones decreases.
4. The ±0 cents stimuli will be recognized correctly by all participants.
4 METHOD
To find out which of the two tuning systems, twelve-tone equal temperament (12-TET) or
twelve fifth-tones tuning (Renold 1), would be more preferred, a listening experiment was
designed with purpose to have people evaluate musical stimuli for their “in tuneness” in a
simple A/B comparison. Overall the listening experiment drew influence from the research by
Hahn & Vitouch (2002), who compared the perceived differences and preferences of four
different tuning systems (equal temperament, just intonation, meantone temperament and
Pythagorean tuning) in a force choice experiment.
The experiment took place in the department of music at the university of Jyväskylä, Finland.
A quiet room was chosen as location for the experiment and for listening the participants used
a pair of closed back headphones (Sennheiser HD-25) to provide extra isolation from possible
random background noises. Instead of using e.g. online queries for the data collection, more
laboratory like conditions were preferred in order to provide similar conditions for each
participant.
Even though anyone was allowed to participate, a desired target participant was an active
musician, because of the assumption that musicians would be generally more experienced in
listening intervals and chords and would therefore possess a more critical ear for tonality
nuances. For example, Roberts (1986, cited by Parncutt, 1989) considers the differences
between tuning systems to be generally too small for non-musicians to perceive. Loosen
(1994, 1995) and Hahn & Vitouch (2002) also conclude that musically inexperienced listeners
lack on musical conditioning and therefore may be too tolerant for small tuning variations and
cannot provide consistent responses, which makes their judgments ambiguous.

57
4.1 Participants
34 participants (14 females, 20 males, Mage = 30,8 years, age range: 21-56) took part in the
listening experiment. Participants were recruited from the department of music at the
university of Jyväskylä and the local music college via e-mail lists and by asking people
personally. Participants represented 13 different nationalities, with 50% of them being Finnish
natives.
91,2% of the participants were active musicians and large majority (82,4%) had more than 10
years of experience in playing an instrument. Similarly, almost everyone (91,2%) had had
some sort of formal musical training (e.g. in a music school, conservatoire, or similar), with
55,9% having had more than 10 years of training and 32,4% with 5 to 10 years of training.
Participants also rated their level of musicianship, with 32,4% identifying themselves as
“Semi-professional”; 26,5% as “Professional”; 23,5% as “Serious Amateur”; 14,7 % as
“Hobbyist” and 2,9% as “Non-musician”.
All participants reported having normal hearing, i.e. had not been medically diagnosed with
hearing impairment. One participant reported of suffering from high frequency tinnitus, but
did not consider it to affect the tasks presented in the experiment. Only one participants
replied having so-called perfect pitch, i.e. absolute pitch hearing.
General familiarity with equal temperament was rather good, with 91,2% replying that they
were familiar with the term, and 67,6% considering that they could explain what ET means.
4.2 Stimuli
The main part of the experiment presented participants with musical stimuli created using the
two tuning systems of interest, i.e. the 12-tone equal temperament (12-TET) and the twelve-
fifth-tones tuning (Renold 1). Stimuli were created in Logic Pro (later Logic) audio sequencer
software with EXS24 virtual sampler instrument and Steinway grand piano modeling. Stimuli
were first recorded as MIDI, but were later converted to 16-bit stereo wave audio files (.wav)
to be used in the listening experiment. All MIDI note velocities were quantized to the same
level (80) to avoid amplitude and timbre variations, which could affect the judgment.

58
The Renold 1 tuning was implemented using Logic’s internal tuning table, which allows user
to apply customized tunings either by using a Scala11 tuning file, or by setting a note specific
deviation (in cents) from the equal temperament scale. The latter option was chosen, because
testing with a software tuner (Melda Production M-Tuner) proved it to provide slightly more
accurate results. The used tuning table with the basic Renold 1 setting is presented in the
Figure 9.
FIGURE 9. Renold 1 tuning table in the key of C.
Considering the intervals used in the experiment, auditioning all twelve intervals had to be
ruled out simply because the stimuli count would become too large, and the experiment
duration too long. Focus was instead set on the harmonically most significant intervals, i.e.
the thirds (m3, M3) and the fifth (P5). In addition, also minor seventh (m7) was used.
The facts that Renold 1 system is based on different tuning reference frequency (C3=128Hz)
than ET (A4=440Hz), and includes different two types of intervals (true and formed),
provided challenges regarding what common reference pitch and which pitch classes were
reasonable to use to allow most transparent comparison between the systems.
Regarding the reference pitch, the standard reference pitch A4=440Hz could not be used,
because this would lead to the C’s (a desirable pitch to be used with the stimuli), being of
different frequencies in the two systems. Different sounding root pitch could however
influence person’s judgment away from the actual focus of the experiment, i.e. the interval
size and harmonic quality of the tone combination. To avoid this, C4=261,63Hz was chosen
as the reference pitch to which the Renold 1 scale was transposed to.
Another concern were Renold’s formed intervals (fifths) appearing at A♯ and B. When
using C4=261,63Hz as the reference pitch, these both A♯ and B end up with different
frequencies in the two tuning systems. To make the tonality comparison equally objective as
with C and F#, the Renold 1 scale was again transposed to match the 12-TET scale, but in this
11 Scala is a software tool for experimentation with musical tunings (http://www.huygens-fokker.org/scala).

59
case tuning A♯ according to A♯4 = 466,16Hz, and B according to B4= 493,88Hz. Despite
these adjustment, the frequency relationships within the scales remained untouched so that
both tuning systems would still had their own characteristic differences. An example of
Logic’s tuning table for formed intervals in A♯ is shown in Figure 10.
FIGURE 10. Renold 1 formed tuning table for root pitch A#/Bb.
Stimuli were eventually based on four different root pitch classes: C, F♯/G♭ , A♯/B♭ and
B, on the pitch range A♯3–B4. Reasoning for using these particular pitches was the
following:
- C: because of its commonness in use with piano and music in general.
- F♯/G♭ : with the C, this is the only pitch/interval that is shared between the 12-TET
and Renold 1 systems. Therefore, using F♯/G♭ allowed repetition of the stimuli
based on C, but on slightly different tonal range.
- A♯/B♭ : the formed fifth, which represents the most radical tonality differences
between the Renold 1 and the 12-TET, occurs between A♯–F.
- B: the formed fifth occurs also between B–F♯. Therefore, B allowed a slightly
different tonal range for examining “formed” tonality.
With the chord and sequence stimuli, these same pitch classes and tuning procedures were
applied. Regarding the tonality choices, the focus was set on major and minor chords, but also
minor seventh (m7) and major seventh (M7) were applied.
In addition to the 12-TET and Renold 1 tuning stimuli, also a third stimulus type, “X”, were
used. These implemented the same musical content, but were deliberately made to sound
overtly out-of-tune. The rationale behind this was that, due to the very small differences
between 12-TET and Renold systems, the experiment could become too exhaustive.
Therefore, the X samples provided one over easy answering options, which would make the
participants feel that the experiment is not too difficult and they could hear at least some
obvious differences. There was no standard pattern for creating these stimuli, but any tuning

60
alterations were allowed as long as the end result was just sounded “wrong”, or out of tune,
but still somehow resembled the properly tuned version so that it could be perceived as the
same interval albeit heavily mistuned. An example of stimulus X tuning table is presented in
Figure 11.
FIGURE 11. Stimulus X tuning table example.
4.3 Design
The experiment interface was designed with Max/MSP 7 visual programming software. Each
part of the experiment had its own program patch, which included necessary instructions and
controls for stimuli playback. Altogether the listening experiment comprised of the following
stages:
1. Just noticeable frequency differences
2. Tonality evaluation of musical intervals.
3. Tonality evaluation of chords and simple musical sequences.
4. Background questionnaire.
Before the experiment each participant was given a short introduction about its overall
structure and were explained the basic idea of choosing the sample they perceived as more
“out of tune” sounding. Participants were instructed to concentrate the best they possibly
could on the listening tasks, and were advised to focus on the overall euphoniousness or
feeling of the stimuli, and make their judgment based on that, i.e. not necessarily on what
should be “right” or “wrong”. Any more detailed information about the purposes of the
research was not revealed until the participant had completed the experiment.
The experiment started with a listening volume level setup, where a short musical excerpt was
played and the participant could adjust the headphone volume to a comfortable level.
Headphone volume could be adjusted freely also later in the experiment, if needed.

61
In part 1 the stimuli included two successive grand piano tones at pitch C4 (f=261,63Hz),
with one of the tones being altered in its frequency (Δf). The task was to distinguish whether
the two tones were same of different in frequency and reply accordingly. Applied frequency
differences between the tones were of same magnitude as the differences found between the
12-TET and Renold 1 pitches, i.e. the variance was between ca. 2 to 10 cents. In addition, two
samples with presumably more obvious differences were added. Stimuli with ±12 and ±24
cent differences were included to provide “over easy” options, which should be
distinguishable by most people. Each frequency difference was presented twice, applying
both higher and lower difference pitches in relation to the reference frequency. An exception
was the smallest, ±1,955 cents difference stimulus, which was presented four times. This was
done to check for consistency in participants’ evaluation with such a small frequency
deviation. Details of the 18 stimuli are presented in Table 22 and Appendix A. In the
experiment the stimuli order was randomized and participants could replay the samples as
many times as they wanted.
Experiment part 1 was inspired by the just noticeable difference test available at the Davidson
College Department of Physics website12 with the exception that instead of using pure tones,
this experiment applied complex tones (virtual piano samples). The aim was simply to
examine, whether such minor frequency differences would be perceivable in a single note
comparison.
In parts 2 and 3 participants were presented with stimulus pairs (Sample A & Sample B), of
which both samples had same musical content, but applied different tuning systems. The task
was to listen and evaluate the stimuli, and then choose the more “out of tune”, or the less
euphonious sounding sample. Inversely this judgment would yield participant’s truly
preferred tonality. Both parts were similar in their execution, only the stimuli content was
different. In the part 2 the focus was on musical intervals, while in part 3 the stimuli
comprised of chords and simple musical sequences. Total number of auditioned stimulus pairs
in part 2 was 56, and 68 in part 3 (see Appendix B and Appendix C for details). Each time
when presented with a new stimulus pair, participants were automatically force-played both
samples in order to have the them listen to them at least once, and to prevent them from
12 http://www.phy.davidson.edu/fachome/dmb/soundrm/jnd/jnd.html

62
skipping the samples altogether. Samples could be replayed as many times as needed after the
initial round. Both the stimulus order and the order of the samples A and B were randomized
throughout the experiment.
This tonality preference evaluation was inspired by the study conducted by Hahn & Vitouch
(2002), who used A/B comparison and force choice method on their study about different
tuning systems. This previous experiment applied a variety of different instrument timbres
and also included longer musical passages. However, in the present experiment only one
instrument timbre (grand piano) was used and the main focus was set on intervals and chords.
Overall aim was to have the experiment fast paced and not too exhaustive and target duration
was set to approximately 30 minutes. Regardless of the rather large number of stimuli, this
was possible, because the duration of single stimulus was very short. So even if a participant
listened the samples multiple times, the target duration would still be reached.
The fourth part of the experiment was an anonymous background questionnaire. See
Appendix D for details.
4.4 Pilot
The listening experiment was piloted once before the actual data collection. Based on the
received feedback, a few modifications were made to the design. The initial idea was to have
the participants evaluate the stimuli according to what they perceived as being more “in tune”.
This question was however rephrased and turned around and eventually participants were
asked to evaluate their perception for the more “out of tune” sounding stimuli. The thought
behind this was that it would be easier for people to act as critics and judge what is “worse”,
rather that ask them to define perfection.
Another significant modification was the addition of “X” stimuli, i.e. the obviously mistuned
samples. The pilot experiment proved that the experiment could become too exhaustive, due
to the very small tonal differences that could be in some cases very challenging, or nearly
impossible to discern. Hence, the third, “over easy” stimulus variant was added to make
participants feel that they could at least hear some clear differences and would possibly be
better motivated to carry on with the experiment.

63
5 RESULTS
5.1 Experiment part 1
A just noticeable difference in frequency test presented participants with 18 stimuli, with
which the frequency differences between the reference frequency (261,63Hz) and the
difference frequency varied between ±2 to ±24 cents (see Appendix A for details). Overall
57,4% of the stimuli were evaluated correctly (see Table 23) and as hypothesized, the general
ability to perceive the tones as different increased as the frequency difference between the
tones increased. Figure 12 and Table 24 show the correct recognition percentage and
evaluation consistency13 separately for each stimulus type.
TABLE 23. Part 1 overall results.
Participants’ evaluations Stimuli (n) Stimuli (%)
Correct 351 57,4
Incorrect 261 42,6
Total 612 100
FIGURE 12. Experiment part 1 frequency evaluation.
13 Evaluation consistency rating is the amount (%) of participants who were able to provide consistently correct
judgments, i.e. with every presented stimulus.

64
TABLE 24. Part 1 evaluation (percentage of the participants, %).
Stimuli ±1,955 ±3,91 ±5,865 ±7,82 ±9,775 ±12 ±24
Average recognition percentage 24,3 30,9 42,6 67,6 75 79,4 98,5
+ difference (“Going sharp”) 20,6 26,5 35,3 64,7 73,5 70,6 100,0
- difference (“Going flat”) 23,5 35,3 50,0 70,6 76,5 88,2 97,1
Average evaluation consistency 0 8,8 26,5 52,9 55,9 61,8 97,1
Secondly, it was postulated that participants’ discrimination threshold would be at about ¼ of
a semitone as everyone was expected be able to distinguish the 24 cents differences. Although
the results show that the recognition percentage with the ±24 cent stimuli was not 100%, there
was only one response that did not match the criteria, and overall the number of correct
responses was significantly free from chance, (p≈0,005 < ). Hence, this hypothesis can be
considered confirmed.
It was also hypothesized that a perceptual frequency turning point would occur at 9,8 cents.
Results however show (see Table 24) that majority of the participants (ca. 68%) begun to
perceive the tones different earlier, with the ±7,82 cents stimuli. This occurred in both
directions, i.e. whether the difference pitch was higher or lower, but “going flat” (i.e.
difference frequency being lower than the reference frequency) seems to have been slightly
more easy to perceive than “going sharp” (see Table 24). To gain support for the result that
the ca. ±8 cents difference was a perceptually significant turning point, a one sample t-test
was performed against 1 (i.e. split judgment of the total of 2 stimuli). Test result (p≈0,006 <
) suggest that this was not a random occurrence (see Table 25).
TABLE. 25. Average recognition of ±7,82 cent stimuli; number of stimuli per participant.
Participants Mean Std. deviation Std. error of mean Min. Max.
34 1,35 0,77 0,13 0 2
One sample t-test
h dof t p
0,05 1 33 2,659 0,00599
Regarding the assumption that everyone would be able to recognize the ±0 cents stimuli, i.e.
when there was no difference between the tones, the hypothesis could not be confirmed.
Although the correct recognition percentage can be considered to be free of chance (p≈0,0002
< ), the overall recognition percentage was only 73,5%, with rather poor, ca. 59% judgment
consistency among the participants.

65
5.2 Experiment part 2
In part 2 participants evaluated two tuning systems by listening to 14 harmonic and 14
melodic interval pairs (see Appendix B for stimuli details) and judged their preference for the
more “out of tune” sounding stimuli. Inversely this evaluation would yield the participants’
truly preferred tuning system. The results show that ca. 64% of all stimuli were preferred in
the 12-TET tuning (see Table 26). Regarding this average, half (50%) of the participants
preferred the 12-TET tonality equally much or more. A boxplot of the preference distributions
is shown in Figure 13.
TABLE. 26. Part 2 overall tonality preferences (all stimuli included).
Tuning system Preferred stimuli
(n)
Stimuli per participant
average (n)
Overall preference
(%)
12-TET 609 17,91 64
Renold 1 343 10,91 36
Total 952 28 100
Figure 13. Experiment part 2 response distribution boxplot.
Null hypothesis postulates completely random judgments with no preference for either of the
tuning systems. For this to be true, one participant’s response should be split equally between
the two alternatives. Therefore, both tunings would be preferred 14 times from the total of 28
presented stimuli:

66
H0: µ = 14.
Alternative hypothesis (Na) postulates that the equal temperament tuning system will be
preferred more, i.e. is preferred with more than half of the 28 stimuli:
Na: µ > 14
To test the hypothesis, a one sample t-test against 14 was performed. Test results in Table 27
suggest that the null hypothesis can be rejected (p ≈ 1,25x10⁻⁹ < ) and the overall 64%
preference for the equal temperament can be considered significant.
TABLE. 27. Average preference for 12-TET; number of stimuli per participant.
Participants Mean Std. deviation Std. error of mean Min. Max.
34 17,91 2,82 0,48 12 23
One sample t-test
h dof t p Mean Diff.
0,05 14 33 8,08 1,25×10⁻⁹ 3,91
Secondly, the preferences were examined considering each stimulus pair and how participants
were distributed between the two alternatives. The null hypothesis assumes equal distribution
of participants (n=34) between the two systems:
H0: µ = 17
Alternative hypothesis (Na) postulates that the equal temperament tuning system is favored
more, i.e. is preferred by more than half of the 34 participants:
Na: µ > 17
One sample t-test performed against 17 (see Table 28) suggests that an average of 64% of
participants preferring the 12-TET tuning was indeed significant (p ≈ 0,0005 < ) and cannot
be regarded as mere random occurrence.

67
TABLE. 28. Average preference for 12-TET; participants per stimulus.
Number of stimuli Mean Std. deviation Std. error of mean Min. Max.
28 21,75 6,76 1,28 7 34
One sample t-test
h dof t p Mean Diff.
0,05 17 27 3,71 0,0005 4,75
Table 29 and Figures 14 & 15 show a more detailed presentation about the distribution of
participants’ preference ratings from certain number of stimuli. These show that no one (0%)
preferred either of the tunings exclusively, i.e. with every presented stimulus. A large
majority (ca. 85%) however preferred the equal temperament tonality most of the time, i.e.
with more than half of the presented stimuli, whereas only 3% (n=1) had an overall
preference for the Renold 1 tonality.
Table 29. Experiment part 2 tonality preferences (percentage of the participants, %).14
Stimuli Entirely
12-TET
Mostly
12-TET
Equal
preference
Mostly
Renold 1
Entirely
Renold 1
All stimuli 0 85,3 11,8 2,9 0
Harmonic intervals 0 70,6 20,6 8,8 0
Melodic intervals 0 82,4 8,8 8,8 0
12-TET vs. Renold 1 Formed 0 85,3 5,9 8,8 0
12-TET vs. Renold 1 True 0 64,7 17,6 17,6 0
Minor 3rd 5,9 50,0 32,4 17,6 0
Major 3rd 0 55,9 26,5 17,6 0
Perfect 5th 2,9 79,4 17,6 2,9 0
14 Calculations omit the minor seventh (m7) stimuli due to insufficient number of samples to allow proper
comparison with other intervals.

68
Figure 14. Tonality preference distribution (see Table 28 for details).
Figure 15. Tonality preference distribution (see Table 28 for details).
Regarding the individual interval sub-groups, only the thirds (m3, M3) show slightly more
widely spread responses, with an increase in equal preferences, but also showing a minor rise
toward Renold tuning preferences. If considering the two interval types in the Renold system,
it seems that the formed intervals have led to slightly clearer judgments, which suggests that
the tonal contrast is stronger between ET tonality and “formed” tonality

69
5.3 Experiment part 3
In the experiment part 3 stimuli consisted of chords and simple musical sequences (see
Appendix C for details). The results show that participants preference for the equal
temperament was strong, with approximately 71% of all stimuli being preferred in 12-TET
tonality (see Table 30).
TABLE. 30. Part 3 average tonality preferences (all stimuli included).
Tuning system Preferred stimuli
(n)
Stimuli per participant
average (n)
Overall preference
(%)
12-TET 821 24,15 71
Renold 1 335 9,85 29
Total 1156 34 100
Considering the average 71% preference of equal temperament, 65% of the participants
favored the 12-TET tonality equally much or more. Preference distribution boxplot is
presented in Figure 16.
Figure 16. Experiment part 3 preference distribution boxplot.
Null hypothesis postulates completely random evaluations with no preference for either of the
tunings. For this to be true, participants’ responses should be split equally between the two
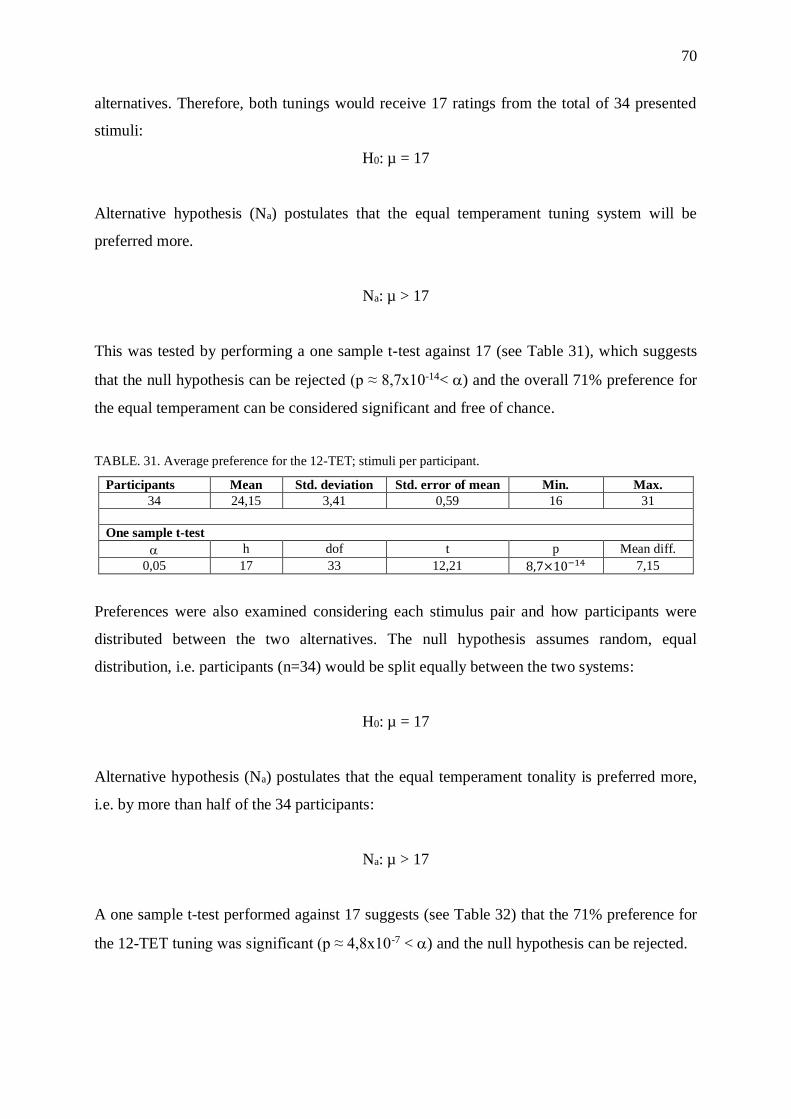
70
alternatives. Therefore, both tunings would receive 17 ratings from the total of 34 presented
stimuli:
H0: µ = 17
Alternative hypothesis (Na) postulates that the equal temperament tuning system will be
preferred more.
Na: µ > 17
This was tested by performing a one sample t-test against 17 (see Table 31), which suggests
that the null hypothesis can be rejected (p ≈ 8,7x10⁻¹⁴< ) and the overall 71% preference for
the equal temperament can be considered significant and free of chance.
TABLE. 31. Average preference for the 12-TET; stimuli per participant.
Participants Mean Std. deviation Std. error of mean Min. Max.
34 24,15 3,41 0,59 16 31
One sample t-test
h dof t p Mean diff.
0,05 17 33 12,21 8,7×10⁻¹⁴ 7,15
Preferences were also examined considering each stimulus pair and how participants were
distributed between the two alternatives. The null hypothesis assumes random, equal
distribution, i.e. participants (n=34) would be split equally between the two systems:
H0: µ = 17
Alternative hypothesis (Na) postulates that the equal temperament tonality is preferred more,
i.e. by more than half of the 34 participants:
Na: µ > 17
A one sample t-test performed against 17 suggests (see Table 32) that the 71% preference for
the 12-TET tuning was significant (p ≈ 4,8x10⁻⁷ < ) and the null hypothesis can be rejected.

71
TABLE. 32. Average preference for the 12-TET; participants per stimulus.
Number of stimuli Mean Std. deviation Std. error of mean Min. Max.
34 24,15 6,68 1,15 9 34
One sample t-test
h dof t p Mean Diff.
0,05 17 33 6,24 4,8×10⁻⁷ 7,15
Table 33 and Figures 17 & 18 show a more detailed view on the response distribution. Again,
none of the participants (0%) preferred neither of the tunings exclusively, but compared to
part 2, the preference for equal temperament tonality is even stronger, with nearly everyone,
ca. 97% preferring it over the Renold system tonality most of the time (i.e. with more than
half of the presented stimuli). Only ca. 3% showed overall preference for the Renold 1 tuning.
If considering the musically most realistic stimuli, i.e. the sequences, the results don’t really
leave room for counterarguments as the ET tonality preference in 100%.
Table 33. Distribution of tonality preferences (percentage of the participants, %).15
Stimuli type Entirely
12-TET
Mostly
12-TET
Equal
preference
Mostly
Renold 1
Entirely
Renold 1
All 0 97,1 0 2,9 0
12-TET vs. Renold 1 True 0 97,1 2,9 3,7 0
12-TET vs. Renold 1 Formed 2,9 85,3 8,8 5,9 0
Chords 0 88,2 5,9 5,9 0
Harmonic 0 79,4 11,8 8,8 0
Melodic 14,7 76,5 14,7 8,8 0
Sequences 26,5 100 0 0 0
Major triad 50 91,2 8,8 0 0
Cadence 44,1 85,3 14,7 0 0
15 Calculation omits the minor triad sequences due to insufficient number of samples to allow proper
comparison with other stimuli.

72
Figure 17. Part 3 preference distribution.
Figure 18. Part 3 preference distribution.

73
5.4 Discussion
The current study tested and confirmed the hypothesis that participants could perceive
differences between the twelve-tone equal temperament and Maria Renold’s twelve fifth-
tones tuning (Renold 1), and that ET tonality would be perceived as being more “in-tune” and
overall more preferred than the Renold 1 tonality. This assumption was based on the findings
from previous research, which suggest that intonation preferences are more determined by
learned traits and long term cultural conditioning than by any qualities of human physiology,
or mathematical/artistic correctness (Loosen, 1994,1995; Hahn & Vitouch, 2002; Kopiez,
2003; Ballard, 2011). The hypothesis was tested by carrying out a listening experiment, which
showed that an average of 67,8% of the participants preferred the 12-TET tonality with
realistic complex tone stimuli that included musical intervals, chords and simple musical
sequences.
In addition, participants’ frequency discrimination ability was tested with a just noticeable
difference in frequency test. It was hypothesized and confirmed that the ear’s discrimination
threshold would be at 24 cents. This was based on previous findings on the ear’s
discriminations threshold, which suggest that most of can recognize 10 to 30 cents differences
(Levitin, 2006) Because the participants were mainly experienced musicians, it was also
hypothesized that that majority of participants would be able to distinguish smaller, ca. 10
cents frequency differences due to enhanced auditory perception (Carey et al., 2015). This
hypothesis was also confirmed, although the actual threshold was lower at ca. 8 cents. The
third hypothesis that everyone would be able to recognize when there was no difference
between tones, could not be confirmed as only 73,5% of these stimuli were judged correctly.
5.4.1 Tonality preferences
Even though the overall tonality preferences have already shown that the equal temperament
was the more preferred tuning system, it is still worth having a more detailed look on the
preference ratings and see how these were distributed between different stimulus sub-groups.
Regarding intervals (see Table 34), it is clear that equal temperament tonality was preferred
regardless of the stimulus type and the response distribution is in fact very similar between
harmonic and melodic intervals, but also between the three interval groups separately.

74
TABLE 34. Part 2 tonality preferences (percentage of the stimuli).16
Stimuli 12-TET (%) Renold 1 (%) R1 True (%) R1 Formed (%)
All 63 37 42 34
Harmonic intervals 64 36 41 34
Melodic intervals 62 38 43 33
m3 61 39 48 31
M3 59 41 23 59
P5 69 31 51 11
There are however two occasions where preferences deviate slightly from the general pattern
as both Renold’s formed major third and true fifth have been slightly preferred over the ET
intervals. Reason for the high preference of formed major third is most likely that major third
is preferred slightly narrower compared to the 12-TET standard (400c), and therefore the
formed major third (396c) has been perceived as more pleasing. This is in line with the
previous findings that small intervals are preferred slightly narrower (Loosen, 1995; Burns,
1999), and is in fact nearly identical with the finding by Nordmark & Ternström (1996), who
discovered that the most favored size for major thirds was 395,4 cents. It is difficult to explain
this with e.g. auditory roughness as the theoretical dissonance values are almost identical
between the ET major third (0,5551) and formed M3 (0,5682). If being truly precise, the
formed interval is theoretically more dissonant of the two, but is very unlikely that such
minor, 0,01 divergence would lead to an actual perceptual difference.
With fifths, the reason for the higher preference of true fifth may be due to it being a pure,
natural fifth and therefore as consonant as a fifth can be, which is also why it has been found
to be more pleasing, or more in-tune. On the other hand, the preference distribution is so close
to 50/50 distribution that it may just as well be considered an equal, or mixed judgment. Still,
the fact that the preference for the Renold’s true fifth was slightly higher (54,4%) in harmonic
context speaks for that its pure consonant quality has indeed affected peoples’ perception
despite the very minor difference to the ET fifth. This is supported by that in melodic context
the true fifth was preferred less (48,5%). Although, by no means being strong preferences,
these still suggest that pure fifths have a certain harmonic quality that appeals to the ear, even
with people who don’t use pure intervals in practice. On the contrary, low preference on
16 Minor seventh (m7) is omitted from the calculation due to insufficient number of stimuli to be comparable
with other interval types.
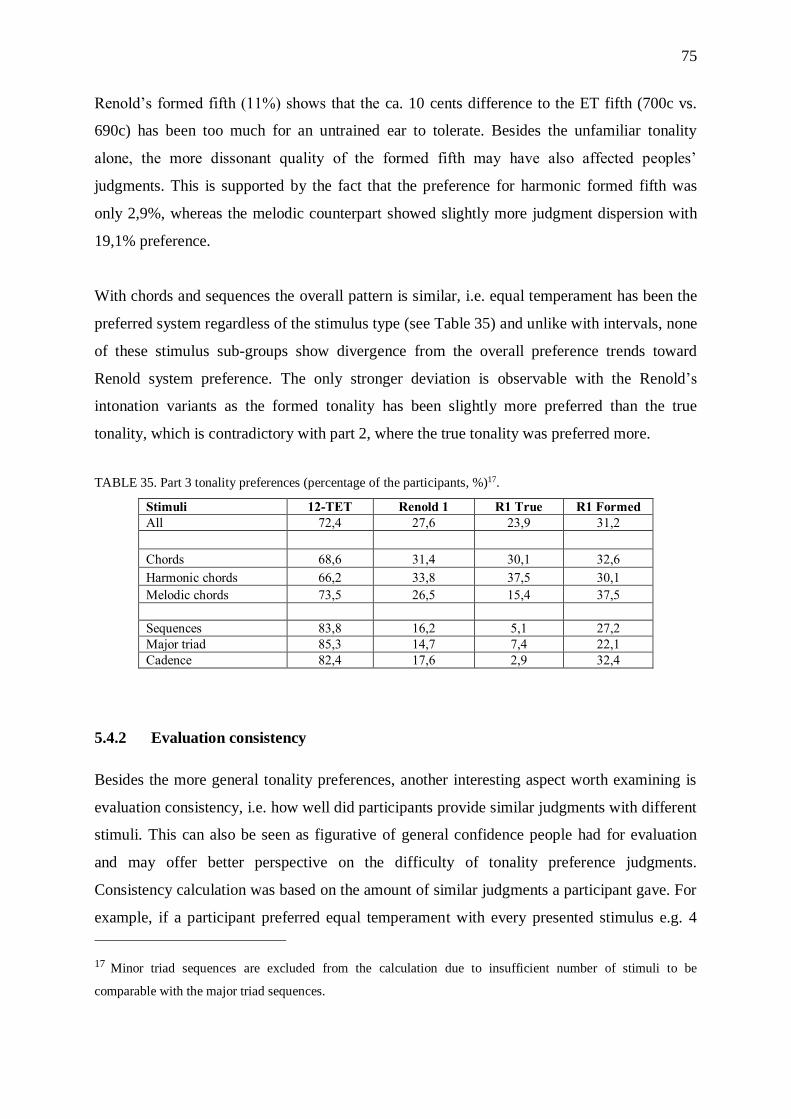
75
Renold’s formed fifth (11%) shows that the ca. 10 cents difference to the ET fifth (700c vs.
690c) has been too much for an untrained ear to tolerate. Besides the unfamiliar tonality
alone, the more dissonant quality of the formed fifth may have also affected peoples’
judgments. This is supported by the fact that the preference for harmonic formed fifth was
only 2,9%, whereas the melodic counterpart showed slightly more judgment dispersion with
19,1% preference.
With chords and sequences the overall pattern is similar, i.e. equal temperament has been the
preferred system regardless of the stimulus type (see Table 35) and unlike with intervals, none
of these stimulus sub-groups show divergence from the overall preference trends toward
Renold system preference. The only stronger deviation is observable with the Renold’s
intonation variants as the formed tonality has been slightly more preferred than the true
tonality, which is contradictory with part 2, where the true tonality was preferred more.
TABLE 35. Part 3 tonality preferences (percentage of the participants, %)17.
Stimuli 12-TET Renold 1 R1 True R1 Formed
All 72,4 27,6 23,9 31,2
Chords 68,6 31,4 30,1 32,6
Harmonic chords 66,2 33,8 37,5 30,1
Melodic chords 73,5 26,5 15,4 37,5
Sequences 83,8 16,2 5,1 27,2
Major triad 85,3 14,7 7,4 22,1
Cadence 82,4 17,6 2,9 32,4
5.4.2 Evaluation consistency
Besides the more general tonality preferences, another interesting aspect worth examining is
evaluation consistency, i.e. how well did participants provide similar judgments with different
stimuli. This can also be seen as figurative of general confidence people had for evaluation
and may offer better perspective on the difficulty of tonality preference judgments.
Consistency calculation was based on the amount of similar judgments a participant gave. For
example, if a participant preferred equal temperament with every presented stimulus e.g. 4
17 Minor triad sequences are excluded from the calculation due to insufficient number of stimuli to be
comparable with the major triad sequences.

76
times from 4 auditioned stimuli, the response was considered consistent. However, if
participant gave more than one split preferences, e.g. 2 out of 4, the response was considered
mixed. If participant preferred one stimulus in ET tonality, but another one in Renold tonality,
the overall preference was considered inconsistent.
With intervals (see Table 35) truly consistent evaluations were scarce as only two participants
provided judgments with such confidence, if considering all stimuli together. Despite that the
amount of mixed responses has been quite moderate, the inconsistent responses on the other
hand are very pronounced as nearly three-fourths (73,5%) of the participants changed their
preference two times or more between stimuli. With chords and sequences (see Table 37),
consistency shows slight increase, which suggests that the musically more complex stimuli
have been easier to judge. This is especially clear with the sequence stimuli, which show very
high confidence levels as separate stimulus groups (ca. 91% with major triads, ca. 85% with
cadences). However, the overall amount of inconsistent responses is still very pronounced (ca.
68%), which means that participants’ preferences have again varied a lot between different
stimulus types.
TABLE 36. Part 2 preference consistency (percentage of participants, %).
Stimulus 12-TET Mixed18 Renold 1 Inconsistent19 Mixed + Inconsistent
All 5,9 20,6 0 73,5 94,1
m3 14,7 38,2 0 47,1 85,3
M3 11,8 35,3 0 52,9 88,2
P5 20,6 35,3 0 44,1 79,4
Harmonic 0 26,5 0 73,5 100
Melodic 2,9 44,1 0 52,9 97
12-TET vs. R1 True 32,4 17,6 0 44,1 61,7
12-TET vs. R1 Formed 5,9 17,6 0 76,5 94,1
18 Response was considered mixed, if participant gave unexlusive judgment more than once.
19 Response was considered inconsistent, if participant showed conflicting preferences, i.e. preferring 12-TET
with one stimulus, Renold 1 with another.

77
TABLE 37. Part 3 preference consistency (percentage of participants, %)
Stimulus 12-TET
Mixed Renold 1
Inconsistent Mixed +
Inconsistent
All 20,6 11,8 0 67,6 79,4
Chords (all) 0 35,3 0 64,7 100
Chords, harmonic 26,5 23,5 0 50 73,5
Chords, melodic 41,2 26,5 0 32,4 58,9
Sequences (all) 55,8 29,4 0 14,7 44,1
Major triad 91,2 5,9 0 2,9 8,8
Cadence 85,3 2,9 0 11,8 14,7
12-TET vs. R1 True 47,1 8,8 0 44,1 52,9
12-TET vs. R1 Formed 26,5 50 0 23,5 73,5
Even though the results show clearly that participants have preferred the 12-TET tonality
more, the overall large amount of mixed/inconsistent responses means that providing solid
preference judgments has been a difficult task and preferences tend to vary greatly depending
on the stimuli. This occurs between individuals and within individuals and thereby person’s
intonation preference with e.g. major thirds implies preferences only with that particular
stimulus and can’t be used for predicting preferences with any other stimuli type. This
behavior is in line with the notions that people can perceive intonation differences, but the
number of people, who can provide confident evaluations about what they perceive as better
or worse, is considerably less (O’Keeffe, 1975; Geringer, 1976; Madsen & Geringer, 1981;
Hahn & Vitouch, 2002).
5.4.3 Aural genuineness
Regarding Renold’s aural genuineness claims of her tuning system the results found no proof
of and hence confirm the hypothesis that no evidence of such phenomenon will be discovered.
For this to have been true, the Renold intonation should have been consistently the more
preferred system, which however did not happen. Also the fact that Renold’s formed fifths,
which pose one of the most radical tonal differences between the scales, were considerably
less favored than the 12-TET fifths is enough to discredit the assumption of aural
genuineness.

78
5.4.4 Just noticeable frequency differences
Participants’ frequency discrimination abilities can be considered to follow general JND(f)
definitions rather well. The fact that everyone was able to distinguish the ±24 cents difference
is in agreement with the 1/30 of the critical bandwidth rule (Rossing et al., 2002; Heller,
2013), according to which the JND(f) would be about 3 Hz (ca. 20 cents). As most of the
participants were experienced musicians, it can be expected that their discrimination threshold
would actually lower than this. This is also hinted by the fact that the majority (ca. 68%) of
the participants were able to discern as small as 7,82 cents differences. Hence, these results
can be considered to be in line with the findings from previous research that musicians have
developed a more accurate ear for detecting minor frequency differences as musical training
has enhanced their auditory perception (Akin & Belgin, 2009; Carey et al. 2015).
Although the results seem to support also Sethares’ (2005) notion that “JND can go low as
two or three cents” (p. 44), it is nevertheless clear that the stimuli with very small differences
to the reference frequency (i.e. ±2 to ±6 cents) were overall most difficult to evaluate as the
recognition percentage was below 50% and decreased the smaller the frequency difference
was. Besides, none (0%) of the participants were able to judge the ±2 cents difference stimuli
consistently, which suggest that this magnitude differences were too small for making proper
judgments and the role of chance has been high. A sign of randomness was that many
participants could recognize e.g. the smallest difference (±2 cents), but not the larger ones (±
6 cents), or vice versa. Hence it is likely that many of these evaluations were based more on
guessing rather than actually hearing the differences.
Besides this, other odd behavior in responses was that sometimes participants were not able to
perceive an “easy” stimulus correctly, i.e. one with large difference (±12 or ±24 cents), but
still showed ability to recognize some of the much smaller differences. This may have been
due to experiment design and stimuli randomization. If a participant was first tested with an
“easy” stimulus, i.e. one of the ±12 or ±24 cents difference samples, but he/she was expecting
to hear much larger differences (e.g. a semitone), then even these supposedly easy stimuli
could become judged as “same”. Conversely, if one gets to evaluate the more difficult
samples first (i.e. one with very small frequency differences), the larger differences are most
likely easier to perceive once they appear due to larger contrast.

79
5.4.5 Enculturation affects
Even though this study has shown that a group of 34 participants had a strong preference for
the 12-TET tonality, one must understand that this tonality comparison was far from being
objective and there was in fact an enormous cultural bias present toward the equal
temperament tonality. To expect any alternative tuning system, that none of the participants
has ever heard of, to be found better than a tonality that has dominated our culture for last 100
years, can be considered one overtly ambitious and idealistic assumption. Or would at least
require some sort of semi-miraculous manifestation of aural genuineness to take place. One
must simply face it; it won’t happen.
Besides being a problem with the current study, this is a problem that can be considered to be
a fundamental issue with any perceptual intonation experiment. It is nearly impossible to
reach the level of objectivity that would be required to gain truly meaningful results, because
whatever alternative tonality is used, it will never be on the same start line with the equal
temperament as every one of us is encultured to hear music and tonal relationships in a certain
way and it is quite impossible to suddenly bypass this conditioning. However, whether the
cultural conditioning could be diminished somehow, is worth considering. Overcoming this
problem would require some sort of counter enculturation process before the data collection,
i.e. people should be exposed to the alternative tonality (whatever that is) and have them
become familiar with its qualities.
There are basically two ways to try this. If the participants are musicians, they should be
given a possibility to rehearse and perform with an instrument that is tuned according to the
standards of the alternative tuning. Or, if the participants are non-musicians, they should be
offered music to listen to that uses the alternative tuning system of interest. The
familiarization period should be also quite extensive (e.g. a month) to allow people to really
get used to the alternative tonality. In practice this would also require a highly dedicated
group of participants and no one outside the group would be able to participate to the
experiment. All of these considerations are admittedly very idealistic and would be rather
difficult to carry out without having the entire experiment procedure to become unnecessarily
extensive and cumbersome. In any case, for any future research approaches, the reduction of

80
enculturation affects should be the number one priority. Without this, it is impossible to gain
truly valuable results.
5.4.6 Methodology and design
Overall designing the listening experiment was an interesting task, but very challenging
regarding how much stimulus content (i.e. musical variation) could be included. Although
much thought and care was put in building the stimulus set, in retrospect there was maybe too
much musical variation included. With little less realistic musical validity, the stimuli could
have been more included more repetition and this way could have been more focused.
Alternatively, the researcher should have just allowed the experiment to become longer,
instead of clinging on to the target duration of 30 minutes. Also, more care should have been
taken about the stimulus content in that there would have been equal number of stimuli in the
different tonalities. Now certain stimuli had to be left out from the analysis due not having a
proper number of equivalents in all tonality variations.
The JND test could have been improved just by having more stimuli; at least four samples for
each frequency difference. Although this was not the main focus of the study, it still would
have provided more reliable overall results. Another improvement would have been to include
few trial stimuli before the actual experiment stimuli. This would have given participants a
better idea of what kind of tonal differences they were expected to judge and could have
possibly led to more accurate results.
In general, the experiment design can be considered successful in that it was simple and
straightforward and from technical point of view, none of the participants reported having
trouble carrying out the experiment. Majority of participants (67,6%) found did not find the
overall difficulty level to be either too easy or too difficult, but in between. Several
participants also found the experiment as fun and interesting to do and people were mainly
able to complete the test in 25 to 35 minutes. This fulfilled the objective of not having too
long and exhaustive.
Considering the research methodology used in this study, the principal issue was general lack
of vision regarding the data collection method and analysis. The choice of AB comparison
81
test was made solely on basis of previous research by Hahn & Vitouch (2002), who carried
out a similar experiment. There is however not much proof about the scientific validity of AB
testing and this caused a lot of doubt in how the data should be analyzed in best possible way.
Having included some additional questionnaire in combination with the stimulus comparison
could have be beneficial in finding out why people made their choices. Were their decisions
based on really hearing the differences, or just on guessing, or did the samples have some
particular tonal character, e.g. brightness, openness, clarity. Overall the analysis part lacked in
general vision from researcher’s part and may be considered the weak point of the study.
5.5 Conclusions
This study examined the perceived differences between two tuning systems, the standard
twelve-tone equal temperament and Maria Renold’s twelve fifth-tones tuning. Although the
results from listening experiment suggest that people were able to differentiate between these
two tonalities and that equal temperament tonality was strongly more preferred, it must be
acknowledged that this experiment did not reach the level of objectivity that would have been
be required to achieve truly adequate results. The reason for this is that there is too much
cultural bias toward equal temperament tonality.
Hence, it may be concluded that people who participated in the experiment were (1) able to
perceive differences between musical stimuli that applied different tuning standards and (2)
had a strong preference for the tonality that was more familiar to them. However, did it really
prove that one system is better over the other? Not really. To prove the superiority of one
tuning system over another would require a long term practical use of both tuning methods
and active comparison of their qualities. And as it has been shown with e.g. equal
temperament, this process that can take centuries. Thus, the question, whether the scale of
twelve true fifths could challenge equal temperament must left unanswered, because making
such conclusion based on single perceptual experiment is not feasible.
Despite having few apparent design flaws, this study has nevertheless helped in filling a small
uncovered gap in intonation research, but has also brought up the complexities that one faces
when arranging tonality preference experiments.

82
REFERENCES
Akin, O. & Belgin, E. (2009). Hearing characteristics and frequency discrimination ability in
musicians and nonmusicians. The Journal of International Advanced Otology, 5 (2), 195-202.
Retrieved from http://advancedotology.org/sayilar/67/buyuk/Akin1.pdf
Arthurs, Y. & Timmers, R. (2013). Evaluating the Consonance and Pleasantness of Triads in
Different Musical Context. In: Proceedings of the 3rd International Conference on Music &
Emotion (ICME3), Jyväskylä, Finland, 11th - 15th June 2013. Geoff Luck & Olivier Brabant
(Eds.). University of Jyväskylä, Department of Music.
Retrieved from https://jyx.jyu.fi/dspace/handle/123456789/41641
Ballard, D. (2011). Relationships Between College-level Wind Instrumentalists' Achievement
in Intonation Perception and Performance. Bulletin of the Council for Research in Music
Education, (187), 19-32. Retrieved from http://www.jstor.org/stable/41162321
Barbour, J. M. (1938). Just intonation confuted. Music & Letters, Vol. 19, No. 1, 48-60.
Barbour, J. M. (1951). Tuning and temperament – A historical survey. East Lansing:
Michigan College Press. Retrieved from https://archive.org/details/tuningtemperamen00barb
Burkholder, J. P., Grout, D. J., & Palisca, C. V. (2010). A history of Western music.
Burns, E. M. (1999). Intervals, scales and tuning. In Diana Deutsch (Ed.), Psychology of
Music, 2nd edition. Academic Press.
Cantrell, D. W. (2003). Pythagorean means. MathWorld - A Wolfram Web Resource.
Retrieved from http://mathworld.wolfram.com/PythagoreanMeans.html

83
Carey, D., Rosen, S., Krishnan, S., Pearce, M.T., Shepherd, A., Aydelott, J., & Dick, F.
(2015). Generality and specificity in the effects of musical expertise on perception and
cognition. Cognition, 137 (2015), 81-105. Retrieved from http://music-
cognition.eecs.qmul.ac.uk/papers/CareyEtAl2015.pdf
Cheveigné, A. (2004). Pitch perception models. Draft. Retrieved from
http://citeseerx.ist.psu.edu/viewdoc/download?doi=10.1.1.97.4819&rep=rep1&type=pdf
Doty, D. B. (2002). The Just intonation primer – An introduction to the theory and practice of
Just intonation, (3rd Edition). The Just Intonation Network. A Project of Other Music, Inc.
San Francisco. Retrieved from http://www.dbdoty.com/Words/primersample.pdf
Duffin, R. W. (2007). How equal temperament ruined harmony (And why you should care).
New York: W.W.Norton & Company.
Grenfell, M. T. (2005). The development of the equal temperament scale – Evolution or
radical change? Master’s Thesis. The Faculty Of Western Connecticut State University,
Department of Mathematics, Danbury, Connecticut.
Retrieved from http://grenfellmusic.net:8184/pdf/thesis.pdf.
Hagerman, B. & Sundberg, J. (1980). Fundamental frequency adjustment in barbershop
singing. STL-QPSR, Volume 21, No. 1, 28-42. Retrieved from
http://www.speech.kth.se/prod/publications/files/qpsr/1980/1980_21_1_028-042.pdf
Heller, E. J. (2013). Why you hear what you hear. Princeton University Press. Retrieved from
http://www.pearl-
hifi.com/06_Lit_Archive/14_Books_Tech_Papers/Heller_Eric/Why_You_Hear_What_You_
Hear/Why_You_Hear_What_You_Hear.pdf
Von Helmholtz, H. L. F. (1895/1912) On the sensations of tone as a psychological basis for
the theory of music, 3rd English edition, A. J. Ellis Transl. Longmans, Green, And Co.
Retrieved from https://archive.org/details/onsensationsofto00helmrich

84
Hall, D. E. & Hess, J. T. (1984). Perception of musical interval tuning. Music Perception,
Vol. 2, No. 2, 166-195. Retrieved from
http://search.proquest.com/docview/740664037/fulltextPDF/1F95D78893384CE1PQ
Howard, D. M. (2007a). Equal or non-equal temperament in a capella SATB singing. In
Logopedics Phoniatrics Vocology, DOI: 10.1080/14015430600865607. Retrieved from
https://www.researchgate.net/publication/6223729_Equal_or_non-
equal_temperament_in_a_capella_SATB_singing
Howard, D. M. (2007b). Intonation drift in capella soprano, alto, tenor, bass quartet singing
with key modulation. Journal of Voice 21(3), 300-315. Retrieved from
https://www.researchgate.net/publication/7251778_Intonation_Drift_in_A_Capella_Soprano_
Alto_Tenor_Bass_Quartet_Singing_With_Key_Modulation
Jers, H. & Ternström. S. (2005). Intonation analysis of a multi-channel choir recording. TMH-
QPSR, KTH, Volume 47/2005. Retrieved from
http://www.speech.kth.se/prod/publications/files/qpsr/2005/2005_47_1_001-006.pdf
Jorgensen, O. (2009). About the temperament used by J.S. Bach and others.
Retrieved from http://tunersart.com/jorgensenontemperament.pdf
Kameoka, A. & Kuriyagawa, M. (1969a). Consonance theory part I: Consonance of dyads.
The Journal of Acoustical Society of America, 45(6), 1451-1459.
Kameoka, A. & Kuriyagawa, M. (1969b). Consonance theory part II: Consonance of complex
tones and its calculation method. The Journal of Acoustical Society of America, 45(6), 1460-
1469.
Karrick, B. (1998). An Examination of the Intonation Tendencies of Wind Instrumentalists
Based on Their Performance of Selected Harmonic Musical Intervals. Journal of Research in
Music Education, Vol. 46, No. 1, 112-127. Retrieved from
https://www.jstor.org/stable/3345764
85
Kopiez, R. (2003). Intonation of harmonic intervals: Adaptability of expert musicians to equal
temperament and Just intonation. Music Perception, Vol. 20, No. 4, 383-410. Retrieved from
http://www.biophysics.uwa.edu.au/acoustics/pdf/Kopiez-Intonation-MP2003.pdf
Krumhansl, C. L. (2000). Rhythm and pitch in music cognition. Psychological Bulletin Vol.
126, No. 1, 159-179. American Psychological Association, Inc. Retrieved from
http://www.brainmusic.org/EducationalActivities/Krumhansl_rhythm2000.pdf
Lartillot, O. (2014). MIRtoolbox 1.6.1 user’s manual. Aalborg University, Denmark.
Retrieved from
https://www.jyu.fi/hum/laitokset/musiikki/en/research/coe/materials/mirtoolbox/MIRtoolbox1
.6.1guide
Lartillot, O. & Toiviainen, P. (2007). A matlab toolbox for musical feature extraction from
audio. In: Proceedings of the 10th International Conference on Digital Audio Effects (DAFx-
07). Retrieved from http://dafx.labri.fr/main/papers/p237.pdf
Levelt, W. J. M., van de Geer, J. P. & Plomp, R. (1966). Triadic comparisons of musical
intervals. The British Journal of Mathematical and Statistical Psychology, Vol. 19, Part 2,
163-179. Retrieved from
http://pubman.mpdl.mpg.de/pubman/item/escidoc:66403/component/escidoc:468043/Levelt_
Triadic_1966.pdf
Levitin, D. J. (2006). This is your brain on music – The science of a human obsession. Plume,
Penguin Group USA.
Lindqvist-Gauffin, J. & Sundberg, J. (1971). Octaves and pitch. STL-QPSR, 12(1), 51-67.
Retrieved from http://www.speech.kth.se/prod/publications/files/qpsr/1971/1971_12_1_051-
067.pdf

86
Loosen, F. (1994). Tuning of diatonic scales by violinists, pianists, and nonmusicians.
Perception & Psychophysics, 56 (2), 221-226. Psychonomic Society. Retrieved from
https://www.researchgate.net/publication/225450384_Tuning_of_diatonic_scales_by_violinis
ts_pianists_and_nonmusicians
Loosen, F. (1995). The effect of musical experience on the conception of accurate tuning.
Music Perception Vol. 12, No 3, 291-306. University of California Press. Retrieved from
http://www.jstor.org/stable/40286185
Madsen, C. K. & Geringer, J. M. (1981). Discrimination between tone quality and intonation
in unaccompanied flute/oboe duets. Journal of Research in Music Education, Vol. 29, No. 4,
305-313. Retrieved from https://www.jstor.org/stable/3345006
Mason, J. A. (1960). Comparison of solo and ensemble performances with reference to
Pythagorean, Just, and Equi-Tempered intonations. Journal of Research in Music Education,
Vol. 8, No. 1, 31-38. Sage Publications Inc. Retrieved from
http://www.jstor.org/stable/pdf/3344235.pdf
Nordmark, J. & Ternström, S. (1996). Intonation preferences for major thirds with
non-beating ensemble sounds. In TMH-QPSR, KTH, Vol. 37, No. 1, 57-62. Retrieved from
https://www.researchgate.net/publication/251783070_Intonation_preferences_for_major_thir
ds_with_non-beating_ensemble_sounds
O’Keeffe, V. (1975). Psychophysical preference for harmonized musical passages in the just
and equal temperament systems. Perceptual and Motor Skills, 40, 192-194. Retrieved from
http://thirdworld.nl/psychophysical-preference-for-harmonized-musical-passages-in-the-just-
and-equal-tempered-systems
Oxenham, A. J. (2012). Pitch Perception. The Journal of Neuroscience 32 (39), 13335 –
13338. Retrieved from http://www.jneurosci.org/content/32/39/13335.full.pdf+html.
Oxenham, A. J. (2013). The perception of musical tones. In Diana Deutsch (Ed.), Psychology
of Music, 3rd edition. Academic Press.

87
Parncutt, R. (1989). Harmony: A psychoacoustical approach. Berlin: Springer-Verlag.
Retrieved from https://books.google.fi/
Partch, H. (1974). Genesis of a music, second edition, enlarged. Da Capo Press, New York.
Platt, J. R. & Racine, R. J. (1985). Effect of frequency, timbre, experience, and feedback on
musical tuning skills. Perception & Psychophysics, 38 (6), 543-553.
Retrieved from http://link.springer.com/article/10.3758%2FBF03207064
Plomp, R. & Levelt, W. J. M. (1965). Tonal consonance and critical bandwidth. Journal of
Acoustic Society of America 38, 548-560. Retrieved from
http://www.mpi.nl/world/materials/publications/levelt/Plomp_Levelt_Tonal_1965.pdf
Plomp, R. (1968). Pitch, timbre, and hearing theory. International Journal of Audiology, Vol.
7, No 3, 322-344. Retrieved from http://www.isa-audiology.org/periodicals/1962-
1970_International_Audiology/InternatAudio,%20%20Vol.%207,%20%201968/No.%203%2
0%28229-374%29/Plomp,%20%20InternatAudio,%20%201968.pdf
Rakowski, A. (1985). The Perception of Musical Intervals by Music Students. Bulletin of the
Council for Research in Music Education. No. 85, 175-186. University of Illinois Press.
Retrieved from http://www.jstor.org/stable/40317954
Renold. M. (2004). Intervals, scales, tones and the concert pitch C = 128 Hz., B. Stevens
Transl., Temple Lodge Publishing.
Rossing, T., Moore, F. & Wheeler, P. (2002). The science of sound, 3rd edition. San
Francisco: Pearson Education Inc., Addison Wesley.
Schellenberg, E. G. & Trehub, S. E. (1996). Natural musical intervals: Evidence from infant
listeners. Psychological Science, Vol. 7, No. 5, 272-277. Retrieved from
http://pss.sagepub.com/content/7/5/272.full.pdf

88
Sengpielaudio (2015). Conversion of intervals: Frequency ratio to cents and cents to
frequency ratios. Retrieved from http://www.sengpielaudio.com/calculator-centsratio.htm
Sethares, W. A. (2005). Tuning, timbre, spectrum, scale, 2nd Edition. New York: Springer.
Retreived from http://www.pearl-
hifi.com/06_Lit_Archive/14_Books_Tech_Papers/Sethares_William/Tuning_Timbre_Spectru
m_Scale.pdf
Siegel, J. A. & Siegel, W. (1977). Absolute identification of notes and intervals by musicians.
Perception & Psychophysics, Vol. 21 (2), 143-152. Retrieved from
http://link.springer.com/article/10.3758/BF03198717
Steck., D. A. (2015). Musical temperament. Oregon Center for Optics and Department of
Physics, University of Oregon. Retrieved from http://atomoptics-
nas.uoregon.edu/~dsteck/teaching/temperament/temperament.pdf
Stevens, C. (2004). Cross-cultural studies of musical pitch and time. Acoustical Science &
Technology, Vol. 25, No. 6., 433-438. Retrieved from
https://www.jstage.jst.go.jp/article/ast/25/6/25_6_433/_pdf
Terhardt. E. (1974). Pitch, consonance, and harmony. Journal of the Acoustical Society of
America, 55, 1061.
Terhardt. E. (1978). Psychoacoustic evaluation of musical sounds. Perception &
Psychophysics, 23 (6), 483-492. Retrieved from
http://link.springer.com/article/10.3758/BF03199523
Terhardt. E. (1984). The Concept of Musical Consonance: A Link between Music and
Psychoacoustics. Music Perception: An Interdisciplinary Journal, Vol. 1 No. 3, 276-295.
University of California Press. Retrieved from http://www.jstor.org/stable/40285261
Thompson, W. F. (2013). Intervals and scales. In Diana Deutsch (Ed.), Psychology of Music,
3rd edition. Academic Press.

89
van de Geer, J. P., Levelt, W. J. M. & Plomp, R. (1962). The connotation of musical
consonance. Institute for perception RVO-TNO, Soesterberg, The Netherlands. Retrieved
from http://www.mpi.nl/world/materials/publications/Levelt/Geer_Levelt1962.pdf
Vassilakis, P. N. (2001). Perceptual and physical properties of amplitude fluctuation and
their musical significance. Doctoral dissertation, University of California, Los Angeles.
Retrieved from http://www.acousticslab.org/papers/VassilakisP2001Dissertation.pdf
Vos, J. (1982). The perception of pure and mistuned musical fifths and major thirds:
Thresholds for discrimination, beats, and identification. Perception & Psychophysics, 32 (4),
297-313. Retrieved from http://link.springer.com/article/10.3758/BF03206236
Vos, J. (1984). Spectral effects in the perception of pure and tempered intervals:
Discrimination and beats. Perception & Psychophysics, 35 (2), 173-185. Retrieved from
http://link.springer.com/article/10.3758/BF03203897
Vos, J. (1986). Purity ratings of tempered fifths and major thirds. Music Perception, Vol 3.,
No. 3, 221-258. Retrieved from
http://search.proquest.com/docview/740665469/fulltextPDF/637900CD78ED4EB2PQ
Vos, J. & van Vianen, B. G. (1985a). Thresholds for discrimination between pure and
tempered intervals: The relevance of nearly coinciding harmonics. The Journal of the
Acoustical Society of America, Vol. 77, 176-187. Retrieved from
http://www.vosanr.com/images/stories/downloads/jasa_77_176_1985.pdf
Vos, J. & van Vianen, B. G. (1985b). The effect of fundamental frequency on the
discriminability between pure and tempered fifths and major thirds. Perception &
Psychophysics, 37, 507-514. Retrieved from
http://www.vosanr.com/images/stories/downloads/pp1985vosvanvianen.pdf
Vurma, A. & Ross, J. (2006). Production and perception of musical intervals. Music
Perception, Volume 23, Issue 4, 331-344. Retrieved from
www.jstor.org/stable/10.1525/mp.2006.23.4.331

90
White, W. B. (1917). Modern piano tuning and allied arts. New York: Edward Lyman Bill,
Inc. Retrieved from http://www.mmdigest.com/Smythe/Piano_Tuning_and_Allied_Arts.pdf
Wollenberg. S. (2006). Music and mathematics: An overview. In John F., Raymond F., Robin
W. (Eds.) Music and Mathematics – From Pythagoras to Fractals. Oxford University Press.
Retrieved from http://academic.evergreen.edu/curricular/mmm/documents/Fauvel1.pdf
Wright, D. (2009). Mathematics and music. Department of Mathematics, Washington
University, St. Louis. Retrieved from
http://www.math.wustl.edu/~wright/Math109/00Book.pdf
Yasser, J. (1953). A letter from Arnold Schoenberg. Journal of the American Musicological
Society, Vol. 6, No. 1, 53-62. University of California Press on behalf of the American
Musicological Society. Retrieved from http://www.jstor.org/stable/829999
Yost, W. A. (2009). Pitch perception. Attention, Perception & Psychophysics 71 (8), 1701 –
1715. The Psychonomic Society, Inc. Retrieved from
http://www.utdallas.edu/~assmann/hcs6367/yost09.pdf
Zwicker, E., Flottorp, G. & Stevens, S. S. (1957). Critical bandwidth in loudness summation.
The Journal of the Acoustic Society of America 29 (5). Retrieved from
http://www.ee.columbia.edu/~dpwe/e6820/papers/ZwicFS57-crband.pdf
Zwicker, E. & Fastl, H. (2007). Psychoacoustics: Fact and models, 3rd edition. Springer-
Verlag Berlin Heidelberg, 1990, 1999, 2007. Retrieved from
http://zhenilo.narod.ru/new_main/students/Zwicker_Fastl.pdf

91
APPENDICES
Appendix A
Stimulus Reference tone, f (Hz) Difference tone, Δf (±cents)
P1-01 261,63 ±0
P1-02 261,63 +1,955
P1-03 261,63 +3,910
P1-04 261,63 +5,865
P1-05 261,63 +7,820
P1-06 261,63 +9,775
P1-07 261,63 +12
P1-08 261,63 +24
P1-09 261,63 ±0
P1-10 261,63 -1,955
P1-11 261,63 -3,910
P1-12 261,63 -5,865
P1-13 261,63 -7,820
P1-14 261,63 -9,775
P1-15 261,63 -12
P1-16 261,63 -24
P1-17 261,63+1,955¢ 261,63
P1-18 261,63-1,955¢ 261,63

92
Appendix B

93
Appendix C

94

95
Appendix D
Q1. Age (Select)
Q2. Nationality? (Please type)
Q3. Gender? (Select)
- Male
- Female
Q4. Do you play any musical instrument actively? (Select)
- Yes
- No
Q5. What is your main instrument?
(Please type. Type “none”, if you don’t play any instrument)
Q6. How many years have you played your main instrument? (Select)
- None
- 1 – 4
- 5– 10
- More than 10 years
Q7. Have you had any formal musical training? (Select)
- Yes
- No
Q8. How many years have you had formal training? (Select)
- None
- 1– 4
- 5– 10
- More than 10 years

96
Q9. How would you describe the level of your musical profession? (Select)
- Not a musician
- Hobbyist
- Serious amateur
- Semi-professional
- Professional
Q10. Do you usually play in a group or by yourself? (Select)
- In a group
- By myself
Q11. Do you practice any of the following? (Select)
- Composing or arranging music (e.g. for a band, ensemble, choir)
- Conducting (e.g. orchestra, ensemble, choir)
- Music production (e.g. sound engineering, recording, mixing, mastering).
- No, I don’t practice any of the above
Q12. Do you have normal hearing? (Answer no if you have been diagnosed with hearing
imapairment) (Select)
- Yes
- No
Q13. Do you have a so-called perfect pitch or absolute pitch? (Select)
- Yes
- No
Q14. Have you ever heard of equal temperament (= tasavirejärjestelmä)? (Select)
- Yes
- No

97
Q15. If someone asked, would you be able to explain what equal temperament means?
(Select)
- Yes
- No
Q16. How would you rate the overall difficulty of this experiment? (Select)
1. Too easy
2.
3.
4.
5. Impossible