AN EXAMINATION OF SELF-PERCEIVED TEMPERAMENT STYLES …
155
iii AN EXAMINATION OF SELF-PERCEIVED TEMPERAMENT STYLES AND ITS RELATION TO THE RETENTION OF FIRST TIME, FULL-TIME FRESHMEN IN A COLLEGE OF AGRICULTURE by Ashley Loren Powell A thesis submitted in partial fulfillment of the requirements for the degree of Masters of Science in Agricultural Education MONTANA STATE UNIVERSITY Bozeman, Montana April, 2014
Transcript of AN EXAMINATION OF SELF-PERCEIVED TEMPERAMENT STYLES …

iii
AN EXAMINATION OF SELF-PERCEIVED TEMPERAMENT STYLES AND ITS
RELATION TO THE RETENTION OF FIRST TIME, FULL-TIME
FRESHMEN IN A COLLEGE OF AGRICULTURE
by
Ashley Loren Powell
A thesis submitted in partial fulfillment of the requirements for the degree
of
Masters of Science
in
Agricultural Education
MONTANA STATE UNIVERSITY Bozeman, Montana
April, 2014
iv
©COPYRIGHT
By
Ashley Loren Powell
2014
All Rights Reserved

ii
ACKNOWLEDGEMENTS
I would like to thank everyone who has supported me throughout the thesis
writing process and my completing my Master’s program. I could not have made it
through this journey without such a strong and positive support system. I am thankful to
have you all.
To Dr. Carl Igo, thank you for your guidance and support in writing this thesis.
You have been a remarkable advisor and encourager throughout my time in this program.
Thank you for all of the laughs and dinners with your family—even if we are the only
ones who laugh at each other’s jokes. Bazinga! The teaching opportunities you have
afforded me throughout the program were truly invaluable. They have provided me with
a solid foundation of teaching and learning in the college classroom.
To Dr. Shannon Arnold and Dr. Nora Smith, thank you for all of your insight,
guidance, and laughs shared through this process. Both of you are brilliant and truly
lovely ladies. It has been an honor to learn with you, and most certainly from you. No
student before me has ever been so lucky to have such a wonderful committee as I.
To all my friends, thank you for the love, laughter, encouragement, and dances.
Each and every one of you have inspired, moved, and impacted my life in a profound
way. I am a better person for knowing and receiving the gift of friendship from you all.
To my family, thank you for always encouraging me to follow my dreams. Thank
you for the innumerable prayers of safety, sanity, and success throughout my program
and life. This thesis is for you all- my love and thank you letter for the years of support
and encouragement.

iii
TABLE OF CONTENTS
1. INTRODUCTION ...........................................................................................................1 Background and Setting ...................................................................................................1 Statement of the Problem .................................................................................................9 Purpose and Objectives ....................................................................................................9 Definition of the Terms ..................................................................................................10 Limitations of the Study.................................................................................................11 Basic Assumptions of the Study ....................................................................................12 2. REVIEW OF THE LITERATURE ...............................................................................13 Introduction ....................................................................................................................13 Theoretical Framework ..................................................................................................13 Retention ........................................................................................................................15
History and Main Theories ....................................................................................15 Pre-College Characteristics ....................................................................................19
Demographic Traits ...................................................................................19 College of Agriculture Demographics and Traits ......................................20 Personality and Retention ..........................................................................21 Admissions Criteria ...................................................................................22 Goal Commitment ......................................................................................24 Institutional Integration: Social and Academic..........................................24
First-year Students .........................................................................................................26 Temperament .................................................................................................................28
Ancient Beginnings ................................................................................................28 Modern History of Temperament ..........................................................................29 Keirsey Temperament Theory ...............................................................................31
Personality, Temperament, and Retention in Colleges of Agriculture ..........................32 Real Colors.....................................................................................................................34
Background ............................................................................................................34 The Four Colors .....................................................................................................35
Blue ............................................................................................................36 Gold............................................................................................................36 Green ..........................................................................................................36 Orange ........................................................................................................36
Real Colors in the Industry ....................................................................................37 Real Colors and True Colors..................................................................................38
Beginning College Survey of Student Survey ...............................................................39 Summary ........................................................................................................................43

iv
TABLE OF CONTENTS CONTINUED 3. METHODOLOGY ........................................................................................................45 Instrumentation ..............................................................................................................45
Beginning College Survey of Student Engagement...............................................46 Validity ......................................................................................................47
Real Colors.............................................................................................................48 Reliability & Validity ................................................................................50
Population ......................................................................................................................51 Data Collection ..............................................................................................................53 Data Analysis .................................................................................................................55 Summary ........................................................................................................................60 4. RESULTS ......................................................................................................................62 Introduction ....................................................................................................................62 College of Agriculture Freshmen Profile .......................................................................62 Beginning College Survey of Student Engagement.......................................................65 Pre-College and Retention .............................................................................................69 Temperament, Pre-College, BCSSE, and Retention Relationships ...............................71
Mann-Whitney U Results for Background Characteristics ...................................72 Mann-Whitney U Results for BCSSE Questions 13 and 18 ..................................73 Kruskal-Wallis Results ..........................................................................................74 Chi-Square .............................................................................................................78 Correlations ............................................................................................................79
5. CONCLUSIONS AND DISCUSSION .........................................................................84
Outcomes .......................................................................................................................84
Objective One ........................................................................................................85 Objective Two ........................................................................................................86 Objective Three ......................................................................................................89 Objective Four .......................................................................................................89
Implications and Recommendations ..............................................................................92 Building Effective College of Agriculture Retention Programming .....................94 College of Agriculture Academic Advising ..........................................................96 College of Agriculture Career Advising ................................................................97 Implications for Agriculture Education and Leadership Courses ..........................99
Recommendations for Future Research ...........................................................................101 Summary ..........................................................................................................................102 REFERENCES CITED ....................................................................................................105

v
TABLE OF CONTENTS CONTINUED APPENDICES .................................................................................................................120
APPENDIX A: Beginning College Survey of Student Engagement ...................121 APPENDIX B: Example of COA Champ Change Retention Events ..................126 APPENDIX C: Types of Courses, Course characteristics, and
Coursework that the Different Temperaments Excelled In .................................................................................129
APPENDIX D: The Four Temperaments: Careers in Agriculture ......................139 APPENDIX E: IRB Approval Form ....................................................................142

vi
LIST OF TABLES
Table Page
1. The History of the Four Temperaments .............................................................32
2. The Compatible Temperament Types of Galen, Myers-Briggs, Keirsey, and Real Colors® ...............................................................................................35
3. Data Codebook for Variables within the Study as Input in SPSS 20............................................................................56
4. Primary and Secondary Color Temperament Distribution by Gender ......................................................................................65
5. Frequencies (n) and Percentages (%) of the Purposive Sample’s BCSSE Question 13: A-D Results ........................................................................................................68
6. Means (M) and Standard Deviations (SD) of BCSSE Question 18 ......................................................................................................69
7. High School GPA Range Frequencies (n) and Percentages (%) for the Purposive Sample..............................................................................................................70
8. Means (M) and Standard Deviations (SD) of SAT Verbal and Math and ACT Composite Scores ...............................................................................................................71
9. Mann-Whitney U n, Means Ranks, U, and p Values of Gender and High School GPA, SAT Verbal and Math, and ACT Composite Scores.............................................................................................73
10. Mann-Whitney U Test n, Mean Ranks,
U, and p values from BCSSE Question 18 and Gender ..................................................................................................74
11. Kruskal-Wallis Results of the Three Semester Groups for BCSSE Questions 13 and 18 Values n, Mean Ranks, degrees of freedom (df), and p ..............................................75

vii
LIST OF TABLES – CONTINUED
Table Page
12. Post-hoc Mann-Whitney U Test to Compare Temperament to BCSSE Question 18: E .........................................................77
13. Cross-Tabulation between the Primary and Secondary Temperaments in the Purposive Sample..............................................................................................................78
14. Correlations between Primary and Secondary Temperament, Retention, High School GPA, ACT Composite, and SAT Verbal and Math Scores in the Purposive Sample .......................................................................80
15. Correlations between Primary and Secondary Temperament, Retention, and BCSSE Questions 13: A-D and 18: A-F ........................................................................................82
16. Revised Temperament, Talent, and Tools in the Workforce ..................................................................................................98

viii
LIST OF FIGURES
Figure Page
1. The Freshmen Year Process and Four Retention Decisions (Veenstra, 2009) ..............................................................27
2. Gender Distribution of the Purposive Sample...............................................................................................................63
3. Primary Temperament Distribution for the Purposive Sample .........................................................................................64
4. Secondary Temperament Distribution for the Purposive Sample ........................................................................................64
5. Primary and Secondary Temperament Distribution ..........................................85

ix
ABSTRACT
First-time full-time freshmen are faced with an enormous amount of new experiences in their first year in college. Student personality has been a well-established factor in retention studies. However, no studies had been conducted on what significant ways a student temperament could be used to positively impact the retention of first-time, full-time freshmen within the College of Agriculture (COA) at Montana State University (MSU). The purposive sample for this study included only students who met four criteria: (a) First-time, full-time freshmen enrolled in the AGED 140 course in the fall 2012, spring 2013, and fall 2013 semester with declared majors in the COA; (b) completed the Beginning College Survey of Student Engagement (BCSSE) during the summer 2012 orientation session; and (c) completed the Real Colors® temperament assessment during the AGED 140 course. Descriptive quantitative in design, inferential and descriptive nonparametric statistics were used to explore for relationships and statistical significance between pre-college scores and the two study instruments—the BCSSE and Real Colors®. Findings were based on the results from the two instruments and pre-college academic factors of high school GPA, SAT Verbal and Math scores, and ACT Composite scores. Results showed that the largest primary temperament was Orange, and the largest secondary temperament was equal between Gold and Blue. Gold and Green students were concerned about making friends. Students were also concerned with engaging with instructors and paying for college. Females were concerned with their time management skills. Students expected to spend 21-30 hours preparing for coursework each week. Temperament was not correlated with retention. Recommendations were that retention programs and course study groups focus on gathering students struggling in a course or multiple courses. Scholarship and other financial services that assist in paying for college should be well publicized to students. Instructors’ office hours should be posted and referred to often. Instructors and advisors should be aware of the different ways in which students with different temperaments perceived their first year academic workload. Instructors should keep course assignments practical; relate course material to industry jobs; provide hands on activities; and encourage big picture thinking.

1
INTRODUCTION
Background and Setting
The educational institutions currently known as colleges came into existence in
the 1600s. However, it has only been within the past 50 years that retention has become a
focal point (Morrison & Silverman, 2012). An institution’s “source of prestige” has been
built on its ability to retain students (Berger, Ramirez, & Lyons, 2012, p. 10). Some
higher education institutions include in their strategic plans priorities to raise retention
rates; while others take less formal action approaches to retention. Universities that do
take action care not only about their reputation, but about keeping students motivated to
stay in college by providing a quality education and effective retention programming for
all. Montana State University (MSU) was an example of one such institution that did not
just talk about raising retention rates, but took strategic steps to do so.
With only 28% of Montanans 25 years of age or older having at least a
baccalaureate degree, action needed to be taken to raise retention and graduation rates
(Baum, Ma, & Payea, 2013, p. 44). MSU’s 2012 Strategic Plan documented that
equipping students with the knowledge and skills needed for being successful in their
future careers and education was an institutional learning goal (Strategic Planning
Committee, 2012). The Strategic Planning Committee believed “this goal pushes MSU to
seek continuous improvement in student learning and to create innovative, compelling
student learning opportunities that will increase retention and graduation rates” (Strategic
Planning Committee, p. 3). To reach this goal, MSU sought to increase first-time, full-
time freshmen retention rates from fall-to-fall semester from 74% to 82%. According to

2
the Strategic Planning Committee (2012), MSU fell below the average Western land-
grant institutional retention rate of 77%. The challenge faced by MSU and other
institutions nationwide was to identify why students were leaving, and then build and
implement effective early intervention and support programs to draw those students.
In order to determine what makes students depart from college, examination must
begin with their first year experiences. Many important experiences that shape a student’s
decision to stay or leave college happen within their first year (Tinto, 1993). MSU has
developed a number of initiatives and institution-wide programs to address those issues.
One example came from the 2013-2019 Academic Strategic Plan developed by the
Dean’s Council. Eight implementation recommendations were outlined regarding
increased first-time, full-time freshmen retention rates. The recommendations were as
follows (The Dean's Council, 2013):
• Analyze and implement recommendations from assessment of freshman seminars;
• Implement and assess freshmen experience classes, residential interest groups or
freshman interest groups;
• Identifying funding for sophomore-level scholarships;
• Develop transitional advising for students changing majors that will allow on time
graduation;
• Encourage “introduction to the major” seminars in all programs;
• Provide clear four-year degree plans;
• Survey why students leave and address results; and
• Reduce Drop/Fail/Withdraw (DFW) levels in freshmen-level classes.

3
Fox-Koon, Frick, and Igo (2009) noted that retention should be a university-wide
effort, and that no single program or factor explained student retention. This conclusion
was also reached by previous retention researchers such as Berger, Ramirez, & Lyons,
(2012) and Tinto (1990, 1993, & 1997). As a result, institutions needed to implement
multiple initiatives to increase student retention (Tinto, 1990). Paramount retention
researchers, such as Tinto (1990, 1993, 1997, & 2002), Astin (1993) and others (Yorke &
Longden, 2004; Kuh, 2001-2002) noted that universities needed to identify students who
were at-risk of dropping out of college before they did so. Early student support could
have meant the difference between retention or an early exit from higher education.
MSU, specifically, employed two early identification and support programs that
adhered to researcher’s institution-wide multiple initiative recommendation. The
Beginning College Survey of Student Engagement (BCSSE) is a pre-college survey that
MSU administered to incoming freshmen prior to the start of fall classes (Montana State
University, 2012). The instrument gathered information on student’s pre-college
experiences, first-year expectations, and intention to graduate from the institution. The
Office of Student Success at MSU utilized the data by contacting students about areas of
concern, based on their survey responses, and initiated support in the areas the instrument
identified as potential issues (Beck, 2011). The BCSSE data provided MSU and the
College of Agriculture, specifically, with an in-depth understanding of the student’s pre-
college engagement and expectations of their first-year (Indiana University, 2013).
After the semester began, faculty and staff at MSU had at their disposal the Early
Alert System (Montana State University, 2012). With Early Alert, faculty submitted the
4
names of students in their courses about whom they were concerned. Upon submission
into the system, attempts were made to connect the student with an advisor at the Office
of Student Success to create a plan of action that sought to improve the student’s
performance and success (Montana State University, 2012). Together the BCSSE and
Early Alert system were two institution-wide attempts at early identification of students
that possibly needed support in order to be successful and stay in college at MSU. These
programs were prime examples of the types of procedures that researchers, such as Tinto
(1975; 1993), recommended universities employ.
However, not only the higher education institutions were affected by the retention
or dropping out of college students. Industries, and by extension, the U.S. economy were
also impacted. Obtaining a higher education degree not only positioned the individual for
higher financial earnings, but it was also linked to economic growth (Baum & Ma, 2007).
The National Institute of Food and Agriculture (NIFA) (Goecker, Smith, Smith, & Goetz,
2010) forecasted a five percent increase in the need of college graduates that had
expertise in food, agriculture, renewable energy, and the environment during the years of
2010-2015. This increased need for qualified graduates served to underscore the
importance that colleges of agriculture retain students so employment vacancies can be
filled. The numerical estimation of available jobs between 2010 and 2015 was “54,400
annual openings for individuals with a baccalaureate or higher degree in food, renewable
energy, and environmental specialties” (Goecker, Smith, Smith, & Goetz, 2010, p. 1).
Not surprisingly, employers in the industry preferred to hire specialized agriculture
students over other graduates (Goecker, Smith, Smith, & Goetz, 2010).

5
The United States Department of Agriculture (USDA) reported that college of
agriculture graduates in pursuit of employment in the agricultural education,
communication, and governmental industries had approximately 6,200 (11%) annual job
openings between 2010 and 2015 (2010). The retention of college of agriculture students
was not only important to fill the job vacancies reported, but to continue to grow and
sustain the industry for the future.
Simultaneous to the increased need for qualified graduates in the field of
agriculture was the price of obtaining a higher education degree (Berger, Ramirez, &
Lyons, 2012). Students must feel that their time spent and knowledge gained at higher
education institutions was a sound investment in their future (Paulsen & St. John, 2002).
The College Board reported in 2011, the median earnings of an individual with a
bachelor’s degree that worked full-time was $56,500 annually. That was $21,100 more
than the median earnings of an individual who obtained a high school diploma alone
(Baum, Ma, & Payea, 2013). The numbers provided evidence that individuals were
positioned for higher earnings in the marketplace by receiving a higher education degree
(Baum et al., 2013; DeBernard, Spielman, & Julka, 2004). Degree attainment not only
had an impact on the standard of living of the individual or family unit, but also affected
the communities and societies in which these degreed workers lived (Baum et al., 2013).
Federal, state, and local governments also benefited from a higher number of
college graduates. At each level, an increase in tax revenue occurred because
governments “spend less on income support programs” (Baum et al., 2013, p. 5). The
Montana legislature understood this important outcome, and got involved in increasing

6
MSU’s retention and graduation rates. The Bozeman Daily Chronicle reported, during the
2013 Montana legislative session, that the state Board of Regents voted unanimously to
appropriate state dollars based on the campus’ graduation rates, which was a result of
successful student education and retention. The graduation rates of students was
measured, by the state, as the number of first-time, full-time freshmen who graduated
from a Montana University System institution within six years (Schontzler, 2013). There
were sixteen colleges and universities in the Montana University System (Montana
University System, 2011). Competition between institutions for state funds was yet
another motivation for MSU to raise retention rates.
“Student retention has now become a big business” (Tinto, 2006-2007, p. 5). The
Lumina Foundation, a private organization committed to increasing the number of
college graduates in the U.S., focused solely on increasing the number of individuals with
college degrees or certificates by 60% by the year 2025. In 2012 alone, the Lumina
Foundation made 70 grants amounting to $30 million dollars for the implementation of
their goal (Lumina Foundation, 2011). Such interest from various stakeholders in
increasing the number of college graduates displayed how college student retention was
not just a concern of higher education systems.
With the large list of stakeholders of student retention, Upcraft, Gardner, and
Barefoot (2005) noted nearly 75% of colleges and universities were offering programs for
first-year students. They further concluded that even with surveys, such as the BCSSE,
university retention rates were still a concern. There was not one magical mixture of
variables to assuredly predict first-time, full-time freshmen retention to the second fall

7
semester. Traditional admissions criteria alone could not predict academic performance
and the retention of students (Garton, Dyer, & King, 2000). In fact, in their 2004 study,
Lotkowski, Robbins, and Noeth concluded that eight of nine nonacademic factors, when
combined with socioeconomic status, high school GPA, and ACT scores, could be used
to effectively predict student retention. The predictive factors were found to be
confidence, institutional commitment, social support, financial aid, academic goals,
academic self-confidence, and social involvement. These factors explained 17% of the
variance of student retention in the study (Lotkowski, Robbins, & Noeth, 2004). Multiple
variables that could affect retention have been examined in past retention research.
Different from previous research, this study explored self-perceived temperament style as
a variable could impact a College of Agriculture student’s retention.
Temperament and personality assessment instruments have a popular use in the
private, nonprofit, and public sectors for helping groups understand one another to
streamline work efforts and manage conflict. The Human Resources Department at MSU
has used personality style differences to help explain why conflicts may occur
(McCorkle, 2012). In academia, personality styles have been used in various disciplines
from economics to parenting to medicine (Liang, 2010; McPhereson & Mensch, 2007;
Nedrow, Istvan, Haas, Barrett, Salveson, Moore, Hammerschlag, Keenan, 2007; Parker,
1993; Ziegert, 2000).
Within agriculture research, personality styles and temperament have been used to
assess students learning styles and academic achievements in relation to retention;
agriculture education teachers and teaching styles; rural leaders; and Extension agents

8
(Barrett, 1985; Barrett, Sorenson, & Harding, 1985; Barrett, Sorenson, & Harding, 1987;
Barrett & Horner, 1989; Garton, Ball, & Dyer, 2002; Raven, Cano, Garton, & Shelhamer,
1993; Sorensen, 1998; Watson & Rayner, 1920). Many articles have been published on
the personality styles of teachers and students and how this knowledge can positively
impact colleges of agriculture in the classroom and for retention purposes. Other
variables, such as demographic and academic, have also been measured in conjunction
with personality styles to form a predictive link to retention.
With the broad search for different factors that affect student retention, the
question posed became why temperament, and more specifically Real Colors®, had not
been utilized to explain the retention of students in a college of agriculture? Friedman and
Mandel (2011) called for more research to be conducted on supplemental factors that go
beyond high school GPA and SAT scores to help improve the prediction of retention in
first-year students. For college of agriculture students specifically, Dyer and Breja (1999)
found that traditional admissions criteria alone were not the best predictors of retention.
Even with these recommendations for future research, no studies had been conducted that
tested for a link between self-perceived temperaments of first-time, full-time freshman,
measured against proven student demographic variables, and retention at Montana State
University. This study was exploratory in nature and concentrated only on the retention
of first-time, full-time freshmen in the College of Agriculture at Montana State
University.

9
Statement of the Problem
In what significant ways can a student’s self-perceived temperament style be used
to positively impact the retention of first-time, full-time freshmen students within the
College of Agriculture at Montana State University?
Purpose and Objectives
The purpose of this study was to investigate the potential for a significant
explanatory relationship between self-perceived temperament style and retention to the
second fall semester of college in first-time, full-time freshmen in the College of
Agriculture at Montana State University. The specific objectives of the study were:
1. Compare the Real Colors® temperament assessment results to create individual
lab and sample preliminary profiles of the primary and secondary self-perceived
temperament styles in the full-time, first-time freshmen enrolled in the AGED 140
Leadership Development for Agribusiness and Industry Employees course in the
fall semester of 2012, and spring and fall semester of 2013, at Montana State
University.
2. Compile results of the first-time, full-time freshmen enrolled in the College of
Agriculture BCSSE survey questions 13, 18, and 25 to uncover the sample’s
expectations.
3. Obtain, organize and analyze student pre-college academic information—SAT
Verbal and Math, ACT Composite scores, and high school GPA— and enrollment

10
data from the 2012-2013 academic year to the 2013-2014 academic year to
identify whether participants were retained to their second fall semester.
4. Determine if a relationship exists, and to what magnitude it may exist, between
self-perceived temperament style and BCSSE data, pre-college academic
information, and retention to the second fall semester at Montana State
University.
Definition of the Terms
For the purpose of this study, specific terms were defined as follows:
At-risk: The degree to which a student is susceptible to dropping out of college
within their first year at Montana State University (Fox, 2006).
Beginning College Survey of Student Engagement (BCSSE): The Beginning
College Survey of Student Engagement is a survey administered to incoming freshmen
students at Montana State University. The BCSSE gathers data on the high school
academic and co-curricular experiences of students, their expectation about their first
year in college, and additional information (Indiana University, 2013).
First-time, Full-time Freshman: “A traditional aged student enrolled in an
equivalent credit load of 12 credits or higher and who has not previously attended an
institution of higher education in the pursuit of a degree” (Chambers, 2009, p. vii).
Personality: Personality consists of a person’s character and temperament.
“Character is disposition, temperament is predisposition” (Keirsey, 1998, p. 20). Multiple

11
personality traits make up a personality type. “The types can be identified by their
differences in traits, and they are described by their traits” (Lawrence, 2009, p. 17).
Real Colors®: A temperament assessment instrument developed by National
Curriculum & Training Institute, Inc.(NCTI) that bridges Keirsey’s temperament theory
(Keirsey & Bates, 1984) and real life application to help people understand one another.
Real Colors identifies four temperaments — Blue, Gold, Orange, and Green (NCTI,
2005).
Retention: The enrollment status of a first-time, full-time freshmen who have
been enrolled in the College of Agriculture from their first fall semester to their second
fall semester at Montana State University.
Temperament: “Temperament is an inherent personal style, a predisposition that
forms the basis of all of our natural inclinations: what we think and feel, what we want
and need, what we say and do.” (Montgomery, 2002, p. 17-18).
Limitations of the Study
1. The purposive sample for this study included only student who met all the following
criteria:
a. First-time, full-time freshmen enrolled in the AGED 140 course in the fall
2012 and spring 2013 semester with declared majors in the College of
Agriculture;
b. Retained to the fall 2013 semester;

12
c. Completed the BCSSE during the summer 2012 orientation administered by
the Office of Student Success at Montana State University and also complete
the Real Colors® temperament assessment during the AGED 140 course.
2. The determination and reliability of temperament style is not consistently exact when
assessing young people, such as first-time, full-time freshmen (Lawrence, 2009).
3. This study did not record whether non-persisters at Montana State University
transferred to another higher education institution or on academic suspension.
4. The study did not distinguish nor is concerned whether non-persisters withdrew
voluntarily or involuntarily.
Basic Assumptions of the Study
The basic assumptions of this study were the following:
1. The facilitator of the Real Colors® temperament assessment was certified by NCTI.
2. The students that participated in the Real Colors® temperament assessment were of
sound mind to answer the questions honestly and accurately.
3. The instruments used in this study were reliable in collecting the data needed to
accurately investigate the research problem.
4. Data was provided by the Office of Student Success related to the BCSSE instrument
for each student, as well as data from the Registrar’s Office on student’s enrollment
status was accurate.

13
REVIEW OF THE LITERATURE
Introduction
Within this chapter, the review of the literature covered the theoretical framework
of the study, as well as the research areas of retention, temperament theory, the Real
Colors® temperament assessment, and the Beginning College Survey of Student
Engagement (BCSSE). The first half of the review was focused on the elements of
retention and temperament. Examination of retention research occurred through the lens
of the first-time, full-time freshmen in higher education. The second half of the review
was comprised the instruments utilized in the study—Real Colors® temperament
assessment and the BCSSE.
Theoretical Framework
The theoretical framework for this study was based on two of the most well-
known and abundantly cited models of student retention (Tinto, 1975; 1993). Vincent
Tinto’s interactionalist theory and student departure model has served as the framework
for countless retention studies throughout the years (1975; 1993). Internationalist theory
(1993) informed the outline of the study trough the student academic and integration
factors that dictated retention. Factors in the model included student and institutional
factors and the relationships between them. The formal and informal interactions between
faculty and students promoted academic and social integration into the college. These

14
interactions, in conjunction with commitment to academic goals, determined a student’s
degree of “belonging” in the institution (Tinto, 1993).
Tinto’s student departure model (1975) was an expansion from Spady’s (1970)
sociological model of student departure. The model suggested that “a student’s entry
characteristics, coupled with his or her initial commitment to the institution and to
graduation, influence student departure decisions” (Berger, Ramirez, & Lyons, 2005, p.
23). A student’s pre-college characteristics had the power to influence their expectations
of college and initial commitment level. Institutional commitment and commitment to
graduation were confirmed factors that effected a student’s academic and social
integration. Both were also critical in the student’s retention or dropout decision (Tinto,
1975, 1993).
In order to examine the retention of first-time, full-time freshmen to their second
fall semester at Montana State University (MSU), the researcher incorporated factors that
impacted retention set forth in both of Tinto’s models (1975; 1993). The factors
examined in the study and captured by the instruments were student characteristics such
as gender, high school GPA, SAT/ACT scores, student’s disposition (self-perceived
temperament style), institutional commitment, and first-year expectations.
As discovered by Tinto (1975), student institutional interaction also predicted
retention. However, because of the timeline, scope, and data collected from the
instruments, students’ degree of institutional interaction was not available. Thus, adaption
of Tinto’s model for the study was necessary. A student’s interaction, both social and
academic, with Montana State University was reported in the study as expected

15
interactional values captured by the BCSSE. An additional major component of Tinto’s
(1975) model was the institutional characteristics that either encouraged or constrained
students in the development and integration into the system.
Retention
Main Theories The topic of student retention in higher education institutions has been
extensively researched for the past fifty years and was one of the most popular research
topics in higher education (Berger & Lyons, 2005; Pascarella & Terenzini, 1991, 2005;
Tinto, 2006-2007; Yorke & Longden, 2004). The extensive body of material available
verified the issues’ importance. Student retention was studied from many different
perspectives, and numerous factors have emerged as identifiers affecting student
retention. Retention research was largely focused on developing and testing theories that
were concerned with why some students dropped out and why some reached degree
attainment (Seidman, 2005).
The foundational and most popular theories of retention research related to this
study came from the 1970s and 1980s by Spady (1970), Tinto (1975; 1987; 1993), Astin
(1975; 1977; 1985), Hossler (1988), Pascarella and Terenzini (1980), Terenzini and
Pascarella (1977), and Bean (1980, 1983). These researchers designed the framework and
theories of which this study was based. It was through these foundational studies, that the
concept of retention and understanding of factors affecting it were identified.

16
Alexander Astin, in 1975 and again in 1985, reported two main predictors of
student retention— personal and environmental factors. Astin described personal factors
as the student’s academic and family background, study habits, academic goals,
expectations, age, and marital status (1975). Environmental factors were defined as the
student’s place of residence, academic environment, employment, and college
characteristics (1975). The personal factor that was the best predictor of a student’s
retention was past academic grades. These findings led Astin to develop the involvement
theory (1985). The theory posits that the student who was more involved in college life,
based upon supported experiential factors, was more likely to persist (Astin, 1985).
William Spady offered his own, single-institution focused, interdisciplinary model
of student departure that was born from a sociological and longitudinal approach (1970).
Spady’s (1970) model delivered a more focused and defined lens of understanding of
why student’s dropped out. Based off of Durkheim’s suicide theory, Spady believed that
“the social conditions that give rise to dropping out are similar to those that result in
suicide” (Morrison & Silverman, 2012, p. 69). A student brought with them to college
their attitudes, skills, and values. These attributes either conflicted or complemented the
college’s values and goals (Spady, 1970). Thus, the attribute interaction with the college
system, both academically and socially, explained a student’s decision to drop out or stay
(Berger et al., 2012; Morrison & Silverman, 2012).
Spady’s (1970) model was a precursor of Vincent Tinto’s model. Tinto’s model
focused on student social and academic integration as the most important factor attributed
to retention. The model also acknowledged the importance of external factors that

17
affected a student’s decision (1975). Born from anthropological and sociological theories,
Tinto cultivated his model positing that the attributes a student brought with them to
college, along with institutional and educational commitment level impacted whether a
student stayed or left that institution (Morrison & Silverman, 2012; Tinto, 1987).
Tinto’s theory (1975) was well established due to the work of subsequent
researchers who validated and supported his theory. To operationalize Tinto’s (1975)
model, Terenzini and Pascarella (1977) examined the possibility of a functional
relationship between social and academic integration and attrition. Results of the study
proved Tinto’s theory (1975; 1987) that social and academic integration were equally
significant factors that affected student retention. Berger, Ramirez, and Lyons, explained
the importance of Terezini’s and Pascarella’s (1977) work in that they “provided a
foundation of research that led to an explosion of studies and more systematic
understandings of the nature of retention (2012, p. 24). Instruments used in the study
produced data that gave insight into the expected social and academic integration of
research participants.
In the 1980s, retention research expanded and explored new factors. Building off
previous studies that expanded Tinto’s work (1975), Pascarella and Terenzini (1980)
identified and tested five institutional integration variables (1) peer-group interactions,
(2) interactions with faculty, (3) faculty concern for student development and teaching,
(4) academic and intellectual development, and (5) institutional and goal commitment.
Results of the study proved, once again, that Tinto’s (1987) model was accurate at the
18
identification of freshmen who persisted and who voluntary dropped out of higher
education (Pascarella & Terenzini, 1980).
Bean (1980) adapted Price and Mueller’s (1981) model of nurse worker turnover
that helped explain student departure. Bean’s (1980) psychological model proposed that
there were similarities in the reasons why nurses left their jobs and why students left
college. From the literature of worker turnover, Bean (1980) formed four categories of
environmental factors: (1) a student’s decision to leave college must be realized as the
dependent variable; (2) two intervening variables that affected a student’s decision were
their institutional commitment and satisfaction; (3) there were five student background
variables that were reflective of pre-enrollment interactions with the institution; and (4)
there were twenty-one factors that reflected organizational or institutional elements that
influenced a student or worker’s satisfaction (Berger & Lyons, 2012; Morrison &
Silverman, 2012). Although the study provided retention researchers and institutions with
an alternative way to view and frame retention, Bean’s theory had a serious flaw—a
failure to account for variance in men and women. Morrison and Silverman stated that
“studies of student retention that utilize the conceptual framework proposed by Bean
[were] limited” because he failed to account for gender differences (2012, p. 74).
By the end of the decade, quality framework models and theories of retention had
been posed by researchers whose work was the very foundation of this study.
Specifically, Tinto’s (1987) model spurred retention research forward. Morrison and
Silverman (2012) expressed the critical implications of Tinto’s research to the field,
“Regardless of the particular theory, model, or concept, it is Tinto’s model of academic

19
and social integration that is generally the cornerstone of research…” (p. 77). This study,
and many others, were indebted to the work of Vincent Tinto, and pressed forward in the
search for the factors that predicted student retention.
Pre-College Characteristics Over the years, research proved that a student’s pre-college characteristics were
important factors in degree attainment (Astin, 1991, 1993, 1997; Astin & Oseguera,
2005, 2012; Fox, 2006; Pascarella and Terenzini, 1991, 2005; Tinto, 1993). The
background characteristics of students such as gender, ACT/SAT scores, and high school
GPA were factors included in many retention studies (Astin, 1997; DuBrock, 1999; Fox,
2006; Nora, Barlow, & Crisp, 2005; Smith, 1995; Tinto, 1975). Tinto (1987; 1993)
included the pre-college characteristics of student’s disposition which study referred to
disposition as temperament; high school educational experiences; commitment to the
institution and graduation; and institutional academic and social integration.
Unfortunately, the research on academic and nonacademic pre-college characteristics
varied from study to study. To review the literature of these characteristics was necessary
as a result of incongruences and established importance of inclusion of these factors.
Demographic Traits. The basic goal of retention studies in higher education was
to discover the differences between students who persisted in college and students who
did not persist (Fox, 2006). Student demographic descriptors have been at the forefront or
served as a factor associated with the majority of retention research in existence (Fox,
2006). There were four pre-college characteristics Astin (1997) identified that provided

20
evidence as sound predictors of retention. Two of the four demographic traits identified
by Astin (1997) that were proven predictors of retention were gender and the student’s
personality.
In the past, researchers concluded various predictive strengths of gender as a
factor of student retention. Attewell, Heil, & Reisel (2011) found that gender was a
significant factor in the prediction of college graduation. The persistence of males and
females in college, however, varied by study (DuBrock, 1999; Nora, et al., 2005). For
example, Smith (1995) reported that females were more likely to persist in college than
men were. Due to the unstable findings in the research, it was important to identify the
background characteristics of participants in the study.
Astin and Oseguera found in their 2012 study that women were more likely to
complete a bachelor’s degree than men. Whether the women completed the degree in four
or six years, they were still more likely to reach degree attainment. Findings were
congruent with the works of Astin (1971, 1975, 1982, & 1993) and Astin, Tsui, and
Avalos (1996). These studies reflected that gender and degree attainment was an
important inclusion in this study since degree attainment was a result of student retention.
College of Agriculture Demographic and Traits. Additional demographic factors
were specific to retention studies that involved college of agriculture students. The
additional factors utilized included the following: 4-H or FFA involvement (Ball, Garton,
& Dyer, 2001; Dyer, Breja, Wittler, 2000; Dyer, Lacey, & Osborne, 1996), experience
with agriculture (Dyer, Breja, & Anderson, 1999; Dyer, Lacey, & Osborne, 1996;
Wildman & Torres, 2001), high school participation with agricultural curriculum

21
(Abbasi, 1989; Dyer, Breja, & Anderson, 1999; Dyer, Breja, & Wittler, 2000; Dyer,
Lacey, & Osborne, 1996), and having a farm or rural background (Dyer, Breja, &
Andreason, 1999; Dyer, Breja, & Wittler, 2000). Garton, Dyer, and King (2000)
investigated whether a student’s learning style was a predictor of academic achievement
and retention. They concluded that high school GPA and ACT score was the best
predictor of academic performance, but learning style and ACT score was the most
accurate predictor of retention.
Personality and Retention. Tinto (1975) called upon retention researchers to look
past traditional academic factors, and begin to investigate nonacademic factors, such as
student’s disposition. In response to Tinto’s recommendations, past researchers included
individual characteristics such as personality and temperament in their retention studies
(Schurr, Ruble, Palomba, Pickerill, & Palomba, 1997). Years later, Tross, Harper, Osher,
and Kneidinger (2000) concluded that “personality variables are useful predictors of
college performance and retention” (p. 323). Support for personality as an important
factor in student retention has continued and supported by the sizable amount of literature
reviewed on the topic (Welter, 2002).
In 2004, McKenzie, Gow, and Schweitzer found that students who were
Introverted and had agreeable personalities were more likely to have higher grades than
those who were Extroverted and antagonistic. Further findings in McKenzie and
colleagues (2004) study showed that students who were categorized as Introverts were
more focused on their goals, better organized, and were less likely to get distracted by
social activities than were Extroverts.

22
Retention researchers and institutions have utilized the well-known personality
instrument, the MBTI, to improve student learning, performance, and retention. In 2002,
Kahn, Nauta, Gailbreath, Tipps, and Chartrand examined the capacity of the MBTI to
predict student retention and academic performance. Their study included over 600 first-
year students and discovered that students that were identified as Feeling increase
academic performance when enrolled in classes that developed analytical thinking skills.
While students identified as Intuitive increase academic performance when enrolled in a
higher number of classes that allowed them to be detail-oriented and examine factual data
(Kahn et al., 2002). Students that identified themselves as Sensing had a higher likelihood
of being retained than Thinking students. This was conceivably due to the tolerance for
tasks such as note taking and material memorization (Kahn et al., 2002).
Admissions Criteria. Every higher education institution had an established set of
criterion that students must meet in order to be accepted into the institution. Criteria were
set in place by the institution to admit only the students they believed were most likely to
persist until graduation. The types of criterion vary from institution to institution.
However, there was basic criterion in which virtually all higher education institutions
require. Two basic criteria were ACT/SAT score and high school GPA. MSU was much
like other four-year universities in that they required an institution-specific minimum
ACT/SAT score, with the exception of some on academic probation, graduation from an
accredited high school or a passing score on the General Education Development (GED)
exam, minimum cumulative high school GPA of 2.5 or upper half of high school
graduated class, and completion of state college preparatory curriculum of all incoming

23
first-time freshmen to be submitted. However, MSU also admitted students with low
scores into the institution but were placed on academic probation (Montana State
University, 2012).
Over the years, various predictors of student retention in admissions criteria have
been identified and actively reported. Astin (1997) provided evidence that ACT/SAT
scores and high school GPA were two admission criterion that were successful
predictors. Perrine and Spain (2008) found in their study of first-year students that high
school GPA and ACT scores were significant predictors of retention. Oseguera’s study in
2006 found that standardized test scores were strong positive predictors of degree
completion for White students, but not as strong for African-American students. Astin
and Oseguera (2005) reviewed, summarized, and cited volumes of research that also
supported admissions criteria, such as high school GPA as a successful predictor of
student retention.
However, other researchers have found that through the lens of academic
performance, high school GPA and SAT/ACT scores were not directly related to college
persistence (Anastasi, 1988; Bean & Metzner, 1985; Kern, Fagley, & Miller, 1998;
McGrath & Braunstein, 1997; Wolfe & Johnson, 1995). When combined, high school
GPA and SAT/ACT scores were more significantly predictors of student’s college
academic performance (Anastasi, 1988; Astin, Korn, & Green, 1987). The research on
whether high school GPA was a solid predictor of retention was debatable. Despite this
fact, the inclusion of high school GPA in retention research was widely prevalent and
included in this study.

24
Goal Commitment. Goal commitment in this study was defined as whether the
student intended to graduate from Montana State University. This factor of goal
commitment was a question that appeared on the 2012 BCSSE instrument. The data
collected from the BCSSE was representative of the definition provided.
Tinto’s interactionalist theory focused on the importance of a student’s
commitment to not only the institution, but also the commitment level to graduation as an
important factor that effected whether a student stayed in college or not (1975). Simarly,
Oseguera (2006) found that institutional commitment was a positive predictor of degree
completion. For White students, institutional commitment was a stronger predictor than it
was for African-American students, and social integration was a stronger predictor for
African-American students of degree completion.
Institutional Integration: Social and Academic. As people age, they like to relive
their “glory days”. For some those days were spent in high school and for others it was
college. Whether one graduated in two, four, six, or eight years, integration into the
academic and social life of college had an impact on one’s experience. In Tinto’s (1975;
2006-2007) longitudinal model of student retention, he stressed the importance of the
student’s institutional integration into the social and academic life during the first year of
college. “We learned that involvement matters and it matters most during the first critical
year of college” (Tinto, 2006-2007, p. 3). The works of Kuh (1999; 2003), Astin (1985;
1993), and Pace (1980) made positive strides in the operationalization student integration.
The notion of having a college life dated back to the nineteenth century. It was
just as important then as it was in the twenty-first century. Social integration was defined

25
by Oseguera as “measures such as peer relations, participation in student government,
and satisfaction with social life” (2006, p. 16). In past single-institution research, social
integration proved to be positively related to graduation (Allen & Nelson, 1989; Cabrera,
Nora, & Castaneda, 1992).
Activities, such as volunteering, during high school had a positive effect on
degree completion (Oseguera, 2006). In fact, it was viewed as a precursor to college
social integration and engagement (Oseguera, 2006), which enhanced the probability the
student was retained and graduated from college. In Braxton and Braxton, Sullivan, &
Johnson’s (1997; 2000) studies measuring the internal consistency of Tinto’s model,
results alluded to the notion that social integration was a key component in student
departure and not academic integration.
Noel-Levitz supported and validated Tinto’s theory through their 2006
investigation. Results showed that students place a high premium on academic
interactions, such as advising from faculty. The function of academic advising was to
identify and guide students toward their academic and career goals. When done
effectively, academic advising promoted student retention. In conjunction with academic
advising was the critical factor of actual academic classroom instruction. The quality of
instruction a student received in courses took priority over every other factor in college
integration and satisfaction (Noel-Levitz, 2006).
The more students that were involved in the academic and social environments of
college, the more likely they were to stay (Astin 1977; 1985). Due to the nature of the
data gathered by the BCSSE instrument, the values of the data were expected levels of

26
social and academic institution integration. Information on expected levels of integration
was just as crucial to the retention puzzle as actual student integration levels.
First-Year Students Retention studies were normally conducted on first-year students due to them
being most impressionable during this time of change and newness. The period of change
and adjustment within the first year was when most students fell prey to voluntary or
involuntary departure (Fox, 2006). Thomas Mortenson, in his chapter Measurements of
Persistence (2012), noted that “Freshman-to-sophomore persistence measurement is
important both because of student vulnerability at the beginning of college and because
institutions can react quickly with interventions” (p. 40). The first year in college has a
significant positive or negative effect on freshmen. There were many factors at play when
studying first-time, full-time freshmen as a population.
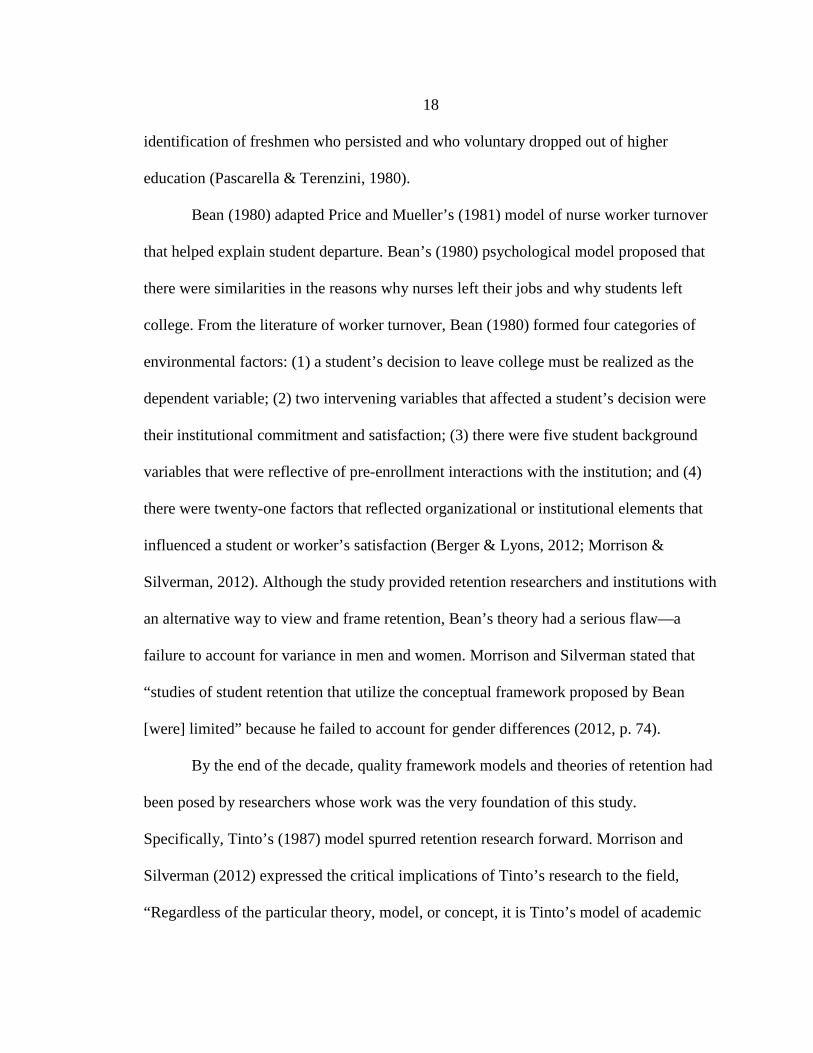
Cindy Veenstra illustrated the processes a student went through in their first year
of college. She discovered that there were four possible retention decisions freshmen had
available to them (Veenstra, 2008). See Figure 1 for the display of the freshmen year
process and the four retention decisions. Having met the admissions criterion, freshmen
entered the institution. Students brought with them past experiences and assumptions that
influenced their encounters at the institution. Then, it was the responsibility of the
institution to provide the student with “the development of its educational processes and
programs throughout the freshman year” (Veenstra, 2009, p. 19). At the end of the
student’s freshman year, a decision was made about their retention. The four choices
were the following (Veenstra, 2009, p. 19): (1) Return to the same college; (2) Leave this
27
college and transfer to another college in the same university; (3) Leave this college and
transfer to another university; or (4) Drop out of college.
Figure 1. The freshmen year process and four retention decisions (Veenstra, 2009) The knowledge of this process about the first year of college should empower institutions
to provide quality experiences, as well as support programs to help influence the student
to continue their education at the respective institution. Veenstra believed that it was the
responsibility of the faculty who taught the freshman classes and the staff to help the
students experience a successful first year in college (2009; Berger et al., 2012).
Tinto demanded that “What is needed and what is not yet available is a model of
institutional action that provides guidelines for the development of effective policies and
programs that institutions can reasonably employ to enhance the persistence of all of their
students” (2006-2007, p. 6-7). When colleges and universities were able to retain their
students, the positive impact was not just on the university, but also on the student’s
prospective industry and self.
The implementation of retention programs came at a high nominal cost for
institutions. However, not implementing retention programs tailored to the students also

28
cost the institution their prestige ranking amongst other institutions (Crosling, Thomas, &
Heagney, 2008). Veenstra believed that “As long as the budget for student services is less
than the loss associated with students leaving the university, the monetary benefit to the
University of supporting a major student support effort is positive.” (2009, p. 20).
Because of this study, the College of Agriculture and MSU had a pivotal piece of the
retention puzzle that assisted leveling, increasing, or allocating funds to other initiatives
due to the retention of students (Schuh & Gansemer-Topf, 2012).
Temperament
Ancient Beginnings The concept of temperament was not new by any means. In fact, a Greek
physician, Hippocrates, in the fifth century B.C.E., believed that the only way for a
person to be healthy was if they had a balance of four “humors”. Galen, a second century
Roman physician, agreed and postulated that each of the four humors were actually
bodily fluids that blended together in a different pattern. These patterns could be viewed
as a temperament or emotional style (Clark & Watson, 1999). When one of the fluids was
more present within the body than the others, it created an imbalance within the person.
This imbalance of the bodily fluids was where the Galen’s four humors originated. He
identified the four humors as the Sanguine, if blood was dominant; Melancholic if black
bile was dominant; Choleric if yellow bile was dominant; and Phlegmatic if phlegm was
dominant (Kagan, 1994: Keirsey, 1998).
29
In 1884, Sir Francis Galt first mentioned the importance of measurement stating,
“the character which shapes our conduct is a definite and durable ‘something’, and
therefore… it is reasonable to attempt to measure it” (p. 179). Temperament research
would not have the merit it does today if early scientists and statisticians had not placed a
high regard and established need for the practice. The focus on measurement paved the
way for researchers to identify and quantify human behavior into traits and
temperaments.
Aspects of these ancient views of temperament were evident in modern popular
temperament theories. Allport (1937) provided an all-inclusive definition of temperament
that has served past, present, future temperament research.
Temperament refers to the characteristic phenomena of an individual’s emotional nature, including his susceptibility to emotional stimulation, his customary strength and speed of response, the quality of his prevailing mood, and all the peculiarities of fluctuation and intensity of mood; these phenomena being regarded as dependent on constitutional makeup and there largely hereditary in origin. (p. 54)
Modern History of Temperament The personality trait was a concept that identified patterns of human behavior. For
years, psychologists have identified certain personality types, or bundles of
characteristics, that defined an explicit pattern in behavior (Winter, John, Stewart,
Klohnen, & Duncan, 1998). Personality researchers approached the identification of trait
patterns through three popular strategies: (1) a factor analysis, (2) rational theorizing of
typologies, and (3) biological “basic” traits (Winter & Barenbaum, 1999). These three

30
strategies comprised the history of how traits were studied. However, it was through the
typology approach that gave rise to modern temperament theories.
The modern history of temperament began in child psychological research.
Childhood temperament studies have been dominated by dimensional structures proposed
by Thomas, Chess, and Birch (1968; Thomas & Chess, 1977) in the late 1960s, and by
Jerome Kagan (1994). Kagan’s two infant temperaments were derived from two of the
four humors Galen identified. The two temperaments were identified in infants as young
as four months old. Kagan saw the sanguine temperament as positive and outgoing,
which mirrored his uninhibited temperament. Whereas, when the child was identified as
negative and moody, the melancholic temperament provided the basis for the inhibited
temperament (Kagan, 1994).
Typologies were a way of behavioral pattern identification through the
combination of characteristics that created a distinct configuration. The most popular of
these was the Myers-Briggs Type Indicator (Myers & Briggs, 1962), developed from
Jung’s typology (1923/1971). The traits combined were Extraversion-Introversion and
other functions such as Feeling, Body, Intellect, and Intuition (Jung, 1923/1971). People
identified as Extroverts were more outgoing and excited to be around people. Introverts
were the complete opposite. Introverts preferred to focus internally on thoughts and ideas.
No one person was ever 100% Introverted or 100% Extroverted. People had a natural
preference or tendency for one over the other (Lawrence, 2009, Liang, 2010).

31
Keirsey Temperament Theory The Keirsey temperament theory has been the cornerstone of which most modern
theories were found (Keirsey.com, 2008). Keirsey believed that each one of the
temperaments had its own distinctive path, “its own unique qualities and shortcomings,
strengths and challenges” (Keirsey.com, 2008, p.1; Miao, 2009). The theory was “based
on the belief that such differences are not acquired from environmental influence” and
was a “sort of a psychological DNA” (Bassey, Logeswaran, & Michel, 2013, p. 78). The
four temperament types identified were the Artisan, the Rational, the Idealist, and the
Guardian (Keirsey, 1998).
Keirsey believed a person’s personality was inborn wholly and completely as one;
a person’s personality was not compartmentalized and taken apart. Based upon this
belief, Keirsey developed his temperament sorter that identified four temperaments and
corresponding learning styles. The Keirsey Temperament Sorter was used by teachers
and students alike to help make the classroom a more successful learning environment for
all. The sorter also helped students identify careers that matched their temperament type
and preferences (Keirsey.com, 2008).
The research regarding temperament has been challenged, changed, and
controversial over the development of the discipline. Until all of the broad traits and
outlines of a unified model have been agreed upon, researchers have continued in pursuit
of all avenues of temperament models, systems, and assessments.

32
In this section, a brief history of temperament was examined in personality
psychology. A full review of the history was too large for the scope of this study. Table 1
displayed the history and evolution of temperament theories covered in this review.
Table 1. The history of the four temperaments Hippocrates BCE 370
Cheerful Somber Enthusiastic Calm
Galen c190 Sanguine Melancholic Choleric Phlegmatic Myers 1958 Perceiving Judging Feeling Thinking Keirsey 1978 Dionysian
(artful) Epimethean (dutiful)
Apollonian (soulful)
Promethean (technological)
Keirsey 1998 Artisan (SP) Guardian (SJ) Idealist (NF) Rational (NT) Personality, Temperament and Retention in Colleges of Agriculture Personality has appeared in many studies as possible predictors of retention,
dropout, persistence, and degree attainment. Identifying the personality factors of
retained students and non-retained students was important. An even more crucial
component was the environment in which specific personality or temperament types
arose. Just as there were certain pre-college characteristics linked to retention prediction
in college of agriculture students, specific temperament and personality traits were also
present in college of agriculture students.
Students with different temperaments often had different collegiate experiences
and viewed their education in different lights (Sorensen, 1998). The majority of the
personality studies conducted on college of agriculture students and retention came out of
the 1980s by Leverne Barrett at University of Nebraska-Lincoln. Before Barrett’s studies
on college of agriculture students, Roberts and Lee (1977) reported personality

33
differences of the teachers and students within a college of agriculture. This spurred
Barrett’s (1985, 1985, 1987) cornerstone works on personality in agriculture.
In 1985, Barrett studied the effect of student and teacher personality differences
on student grades, providing critical information about college of agriculture students
through the use of the MBTI. Most of the students in her 413 student sample were typed
as Sensing (S), and specifically Sensing-Perceiving (SP), meaning they needed and
wanted real-life, experiential learning opportunities, and felt they do not perform well in
structured classrooms. “Many sensing students say that they chose to major in agriculture
because it was the most practical of the majors” (Barrett, 1984 as cited in Barrett, 1985,
p. 55).
Barrett also found that personality type was related to GPA. The students who
typed themselves as Judging (J) tended to have higher averages than the Perceiving (P)
students. According to Barrett, judging (J) students liked deadlines and preferred to plan
their work to be accomplished by a date set. GPA was also found to be higher for
Introvert (I) students than for Extrovert (E) students. A study by McKenzie, Gow, and
Schweitzer (2004) reinforced Barrett’s (1985) reasoning for this occurrence. Both
supported the idea that Introverts had an easier time staying focused on one thing.
Utilizing the Myers-Briggs and Keirsey’s temperament groups, Barrett, Sorensen,
and Hartung (1985) found similar results. Students typed as Judging (J) and Introverted
(I) had higher GPAs. The majority of the students in the University Nebraska’s College
of Agriculture were 54% Introverted (I), 84% Sensing (S), 69% Thinking (T), and 57%

34
Judging (J) (Barrett, Sorensen, & Hartung, 1985). The results for the Keirsey (1984)
temperament assessment showed that 51% of the students were Sensing-Judging (SJ).
Williams (2007) compared agriculture students with non-agriculture students. His
study also revealed personality type differences in college of agriculture students that
Barrett (1985) outlined. Williams found 76% of the freshmen at Texas Tech were typed
as Extroverts (E), an increase from Barrett’s 54% in 1985 at the University of Nebraska.
While scores were mostly even between Thinking (T) and Feeling (F), students in
agriculture were higher in Sensing (S) than were non-agriculture students. Conflicting
results between Barrett and Williams also occurred in the number of students typed as
Perceiving (P) over Judging (J). The culture of the college seemed to attract more
students who were E, N, and P, Williams (2007) noted.
Real Colors®
Background The ancient view of Hippocrates that all humans were divided into four
behavioral types has transcended throughout the years. Combining the temperament
theories of Jung (1923/1971), Myers-Briggs (1962), and Keirsey (1984), The National
Curriculum Center & Training Institute, Inc. (NCTI), fashioned the Real Colors®
assessment instrument in 1981 (NCTI, 2007). Over the years, NCTI has been a leader in
development trainings used by multiple businesses, non-profit agencies, governments,
criminal justice agencies, and educational institutions (NCTI, 2007).

35
The Real Colors® and Keirsey (1984) model of temperament prescribed that
people were a blend, or on a continuum, of the four temperament types. It was the
specific arrangement of the types that placed a person into temperament groups. “Keirsey
recognizes that the theory may not be logical. But it is behaviorally sound, and his long-
time assessment of temperament validates the theory” (NCTI, 2007, p. 30). Table 2
identified the relationship of Real Colors to previous temperament types discussed in the
chapter.
Table 2. The compatible temperament types of Galen, Myers-Briggs, Keirsey, and Real Colors®.
Galen 4 humors Myers-Briggs 16 Types
Myers-Briggs 4 temperaments Keirsey Real
Colors®
Sanguine ESTP;ESDP;ISTP;ISFP Perceiving: SP (Sensing-Perceiving)
Artisans Orange
Melancholic ESTJ; ESFJ; ISTJ; ISFJ Judging: SJ (Sensing-Judging) Guardians Gold
Choleric ENFJ;ENFJ;INFJ;INTJ Feeling: NF (Intuitive-Feeling) Idealists Blue
Phlegmatic ENTJ; ENFJ; INTJ;INFJ
Thinking: NT (Intuitive-Thinking) Rationals Green
The Four Colors The temperament colors identified by Real Colors® were blue, gold, green, and
orange (NCTI, 2005).
As you learn more about the Colors, you’ll instinctively recognize characteristics
of people you know, and their Color. This knowledge gives you valuable insight
into what is most important to them, why they may react to situations differently

36
than others, how you can best communicate with them and much more (NCTI,
2005).
Blue. Words that describe blues were: peaceful, sincere, spiritual, subjective,
sympathetic, insightful, caring, compassionate, personal, empathetic, etc. (NCTI, 2005).
Blues were the feelers of the temperaments. Blues placed others ahead of themselves.
They were the mediators and peacemakers of the world. Blues liked to work in related
industries where they assisted and helped others.
Gold. Words that described a gold were: sensible, practical, organized, provider,
parental, stable, thorough, punctual, etc. (NCTI, 2005). Gold’s were the bosses and
operations managers in organizations. They relied on facts, and made decisions based
upon them. A person who was a gold tended to be very organized, valued rationality and
security- both financial and relational. A gold liked to be at the top of their field or class.
A gold typically did not consider emotions in the decision making process.
Green. Words that described a green were: complex, curious, abstract, exacting,
independent, ingenious, intellectual, research-oriented, etc. (NCTI, 2005). People who
were green were the researchers at universities. They enjoyed analyzing. The results for a
green did not matter as much as making sure all avenues of a situation, challenge, or
experience have been identified and weighed equally.
Orange. Words that described an orange were: immediate, generous, witty,
competitor, performer, trouble-shooter, optimistic, eager, charming, courageous, etc.

37
(NCTI, 2005). A person typed as an orange was considered the life of the party. They
were always looking for something fun to do. An orange was also very creative and
excelled at the arts. Oranges tended to be the big picture, visionaries of organizations.
Implementation of the creative strategies, events, or projects they came up with was not a
strong suit.
Real Colors® in the Industry Since 1981, Real Colors® has been available to and utilized by multiple
organizations and businesses to help employees and constituents better understand one
another (NCTI, 2005). Higher education institutions, not- and for-profit organizations,
and public and private business have utilized Real Colors® to help maximize
understanding of individuals and how to successfully recognize, accept, and value the
work of others with different color temperament distributions. The knowledge of self and
others, empowered individuals to create, grow, and foster positive work or home
environment due to their awareness of personal values and the values others who
surround them in the workplace or home (University of Wisconsin Cooperative
Extension, 2010).
Cooperative Extension has a rich history of utilizing Real Colors® for training
purposes. Real Colors® has been utilized in many different formats and for many
different audiences ranging from career professionals to volunteers to community
members. Real Colors® has been an integral tool in increasing the approachability and
service driven environment of Cooperative Extension.

38
University of Wisconsin-Extension created the “Get REAL with Money” program
(2013). The program participants completed the Real Colors® instrument and applied
temperament findings to their individual financial situation. The goal was to increase
positive financial practices. Other state Extension programs that utilized Real Colors®
included Michigan State University Extension, Montana State University Extension,
University of Nebraska Extension, and University of Illinois Extension. Real Colors®
was more than just a temperament assessment instrument. Real Colors® impacted
practical aspects and happenings in the lives of individuals who completed the
instrument.
Businesses, organizations, and educational institutions have all used Real
Colors® temperament assessment. Businesses and organizations such as Ashley
Furniture Industries, Inc., GEICO, General Electric, Bank of America, Tempe
Leadership, Arizona Builders Alliance, and Gilbert Leadership have engaged in and
complete the Real Colors® instrument. Educational institutions such as Vanderbilt
University, Purdue University, University of Illinois, Hawkeye Community College and
others have facilitated Real Colors workshops in classrooms and trained faculty and staff
on campuses to lead the workshops (NCTI, 2005)
Real Colors® and True Colors™ A related temperament instrument, called True Colors™, also was based in Jung,
Myers-Briggs, and Keirsey temperament theories. True Colors™ also utilized the blue,
green, gold, and orange colors with near identical definitions of temperaments as Real
Colors®. The founder and creator of True Colors™, Don Lowry, was a student of David

39
Keirsey and worked closely with him on developing personality concepts. In 1978,
Lowry coined the coloring methodology of temperaments (True Colors International,
2013).
Similar to Real Colors®, True Colors™ was a personality instrument that was
meant to be used to help “people find personal success and dramatically improve their
interpersonal relationships” (True Colors International, 2013). The reputation and
applicability of the instrument parallels that of Real Colors®. For both programs,
facilitator certification was necessary to administer the instrument and take participants
through the exercises.
Beginning College Survey of Student Engagement (BCSSE)
For freshman, the first year of college, in particular, commences a new and
possible stressful transition for students (Lu, 1994). The Beginning College Survey of
Student Engagement (BCSSE), first launched in 2007, provided insight for institutions on
what the high school experiences and first-year of college expectations were of their
incoming freshman class. James Cole, project manager, and Elijah Howe, project
associate, state the BCSSE’s purpose was “…to measure entering first-year students’ pre-
college academic and co-curricular experiences, as well as their expectations and
attitudes for participating in educationally purposeful activities during the first college
year” (2013, p. 3).
The BCSSE was created in response to interest generated by institutional leaders
in having a pre-emptive instrument to provide perceptional and characteristic data about
40
entering students. Prior to development of the BCSSE, colleges and universities only had
access to National Survey of Student Engagement (NSSE) which was administered at the
end of the student’s first-year of college and asked students about their actual first-year
experiences. The BCSSE was a created to be a companion survey to NSSE, that when
administered together, provided longitudinal data about the student’s complete first-year
in college. BCSSE was not created to identify students that needed remedial classes or
academic intervention (Cole & Howe, 2013).
The first BCSSE was piloted in 2004, and first administered in 2007 with multiple
institutions (Cole & Howe, 2013). Oregon State University (OSU) was one of the
institutions that participated in the BCSSE pilot study. OSU communicated the
importance of the survey in their 2012 BCSSE Results report, “The ability to compare
student responses at the beginning of their collegiate experience with those obtained near
the end of their first year can provide valuable information to inform programs and
services for students’ first year experience” (Sanderson, 2012, p.1).
The BCSSE included three sections. The first section of the BCSSE asked
students about their high school experiences. Questions ranged from the type of classes
students took (core or advanced), extracurricular activities, and academic behaviors
(study habits) (Cole & Howe, 2013).
The second section asked fundamentally the same questions as the first, but was
tailored toward the student’s first-year expectations of college. The questions asked
involved the student’s expectations, attitudes, and beliefs about their first year in college.
Questions ranged from expected hours of study and study habits; co-curricular activities;

41
expected types of academic assignments; potential hindrances; financial situation; and
institutional and academic goals (Cole & Howe, 2013).
The final section of the survey gathered background characteristics of the student.
Characteristics of the student collected were major, gender, full-time or part-time status,
ethnicity, parental education level, and more (Cole & Howe, 2013). The information
collected in this portion assisted researchers in organizing student data by background
characteristics, and provided added insight through statistical procedures of how these
factors might affect a student’s responses in the previous two sections.
Indiana University Center for Post-Secondary Research provided four
administration options to institutions for the BCSSE: paper administration at an event like
Welcome Week or New Student Orientation; web group administration, such as in a
computer lab; through an e-mail link; or a mixture of methods (Cole & Howe, 2013).
After the survey was administered, two reports were generated: the BCSSE report
and the BCSSE Advising. The BCSSE Report and raw data files of the means and
frequencies of the responses was generated and e-mailed to institution during either the
late summer or early fall months. There was no physical report sent to institutions.
Institutions had the autonomy to create their own meaningful report to identify students
or questions they wanted to focus on or were concerned with through the raw data files
(Cole & Howe, 2013).
The second report was the BCSSE Advising report sent in an Excel spreadsheet
that was capable of being merged to Microsoft Word. The information from this report
created a one page student summary for advisors or faculty that worked one-on-one with
42
students. The summary identified factors that a student might have issues with, such as
study habits, motivation or low engagement, to better equip the advisor or faculty
member with information about how best to support the student (Cole & Howe, 2013).
Retention, recruitment, academic advising, curriculum reform, and first-year
program evaluation were just a few of the ways in which the BCSSE results were used.
First-year programs, specifically, were proven to related increased retention and have a
positive correlation with student involvement, student satisfaction, graduation rates,
faculty attitudes, and more (Barefoot, Warnock, Dickenson, Richardson, & Roberts,
1998; Tobolowsky, Cox, & Wagner, 2005; Upcraft, Gardner, & Barefoot, 2005).
Barton and Donahue (2009) reported findings from the University of Maine at
Farmington comparing a first-year seminar course, first-year transition course and a one
week Summer Experience orientation. The BCSSE and NSSE were utilized to compare
the engagement, preparedness, and expectations of the students in the first-year seminar
and Summer Experience. Results showed that “retention was a little higher for first
semester and Summer Experience immediately after the semester but was reversed for
spring to fall, and retention was highest after the first semester for students taking both
Summer Experience and first-year seminar” (Barton & Donahue, 2009, p. 267). Student
academic performance (first-year GPA) was significantly higher for students who
participated in the first-year seminar course. Interestingly, only five out of the fourteen
corresponding expectations and engagement questions from the BCSSE and NSSE
resulted in statistically significant associations to whether the student participated or did
not participate in a first-year seminar (Barton & Donahue, 2009).
43
Students who participated in a first-year seminar had higher outcomes on time
spent on academic work, higher expectations about receiving academic assistance,
discussed grades and assignments with professors more, high expectations and outcomes
with attending campus events and activities, and lastly entered college with higher
expectations for vising creative art venues or events. From these findings, Barton and
Donahue concluded that first-year seminar courses attracted the academically prepared
students that continued on successfully in college (2009).
The data returned to institutions from the BCSSE had multiple uses and painted a
portrait of expected levels of college engagement, both academic and social. It was up to
the institution to decide on how the results of the survey were to form retention efforts,
course planning, academic advising, and other aspects at their institution. The BCSSE
survey administration procedures, instrument components, institutional reports, and
institution impacts were discussed in this section of the chapter. The validity and
reliability of the BCSSE relationship to the NSSE was reported in the following
Methodology chapter.
Summary
Retention, personality, and temperament were highly researched areas in
academia. A review of the literature on the three areas, though not exhaustive, supported
the importance of each of the topics. Previous studies of how personality impacted
student retention have been performed (Liang, 2010). Each instrument and research area

44
discussed employed facets of Tinto’s student engagement and internationalist theories
(1975; 1993).
45
METHODOLOGY The purpose of this study was to investigate the potential for a significant
explanatory relationship between self-perceived temperament styles and retention to the
second year of college in first-time, full-time freshmen enrolled in the College of
Agriculture at Montana State University (MSU). Approval from the Internal Revenue
Board (IRB) at MSU was obtained by the researcher to conduct the study.
This chapter described the instrumentation used and population of the study. The
research design, methods of data collection, and data analysis were also described. This
study did not record whether non-persisters at Montana State University transferred to
another higher education institution. Also, this study did not distinguish nor was
concerned whether non-persisters withdrew forcibly or voluntarily.
Instrumentation
The two instruments used in this study have been widely established and
employed before this study was conducted. Instruments used were the Beginning College
Survey of Student Engagement (BCSSE) and the Real Colors® temperament assessment.
Both were chosen for the study due to the unique descriptive portrayals of the purposive
sample. The Real Colors® assessment was a diagnostic tool that shed light on the
participant’s behavioral preferences. While the BCSSE provided data on the samples’
expectations of their first year of college. Together, the instruments produced a snapshot
of the purposive sample’s temperament types, and how their college expectations may
have, ultimately, affected their retention to the second fall semester of college. The

46
instruments fulfilled the roles that Dr. Paul Gore laid out for assessments (2014). They
were the following: “to supplement data already available to institutions in the
admissions record; to more accurately predict student strengths and weaknesses; and to
use that knowledge to leverage resources and services in a more efficient and effective
manner.” (Gore, 2014, p.7)
Beginning College Survey of Student Engagement
The first-year engagement factors that the Beginning College Survey of Student
Engagement (BCSSE) identified aligned with the variables outlined by Tinto (1987) in
his model of student retention. Tinto’s variables (1987) were the following: (1) peer-
group interactions, (2) interactions with faculty, (3) faculty concern for student
development and teaching, (4) academic and intellectual development, and (5)
institutional and goal commitment. It was important to choose an instrument that
captured each of these factors to bridge the connection between Tinto’s (1987) model and
this study.
During the 2012 summer freshman orientation session, the MSU Office of
Student Success required that “every entering freshman” take the BCSSE (Montana State
University, 2012, p.1). The BCSSE was physically administered and completed on paper
by the students. Results of the survey were reported back to MSU later in the fall
semester. Means and frequencies reports, along with raw data files, were housed in the
Office of Student Success for institutional leaders, staff, and faculty to view (Montana
State University, 2012). The fall 2012 BCSSE data set was accessed by the Director of

47
the Office of Student Success and disseminated to the researcher in an Excel pre-coded
spreadsheet during the spring 2014 semester.
Validity. Quality research not only employs sound methodology and an
established framework, but also utilizes valid and reliable instruments to gather data. The
Indiana University Center for Postsecondary Research has routinely produced validity
and reliability reports for the National Survey of Student Engagement (NSSE). In 2012,
Indiana University reviewed the relationship between the BCSSE and the NSSEE. The
review provided evidence of validity for both instruments. The BCSSE data used in the
validity study was from the 2008 administration and the NSSE data was from the 2009
administration. The sample included 13,000 first-year students enrolled in one of the 91
participating institutions that completed both the BCSSE in the summer of 2008 and the
NSSE in the spring 2009 (NSSE, 2013).
Variables used the 2012 study included five BCSSE scales that were
representative of high school academic engagement, college expectations, and attitude
toward academic work. The scales “range from 0 (low) to 10 (high) and include High
School Academic Engagement (alpha =.76), Expected First-Year Academic Engagement
(alpha =.72), Academic Perseverance (alpha = .80), and Expected Academic Difficulty
(alpha = .62)” (Indiana University, 2012, p. 1). The NSSE Benchmarks served as the
dependent variable and were organized into three scales that portrayed student
engagement. The three scales were Level of Academic Challenge (LAC), Active &
Collaborative Learning (ACL), and Student Faculty Interaction (SFI). Internal

48
consistency for the three benchmarks were previously established and were reported as
.714, .644, and .719 respectively.
The researchers used hierarchical linear modeling due to the nature of the BCSSE
data. Validity was established through the effect size of .31 of high school academic
engagement at step two in the study. “Academic engagement was significantly related to
level of academic challenge even after controlling for various student and institutional
characteristics.” (Indiana University, 2012, p. 2). The NSSE psychometric portfolio also
established concurrent validity on BCSSE scales which were proven to be “highly related
to NSSE benchmarks” (Gonyea & Miller, 2010, p. 18).
Real Colors®
The Real Colors® temperament assessment instrument was given to the
participants in the early weeks of the fall 2012, and the spring and fall 2013 semesters.
For the purpose of this study, the researcher exchanged Tinto’s “disposition” (1993, p.
37) for temperament. The assessment identified participants as a combination or
distribution of four temperament colors: Blue, Gold, Green, and Orange. Real Colors®
provided the researcher with an additional tool for understanding the behaviors of the
purposive sample (NCTI, 2005).
The administration of the Real Colors® diagnostic assessment met the conditions
outlined by Gore for why assessments should be used (2014). The conditions were the
following: (1) the assessment administration was intentional by the Real Colors®
certified facilitator. (2) The researcher and facilitator had a clear goal that focused on the
promotion of understanding temperament differences, and to how best work

49
collaboratively with them, in mind during the session. (3) The assessment was based on
temperament research and implemented because of the evidence proposed by Tinto
(1987; 1993). (4) The administration of the assessment led to action through the
conduction of this study, and application of implications and recommendations
Each research participant completed three different temperament identification
exercises in the Real Colors® Adult Version workbook. The first exercise instructed
participants to circle up to eight images, found on each of the four temperament color
cards, that “look[ed] most like” them (NCTI, 2005, p.6). Once completed, participants
ranked the color cards from 4 (most like them) to 1 (least like them) with number of
pictures they circled on the individual color cards under the corresponding temperament
color column on the scoring page.
The second exercise was on the reverse side of the color cards. Participants were
instructed to circle as many words and sentences that “sound[ed] most like” (NCTI, 2005,
p.7) them. Participants were directed by the facilitator not to circle the words and
sentences that described what they supposed people thought about them or what they
wished they were like, but to circle the words that truly described themselves.
Participants then ranked the color cards with the card that had the highest number of
words circled ranked as 4 and the card with the lowest number of words and sentences
circled ranked as 1.
The third exercise was a multiple choice sentence completion exercise.
Participants were asked to complete a sentence with four possible phrase endings labeled
as a, b, c, or d. Each of the four phrases corresponded with a specific color temperament.
50
Participants gave 4 points to the phrase that “is most like you”, 3 points to the phrase that
“is next most like you”, 2 points to the next, and 1 point to the phrase that “is least like
you” (NCTI, 2005, p.4). After participants completed the exercise, they transferred the
number of a’s, b’s, c’s, and d’s to the scoring grid at the bottom of the page.
The scores from each of the three exercises were totaled vertically in each of the
four color columns. The color column with the highest numeric value revealed the
primary temperament color of the participant. The column with the second highest
numeric value was the participant’s secondary temperament color. The same process was
repeated twice more which revealed the third and fourth temperament color (NCTI,
2005). The purpose of ranking temperament colors was to identify participant’s inherent
(primary) temperament style and subsequent styles they were capable of transitioning to
when primary temperament style was not applicable within a given situation or scenario.
Reliability & Validity. In spite the popularity of the Real Colors® temperament
assessment, no validity or reliability studies have been conducted. However, True
Colors™, a near identical temperament assessment, has undergone validity and reliability
tests (Whichard, 2006; Cooper, 2009). An evaluation study of the True Colors™
instrument cited the reliability and validity of the instrument.
In 2006, Dr. Judith Whichard conducted a reliability and validity study which
generated empirical data that solidified the instrument and supported the theories on
which it was based. The study included 416 participants over a four year period.
Participants were involved, at the time of the study, in a Level 1 Certification Training or

51
True Colors Awareness Workshop, or enrolled in a 100 level collegiate psychology
course (Whichard, 2006).
The Word Cluster assessment exercise in True Colors™ was determined
“relatively free from measurement error” at a 0.94 reliability coefficient (Whichard,
2006, p. 4). Content validity was measured against two highly popular personality
assessments, the MBTI and the DISC. All dimensions, except for the DISC Dominance
and True Colors™ Orange type, displayed significant content validity at the 0.05
confidence level. Construct validity was solidified by the underlying connections to key
temperament theories and was judged as highly accurate by the participants in assessing
characteristics and behavioral preferences (Whichard, 2006).
Population
Purposive sampling techniques were used for this study. The purposive sampling
technique was defined by Leedy & Ormrod as “people or other units [that were] chosen,
as the name implies, for a particular purpose” (2013, p.215). Thus, in purposive
sampling, participants were selected by the researcher for a specific reason (Singh, 2007).
For this study, the population was chosen by the researcher for four purposeful reasons:
(1) their enrollment in the College of Agriculture, (2) enrollment in the freshmen seminar
course AGED 140: Leadership Development for Agribusiness and Industry Employees,
(3) academic standing as a first-time, full-time freshmen, and lastly (4) they took the
BCSSE in the 2012 summer new student orientation session.

52
The population frame for this study was first-time, full-time, degree-seeking
freshmen that entered the College of Agriculture at Montana State University in the 2012
fall semester. First-time, full-time freshmen included in the study were defined as those
enrolled in a minimum of twelve credit hours, were of traditional age, and began their
college education at Montana State University. The sample was limited to participants
who were present on the day the survey was administered in the AGED 140 course
during a regular lab session in the fall 2012, spring 2013, or fall 2013 semesters. The
cohort was further limited to students who completed the BCSSE in the summer of 2012
new student orientation session prior to the start of the fall 2012 semester.
A total of 102 participants comprised the population for the study. Three separate
groups of students, defined by their semester of enrollment in the AGED 140 course,
were included in the study. The first group, from the fall 2012 semester, consisted of 31
participants. The second group, from the spring 2013 semester, included 34 participants.
The last group, from the fall 2013 semester, included 37. Of the total, 49 participants
were classified as first-time, full-time freshmen and met the four criteria for the purposive
sample. Thus, only 49 participants were included in the data analysis for the study. The
purposive sample was comprised of 21 participants from the fall 2012 group, 23 from the
spring 2013 group, and 5 from the fall 2013 group. Of those, 20 (40.8%) were male and
29 (59.2%) were female. The number of participants that were retained to their second
fall semester in college was 38 (77.6%). While only 11 (22.4%) were not retained to the
second fall semester.

53
Data Collection
The data collected for the study was classified as insubstantial measurements, due
to the absence of the physical qualities of the Real Colors®, BCSSE, and retention data
(Leedy & Ormrod, 2013) utilized in the study. To ensure the quality of data collected
from the temperament assessment, observation of the three groups of participants
engaging in the assessment was carried out by the researcher. To verify the accuracy of
the assessment and information collected, the facilitator allowed participants to move
between temperament colors if they felt they had typed themselves incorrectly.
Confidentiality maintenance of the temperament assessment results was the
responsibility of the facilitator until the proprietary information had been released to the
researcher by the students. Results from the Real Colors® temperament assessment was
student owned data and released to the researcher through an informed consent form
signed before the assessment began. Students in the AGED 140 course owned the data
for the reason that the cost of the Real Colors® book was funded through their fees for
the course. Once the facilitator released the temperament assessment results to the
researcher, the information was stored in a locked, secured, and confidential space.
For the purposive sample, high school GPA and SAT/ACT scores were obtained
from the Office of Registrar at Montana State University in the fall of 2013. High school
GPA was calculated based on courses required by Montana State University for
admission. The enrollment status of participants was obtained from the Dean’s Office in
the College of Agriculture. The retention of study participants was determined based
upon their enrollment status in the College of Agriculture at the beginning of the fall

54
2013 semester. The individual participant BCSSE data was obtained from the Director of
the Office of Student Success in the spring semester of 2014.
A unique identification number and an alias were assigned to each participant in
the selected sample to track them throughout the course of the study. This technique
aided the researcher in matching the BCSSE measures, Real Colors® assessment results,
high school GPA, SAT/ACT scores, and enrollment data with each specific study
participant.
Of the data collected on the purposive sample, missing values existed within the
data set. The high school GPA data had two missing values. Within the ACT Composite
data, 13 values were missing. The SAT Verbal and SAT Math scores both had 28 missing
values. The reasons for the missing values were attributed to four explanations: (1) some
participants took the ACT or SAT, (2) some took both the ACT and SAT, (3) scores were
not available due to citizenship or disability, or (4) students were in the top 10% of their
class and did not need to take the entrance test to be accepted into Montana State
University. Participants with missing data were included in the purposeful sample and not
deleted because deleted data would result in the loss of other necessary data that was
paramount to answering the research question. To avoid loss of necessary data to answer
the research question, the missing values were deemed not crucial to the validity and
reliability of the study.

55
Data Analysis
A descriptive quantitative research design was chosen for this study. “Descriptive
research, as the name suggests, enumerates descriptive data about the population being
studied and does not try to establish a causal relationship between events” (Singh, 2007,
p. 64). Descriptive design was required due to the data classified as insubstantial
measurements. The researcher examined the retention and temperament situation of the
participants as it was in real-life. The variables within the study were not manipulated or
maneuvered by the researcher during the data collection process. The independent
variables within the study were the Real Colors® temperament assessment results, high
school GPA, SAT/ACT scores, and the BCSSE data. The dependent variable within the
study was the enrollment data gathered depicting whether participants were retained to
the second fall semester in college.
In order to answer the research question, the following statistical procedures were
used to analyze the Real Colors®, BCSSE, high school GPA, SAT/ACT scores, and
enrollment data. Data was initially complied into a Microsoft Excel spreadsheet for
sorting and coding. Expert guidance in SPSS 20 for Windows was secured from a
Statistics professor at Montana State University. Confirmation bias was described by
Leedy and Ormrod as: “The researcher might bias the procedure by looking only for
those data that would appear to support the hypothesis” (2013, p. 39). By utilizing
external expert guidance, the researcher reduced confirmation bias in the analysis
process.
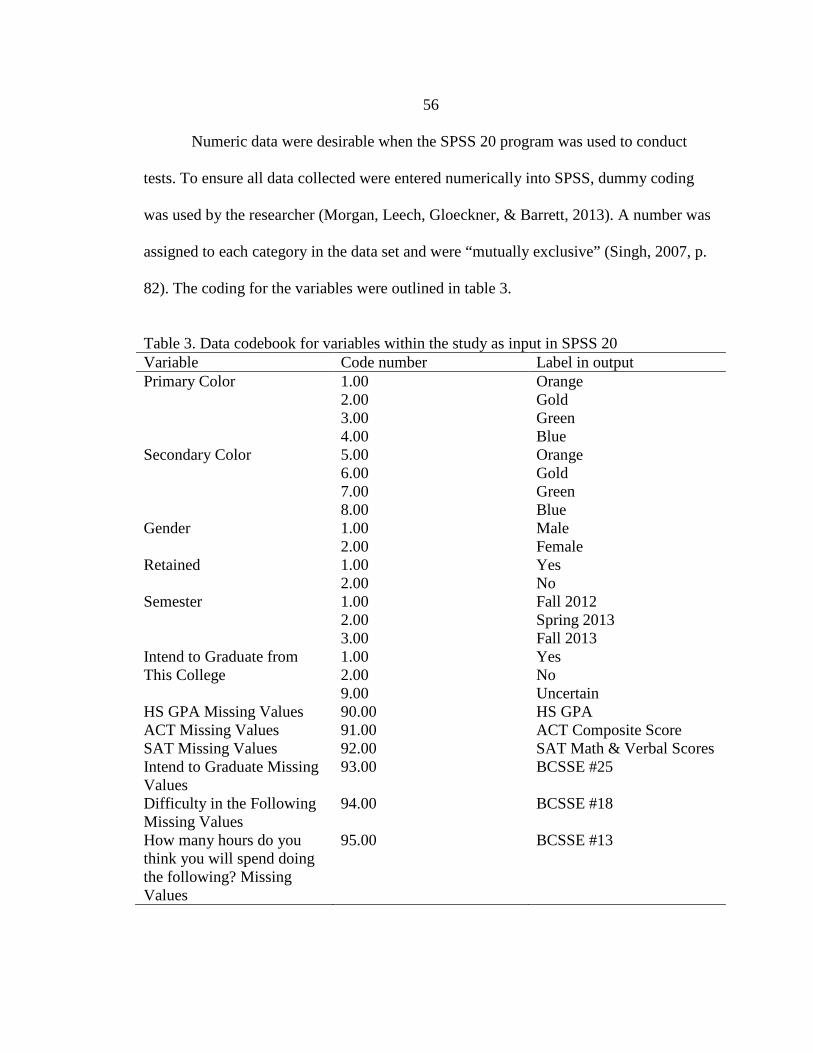
56
Numeric data were desirable when the SPSS 20 program was used to conduct
tests. To ensure all data collected were entered numerically into SPSS, dummy coding
was used by the researcher (Morgan, Leech, Gloeckner, & Barrett, 2013). A number was
assigned to each category in the data set and were “mutually exclusive” (Singh, 2007, p.
82). The coding for the variables were outlined in table 3.
Table 3. Data codebook for variables within the study as input in SPSS 20 Variable Code number Label in output Primary Color 1.00
2.00 3.00 4.00
Orange Gold Green Blue
Secondary Color 5.00 6.00 7.00 8.00
Orange Gold Green Blue
Gender 1.00 2.00
Male Female
Retained 1.00 2.00
Yes No
Semester 1.00 2.00 3.00
Fall 2012 Spring 2013 Fall 2013
Intend to Graduate from This College
1.00 2.00 9.00
Yes No Uncertain
HS GPA Missing Values 90.00 HS GPA ACT Missing Values 91.00 ACT Composite Score SAT Missing Values 92.00 SAT Math & Verbal Scores Intend to Graduate Missing Values
93.00 BCSSE #25
Difficulty in the Following Missing Values
94.00 BCSSE #18
How many hours do you think you will spend doing the following? Missing Values
95.00 BCSSE #13
57
For the BCSSE, the data provided was both nominal and scale data. The BCSSE
data was coded identically to the values and labels produced by Indiana University
(2012). The three questions chosen from the 2012 BCSSE that complimented the
behavioral results of the Real Colors® assessment were the following:
“Question 13: During the coming school year, about how many hours do you expect to
spend in a typical 7 day week doing each of the following?
a) Preparing for class (studying, reading, writing, doing homework or lab work,
analyzing data, rehearsing, and other academic activities)
b) Working for pay on- or off- campus
c) Participating in co-curricular activities (organizations, campus publications,
student government, fraternity or sorority, intercollegiate or intramural sports,
etc.)
d) Relaxing and socializing (time with friends, video games, TV or videos, keeping
up with friends online, etc.)
Question 18: During the coming school year, how difficult do you expect the following to
be?
a) Learning course material
b) Managing your time
c) Paying college expenses
d) Getting help with school
e) Making new friends
f) Interacting with faculty

58
Question 25: Do you expect to graduate from this college?
� Yes
� No
� Uncertain” (Indiana University, 2012)
A 0.05 alpha level was selected as the criterion for statistical significance in the
study. Both inferential and descriptive nonparametric statistical procedures were used to
analyze the data. Inferential statistics, as stated by Leedy and Ormrod, “help the
researcher make decisions about the data” (2013, p. 10). This particular type of statistical
measure assisted the researcher in estimating whether temperament was associated with
the BCSSE data and retention for the purposive sample. As discussed in the literature
review, temperament was a predetermined and constant way of behaving or viewing the
world. Temperament served as the population parameter because it was a characteristic of
the population that was held constant.
Descriptive and frequency tables were utilized to characterize, summarize,
organize, and simplify the data within the study. Measures of central tendency and
frequencies were displayed to show how many individuals (or scores) fit in each
temperament, gender, retention, and lab semester groups. Frequency distributions were
important given that Morgan, Leech, Gloecker, and Barrett believed they “are critical to
understanding our use of measurement terms” (2013, p. 37).
The frequency table results for the nominal data of primary and secondary
temperament, gender, retention, lab semester groups, and expectation to graduate were
reported in valid percentages. While BCSSE questions 13: A-D and 18: A-F scale data

59
were reported in cumulative percentages. The frequency distribution charts provided the
researcher visual confirmation of the distribution, either normal or skewed, of each
variable.
Mann-Whitney U tests were used as a result of the non-normally distributed
dependent variable of retention. Retention was a two-level dependent variable that was
tested against the independent, grouping variable of gender. Outcomes from the Mann-
Whitney U test would reveal whether the gender group with the higher mean rank was
most likely retained to the second fall semester in college. Four independent Mann-
Whitney U tests were conducted on BCSSE questions 13 and 18. Two additional Mann-
Whitney U tests were conducted to compare the two-level variable of gender against the
participant’s results from BCSSE questions 13 and 18. Lastly, two tests were conducted
to compare the dependent variable of retention to the results of BCSSE questions 13 and
18.
Kruskal-Wallis tests were performed due to the assumption of equality of group
variances was violated (Morgan, Leech, Gloeckner, & Barrett, 2013). The test was used
to (1) compare the mean ranks of the three semester groups with the Real Colors® results
and BCSSE questions 13, 18, and 25; (2) to compare if there was any statistically
significant difference between the four primary and secondary color temperaments and
participant’s retention to the second fall semester; (3) compare the four primary color
temperaments of Real Colors® and the BCSSE questions; and (4) comparing primary and
secondary temperament colors with high school GPA, ACT Composite score, SAT
Verbal, and SAT Math scores for statistical differences. The SPSS outputs showed

60
whether an overall difference occurred between the different levels and independent
variables of the study.
In order to explore whether a statistically significant relationship existed between
the primary and secondary temperaments, a Chi-square test was ran despite the small
sample size. As Morgan, Leech, Gloeckner, and Barrett (2013) recommended for data
that has more than two levels, the Cramer’s V was reported instead of the phi. A Chi-
Square test was performed to identify whether males and females differed in their
retention to the second fall semester of college. A second Fisher’s Exact test was
performed on the three-level BCSSE question 25 “Do you expect to graduate from this
institution” and the two-level dependent variable of retention. The multiple combinations
of the BCSSE questions, temperament, pre-college characteristics, and retention were
utilized in the computation of other Chi-Square tests to explore the possibility of
relationships between the data.
Spearman rho correlational tests were run due to some of the BCSSE results
yielding ordinal data. The Pearson parametric assumptions were also violated. A total of
four correlations were run to search for associations between the variables within the
data.
Summary
In conclusion, the study utilized 49 participants from the purposive sample of
first-time, full-time freshmen. The purpose of this study was to explore the possibility of
a significant explanatory relationship between self-perceived temperament styles and
61
retention to the second fall semester in college of participants enrolled in the College of
Agriculture and the AGED 140 course at Montana State University in the fall of 2012
and 2013, as well as the spring of 2013 semesters. IRB approval was received by the
researcher to conduct the study on October 24, 2013. Participants signed informed
consent forms that gave access to their temperament styles, BCSSE, and pre-college data
to the researcher. The chapter described the instrumentation utilized in the study, the
population, data collection procedures, and the data analysis process employed by the
researcher. Findings of the data analysis process were reported in Chapter 4.

62
RESULTS
Introduction
This study was designed to explore the possibility of a significant explanatory
relationship between the self-perceived temperament styles, Beginning College Survey of
Student Engagement (BCSSE) data, and pre-college data to the retention of first-time,
full-time freshmen in the College of Agriculture at Montana State University. This
chapter detailed the results of the study, while incorporating the essence of the study’s
theoretical framework (Tinto 1975; 1993). To satisfy the objectives of the study, the
results were divided into the following sections: College of Agriculture Freshmen Profile;
Beginning College Survey of Student Engagement (BCSSE); Pre-College and Retention;
and Temperament, Pre-College, BCSSE, and Retention Relationships.
College of Agriculture Freshmen Profile
The first objective of the study was to compare the Real Colors® temperament
assessment results with gender that created a separate lab and sample profile of the
freshmen enrolled in the AGED 140 Leadership Development for Agribusiness and
Industry Employees course in the fall 2012 semester, spring 2013 and fall 2013 semesters
at Montana State University (MSU). The specific variables utilized in the profiles were
gender and primary and secondary temperament. First, the sample was separated into lab
groups by semesters, then by gender, and lastly by primary and secondary temperament.

63
Frequencies were reported on the nominal data variables of primary and secondary
temperament, gender, and lab group.
The frequency distributions for the three separate lab groups were identified by
the corresponding semester the participants were enrolled in AGED 140. The fall 2012
group accounted for 42.9%; the spring 2013 group accounted for 46.9%, and the fall
2013 group accounted for 10.2% of the purposive sample. The fall 2013 group was
considerably smaller due to a bulk of the population in that semester group not meeting
the criterion to be a part of the purposive sample. There were no missing values within
the data set for lab groups.
Figure 2 displayed the gender distribution of the first-time, full-time freshmen
who met the criteria to be included in the purposive sample. The fall 2012 and spring
2013 group included nine males each; the spring 2013 group included two males. The
largest frequency of females (14) occurred in the spring 2013 group, the fall 2012 group
followed with 12, and the lowest frequency representation of females was the spring 2013
group with three.
Figure 2. Gender distribution of the purposive sample
Female, 60%
Male, 40%

64
Based on the Real Colors® temperament assessment, the largest percentage of
students in the purposive sample self-identified their primary temperament as Orange
(40.8%). Gold was second (24.5 %); Blue third (18.4%); and 16.3% of students self-
identified as Green (Figure 3). The secondary color distribution for the purposive sample
was as follows (Figure 4): Gold and Blue temperaments each accounted for 36.7%,
Orange accounted for 16.3%, and Green accounted for 10.2%.
Figure 3. Primary temperament distribution for the purposive sample
Figure 4. Secondary temperament distribution for the purposive sample
The primary and secondary temperaments were also categorized by gender. More
females self-identified as primary Gold, Green or Blue temperaments, while more males
reported an Orange primary temperament. With secondary temperaments, females
41%
25%
18%
16% OrangeGoldBlueGreen
16%
37%
10%
37% OrangeGoldGreenBlue
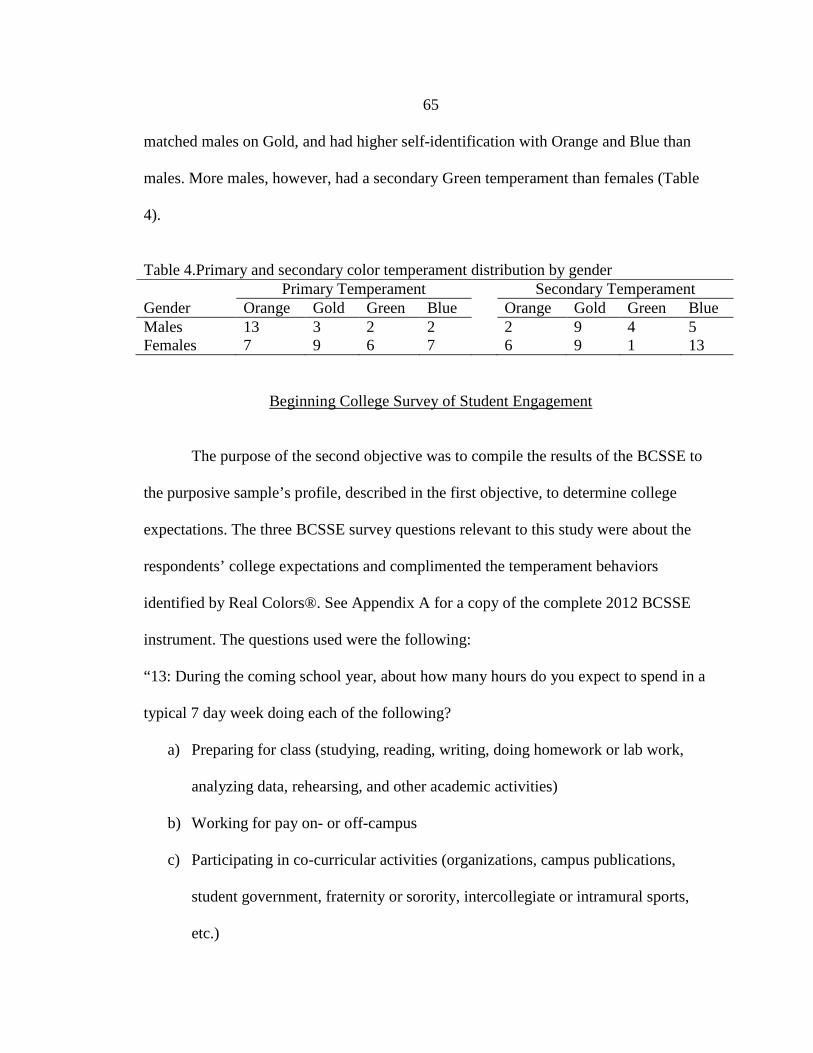
65
matched males on Gold, and had higher self-identification with Orange and Blue than
males. More males, however, had a secondary Green temperament than females (Table
4).
Table 4.Primary and secondary color temperament distribution by gender Primary Temperament Secondary Temperament Gender Orange Gold Green Blue Orange Gold Green Blue Males 13 3 2 2 2 9 4 5 Females 7 9 6 7 6 9 1 13
Beginning College Survey of Student Engagement
The purpose of the second objective was to compile the results of the BCSSE to
the purposive sample’s profile, described in the first objective, to determine college
expectations. The three BCSSE survey questions relevant to this study were about the
respondents’ college expectations and complimented the temperament behaviors
identified by Real Colors®. See Appendix A for a copy of the complete 2012 BCSSE
instrument. The questions used were the following:
“13: During the coming school year, about how many hours do you expect to spend in a
typical 7 day week doing each of the following?
a) Preparing for class (studying, reading, writing, doing homework or lab work,
analyzing data, rehearsing, and other academic activities)
b) Working for pay on- or off-campus
c) Participating in co-curricular activities (organizations, campus publications,
student government, fraternity or sorority, intercollegiate or intramural sports,
etc.)

66
d) Relaxing and socializing (time with friends, video games, TV or videos, keeping
up with friends online, etc.)
16: During the coming school year, how difficult do you expect the following to be?
a) Learning course material
b) Managing your time
c) Paying college expenses
d) Getting help with school
e) Making new friends
f) Interacting with faculty
22: Do you expect to graduate from this college?
� Yes
� No
� Uncertain” (Indiana, University, 2012)
BCSSE questions 13 and 18 produced scale-level data that required frequency
distribution, means, and standard deviation reports to describe the sample’s expectations.
For both questions, a total of 10 missing values were present within the data set. Only 39
values were included in the reports.
The purposive sample, for question 13, chose how many hours they expected to
spend per week on the following activities: preparing for class; working for pay on- or
off-campus; participating in co-curricular activities, and relaxing and socializing. The
seven expected hours per week categories were arranged on a Likert scale of the
following: 0 hours per week, 1-5 hours per week, 6-10 hours per week, 11-15 hours per
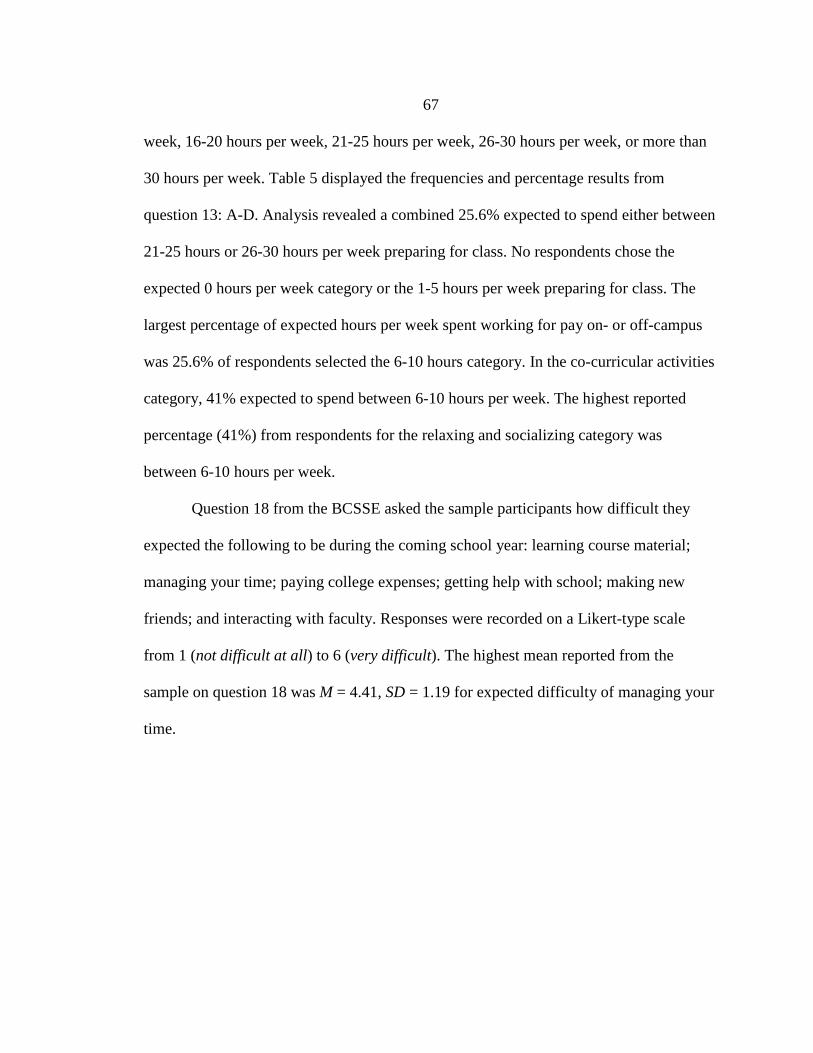
67
week, 16-20 hours per week, 21-25 hours per week, 26-30 hours per week, or more than
30 hours per week. Table 5 displayed the frequencies and percentage results from
question 13: A-D. Analysis revealed a combined 25.6% expected to spend either between
21-25 hours or 26-30 hours per week preparing for class. No respondents chose the
expected 0 hours per week category or the 1-5 hours per week preparing for class. The
largest percentage of expected hours per week spent working for pay on- or off-campus
was 25.6% of respondents selected the 6-10 hours category. In the co-curricular activities
category, 41% expected to spend between 6-10 hours per week. The highest reported
percentage (41%) from respondents for the relaxing and socializing category was
between 6-10 hours per week.
Question 18 from the BCSSE asked the sample participants how difficult they
expected the following to be during the coming school year: learning course material;
managing your time; paying college expenses; getting help with school; making new
friends; and interacting with faculty. Responses were recorded on a Likert-type scale
from 1 (not difficult at all) to 6 (very difficult). The highest mean reported from the
sample on question 18 was M = 4.41, SD = 1.19 for expected difficulty of managing your
time.
68
Table 5. Frequencies (n) and percentages (%) of the purposive sample’s BCSSE Question 13: A-D results
Dur
ing
the
com
ing
scho
ol y
ear,
abou
t how
man
y ho
urs d
o yo
u ex
pect
to sp
end
in a
typi
cal 7
-day
wee
k do
ing
each
of t
he fo
llow
ing?
A: Preparing for class Expected hours
spent n %
0 0 0 1-5 0 0
6-10 1 2.6 11-15 5 12.8 16-20 7 17.9 21-25 10 25.6 26-30 10 25.6 30+ 6 15.4
B: Working for pay on- or –off campus 0 6 15.4
1-5 4 10.3 6-10 10 25.6 11-15 8 20.5 16-20 6 15.4 21-25 4 10.3 26-30 1 2.6 30+ 0 0
C: Participating in co-curricular activities 0 2 5.0
1-5 5 12.8 6-10 16 41.1 11-15 7 17.9 16-20 7 17.9 21-25 1 2.6 26-30 0 0 30+ 1 2.6
D: Relaxing and socializing 0 0 0
1-5 9 21.3 6-10 16 41.0 11-15 9 23.1 16-20 2 5.1 21-25 2 5.1 26-30 0 0 30+ 1 2.6

69
The lowest mean reported was M = 2.46, SD = 1.09 for expected difficulty of making
new friends. The complete table of all means and standard deviations from the six
variables were listed in Table 6.
Table 6. Means (M) and Standard Deviations (SD) of BCSSE Question 18
During the coming school year, how difficult do you expect the
following to be?
Variable of Expected Difficulty M SD Learning Course Material 3.79 1.15 Managing your time 4.41 1.19 Paying college expenses 3.95 1.56 Getting help with school 2.90 1.37 Making new friends 2.46 1.09 Interacting with faculty 2.67 1.16
BCSSE Question 25 recorded the participant’s intention to graduate from this
institution (Montana State University) using nominal data. Participants had the option to
select one of three options— a box answering “yes”, “no” or “uncertain”. There were 11
missing values in the data set. Of the useable 38, 89.5% of sample participants expected
to graduate from Montana State University. Results from gender distribution revealed
that more females (n = 22) than males (n = 12) expected to graduate. None of the males
reported that they did not expect to graduate from this institution, leaving one female
reported “no”. Three respondents, all female, reported that they were uncertain as to
whether they expected to graduate from Montana State University.
Pre-College and Retention
The purpose of the third objective was to analyze the pre-college data—SAT
Verbal and Math scores, ACT Composite score, and high school GPA—against
enrollment data from the 2012-2013 and 2013-2014 academic years to identify whether

70
sample participants were retained to the second fall semester in college. It was useful to
define the pre-college characteristics to provide an accurate academic background of the
purposive sample. The means and standard deviations of the SAT Verbal and Math, ACT
Composite, and high school GPA data were reported for the sample. The retention data
for the sample and gender groups were reported in valid percentages as advised by
Morgan, Leech, Gloeckner, and Barrett (2013).
The mean high school GPA for the purposive sample was 3.48 (SD = .41). None
of the participants had a high school GPA below a 2.0. There were two missing high
school GPA variables within the data set resulting in only 47 scores accounted for in the
frequency distribution. Table 7 displayed the purposive sample’s high school GPA
distributed over five ranges.
Table 7. High School GPA range frequencies (n) and percentages (%) for the purposive sample Ranges n % <2.0 0 0 2.0-2.49 1 2.1 2.5-2.99 5 10.6 3.0-3.49 15 32 3.5-3.99 23 48.9 4.00 3 6.4 Total 47 100
The pre-college characteristics of the purposive sample provided insight as to
where the study participants at MSU ranked nationally. The mean ACT composite score
was M = 23.80 for the purposive sample. According to the national ranks of reported high
school graduates that took the ACT in 2012, 68% of high school graduates also attained a
score of 23 or lower (ACT, 2014). As reported by the National Center for Education

71
Statistics in 2012, the average SAT Math score in Montana in 2011-2012 was M = 536.
Participants in the purposive sample scored above the average with a mean score of M =
555.24 on the SAT Math test. The SAT Verbal score was M = 542.38, which was above
the state average of 536 in 2010-2012 (National Center for Education Statistics, 2012).
Table 8 illustrated the mean and standard deviations for the samples’ scores.
Table 8. Means (M) and Standard Deviations (SD) of SAT Verbal and Math and ACT Composite scores Test M SD SAT Verbal 542.38 99.34 SAT Math 555.24 70.75 ACT Composite 24 3.39
The retention data gathered from the Office of the Registrar comprised all 49
participants’ enrollment data for the 2013-2014 academic year. Of the sample, 77.6% (n
= 38) were retained to their second fall semester at Montana State University; 22.4% (n =
11) not retained. Of the 38 participants retained, 16 (42%) were males and 22 (58%) were
females. Of the 11 not retained to the second fall semester, four (36.4%) were males and
seven (63.6%) were females.
Temperament, Pre-College, BCSSE, and Retention Relationships
The purpose of objective four was to determine if a significant relationship
existed, and if so, to what magnitude, between temperament, the BCSSE, pre-college, and
retention data in the purposive sample. Mann-Whitney U, Kruskal-Wallis, Fisher’s exact
and Chi square, and correlational tests were utilized to determine relationships and
strength between variables in the study.

72
Mann-Whitney U Results for Background Characteristics
Because the data sets did not fit within parametric normality assumptions, non-
parametric Mann-Whitney U tests were performed to compare gender with retention to
the second fall college semester. The 29 female students had slightly higher retention
mean ranks (25.41) than the 20 male students, U = 278, p = 0.736, r = -0.05, which did
not meet the apriori critical value of 0.05. Males were no more likely than females to be
retained to the second fall semester in college.
Gender was next tested against the independent variables of high school GPA,
SAT Verbal and Math, and ACT Composite scores. Table 9 displayed the Mann-Whitney
U n, means ranks, U, and p values of gender and high school GPA, SAT Verbal and
Math, and ACT Composite. The 23 female students had a higher mean rank (21.63) than
the 13 males (12.96) on the ACT Composite scores, U = 77.50, p = 0.017, r = 0.40,
which was a statistically significant difference and considered a medium effect size.
Females came close to having a statistically significant higher mean rank (12.86) than
males (7.43) on their SAT Math scores, U = 23, p = 0.056, r = 0.42. However, the gender
variable did not reveal statistically significant differences when compared to high school
GPA or SAT Verbal scores. The mean score for high school GPA for males was 22.53
and for females was 25, U = 238, p = .544, r = -.09. The mean SAT Verbal scores for
males was 7.43 and 12.79 for females, U = 24, p = .061, r = -.41.
Table 9. Mann-Whitney U n, means ranks, U, and p values of gender and high school GPA, SAT Verbal and Math, and ACT Composite Scores
Pre-College Variables
Gender n Mean Rank U p High School Male 19 22.53 238 0.544

73
GPA Female 28 25.00 Totals 47
ACT Composite Score
Male 13 12.96 77.50 0.017
Female 23 21.63
Totals 36
SAT Verbal Male 7 7.43 24 0.067 Females 14 21.63 Total 21
SAT Math Male 7 7.29 23 0.056
Female 14 12.86 Total 21
Mann-Whitney U Results For BCSSE Question 13 and 18
Questions 13 and 18 on the BCSSE were tested against gender through two
Mann-Whitney U tests. Neither males nor females returned statistical significance on any
of the four variables of question 13 on the BCSSE. However, on BCSSE question 18: B,
the 26 female participants had higher mean ranks (22.48) than the 13 males (15.04) on
how difficult they expected managing their time to be in college, U = 104.50, p = 0.044, r
= -0.32, a medium effect size. Males and females did not differ significantly on any of the
other variables in question 18. Table 10 displayed the n, mean ranks, U, and p values
from BCSSE question 18: A-F and gender.
Two Mann-Whitney U tests were performed to test against retention and BCSSE
questions 13 and 18. Results of the test showed that there was no statistical significance
between the participants that were and were not retained to the second fall semester in
college and their BCSSE results on question 13 and 18.

74
Table 10 Mann-Whitney U Test n, Mean Ranks, U, and p values from BCSSE question 18 and gender
Dur
ing
the
com
ing
scho
ol y
ear,
how
diff
icul
t do
you
expe
ct th
e fo
llow
ing
to b
e:
Variable Gender n Mean Ranks U p A: Learning course material
Male 13 17.92 142 0.401 Female 26 21.04 Total 39
B: Managing your time Male 13 15.04 104.5 0.044 Female 26 22.48 Total 39
C: Paying college expenses Male 13 18.19 145.5 0.475 Female 26 20.90 Total 39
D: Getting help with school Male 13 21.23 153 0.622 Female 26 19.38 Total 39
E: Making new friends Male 13 16.04 117.5 0.111 Female 29 21.98 Total 39
F: Interacting with faculty Male 13 20.96 156.5 0.701 Female 29 19.52 Total 39
Kruskal-Wallis Results
The Kruskal-Wallis test allowed analysis of statistically significant differences
between two nonparametric independent grouping variables (Table 11). For this research,
Kruskal-Wallis was used to determine whether a statistically significant difference
existed between the three semester groups, their Real Colors® primary temperaments and
BCSSE questions 13: A-D, 16: A-F, and 25 through four separate tests. A total of 39 data
points were a part of the analysis.
The first test indicated that the three respondent groups differed significantly only
on BCSSE 13-D: “During the coming school year, about how many hours do you expect
to spend in a typical 7-day week doing each of the following:

75
Table 11. Kruskal-Wallis results of the three semester groups for BCSSE Questions 13 and 18 values n, mean ranks, degrees of freedom (df), and p
Q 13: During the coming school year, how many
hours do you expect to spend in a
typical 7-day week doing each of the following:
Variable Lab Group n Mean Ranks df p
A: Preparing for class
Fall 2012 21 18.21 2 0.309 Spring 2013 14 23.61 Fall 2013 4 16.75
B: Working for pay on- or off-campus
Fall 2012 21 19.98 2 0.369 Spring 2013 14 18.04 Fall 2013 4 27
C: Participating in co-curricular activities
Fall 2012 21 20 2 0.615 Spring 2013 14 18.64 Fall 2013 4 24.75
D: Relaxing and socializing with friends
Fall 2012 21 19.71 2 0.050 Spring 2013 14 17 Fall 2013 4 32
Question 18: During the
coming school year, how difficult
do you expect the
following to be?
A: Learning course material
Fall 2012 21 19.21 2 0.835 Spring 2013 14 20.43 Fall 2013 4 22.63
B: Managing your time Fall 2012 21 19.81 2 0.706 Spring 2013 14 21.36 Fall 2013 4 16.25
C: Paying college expenses
Fall 2012 21 20.64 2 0.898 Spring 2013 14 18.89 Fall 2013 4 20.50
D: Getting help with school
Fall 2012 21 22.40 2 0.340 Spring 2013 14 17.18 Fall 2013 4 17.25
E: Making new friends Fall 2012 21 22.43 2 0.040 Spring 2013 14 20 Fall 2013 4 7.25
F: Interacting with faculty
Fall 2012 21 19.14 2 0.775 Spring 2013 14 21.68 Fall 2013 4 18.63
Relaxing and socializing (time with friends, video games, TV or video, keeping up with
friends online, etc.)”, χ2 (2, n = 39) = 5.97, p = 0.05, and BCSSE 18-E: “During the
coming school year, how difficult do you expect the following to be? Making new
friends”, χ2 (2, n = 39) = 6.419, p = .040. The lab groups did not differ significantly on

76
any other variables in questions 13 and 18. The three groups also did not differ
significantly on BCSSE question 25.
Post hoc Mann-Whitney U test compared the three semester lab groups on
BCSSE 18-E using a Bonferonni corrected p value of 0.017 to indicate statistical
significance. Three individual Mann-Whitney U tests were performed comparing the fall
2012 group to the spring 2013 group; the fall 2012 group to the fall 2013 group; and the
spring 2013 group to the fall 2013 group. No statistically significant differences were
returned between the fall 2012 and spring 2013 comparisons or between the fall 2012 and
fall of 2013 comparisons. However, the spring 2013 and the fall 2013 comparisons
returned a significance level just outside the corrected p criterion (11.00, n = 25), z = -
2.372, p = 0.019.
Post hoc Mann-Whitney U tests were also performed to compare the three
semester groups on BCSSSE 13-D. Three individual Mann-Whitney U tests were
performed that compared the fall 2012 group to the spring 2013 group; the fall 2012
group to the fall 2013 group; and the spring 2013 group to the fall 2013 group. No
statistically significant differences were revealed using the Bonferonni corrected p.
A second Kruskal-Wallis test was performed on the four primary and four
secondary temperaments against retention to the second fall semester. Results from the
showed that there were no statistically significant differences between the primary
temperament groups and retention to the second fall semester, χ2 (3, n = 49) = 3.27, p =
0.352. There was also no statistically significant difference between the secondary
temperaments and retention, χ2 (3, n = 49) = 5.49, p = 0.139.

77
The third Kruskal-Wallis test was performed on the four primary temperaments
and the BCSSE questions 13: A-D, 18: A-F, and 25. The test indicated the four primary
temperament color groups differed significantly on BCSSE 18-E: “During the coming
school year, how difficult do you expect the following to be? Making new friends”, χ2 (3,
N = 39) = 13.43, p = .004 (Table 12). Four individual Mann-Whitney U tests were
performed to compare each primary color temperament group and BCSSE 18-E using a
Bonferonni corrected p value of .017 to indicate statistical significance.
Table 12. Post-hoc Mann-Whitney U test to compare temperament to BCSSE question 18: E During the coming school year, how difficult do you expect the following to be: Making new friends
Temperament n Mean Ranks U p Orange 15 10.33 35 0.010 Gold 11 15.04
Orange 15 8.37 5.50 0.004 Green 5 16.90 Orange 15 11.97 59.50 0.972
Blue 8 12.06 Gold 11 7.45 16 0.171 Green 5 10.80 Gold 11 12.09 21 .048 Blue 8 7.13
Green 5 10.10 4.50 0.19 Blue 8 5.06
Results uncovered a statistically significant difference between the primary temperament
colors of Orange and Gold, (35.00, n = 26), z = -2.59, p = 0.010, and between Orange and
Green, (5.500, n = 20), z = -2.900, p = 0.002, on BCSSE 18:E. No statistically significant
differences emerged between the other temperament color groups and BCSSE 16-E.
The final Kruskal-Wallis compared temperament to high school GPA, ACT
Composite, SAT Verbal, and SAT Math scores. No statistically significant differences

78
emerged in the test of primary temperament. Also, there was no statistically significant
difference between the secondary temperament groups and the pre-college enrollment
data.
Chi-square
A Chi-square test was ran to compare the two primary and secondary
temperament groups. Because there were more than two levels of the independent
temperament variables, the Chi-square was performed over the Fisher’s exact test, despite
the small sample size. Cramer’s V was reported instead of phi due to the presence of
different levels within the variables. The test resulted in a statistically significant
difference between the primary and secondary temperament groups, (χ2 = 20.87, df = 9, N
= 49, p = 0.013. Table 13 displayed the cross-tabulation between the primary and
secondary temperaments.
Table 13. Cross-tabulation between the primary and secondary temperaments in the purposive sample
Primary Temperament
Secondary Temperament n Orange Gold Green Blue χ2 p Orange 20 0 8 3 9 20.87 0.013 Gold 12 5 0 1 6 Green 8 1 4 0 3 Blue 9 2 6 1 0
Totals 49 8 18 5 18 Correlations
Because the assumptions of the Pearson product moment correlation were
violated, the Spearman rho was used to compute correlation between the variables in the
data set. The first correlation computation was exploring the possibility of an association
79
between primary and secondary temperament in the purposive sample. Results showed
that there was a statically significant negative association between the primary and
secondary temperaments in the purposive sample, r (49) = -0.342, p = 0.016. When the
association between primary temperament and retention was explored, results revealed
that there was no statistically significant association between the two, r (49) = -0.216, p =
0.136. There was also no statistical significant association found between secondary
temperament and retention to the second fall semester in college, r (49) = 0.192, p =
0.187.
A correlation matrix was computed to discover whether associations existed
between multiple non-normally distributed variables within the data set. A total of three
correlation matrices were computed. The first correlation matrix explored the possibility
for an association among the four variables of primary and secondary temperaments,
retention to the second fall semester in college, and lab semester groups. No statistically
significant correlations were found among the four variables—besides between primary
and secondary temperaments previously reported—in the purposive sample.
The second correlation matrix computed was among primary and secondary
temperaments, retention, and the pre-college data of high school GPA, SAT Verbal and
Math, and ACT Composite scores. A statistically significant association among the
purposive sample’s ACT composite scores and SAT Verbal and Math scores were
reported and displayed in Table 14. The strongest positive correlation was between ACT
Composite scores and SAT Math scores, r (10) = 0.86, p = 0.001. This meant that
students who had relatively high ACT Composite scores were also very likely to have

80
high SAT Math scores. The ACT Composite scores also displayed a positive statistically
significant correlation to SAT Verbal scores, r (10) = 0.76, p = 0.011.
Table 14. Correlations between primary and secondary temperament, retention, high school GPA, ACT Composite, and SAT Verbal and Math scores in the purposive sample Variable 1 2 3 4 5 6 7 1. Primary Temperament -- 0.183 0.147 0.572 1.00 0.794 0.931
2. Secondary Temperament -- -- 0.427 0.162 0.841 0.876 0.654
3. Retention -- -- -- 1.00 0.203 0.459 0.119 4. High school GPA -- -- -- -- 0.562 0.859 0.375
5. ACT Composite -- -- -- -- -- 0.011* 0.001**
6. SAT Verbal -- -- -- -- -- -- 0.211
7. SAT Math -- -- -- -- -- -- -- * p <0.05 ** p
<0.01
A third correlation matrix was computed among primary and secondary
temperament, retention, and BCSSE questions 13, 18, and 25 (Table 15). Multiple
positive and negative statistically significant associations were found between the
variables in the data set. The association between primary and secondary temperaments
strengthened when the BCSSE questions were added to the matrix, r (38) = -0.413, p =
0.010. Secondary temperament and BCSSE 18: A “During the coming school year, how
difficult do you expect the following to be: Learning course material” was just outside of
statistical significance, r (38) = -0.319, p = 0.051. A negative statistically significant
association between secondary temperament, and BCSSE 18: C “During the coming
school year, how difficult do you expect the following to be: Paying college expenses”, r

81
(38) = -0.339, p = 0.037. No statistically significant association was uncovered between
retention and any of the variables in this correlation matrix.
The BCSSE questions 13: A-D, 16: A-F, and 25 showed statistically significant
correlations between each other. BCSSE 13: A “During the coming school year, about
how many hours do you expect to spend in a typical 7-day week doing the following:
Preparing for class” was found to have a positive statistically significant association with
BCSSE 18: B “Managing your time”, r (38) = 0.365, p = 0.024. Question 13: B
“Working for pay on- or off-campus” also had a positive statistically significant
correlation to BCSSE question 25 “Do you expect to graduate from this institution”, r
(38) = .331, p = 0.043. BCSSE 13: C “Participating in co-curricular activities” was found
to have a strong, positive association with 13:D , r (38) = .458, p = 0.004. While, BCSSE
13: D “Relaxing and socializing” also had a strong, negative association with BCSSE 18:
E “Making new friends”, r (38) = -0.436, p = 0.006. Question 18: A “Learning course
material” reported to have a strong, positive association with 18: B “Managing your
time”, r (38) = .421, p = 0.009.

Table 15. Correlations between primary and secondary temperament, retention, and BCSSE questions 13: A-D and 18: A-F Variable 1 2 3 4 5 6 7 8 9 10 11 12 13 14 1.Primary -- .010** .058 .892 .466 .495 .998 .575 .137 .139 .820 .295 .975 .135 2.Secondary -- -- .064 .962 .218 .323 .795 .051 .340 .037* .921 .761 .589 .083 3. Retention -- -- -- .167 .451 .487 .987 .321 1.00 .542 .342 .841 .526 .288 4.13: A -- -- -- -- .409 .204 .456 .267 .024* .479 .673 .708 .443 .135 5.13: B -- -- -- -- -- .873 .464 .377 .325 .165 .583 .204 .105 .043* 6.13: C -- -- -- -- -- -- .004** .293 .347 .722 .636 .076 .129 .164 7.13: D -- -- -- -- -- -- -- .079 .813 .513 .280 .006** .161 .269 8.18: A -- -- -- -- -- -- -- -- .009** .171 .108 .622 .747 .377 9.18: B -- -- -- -- -- -- -- -- -- .020* .250 .210 .461 .541 10.18: C -- -- -- -- -- -- -- -- -- -- .103 .407 .007** .098 11.18: D -- -- -- -- -- -- -- -- -- -- -- .008** .071 .920 12.18: E -- -- -- -- -- -- -- -- -- -- -- -- .003** .762 13:18: F -- -- -- -- -- -- -- -- -- -- -- -- -- .906 14. 25 -- -- -- -- -- -- -- -- -- -- -- -- -- -- * p <0.05 ** p <0.01
82

83
18: B also had a positive association with 18: C “Paying college expenses”, r (38) = .377,
p = 0.020. Following suit, 18: C had a positive strong association with 18: F “Interacting
with faculty”, r (38) = .428, p = 0.007. 18: D “Getting help with school” and 18: E
“Making new friends” reported a strong positive association, r (38) = .422, p = 0.008.
Lastly, 18: E and 18: F “Interacting with faculty” was reported to have a strong positive
association between each other, r (38) = .475, p = 0.003.

84
CONLUSION AND DISCUSSION Descriptive and quantitative in design, this study investigated the potential for a
significant explanatory relationship between self-perceived temperament style and
retention to the second fall semester in first-time, full-time freshmen in the College of
Agriculture at Montana State University. The research findings were based on the results
from the Real Colors® diagnostic assessment, the Beginning College Survey of Student
Engagement (BCSSE), and pre-college academic factors.
Within the chapter, the outcomes from the objectives were outlined. Implications
were made in relation to college of agriculture retention programming, academic and
career advising, and agriculture education and leadership courses. The chapter concluded
with a discussion on recommendations for future research.
Outcomes
The completion of objectives in chapter four was accomplished through multiple
descriptive and inferential nonparametric statistical procedures. To ultimately answer the
research question and satisfy the purpose, correlational tests were run between the Real
Colors® results and retention data. Objectives one through three were crucial in order to
adequately describe the population and compare with past research on the personality
types of college of agriculture students. Objective four combined data from the other
three objectives, leading to recommendations and implications.

85
Objective One The purpose of objective one was to create a temperament profile of each
semester group and a sample profile including all groups. In both fall 2012 and spring
2013 semester groups, the largest primary temperament group was identified as Orange.
The Gold temperament was identified as the largest secondary temperament group. Gold
primary and Blue secondary were the second largest groups. The fall 2013 temperament
groups were incongruent with the previous two due to the small number of participants
that met the criterion of the purposive sample. Figure 5 displayed the sample’s
temperament distribution.
Figure 5. Primary and secondary temperament distribution
The purposive sample in this study was compared with the descriptions of college
of agriculture students reported by Barrett in her 1985 study. Barrett’s (1985) profile of
college of agriculture students was chosen as the comparison due to her population being
most-like the population in this research. The Myers-Briggs Type Indicator (MBTI) and
Keirsey and Bates (1978) four temperament types were reported in Barrett’s (1985)
0.00%5.00%
10.00%15.00%20.00%25.00%30.00%35.00%40.00%45.00%
PrimaryTemperament
SecondaryTemperament
OrangeGoldGreenBlue

86
study. The Real Colors® temperament types were linked to the four temperament types
reported in Barrett’s study. See Table 4 for the comparison of Real Colors® to the
Keirsey and Bates temperament types.
This study’s findings of the largest primary temperament group was congruent
was Barrett’s (1985) findings of Sensing-Perceiving’s/Orange temperament as the largest
group. Also congruent with Barrett’s study was the Sensing-Judging/Gold temperament
group being the second largest group. Incongruent, however, with Barrett’s findings was
this study’s third and fourth largest temperament groups. Barrett reported Intuitive-
Thinking/Green, being the third largest, and Intuitive-Feeling/Blue, was the smallest of
the student temperament groups. As Barrett noted, “these findings may have major
implications on the approaches used to improve teaching and learning for agricultural
college students” (1985, p. 53).
Educators have been aware that students learn differently. The representation of
Orange may suggest that first-time, full-time freshmen in the College of Agriculture
preferred to learn hands on and enjoyed the practical applicability of agricultural topics.
The Gold and Blue temperament groups may have been drawn to the College of
Agriculture because of their dedication to family traditions or way of life. Each of these
suppositions were congruent with Keirsey (1998) and the Real Colors® (NCTI, 2005)
view of the primary temperament groups.
Objective Two The purpose of objective two was to compile the results from the BCSSE survey
questions 13, 18, and 25 to uncover the sample’s first-year of college expectations. A

87
little over a quarter of the purposive sample expected to work between 6-10 hours per
week during their first year in college. While only a small margin of the sample, 2.6%,
expected to work between 26-30 hours per week.
Tinto noted (1993) that students who felt integrated into the institutional and
social communities of an institution were more likely to be retained. 41% of the
purposive sample expected to spend between 6-10 hours per week engaged in co-
curricular activities. This suggested that students in the sample entered college with the
expectation of joining a student organization or intramural sport team. Entering college
with the expectation of becoming involved in campus life (social and institutional) could
positively increase retention to the second fall semester in college through the
encouragement of academic advisors.
Interestingly, 41% of the purposive sample also reported to expect to spend
between 6-10 hours per week relaxing and socializing (time with friends, video games,
TV or videos, keeping up with friends online, etc.). The occurrence of the same
percentage of students expecting to become involved in co-curricular activities and spend
the same amount of time relaxing gave rise to the perception that students expected to
spend less time socializing during their first year in college and more time on coursework
and studying.
The BCSSE results from question 13 and 18 and primary temperaments of
Orange, Gold, and Blue bolstered the conclusion that the first-time, full-time freshmen in
the College of Agriculture answered BCSSE questions according to their primary
temperament. When it came to education, Orange’s and Gold’s expected to succeed in
college, but for two completely different reasons. Oranges expected to spend a lot of time
88
studying so that they can get the passing grade and graduate, or may have become
competitive with classmates and friends to see who received the higher grade. As Dr.
Stephen Montgomery described this temperament type, “Their actions are aimed at
getting them where they want to go… do whatever it takes to accomplish their goals”
(2002, p. 21).
Gold’s expected to study long hours because they, too, liked to receive high
grades and notoriety. This also could have been due to their desire to plan and prepare
carefully and thoroughly (Keirsey, 1998; Montgomery, 2002; NCTI, 2005). Blues,
meanwhile, operated and had expectations to succeed in college that came from a
different end of the behavioral continuum. Blues may have expected to spend long hours
studying and a good amount of time per week engaging in co-curricular activities and
socializing due to their desire to be included, involved, and foster personal growth in
themselves and others (Keirsey, 1998; Montgomery, 2002; NCTI, 2005). They may have
joined organizations, worked a small part-time job, or studied in peer groups to “inspire
others to develop as individuals and to fulfill themselves” (Montgomery, 2002, p. 31).
Knowing the level of expected difficulties and hours spent engaged in certain aspects of
campus or community life of first-time full-time freshmen should empower institution
and college of agriculture faculty and staff to form programs and plan coursework
accordingly.
Nearly 90% of first-time, full-time freshmen reported that they expected to
graduate from Montana State University. The number of females was almost double the
number of males for this finding, which further confirmed Tinto’s (1975; 1993) findings

89
that institutional commitment and commitment to graduate were critical factors to a
student’s retention decision.
Objective Three The purpose of objective three was to analyze and compile the pre-college data—
SAT Verbal and Math scores, ACT Composite scores, and high school GPA— and
enrollment data from the 2012-2013 academic year to the 2013-2014 academic year to
identify what percentage of the purposive sample was retained to the second fall semester
of college. Both the mean SAT Verbal and Math scores of the purposive sample were
above the state average of graduating seniors (National Center for Education Statistics,
2012).
Resembling the high pre-college scores, a high percentage of participants, almost
80%, was retained to the second fall semester of college, just 10% lower than the
expectation to graduate. More females than males were retained. The 22% of students
who were not retained included more females than males. The high scores reported from
the admission requirements mimicked the high number of students retained. However,
the retention of the sample was higher than the overall institutional retention rate.
Objective Four
The purpose of objective four was to determine whether a relationship existed,
and to what magnitude, between self-perceived temperament style, and BCSSE
responses, pre-college data, and retention to the second fall semester.
Results from the nonparametric test showed that males were no more likely to be
retained than females to the second fall semester in college. Females did, however, have

90
higher ACT Composite scores than males. Males and females differed significantly on
their expected difficulty of managing their time during their first year of college. Females
were more concerned with managing their time during their first year of college than
males. This expected concern with time management was no surprise due to it being
primarily a Gold temperament trait, of which females were the largest primary
temperament group within the sample.
No statistically significance between the BCSSE questions13: A-D and 18: A-F
and retention was discovered. This could have been due to the small sample size. The
three lab semester groups differed significantly on how difficult they expected making
friends and how many hours they expected to spend socializing and relaxing.
Specifically, the comparison between the spring 2013 and fall 2013 group fell just outside
statistical significance on expected difficulty of making new friends during their first year
in college.
The Orange and Green, as well as the Gold and Green temperaments differed
significantly on their expected difficulty of making friends during the first year in
college. Students who expected a great deal of difficulty making new friends also
expected a great degree of difficulty getting help with school work also. The anticipated
long hours spent studying, perhaps in solitary because of the perceived difficulty with
finding help on assignments, could have detracted from the student’s time spent meeting
new people on- and off-campus.
The primary and secondary temperaments of the purposive sample did not have
an effect on whether they were retained or not to the second fall semester of college at
Montana State University. This could have been due to small sample size, which was also

91
the possible case in Liang’s research on temperament and retention (2010).There was
also no correlation found between temperament, semester group, and retention. However,
student’s secondary temperament could have potentially influenced their financial stress
level of paying for college.
Students who were concerned about managing their time also expected to spend a
large number of hours per week preparing for classes. The two largest primary
temperaments represented in the sample, Orange and Gold, could have attributed to this
outcome. It was the temperament’s distinctly different views of college that call attention
to their expectations. The expectation of spending less hours working on- or off-campus
during their first year also meant a higher expectation of graduating from Montana State
University. Conversely, students who expected to spend a great deal of time working had
a lower expectation of graduating from Montana State University. In light of the
temperament groups, Orange students could have expected to graduate when working
less because they had more free time to have fun and study. Gold students could have
expected to graduate when working less due to the time available to them to study, seek
help, create study groups, and join organizations.
Students who expected to spend a high amount of time participating in co-
curricular activities also expected to spend a large amount of their time relaxing and
socializing with friends. Students may have anticipated that spending time on co-
curricular activities was the same as spending time with friends. The more students spent
time with those they served with in organizations and played with on intramural teams,
the more likely they could have been to become friends. These students who expected to
spend more time relaxing and socializing with friends also expected less difficulty in
92
making friends. The expectation of spending a lot of time with a social group could have
translated to the students’ openness to meeting and forming friendships with others.
The students who were highly concerned with learning course material were also
concerned as to how they were going to manage their time during their first year in
college. These same students whom were concerned with managing their time during
their first year in college were also concerned with paying for the college education.
The expectation of having a hard time paying for college was coupled with the
expectation of having a difficult time interacting with faculty The vice versa was also
true. This disconnect could have been due to limited number of hours spent on campus
due to work schedules of first-time, full-time freshmen.
Implications and Recommendations
Based on the findings and conclusions of this research, the following
recommendations were presented:
1. Retention programs or course study groups focused on gathering together students
outside normal school hours who are struggling in a course or multiple courses so
an opportunity to create new social communities and develop time and course
management skills.
2. Institutional leaders and advisors should offer, publicize, and educate students on
the scholarship and other financial services that assist in paying for college.
3. Instructors should intentionally mention their office hours or hours of availability
to students for assistance. Instructor and advisor awareness should increase of
students whom were experiencing difficulty paying for college.
93
4. Faculty and staff needed to be sensitive to the different ways in which students
with different temperaments perceived the workload of their first year in college,
and possibly even first few months in college courses.
5. Instructors should keep course assignments practical; relate course material to the
types of jobs; provide hands on activities; and encourage big picture thinking.
Personality was a well-established factor in retention studies. The inclusion
helped to paint a picture of the students who were enrolled in the College of Agriculture
(COA) at Montana State University (MSU). David Keirsey reminded us that we should
not view people with different temperaments than ourselves as bad or strange (1998).
Retention researchers should not view students with specific temperaments or traits as
unsuccessful due to a statistical indication that their primary temperament predicts
dropout. Instead, programs need to be constructed that engage and build up the less
prominent temperaments present in students—to balance the humors as Galen would
have recommended. Institutions cannot be “sculpting others into our own likeness” to
increase retention rates (Keirsey, 1998, p. 2).
First-time full-time freshmen encountered various and large amounts of new
experiences in their first year of college. Researchers and educators should display
student’s talents and difficulties strengthened through retention programs and classroom
learning. Implications and recommendations of this study provided an opportunity for
student development and on college campuses. Implications of the findings were applied
to retention programming, academic and career advising in the College of Agriculture,
and for the planning of Agriculture Education and Leadership courses. Recommendations
for future research were also explored.

94
Building Effective College of Agriculture Retention Programming
Upcraft, Gardner, and Barefoot (2005) noted the preponderance of research
supporting the importance of freshmen’s first-year experience in college. However, this
study was the second to be conducted at Montana State University on retention and COA
students. As a result of this study, the faculty and staff of the Agricultural Education
Division and the College of Agriculture were provided a profile of the students to consult
when planning programs that engaged the four temperament groups. The more
knowledge of student behavior available, the more successful we can be at helping
students reach their academic and personal goals (Seidman, 2012).
For students identified as Gold, the concern about making friends could have been
due to their belief that they must work hard to be successful, which minimized time spent
with friends. To a Gold college is a time to build the skills and make the network
successfully to obtain a good job after graduation. A Gold’s need and desire for planned
events inhibits attendance of impromptu or poorly marketed social or institutional
activities. Also, dedication to their family and home communities could contributed to the
expected difficulty that would have resulted in a less active campus life (Keirsey, 1998;
Montgomery, 2002; NCTI, 2005).
For the students who identified themselves as Green, their expectation of having
difficulty making friends was not surprising. Students with the Green temperament
preferred to spend more time thinking, staying in their head, rather than in the world.
Greens were pragmatic, skeptical, individualistic and private in their thinking, certainly in
their actions, and definitely in relationships with others. Greens could spend their time

95
evaluating the best event or program to meet like-minded people that they may never
attend. (Keirsey, 1998; Montgomery, 2002; NCTI, 2005). The combination of these
characteristics could easily lead a Green to become concerned about making friends in
college.
An example of a retention program would be an off-campus and after-work
retention programs should be created to reach those students who work part- or full-time.
The Agriculture Education Division specifically could implement a program occurring on
a weekend or evening that allowed first-time, full-time freshmen, as well as other upper
classmen to interact faculty and graduates from Agriculture Education to serve as a report
from the field to assess and resolve needs, trends, and issues . This type of program
would encourage institutional and social integration, along with supporting graduation
commitment, which Tinto noted as critical factors for retention (1975/1993).
The College of Agriculture could implement an open study or questions forum
that occurred one or two evenings a semester for first-time, full-time freshmen to engage
with upperclassmen and faculty to focus on skills that would help develop critical
thinking and time management that will help them be successful in their student role and
in their prospective careers. Prizes could be raffled off at the event, such as concert
tickets or gift cards. Further examples of retention programs, events, and activities the
Agriculture Education Division and COA could sponsor, publicize, or implement were
found in Appendix B.

96
College of Agriculture Academic Advising It was well known that students learn in different ways and in different
environments. The same was true for the four temperament groups. Lawrence (2009) and
Montgomery (2002) outlined the multiple academic environmental needs of the four
temperaments. Their contributions coupled with researcher recommendations based on
the findings from this study provided practical applicability for academic advisors of the
knowledge gained about the temperament and expectations of first-time, full-time
freshmen found in Appendix C.
First-time, full-time freshmen could take the Real Colors® assessment at the
beginning of the semester in their seminar one credit courses. To disseminate
temperament distribution and BCSSE results institution-wide, the information could have
been housed in DegreeWorks and made available to all faculty and staff on the MSU
campus. By reporting the temperament information, faculty and could recommend
courses that appealed to student’s temperament types.
Academic advisors could recommend students take courses that appealed to their
particular temperament distribution. A good course temperament distribution would be:
40% of course load each semester engage at the least primary temperament, 30% of
course load engage the secondary temperament, and 30% engage supplementary
temperaments. Appendix C provides an overview of the type of College of Agriculture
courses at Montana State University that each temperament has a natural talent or
competency. However, it is important to keep in mind that each temperament is certainly
able to perform well in other classes that do not engage their natural competencies and
primary temperament. For this reason, it is important to know the distributions—their

97
competencies and limitations — to provide a well-rounded academic plan to encourage
success for all temperaments in any College of Agriculture major.
Utilizing the knowledge that most first-time, full-time freshmen in the COA at
Montana State University expected to spend a lot of hours studying and less hours
socializing, academic advisors would validated the student’s academic expectations, and
disclose the opportunities for social and academic groups. If the student was working,
advisors could ensure that the course schedule did not overwhelm students and create
distance between the student and faculty member if help with courses was needed.
College of Agriculture Career Advising To advise students successfully, faculty members and staff needed to take into
consideration the student’s personal academic and career goals, as well as their natural
talents and areas for development. Lawrence (2009) outlined three questions that advisors
needed to answer in the quest for student career skills development. The three questions
were modified by the researcher to fit the College of Agriculture advisors and were the
following (Lawrence, 2009):
1. What was the primary and secondary temperament of the student?
2. How do you spot them in the student?
3. How do you work with students to achieve their desired career aspirations?
The value of the knowledge gained through this study was useful in providing a
new viewpoint of which to advise students in how to reach their professional goals.
Advisors could utilize the Real Colors® diagnostic assessment to discover the student’s
existing talents and skills, while defining development needs to succeed within a specific

98
career in the agriculture industry. Montgomery (2002) outlined the four talents and tools
that the four temperaments work best with. Table 16 displayed the list of talents and tools
revised with the Real Colors® temperaments by the researcher.
Table 16. Revised Temperament, Talent, and Tools in the Workforce
Temperament Talents Works best with Orange Tactics Tools and equipment Gold Logistics Supplies and schedules Blue Diplomacy People and Communication
Green Strategy Plans and technology Building off of the questions that Lawrence (2009) outlined and taken into
consideration the tools and talents of Montgomery (2009), there were a few simple tasks
that career advisors could perform to ensure a student was a good fit for a specific field of
agriculture. The first step was to identify the key qualities that inhabited a model
employee in a particular agricultural occupation. Secondly, compare the daily activities,
skills, and development opportunities of the job with the student’s temperament, talents,
and skills. Thirdly, the career advisor would meet with the student to discuss, using
buzzwords that would motivate, encourage, or discourage a specific temperament to seek
employment in a particular occupation. Buzzwords of the occupation should resonate
either positively or negatively with the student. Both advisor and student would create a
plan of action that would allow the student to develop the skills of their less significant
temperaments, while furthering their primary temperament in order to develop the skills
necessary to become a successful in a particular occupation. Lastly, advisors would
present career prep opportunities that engaged all four of the temperaments to ensure the
student was developing the skill of performing well in the workplace in supplementary as

99
well as their primary temperaments. Appendix D provided example of the types of
careers within agriculture the different temperaments would be drawn to.
Implications for Agriculture Education and Leadership Courses
Agriculture, as an industry, has been changing and, thus, the curriculum and
agriculture students at the university level have been changing as well. In response,
research has begun to emerge on how to better educate, retain, and graduate students
within colleges of agriculture. This study joined previous research in the attempt to
positively impact college of agriculture student retention.
In knowing the temperament distributions of the first-time, full-time freshmen in
the College of Agriculture at Montana State University, faculty and staff were presented
with the challenge to engage in the classroom and through retention programs the
Orange, Gold, and Blue temperaments that aimed at increase learning and positively
affect college of agriculture student retention.
Lawrence (2009) noted the importance of temperament knowledge for education
and planning, “The outcomes of formal education depend so much on understanding
student differences in motivation, interest, learning styles and attitudes” (p. 31-32).
Formal education benefits some temperaments and hinders others. Since the purposive
sample was derived from an introductory leadership Agriculture Education course,
implications for the use of the results were applied to agriculture education and
leadership education course in colleges of agriculture.
Instructors were recommended to provide students with the opportunity to begin
the development process during the first year of college through the creation of well-

100
rounded coursework that assisted in the development the four temperaments. By
supporting the four temperaments through purposeful coursework, students will have a
built-in opportunity to impact positive leadership skill development.
Due to the large number of students with Orange primary temperaments,
instructors should be aware that these students and others, Twenge noted (2006), wanted
experiences that provided personal attention, and practical and interactive classes. To
meet these student desires and acquire the skills necessary to be effective in the
workforce after college, students need to have experience in “communicating effectively,
working in teams, and develop[ing] creative solutions to complex problems” (Doerfert,
2011, p. 21) in the classroom. Each temperament responds and behaves differently
initially to each of these abilities, and should be provided a safe classroom environment
to develop these skills that may or may not come naturally.
One of the skills Doerfert (2011) noted that students needed to be able to do
effectively in the workforce was work as a team. In an Agriculture Education or
Agriculture Leadership course, for example, that required a debate-style group project or
a service leadership project has the opportunity to give students a positive or negative
group-work experience. The type of experience students have depends upon the types
represented in each group. Structuring the assignment so that a task was performed that a
specific temperament typically enjoyed would be a way to engage each temperament.
Appendix C contained an example of course assignments that each temperament enjoyed
or had a hesitation toward based on the temperament knowledge gained from this study to
promote success in Agriculture Education and Agriculture Leadership courses.

101
Recommendations for Future Research
Based on the findings of this study, recommendations for future research on the
topic of student temperament and retention were as follows.
This study should be replicated with a larger sample size to uncover whether
results of the study were attributed to small sample size or were representative of all
college of agriculture first-time, full-time freshmen. By doing so, a more in-depth picture
of college of agriculture students at four-year universities would be painted and beneficial
for institution faculty and staff.
Replication at multiple institutions would provide a snapshot of the first year
expectations and temperaments of first-time, full-time students in colleges of agriculture
across the country. This would aid college of agriculture leaders and faulty to develop
curriculum and effective retention programming standards that would be used across the
country. Other colleges at MSU were also encouraged to participate in a replication of the
study to discover whether the findings were representative of all first-time, full-time
freshmen at the institution.
For the Agriculture Education Division specifically, a longitudinal study to
determine whether the primary and secondary temperament distribution changes
throughout a student’s college career should be explored. A temperament distribution
profile of students within each of the majors and the population as a whole in Colleges of
Agriculture, which would aid faculty and staff in course planning and development.
Institutions should conduct research utilizing Real Colors® to construct a
reputation as an easy to use and accurate diagnostic assessment in the self-reporting of

102
student temperament distributions. Through the more frequent utilization of temperament
assessments in colleges of agriculture to promote retention, success in the classroom, and
social and institutional integration, research should be conducted on whether
temperament positively affected the actual first-year engagement (NSSE) of freshmen in
the college of agriculture.
Results from the BCSSE and NSSE should be compared to student temperament
for the identification of a possible link between college expectations, actual engagement,
and temperament. Recommendations for future research needed be focused on the
development of student’s supplementary temperaments to positively affect retention,
engagement, and success in the classroom within colleges of agriculture.
Summary
Through a descriptive, quantitative research design, this study provided evidence
that student temperament may be used to positively impact the retention of first-time,
full-time freshmen in the College of Agriculture at MSU through the implementation of
temperament and BCSSE findings. The retention of college students was a topic that was
deemed important to multiple stakeholders. Finding ways in and outside the classroom
that supported and encouraged student retention to the second fall semester in college
was information desirable for the faculty and staff in the College of Agriculture. It was
important to remember that retention decision stems from various college experiences,
and each of the four temperaments perceive them differently.
The recommendations were based on this study’s results. Retention program
planners and course instructors needed to encourage provide opportunities to for students

103
to form study and social groups that would assist with the student’s expected difficulty of
learning course material and making new friends in their first year. Instructors should
post office hours and encourage communication in and outside the classroom. Faculty
and staff should be sensitive to how the different temperaments perceived their course
load in their first year. Course assignments should be practical; related to potential
careers; interactive; and encourage big-picture thinking.
Implications extended to MSU College of Agriculture faculty and staff. Retention
programmers should offer multiple types of programs to engage each of the four
temperaments. Academic and career advisors within the College of Agriculture should be
mindful of the talents and job preferences of each temperament. Instructors in the
Agriculture Education and Agriculture Leadership departments should take into account
the different types of assignments that the four temperaments enjoy or do not feel
comfortable performing when planning instruction.
The study should be replicated with a larger sample to determine if findings were
representative of all College of Agriculture students at Montana State University.
Additionally, other colleges at MSU were encouraged to collaborate to discover the
largest primary and temperament groups and first year expectations of all first-time, full-
time freshmen at Montana State University. Future research should be conducted to
uncover whether well-rounded coursework assisted in the development supporting
temperaments and positively affected retention and course satisfaction. Other institutions
were recommended to conduct research utilizing Real Colors® to construct a reputation
as an easy to use and accurate diagnostic assessment in the self-reporting of student
temperament distributions.

104
While every freshman may have a different college experience, it should be the
goal of the faculty and institutional leaders to make all of their experiences as personal
and positive as possible. To impact students, we must be willing to do the work to get to
know them, calm their fears, and discuss expectations so that the first year is not only a
challenging one, but a successful one that leads to degree attainment.

105
REFERENCES CITED

106
Abbasi, A. S. (1989). Multivariate analysis of predictors of attrition in the college of agriculture at Kansas State University (Unpublished doctoral dissertation). Kansas State University.
ACT. (2014). Average Scores by State. Retrieved from
http://www.act.org/newsroom/data/2012/states.html Allen, D. F., & Nelson, J. M. (1989). Tinto's model of college withdrawal applied to
women at two institutions. Journal of Research and Development in Education, 22(3), 1-11.
Allport, G. W. (1937). Personality: A psychological interpretation. New York, NY:
Henry Holt. Anastasi, A. (1988). Psychological testing. New York, NY: Macmillan. Astin, A., Korn, W., & Green, K. (1987). Retaining and satisfying students. Educational
Record, 68(1), 36-42. Astin, A. W., & Oseguera, L. (2005). Degree attainment levels at American colleges and
universities: Revised edition. Los Angeles, CA: Higher Education Research Institute (UCLA).
Astin, A. W., & Oseguera, L. (2012). Pre-College and institutional influences on degree
attainment. In A. Seidman (Author), College student retention: Formula for student success (pp. 245-276). Westport, CT, CT: Praeger.
Astin, A. W. (1971). Predicting academic performance in college. New York, NY: Free
Press. Astin, A. W. (1975). Preventing students from dropping out. San Francisco, CA: Jossey-
Bass. Astin, A. W. (1977). Four critical years. San Francisco, CA: Jossey-Bass. Astin, A. W. (1985). Achieving educational excellence. San Francisco, CA: Jossey-Bass. Astin, A.W. (1991). Assessment for excellence: The philosophy and practice of
assessment and evaluation in higher education. New York: Macmillian/Oryx Astin, A. W. (1993). What matters in college?: Four critical years revisited. San
Francisco, CA: Jossey-Bass.

107
Astin, A. W. (1997). How "good" is your institution's retention rate. Research in Higher Education, 38(6), 647-658.
Astin, A. W., Tsui, L., & Avalos, J. (1996). Degree attainment rates at American
colleges and universities: Effects of race, gender, and institutional type. Los Angeles, CA: Higher Education Research Institute (UCLA).
Attewell, P., Heil, S., & Reisel, S. (2011). Competing explanations of undergraduate
noncompletion. American Educational Research Journal, 48(1), 155-187. doi: 10.3102/0002831210392018
Ball, A. L., Garton, B. L., & Dyer, J. E. (2001). The influence of learning communities
and 4-H/FFA participation on college of agriculture students' academic performance and retention. Journal of Agriculture Education, 42(4), 54-62.
Barefoot, B., Warnock, C., Dickenson, M., Richardson, S., & Roberts, M. (Eds.). (1998).
Exploring the evidence, Vol. 2: Reporting outcomes of first-year seminars (Vol. 2). Columbia, SC: National Resource Center for the Freshman Year Experience.
Barrett, L. (1985). Personality type difference of students and faculty and their effect on
student achievement. Journal of the American Association of Teacher Educators in Agriculture, 26(3), 48-56. doi: 10.5032/jaatea.1985.03.048
Barrett, L. A., & Horner, J. T. (1989). Personality styles and rural leadership. Journal of
Extension, 27(1), spring, 1-2. Retrieved September, 2012. Barrett, L., Sorenson, R., & Harding, T. (1985). Personality type factors of faculty and
students implications for agriculture college teaching. North America Colleges and Teachers Association, 29(1), 50-54.
Barrett, L., Sorenson, R., & Harding, T. (1987). Personality types of agricultural college
students implications for teaching, retention, and recruitment. North American Colleges and Teachers Association, 31(4), 14-19.
Barton, A., & Donahue, C. (2009). Multiple assessments of a first-year seminar pilot. The
Journal of General Education, 58(4), 259-278. doi: 10.1353/jge.0.0051 Bassey, N. D., Logeswaran, R., & Michel, S. (2013). The new generation of leadership:
Transforming ordinary young people into outstanding and growing leaders. Bloomington, IN: West Bow Press.
Baum, S., & Ma, J. (2007). Education pays: The benefits of higher education for
individuals and society. Washington DC: The College Board.

108
Baum, S., Ma, J., & Payea, K. (2013). Education pays: The benefits of higher education for individual and society. Washington, DC: The College Board.
Bean, J. P., & Metzner, B. S. (1985). A conceptual model of nontraditional undergraduate
student attrition. Review of Educational Research, 55(4), 485-540. doi: 10.2307/1170245
Bean, J. P. (1980). Dropouts and turnovers: The synthesis and test of a causal model of
student attrition. Research in Higher Education, 12, 155-187. Bean, J. P. (1983). The application of a model of turnover in work organizations to the
student attrition process. Review of Higher Education, 6(2), winter, 129-148. Beck, C. (2011, December). Funding for Office of Student Success. MSU Investment
Proposal for Institutional Priorities. Retrieved from http://www.montana.edu/wwwbdgt/investments/documents/IP75%20Office%20of%20Student%20Success011912.pdf
Berger, J. B., & Lyons, S. C. (2005). Past to present: A historical look at retention. In A.
Seidman (Ed.), College student retention: Formula for student success (pp. 1-27). Westport, CT: Praeger.
Berger, J. B., Ramirez, G. B., & Lyons, S. (2012). Past to present: A historical look at
retention. In A. Seidman (Author), College student retention: Formula for student success (2nd ed., pp. 7-34). Lanham, MD: Rowman & Littlefield.
Braxton, J. M. (2000). Reworking the student departure puzzle. Nashville, TN:
Vanderbilt University Press. Braxton, J. M., Sullivan, A. S., & Johnson, R. (1997). Appraising Tinto's theory of
college student departure. In J. S. Smart (Ed.), Higher Education: Handbook of theory and research (Vol. XII). New York, NY: Agathon.
Cabrera, A. F., Nora, A., & Castaneda, M. B. (1992). The role of finances in the
persistence process: A structural model. Research in Higher Education, 33(5), 571-593. doi: 10.1007/BF00973759
Chambers, S. R. (2009). Student engagement: Using the NSSE benchmarks o
investigating long term persistence (Unpublished doctoral dissertation). Montana State University.
Clark, L. A., & Watson, D. (1999). Temperament: A new paradigm for trait psychology.
In L. A. Pervin & O. P. John (Eds.), Handbook of personality: Theory and research (2nd ed., p. 399423). New York, NY: Guilford Press.

109
Cole, J. S., & Howe, E. (2013, February). Using BCSSE and NSSE data to investigate
college readiness. Presented at 32nd Annual Conference on The First-Year Experience, Orlando, Florida.
Cooper, W. (2009). True Colors personality test [Scholarly project]. In True Colors
Personality Test. Retrieved from http://wmacooper.pbworks.com/f/WillCooper-True%20Colors.pdf
Crosling, G. M., Thomas, L., & Heagney, M. (2008). Improving student retention in
higher education: The role of teaching and learning. New York, NY: Routledge Falmer.
The Dean's Council. (2013). Academic Strategic Plan (Working paper). Retrieved March,
2013, from Montana State University website: http://www.montana.edu/wwwprov/StrategicPlans/AcademicStrategicPlan20Dec12.pdf
DeBernard, M. S., Spielman, G. I., & Julka, D. L. (2004). Predictors of academic
achievement and retention among college freshmen: A longitudinal study. College Student Journal, 38(1), 66-80.
Doerfert, D. L. (2011). National research agenda: American Association for Agricultural
Education's research priority areas for 2011-2015. Lubbock, TX: Texas Tech University, Department of Agricultural Education and Communications.
DuBrock, C. P. (1999). Financial aid and college persistence: A five-year longitudinal
study of 1993 and 1994 beginning freshmen students. Paper presented at symposium conducted at the AIR 40th Annual Forum. Cincinnati, OH.
Dyer, J. E., & Breja, L. M. (1999). Predictors of student retention in colleges of
agriculture students. In Proceedings of the 53rd annual Central region research conference in agricultural education (pp. 93-100). St. Louis, MO.
Dyer, J. E., Breja, L. M., & Andreasen, R. J. (1999). Attitudes of college of agriculture
freshmen toward agriculture. Journal of Agriculture Education, 40(2), 1-10. Dyer, J. E., Breja, L. M., & Wittler, P. S. (2000). Predictors of student retention in
colleges of agriculture students. In 27th Annual National Agricultural Education Research Conference. San Diego, CA.
Dyer, J. E., Lacey, R., & Osborne, E. W. (1996). Attitudes of University of Illinois
College of Agriculture freshmen toward agriculture. Journal of Agriculture Education, 37(3), 43-51.

110
Fox, L. A. (2006). An exploration of the relationship of explanatory style to academic
achievement, college student persistence, ACT/ACT composite scores, and College Student Inventory measures (Doctoral dissertation, Montana State University, 2006) (pp. 1-186). Bozeman, MT.
Fox-Koon, L. A., Frick, M. J., & Igo, C. G. (2009). What kind of students are enrolling in
a College of Agriculture and are they staying: A mixed methods approach. North American Colleges and Teachers of Agriculture, 53(2), June, 21-28.
Friedman, B. A., & Mandel, R. G. (2011). Motivation predictors of college student
academic performance and retention. Journal of College Student Retention: Research, Theory and Practice, 13(1), 1-15. doi: 10.2190/CS.13.1.a
Galton, F. (1884). Measurement of character. Fortnightly Review, 36, 179-185. Garton, B. L., Ball, A. L., & Dyer, J. E. (2002). The academic performance and retention
of college of agriculture students. Journal of Agriculture Education, 43(1), 46-56. Garton, B. L., Dyer, J. E., & King, B. O. (2000). The use of learning styles and
admissions criteria in predicting academic performance and retention of college freshmen. Journal of Agricultural Education, 41(2), 46-53. Retrieved October, 2012.
Goecker, A. D., Smith, P. G., Smith, E., & Goetz, R. (2010). Employment opportunities
for college graduates in food, renewable energy, and the environment. USDA National Institute of Food and Agriculture. Retrieved October, 2012, from http://www3.ag.purdue.edu/USDA/employment/pages/default.aspx
Gonyea, B., & Miller, A. (2010). NSSE's psychometric portfolio: Evidence for reliability,
validity, and other quality indicators [PowerPoint slides]. Retrieved from http://nsse.iub.edu/html/psychometric_portfolio.cfm.
Gore, P. (2014, February 2). The role of psychosocial and non-cognitive factors in
predicting and promoting student success. Address presented at MSU spring advising luncheon in Montana State University, Bozeman.
Hossler, D. (1988). Admissions and enrollment management. In A. L. Rentz & G. L.
Saddlemire (Eds.), Student affairs functions in higher education (pp. 41-67). Springfield, IL: Charles C. Thomas.
Indiana University. (2012). BCSSE 2011-NSSE 2012 combined codebook (Publication).
Retrieved http://bcsse.iub.edu/pdf/BCSSE%202011-NSSE%202012%20Combined%20Codebook.pdf

111
Indiana University. (2012). Validity: BCSSE-NSSE relationships. Beginning College
Survey of Student Engagement. Retrieved from http://nsse.iub.edu/pdf/psychometric_portfolio/Validity_BCSSE-NSSE%20Relationships.pdf
Indiana University. (2013). About BCSSE. BCSSE: Beginning College Survey of Student
Engagement. Retrieved from http://bcsse.iub.edu/_/?cid=15 Indiana University Center for Postsecondary Research. (2013). BCSSE 2012 overview.
Beginning College Survey of Student Engagement. Retrieved from http://nsse.iub.edu/2013_Institutional_Report/pdf/BCSSE_2012_Overview.pdf
Indiana University Center for Postsecondary Research. (2013). NSSE's commitment to
data quality. NSSE Psychometric Portfolio. Retrieved from http://nsse.iub.edu/html/psychometric_portfolio.cfm
Jung, C. G. (1923/1971). Psychological types. In H. Read, M. Fundham, G. Adler, & W.
McGuire (Eds.), The collected works of C. G. Jung (Vol. 6, pp. 1-495). Princeton: Princeton University Press.
Kagan, J. (1994). Galen's prophecy: Temperament in human nature. New York, NY:
Basic Books. Kahn, J. H., Nauta, M. N., Gailbreath, R. D., Tipps, J., & Chartrand, J. M. (2002). The
utility of career and personality assessment in predicting academic progress. Journal of Career Assessment, 10(1), 3-23.
Keirsey, D., & Bates, M. (1978). Please understand me: Character & temperament types.
Del Mar, CA: Prometheus Nemesis. Keirsey, D., & Bates, M. (1984). Please understand me. Del Mar, CA: Prometheus
Nemesis Book Company. Keirsey, D. (1998). Please understand me II: Temperament, character, intelligence. Del
Mar, CA: Prometheus Nemesis. Keirsey.com. (2008). About David Keirsey. Keirsey Temperament Website. Retrieved
December 2, 2012, from http://www.keirsey.com/drdavidkeirsey.aspx Kern, C. W., Fagley, N. S., & Miller, P. M. (1998). Correlates of college retention and
GPA: Learning and study strategies, testwiseness, attitudes, and ACT. Journal of College Counseling, 1(1), 26-34.

112
Kuh, G. D. (1999). How are we doing? Tracking the quality of the undergraduate experience from the 1960s to the present. Review of Higher Education, 22, 99-119.
Kuh, G. D. (2003). What we're learning about student engagement from NSSE:
Benchmarks for effective educational practices. Change: The Magazine of Higher Learning, 35(2), 24-32. doi: 10.1080/00091380309604090
Kuh, G. D. (2001-2002). Organizational culture and student persistence: Prospects amd
puzzles. Journal of College Student Retention: Research, Theory, and Practice, 3(1), 23-40.
Lawrence, G. (2009). People types and tiger stripes: Using psychological type to help
students discover their unique potential (4th ed.). Gainesville, FL: Center for Applications of Psychological Type.
Leedy, P. D., & Ormrod, J. E. (2013). Practical research: Planning and design (10th
ed.). Boston, CA: Pearson. Liang, J. P. (2010). Relationship of personality traits to student retention (Doctoral
dissertation, Capella University, 2010). Ann Arbor, MI: ProQuest, UMI Dissertation Publishing. Retrieved from http://search.proquest.com.proxybz.lib.montana.edu/docview/835030120?accountid=28148
Lotkowski, V. A., Robbins, S. B., & Noeth, J. R. (2004). The role of academic and
nonacademic factors in improving college retention. ACT. Retrieved from http://www.act.org/research/policymakers/pdf/college_retention.pdf
Lu, L. (1994). University transition: Major and minor stressors, personality
characteristics and mental health. Psychological Medicine, 24, 81-87. Lumina Foundation. (2011). About us | Lumina Foundation. Lumina Foundation.
Retrieved from http://www.luminafoundation.org/about_us/ McCorkle, S. (2012, January 18). HR management skills series: Negotiation and conflict
management. Montana State University. McGrath, M. M., & Braunstein, A. (1997). The prediction of freshmen attrition: An
examination of the importance of certain demographic, academic, financial, and social factors. College Student Journal, 31(3), 396-408.

113
McKenzie, K., Gow, K., & Schweitzer, R. (2004). Exploring first‐year academic achievement through structural equation modelling. Higher Education Research & Development, 23(1), 95-112. doi: 10.1080/0729436032000168513
McPhereson, B., & Mensch, S. (2007). Students' personality type and choice and major.
Academy of Information and Management Sciences Journal, 10(2), 2007th ser., 1-18.
Miao, G. C. (2009). Keirsey (RTM) temperament theory (TM) and learning styles:
Applications in the classroom (Doctoral dissertation, Alliant International University, 2009) (pp. 1-89). Irvine, CA: ProQuest LLC.
Montana State University. (2012, October 15). Enrollment and persistence. Common
Data Set 2012-13. Retrieved from http://www.montana.edu/opa/facts/cds12/cds12.pdf
Montana State University. (2012). Student services. MSU 2012-2014 Catalog. Retrieved
from http://www.montana.edu/wwwcat/studentlife/stud2.html Montana University System. (2011). Montana University System. Retrieved from
http://www.mus.edu/ Montgomery, S. (2002). People patterns: A modern guide to the four temperaments. Del
Mar, CA: Archer Publications. Morgan, G. A., Leech, N. L., Gloeckner, G. W., & Barrett, K. C. (2013). IBM SPSS for
introductory statistics: Use and interpretation (5th ed.). New York, NT: Routledge.
Morrison, L., & Silverman, L. (2012). Retention theories, models, and concepts. In A.
Seidman (Author), College student retention: Formula for student success (2nd ed., pp. 61-80). Lanham, MD: Rowman & Littlefield.
Mortenson, T. G. (2012). Measurements of persistence. In A. Seidman (Author), College
student retention: Formula for student success (Vol. 2nd, pp. 35-59). Lanham: Rowman & Littlefield.
Myers, I. B., & Briggs, K. C. (1962). The Myers-Briggs type indicator. Palo Alto, CA:
Consulting Psychologists Press. National Center for Education Statistics. (2012). SAT mean scores of college-bound
seniors and percentage of graduates taking SAT, by state: Selected years, 1995-96 through 2011-12. Digest of Education Statistics. Retrieved from http://nces.ed.gov/programs/digest/d12/tables/dt12_174.asp

114
National Center for Education Statistics. (2013, May). Instituional retention and graduation rates for undergraduate students (Rep. No. NCES 2013-037). Retrieved http://nces.ed.gov/programs/coe/indicator_cva.asp
National Center for Education Statistics, Inc. (2010). Number of associate's and
bachelor's degrees awarded by degree-granting institutions, percentage of total, number and percentage awarded to females, and percentage change, by selected fields of study: Academic years 1999-2000 and 2009-10-Continued. The Condition of Education: Postsecondary Education. Retrieved October 23, 2012, from http://nces.ed.gov/programs/coe/tables/table-fsu-1_2.asp
NCTI. (2005). About Real Colors®. Real Colors®. Retrieved September, 2012, from
http://www.realcolors.org/about.php NCTI. (2005). Clients & testimonials. Real Colors®. Retrieved from
http://realcolors.org/about_clients.php NCTI. (2005). The power of Real Colors®. Real Colors®. Retrieved November, 2012,
from http://realcolors.org/about_power.php NCTI. (2005). Real Colors- Adult version workbook [Pamphlet]. Phoenix, AZ: National
Curriculum & Training Institute. NCTI. (2005). Real Colors®. History of Real Colors®. Retrieved from
http://realcolors.org/about_history.php NCTI. (2005). Welcome to the Real Colors website. Real Colors. Retrieved October,
2012, from http://realcolors.org/ NCTI. (2007). Real Colors certification handbook. Phoenix, AZ: National Curriculum &
Training Institute. Nedrow, A. R., Istvan, J., Haas, M., Barrett, R., Salveson, C., Moore, G., Hammerschlag,
Keenan, E. (2007). Implications for Education in Complementary and Alternative Medicine: A Survey of Entry Attitudes in Students at Five Health Professional Schools. The Journal of Alternative and Complementary Medicine, 13(3), 381-386. doi: 10.1089/acm.2007.6273
Noel-Levitz. (2006). Five-year trend study: National student satisfaction report.
Retrieved from www.noellevitz.com/NR/rdonlyres/?E90103D0-F998-4923-A977-FC42586E0804/0/FiveYearTrendStudy.pdf
Nora, A., Barlow, E., & Crisp, G. (2005). Student persistence and degree attainment
beyond the first year in college: The need for research. In A. Seidman (Ed.),

115
College student retention: Formula for student success (pp. 129-153). Westport, CT: Praeger.
NSSE. (2013). NSSE 2013 engagement indicators: Internal consistency statistics by class
level (Rep.). Indiana University Center for Postsecondary Research. Office of Planning and Analysis. (2012). Graduation and retention rates (Rep.).
Retrieved Winter, 2012, from Montana State University website: http://www.montana.edu/opa/students/performance/gradrate/r_all.pdf
Office of Planning and Analysis. (2013, July). College of agriculture. Academic Key
Performance Indicators (KPI's) for 2011-2012. Retrieved from http://www.montana.edu/opa/kpi/FY12KPIAg.pdf
Office of Planning and Analysis. (2013). Quick Facts: 2012-2013. Montana State
University. Retrieved from http://www.montana.edu/opa/facts/quick.htm Oseguera, L. (2006). Four and six-year baccalaureate degree completion by institutional
characteristics and racial/ethnic groups. Journal of College Student Retention, 7(1-2), 19-59.
Pace, C. R. (1980). Measuring the quality of student effort. Los Angeles: Laboratory for
Research in Higher Educations, University of California, Los Angeles. Parker, G. (1993). Parental rearing style: Examining for links with personality
vulnerability factors for depression. Social Psychiatry and Psychiatric Epistemology, 28(3), 97-100. Retrieved October 24, 2012.
Pascarella, E. T., & Terenzini, P. T. (1980). Predicting freshman persistence and
voluntary dropout decisions from a theoretical model. The Journal of Higher Education, 51(1), 60-75.
Pascarella, E. T., & Terenzini, P. T. (1991). How college affects students: Findings and
insights from twenty years of research. San Francisco, CA: Jossey-Bass. Pascarella, E. T., & Terenzini, P. T. (2005). How college affects students: A third decade
of research (2nd ed.). San Francisco, CA: Jossey-Bass. Paulsen, M. B., & St. John, E. P. (2002). Social class and college costs: Examining the
financial nexus between college choice and persistence. The Journal of Higher Education, 73(2), 189-236. doi: 10.1353/jhe.2002.0023
116
Perrine, R. M., & Spain, J. W. (2008). Impact of a pre-semester college orientation program: Hidden benefits? Journal of College Student Retention: Research, Theory and Practice, 10(2), 155-169. doi: 10.2190/CS.10.2.c
Price, J. L., & Mueller, C. W. (1981). A causal model of turnover for nurses. Academy of
Management Journal, 24, 543-565. Raven, M. R., Cano, J., Garton, B. L., & Shelhamer, V. (1993). A comparison of learning
styles, teaching styles, and personality styles of pre-service Montana and Ohio agriculture teachers. Journal of Agricultural Education, 34(1), 40-50. doi: 10.5032/jae.1993.01001
Roberts, D. Y., & Lee, H. Y. (1977). Personalizing learning processes in agricultural
economics. American Journal of Agricultural Economics, 59(5), 1022. doi: 10.2307/1239882
Sanderson, R. A. (2012). Beginning College Survey of Student Engagement (BCSSE)
2012 OSU Results (pp. 1-47, Rep. No. 02-12). Corvallis, OR: Oregon State University.
Schontzler, G. (2013, March 8). Regents commit to tuition freeze, performance funding.
The Bozeman Daily Chronicle. Retrieved March, 2013, from http://www.bozemandailychronicle.com/news/montana_state_university/article_4a92c22c-8787-11e2-a5a4-001a4bcf887a.html
Schuh, J. H., & Gansemer-Topf, A. (2012). Finances and retention: Trends and potential
implications. In A. Seidman (Author), College student retention: Formula for student success (2nd ed., pp. 101-118). Lanham: Rowman & Littlefield.
Schurr, K. T., Ruble, V., Pickerill, B., & Palomba, C. (1997). Relationships between the
MBTI and selected aspects of Tinto's model for college attrition. Journal of Psychological Type, 40(31), 31-42.
Seidman, A. (2005). Where we go from here: A retention formula for success. In A.
Seidman (Ed.), College student retention (pp. 295-316). Westport, CT: Praeger Publications.
Seidman, A. (2012). Introduction [Introduction]. In A. Seidman (Author), College student
retention: Formula for student success (2nd ed., pp. 1-5). Lanham, MD: Rowman & Littlefield.
Singh, K. (2007). Quantitative social research methods. Los Angeles, CA: Sage
Publications.

117
Smith, T. Y. (1995). The retention status of underrepresented minority students: An analysis of survey results from sixty-seven U.S. colleges and universities. Paper presented at symposium conducted at the AIR 35th Annual Forum. Boston, MA.
Sorensen, R. C. (1998). Student academic goals and personality type. North American
Colleges and Teachers of Agriculture, march, 34-42. Spady, W. G. (1970). Dropouts from higher education: An interdisciplinary review and
synthesis. Interchange, 1(1), 64-85. doi: 10.1007/BF02214313 Strategic Planning Committee. (2012, May). Montana State University strategic plan
2012- Mountains and minds: Learners and leaders. Montana State University. Retrieved October, 2012, from http://www.montana.edu/strategicplan/documents/montanastate-strategic-plan.pdf
Terenzini, P. T., & Pascarella, E. T. (1977). Voluntary freshman attrition and patterns of
social and academic integration in a university: A test of a conceptual model. Research in Higher Education, 6(1), 25-43. doi: 10.1007/BF00992014
Thomas, A., & Chess, S. (1977). Temperament and development. New York, NY:
Brunner/Mazel. Thomas, A., Chess, S., & Birch, H. G. (1968). Temperament and behavior disorders in
children. New York, NY: New York University Press. Tinto, V. (1975). Dropout from Higher Education: A Theoretical Synthesis of Recent
Research. Review of Educational Research, 45(1), 89. doi: 10.2307/1170024 Tinto, V. (1987). Leaving college: Rethinking the causes and cures of student attrition.
Chicago, IL: University of Chicago Press. Tinto, V. (1990). Principles of effective retention. Journal of Freshman Year Experience,
2(1), 35-48. Tinto, V. (1993). Leaving college: Rethinking the causes and cures of student attrition.
Chicago, IL: University of Chicago Press. Tinto, V. (1997). Classrooms as communities: Exploring the educational character of
student persistence. Journal of Higher Education, 68, 599-623. Tinto, V. (2002, June 19). Promoting student retention: Lessons learned from the United
States. Paper Presented at the 11th Annual Conference of the European Access Network, Prato, Italy. Retrieved November 4, 2013, from suedweb.syr.edu/Faculty/Vtinto/Files/EAN speach.pdf

118
Tinto, V. (2006-2007). Research and practice of student retention: What next? Journal of College Student Retention: Research, Theory and Practice, 8(1), 1-19. doi: 10.2190/C0C4-EFT9-EG7W-PWP4
Tobolowsky, B. F., Cox, B. W., & Wagner, M. T. (Eds.). (2005). Exploring the evidence,
Vol 3: Reporting research on first-year seminar (Rep. No. Monograph #42). Columbia, SC: National Resource Center for the First-Year Experience and Students in Transition.
Tross, S. A., Harper, J. P., Osher, L. W., & Kneidinger, L. M. (2000). Not just the usual
cast of characteristics: Using personality to predict college performance and retention. Journal of College Student Development, 41(3), 323-334.
True Colors International. (2013). Welcome to True Colors. True Colors. Retrieved from
http://truecolorsintl.com/ True Colors International. (2013). Why use True Colors? True Colors. Retrieved from
http://truecolorsintl.com/about-us/why-use-true-colors/ Twenge, J. M. (2006). Generation me: Why today's young Americans are more confident,
assertive, entitled, and more miserable than ever. New York, NY: Free Press. University of Wisconsin Cooperative Extension. (2010, November). Real Colors
personality inventory. University of Wisconsin Cooperative Extension. Retrieved from http://washburn.uwex.edu/files/2010/05/ColorsPersonalityInstrumentPDFforwebsite.pdf
University of Wisconsin-Extension. (2013). Get REAL® with Money. 2012 Annual
Report. Retrieved from http://outagamie.uwex.edu/files/2013/03/2012_Annual_Report.pdf
University of Wisconsin-Extension. (2012). Real Colors seminars. Real Colors Seminars.
Retrieved from http://www.uwex.edu/ces/pdande/leadership/realcolors.html Upcraft, M. L., Gardner, J. N., & Barefoot, B. O. (2005). Challenging and supporting the
first-year student: A handbook for improving the first year of college. San Francisco, CA: Jossey-Bass.
USDA. (2010). Education, communication, and governmental services. United States
Department of Agriculture: Employment Opportunities for College Graduates in Food, Renewable Energy, and the Environment United States, 2010-2015. Retrieved from http://www3.ag.purdue.edu/USDA/employment/Pages/education.aspx
119
Veenstra, C. P. (2009). A strategy for improving freshman college retention. Journal for Quality & Participation, 31(4), Jan, 19-23.
Watson, J. B., & Rayner, R. (1920). Conditioned emotional reactions. Journal of
Experimental Psychology, 3(1), 1-14. doi: 10.1037/h0069608 Welter, L. A. (2002). College freshmen retention as a function of personality and
attributional styles (Doctoral dissertation, Spalding University, 2002) (pp. 1-165). Ann Arbor, MI: ProQuest UMI.
Whichard, J. A. (2006). Reliability and validity of True Colors. Reliability and Validity of
True Colors. Retrieved from https://www.mytruecolors.com/tcrs.pdf Wildman, M., & Torres, R. M. (2001). Factors identified when selecting a major in
agriculture. Journal of Agriculture Education, 42(2), 46-55. Williams, K. B. (2007). Factors influencing choice of academic major: A comparison of
agricultural and non-agricultural degree programs (Unpublished doctoral dissertation, 2007). Texas Tech University.
Winter, D. G., & Barenbaum, N. B. (1999). History and modern personality theory and
research. In L. A. Pervin & O. P. John (Eds.), Handbook of personality: Theory and research (2nd ed., pp. 3-27). New York, NY: Guilford Press.
Winter, D. G., John, O. P., Stewart, A. J., Klohnen, E. C., & Duncan, L. E. (1998). Traits
and motives: Toward an integration of two traditions in personality research. Psychological Review, 105, 230-250.
Wolfe, R. N., & Johnson, S. D. (1995). Personality as a predictor of college performance.
Educational and Psychological Measurement, 55(2), 177-185. doi: 10.1177/0013164495055002002
Yorke, M., & Longden, B. (2004). Retention and student success in higher education.
Berkshire: Open University Press. Ziegert, A. L. (2000). The role of personality temperament and student learning in
principles of Economics: Further evidence. Journal of Economic Education, 31(4), autumn, 307-322. Retrieved October 24, 2012.

120
APPENDICES

121
APPENDIX A
2012 BEGINNING COLLEGE SURVEY
OF STUDENT ENGAGEMENT SURVEY

122

123

124

125

126
APPENDIX B
EXAMPLE OF COA CHAMP CHANGE RETENTION EVENTS

127
Event Description and Temperament New Student Orientation Introduce and give Champ Change points (Orange) to
students that attended the event. Administer the BCSSE. Student Organization Expo Give points (Orange) to each student who officially joins
(Blue) at least 1 during the organization at the expo. Student Organizations Students would be given extra points (Orange) for holding
an office (Gold) within an organization. Champ Change Tracker Create a mobile app for students (Orange and Gold) to
track and input involvement. Also, it could connect students with similar service interests
Writing and Math Help Center
On top of giving points (Orange) for visiting these locations, students could be awarded in courses with an extra bonus point on assignments or projects if they sought out help (Blue) or started a study group (Blue) for the course.
Chili Cook-Off This type of event would engage all of the temperaments quite well. Oranges would enjoy the competition and have a drive to win a trophy. Gold’s would enjoy putting together the team, scheduling team meetings, and delegating jobs. Green’s would be useful in selecting a chili recipe or researching how to modify an existing recipe. Blues would enjoy the comrade that comes with working on a team and be useful in visually setting up, decorating the tent, and developing a team name or theme that satisfied all team members.
(Thanksgiving) Create A Service Event
Students could be given points (Orange) and notoriety (Gold) for the creation and development of service events (Blue), such as food drives, 5k’s, donations to local nonprofits. Students would be recognized at a college social event or game, like a football game.
Internship Opportunities Students would be given points (Orange) for seeking out career and internship opportunities (Gold) through the Career Services office at MSU that would help them reach their personal professional goals
(Christmas) Adopt a Family, 4-H chapter, Farm or Ranch
Students would receive points (Orange) for compiling a group of COA students that wanted to sponsor a family farm or 4-H/FFA chapter locally or statewide (Blue) to raise money for to provide Christmas presents (MSU COA apparel or necessities), provide scholarships (Gold), or buy feed/supplies for other families and youth who had animals that were less fortunate (Blue).
ALTERNATIVE (Christmas)
Student organizations could create gift ideas (home decorations, clothing, Christmas crafts, etc) from Pinterest

128
that could be given to local farming and ranching families or sold at a silent auction where the money could be donated to help a family in need to buy Christmas presents.

129
APPENDIX C
TYPES OF COURSES, COURSE CHARACTERISTICS, AND
COURSEWORK THAT THE DIFFERENT TEMPERAMENTS EXCELL IN.

130
The four temperaments and the types of courses preferred (Montgomery, 2002) Temperament Course type Course characteristics
Orange Lab, technical, or applied
Works with tools; group work; little management or
oversight; abstract or creative properties to
content
Gold Lecture or applied
Practical applicability of content; structured and
sequential course structure; thorough teaching of
content; individual projects
Blue All (lab, applied, lecture, etc.)
Cooperative environment between instructor and students; group work;
abstract or creative properties to content; no
wrong answer environment
Green Applied, lecture
Present content with complex systems; little
management or oversight; no time limit;
experimentations and manipulations of content;
no right or wrong answers;
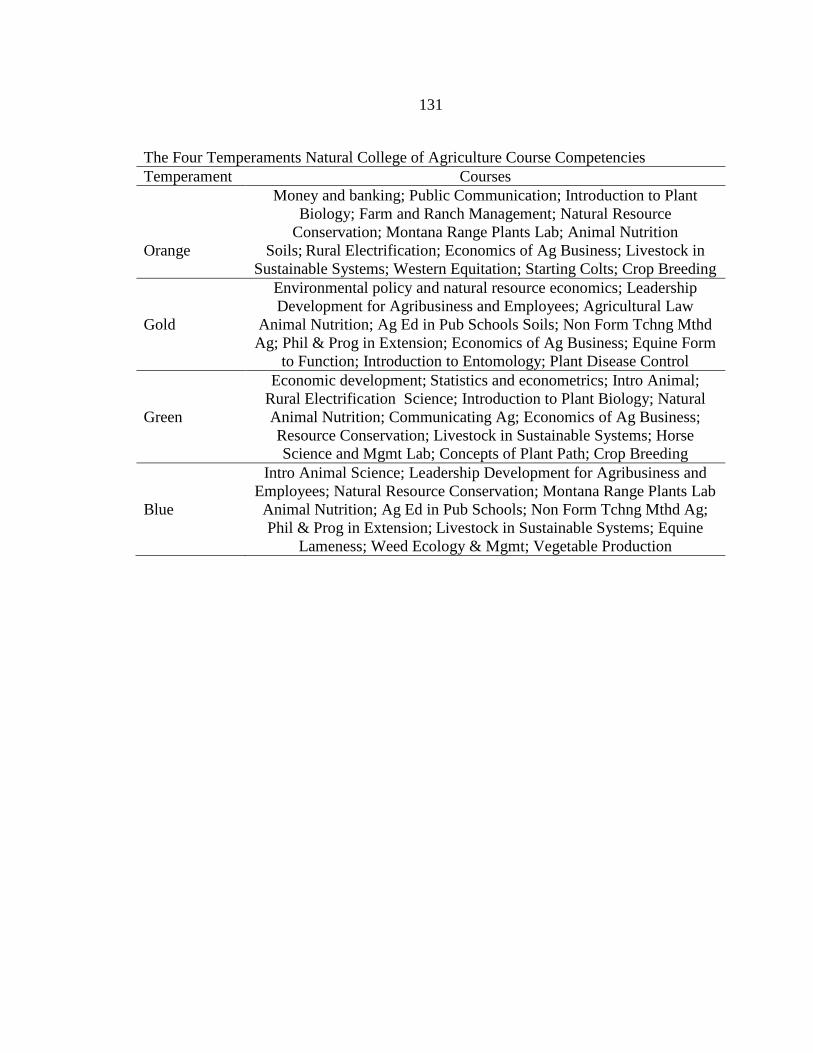
131
The Four Temperaments Natural College of Agriculture Course Competencies Temperament Courses Money and banking; Public Communication; Introduction to Plant
Biology; Farm and Ranch Management; Natural Resource Conservation; Montana Range Plants Lab; Animal Nutrition
Orange Soils; Rural Electrification; Economics of Ag Business; Livestock in Sustainable Systems; Western Equitation; Starting Colts; Crop Breeding
Environmental policy and natural resource economics; Leadership Development for Agribusiness and Employees; Agricultural Law
Gold Animal Nutrition; Ag Ed in Pub Schools Soils; Non Form Tchng Mthd Ag; Phil & Prog in Extension; Economics of Ag Business; Equine Form
to Function; Introduction to Entomology; Plant Disease Control Economic development; Statistics and econometrics; Intro Animal;
Rural Electrification Science; Introduction to Plant Biology; Natural Green Animal Nutrition; Communicating Ag; Economics of Ag Business;
Resource Conservation; Livestock in Sustainable Systems; Horse Science and Mgmt Lab; Concepts of Plant Path; Crop Breeding
Intro Animal Science; Leadership Development for Agribusiness and Employees; Natural Resource Conservation; Montana Range Plants Lab
Blue Animal Nutrition; Ag Ed in Pub Schools; Non Form Tchng Mthd Ag; Phil & Prog in Extension; Livestock in Sustainable Systems; Equine
Lameness; Weed Ecology & Mgmt; Vegetable Production

132
Type of Assignment or Project
Temperament Roles
Group Project
Enjoy: Orange and Blue Hesitation: Gold & Green**
Orange = enjoy being in groups and can be the “big picture” person providing an overall design for the project. Create the visual effects for the project. Blue = enjoy being in groups. Will make sure everyone’s opinion and ideas are heard. Will try to incorporate everyone’s ideas and talents into the process to feel included and as a valued member of the group. Gold = Like group projects only if they can be in charge. Otherwise would rather do it themselves. Provide structure and order to the project. Assigns everyone a job. Green = Need time to think and evaluate about how to best do the project. Logical sequences in project methodology and analyzing results
Report/Essay Assignments
Enjoy: Blue, Gold, & Green Hesitation: Orange
Blue = Through essays, they can describe how they feel and what they think about a topic. Gold = Will enjoy creating a structured and ordered argument for the topic. The logic behind the argument will be based on facts. Green = May have a hard time meeting the deadline of the assignment due to multiple possible outcomes, solutions, or viewpoints. Will provide a thorough and logical analysis. Orange = Will procrastinate and turn in the assignment exactly on time or late. May not have a logical order of points, if order at all. May feel passionately about viewpoint but not a lot of facts. Mainly personal accounts and implications
Agricultural Topical Debates & Speeches
Enjoy: Gold, Orange, Green Hesitation: Blue **
Gold = Provide structure and logical order to the arguments. Demand that facts be reported on the topic. Would be confident in their presentation as long as the work had been done to their standards. Orange = Enjoy entertaining the audience with their speech/debate. Incorporate real-life examples to sell

133
points instead of facts and figures. Use artistic eye for developing visual aids. Green = Would provide facts for their argument. May not decide on a specific viewpoint but provide the audience with researched and concrete facts so that they could decide for themselves. Blue = May would feel uncomfortable taking a specific stance on a subject as not to negate any one’s belief’s about the topic. Unless the reasons for or against would cause harm, discomfort, or sadness to people or animals impacted. Would feel awkward debating a topic that did not add value or help a person or animal’s situation.
Course Reading Assignments
Enjoy: Gold, Green, & Blue Hesitation: Orange
Gold = Divide up reading assignment over a couple days to allow for proper time management and mental processing of the topic. Green = May read all in one day or over the course of a few days. Emphasis would be placed on the time spent thinking and analyzing the topic’s implications and meanings. Blue = Would want to be prepared for class, as to not let the instructor down. Would complete the reading in a timely manner. Would think about the implications of the reading for the self and others. Orange = Read either the night before or not read at all. Create ideas about the reading topic off the top of their heads- not much prior analysis of the topic.
Teaching on an Agricultural Topic in the Secondary Classroom
Enjoy: Gold, Blue, Green, and Orange Hesitation: Blue** & Orange**
Gold = Would be comfortable when following the logical sequence of a detailed lesson plan. Formally teach from a PowerPoint or textbook at the front of the classroom. Blue = Would walk around the room, engaging students about their experiences, knowledge, and desire to apply agricultural topics. Create meaningful assignments. Green = Would follow a logical and detailed lesson plan focusing on the facts of the topic and brainstorming implications. Formally teach from the front of the room.

134
Would only recommend a certain method if all of the facts pointed to one definitive answer. Otherwise, would allow for assignments to be tests to see what topic engaged more students or provided the most logical and valid results. Orange = Would create a loose lesson plan and may not even follow it. Would teach by walking around the classroom. Provide students with plenty of visual aids and scenarios. Projects would be hands-on and active. There would be minimal written assessments of students. Most would be active assessments
** indicates caveats for the temperament. They may enjoy the assignment if tailored specifically to their in-born desires, topics of enjoyment, or was a perceived as a positive experience.
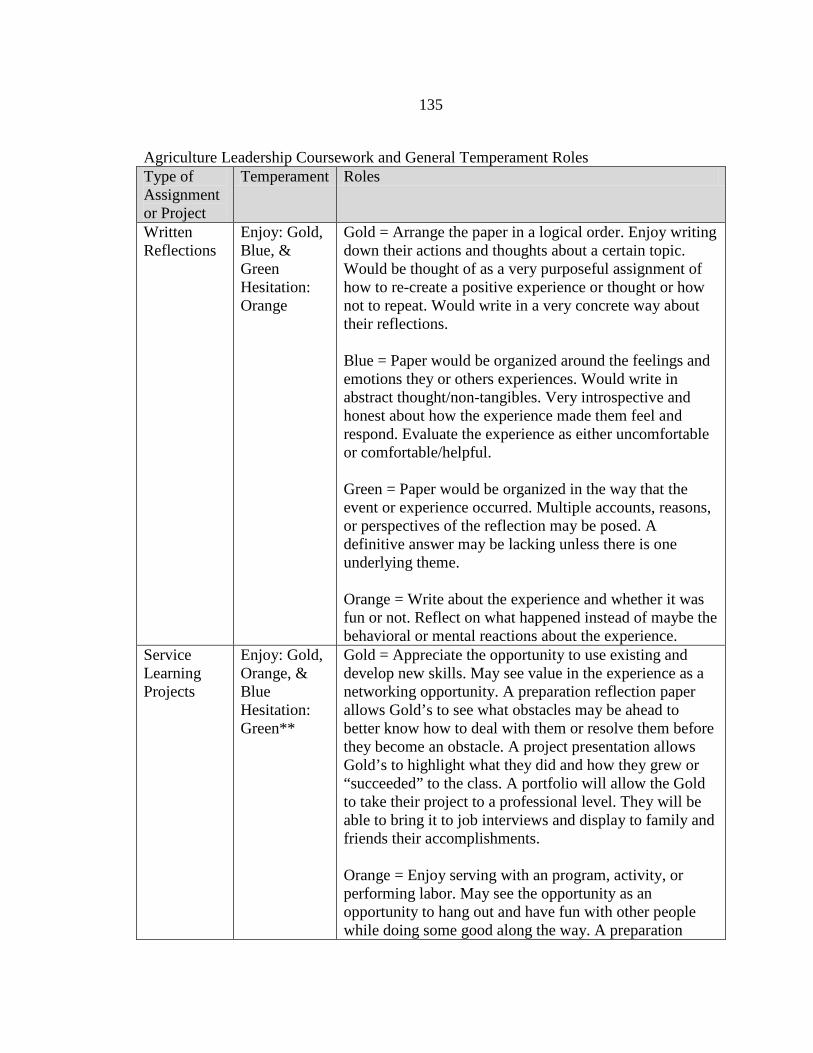
135
Agriculture Leadership Coursework and General Temperament Roles Type of Assignment or Project
Temperament Roles
Written Reflections
Enjoy: Gold, Blue, & Green Hesitation: Orange
Gold = Arrange the paper in a logical order. Enjoy writing down their actions and thoughts about a certain topic. Would be thought of as a very purposeful assignment of how to re-create a positive experience or thought or how not to repeat. Would write in a very concrete way about their reflections. Blue = Paper would be organized around the feelings and emotions they or others experiences. Would write in abstract thought/non-tangibles. Very introspective and honest about how the experience made them feel and respond. Evaluate the experience as either uncomfortable or comfortable/helpful. Green = Paper would be organized in the way that the event or experience occurred. Multiple accounts, reasons, or perspectives of the reflection may be posed. A definitive answer may be lacking unless there is one underlying theme. Orange = Write about the experience and whether it was fun or not. Reflect on what happened instead of maybe the behavioral or mental reactions about the experience.
Service Learning Projects
Enjoy: Gold, Orange, & Blue Hesitation: Green**
Gold = Appreciate the opportunity to use existing and develop new skills. May see value in the experience as a networking opportunity. A preparation reflection paper allows Gold’s to see what obstacles may be ahead to better know how to deal with them or resolve them before they become an obstacle. A project presentation allows Gold’s to highlight what they did and how they grew or “succeeded” to the class. A portfolio will allow the Gold to take their project to a professional level. They will be able to bring it to job interviews and display to family and friends their accomplishments. Orange = Enjoy serving with an program, activity, or performing labor. May see the opportunity as an opportunity to hang out and have fun with other people while doing some good along the way. A preparation

136
reflection paper will allow Oranges to be aware of the obstacles they must crush to be successful or perform the best. The presentation will allow an Orange to be creative and artistic in how they decide to display to the class their growth or activities engaged in. May include a lot pictures, videos, and personal accounts/stories. A portfolio will allow an Orange to creatively arrange and display their project in way that evokes emotion from the reader. They may not keep it or give it to a proud parent. It was not about the grade or the “growth”; it was about the fun had and people met. Blue = Will serve an organization that helps people or animals. Will see value in the work they do in so much that they can see they are making a positive difference. A preparation reflection paper will allow Blue’s to know what obstacles may lie ahead and how to make sure that they do not become an obstacle. Blues are not good with confrontation or encounters that make themselves or others feel like they are not doing a good job. A presentation will allow Blues to show pictures, videos, and tell stories about how they have helped and how it made them feel. A portfolio will be like a diary to a Blue. They will be able to look back and remember all the good done, people/animals helped, and the people they got to meet and work with along the way. Green = A green will serve most likely individually in a capacity that uses problem-solving and analyzing abilities. They will see value in the project in so much as quality data or future uses can be derived from it. A preparation portfolio will allow a Green to explore possible obstacles and solutions prior to experiencing them. Whether a decision gets made prior to experiencing the obstacles is uncertain, but at least they will have a few solutions to choose from in the moment. A project presentation will allow a Green to visually process and analyze an outcome from the experience. They will present and evaluate data based on their experiences. A portfolio will serve as a document outlining experiences and outcomes that could be useful in future encounters or work environments.
Mission Statements
Enjoy: Gold, Blue, &
Gold = Will enjoy thinking about all of the impacts they will make in their future. Serve as a roadmap to their

137
Orange Hesitant: Green
personal definition of success. Highlight their traditions, values, responsibilities, and goal to be the best in their field. Blue = Will enjoy thinking about all of the good they are going to do in the world. Will feature their dedication to a large network of friends, family, and others. May not be concrete as to specifically what, but they will know that they want to help make the world a better place. Orange = Will mention their dedication to family and tradition while making a lasting impact through hard work. May mention a desire to best the best in their field. Focus on one main theme or job. Green = There will be so many extraneous variables and unforeseen events that creating a concise personal mission statement would be a daunting task. Will need to write in generalities with their values and desires that have been constant throughout their life up to that point.
Role-Play Enjoy: Orange, Green, & Gold Hesitant: Blue**
Orange = Adapt easily to change and different scenarios. See role-playing as a fun and “acting” like they are in a movie to find a better angle or approach. Enjoy communicating, and fixing or winning. Focused on finding a solution quickly if a problem is present so they can be done with the exercise. Green = Direct in the methods of communication or resolution. Will restate the goal before mentally thinking about how to approach the scenario even while playing it out in front of the class. Focused on finding the best solution not the fastest solution. Gold = Also will be direct in communication or resolution. May restate their position and the goal before engaging in the scenario with other people. Want to find a solution through efficiency and facts available at the time. Do not waste time to get to an answer with the facts presently available. Wants to win or come out looking the best for negotiating properly and efficiently with other people. Blue = May have a longer role-play scenario than the

138
others. Will want to make sure themselves and the other people are fully heard—their position and their feelings. Will seek to find a solution that validates all parties involved. Maintaining harmony and decency while problem-solving is key.
Assessments Enjoy: Gold, Green, & Blue Hesitant: Orange**
Gold = Enjoy seeing what they excel at and what they need to work on to be the best. Exemplify what they do well, and try to do that most often. Worry about developing weaknesses when it is pertinent. Green = Analyze in what scenarios or situations they embody specific strengths and weaknesses. May theorize over how they develop some skills over others. Will think about how to develop weaknesses while maintaining strengths constant. Evaluate personally whether the assessment was correct and then decide to accept or reject. Blue = Will feel validated and talented by becoming aware of their strengths. Will see their weaknesses and maybe avoid developing them because it may involve an uncomfortable encounter. To keep harmony and peace, will do downplay or play-up whatever skills/qualities are necessary. Orange = Will see the assessment as a chance to brag about all the things they do well. Will downplay their weaknesses or rationalize that they are not as important as their strengths. Or may decide that despite their weaknesses, their strengths make them a good/fun person anyways.
** indicates caveats for the temperament. They may enjoy the assignment if tailored specifically to their in-born desires, topics of enjoyment, or was a perceived as a positive experience.

139
APPENDIX D
THE FOUR TEMPERAMENTS: CAREERS IN AGRICULTURE

140
The Four Temperaments: Potential Careers in Agriculture
Temperament Potential Careers in Agriculture Orange • Advertising for major farm equipment company
• Sales for pesticides, farm & ranch supplies, and equipment • Equipment technician • Farm/ranch laborer • Starting own farm or ranch • Extension Agent • CEO (visioning) • Crop duster • Truck driver • Auctioneer • Corporate spokesperson
Gold • Professor • Program/event planner • Extension Agent • Farm/ranch manager • Supervisor/manager • Office manager • Politician • Accountant • Insurance agent • Lab technician • Fish & game warden
Green • College Rodeo Coach/Director • CEO • College Dean • Farm/ranch management consultant • Extension Agent • Forecasting • College curriculum designer • Researcher • Manufacturing technologist • Economist • Systems analyst
Blue • Extension Agent • Training facilitator • Director of Dean of College of Agriculture • Writer/Editor

141
• Professor • Secondary Agriculture Education teacher • Career counselor in secondary or higher education • Nutritionist • Journalist • Recruiter • Community relations

142
APPENDIX E
IRB APPROVAL FORM

143

144

145