Chaffey College 2014 Student Success Scorecard · PDF filemeasurement system for California...
22
Dr. Sherrie Guerrero Associate Superintendent, Instruction & Student Services Jim Fillpot Dean, Institutional Research & Resource Development Chaffey College 2014 Student Success Scorecard Chaffey College Governing Board Study Session May 21 st , 2014
-
Upload
nguyennguyet -
Category
Documents
-
view
216 -
download
1
Transcript of Chaffey College 2014 Student Success Scorecard · PDF filemeasurement system for California...
Dr. Sherrie Guerrero Associate Superintendent, Instruction & Student Services Jim Fillpot Dean, Institutional Research & Resource Development
Chaffey College 2014 Student Success Scorecard
Chaffey College Governing Board Study Session May 21st, 2014

History of Accountability Reporting AB 1417 – 2004; triggered the creation of a performance
measurement system for California Community Colleges Accountability Reporting for Community Colleges
(ARCC) – 2007 (first reporting year); developed by CCCCO, LAO, DOF, and representative advisory task forces
Student Success Initiative – formed January 2011; final report
presented to Legislature February 2012; 22 recommendations made SB 1456 – Student Success Act approved by Legislature May 2012 Student Success Scorecard (“ARCC 2.0”) – new accountability
framework; released April 2013
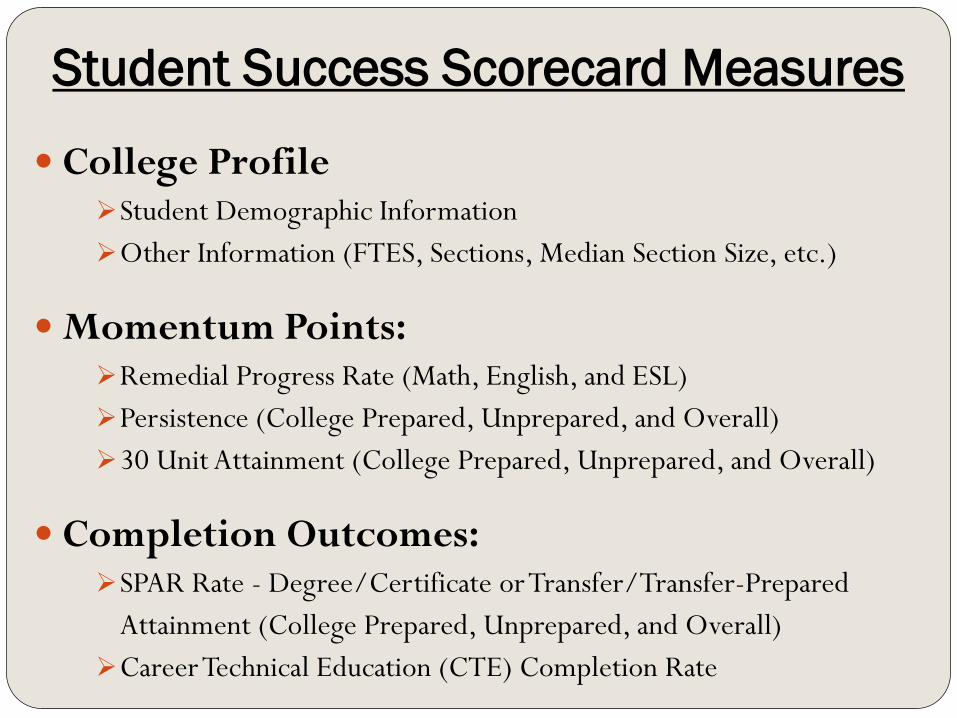
Student Success Scorecard Measures
College Profile Student Demographic Information Other Information (FTES, Sections, Median Section Size, etc.)
Momentum Points: Remedial Progress Rate (Math, English, and ESL) Persistence (College Prepared, Unprepared, and Overall) 30 Unit Attainment (College Prepared, Unprepared, and Overall)
Completion Outcomes: SPAR Rate - Degree/Certificate or Transfer/Transfer-Prepared
Attainment (College Prepared, Unprepared, and Overall) Career Technical Education (CTE) Completion Rate
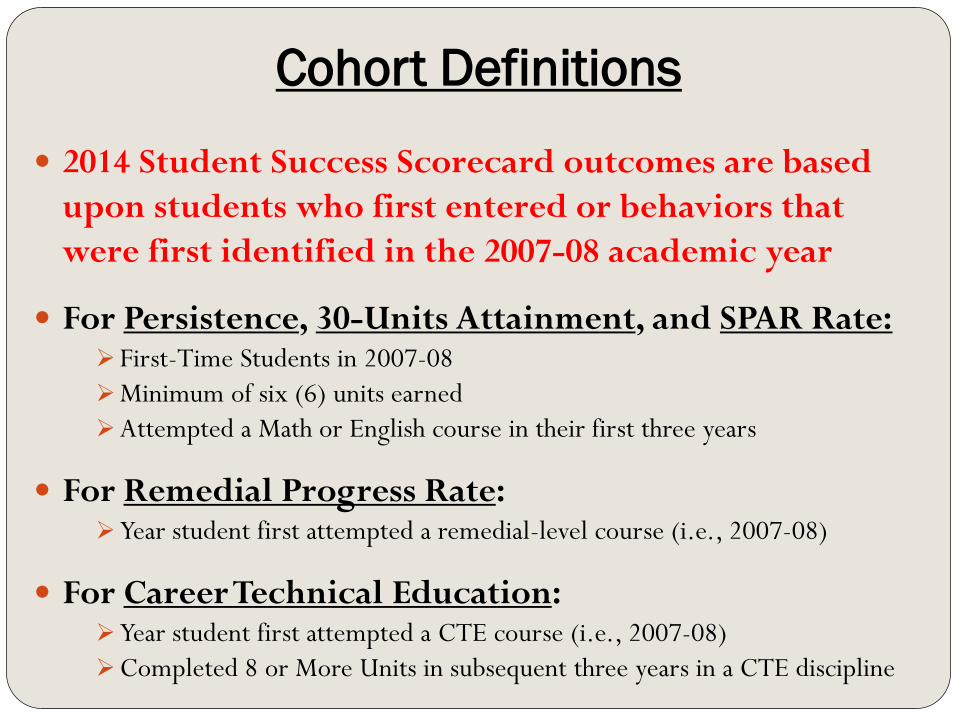
Cohort Definitions
2014 Student Success Scorecard outcomes are based upon students who first entered or behaviors that were first identified in the 2007-08 academic year
For Persistence, 30-Units Attainment, and SPAR Rate: First-Time Students in 2007-08 Minimum of six (6) units earned Attempted a Math or English course in their first three years
For Remedial Progress Rate: Year student first attempted a remedial-level course (i.e., 2007-08)
For Career Technical Education: Year student first attempted a CTE course (i.e., 2007-08) Completed 8 or More Units in subsequent three years in a CTE discipline
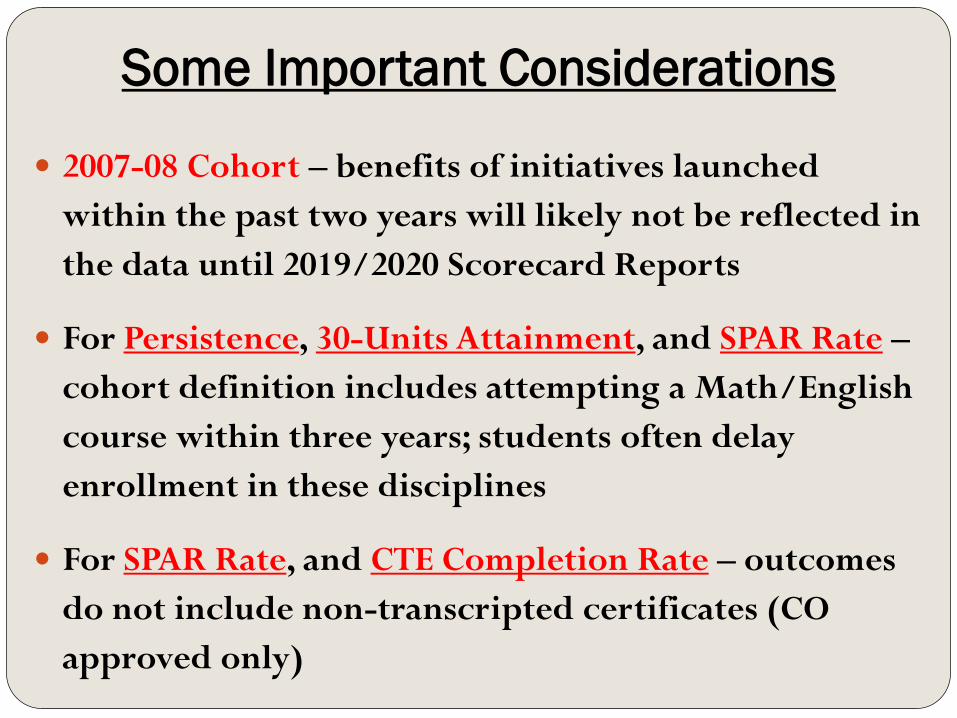
Some Important Considerations
2007-08 Cohort – benefits of initiatives launched within the past two years will likely not be reflected in the data until 2019/2020 Scorecard Reports
For Persistence, 30-Units Attainment, and SPAR Rate – cohort definition includes attempting a Math/English course within three years; students often delay enrollment in these disciplines
For SPAR Rate, and CTE Completion Rate – outcomes do not include non-transcripted certificates (CO approved only)
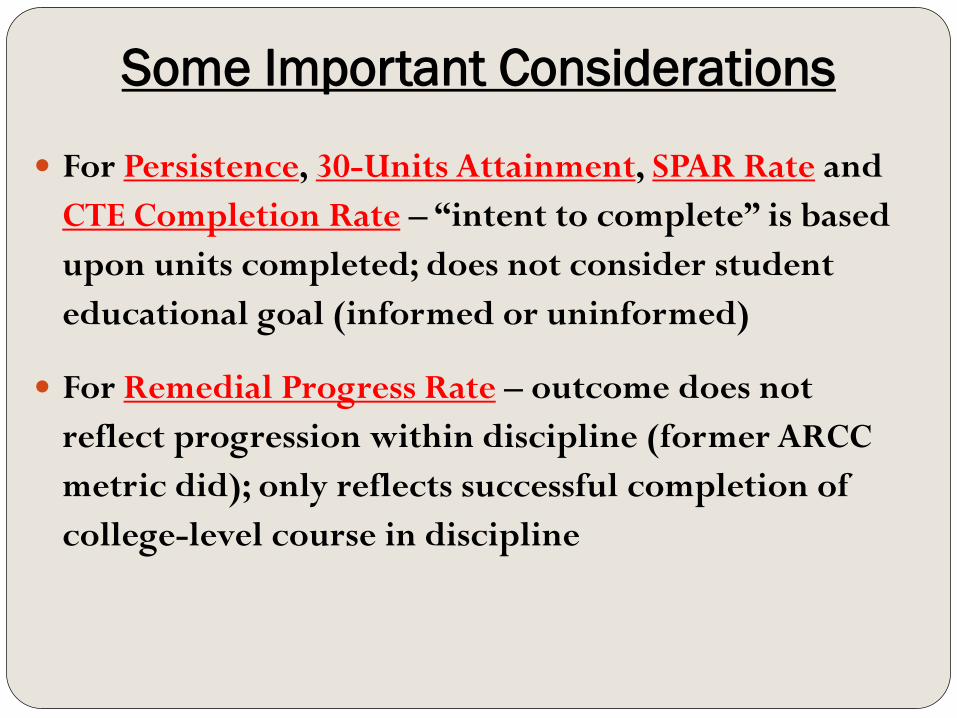
Some Important Considerations
For Persistence, 30-Units Attainment, SPAR Rate and CTE Completion Rate – “intent to complete” is based upon units completed; does not consider student educational goal (informed or uninformed)
For Remedial Progress Rate – outcome does not reflect progression within discipline (former ARCC metric did); only reflects successful completion of college-level course in discipline
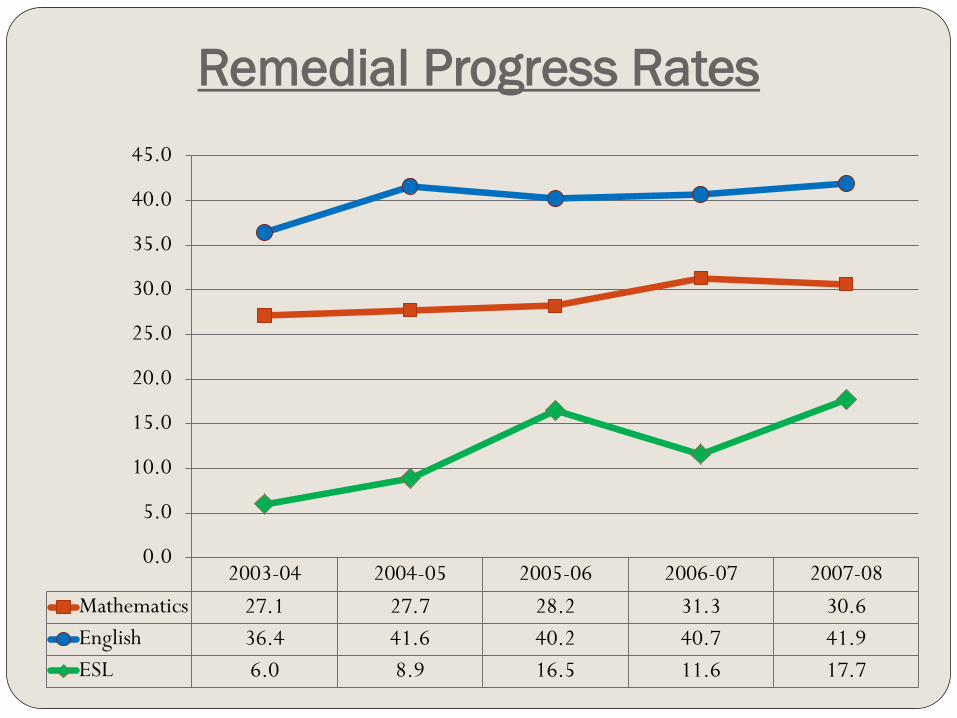
Remedial Progress Rates
2003-04 2004-05 2005-06 2006-07 2007-08Mathematics 27.1 27.7 28.2 31.3 30.6English 36.4 41.6 40.2 40.7 41.9ESL 6.0 8.9 16.5 11.6 17.7
0.0
5.0
10.0
15.0
20.0
25.0
30.0
35.0
40.0
45.0
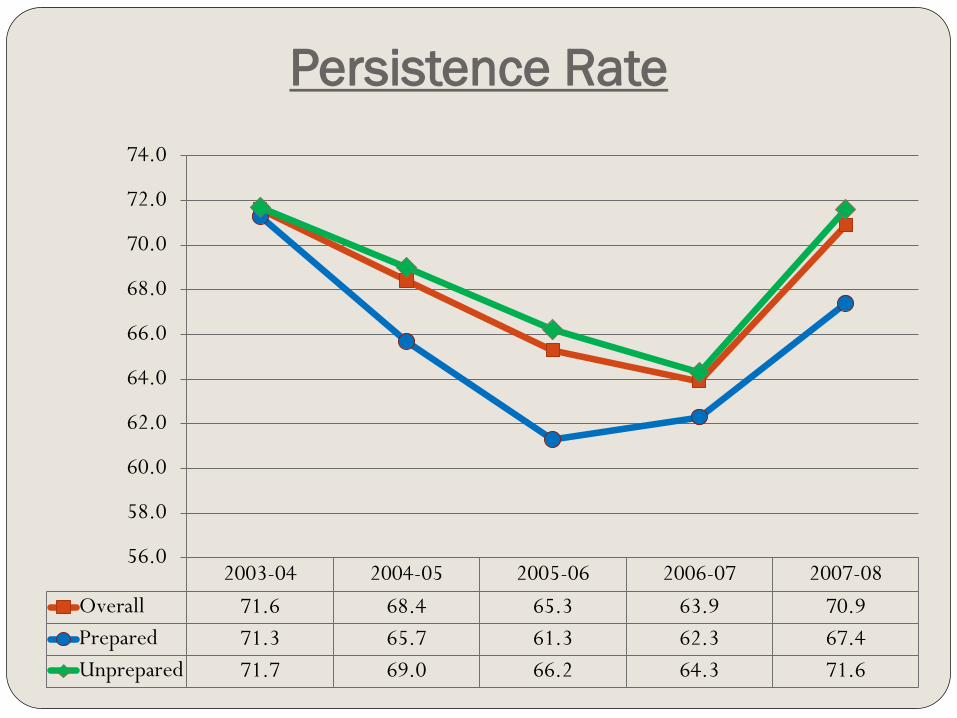
Persistence Rate
2003-04 2004-05 2005-06 2006-07 2007-08Overall 71.6 68.4 65.3 63.9 70.9Prepared 71.3 65.7 61.3 62.3 67.4Unprepared 71.7 69.0 66.2 64.3 71.6
56.0
58.0
60.0
62.0
64.0
66.0
68.0
70.0
72.0
74.0

30 Units Earned Rate
2003-04 2004-05 2005-06 2006-07 2007-08Overall 59.9 59.4 60.3 61.9 63.7Prepared 63.4 58.8 60.1 58.3 63.8Unprepared 59.0 59.5 60.3 62.8 63.7
55.0
56.0
57.0
58.0
59.0
60.0
61.0
62.0
63.0
64.0
65.0
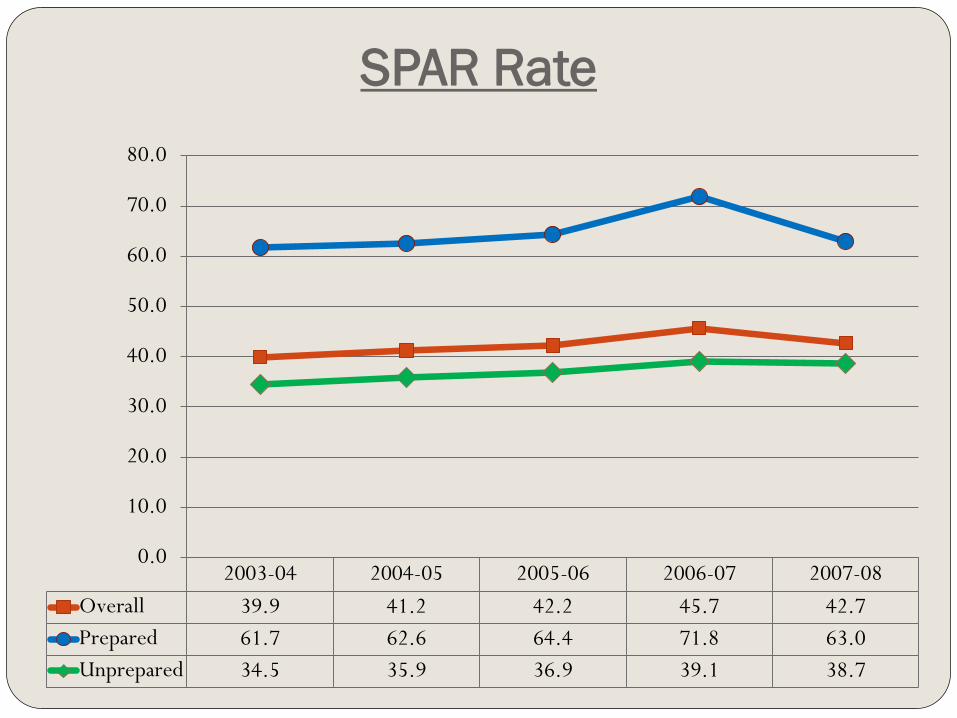
SPAR Rate
2003-04 2004-05 2005-06 2006-07 2007-08Overall 39.9 41.2 42.2 45.7 42.7Prepared 61.7 62.6 64.4 71.8 63.0Unprepared 34.5 35.9 36.9 39.1 38.7
0.0
10.0
20.0
30.0
40.0
50.0
60.0
70.0
80.0

CTE Completion Rate
2003-04 2004-05 2005-06 2006-07 2007-08Overall 54.1 55.6 55.7 54.5 54.1
0.0
10.0
20.0
30.0
40.0
50.0
60.0
70.0
80.0
90.0
100.0
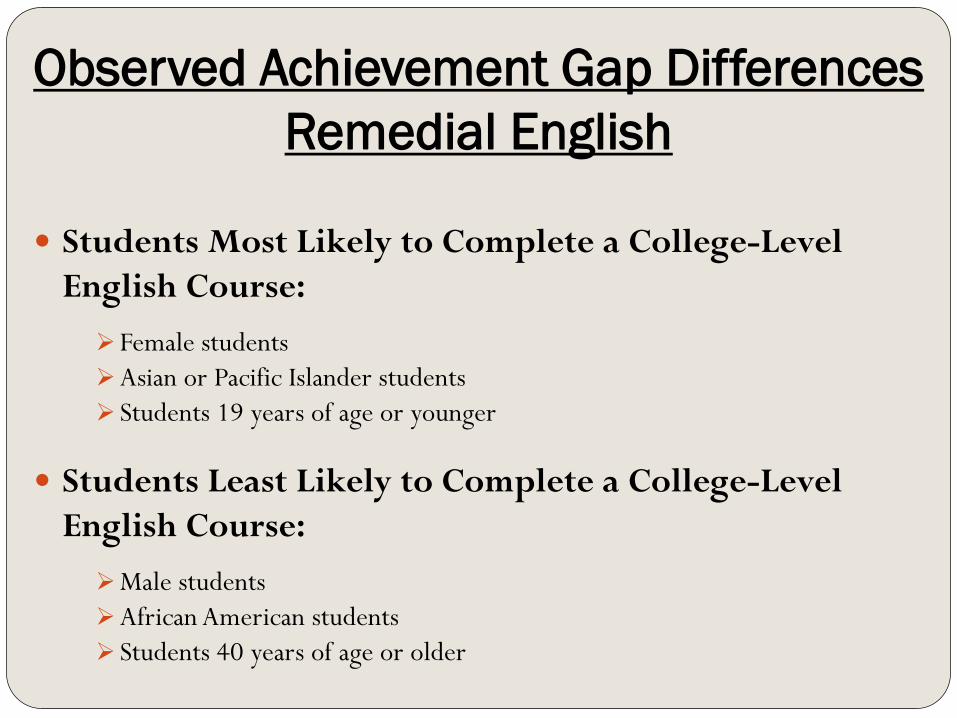
Observed Achievement Gap Differences Remedial English
Students Most Likely to Complete a College-Level English Course:
Female students Asian or Pacific Islander students Students 19 years of age or younger
Students Least Likely to Complete a College-Level English Course:
Male students African American students Students 40 years of age or older
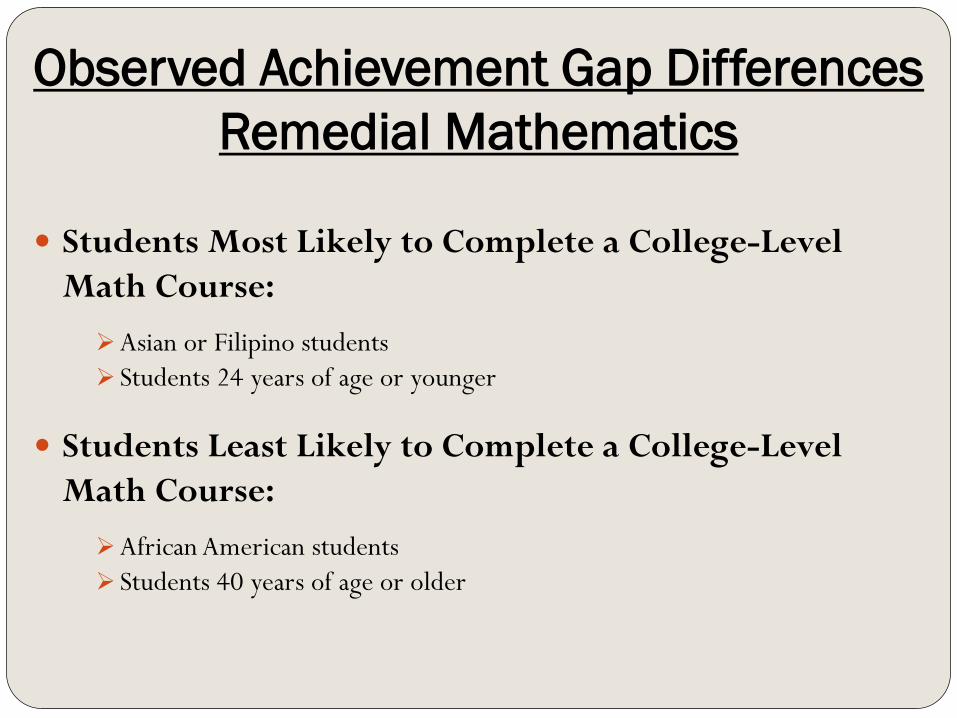
Observed Achievement Gap Differences Remedial Mathematics
Students Most Likely to Complete a College-Level Math Course:
Asian or Filipino students Students 24 years of age or younger
Students Least Likely to Complete a College-Level Math Course:
African American students Students 40 years of age or older
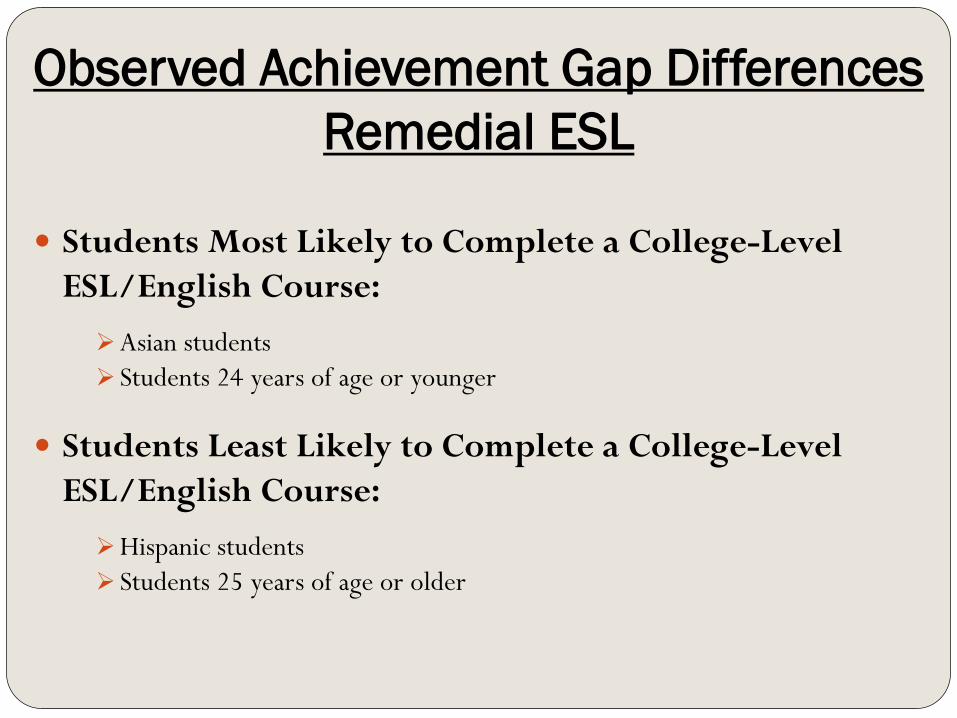
Observed Achievement Gap Differences Remedial ESL
Students Most Likely to Complete a College-Level ESL/English Course:
Asian students Students 24 years of age or younger
Students Least Likely to Complete a College-Level ESL/English Course:
Hispanic students Students 25 years of age or older

Observed Achievement Gap Differences Persistence
Students Most Likely to Persist (3 semesters):
Native American, Filipino, Pacific Islander, and Caucasian students
Students Least Likely to Persist (3 semesters):
African American and Asian students Students 20 to 24 years of age
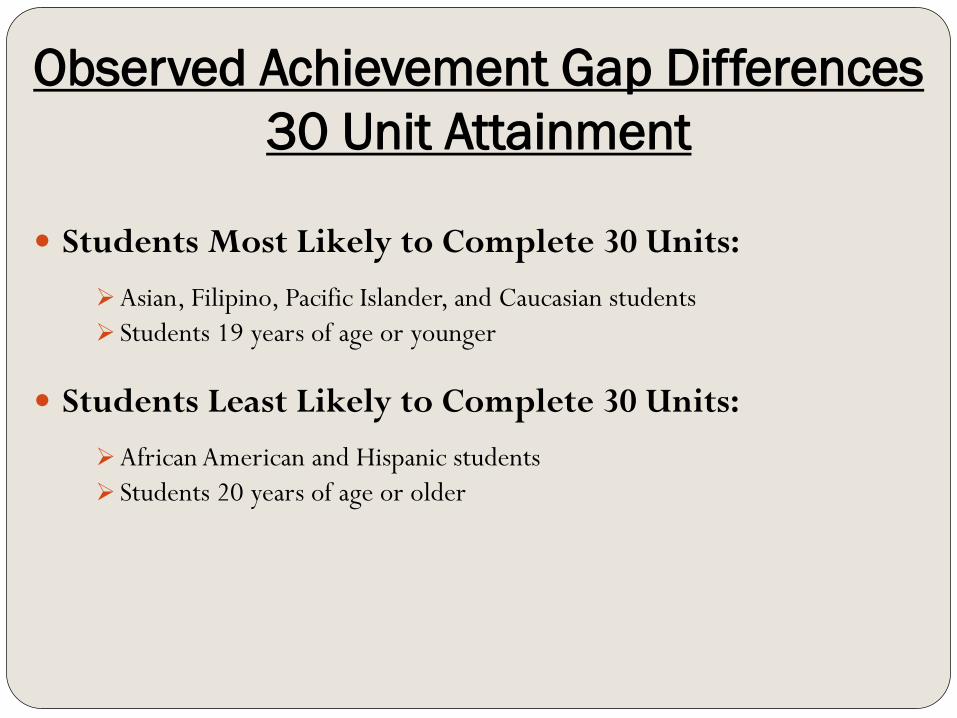
Observed Achievement Gap Differences 30 Unit Attainment
Students Most Likely to Complete 30 Units:
Asian, Filipino, Pacific Islander, and Caucasian students Students 19 years of age or younger
Students Least Likely to Complete 30 Units:
African American and Hispanic students Students 20 years of age or older

Observed Achievement Gap Differences SPAR Rate
Students Most Likely to Earn a Degree/Certificate or Transfer/Become Transfer-Prepared:
Asian, Filipino, Pacific Islander, and Caucasian students Students 19 years of age or younger
Students Least Likely to Earn a Degree/Certificate or Transfer/Become Transfer-Prepared:
African American, Native American, and Hispanic students Students 20 years of age or older

Observed Achievement Gap Differences CTE Completion
Students Most Likely to Be a CTE Completer:
Filipino students Students 24 years of age or younger
Students Least Likely to Be a CTE Completer:
African American and Pacific Islander students Students 25 years of age or older

Strategies to Promote Scorecard Outcomes
Hope and Mindset
Fast-Track Courses
Supplemental Instruction
3SP Strategies - Guiding Panthers to Success (GPS) Center/Super Saturdays/Senior Early Assessment
Degree Auditing
Improved/Increased Student Communication (Portal)
Minority Male Community College Collaborative (M2C3)
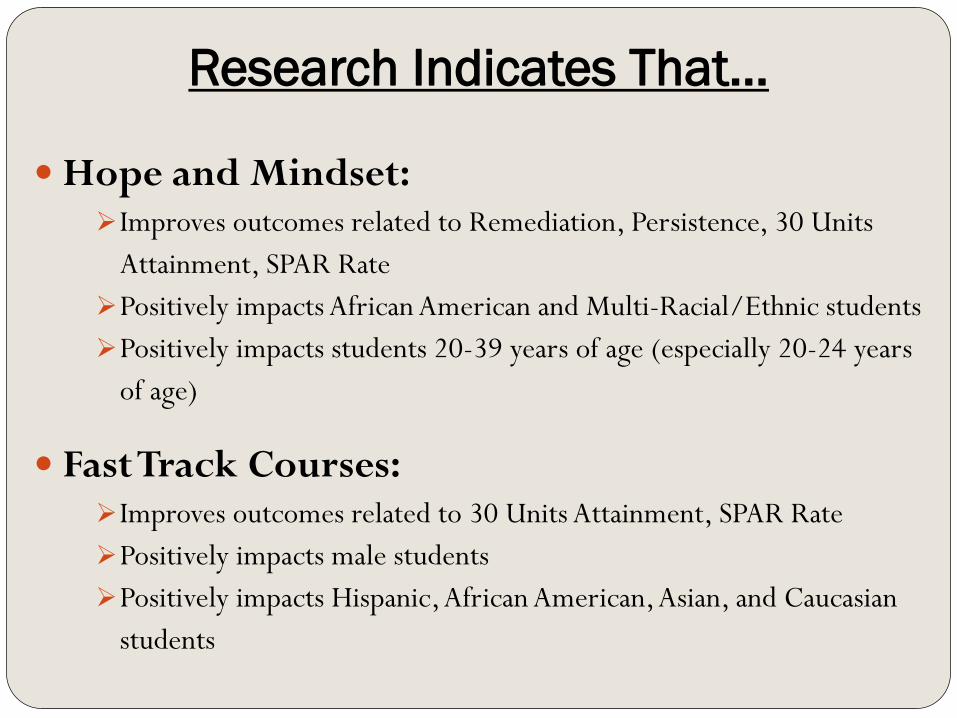
Research Indicates That…
Hope and Mindset: Improves outcomes related to Remediation, Persistence, 30 Units
Attainment, SPAR Rate Positively impacts African American and Multi-Racial/Ethnic students Positively impacts students 20-39 years of age (especially 20-24 years
of age)
Fast Track Courses: Improves outcomes related to 30 Units Attainment, SPAR Rate Positively impacts male students Positively impacts Hispanic, African American, Asian, and Caucasian
students

Research Indicates That…
Supplemental Instruction: Improves outcomes related to Persistence, 30 Units Attainment, CTE
Completion Rate Positively impacts Hispanic and African American students Positively impacts students 50 years of age or older
Senior Early Assessment: Improves outcomes related to Remediation, Persistence, 30 Units
Attainment Positively impacts African American and Hispanic students Positively impacts first-generation college students
2014 Student Success Scorecard
Questions?