CFSTI PRICE(S) 82, - ntrs.nasa.gov · Chopper Correction Loop Calculations - - - - - - - - - - -...
54
FIFTH QUARTERLY REPORT FOR A DAY-NIGHT HIGH RESOLUTION INFRARED RADIOMETER EMPIDYING TWO-STAGE RADIANT COOLING (1 April 1967 - 1 July 1967) Contract No. NAS 5-10113 GPO PRICE $ CFSTI PRICE(S) $ Har ,-wpy (HC) 82, b 6 Microfiche (MF) 11 853 Julv 85 Prepared by ITT Industrial Laboratories Fort Wayne, Indiana 46803 For National Aeronautics and Space Administration Goddard Space Flight Center Greenbelt, Maryland 20771 https://ntrs.nasa.gov/search.jsp?R=19680003468 2018-06-01T05:46:40+00:00Z
Transcript of CFSTI PRICE(S) 82, - ntrs.nasa.gov · Chopper Correction Loop Calculations - - - - - - - - - - -...
FIFTH QUARTERLY REPORT
FOR
A DAY-NIGHT HIGH RESOLUTION INFRARED
RADIOMETER EMPIDYING TWO-STAGE RADIANT COOLING
(1 April 1967 - 1 July 1967)
Contract No. NAS 5-10113 GPO PRICE $
CFSTI PRICE(S) $
Har , -wpy (HC) 82, b 6
Microfiche (MF)
11 853 Julv 85
Prepared by
ITT Industrial Laboratories Fort Wayne, Indiana 46803
For
National Aeronautics and Space Administration Goddard Space Flight Center
Greenbelt, Maryland 20771
https://ntrs.nasa.gov/search.jsp?R=19680003468 2018-06-01T05:46:40+00:00Z

c
~ f i
ITTIL No. 67-1035 15 July 1967
FIFTH QUARTERLY REPORT
FOR
A DAY-NIGHT HIGH RESOLUTION INFRARED
RADIOMETER EMPLOYING TWO-STAGE RADIANT COOLING
(1 April 1967 - 1 July 1967)
Contract No. NAS 5-10113
Prepared by
ITT Industrial Laboratories Fort Wayne, Indiana 46803
For
National Aeronautics and Space Administrations Goddard Space Flight Center .
Greenbelt, Maryland 20771
Contributors
R. V. Annable, J. F. Lodder, R. A. Harber, W. H. Wallschlaeger, G. Eiden
Approved by
c.wt<ep: /& y -/ / K. L. DeBrosse, Manager Space & Applied Science Dept.
Dr. C. W. Stehg’Jr., Direktor Product Development
ITT Industrial Laboratories
ABSTRACT
This report describes the initial testing of a two-stage radiant cooler to be used in a 10.5 to 12.5 micron Day-Night High Resolution Infrared Radiometer and outlines the initial electronic design of a breadboard radiometer. A complete two-stage patch assembly passed sinusoidal vibration tests at Nimbus prototype levels. Thermal tests on single-stage models of the radiant cooler showed that evaporation of aluminum and gold on Alzak treated aluminum does not produce a suitable cone surface, while aluminized mylar produces a cone surface whose emissivity is within the design range (0.086 to 0. 02). The average cone surface emissivity including support and optical openings is 0. 063 in the cooler employing aluminized mylar; this corresponds to an in-orbit patch temperature of 98 degrees K in a single-stage cooler. The helium refrigerator and attached copper structure used to simulate cold space during cooler tests operated close to design values following modification of the support and coupling of the refrigerator. The status of the electronic test equipment is given and the design of the relay optics is outlined. Finally, the initial design of the radiometer elec- tronics is covered.
ii
TABLE OF CONTENTS
Page
1
2 I -
3. 0 TEST EQUIPMENT - - - - - - - - - - - - - - - - - - - - - - - - - - 3.1 3.2
Electronic Test Equipment - - - - - - - - - - - - - - - - - - - - - - Modification of Refrigerator Support and Coupling - - - - - -
4 4 5
I -
8 9
11 16 18 20 25
26
l - VIDEOELECTRONICS . . . . . . . . . . . . . . . . . . . . . . . . 6.0 6.1 6.2 6.3 6.4 6.5 6. 6
Reference Voltage Generator - - - - - - - - - - - - - - - - - - - - - Demodulator and Low-Pass Filter - - - - - - - - - - - - - - - - - Correction Voltage Generator - - - - - - - - - - - - - - - - - - - - Chopper Correction Loop Calculations - - - - - - - - - - - - - -
Video Amplifier - - - - - - - - - - - - - - - - - - - - - - - - - - - - Output Amplifier - - - - - - - - - - - - - - - - - - - - - - - - - - - - -
30 30 30 30 30 33 33
35
8. 0 PROGRAM FOR NEXTQUARTER - - - - - - - - - - - - - - - - - 35
36
Appendix I THERMAL LOAD ON COPPER COLD REFERENCE - - - - - - I- 1
Appendix 11 COOL-DOWN TIME OF COPPER COLD REFERENCE - - - - 11-1
Appendix 111 SPECIFICATION FOR INFRARED RELAY OPTICS - - - - - - 111- 1
iii
LIST OF ILLUSTRATIONS
Page
.'
..
.,
Figure 1 Figure 2 Figure 3 Figure 4 Figure 5 Figure 6 Figure 7 Figure 8
Space Chamber and Cryogenerator Support and Coupling - - - -
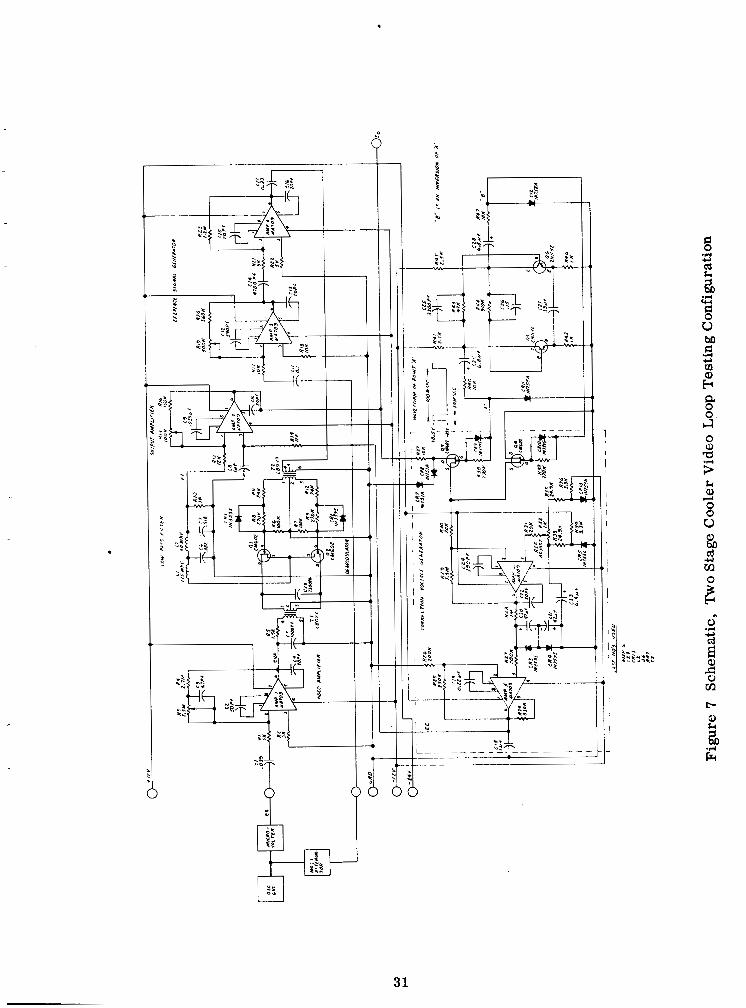
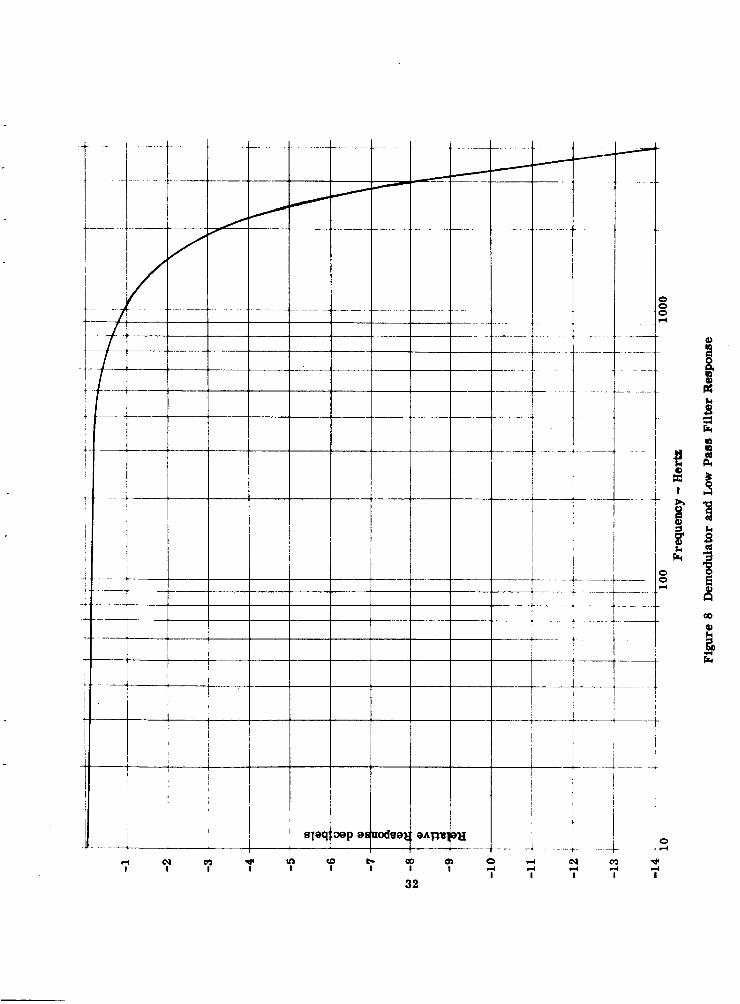
Radiant Cooler Test No. 1 Radiant Cooler Test No. 2 - - - - Radiant Cooler Test No. 3 - - - - - - - - - - - - - - - - - - - - - - - Relay Optic Design Following Collimation - - - - - - - - - - - - - - Schematic, Two-Stage Cooler Video Loop Testing Configuration Demodulator and Low Pass Filter Response - - - - - - - - - - - - -
6 7
10 1 2 13 27 31 32
Flexible Coupling, Cryogenerator to Space Chamber - - - - - - - - - - - - - - - - - - - - - - - - - - - - - - - - - - - - - - - - - - - - - - - - - -
Figure 1-1 Plate to Ambient Geometry with Cooler in Place - - - - - - - - - - 1-2
LIST OF TABLES
Table 1 Table 2 Table 3 Table 4 Table 5 Table 6 Table 7
Experimental Values of Cone Surface Emissivity - - - - - - - - - Experimental Values of Effective Emissivities - - - - - - - - - - Dimensions of Parts in Space Reference Distribution of Radiation Entering Mouth of Perfect Cone - - - - Fraction of Radiation Reaching Patch - - - - - - - - - - - - - - - - - Ratio of Patch to Cone Temperature - - - - - - - - - - - - - - - - - - Increase in Patch Temperature Produced by Non-Black Space
14 15 20 23 24 24
24
- - - - - - - - - - - - - - -
Reference - - - - - - - - - - - - - - - - - - - - - - - - - - - - - - - - - - -
iv
1.0 INTRODUCTION
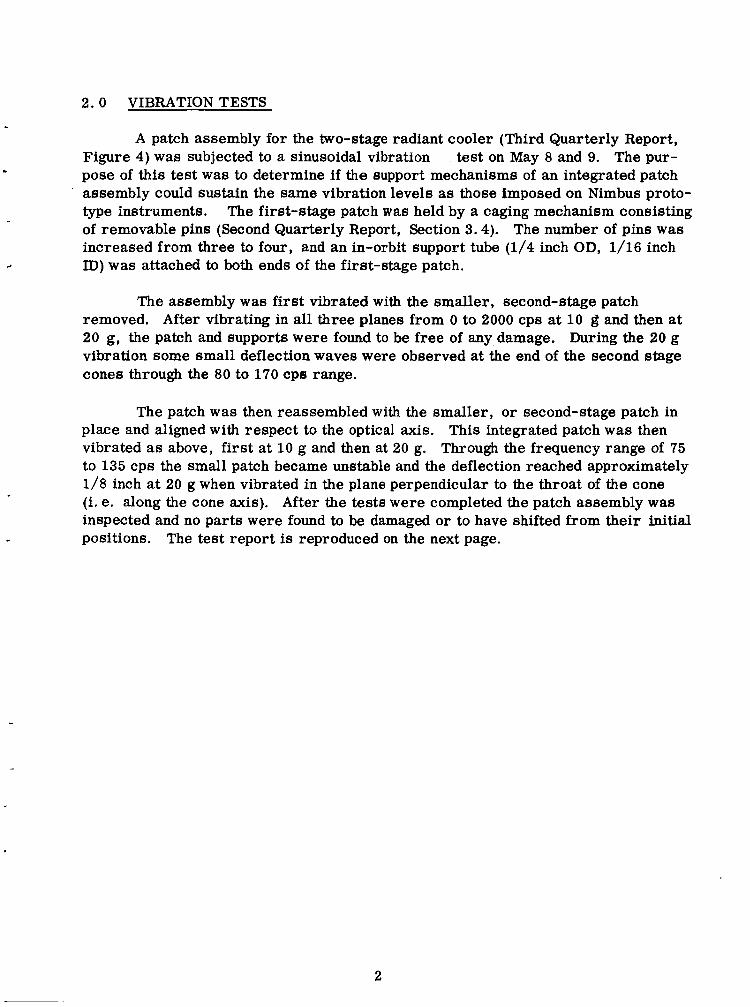
This report covers the technical aspects of the work performed in the develop- ment of a two-stage radiant cooler and associated 10.5 to 12.5 micron day-night radiometer during the quarterly period from 1 April 1967 to 1 July 1967. During the reporting period, a complete two-stage patch assembly passed sinusoidal vibration tests at Nimbus prototype levels. The remaining instruments for the electronic test equipment were selected, and the support and coupling of the helium refrigerator Were modified. Testing of the helium refrigerator and attached copper struoture and
values. Thermal tests on single-stage radiant cooler showed that a cone surface of Alzak treated aluminum covered with evaporated aluminum and evaporated gold has too high an emissivity (0.20). On the other hand, a cone surface of aluminized mylar has an emissivity of 0. 063, which corresponds to an in-orbit patch temperature of 98 degrees K in a single-stage cooler. The optical design of the breadboard radiometer was completed and the electronic design begun.
- aluminum shroud showed that the cold space simulator operates close to its design
A 10.5 to 12.5 micron instrument permits radiometric mapping of the earth and its cloud cover both day and night. It is an extension of the 3.4 to 4.2 micron nighttime High Resolution Infrared Radiometer flown on Nimbus I and 11. The two- stage radiant cooler is anextension of the single-stage cooler employed on the Nimbus radiometer.
This report is for the fourth quarter of the second phase of the program, T which was initiated following approval of the First Quarrterly (Design Study) Report.
The second phase is the construction and testing of a vibrationally sound two-stage cooler, with the objective of attaining a temperature below 80 degrees k. The third phase is the integration of the radiant cooler with a working breadboard radiometer of specific characteristics.
1
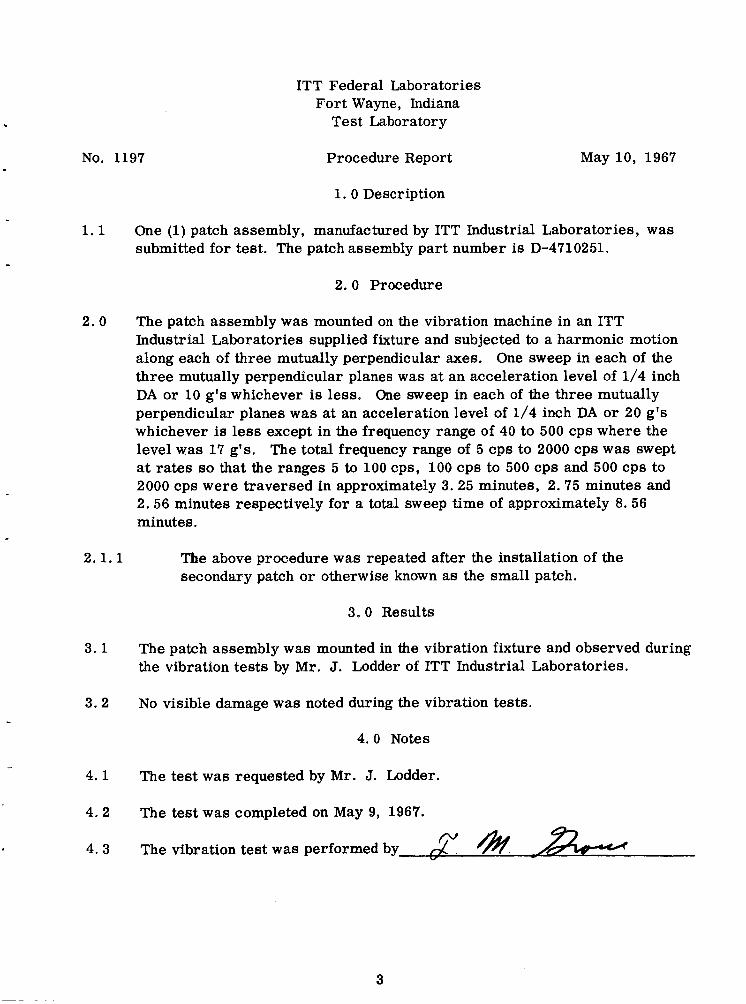
2 . 0 VIBRATION TESTS
A patch assembly for the two-stage radiant cooler (Third Quarterly Report, Figure 4) was subjected to a sinusoidal vibration test on May 8 and 9. The pur- pose of this test was to determine if the support mechanisms of an integrated patch assembly could sustain the same vibration levels as those imposed on Nimbus proto- type instruments. The first-stage patch was held by a caging mechanism consisting of removable pins (Second Quarterly Report, Section 3.4). The number of pins was increased from three to four, and an in-orbit support tube (1/4 inch OD, 1/16 inch ID) was attached to both ends of the first-stage patch.
The assembly was first vibrated with the smaller, second-stage patch removed. Af te r vibrating in all three planes from 0 to 2000 cps at 10 g and then at 20 g, the patch and supports were found to be free of any damage. During the 20 g vibration some small deflection waves were observed at the end of the second stage cones through the 80 to 170 cps range.
The patch was then reassembled with the smaller, or second-stage patch in place and aligned with respect to the optical axis. This integrated patch w a s then vibrated as above, first at 10 g and then at 20 g. Through the frequency range of 75 to 135 cps the small patch became unstable and the deflection reached approximately 1/8 inch at 20 g when vibrated in the plane perpendicular to the throat of the cone (i. e. along the cone axis). After the tests were completed the patch assembly was inspected and no parts were found to be damaged or to have shifted from their initial positions. The test report is reproduced on the next page.
2
No. 1197
1.1
2.0
2.1.1
3.1
3.2
ITT Federal Laboratories Fort Wayne, Indiana
Test Laboratory
Procedure Report May 10, 1967
1. 0 Description
One (1) patch assembly, manufactured by ITT Industrial Laboratories, was submitted for test. The patch assembly part number is D-4710251.
2.0 Procedure
The patch assembly was mounted on the vibration machine in an ITT Industrial Laboratories supplied fixture and subjected to a harmonic motion along each of three mutually perpendicular axes. One sweep in each of the three mutually perpendicular planes was at an acceleration level of 1/4 inch DA or 10 g's whichever is less. One sweep in each of the three mutually perpendicular planes w a s at an acceleration level of 1/4 inch DA or 20 g's whichever is less except in the frequency range of 40 to 500 cps where the level was 17 g's. The total frequency range of 5 cps to 2000 cps was swept at rates so that the ranges 5 to 100 cps, 100 cps to 500 cps and 500 cps to 2000 cps were traversed in approximately 3.25 minutes, 2.75 minutes and 2.56 minutes respectively for a total sweep time of approximately 8. 56 minutes.
The above procedure was repeated after the installation of the secondary patch or otherwise known as the small patch.
3. 0 Results
The patch assembly was mounted in the vibration fixture and observed during the vibration tests by Mr . J. Lodder of ITT Industrial Laboratories.
No visible damage was noted during the vibration tests.
4. 0 Notes
4.1
4.2
4.3
The
The
The
test was requested by Mr. J. Lodder.
test was completed on May 9, 1967.
vibration test was performed by 6((" &. L%?4-
3
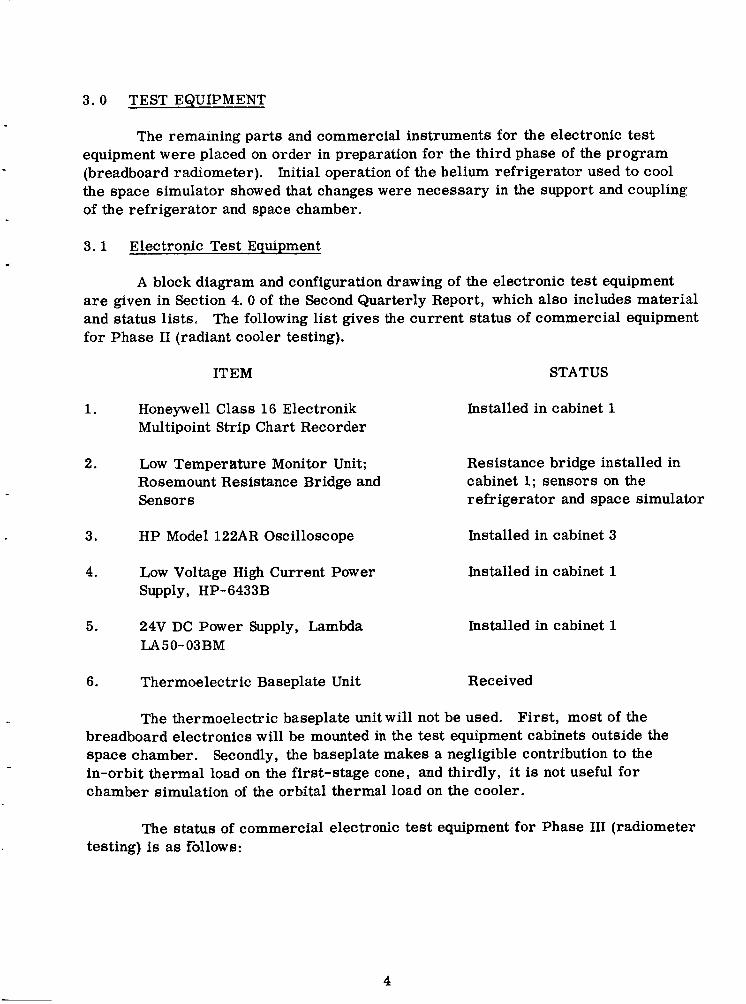
3.0 TEST EQUIPMENT
The remaining parts and commercial instruments for the electronic test equipment were placed on order in preparation for the third phase of the program (breadboard radiometer). Initial operation of the helium refrigerator used to cool the space simulator showed that changes were necessary in the support and coupling of the refrigerator and space chamber.
3.1 Electronic Test Equipment
A block diagram and configuration drawing of the electronic test equipment are given in Section 4. 0 of the Second Quarterly Report, which also includes material and status lists. The following list gives the current status of commercial equipment for Phase I1 (radiant cooler testing).
ITEM STATUS
1. Honeywell Class 16 Electronik Installed in cabinet 1 Multipoint Strip Chart Recorder
2. Low Temperature Monitor Unit; Rosemount Resistance Bridge and Sensors
Resistance bridge installed in cabinet 1; sensors on the refrigerator and space simulator
3. HP Model 122AR Oscilloscope Installed in cabinet 3
4. Low Voltage High Current Power Installed in cabinet 1 Supply, HP-6433B
5. 24V DC Power Supply, Lambda L A 5 0- 03BM
Installed in cabinet 1
6. Thermoelectric Baseplate Unit Received
The thermoelectric baseplate unit will not be used. First, most of the breadboard electronics will be mounted in the test equipment cabinets outside the space chamber. in-orbit thermal load on the first-stage cone, and thirdly, it is not useful for chamber simulation of the orbital thermal load on the cooler.
Secondly, the baseplate makes a negligible contribution to the
The status of commercial electronic test equipment for Phase I11 (radiometer testing) is as fbllows:
4
ITEM STATUS
1. Visicorder 1508 Oscillograph Due 7/23/67
2. 6 Channel Galvanometer Amplifier T6GA-500 Received
3. Galvanometers for Item 1; 2 each M3300, Received M8000, M13000
4. Digital Voltmeter, ,Hewlett Packard 3460B Received
5. Digital Printer, Hewlett Packard HP-P76-5624R Received
The remaining Phase I11 instruments are fabricated in house. Because of the minor hardware cost, most of these units were constructed during Phase YE. These a r e the thermoelectric control unit, the blackbody target and target tempera- ture control, the secondary voltage standard, and the motor power supply; all of them a r e described in Sections 4.1 through 4-4 of the Second Quarterly Report. The thermoelectric control unit will not be needed because of the removal of the thermoelectric baseplate unit. a model 246, 1800 rpm Bodine 60 cycle motor will be used in place of the Roters motor. suitable for a breadboard unit. Power to the Bodine motor will be controlled by a rack-mounted variac.
Neither will the 100 cps motor power supply, since
The Roters unit has a high cost and long delivery time and does not appear
The instruments remaining to be constructed a re the patch panel and input scanner (See Figure 6 in the Second Quarterly Report). been ordered, but fabrication has not been started.
Parts for these units have
3.2 3 The first approach to mating the helium refrigerator (cryogenerator) to the
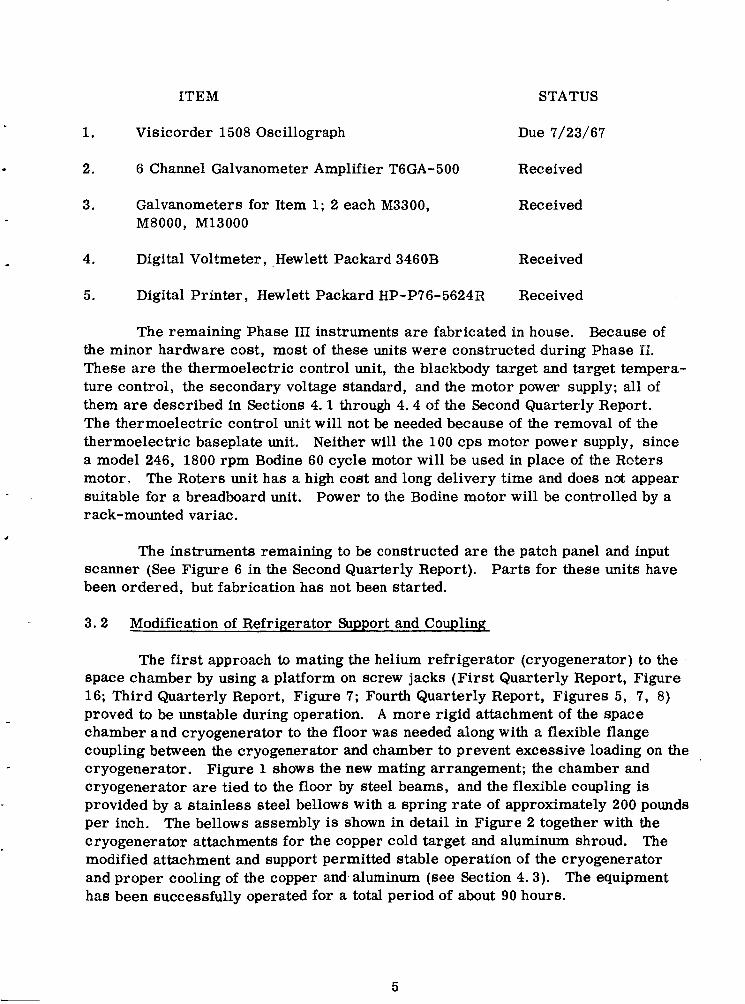
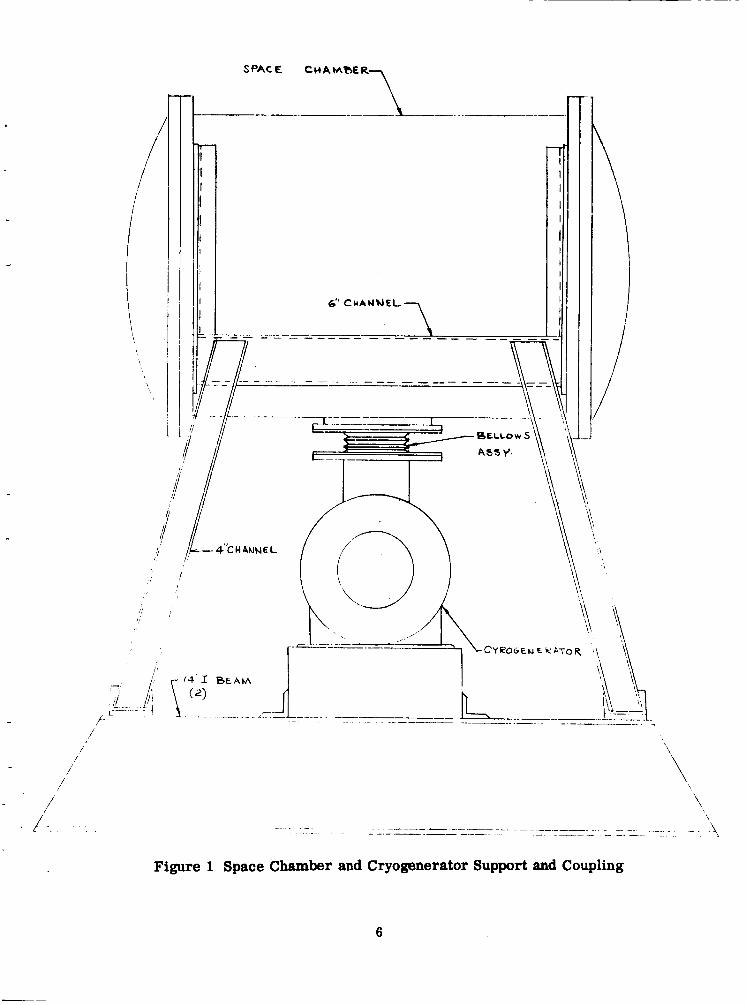
space chamber by using a platform on screw jacks (First Quarterly Report, Figure 16; Third Quarterly Report, Figure 7; Fourth Quarterly Report, Figures 5, 7, 8) proved to be unstable during operation. A more rigid attachment of the space chamber and cryogenerator to the floor was needed along with a flexible flange coupling between the cryogenerator and chamber to prevent excessive loading on the cryogenerator. Figure 1 shows the new mating arrangement; the chamber and cryogenerator a r e tied to the floor by steel beams, and the flexible coupling is provided by a stainless steel bellows with a spring rate of approximately 200 pounds per inch. The bellows assembly is shown in detail in Figure 2 together with the cryogenerator attachments for the copper cold target and aluminum shroud. The modified attachment and support permitted stable operation of the cryogenerator and proper cooling of the copper and aluminum (see Section 4.3). The equipment has been success fu~~y operated for a total period of about 90 hours.
5
7 SPACE C H A M M R
I
i '\ \
. . . L ... - - . . . .I . ~
. . - , I-. . . . ..
Figure 1 Space Chamber and Cryogenerator Support and Coupling
6
BE
/ t
I
i
Figure 2 Flexible Coupling, Cryogenerator to Space Chamber
7

4. 0 THERRlAL TESTS
The performances of two single-stage models of the two-stage radiant cooler were determined by means of the therm&-vacuum tebt equipment (Fourth Quarterly Report, Section 3. 0) and temperature measuring instruments (First Quarterly Repo-t, Section 5.2; Second Quarterly Report, Section 4. 0). The final equilibrium tempera- tures were used to calculate the effective patch-to-cone emissivity (First Quarterly Report, Section 5.4) and the effective emissivity between the outer box and first-stage cone (Second Quarterly Report, Section 5.5.1). The average emissivity of the cone surface can be determined from the effective patch-to-cone emissivity and the cone geometry (First Quarterly Report, Appendix 111; Fourth Quarterly Report, Section 4.3). The in-chamber temperature of the cone, and therefore the accuracy of simu- lating in-orbit operation, is determined by the box-cone emissivity and the tempera- ture of the outer box together with the cone surface emissivity and cooler geometry.
The first cooler to be tested has a cone surface of Alzak treated aluminum covered with successive layers of evaporated aluminum and gold. Its cone surface emissivity is 0.20 (Section 4.2), which is considerably above the design range of 0.086 to 0.02. The surface emissivity is an average value and assumes specular reflection at the cone walls and a black patch; it includes the openings for the in- orbit support tubes and optics as well as the small conductive coupling through the in-orbit support tubes (Second Quarterly Report, Section 5.3).
Much better results were obtained with the second cooler to be tested, which has a cone surface of aluminized mylar. Its cone surface emissivity is 0. 063 (Section 4.2), which corresponds to an in-orbit patch temperature of about 98 degrees K in a single-stage cooler for an orbit normal to sun angle of 79 degrees (Section 4.2). The ratio of patch temperature to cone temperature was 0.48 in the second cooler compared with 0.64 in the first.
The first-stage cone and patch in the aluminized mylar model attained temperatures about 10 percent below their expected orbital values (Section 4.3). The thermal load on the cone will be increased in future tests to increase the accuracy of thermal simulation.
The helium refrigerator and attached copper and aluminum structures provided a cold space reference suitable for thermal testing of the radiant coolers (Section 4.4).
The residual gas pressure in the space chamber during the second and third thermal te6ts reached levels at which gas conduction is entirely negligible (Section4. 5).
A non-black space reference reflects part of the patch and cone radiation back to the patch, thus increasing the patch temperature. The temperature of a black patch is about 4 .2 percent higher when the reference has a diffuse reflectivity of 5 percent (Section 4. 6).
8
4.1 Single-Stage Cooler Models
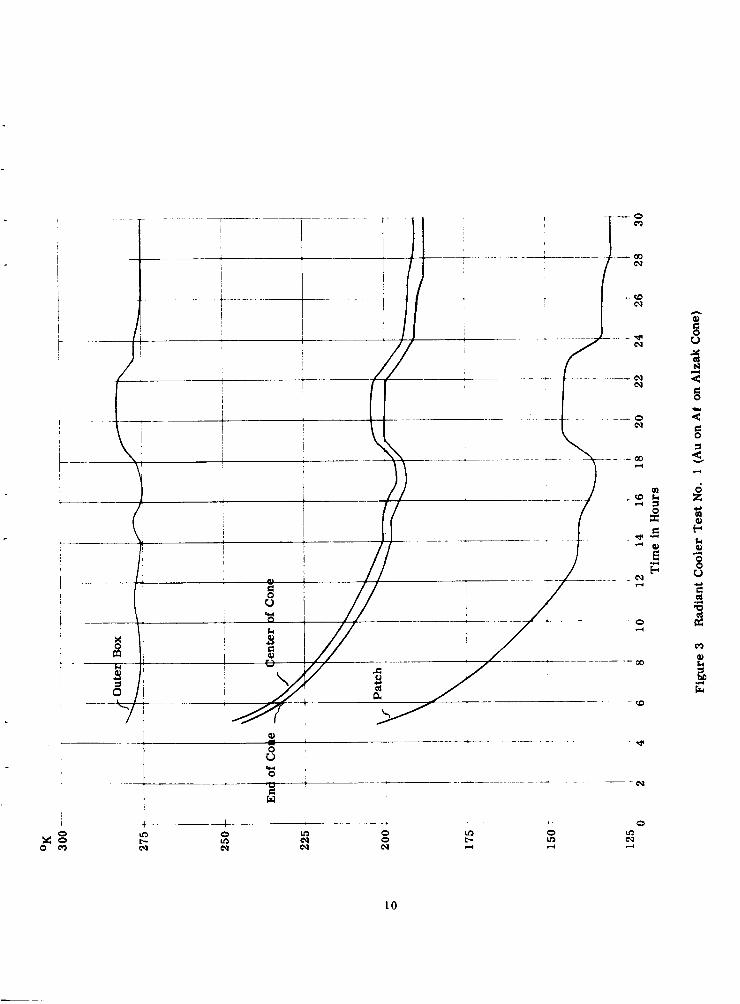
Three thermal tests were conducted on single-stage models of the two-stage radiant cooler. covered with evaporated aluminum and gold. The third test was on a cooler with a cone surface covered with aluminized mylar. Patches in both coolers were painted with 3M Black Velvet and were supported at two ends by Synthane G-10 (in-orbit) support tubes of 1/4-inch outside diameter and 3/16-inch inside diameter. The support tubes were not covered with evaporated gold or wrapped with multilayer insulation (See Second Quarterly Report, Section 5.3). However, the radiative coupling to the surfaces of the tubes was reduced by concentric cylindrical inserts mounted to the patch and covered on their inner surfaces with evaporated gold (See First Quarterly Report, Figure 13). In addition to the openings through the cone wall for the support tubes, openings were provided for the optical beam and the four patch caging pins.
The first two tests were on a cooler with an Alzak cone surface
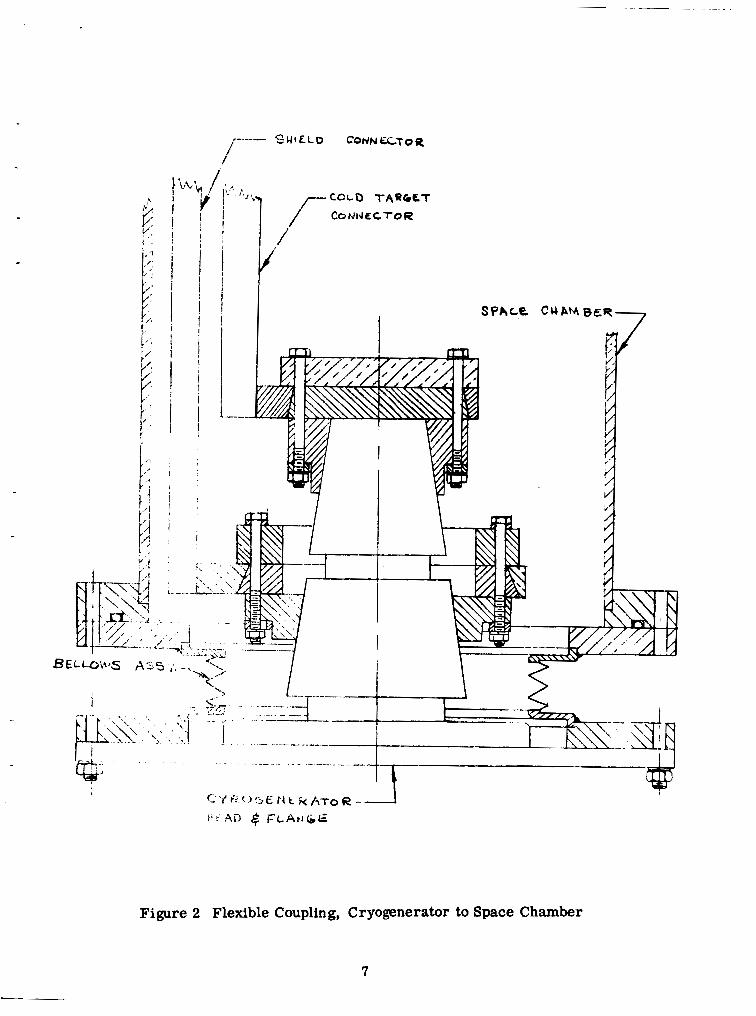
Temperature measurements during the first radiant cooler test a r e shown in Figure 3. Time is measured from the start of the A-20 helium refrigerator. The temperatures of the outer box, cone, and patch were measured by means of chromel- alumel thermocouples. The cone temperature was measured near its ends and at the frame in the center. There w a s a 3 to 4 degree K temperature difference from either end to the center of the cone. After about 12 o r 13 hours the regular decrease in temperatures was interrupted, as shown by the break in the curves of temperature versus time. This was probably caused by the cracking and flaking of the paint (3M Black Velvet) on the copper space reference, which was evident on removal of the cooler. Toward the end of the test run, "frost" was evident on the cold exchanger of the A-20; this appears to have been produced by air leaking into the vacuum system, After the A-20 had been turned off to allow it to warm up, large volumes of gas were given off by the cold exchangers, copper reference,: and aluminum shroud.
d
Following completion of the first thermal test and removal of the radiant cooler, the vacuum system w a s restarted (the helium regrigerator was not turned on). It was evident that a leak had developed; the pressure reached only 2 x A large leak was located in the O-ring seal of the front chamber door and a second, smaller leak in the O-ring seal of the air-release line. A f t e r repair of these leaks, the vacuum system operated satisfactorily, reaching pressure of 1 .8 x after 5 hours of pumping.
Torr.
Torr
The copper end plates used to simulate cold space were removed from the space chamber and cleaned of paint and primer. The plates were then sandblasted, repainted with 3M Black Velvet (no primer was used), andbaked in an oven to set the paint. No cracking or flaking of the new paint surface was evident following tempera- tures cycles from ambient to 30 degrees K and back during the next two thermal tesb.
9
x 8 o m In 0 L- v) N ea
v) ea ea
-7 - - 0 0 N
C .d
Q)
E .r(
b
C 0
z
s C 0 a
4
c, op
F
m
10
*
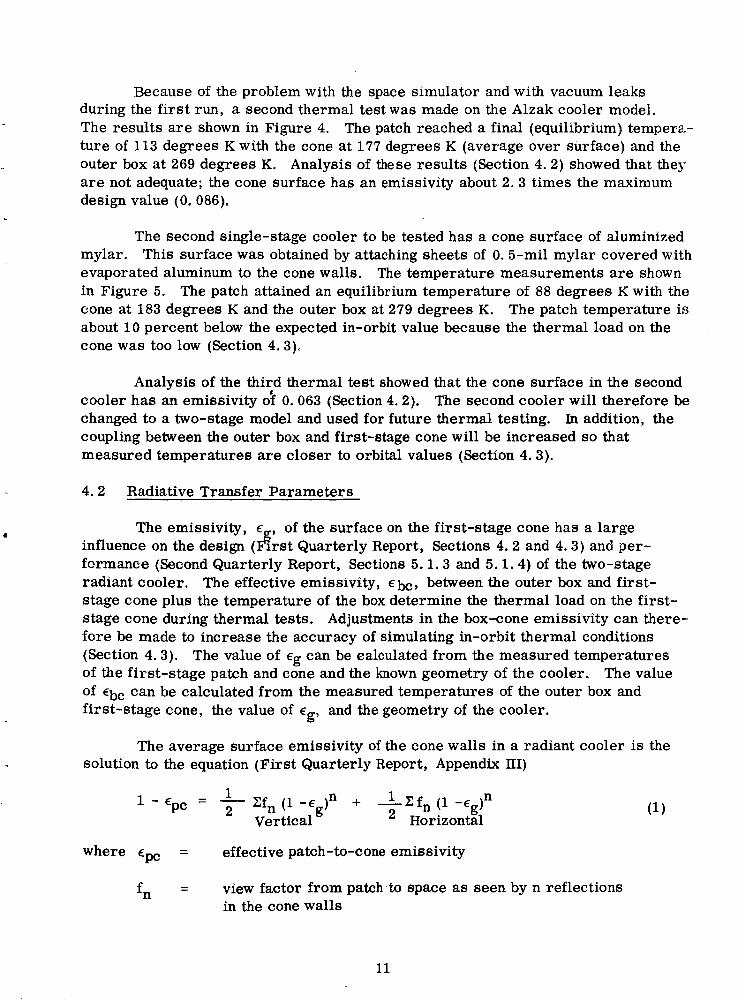
Because of the problem with the space simulator and with vacuum leaks during the first run, a second thermal test was made on the Alzak cooler model. The results a r e shown in Figure 4. ture of 113 degrees K with the cone at 177 degrees K (average over surface) and the outer box at 269 degrees K. Analysis of these results (Section 4.2) showed that they a re not adequate; the cone surface has an emissivity about 2.3 times the maximum design value (0.086).
The patch reached a final (equilibrium) tempera-
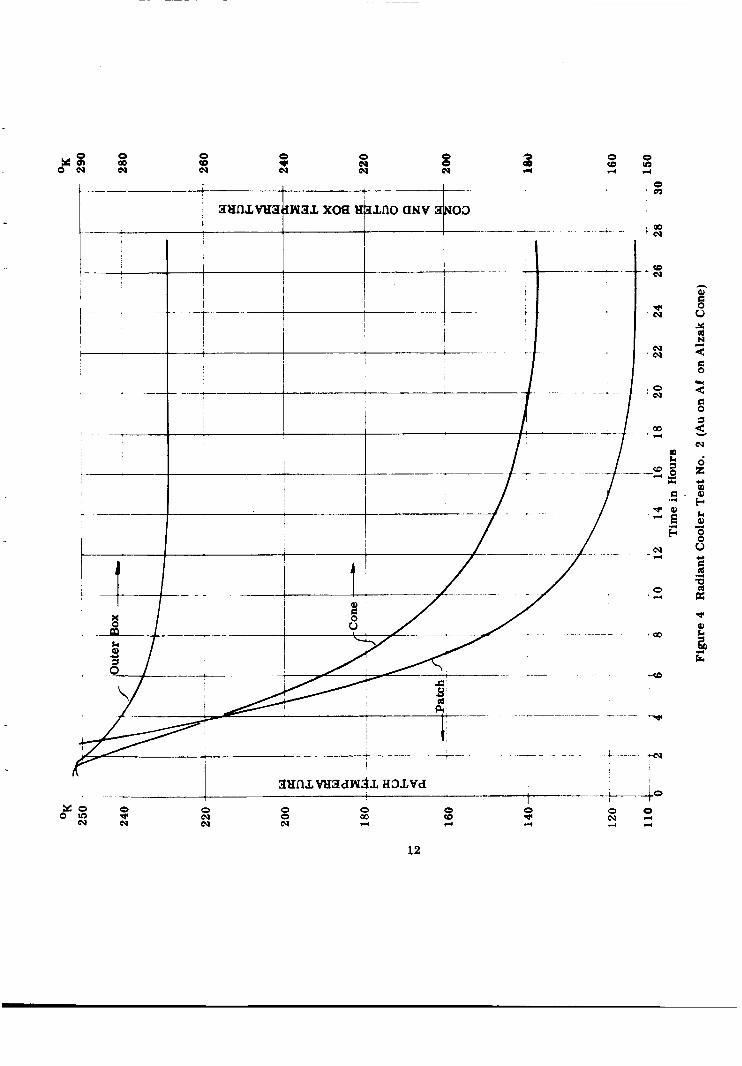
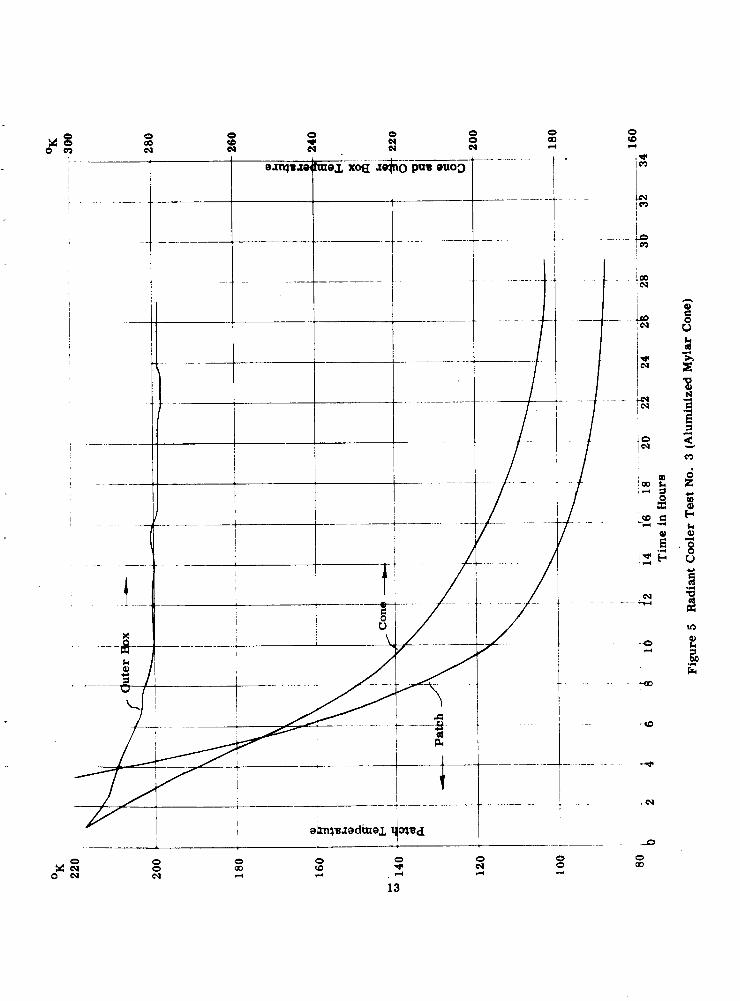
The second single-stage cooler to be tested has a cone surface of aluminized
The temperature measurements a re shown mylar. This surface was obtained by attaching sheets of 0. 5-mil mylar covered with evaporated aluminum to the cone walls. in Figure 5. The patch attained an equilibrium temperature of 88 degrees K with the cone at 183 degrees K and the outer box at 279 degrees K. The patch temperature is about 10 percent below the expected in-orbit value because the thermal load on the cone was too low (Section 4.3).
Analysis of the third thermal test showed that the cone surface in the second cooler has an emissivity Gf 0.063 (Section 4.2). The second cooler will therefore be changed to a two-stage model and used for future thermal testing. In addition, the coupling between the outer box and first-stage cone will be increased so that measured temperatures are closer to orbital values (Section 4.3).
4.2 Radiative Transfer Parameters
The emissivity, E , of the surface on the first-stage cone has a large influence on the design ( # irst Quarterly Report, Sections 4.2 and 4.3) and per- fermance (Second Quarterly Report, Sections 5.1.3 and 5.1.4) of the two-stage radiant cooler. The effective emissivity, E ~ C , between the outer box and first- stage cone plus the temperature of the box determine the thermal load on the first- stage cone during thermal tests. Adjustments in the box-cone emissivity can there- fore be made to increase the accuracy of simulating in-orbit thermal conditions (Section 4.3), The value of Eg can be ealculated from the measured temperatures of the first-stage patch and cone and the known geometry of the cooler. The value of EbC can be calculated from the measured temperatures of the outer box and first-stage cone, the value of eg, and the geometry of the cooler.
The average surface emissivity of the cone walls in a radiant cooler is the solution to the equation (First Quarterly Report, Appendix 111)
1 - EPC = - 1 zfn (1 - E ~ ) ~ + -zfn 1 (1 -Egln 2 Vertical 2 Horizontal
where cPC = effective patch-to-cone emissivity
= view factor from patch to space as seen by n reflections in the cone walls
fn
11
0 0 aD (0 2z ea ea
0 0 * ea ea cu 3 aD 4
8 cu 0 0 W I n r ( d
I -I ~ .- I *
I
. --
I -.
i
. o .ea
Ip bl
-5 X
Z O 0 o m * ea ea 0 ea ea
0 03 +
0 W +
12
0 aD N
0 0 (0 w cu eu I . -
9 n q W J O I
I I I i t - - 1 --
.- I i-
-4 j
x z O N
0 0 N
0 m d
0 (0 d
I - .__ - .. .
I .. * -
0 0 0
0 * r( 2 d
13

The first sum uses the values of fn in the vertical plane and the second sum, in the horizontal plane. The value of cPc in a single-stage cooler is given by (First Quarterly Report, Section 5.4)
where Tp = patch temperature
.Tc = cone temperature
The values of fn are given in Table 2, p. 24, of the First Quarterly Report. Substituting them into equation (l), we obtain
1 /2 - €3- - 1 + 1. 075 - [(l. 075)2 + 1.276 (1. 394 -2 ‘PC)]
(3 ) J 0. 638
The values of E were calculated fo r the two models of radiant cooler described in Section 4. f . The results are given in Table 1.
Table 1
Experimental Values of Cone Surface Emissivity
PC % Cone Wall Material Tp& E
Au on Af on Alzak 0.638 0.166 0.202
AB on Mylar 0.481 0.0535 0.063
The value of box-cone emissivity for a single-stage cooler in.the space chamber can be determined from the thermal balance equation of the cone (Second Quarterly Report, Section 5 . 5 . 1 )
where Ts = temperature of outer box
Ace = area of cone ends
A, = area of cone walls
eCX = effective external emissivity of the cone
= effective cone - to -patch emi s s ivity CP
E
14

Solving for Ebc, we obtain
E k =
The value of Ace/Ac is 0.118. geometry, so there is no distinction between box-to-cone and cone-to-box emissivity.
Equation (4) assumes close-spaced or plane-parallel
The effective cone-to-patch emissivity is related to the effective patch-to- cone emissivity by (First Quarterly Report, equation 15)
where Ap is the radiating area of the patch effective cone external emissivity is given by (First Quarterly Report, p. 26)
The value of Ap/Ac is 0,065. The
[I - 2 fn' (1 - E ~ ) ~ I (7) - Am - -
AC n=O €CX
where A, = area of cone mouths
fn' = view factor from cone mouth to cone mouth and patch as seen by n reflections in the cone walls
The values of fd a re listed in Table 3, p. 26, of the First Quarterly Report. The value of Am/Ac is 0.316.
Values of ccp, cCx, and EbC were calculated for the two cooler models. The results a r e listed in Table 2.
Table 2
Experimental Values of Effective Emissivities
€CX €CP Cone Wall Material
Au on A t on Alzak 0.105 0.0109 0.054
A! on Mylar 0.0375 0.00348 0.036
In both cooler models the inner surface of the outer box (i. e. , the surface facing the cone)was lined with aluminized mylar. In the first cooler the outer surface of the cone was anodized aluminum and in the second, clean mill-finished aluminum. The lower emissivity of the second cone surface produced a lower value of box-cone emissivity.
15
4 . 3 Thermal Simulation
If the temperature of the first-stage cone approximates its in-orbit value during thermal space chamber tests, the patch temperatures will also be close to their orbital values and the test will be realistic. The in-orbit cone temperature for a cone surface of aluminized mylar is calculated below for an orbit normal to sun angle of 79 degrees. The cone temperature during the third thermal test w a s about 10 percent below this temperature, BO that the patch temperature was also 10 percent below its orbital value. Closer simulation can be obtained by increasing the radiative coupling from the outer box to the first-stage cone, thereby increasing the cone thermal load and cone temperatures.
The in-orbit temperature of the first-stage cone is calculated in Section 5 . 1 of the Second Quarterly Report at the extreme values of cone surface emissivity ( cg) and solar absorptivity ( ag). The same procedure may be used to calculate the in- orbit cone temperature for an aluminized mylar surface. If we assume ag equals 0. 201 (L. H. Hemmerdinger and R. J. Hembach in "Handbook of Military Infrared", Ed. by W. Wolfe, Office of Naval Research, 1965, p. 804) and cg equals 0. 063 (Section 4.2) , the in-orbit cone temperature is
Tc = 203'K (8)
for an orbit normal to sun angle of 79 degrees and an earth shield attached to the outer box (First Quarterly Report, Section 4.3) . The values of the other parameters a re given in Section 5 . 1 of the Second Quarterly Report, except those depending on cg and ag which have the following values
3.75 x 10⁻² - - €CX
3.48 10-3 - CP - E
6.64 x 8 - - %e
H = 5.75 x watts/cm'
From equation (2) and Table 1, the corresponding in-orbit patch temperature is
Tp = 97.5'K (9)
1 On the other hand, W. B. Fusscell, et. al. , in "Measurement of Thermal Radiation Properties of Solids", Ed. by J. C. Richmond, NASA SP-31, 1963 give ag = 0.13 for aluminized mylar (p. 100).
16

If the l-1/16-inch wide cone ends in a flight model a r e made of Alzak treated aluminum, better values for the emissivity and solar absorptivity of the ends a r e (Hemmerdinger and Hembach, op. cit. )
This reduces the absorbed direct solar power per unit cone wall area to
2 H = 5.58 x watts/cm
For the other parameters a s above (aluminized mylar cone walls), the cone and patch temperatures become
To increase the accuracy of the simulation of in-orbit thermal conditions, the in-chamber cone temperature will be increased in future tests by increasing the box-cone radiative coupling. If the aluminized mylar is removed from the inner surface of the outer box, it exposes three box walls of mill-finished aluminum and one of Alzak treated aluminum (the outer box surface facing the spacecraft is mill- finished aluminum). The resultant in-chamber cone temperature is close to its orbital value, as shown by the following calculations,
The emissivity of the mill-finished aluminum can be estimated from the values of box-cone emissivity, %c, given in Section 4.2. Assuming plane-parallel o r close-spaced geometry, we have
- 1 1 + - -1 - €bC -
€1 €2
where el = emissivity of inner surface of box
e2 = emissivity of outer surface of cone
If we assume the anodized aluminum outer cone surface in the first cooler model is black (€2 = l ) , we obtain the minimum value for the aluminized mylar of €1 = 0. 054 (Table 2). Using this value we can calculate the maximum value for the emissivity of the mill-finished aluminum on the outer cone surface in the second cooler model. The result is €2 = 0.098.
17
Upon removal of the aluminized mylar from the inner surface of the box in the second model, 0.845 of the surface area becomes mill-finished aluminum facing mill-finished aluminum and 0.155 mill-finished aluminum facing Alzak. The first combination produces a box-cone emissivity of 0.0515 and the second, 0.096 (Alzak emissivity of 0. 8). The average box-cone emissivity is then
0.845 x 0.0515 + 0.155 x 0. 096 (12) - -
0.058 €bc =
Using equation (5) and experimental data for the second cooler model (aluminized mylar cone surface), we obtain an outer box to first-stage cone temperature ratio of
for ECb = 0.058. For an outer box temperature 279 degrees K (achieved in the third thermal test), the in-chamber cone temperature is
Tc = 201°K (13)
This is very close to the estimated in-orbit range of 203 degrees K to 206 degrees K.
4.4 Copper Space Reference
The copper structure used to simulate cold space operated close to its design values. The copper reached thermal equilibrium in about 10.7 hours. mum temperature on a copper end plate at thermal equilibrium was about 29 degrees K (measured near the farthest point from the second cold exchanger of the helium refrigerator). The cool-down time is a little longer than the calculated value (9.9 hours, Appendix 11). The maximum temperature is about that originally calculated (29 to 30 degrees K, Appendix XI1 to the First Quarterly Report). The thermal load on the copper structure is determined below using the experimentally measured temperature drop across the copper. The result (38 watts) compares well with the value calculated from equilibrium radiative loading from the chamber and the radiant cooler when the cooler is placed between the two copper end plates (Appendix I). The thermal loads from the aluminum shroud (Third Quarterly Report, Appendix 11) and through the support cables to the chamber (Third Quarterly Report, Appendix 111) are negligible by comparison. The aluminum shroud was operated without an outer cover of aluminized mylar and attained a thermal equilibrium temperature of about 100 degrees K near the farthest point from the intermediate heat exchanger. Photographs of the copper reference and aluminum shroud suspended inside the chamber are contained in Section 3. 0 of the Fourth Quarterly Report.
The maxi-
2 Results are given for the first test of the space reference.
18
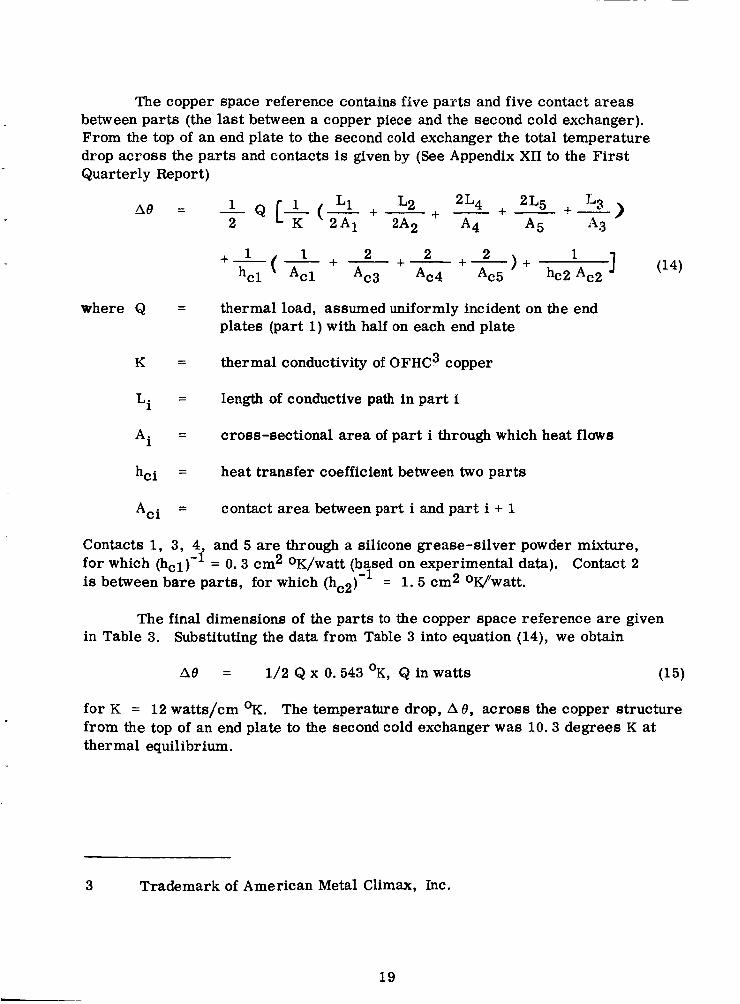
The copper space reference contains five parts and five contact areas between parts (the last between a copper piece and the second cold exchanger). From the top of an end plate to the second cold exchanger the total temperature drop across the parts and contacts is given by (See Appendix XI1 to the First Quarterly Report)
> 1 L1 L2 +-+-+A 2L4 2L5 + - A0 = - Q [+(- 2 2A1 2A2 A4 A5 A3
I (14) 2 +-)+ 1 1 2 2 + -+-
+- hcl Ac3 Ac4 Ac5 b 2 Ac2
where Q = thermal load, assumed uniformly incident on the end plates (part 1) with half on each end plate
K = thermal conductivity of OFHC3 copper
Li = length of conductive path in part i
Ai = cross-sectional area of part i through which heat flows
hci = heat transfer coefficient between two parts
Aci = contact area between part i and part i + 1
Contacts 1, 3, 4 and 5 are through a silicone grease-silver powder mixture, for which (hcl)-i = 0.3 cm2 OK/watt (based on experimental data). Contact 2 is between bare parts, for which (hcz)-' = 1 . 5 cm2 Owlwatt.
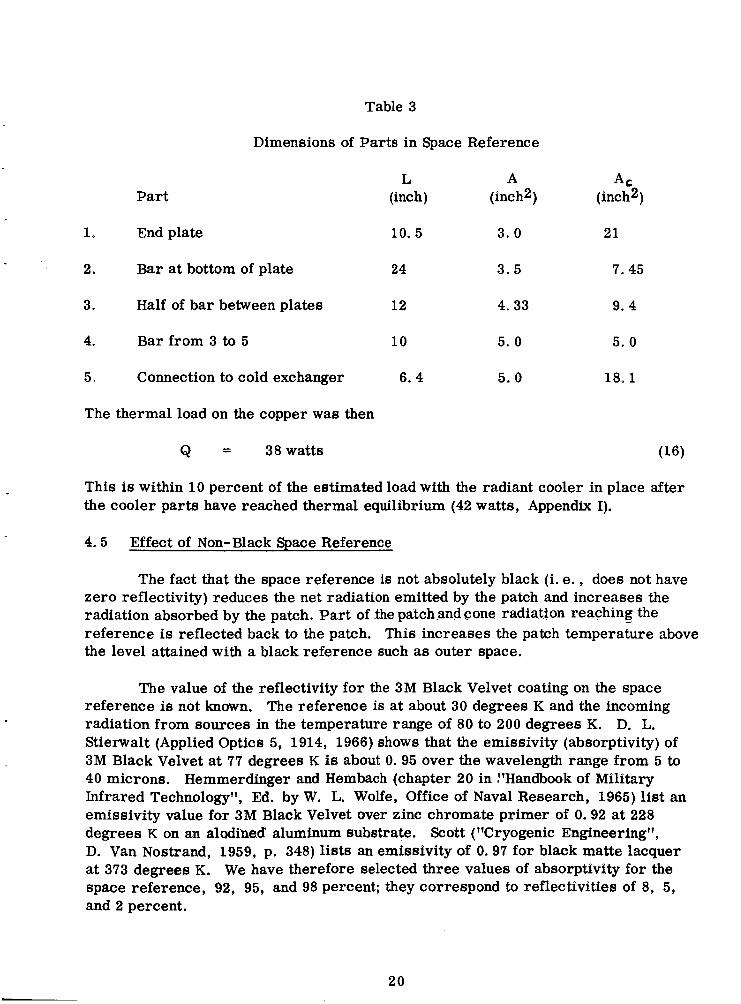
The final dimensions of the parts to the copper space reference are given in Table 3. Substituting the data from Table 3 into equation (14), we obtain
A0 = 1/2 Q x 0.543 OK, Q in watts (15)
for K = 12 watts/cm %. The temperature drop, A 8 , across the copper structure from the top of an end plate to the second cold exchanger was 10.3 degrees K at thermal equilibrium.
3 Trademark of American Metal Climax, Inc.
19
Part
Table 3
Dimensions of Parts in Space Reference
L A A, (inch) (incha) (inch2)
1. End plate 10. 5 3. 0 21
2. Bar at bottom of plate 24 3.5 7.45
3. Half of bar between plates 12 4.33 9. 4
4. Bar from 3 to 5 10 5. 0 5. 0
5. Connection to cold exchanger 6. 4 5.0 18.1
The thermal load on the copper was then
Q = 38 watts (16)
This is within 10 percent of the estimated load with the radiant cooler in place after the cooler parts have reached thermal equilibrium (42 watts, Appendix I).
4.5 Effect of Non-Black Space Reference
The fact that the space reference is not absolutely black (i. e. , does not have zero reflectivity) reduces the net radiation emitted by the patch and increases the radiation absorbed by the patch. Par t of the patchand eone radiation reaching d the reference is reflected back to the patch. This increases the patch temperature above the level attained with a black reference such as outer space.
The value of the reflectivity for the 3 M Black Velvet coating on the space reference is not known. The reference is at about 30 degrees K and the incoming radiation from sources in the temperature range of 80 to 200 degrees K. D. L. Stierwalt (Applied Optics 5, 1914, 1966) shows that the emissivity (absorptivity) of 3M Black Velvet at 77 degrees K is about 0.95 over the wavelength range from 5 to 40 microns. Hemmerdinger and Hembach (chapter 20 in !'Handbook of Military Infrared Technology", Ed. by W. L. Wolfe, Office of Naval Research, 1965) list an emissivity value for 3 M Black Velvet over zinc chromate primer of 0.92 at 228 degrees K on an alodinecT aluminum substrate. Scott ("Cryogenic Engineering", D. Van Nostrand, 1959, p. 348) lists an emissivity of 0.97 for black matte lacquer at 373 degrees K. We have therefore selected three values of absorptivity for the space reference, 92, 95, and 98 percent; they correspond to reflectivities of 8, 5, and 2 percent.
20
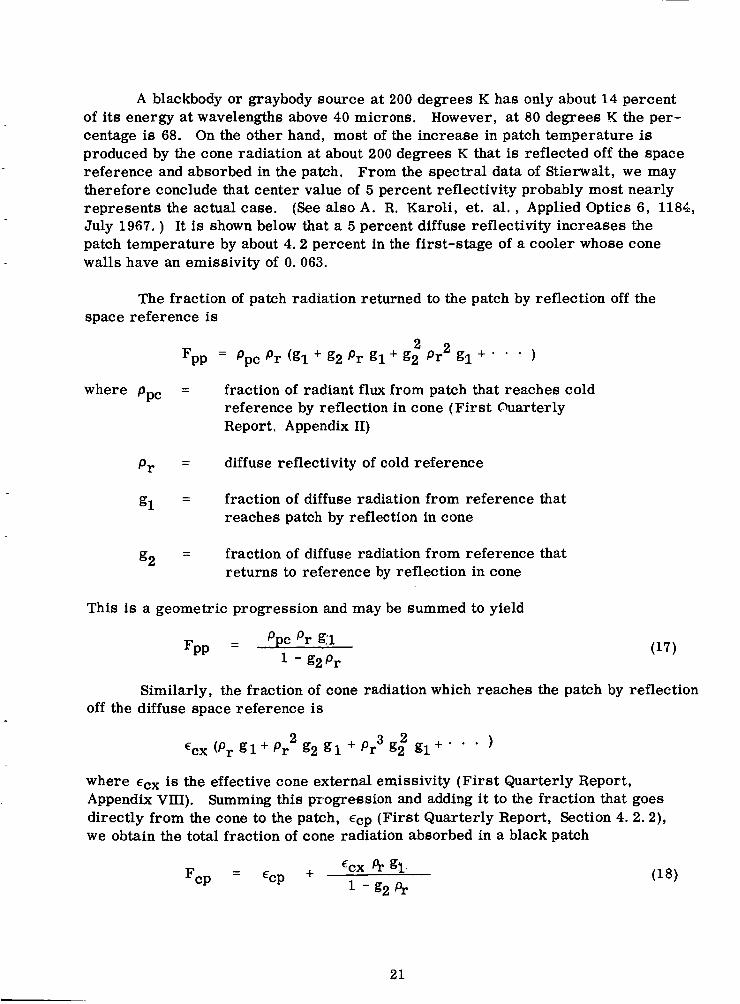
A blackbody or graybody source at 200 degrees K has only about 14 percent of its energy at wavelengths above 40 microns. However, at 80 degrees K the per- centage is 68. On the other hand, most of the increase in patch temperature is produced by the cone radiation at about 200 degrees K that is reflected off the space reference and absorbed in the patch. From the spectral data of Stierwalt, w e may therefore conclude that center value of 5 percent reflectivity probably most nearly represents the actual case. July 1967. ) It is shown below that a 5 percent diffuse reflectivity increases the patch temperature by about 4 .2 percent in the first-stage of a cooler whose cone walls have an emissivity of 0.063.
(See also A. R. Karoli, et. al. , Applied Optics 6, 1184,
The fraction of patch radiation returned to the patch by reflection off the space reference is
2 2 Fpp = Ppc P r @I+ 82 P r 81 + 82 P r 81 + * )
where ppc = fraction of radiant flux from patch that reaches cold reference by reflection in cone (First Ouarterly Report, Appendix 11)
P r = diffuse reflectivity of cold reference
g1 = fraction of diffuse radiation from reference that reaches patch by reflection in cone
g2 = fraction of diffuse radiation from reference that returns to reference by reflection in cone
This is a geometric progression and may be summed to yield
Similarly, the fraction of cone radiation which reaches the patch by reflection off the diffuse space reference is
where ccx is the effective cone external emissivity (First Quarterly Report, Appendix VIII). Summing this progression and adding it to the fraction that goes directly from the cone to the patch, cCp (Firs t Quarterly Report, Section 4. 2. 2), we obtain the total fraction of cone radiation absorbed in a black patch
- + ECX 4.Q 1 - 2 4 .
- Ecp FcP
21
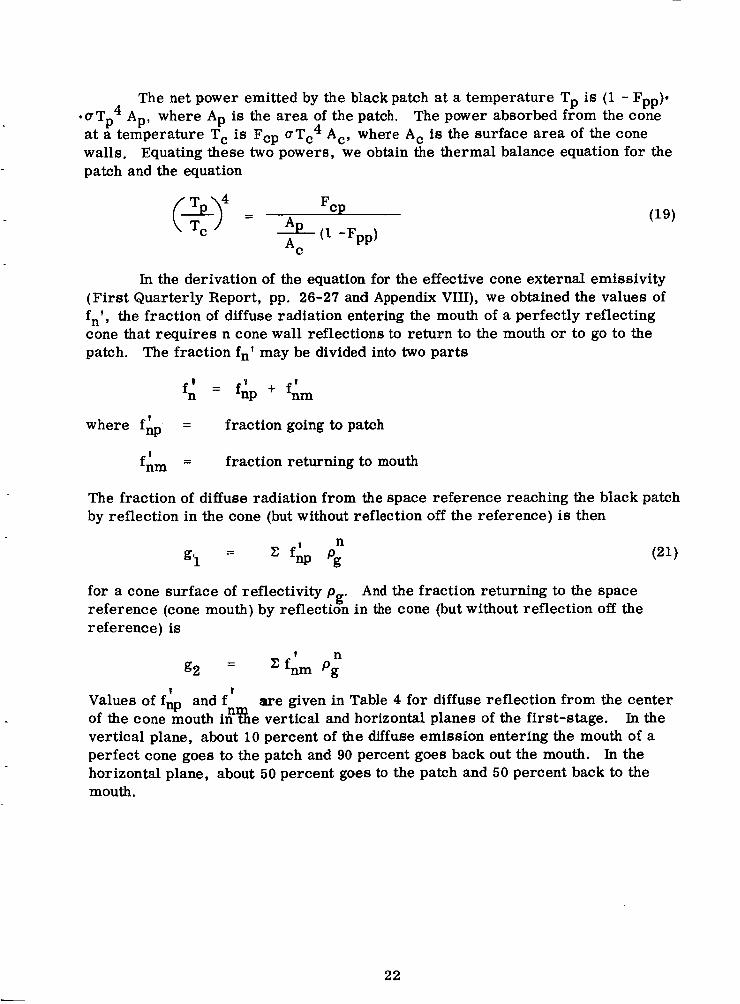
The net power emitted by the black patch at a temperature Tp is (1 - Fpp)* *uTp4 Ap, where Ap is the area of the patch. The power absorbed from the cone at a temperature Tc is Fcp aTc4 A,, where A, is the surface area of the cone walls, Equating these two powers, we obtain the thermal balance equation for the patch and the equation
In the derivation of the equation for the effective cone external emissivity (Firs t Quarterly Report, pp. 26-27 and Appendix VIII), we obtained the values of fn' , the fraction of diffuse radiation entering the mouth of a perfectly reflecting cone that requires n cone wall reflections to return to the mouth or to go to the patch. The fraction fn' may be divided into two parts
where f& = fraction going to patch
t fnm = fraction returning to mouth
The fraction of diffuse radiation from the space reference reaching the black patch by reflection in the cone (but without reflection off the reference) is then
for a cone surface of reflectivity p reference (cone mouth) by reflection in the cone (but without reflection off the reference) is
And the fraction returning to the space g'
I ? Values of fw and f of the cone mouth in%e vertical and horizontal planes of the first-stage. vertical plane, about 10 percent of the diffuse emission entering the mouth of a perfect cone goes to the patch and 90 percent goes back out the mouth. In the horizontal plane, about 50 percent goes to the patch and 50 percent back to the mouth.
are given in Table 4 for diffuse reflection from the center n In the
22
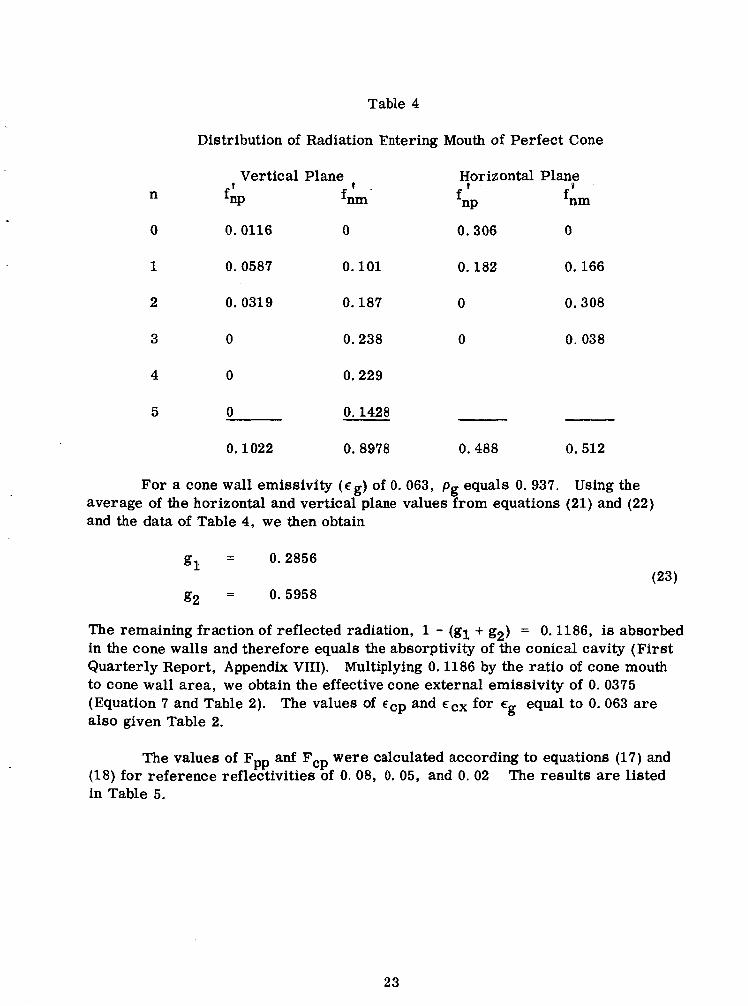
Table 4
n
Distribution of Radiation Entering Mouth of Perfect Cone
Vertical Plane fb fnm
Horizontal Plane 1
fnP 0
fnm
0 0.0116 0 0.306 0
1 0.0587 0.101 0.182 0.166
2 0.0319 0.187 0 0.308
3 0 0.238 0 0. 038
4 0 0.229
5 0 0.1428
0.1022 0.8978 0.488 0.512
For a cone wall emissivity (eg) of 0. 063, pg equals 0. 937. Using the average of the horizontal and vertical plane values from equations (21) and (22) and the data of Table 4, we then obtain
0.2856
82 = 0.5958
- - 81.
The remaining fraction of reflected radiation, 1 - (g l + g2) = 0.1186, is absorbed in the cone walls and therefore equals the absorptivity of the conical cavity (First Quarterly Report, Appendix VIII). Multiplying 0.1186 by the ratio of cone mouth to cone wall area, we obtain the effective cone external emissivity of 0. 0375 (Equation 7 and Table 2). also given Table 2.
The values of cCP and cCX for eg equal to 0.063 are
The values of Fpp anf Fcp were calculated according to equations (17) and The results are listed (18) for reference reflectivities of 0. 08, 0. 05, and 0. 02
in Table 5.
23
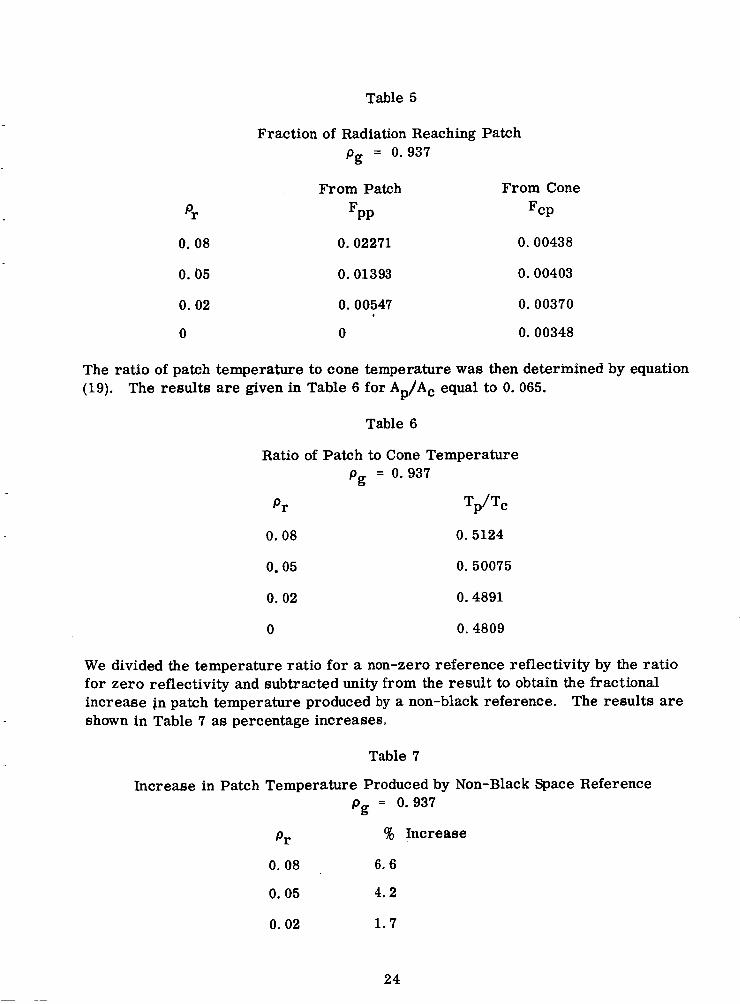
Table 5
Fraction of Radiation Reaching Patch pg = 0.937
From Patch From Cone
Pr FPP FCP
0. 08 0.02271 0.00438
0. 05
0. 02
0
0.01393
0.00547
0
0.00403
0.00370
0.00348
The ratio of patch temperature to cone temperature was then determined by equation (19). The results a re given in Table 6 for Ap/Ac equal to 0. 065.
Table 6
Ratio of Patch to Cone Temperature pg = 0.937
Pr
0.08 0.5124
0.05 0.50075
0. 02 0.4891
0 0.4809
We divided the temperature ratio for a non-zero reference reflectivity by the ratio for zero reflectivity and subtracted unity from the result to obtain the fractional increase in patch temperature produced by a non-black reference. The results a re shown in Table 7 as percentage increases.
Table 7
Increase in Patch Temperature Produced by Non-Black Space Reference pg = 0.937
Pr % Increase
0. 08 6.6
0. 05 4.2
0. 02 1.7
24
4.6 Gas Conduction
The residual gas pressure in the space chamber should be no greater than about 2 x Torr if gas conduction is to contribute no more than 1 percent of the thermal load to a patch (Second Quarterly Report, Section 5. 5.2) When the cooler model with the Alzak cone surfaces was first placed in the chamber, it could not be evacuated because of extensive outgassing. The outgassing was traced to uncured adhesive used to bond the urethane foam core to the aluminum and Alzak skins. adhesive (Dow Corning Silastic 140) cures by reaction with atmospheric moisture. The cooler model was therefore placed in another vacuum chamber of greater pumping speed to remove a large part of the gas evolved from uncured adhesive. The cooler model with the aluminized mylar surface was constructed of laminated panel purchased frolh Met-L-Wood Corp. .(Chicago, Ill..). ' This lamS.n&e uses an epoxy adhesive which does not depend on a i r for curing and which does not outgas. addition, to promote the escape of adhesive gas and the evacuation of a i r from the foam, small holes were drilled through the outside skin of the cone structure and inside skin of the outer box.
The
In
When the Alzak cone model was evacuated in preparation for the first thermal test, the pressure reached only about 4 x Torr. After the helium refrigerator was turned on, the copper cold target and aluminum shroud acted a s cryopumps and reduced the pressure to a final value of 3.2 x 10⁻⁵ Torr. This is still an order of magnitude above the desired level.
The failure to attain a sufficiently low pressure during the first thermal These leaks were fixed test was apparently due to leaks in the space chamber.
before starting the second thermal test. The pressure after evacuation of the same Alzak cone model but prior to starting the helium refrigerator for the second thermal test was 2.1 x The cryopumping of the space simulator reduced this to a final value of 2. 7 x 10⁻⁷ Torr. The final pressure during the third thermal test was 3.7 x 10⁻⁷ Torr. The contribution of gas conduction to the thermal loads on the members of the radiant c o d e r is entirely negligible a t these pressures,
Torr.
25
5 . 0 OPTICAL DESIGN
The relay optics transfers radiant energy from the primary focus at the chopper to the secondary focus at the detector element; its specification is given in Appendix 111. The first element of the re@ optics (used to collimate the radiation from the primary image) will be a doublet lens instead of a paraboloidal mirror and folding flat (First Quarterly Report, Section 4.6; Second Quarterly Report, Section 6.2). The beam from the doublet is focused by an f/8 germanium lens and then increased in speed to f/2 by an aplanatic germanium lens that focuses radiation on the detector element. The deeign of the f/8 lens is outlined below; the design of the aplanatic lens is described in Section 5.1 of the Fourth Quarterly Report. The two elements and their spacing are shown in Figure 6.
A lens bent for minimum spherical aberration has a nearly flat second sur- face when its refractive index is high (R. M. Scott, "Optics for Infrared Systems", Proc. IRE 47, 1530, Sept. 1959). We will therefore consider such a design for the f/8 germanium lens. The Coddington shape factor is then
(24) - - r2 +r1 = 1 (T
r 2 - rl where rl = radius of lens surface nearer object
r2 = radius of lens surface nearer image
The para2ial focal length of the lens for a flat second surface (r2 = 00 3 is independent of the lens thickness and given by
- rl - n- 1
f '
where n is the refractive index. For r1 = 10.0 inches and n = 4 (Ge at 11 microns)
r l = 30.0 inches (26)
The diameter of the primary spherical aberration at best focus for an object at infinity is given by
f ' L A 'SA = 64N3
where N is the f-number of the focused beam and A is given by
(28) A = n + l a 2 - 4 ( n + l ) ~+ 3 n + 2 + n2 n (n-lf n (n - 1) n (n -
For a = 1 a n d n = 4
A = 34/9

m E s s 2
0 .rl u
cd 4
m 0 m c 3
4 8
E
E
5
k
I "
O d d I 1 II I 1
4 N k k u
v) P- O 0
I I
4 4
27

Then for f ' = 10.0 inches andN = 8
6% = 1.15 x inch
The corresponding value for the longitudinal spherical aberration, or paraxial focal length minus marginal focal length, is
A = 18.40 x inch f '
32N2 (LA)' =
Because of the small field of view (2.5 x radian square at the primary image) the only off-axis aberration of any consequence is coma. For the exit pupil at a thin lens, the comatic radius is given by (F. A. Jenkins and H. E. White, "Fundamentals of Optics", McGraw-Hill, 1950, p. 134)
- - ( G p + W a ) rC 4f'N2
where y = off-axis distance of image point
" -' €3' +s
= Coddington position factor4 - - P
s' = image distance
S = object distance
3(2n + 1) 4n
G =
3(n + 1) 4n (n - 1)
w =
5 For an object at infinity ( p = -1) and for germanium (n = 4) -* - r c -
A t the corner of the field of view, y = 0.055 inch; then, for N = 8
- - 0.30 x inch r c -
(33)
(34)
4
5
Sign convention of Jenkins and White
Also equal to -1 for sign convention of Conrady
28

Because the exit pupil is not located at the lens (See Second Quarterly Report, Figure 13), the above value ofcomamust be corrected for a shift in the pupil from the lens to its actual position. For coma measured by its radius (sagittal coma) the change produced by a pupil shift is given by (A. E. Conrady, "Applied Optics and Optical Design", Dover 1957, pp. 336, 341-343)
A r c - - (LA)' W' y 2Nh
6 where L' ;
I ' -Ifp; W' =
(35)
L = image distance = f ' = 10.0 inches
L Ip: = distance from lens to final position of exit pupil
h = radius of effective lens aperture = 0.625 inch
From the Smond Quarterly Report, Figure 13
-9.46 inches (37) =
Then for y = 0.055 inch, N = 8, and the above value of longitudinal spherical aberration
A r c - - +O. 05 x inch (38)
The comatic radius for the actual position of the aperture is then
-0.25 x lov3 inch (39) r * = C
The maximum allowable diameter at the image plane of the f/8 lens is 4 x inch (Third Quarterly Report, Table 8, p. 25). The design of the f/8 lens therefore meets all the requirements. The lens is shown in Figure 6 in relation to the aplanatic lens; the positions of its principal planes a re also given.
6 The formula for W' is for the exit pupil initially at the lens.

6.0 VIDEO ELECTRONICS
l -
Figure 7 is a schematic of the video electronics shown with certain test equipment and test circuitry. Most circuits, it can be seen, utilize a microcircuit monolithic amplifier, the pa 709. This circuit component can be used for a-c or d-c amplification, as a comparator, and as a multivibrator. The signal fed to the video amplifier from the microvolter wi l l eventually come from the preamplifier. The attenuated signal shown going to the reference signal generator simulates the photodiode signal induced by the chopped light through the mechanical chopper.
6.1 Reference Voltage Generator
The reference voltage generator, comprised of Amp 3, Amp 4 and other components, processes 6 khz signal from the chopper photodiode to a 6 khz square wave for demodulation of the video signal. Amp 3 is an a-c amplifier with a voltage gain variation of 5.6 db. Amp 4 is a saturating amplifier which squares up the video signal until now, a sinusoidal signal. The output is a 6 khz square wave approximately 22 volts peak to peak.
6 .2 Video Amplifier
This circuit serves as an amplifier and as a driver for the demodulator. The maximum amplifier gain is about 60 db with a variation of 6 db. The low frequency cutoff is about 700 hz,and the high frequency cutoff,47 khz at maximum gain,& 70 khz at minimum gain.
6.3 Demodulator and Low-Pass Filter
The circuitry consisting of TI, T2, Q1, Qa, CR1, CR2, R5, R6, R7, R8, R9, R11, R12, C5 and C29 is the demodulator. This circuit synchronously rectifies the video amplifier output. The switching voltage from the reference signal g.enerator is fed in at T2. The rectified output is applied at the common source connection of the CM602's Q1 and Q2.
. . The low-pass filter is made up of L1, L2, c6 , C7 and R1O. The filter response with the demodulator is shown in Figure 8. The filter causes a delay which is constant for all frequencies over the pass band. This delay was found to be 184 microseconds.
6.4 Output Amplifier
The output amplifier (Amp 2, etc. ) provides amplification of the demodulated and filtered signal from d-c to beyond the pass band. Xt also serves as a mixing point for the video and chopper correction input.
.
.
1
I I
31
t - --
-=I= ~.
.
-- -+- -- t--
_- i I
I
In (0 t- 00 b, 0 Fl Cr) * I d $ f + d d
I I I I * I I I 1 I I
d cu 0 I I I
32
6 . 5 Correction Voltage Generator
Shown within the dotted lines on Figure 7, the correction voltage generator provides output correction for, the difference in signal between the chopper and space. The gate formed by Q3, etc. passes the video output to the comparator (Amp 6, etc. ) during the time that the mirror is scanning space. This time period is assumed to be one-tenth of the total scanning time. For the purposes of testing, a space scan monostable multivibrator is simulated by the circuit including Q5 and Q6. During the other 90 msec of the scan, Q4 gates the comparator input to ground. (This simulates a scanning rotation of about 600 rpm as compared to the 100 rpm to be expected. However, the ratio of sampling time to scanning time will remain the same for any speed and thus the over-all gain is not affected).
If the output signal (E,) is positive with respect to the reference, the com- parator has a negative going output and the opposite is true for a negative going input. If the comparator input is equal to the reference level, the comparator output is zero. This pulsed output with a one-tenth duty cycle is integrated by R28 and C20 and C21. (Capacitors C20 and C21 together with diodes CR3 and CR4 make a single bipolar 47 microfarad capacitor). The integrated d-c level is amplified by the non-inverting amplifier Amp 5 which provides the correcting input to the output amplifier through R14.
The correction voltage generator has a gain characteristic such that Eo = m- *Ec + vth where Eo is the input voltage level. If the reference level is perfectly adjusted, v~ is zero. In measurements taken in the laboratory m had a value of 1/26.8 and vth was +O. 025 volts.
6 . 6 Chopper Correction Loop Calculations
Referring again to Figure 7, it can be seen that the significant part of the above loop with respect to the chopper e r ror is the output amplifier and the correction voltage generator, The following definitions are made:
Ef = the demodulated and filtered video signal input to the output amplifier
E, = the chopper correction d-c input to the output amplifier
E = the video amplifier output and the input to the correction voltage generator
0
Ech = that portion of the demodulated video signal caused by the chopper
Etar = that portion of the demodulated video signal caused by the target
33
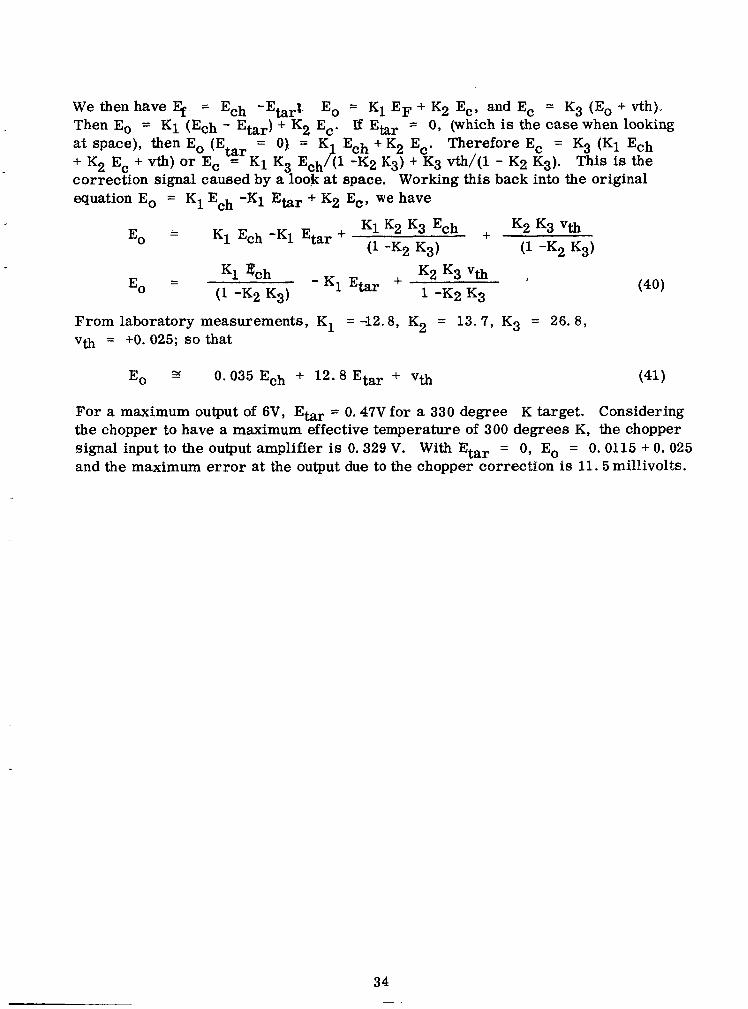
We then have Ef = Ech -Etar;. Then Eo = K1 (E& - Ebr) + K2 E,. If Etar = 0, (which is the case when looking at space), then Eo (Etar = 0) = K Therefore E, = K3 (K1 E& + K E + vth) or E, ’=: K 1 K3 Ech /z (1 -K2 K3) + K3 Vn/(l - K2 K3). This is the correction signal caused by a look at space. Working this back into the original equation E, = K1 Ech -K1 E b r + K2 E,, we have
Eo = K1 EF + K2 E,, and E, = K3 (Eo + vth).
Ech + K2 E,. 2 c.
From laboratory measurements, K1 = -12.8, K2 = 13.7, K3 = 26.8, vth = +O. 025; sothat
For a maximum output of 6V, Etar = 0.47V for a 330 degree K target. Considering the chopper to have a maximum effective temperature of 300 degrees K, the chopper signal input to the output amplifier is 0.329 V. With Etar = 0, E, = 0.0115 + 0.025 and the maximum e r ro r at the output due to the chopper correction is 11.5millivolts.
34
I 7.0 NEW TECHNOLOGY ~
No items which are considered new technology according to the NASA New Technology clause of September 1964 were developed during the fifth quarter of the contract. I.
8.0 PROGRAM FOR NEXT QUARTER 1 -
During the six@ quarter, w e plan to conduct thermal-vacuum tests on I - a complete two-stage radiant cooler and to complete the design of the breadboard
radiometer. The test equipment for the radiometer will be installed and tested. Depending on the available time and the inspection and acceptance of Phase I1 by the Technical Officer, construction of the breadboard radiometer will be started.

9 .0 CONCLUSIONS
From vibration and thermal tests conducted during the fifth quarter and an analysis of the thermal test results, we may conclude the following:
a. The two-stage patch assembly (first-stage patch, second- stage cone, and second-stage patch) is vibrationally sound when the first-stage patch is held by a simple 4 pin caging mechanism.
b. Evaporation of a basically low emissivity material such as aluminum or gold on Alzak treated aluminum does not produce a low emissivity surface.
c. Evaporation of aluminum on mylar produces a specular, low emissivity surface suitable for the cone walls in a radiant e ooler .
d. Single-stage radiant cooling to 98 degrees K or less can be achieved in a Nimbus orbit at an orbit normal to sun angle in the range 79 to 90 degrees.
e. A space reference at a temperature of about 30 degrees K can be obtained by conductively cooling a large mass of high conductivity copper with a Norelco A-20 helium refrigerator.
f . The Conditions for thermal simulation of orbital conditions (proper cone tlemperature and low residual gas pressure) can be realized.
In general, we are well on our way toward demonstrating the feasibility of two-stage radiant cooling (second-stage temperature below 80 degrees K) under realistic mechanical and thermal conditions.
36
APPENDIX I
THERMALLOADONCOPPERCOLDREFERENCE
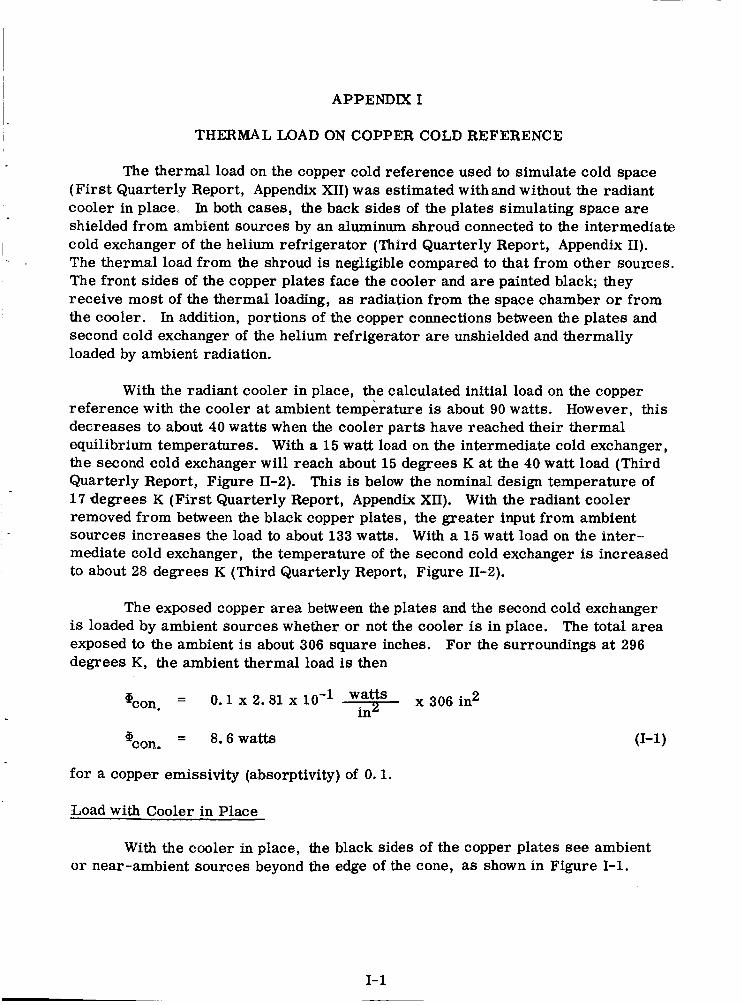
The thermal load on the copper cold reference used to simulate cold space (First Quarterly Report, Appendix XII) was estimated withand without the radiant cooler in placeo In both cases, the back sides of the plates simulating space are shielded from ambient sources by an aluminum shroud connected to the intermediate cold exchanger of the helium refrigerator (Third Quarterly Report, Appendix 11). The thermal load from the shroud is negligible compared to that from other soufles. The front sides of the copper plates face the cooler and a re painted black; they receive most of the thermal loading, as radiation from the space chamber o r from the cooler. In addition, portions of the copper connections between the plates and second cold exchanger of the helium refrigerator are unshielded and thermally loaded by ambient radiation.
I
I
With the radiant cooler in place, the calculated initial load on the copper reference with the cooler at ambient temperature is about 90 watts. However, this decreases to about 40 watts when the cooler parts have reached their thermal equilibrium temperatures. With a 15 watt load on the intermediate cold exchanger, the second cold exchanger will reach about 15 degrees K at the 40 watt load (Third Quarterly Report, Figure 11-2). This is below the nominal design temperature of 17 degrees K (First Quarterly Report, Appendix XII). With the radiant cooler removed from between the black copper plates, the greater input from ambient sources increases the load to about 133 watts. With a 15 watt load on the inter- mediate cold exchanger, the temperature of the second cold exchanger is increased to about 28 degrees K (Third Quarterly Report, Figure 11-2).
The exposed copper area between the plates and the second cold exchanger is loaded by ambient sources whether or not the cooler is in place. The total area exposed to the ambient is about 306 square inches. For the surroundings at 296 degrees K, the ambient thermal load is then
@con. = 8.6 watts
for a copper emissivity (absorptivity) of 0.1.
Load with Cooler in Place
With the cooler in place, the black sides of the copper plates see ambient o r near-ambient sources beyond the edge of the cone, a s shown in Figure 1-1.
1-1

0. 5" Dimension Exaggerated to Show Separation
i 22.33" l- A i uter Edge of Cone End
1
0. v 5 " p H FH = 1 -sin2 $H = 0.0020
2 FV = 1 - s i n #V = 0.0120
Figure 1-1 Plate to Ambient Geometry with Cooler in Place
1-2

The cone mouth and cone end are 0.5 inch from the plate. The view factor from the center of the copper plate to the ambient in the horizontal plane is given by
o*25 = 0.0020 2 FH = 1 - sin $H =
124.9
And the view factor in the vertical plane is
o:25 = 0.0120 2 1 - sin $ V = - 20.86 FV -
The average view factor from the center of a plate to ambient is then 0. 007 with the cooler in place, and the ambient thermal load on the plates is about
@a - - 2.81 x 10⁻¹ watts x 512 in2 x 7 x in2
The two plates are black a d have an area of 512 square inches.
To determine the thermal load on the plates with the cooler in place, we need to know the load from the outer box, the first-stage cone (ends and walls), and the patches. The last two loads change as the cooler approaches thermal equilibrium. A t first, the entire cooler is at ambient and introduces a larger thermal input to the copper plates.
The outer box is constructed of 3/4-inch laminate, its open ends face the black copper plates and have inner dimensions, in inches, of 9.8 x 22. 8. end plates have corresponding dimensions of 24 x 11. Since the foam core is essentially black in the infrared, the loading from both ends of the outer box at ambient (296 degrees K) is
The copper
% = 22.8 watts (1-3)
From equation (9) of the Second Quarterly Report, the outgoing power radiated by the cone walls and cone ends is
The term
ECP (1 + 1/2 - Ac2 )
APl represents radiation to the patch and second-stage cone and is not included.
1-3
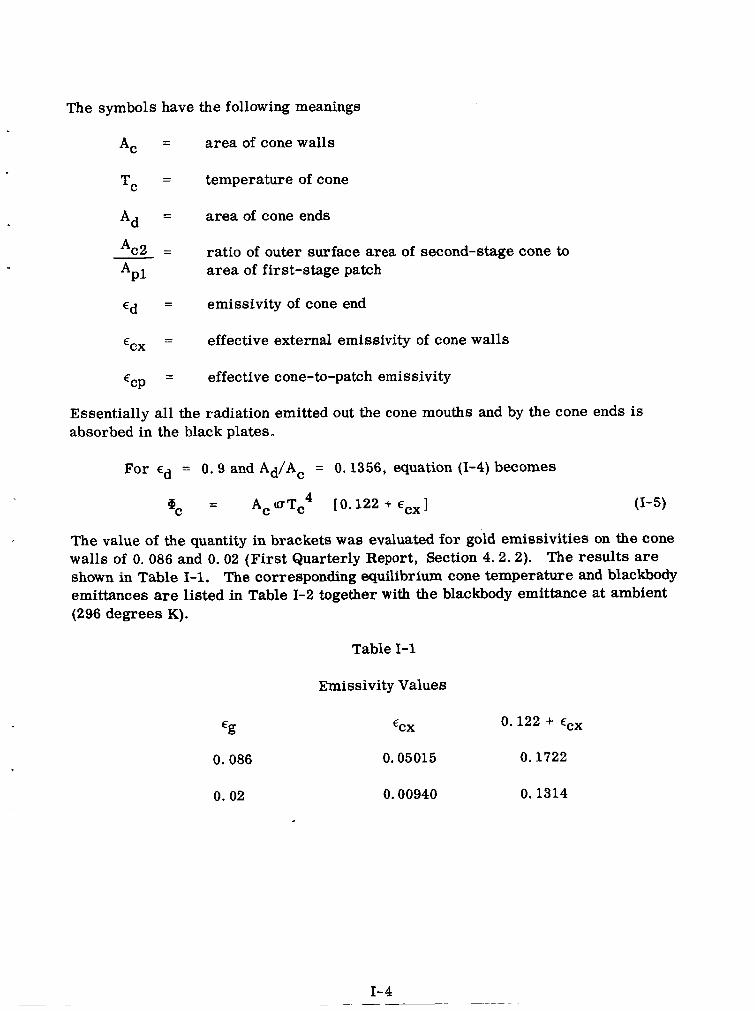
The symbols have the following meanings
A, = area of cone walls
Tc = temperature of cone
Ad = area of cone ends
AC2 =
APl area of first-stage patch ratio of outer surface area of second-stage cone to
Ed = emissivity of cone end
%X = effective external emissivity of cone walls
cCP = effective cone-to-patch emissivity
Essentially all the radiation emitted out the cone mouths and by the cone ends is absorbed in the black plates.
For Ed = 0.9 and Ad/Ac = 0.1356, equation (1-4) becomes
% - - A, a T C 4 [ 0.122 + eCX ] (1-5)
The value of the quantity in brackets was evaluated for gold emissivities on the cone walls of 0. 086 and 0. 02 (First Quarterly Report, Section 4.2.2). The results are shown in Table 1-1. The corresponding equilibrium cone temperature and blackbody emittances are listed in Table 1-2 together with the blackbody emittance at ambient (296 degrees K).
Table 1-1
Emissivity Values
% 0.086
0.02
%X
0.05015
0.00940
0.122 + ECX
0.1722
0.1314
I- 4
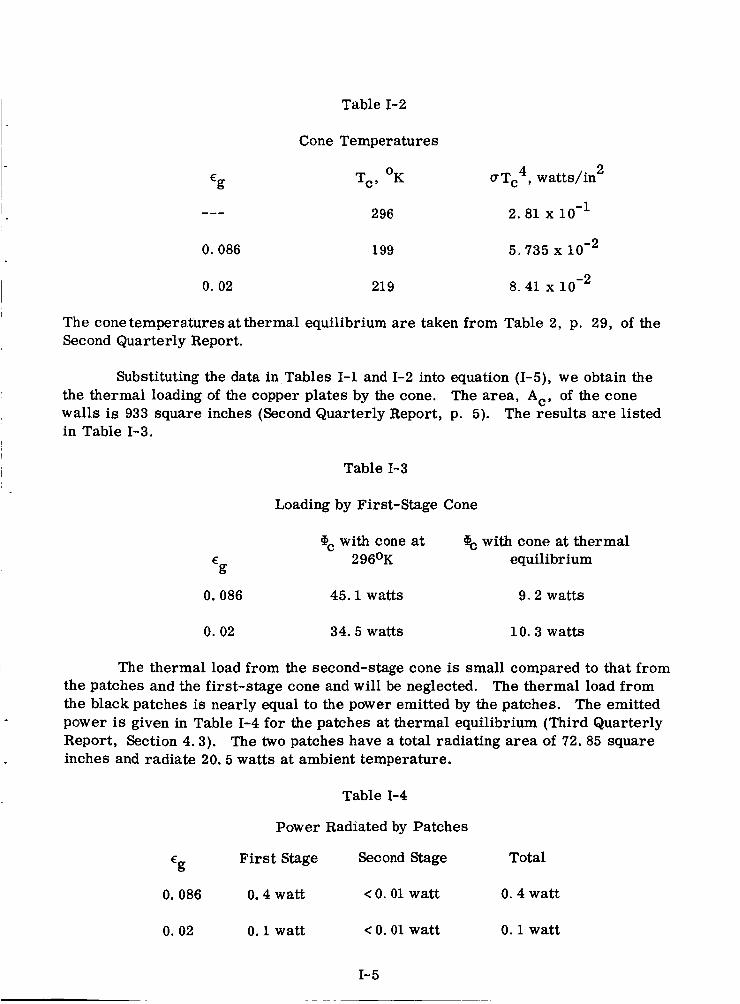
Table 1-2
Cone Temperatures
2 CT Tc4, watts/in
I 296 2.81 x 10⁻¹
0.086
0. 02
199
219
5.735 x
8.41 x
The conetemperaturesatthermal equilibrium are taken from Table 2, p. 29, of the Second Quarterly Report.
Substituting the data in Tables 1-1 and 1-2 into equation (1-5), we obtain the the thermal loading of the copper plates by the cone. The area, A,, of the cone wal ls is 933 square inches (Second Quarterly Report, p. 5). The results are listed in Table 1-3.
Table 1-3
Loading by First-Stage Cone
gc with cone at with cone at thermal 296OK equilibrium
g E
0.086 45.1 watts 9. 2 watts
0. 02 34. 5 watts 10. 3 watts
The thermal load from the second-stage cone is small compared to that from the patches and the first-stage cone and wi l l be neglected. The thermal load from the black patches is nearly equal to the power emitted by the patches. The emitted power is given in Table 1-4 for the patches at thermal equilibrium (Third Quarterly Report, Section 4.3). The two patches have a total radiating area of 72.85 square inches and radiate 20. 5 watts at ambient temperature.
Table 1-4
Power Radiated by Patches
Firs t Stage Second Stage Total g E
0.086 0.4 watt < 0. 01 watt 0. 4 watt
0. 02 0.1 watt < 0. 01 watt 0.1 watt
I- 5
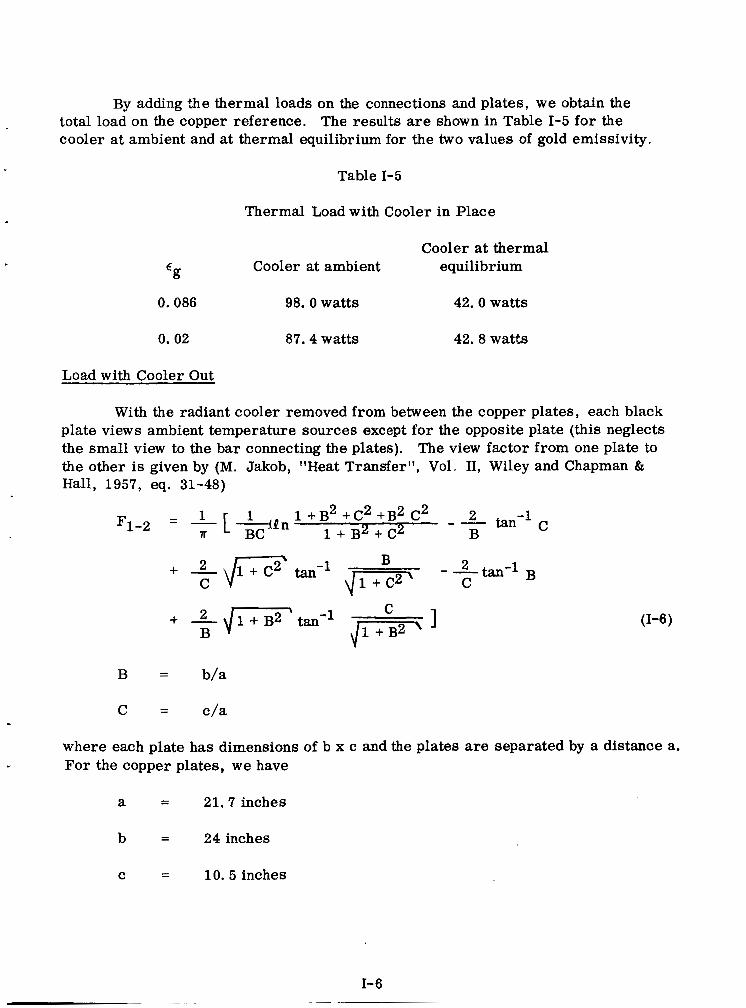
By adding the thermal loads on the connections and plates, w e obtain the total load on the copper reference. The results are shown in Table 1-5 for the cooler at ambient and at thermal equilibrium for the two values of gold emissivity.
Table 1-5
Thermal Load with Cooler in Place
Cooler at thermal % Cooler at ambient equilibrium
0.086 98. 0 watts 42. 0 watts
87. 4 watts 42. 8 watts 0. 02
Load with Cooler Out
With the radiant cooler removed from between the copper plates, each black plate views ambient temperature sources except for the opposite plate (this neglects the small view to the bar connecting the plates). The view factor from one plate to the other is given by (M. Jakob, "Heat Transfer", Vol. 11, Wiley and Chapman & Hall, 1957, eq. 31-48)
B = b/a
C = c/a
where each plate has dimensions of b x c and the plates are separated by a distance a. For the copper plates, we have
21.7 inches - a -
24 inches - b -
10.5 inches - - C
I- 6

Equation (1-5) then yields
The view factor from a plate to ambient is
and the thermal load on both plates becomes
- - 512 in2 x 2. 81 x 10-1 watts/in2 x 0.868 'a
(1-7) = 124. 9 watts
for an ambient temperature of 296 degrees K.
Adding the 8 . 6 watt load on the copper connections, we obtain the total thermal load, 9, on the copper reference when the radiant cooler is removed.
% = 133. 5 watts (1-81
I- 7
APPENDIX I1
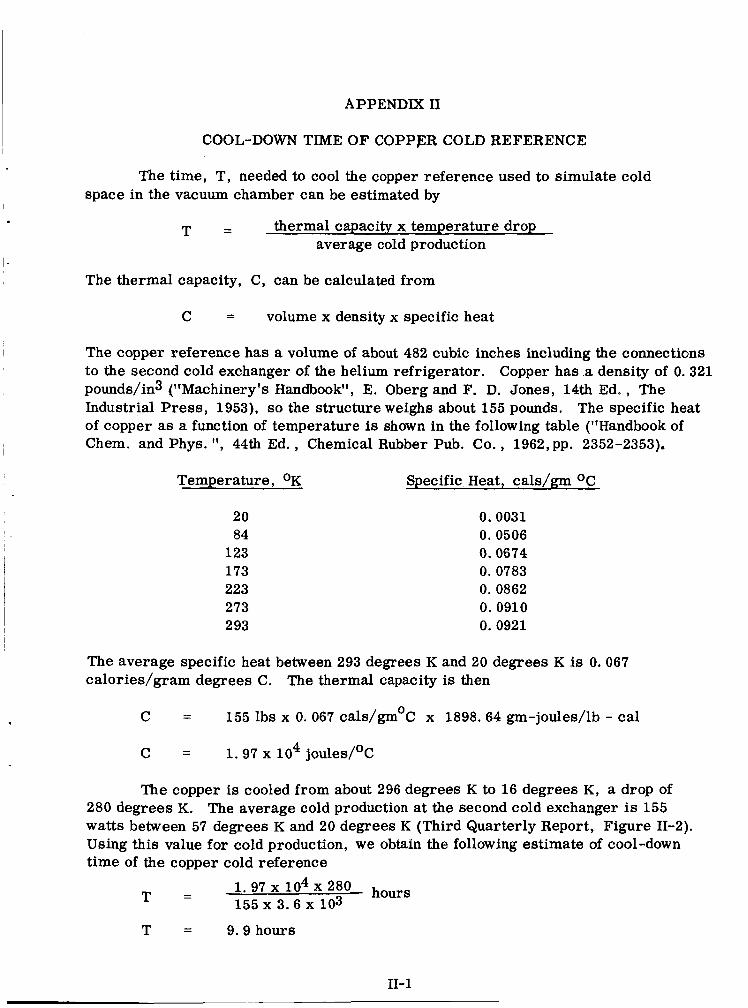
COOL-DOWN TIME OF COPPER COLD REFERENCE
The time, T, needed to cool the copper reference used to simulate cold space in the vacuum chamber can be estimated by
T = thermal capacity x temperature drop average cold production
The thermal capacity, C, can be calculated from
C = volume x density x specific heat
The copper reference has a volume of about 482 cubic inches including the connections to the second cold exchanger of the helium refrigerator. Copper has a density of 0.321 pounds/in3 ("Machinery's Handbook", E. Oberg and F. D. Jones, 14th Ed. , The Industrial Press, 1953), so the structure weighs about 155 pounds. of copper as a function of temperature is shown in the following table ("Handbook of Chem. and Phys. ' I , 44th Ed. , Chemical Rubber Pub. Co. , 1962,pp. 2352-2353).
The specific heat
Temperature, OK
20 84
123 173 223 273 2 93
Specific Heat, cals/gm OC
0.0031 0. 0506 0.0674 0. 0783 0. 0862 0.0910 0.0921
The average specific heat between 293 degrees K and 20 degrees K is 0.067 calories/gram degrees C. The thermal capacity is then
C = 155 lbs x 0. 067 cals/gm°C x 1898.64 gm-joules/lb - cal
c = 1.97 x lo4 joules/oC
The copper is cooled from about 296 degrees K to 16 degrees K, a drop of 280 degrees K. The average cold production at the second cold exchanger is 155 watts between 57 degrees K and 20 degrees K (Third Quarterly Report, Figure 11-2). Using this value for cold production, we obtain the following estimate of cool-down time of the copper cold reference
1. 97 x lo4 x 280 hours 155 x 3 . 6 x lo3 T =
T = 9 . 9 hours
II- 1
I APPENDIX I11 I -
SPECIFICATION FOR INFRARED RELAY OPTICS
1. 0 General Description
This specification covers the final design and fabrication of a relay optical system for an infrared instrument designed to operate in the wavelength band from 10.5 to 12.5 microns. The relay system collects radiation which has been brought to focus by an f / l Cassegrain-type telescope (the optical beam is modulated at this primary image location; the telescope is not a part of this procurement). The size of the primary image is 0.25 mm by 0.25 mm. The optical beam is first collimated by a germanium collimator lens (lenses), slightly focused by an f/8 lens and further focused by an aplanatic lens near the infrared detector. cally in Figure 111-1. The beam is collimated so that the separation between the collimator lens and the focusing lenses can be changed a moderate amount without affecting the over-all magnification of the relay system. the f/8 focusing lens and the aplanatic lens, their clear apertures, and their diameters have been calculated. Tolerances for the different radii and the quality of the refract- ing surfaces have not been established. These can be determined from the over-all performance requirements. The detailed design of the collimator lens (lenses) has not been determined, but calculations for a single germanium lens designed for minimum spherical aberration show that such a lens has too much residual aberration; it is felt that a doublet will give suitable performance.
This is illustrated schemati-
The radii of curvature of
A l l of the lenses shall have their refracting surfaces antireflection-coated for high transmission in the 10.5 to 12.5 micron band. lens shall be 90 percent or more in this spectral band. The bandpass of 10.5 to 12.5 microns is established by an interference-type filter located just in front of the aplanatic lens (the optical filter is not a part of this procurement).
The average transmission of each
The over-all magnification of the relay system is 2X, i. e. , the infrared detector h a s a sensitive area of 0.50 mm by 0.50 mm.
The performance requirements for the collimator lens assembly are given below. The configurations of the f/8 focusing lens and the aplanatic lens are also given. The aberrations of these latter two lenses have been calculated (assuming the radii of curvatures given) and show that satisfactory performance would be achieved if the given radii a r e sufficiently closely obtained in manufacture. resolution requirements of the focusing lenses are given below as an aid in determining manufacturing tolerances.
The
111-1

a a
A
E E
d B E E
rl) e4
In hl
9 4 E E E
t 4
.r(
(d
.r(
w 111-2
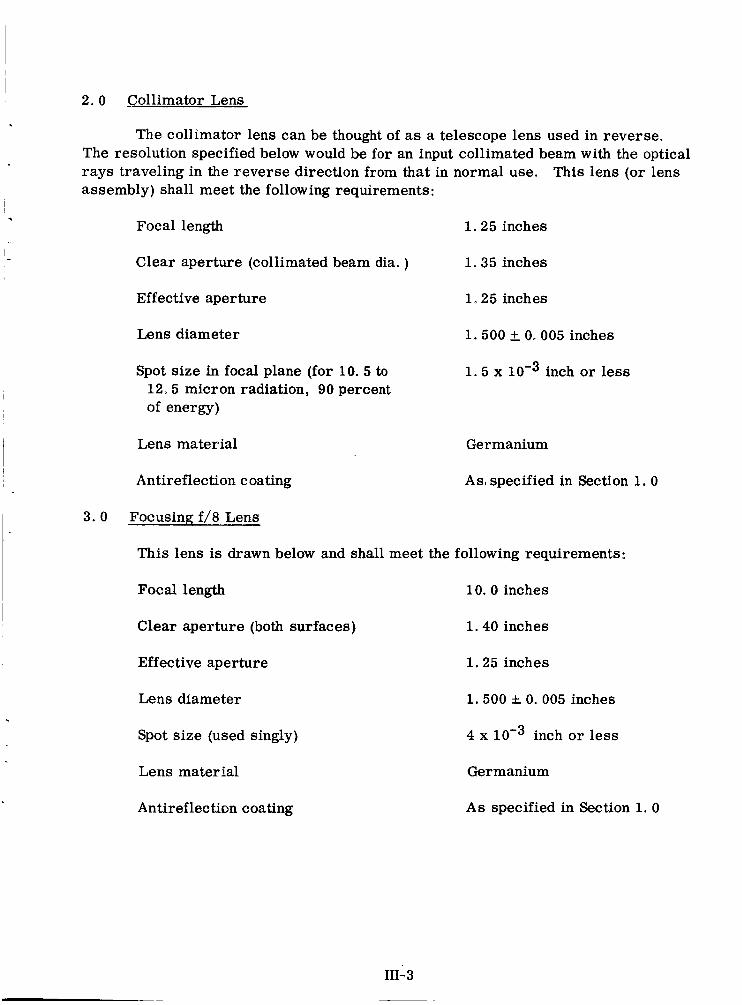
2. 0 Collimator Lens
The collimator lens can be thought of as a telescope lens used in reverse. I I The resolution specified below would be for an input collimated beam with the optical
rays traveling in the reverse direction from that in normal use. assembly) shall meet the following requirements:
This lens (or lens
* Focal length 1.25 inches
Clear aperture (collimated beam dia. ) 1.35 inches
Effective aperture 1.25 inches
Lens diameter 1.500 +. 0.005 inches
Spot size in focal plane (for 10. 5 to 12.5 micron radiation, 90 percent of energy)
1.5 x inch or less
Lens material Germanium
Antireflection coating A s , specified in Section 1. 0
3.0 Focusing f/8 Lens
This lens is drawn below and shall meet the following requirements:
Focal length 10.0 inches
Clear aperture (both surfaces)
Effective aperture
1.40 inches
1.25 inches
Lens diameter 1.500 L 0.005 inches
Spot size (used singly) 4 x inch or less
Lens material Germanium
Antireflection coating A s specified in Section 1. 0
111-3
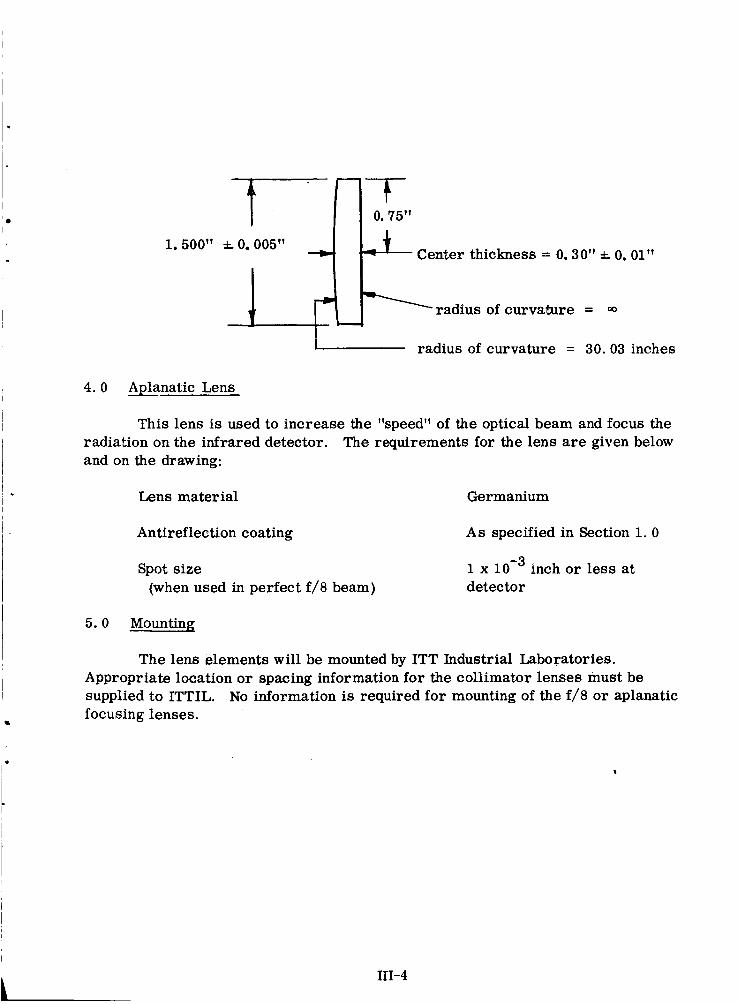
1. 500"
4, 0 Aplanatic Lens
3L 0.
m
01"
radius of curvature = 30.03 inches
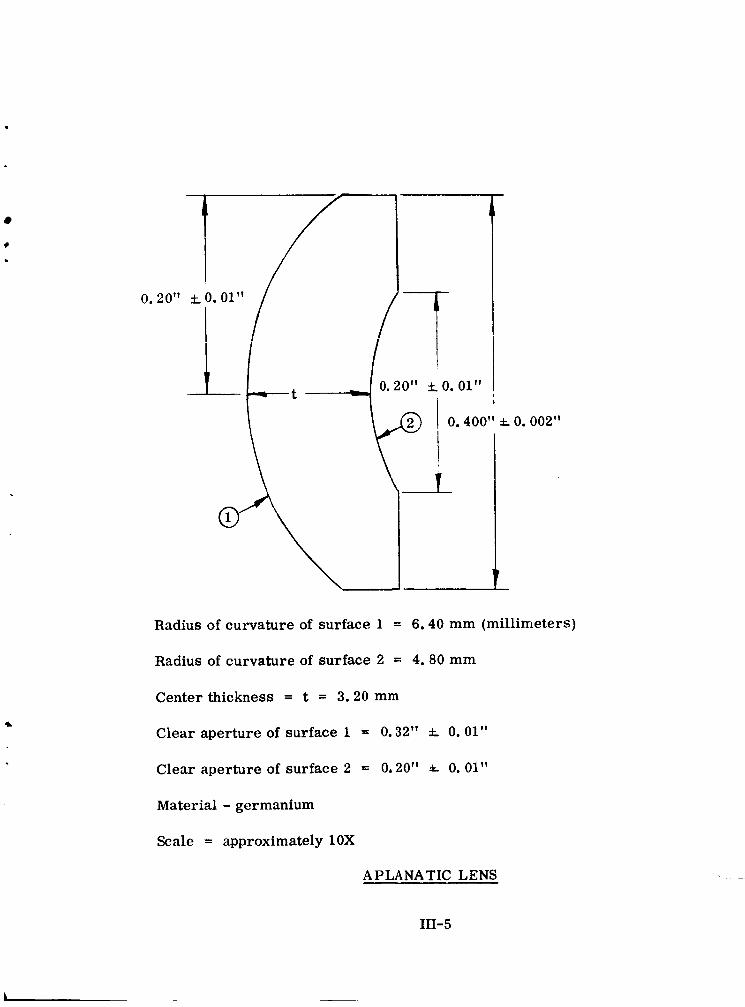
This lens is used to increase the "speed" of the optical beam and focus the The requirements for the lens are given below radiation on the infrared detector.
and on the drawing:
Lens material Germanium
Antireflection coating A s specified in Section 1. 0
Spot size (when used in perfect f/8 beam)
1 x detector
inch or less at
5.0 Mounting
The lens elements will be mounted by ITT Industrial Laboratories. Appropriate location or spacing information for the collimator lenses must be supplied to ITTIL. No information is required for mounting of the f/8 or aplanatic focusing lenses.
L
111-4
.
Radius of curvature of surface 1 = 6.40 mm (millimeters)
Radius of curvature of surface 2 = 4.80 mm
Center thickness = t = 3.20 mm
Clear aperture of surface 1 = 0.32" L 0.01"
Clear aperture of surface 2 = 0.20'' A 0.01''
Material - germanium
Scale = approximately 1OX
APLANATIC LENS
111-5