CERTIFICATION - mujeresporafrica.es · Web viewLovelock and Wright (1999) cited on (Deborah Mamo...
109
IMPACT OF SERVICE QUALITY ON CUSTOMER SATISFACTION IN TANZANIA BANKING INDUSTRY: A CASE STUDY OF BARCLAYS BANK DODOMA BRANCH 1
Transcript of CERTIFICATION - mujeresporafrica.es · Web viewLovelock and Wright (1999) cited on (Deborah Mamo...

IMPACT OF SERVICE QUALITY ON
CUSTOMER SATISFACTION IN TANZANIA BANKING
INDUSTRY:
A CASE STUDY OF BARCLAYS BANK DODOMA BRANCH
1

IMPACT OF SERVICE QUALITY ON CUSTOMER
SATISFACTION IN
TANZANIA BANKING INDUSTRY:
A CASE STUDY OF BARCLAYS BANK DODOMA BRANCH
By
Gloria Jackson Shansi
A Research Report Submitted to the Faculty of Science and Technology in
Part Fulfillment of the Requirements for the Award of Bachelor
Of Science in Production and Operation Management from
Mzumbe University
2018
2

CERTIFICATION
The undersigned certify that I have read and hereby recommend for acceptance by the
Mzumbe University, a research report entitled: The impact of service quality on
customer satisfaction in Tanzania Banking Industry. A case study of Barclays Bank
Dodoma Branch, in partial fulfillment of the requirement for Bachelor degree of
Science in Production and Operations Management of Mzumbe University.
Major Supervisor Name’s: Dr Joseph Sungau
Signature……………………………………..
Date………………………………
Internal examiner
Signature………………………………………
Date……………………………….
Accepted for Board of Department of Engineering management studies
Signature………………………………………………………..
Dean Faculty of science & Technology
i

DECLARATION
I, GLORIA JACKSON SHANSI, hereby declare that this research is the result of my
own work, except for quotations which have been submitted for any other degree award
or will not be submitted to any other institution for similar or any other degree award.
Student Signature: ………………………………………………………..
Date: ……………………………………………………………….
ii

COPYRIGHT
All right reserved, part of this report shall be reproduced or distributed in any form,
stored in data base, retrieved system or transmitted I any form or by means of
mechanical, electronically, photocopying, recording or otherwise without the written
permission of the copyright owner or Mzumbe University management `on my behalf.
iii

ACKNOWLEDGEMENT
Firstly, I would like to thank Almighty God for the love, grace, protection and direction
towards facing a number of challenges in accomplishing my work. Glory to God.
Secondly I send Special thanks to my supervisor DrSungau; for the time and efforts in
directing me on what to do and correcting me for the mistakes. Also thanks to all my
lecturers and administrators at Mzumbe University and especially in faculty of science
and technology.
I appreciate the care, love and courage from Shansi’s family for all their support on me.
Lastly to all members of Barclays Bank Dodoma Branch for their support and
cooperation towards my work.
iv

DEDICATION
I dedicate my work to my beloved Shansi’s family, for their moral support and
encouragement since my childhood to date and for laying down the foundation for my
education, whose encouragement and endurance was highly invaluable. My father
Jackson Shansi, my mother Avelda Shansi, my brothers and sister Armani Shansi,
Elizabeth Shansi and Justine Shansi.
v

LIST OF ABBREVIATIONS
ATM - Automatic Teller Machine
CRDB - Cooperative Rural Development Bank
NBC - National Bank of Commerce
NMB - National Microfinance Bank
SPSS - Science Package Statistical Software
vi

ABSTRACT
The aim of this dissertation is to gather more knowledge about the impact of service
quality on customer satisfaction in Barclays Bank in Dodoma. Nowadays the market of
the services providing firms is highly competitive and the expectation of the customer is
increasing. The firms are required to focus more on the services they provide to satisfy
the customer in order to achieve the goal of an organization. The main purpose of this
dissertation is to investigate on effect of services quality on customer satisfaction.
The study is qualitative research in nature. Structure and unstructured questionnaire
are used in order to collect the data. The theoretical framework used in this
paper is SERVIQUAL model developed by Parasuraman (1998). The findings of
the study indicate that the customer of the Barclays Bank was satisfied with the
services provided. But respondents ask for Barclays Bank to expand to more places in
central parts of Tanzania because of the high satisfaction of their service. It shows that
the better services providing company can get advantage of market share from
Industry are belonging. The service quality model can help the banking sector of
Tanzania to build a strong market and the service provider can get advantage from
providing better services.
vii

TABLE OF CONTENTS
CERTIFICATION...............................................................................................................i
DECLARATION...............................................................................................................ii
COPYRIGHT....................................................................................................................iii
ACKNOWLEDGEMENT................................................................................................iv
DEDICATION...................................................................................................................v
LIST OF ABBREVIATIONS...........................................................................................vi
ABSTRACT.....................................................................................................................vii
LIST OF TABLES...........................................................................................................xii
LIST OF FIGURES........................................................................................................xiii
CHAPTER ONE...............................................................................................................1
1.0 Introduction..................................................................................................................1
1.1 Background of the problem..........................................................................................1
1.2 Statement of the problem.............................................................................................2
1.3 Objectives.....................................................................................................................3
1.3.1 General Objective......................................................................................................3
1.3.2 Specific Objective.....................................................................................................3
1.4 Research question.........................................................................................................4
1.5 Research Hypothesis....................................................................................................4
1.6 Significance of the study..............................................................................................4
1.7 Scope of the study........................................................................................................5
1.8Limitation and delimitation of the study.......................................................................5
1.9Organization of the study..............................................................................................5
CHAPTER TWO..............................................................................................................6
2.0 Literature review..........................................................................................................6
2.1 Theoretical review........................................................................................................6
2.1.1 Service.......................................................................................................................6
viii

2.1.2 Characteristic of service............................................................................................7
2.1.3 Quality.......................................................................................................................8
2.1.4 Service Quality........................................................................................................10
2.1.5 Measuring Service Quality......................................................................................12
2.1.5.1 Using SERVQUAL to Measure Service Quality.................................................12
2.1.5.2 Using SERVPERF to Measure Service Quality...................................................14
2.1.5.3. The Gap Model....................................................................................................15
2.1.6 Customer Satisfaction..............................................................................................18
2.1.7 Customer Satisfaction versus Service Quality........................................................19
2.2 Conceptual Framework..............................................................................................21
CHAPTER THREE.......................................................................................................22
3.0 Research methodology..............................................................................................22
3.1 Research design..........................................................................................................22
3.2 Study Area..................................................................................................................22
3.3 Population of the study...............................................................................................23
3.3.1 Target population....................................................................................................23
3.4 Sample size.................................................................................................................23
3.5 Sampling procedure....................................................................................................24
3.6 Data collection tool....................................................................................................25
3.6.1 Secondary Data........................................................................................................25
3.6.2 Primary Data............................................................................................................25
3.6.3 Questionnaires.........................................................................................................25
3.7 Research Ethics..........................................................................................................27
3.8 Data analysis and Processing.....................................................................................27
3.8.1 Data analysis............................................................................................................27
3.8.2 Data processing.......................................................................................................27
3.8.3 Data Reliability........................................................................................................27
ix
CHAPTER FOUR..........................................................................................................29
4.0 Introduction................................................................................................................29
4.1 Overall Respond Rate.................................................................................................29
4.2 Respondents Profile....................................................................................................29
4.3 Descriptive Analysis of Service Quality Measurement.............................................31
4.3.1 Tangibility...............................................................................................................32
4.3.2 Reliability................................................................................................................33
4.3.3 Responsiveness........................................................................................................34
4.3.4 Empathy..................................................................................................................35
4.3.5 Assurance................................................................................................................36
4.3.6 Summary of Results on Perceived Variables..........................................................37
4.4 Customer Satisfaction.................................................................................................38
4.5 Correlation Analysis between Service Quality Dimensions and Customer
Satisfaction.......................................................................................................................39
4.6 The impact of service quality on customer satisfaction.............................................42
4.6.1 Tangibility...............................................................................................................42
4.6.2 Reliability................................................................................................................43
4.6.3 Responsiveness........................................................................................................44
4.6.4 Empathy...................................................................................................................45
4.6.5 Assurance................................................................................................................46
4.7 Overall Regression analysis.......................................................................................47
4.8 Identifying the dominant dimension of service quality that drives customers’
perceived service quality in Barclays Bank Dodoma.......................................................48
CHAPTER FIVE............................................................................................................49
SUMMARY OF FINDINGS, CONCLUSION AND RECOMMENDATION.........49
5.0 Summary of Findings.................................................................................................49
5.1 Conclusion..................................................................................................................50
5.2 Recommendation.......................................................................................................50
5.3 Suggestion for Future Study.......................................................................................52
x

REFERENCES...............................................................................................................53
QUESTIONNAIRE........................................................................................................57
xi

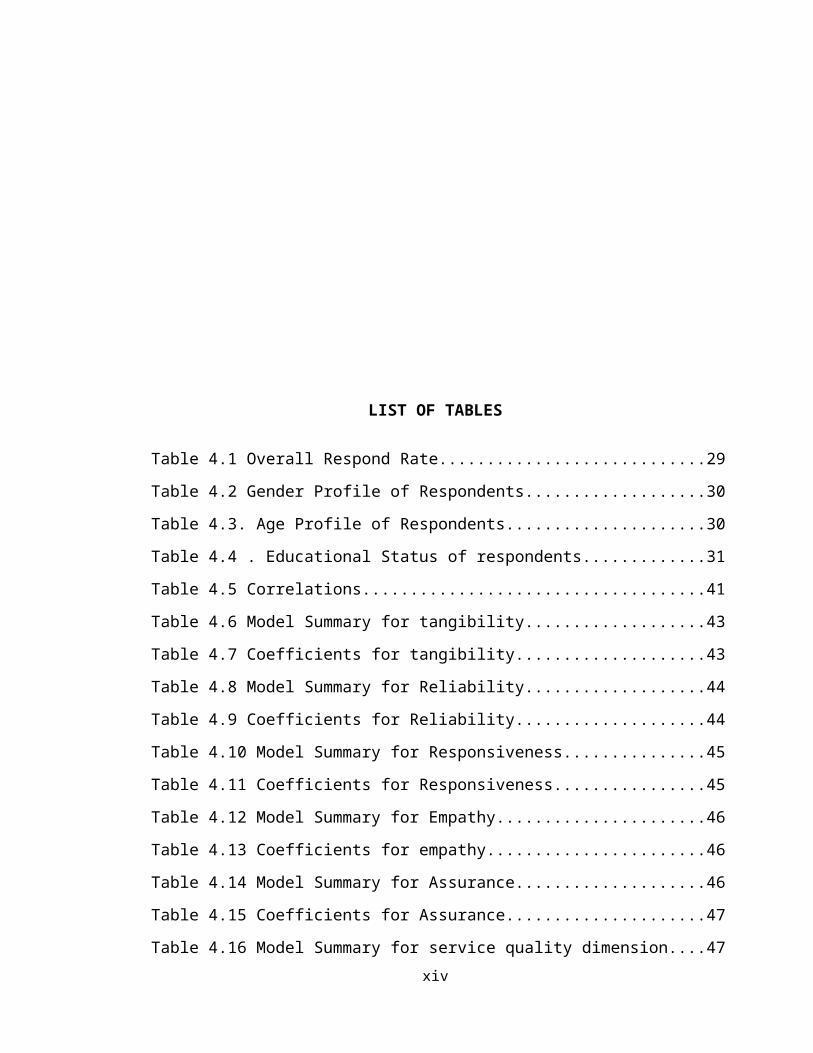
LIST OF TABLES
Table 4.1 Overall Respond Rate........................................................................................29
Table 4.2 Gender Profile of Respondents..........................................................................30
Table 4.3. Age Profile of Respondents..............................................................................30
Table 4.4 . Educational Status of respondents...................................................................31
Table 4.5 Correlations........................................................................................................41
Table 4.6 Model Summary for tangibility.........................................................................43
Table 4.7 Coefficients for tangibility.................................................................................43
Table 4.8 Model Summary for Reliability.........................................................................44
Table 4.9 Coefficients for Reliability................................................................................44
Table 4.10 Model Summary for Responsiveness..............................................................45
Table 4.11 Coefficients for Responsiveness......................................................................45
Table 4.12 Model Summary for Empathy.........................................................................46
Table 4.13 Coefficients for empathy.................................................................................46
Table 4.14 Model Summary for Assurance.......................................................................46
Table 4.15 Coefficients for Assurance...............................................................................47
Table 4.16 Model Summary for service quality dimension...............................................47
Table 4.17 ANOVAfor service quality dimension and customer satisfaction...................48
LIST OF FIGURES
xii

Figure 2.1 The Gap Model of Service Quality.................................................................16
Figure 2.2 Conceptual frameworks on the impact of the service quality on customer
satisfaction........................................................................................................................21
Figure 4.1 Tangibility.......................................................................................................32
Figure 4.2 Reliability........................................................................................................33
Figure 4.3 Responsiveness...............................................................................................35
Figure 4.4 Empathy..........................................................................................................36
Figure 4.5 Assurance........................................................................................................37
Figure 4.6 Summary of Perception on Variables.............................................................38
Figure 4.7 customer satisfaction.......................................................................................39
xiii
CHAPTER ONE
1.0 Introduction
This chapter explains the background of the problem, statement of the problem,
Objective of the study, Research questions, the significance of the study, limitations and
scope of the study.
1.1 Background of the problem
The Tanzanian banking industry has undergone many changes in terms of service
delivery with the aim of improving the quality of customer service. The past few
years there has also been a phenomenal growth in the Tanzania banking sector which
has led to intense competition among the industry players. The Tanzania Banking Report
(2009) has shown that the traditional banks are losing out as competition in the industry
deepens, triggered by aggressive new entrants (New generation banks).
The report, based on the financial results of banks last year revealed a squeeze in profit
across board with the big banks being the major losers, although it said
performance in the industry on the whole was creditable.
The phenomenal growth in the sector has called for a new approach to quality service to
build strong customer relationship where the banks extend their strategic focus to largely
concentrate on the customer as the driver of business. Effective service quality
management therefore has become a key driver to sustenance and growth of every player
in the industry.
As every business is established having the aim of achieving success and being
profitable. The service industry as any other business sector shares this aim. The service
industry is among the oldest and most diverse industries in the word. Services vary in
many ways and include various stages. Lovelock and Wirtz (2004) define service as “an
act or performance made by one party to another although the process may be tied to
physical product, the performance is transitory, often intangible in nature and does not
1
normally result in ownership of the factor of production”. It is an economic activity that
creates value and provides benefits for customer at specific time and place by bringing
about a desired change in or on behalf of the recipient of the service.
The service industry is among the highly dynamic industries as consumers and
customers often demands change. These changes further drive the service provision and
delivery forward with increasing demand for quality. Since services are intangible in
nature their success and failure is not easily measured or quantified. These changes
further drive the service provision and delivery forward with increasing demand for
quality. The success of any service providing organization can be measured in terms of
its customers’ attitude towards the service delivery practiced which means service
quality will be the dominant element in customer’s evaluations of a given services
Barclays Bank of Tanzania (BBT) was nationalized and converted into the National
bank of commerce, Tanzania’s largest bank asset. With the liberalization of economy in
the 1990’s, Barclays Bank Plc re-entered the economy resuming business 2000. Barclays
Bank organization comprises a full trained employees and a wide range of parts and
accessories together with a comprehensive range of equipment all this for providing a
quality service that was going to satisfy a customer.
1.2 Statement of the problem
Most of banks experience the problem of quality services from their customers
ending up to be unpleasing from the service been provided by the banking industry, that
is why this study desires to investigate the effect of quality service on customer
satisfaction in the banking industry.
Service quality is a particularly essential in the banking service context because it
provides high level of customer satisfaction, and hence it becomes a key to competitive
advantage (Ahmossawi, 2001 cited on MesayShata, 2012). Winning this competition, it
is obvious that customer satisfaction is critical issue as it is highly correlated with the
quality of services provided by competing organizations.
2

Being one of service offering institutions, the quality of the service offered by banks is
very crucial for their survival. As most of private banks in the banking industry of
Tanzania offer similar types of products, the differentiation lies in the service quality
offered.
One may ask “why is it necessary to assess the level of service quality in an
organization”? The reason is in this world of competition the only way a firm can
survive is by being the best in service industry i.e. being able to provide the best service
quality. And this is because unsatisfactory customer service leads to a drop in customer
satisfaction and willingness to recommend the service to friend. Levesque and
McDougall (1996)
Therefore the main interest of this study is to measure the perception of customers
concerning a service provided by bank of Barclays and find out whether the bank has
met the perception of its customers under all the dimension of service quality as service
quality is becoming key choice driver of customers.
1.3 Objectives
1.3.1 General Objective
The general objective of this study is to examine the quality of service provided
by Barclays Bank Dodoma and its impact on customer satisfaction.
1.3.2 Specific Objective
The specific objective of the study is:
- To examine the relationship between service quality dimensions and customer
satisfaction.
- To examine the impact of service quality on customer satisfaction.
- Identifying the dominant dimension of service quality that drives customers’
perceived service quality in Barclays Bank Dodoma
.
3

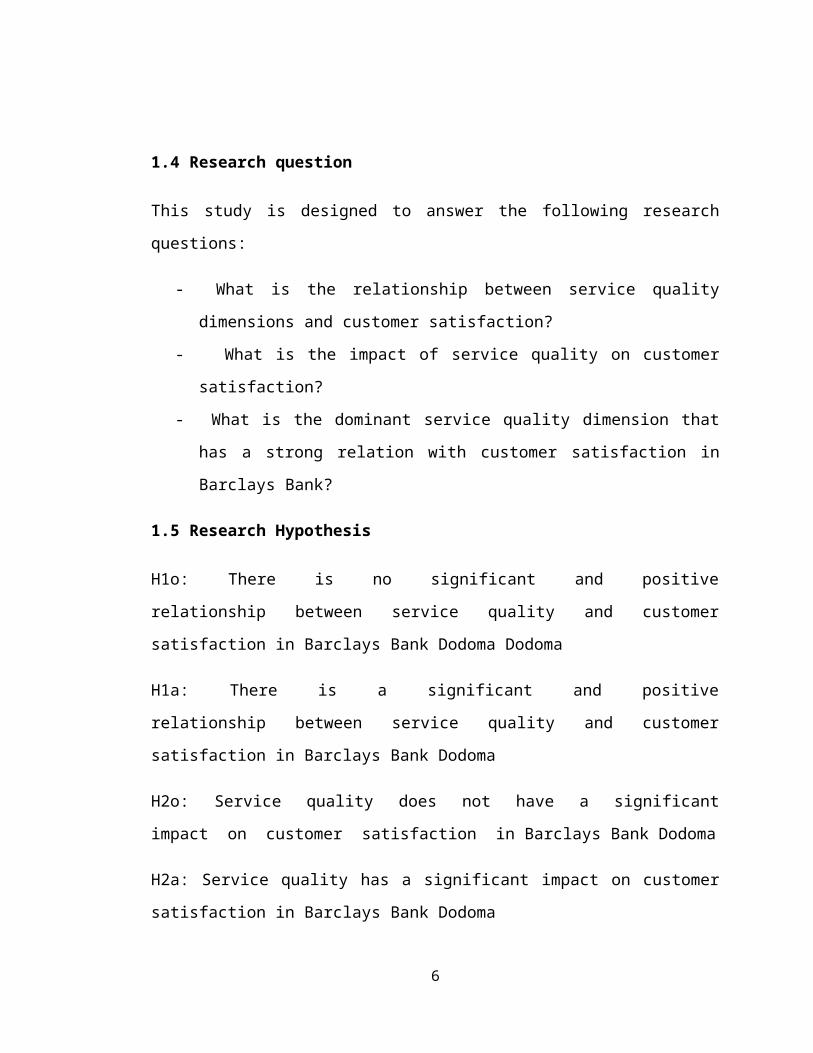
1.4 Research question
This study is designed to answer the following research questions:
- What is the relationship between service quality dimensions and customer
satisfaction?
- What is the impact of service quality on customer satisfaction?
- What is the dominant service quality dimension that has a strong relation with
customer satisfaction in Barclays Bank?
1.5 Research Hypothesis
H1o: There is no significant and positive relationship between service quality and
customer satisfaction in Barclays Bank Dodoma Dodoma
H1a: There is a significant and positive relationship between service quality and
customer satisfaction in Barclays Bank Dodoma
H2o: Service quality does not have a significant impact on customer satisfaction
in Barclays Bank Dodoma
H2a: Service quality has a significant impact on customer satisfaction in Barclays Bank
Dodoma
1.6 Significance of the study
The significance of the study is to give sufficient information on the service the bank is
currently providing and help it to know areas which need improvement and plan towards
it so that its customers enjoy quality service.
Through this study, Barclays bank management identifies the need and expectations of
its customer in order to satisfy them. Again customer feedback received from this
research was incorporated in Barclays bank continuous improvement processes. This
research would further contribute to the available pool of knowledge on customer
4

The study primarily serves as a catalyst for other studies into the field of Quality Service
in Tanzania, especially the banking and financial sector that has seen intense
competition with the introduction of the worldwide banking by the Bank of
Tanzania. It is hoped that the information that was gathered from this research would be
of benefit to corporate bodies, academia and researchers in general.
1.7 Scope of the study
The study covers the areas of service delivery within a branch in Barclays bank Dodoma
that was focus on assessing the impact of service quality towards customer satisfaction.
1.8Limitation and delimitation of the study
In conducting the research some of the respondents were unwilling to respond to
questionnaires at a required time this caused the researcher to suffer on waiting and
remind them several times and yet some of them did respond to the questionnaires. And
thus to overcome this problem a researcher had to re-distribute extra questionnaires to
the customer so as to reach targeted population.
1.9Organization of the study
The work was organized into five chapters. Chapter one contained the background to the
study, the problem statement, the objectives of the study, research questions significance
of the study, scope of the study, limitation of the study and organization of the study.
Chapter two covered the literature review. Chapter three covers methodology which
comprises the research design, population of the study, target population, sample size
data collection tool, research ethics and data analysis. Chapters four consist of analysis
of data and discussion of result. Chapters five consist of conclusions of the study and
recommendation.
5

CHAPTER TWO
2.0 Literature review
Introduction
This chapter covers the literature reviewed of Theories and models and conceptual
framework which serves as evidence of the Variables of the study - Service
Quality and Customer Satisfaction. Definitions of service, quality, customer satisfaction,
the concept of service quality, and the relationship between service quality and customer
satisfaction is briefly highlighted.
2.1 Theoretical review
2.1.1 Service
There are many definitions of service in the literature may depend on the scholars and
focus on a specific research (Groonros 2001). A service is a commodity with no
physical existence, usually created and consumed at the same time. Gronroos
(2001) described a service as a process resulting in an outcome in a partly
simultaneous production and consumption process. This definition points to the fact
that service provision and consumption are simultaneous activities.
Service is intangible in nature, it cannot be mass produced. It cannot be inventoried and
stored after production. Due to the fact that services and consumers of services are
inseparable, they cannot be produced until the consumer is ready to consume them.
Providing consistent quality is difficult for service because of the characteristic of
variability (Clow and Kurtz, 2003). When one puts it in the simplest term; services are
deeds, processes and performances (Zeithaml and Bitner, 2004). It is apparent that
services are produced not only by service businesses but also are integral to the offering
of many manufactured goods producers.
6

Philip kottler (2000) defines services as “ A service is any act or performance that one
party can offer to another that is essentially intangible and does not result in the
ownership or anything, it’s production may not be tied to a physical product.’’
According to Zeithaml and Bitner (2004) Services include all economic activities whose
output is not a physical product or construction, is generally consumed at the time
it is produced and provides added value in forms (such as convenience, amusement,
timeliness, comfort or health) that are essentially intangible concerns of its first
purchaser. Lovelock and Wirtz (2007) indicated that, service is “time based” and the
outcome of a service may result in desire change in consumer or any property of the
consumer.
2.1.2 Characteristic of service
It is generally accepted that services have four main characteristics that differentiate
them from goods: intangibility, inseparability, variability and perishability (Armstrong
&Kotler, 2011) these characteristics create unique challenges for services.
Service intangibility refers to the fact that services cannot be seen, tasted, felt,
heard, or smelled before they are bought. For this reason, customers try to
evaluate the quality of a service by looking at tangible components such as the
place, people, price, equipment, and communications apparent. (Armstrong &Kotler,
2011).
Service inseparability refers to the fact that services cannot be separated from their
providers, whether the providers are people or machines. This means that the employee
providing the service becomes part of the service, in most cases, the customer is also
present at the time of providing the service. Therefore, the provider-customer
interaction becomes important in determining the outcome of the service (Armstrong
&Kotler, 2011)
7

Service variability refers to the fact that the quality of services depends on who provides
them as well as when, where, and how they are provided (Armstrong &Kotler,
2011). This means that the quality of a service provided is not just determined by the
company but by the service provider too. Therefore, understanding the role of
service providers is crucial to understand perceptions of service quality.
Service perishability refers to the fact that services cannot be stored for later sale
or use (Armstrong &Kotler, 2011), although Lovelock and Wirtz (2011) argue that
“not all service performances are perishable” like video recordings of events and
concerts. One problematic situation that accompanies this characteristic is when
demand exceeds supply (Armstrong &Kotler, 2011). This can be applied to the
banking sector when there is traffic at the counters and no enough service providers, thus
the service in that case cannot be stored for later use.
In this case, banks should think of better ways to match the service supply with the
demand. For this reason, understanding perishability of services is important in the
context of this study.
2.1.3 Quality
There are many definitions of quality derived from uncountable philosophies. One of
them is a Romanian engineer, Joseph M. Juran also have his own point of view
regarding to the quality meaning. Juran (1988), in the business perspective state that
qualities are those features of products which meet customer needs and thereby provide
customer satisfaction. The purpose of such higher quality is to provide greater customer
satisfaction
For some quality is Performance to standards while for others it is meeting or satisfying
the customer’s needs. The Quality of a product or service is the fitness of that product or
service for meeting or exceeding its intended use as required by the customer (S.Anil
Kumar and N.Suresh). Dr. Ram Naresh Roy defined quality as the totality of features
and characteristics of a product or service that bear on its ability to satisfy stated or
8

implied needs. The definition of quality depends on the point of view of the
people defining it. Most consumers have a difficult time defining quality, but they
know it when they see it. Some definitions of Quality according to Reid and Sanders:
Conformance to specifications: How well a product or service meets the targets and
tolerances determined by its designers.
Fitness for use: A definition of quality that evaluates how well the product
Performs for its intended use.
Value for price paid: Quality defined in terms of product or service usefulness
for the price paid.
Support services: Quality defined in terms of the support provided after the product or
service is purchased.
Psychological criteria: a way of defining quality that focuses on judgmental evaluations
of what constitutes product or service excellence.
Defining quality for service organization is difficult because of the intangible
nature of the product. Since a service is experienced, perceptions can be highly
subjective. In addition to tangible factors, quality of services is often defined by
perceptual factors. In most cases, defining quality in services can be especially
challenging. (Reid and Sanders, operation mgt 4thedition)
Some of the terms used to define quality in the service industry according to Reid and
Sanders are:
Consistency: ability to provide same level of good quality repeatedly.
Responsiveness to Customer needs: willingness of service providers to help customers
in unusual situations and to deal with problems.
9
Courtesy: the way employees treat customers.
Time: the amount of time a customer has to wait for the service.
Reliability: the ability to perform dependably, consistently and accurately.
Convenience: the accessibility of service provider to its customers.
2.1.4 Service Quality
Quality can only be judged in a context of customers’ expectations and experience. Its
value to the customers which should be the driving force of quality needs to be a
dynamic factor responding to change. Jim whittle (1995) cited in Ken Irons (1997) said
“service is the one unique opportunity we have to be better than competitors and
make sure our customers return” which would mainly be the result of a quality service.
Gronroos (1984) defined service quality as the outcome of an evaluation of process
where the consumer compares their expectations with the service they received. He
postulated that customer perceived service quality is a function of expected service,
perceived service, and image quality.
Lehtinen and Lehtinen (1982) defined service quality in terms of physical quality,
interactive quality and corporate (image) quality. Physical quality is associated with
tangible aspects of the service. Interactive quality involves the interactive nature of
services and refers to the two-way flow, which occurs between the customer and the
service provider, or his/her representative, including both automated and animated
interactions. Corporate quality refers to the image attributed to a service provider by its
current and potential customers, as well as other publics.
They also suggested that, when compared with the other two quality dimensions,
corporate quality tends to be more stable over time.
Researchers argue that the distinctive nature of services requires a distinctive
approach to defining and measuring service quality. As a result of the intangible
10

multifaceted nature of many services, it may be harder to evaluate the quality of
a service than of a good. Because customers are often involved in service
production particularly in people processing services, distinction needs to be drawn
between the process of service delivery and the actual output of the service. Perceived
quality of service is the result of an evaluation process in which customers
compare their perception of service delivery and its outcome against what they
expect.
The most extensive research in to service quality is strongly user oriented. Valarie
Zeithmal and Leonard Berry (1990) cited in Lovelock and Wirtz (2004) identified
criteria consumers use in evaluating service quality. In subsequent research, they
found a high degree of correlation among several of these variables and so consolidated
them into five broad dimensions.
1. Tangibles: the appearance of physical facilities, equipment, personnel and
communication materials. The customer perceives that all the tangible aspects of
the service are fit for the task and is customer friendly.
2. Reliability: the ability to perform the promised service dependably and
accurately.
3. Responsiveness: the willingness to help customers and provide prompt service.
The customer’s perception is that the service provider responds quickly and
accurately to his or her specific needs and demands.
4. Assurance: the knowledge and courtesy of employees and their ability to convey
trust and confidence so that the customer feels he or she is in courteous, able and
competent hands.
5. Empathy: providing caring and individualized attention for customers to make
them feel they are receiving caring services and individualized attention.
11
2.1.5 Measuring Service Quality
Without doubt, conceptual service quality models are useful in so much as they
provide an overview of the factors which have the potential to influence the quality of
an organization and its service offerings. They facilitate our understanding and can help
organizations to clarify how quality shortfalls develop. However, human behavior
significantly affects the quality of an organization and its offerings, and this is more
evident in service organizations.
The most widely used models in measuring service quality in the banking sector
are the SERVQUAL and SERVPERF model.
2.1.5.1 Using SERVQUAL to Measure Service Quality
According to Clow and Kurtz (2003) a test instrument called SERVQUAL was
developed to measure service quality.
Parasuraman et al. (1985) is believed to be the first who introduced the conceptual
framework for the SERVQUAL model to measure consumer perceptions of service
quality and later refined the model. According to the SERVQUAL model (Parasuraman
et al., 1988), service quality can be measured by identifying the gaps between
customers’ expectations of the service to be rendered and their perceptions of the
actual performance of the service.
It was developed to measure perceived service quality as the key output variable
and in its finalized form it has 22 pairs of Likert-type scales. The first 22 items are
designed to measure customer expectations of service for a particular service
industry (expectations), while the remaining 22 are intended to measure the perceived
level of service provided by a particular service organization (perceptions). Service
quality is then measured by calculating the difference in scores between the
corresponding items (i.e. perceptions minus expectations).
12
(Parasuraman et al, 1985). In other words, it is a technique that can be used for
performing a gap analysis of an organization's service quality performance against
customer service quality needs.
Research has shown SERVQUAL to be an effective and stable tool for measuring
service quality across service industries (Parasuraman et al., 1985, 1988; Zeithaml et al.,
1990; 1993).
SERVQUAL is based on five dimensions of service quality. The model was initially
developed for financial services sector and it has been used for other sectors such
as telecommunications, healthcare and hospitality. When perceived performance
rating exceeds expectations, the outcome is considered as a sign of good quality
whilst the reverse is an indication of a poor quality. (Lovelock and Wirtz (2007).
SERVQUAL has been adopted for conducting many studies. As it easily identifies the
strength and weakness of service provided by organizations, areas of weakness can be
prioritized. It also serves as a standard for organizations to measure the quality of service
in the same industry.
Moreover it serves as a signal to management to take in consideration the perception of
both the management and the customer helps them to know the customer’s impression
about the service provided. (Buttle 1996 cited on Aborampah Amoah Mensah 2010)
However major criticisms have been made against the SERVQUAL model. The major
one being, the five service quality dimensions are not universal and cannot be
applied in all service industries. Further Buttle(1996) cited on Aborampah2010 argues
that there is a little proof that customers evaluate the quality of service on the basis
of the difference between perception and expectation. Landhare also supported his
idea saying the difference score do not give any additional information beyond that
already existed in the perception’s item for the result showed that the dominant
contributor to the gap scores comes from the perception’s score. More over using
two sets of questionnaire with the likert scale is confusing and tire some.
13

SERVQUAL also fails to provide remedies for the identified Gaps. (Aborampah Amoah
Mensah 2010)
2.1.5.2 Using SERVPERF to Measure Service Quality
The SERVPERF model was carved out of SERVQUAL by Cronin and Taylor in
1992.SERVPERF directly measures the customer’s perception of service performance
and assumes that respondents automatically compare their perceptions of the
service quality levels with their expectations of those services. Cronin and Taylor
argued that only perception was sufficient for measuring service quality and therefore
expectations should not be included as suggested by SERVQUAL (Baumann et al,
2007).Instead of measuring the quality of service via the difference between the
perception and expectation of customers as in SERVQUAL, SERVPERF operationalizes
on the perceived performance and did not assess the gap scores as expectation does not
exist in the model. Thus, it is performance-only measure of service quality.
The model adopts the five dimensions of SERVQUAL and the 22 item scale is used in
measuring service quality. In the SERVPERF model, the results demonstrated that it had
more predictive power on the overall service quality judgment than SERVQUAL.
(Cronin and Taylor 1994)
‘’The SERVPERF scale is found to be superior not only as the efficient scale
but also more efficient in reducing the number of items to be measured by 50%
(Hartline and Ferrell, 1996; Babakus and Boller, 1992; Bolton and Drew, 1991)’’
cited by Mesay Shita2012.Many studies have been conducted by adopting the
SERVPERF model.
Also, Wall and Payne(1973) note that when people are asked to indicate the
“desired level” (expectations) of a service and the “existing level”(perceptions) of
the service, there is a psychological constraint that people always tend to rate the
former higher than the latter (E>P).
14

Babakus and Boller1992 have found that service quality, as measured in the
SERVQUAL scale, relies more significantly on the perception score than on the
expectation score. (Cited on H.Vasantha Kumari)
Due to the above mentioned facts the researcher also preferred to use
SERVPERV model to undertake the study.
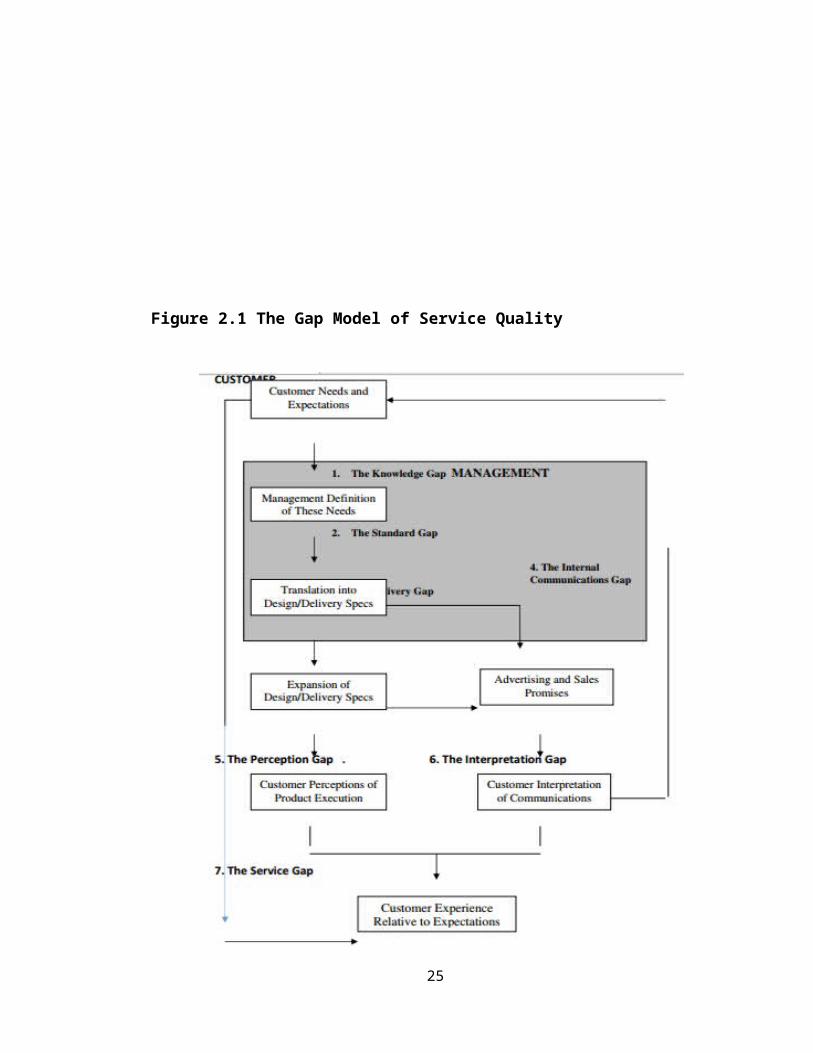
2.1.5.3. The Gap Model
If one accepts interview that quality entails constantly meeting or exceeding
customer’s expectations the manager’s task is to balance customer expectation and
perceptions and to close any gaps between the two.
Zeithmal et al (1990) cited in Lovelock and Wirtz (2004) identified four potential gaps
within the service organization that may lead to a final and most serious gap. The
difference between what customers expected and what they perceived was delivered
15

Figure 2.1 The Gap Model of Service Quality
Source: (Lovelock and Writz,2004)
16

1. The knowledge gap: - is the difference between what service providers
believe customers expect and customer’s actual needs and expectations.
2. The standard gap: - is the difference between manager’s perceptions of
customer expectations and the quality standards established for the service
delivery.
3. The delivery gap: - is the difference between specified delivery standards
and the service providers’ actual performance on these standards.
4. The internal communication gap: - is the difference between the company’s
advertising and sales personnel thinks are the products features, performance
service quality levels and what the company is actually able to deliver.
5. Perceptions gap: - is the difference between what is in fact, delivered and what
customers perceive they have received (because they are unable to accurately
evaluate service quality.)
6. The interpretation gap: - is the difference between what a service provider’s
communication efforts (in advance of service delivery) promise and what a
customer think was promised by these communications.
7. The service gap: - is the difference between what customers expect to
receive and their perception of the service that is delivered.
Gaps 1, 5, 6 and 7 represent external gaps between the customer and the
organization. Gaps 2, 3 and 4 are internal gaps occurring between different
functions and departments within the organization. The presence of any one of
the above seven gaps may lead to a disappointing outcome which affects the
relationship with customers. Thus it is important to avoid this gap in every
service encounter for it helps to build a good reputation in the eyes of customers.
Moreover identifying the specific causes of each gap and then developing
strategies to close them will reduce the likelihood that one of the gaps will
occur. (Lovelock and Writz, 2004)
17
2.1.6 Customer Satisfaction
Satisfaction is the consumer’s fulfillment response. It is a judgment that a product or
service feature, or the product or service itself, provided (or is providing) a
pleasurable level of consumption-related fulfillment, including levels of under or over-
fulfillment (Oliver 2010).
Zeithaml and Bitner (2000) defined customer satisfaction as the customers’
evaluation of a product or service in terms of whether that .product or service has
met their needs and expectations.
Customer satisfaction can also be defined as the “customer’s response to the evaluation
of the perceived discrepancy between prior expectation and the actual performance of
the product as perceived after its consumption” (Tse and Wilton, 1998). Jamal and
Nazer(2002) cited on Aborampah argued that customer satisfaction is not only linked
with the view of customers but also on their experience with the service delivery
process.(Aborampah Amoah Mensah 2010)
Customer satisfaction reflects the degree of a customer’s positive reaction for a
service provider in a bank context, it is necessary for service providers (bank) to
recognize the customer’s vision of their services. A high level of customer
satisfaction can have a positive impact on customer loyalty (Deng et al., 2010) cited on
Hossein Gazora*, Babak Nematia, Amir Ehsania and Kianoush Nazari Amelehb
Mixed findings exist regarding the casual direction between service quality and
satisfaction (Lee, et al., 2000) does customer satisfaction leadto service quality or vice
versa. Yavas et al. (1997) explained that although some studies interpreted service
quality perceptions as an outcome of satisfaction, recent studies have characterized
service quality as an antecedent of satisfaction. We except the position that
customers can evaluate a service (be satisfied or dissatisfied) only after they
perceive it. Many authors who studied the relationship between perceived service
18

quality and customer satisfaction have shown that service quality determines customer
satisfaction. (cited on Anderson et al 1994)
Edvardsson (1998) believes that the concept of service should be approached from a
customer perspective. It is the customer’s total perception of the outcome, which
is “the service”. It forms the perception of quality and determines whether a
particular customer is satisfied or not. Customers have different values and different
grounds for assessment; they may perceive one and the same service in different ways.
Therefore a company must first find out the level of satisfaction of its current
customers to improve its customer satisfaction. One common way of measuring
satisfaction is to ask customers first to identify what factors are important in satisfying
them and then to evaluate the performance of a service provider and its competitors on
these factors. Many firms use a five point scale to measure customer satisfaction, with
the following format
1= very dissatisfied
2=somewhat dissatisfied
3=neutral
4= somewhat satisfied
5=very satisfied.
The result of the satisfaction surveys can be used to estimate the number of loyal
customers a firm has as well as how many are at risk f defecting. Lovelock and
Wright (1999) cited on (Deborah Mamo 2014)
2.1.7 Customer Satisfaction versus Service Quality
Due to the dynamic nature of expectation, evaluations change over time form person to
person and form culture to culture. What is considered quality service or the things
19

that satisfy customers today may be different tomorrow. Customers perceive
services in terms of the quality of the service and how satisfied they are overall with
their experiences. (Zeithaml and Bitner, 2013).The reason for the focus on quality
of service and customer satisfaction is the belief that organizations can
differentiate themselves by means of providing better service quality and overall
customer satisfaction.
Parasuraman et al (1988) defined service quality and customer satisfaction as service
quality is a global judgment or attitude relating to the superiority of the service, whereas
satisfaction is related to a specific transaction. Satisfaction is a post consumption
experience which compares perceived quality with expected quality, whereas service
quality refers to a global evaluation of a firm's service delivery system. (BeliyuGirma
2012)
According to Zeithaml and Bitner (2013) the terms satisfaction and quality were
used interchangeably. But researchers have attempted to be more precise about the
meanings and measurement of the two concepts, resulting in considerable debate.
Consensus is growing that the two concepts are fundamentally different in terms of
their underlying causes and outcomes. Although they have certain things in common,
satisfaction is generally viewed as a broader concept whereas service quality
assessment focuses specifically on dimensions of service. Based on this view
perceived service quality is a component of customer satisfaction.
According to Kotler and Armstrong satisfaction is the post-purchase evaluation of
products or services taking into consideration the expectations. Researchers are divided
over the antecedents of service quality and satisfaction. Some believe service quality
leads to satisfaction, others think it’s not. The studies of Lee et al. (2000); Gilbert and
Veloutsou (2006); Sulieman (2011) and Buttle (1996) suggest service quality leads
to customer satisfaction. To achieve a high level of customer satisfaction, most
researchers suggest that a high level of service quality should be delivered by the
service provider as service quality is normally considered an antecedent of customer
20

satisfaction. As service quality improves, the probability of customer satisfaction
increases. (Mesay 2012)
2.2 Conceptual Framework
The conceptual framework indicates the crucial process, which is useful to show the
direction of the study. The study shows the relationship between the five service quality
dimensions and customer satisfaction. Also the study focuses on SERVPERV model
which represents customers’ perceptions toward the service offered which is referred to
as the perceived service quality.
Figure 2.2 Conceptual frameworks on the impact of the service quality on customer
satisfaction
Source: Parasuraman et al., 1988
21
Service Quality
Dimension
Tangible
Responsiveness
Reliability
Empathy
Assurance
Customer satisfaction

CHAPTER THREE
3.0 Research methodology
Introduction
This chapter explains how exactly the research was taken so as to answer the research
questions by providing a plan of action used by the researcher, and describes the steps
that were involved in sufficient detail to allow an inexperienced reader to follow the
study. This includes research design, population data type and source, sampling method
and size, procedure for data collection, method of data collection and data analysis,
questionnaire design and reliability.
3.1 Research design
This study is designed to collect the information about the effect of service quality on
customer’s satisfaction in banking industry involve the case study of Barclays Bank
Dodoma branch. There are different research designs in case of different types of
research studies. Descriptive research design is the type of research design that was used
to collect data. (This study includes quantitative research design.) Through this design,
a researcher can analyze various factors which motivate people to behave in a
particular manner or which make people like or dislike a particular thing
(Kothari,2004).
3.2 Study Area
The study was taken around Barclays Bank. Dodoma region was very convenient to
the researcher due to availability of customers of the bank and resources
constraints especially time and shortage of funds to cover all research cost. So by
choosing that mentioned area it made possible for the study to be conducted effectively.
Not only that, but also it was easy for the researcher during data collection as it
encompassed the clients of Barclays Bank branch in Dodoma regions. The reason for
22

choosing this bank branch was that it has enough number of clients and there is
competition among other banks and they have different kinds of customers in national
level and globally, which means the sample will be good and fair representation.
3.3 Population of the study
The study has population from various departments of the branch, involve the front
office and back office (BOTL, Branch manager, Universal Banker, Personal Banker,
Customer service adviser, Sales manager and LG’s), but the main area of concentration
was the front office that base much on customer service.
3.3.1 Target population
The main focus of this study was to identify the service quality provided by Barclays
Bank and its impact on customer satisfaction using SERVPERF Model.
The target population for the study was customers of Barclays Bank Dodoma branch.
3.4 Sample size
Kothari, (2004) suggests that a viable sample must contain a minimum of 25% units to
be included in sample for correct statistical analysis to be attained for the case study
research. The size of the sample neither was excessively large, nor too small. It should
be optimal. An optimal sample was one which fulfills the requirements of efficiency
representativeness, reliability and flexibility. Borg gall (2003) researcher needs to select
a convenience sample,
The bank has 1,000 customers per year in Barclays bank. The sample size of this study
was determine using the investigation on how many people attend for service per year
with how many months a researcher was doing the research.
Sample size calculation:
23

Given
1. Number of customer per year = 1000
2. Three months for research = 14 of the year
Find the number of customers attending
14×1000 = 250
The number of customer = 250
Find the sample size of customer to be sampled.
25100×250 = 62.5 customers
Sample size will be 62.5units/customer
Thus, sample of 62 customers population from the population 1000 customer per year
3.5 Sampling procedure
To achieve the overall objective of the study of Barclays Bank Dodoma branch was the
institutions as the main sources of inquiry from which samples were formulated.
The main objective of sampling was to ensure that the sample is a representative of the
target population. In this study were used non- probability samples the probability
of each case being selected from the total population was not known.
Thus it was impossible to answer research questions or to address objectives that
require the researcher to make statistical inferences about the characteristic of the
population (Saunders, Lewis & Thornbill,2000)
A researcher use simple random sampling and judgmental sampling technique. These
techniques were seen convenient with regards to resources constraints, therefore good
24

representative number of people was obtained, and also every customer had equal
chance of being selected.
3.6 Data collection tool
The study included quantitative method of collecting data therefore These are including
primary and secondary data collection.
3.6.1 Secondary Data
Secondary data was collected by accessing and reviewing various documents, which was
to see the impact of services quality on customer satisfaction in Tanzania banking
industry. Secondary data was consisted of reports, journals, books and publication
to establish the available data on the subject and the primary data collected. These
included sources like, internet, journals, Open University library etcetera.
3.6.2 Primary Data
Primary data used were collected through interview or face to face aided by
questionnaires, which collected all responses from the chosen sample.
3.6.3 Questionnaires
Questionnaires were used with both structured and open ended questions which were
administered to the chosen sample of respondents. The questionnaire for this study was
took the problem statement of research into account. The questions were based on
variables of the conceptual model to the impact of service quality on customer
satisfaction.
Written questionnaires were used to collect data from customers because it is mostly
less expensive in terms of time spent in collecting data. It can be distributed to a
large number of respondents simultaneously in a large geographical area at a relatively
25

low cost. Questions in written questionnaires are often standardized and are therefore
not susceptible to changes in emphasis as in the case of verbal interviews.
Questionnaires were distributed to the customers of “Barclays Bank Dodoma”. It was
not possible to collect all data by the e-mail and with social media also because there
was no database showing the e-mail and social media of customers from the bank. The
questionnaire was distributed physically personal interviews with customer.
The data collection was done using self-administered questionnaire to be filled by
the bank’s customers. The questionnaire was designed in a five scale likert
measurement. A 22 item measure was used to indicate the customers degree of
agreement for the 22 performance statements, based on their assessments of the
service provided by the bank adopted from SERVPERF model by Cronin and
Taylor’s(1992).The variables are measured using Likert scale with five response
categories (strongly agree, agree, neither agree nor disagree, disagree and strongly
disagree). The Likert scale method was refereed to make the questions interesting to the
respondents and to insure maximum response rate. Customer satisfaction was measured
with one scale adopted from Lovelock and Wright (1999) with response ranging
from ‘very satisfied’ to ‘very dissatisfied’
The questionnaire was prepared in three parts. The first part of the questionnaire
consists of issues related to the personal information of the respondent. It included the
age, gender, and educational background. The second part was concerned with the
questions used to assess service quality of Barclays Bank Dodoma. S.C. The research
instrument designed is based on the five dimensions of service quality and the 22 service
items of the SERVPERF model. The developed questionnaire includes four items
which correspond to the tangibles dimension, five items which correspond to the
reliability dimension, five items to the responsiveness dimension, four items to
empathy dimension and four items which correspond to the assurance dimensions.
Respondents were asked to indicate their degree of agreement with each of the items on
five point likert scale. The third part of the questionnaire measures the level of
26

customer satisfaction using a five point Likert sale which ranges from ‘highly
satisfied’ to ‘highly dissatisfied.’
3.7 Research Ethics
In this study the respondent was not forced to participate in the study and the researcher
was respectfully and committed to the study only not beyond. The norm was being
followed in a high confidentiality of the responses from the respondents and
interviewees. There was also privacy on the information that was be given out by the
respondents and highly protection of information that was obtained either in writing or
reporting facts and opinions from the field.
3.8 Data analysis and Processing
3.8.1 Data analysis
Both descriptive and inferential statistics were used to analyze and interpret the
findings. Demographic variables of the respondents and mean scores of the service
quality dimensions are interpreted using descriptive statistics whereas inferential
statistics is used to find out the relationship between service quality dimensions and
customer satisfaction using correlation and regression analysis via SPSS Version 16.
This software has been widely used by researchers as a data analysis technique
(Zikmund, 2003).
3.8.2 Data processing
In the processing of data the study uses the following statistical concepts: mean
percentages, and graphics presentation
3.8.3 Data Reliability
The Cornobatch alpha coefficient is an indicator of internal consistency of the
scale. A highvalue of the Cronbach alpha coefficient suggests that the items that make
27

up the scale ‘hang together’ and measure the same underlying construct. A value of
Cronbach alpha above 0.70 canbe used as a reasonable test of reliability. To meet the
consistency reliability of instrument, the questionnaire was first distributed to 30
respondents and the Cornbach’s alpha for the independent variables (Tangibility,
Reliability, Responsiveness, Empathy and Assurance) was found to be 0.896.
Therefore the five dimensions of service quality were found to be high in their internal
consistency and thereby in measuring the dimensions of interest.
28
CHAPTER FOUR
4.0 Introduction
This is chapter deals with the study findings, analysis data and Discussion; the
researcher used methods that were of a quantitative in nature.
4.1 Overall Respond Rate
The researcher sample was 62 but 70 questionnaires were distributed to customers of
Barclays Bank Dodoma 64 questionnaires were collected but only 62 were needed for
the investigation and to present the findings and discussion of the results for the study
about the impact of quality service on customer’s satisfaction in Tanzania Banking
industry a case of Barclays Bank Dodoma. The data was analyzed using SPSS
version16.
Table 4.1 Overall Respond RateNO Description Response Percentage
1 Received 64 91.4%
2 Outstanding 4 5.7%
3 Incomplete 2 2.9%
Total 70 100%
4.2 Respondents Profile
To find out the general background of customers of Barclays Bank Dodoma, the
respondents were asked their Gender, Age and Education Status. The results obtained
from the structured questionnaires are on the table below.
29
Table 4.2 Gender Profile of Respondents
Frequency Percent Valid Percent Cumulative Percent
Valid Male 41 66.1 66.1 66.1
Female 21 33.9 33.9 100.0
Total 62 100.0 100.0
From the questionnaire the respondents were to allocate their gender. From the figure
below the results obtained consists of male and female. From the results collected males
were 41 which accounts for 66.1% of the total number of respondents, females were 21
which is 33.9% of the total respondents. So a large number of customers were males
which makes them to be many than females. This implies that the organization is
being visited much by males than females this might be due to nature of the activities
done by male that make them do transaction more in banks. Also another reason behind
to the male number to turn out more than women was central part of Tanzania men deal
with big business compare to women that is why their banking service than women
Table 4.3. Age Profile of Respondents
Frequency Percent Valid Percent Cumulative Percent
Valid 18-29 15 24.2 24.2 24.2
30-39 29 46.8 46.8 71.040-49 12 19.4 19.4 90.3
above 50 6 9.7 9.7 100.0Total 62 100.0 100.0
The ages of the respondents were kept in a number of categories such those who were
years under on category, those who range between 18- 29 years in one category , 30-39
years, 40-49 years and above 45 years. The result from the table shows that most of
respondents are 29(46.8%) aged 30-39 years, followed by 15( 24.2%) respondents who
are aged 18-29 years, some of respondents 12(19.4%) are aged 40-49 years and few
respondents 6( 9.7%) are aged above 50 years.
30

Table 4.4 . Educational Status of respondents
Frequency Percent Valid PercentCumulative Percent
Valid secondary 3 4.8 4.8 4.8
Certificate or Diploma 13 21.0 21.0 25.8
Degree 37 59.7 59.7 85.5
Master and Above 9 14.5 14.5 100.0
Total 62 100.0 100.0
The education level was expressed in a number of categories such as primary level,
secondary level, certificate or diploma level, degree level, master’s degree and others
who were told to specify their level. From the questionnaire as ever respondent was
asked to locate their education levels the final results were as follows primary level was
0 which is 0%, secondary level were 3 which is 4.8% of the total, certificate or diploma
level were 13 which is 21.0% of the total, degree level were 37 which is 59.7% of the
total and master’s degree and above were 9 which is 14.5% of the total respondents. So
from the table it shows that the respondents are characterized with a number degree level
of education which more than half of the total respondents. This implies that the
organization is being favor much by degree level customers, followed by certificate or
diploma level then masters holder and above and lastly secondary level.
4.3 Descriptive Analysis of Service Quality Measurement
To measure the customers’ perception of the service quality provided by Barclays Bank
Dodoma, SERVPERF model is used in this study. SERVPERF directly measures the
customer’s perception of service performance and assumes that respondents
31
automatically compare their perceptions of the service quality levels with their
expectations of those services. The model contains 22 questions and a five point likert
scale is used to measure the performance. For all the service quality dimensions
(Tangibles, Reliability, Responsiveness, Empathy and Assurance), the score have been
computed. The table below represents the results.
4.3.1 Tangibility
Tangibility refers to the appearance of physical facilities, equipment, personnel
and communication materials or physical representation or images of the service to be
provided. From the table the 3 questions asked under tangibility the highest score is
obtained on the bank’s equipment and technology which shows that majority of the
respondent’s agree that the bank has up to date equipment and technology. The lowest
mean score is obtained in the statement which asks whether the employees are well
dressed and appear neat or not. The figure below depicts the results in percentage
Figure 4.1 Tangibility
32

4.3.2 Reliability
Reliability is the ability to perform the promised service dependably, accurately
and consistently. It is performing the service right the first time. It also means that the
firm honors its promises (willingness to help). Reliability of service designates the
bank‘s capability to supply the promised output at the stated level. Accordingly the
mean value of reliability is 4.08.The highest mean score is obtained on questions no.8
thus respondents agree that the bank keeps their records accurately. The lowest mean
score is obtained on question no.7 which asks whether the bank provide service at the
time they promise to do so or not. The figure below depicts the results in percentage
Figure 4.2 Reliability
33

4.3.3 Responsiveness
Responsiveness refers to the prompt response to the service need of the customer
and the readiness of employees to provide service. It is the speed and timeliness of
service delivery (be willing to help). This includes the speed of throughput and the
ability of the service to respond promptly to customer service requests, with
minimal waiting and queuing time. When the customer is kept waiting for no apparent
reason creates unnecessary negative perceptions of quality. Conversely, the ability
for the bank to recover quickly when service fails and exhibit professionalism will
also create very positive perceptions of quality. This dimension touched on subjects as
information about the request by customers being authorized promptly,
communication of new products to customers and handling of customer professionally.
As it can be noted from the below table the mean score of responsiveness is 3.60. The
highest mean score is obtained on question number 10. Here majority of the respondents
agree that Barclays Bank Dodoma’s employees tells you exactly when the service will
be performed and that employees are always helpful whereas the lowest mean score is
obtained on question number 11 that says do customer receive prompt service from
Barclays Bank Dodoma’s employees. The figure below depicts the results in percentage
34

Figure 4.3 Responsiveness
4.3.4 Empathy
Empathy is providing caring and individualized attention to customers to make them feel
they are receiving caring services and individualized attention. Service empathy
characterizes both the service provider’s willingness and capability to respond to
individual customer desires. This means putting one’s self in the shoes of the customer.
The majority of the respondents agree that the bank’s service hour is convenient and
hence the highest mean score is obtained therein. The lowest mean score is obtained on
the question which asks Barclays Bank Dodoma‘s branch is easily accessible to you.
The figure below depicts the results in percentage
35

Figure 4.4 Empathy
4.3.5 Assurance
Since assurance is all about the security provided service by the organization. Therefore
assurance is the knowledge and courtesy of employees and their ability to convey
trust and confidence so that the customer feels he or she is in courteous, able and
competent hands. It relates to the capability of the service provider to deliver the output,
specifically in terms of the knowledge, politeness and trustworthiness of the employees
to the customer of the service firm. This dimension is about the behavior and ability of
the employees to instill confidence, secure transactions, courtesy of the employees and
the knowledge of the employees to answer questions from customers.
The highest contributor for this score is question 22 where the majority of the
respondents agree that Barclays Bank Dodoma ‘s employees provide you the adequate
information on the service you requested. The lowest mean score is obtained on question
19 which says that behavior of Barclays Bank Dodoma’s employees Instills confidence
in you. The figure below depicts the results in percentage
36

Figure 4.5 Assurance
4.3.6 Summary of Results on Perceived Variables
The results indicated that most of variables returned an overall mean score of 4.0 points
out of 5.0 points. Customers felt that the reliability and assurance of the bank services
quality returned an overall mean score greater than 4.0 points which was 4.08 and 4.3
points and 62 respondent claims to be satisfied. This result indicates that customers are
satisfied with assurances and reliability of the bank services quality.
However, the services quality of the empathy, tangibility and responsiveness variable
returned an overall mean score of 3.8, 3.97 and 3.96 which less than mean of 4.0,
thus, results to moderate satisfaction in the attention of the bank toward
customers. Also, there are results that indicated in general the satisfaction of customers
towards the services of banks seem to be more than 4.0 points. Whereas, the overall
mean score of 4.0 points which indicates that there are customers who are moderately
satisfied as shown in a table.
37
The results show that level of satisfaction of each variable quality service for Barclays
bank customers. For the bank to be continuously sustainable and succeed in the severe
global competitive environment, the customer needs to be highly satisfied to a large
extent. Also the reliability and assurance of the bank services quality have to exist to a
large extent, that are good signal that customer are happy with service being provided by
the bank to them.
Figure 4.6 Summary of Perception on Variables
Responsiveness, tangibility and empathy of the bank have to be increased attention to
them because customer use to find dissatisfies with bank service quality when there a
chances to do that, but customers can be attracted and retained after being satisfied by all
dimension of services. Barclays Bank should not stay proud that customers are happy
with the service because customer is unstable, they should keep improving service
quality should keep improving service quality.
4.4 Customer Satisfaction
As explained in the literature review, customer satisfaction involves the fulfillment
of customers’ anticipation of the goods and services. Customers become satisfied if
the performance of the good or service is equivalent to, or even surpasses, the original
expectation. Accordingly identifying satisfaction level of customers is one interest
of this study. The satisfaction level in this study is also categorized and it ranges
from highly dissatisfied, Dissatisfied, Neutral, Satisfied and Highly Satisfied.
The figure below presents the overall level of customer satisfaction
38

Figure 4.7 customer satisfaction
3% 3%8%
73%
13%
Percent
Highly DissatisfiedDissatisfiedNeutralSatisfiedHighly Satisfied
As it can be seen from the table 73% of the respondents are satisfied, 13 percent
of the respondents are very satisfied, 8% chose to remain neutral, 3% are dissatisfied
and 3% is very dissatisfied. Therefore even if the highest percentage of respondents
are somehow satisfied by the service provided by bank of Abyssinia 6% of the
respondents are dissatisfied from these one can infer that the bank needs to work more to
change this result and highly satisfy its customers for customers are key divers of bank
performance in today’s environment.
4.5 Correlation Analysis between Service Quality Dimensions and Customer
Satisfaction
To find out the relationship between service quality dimensions and customer
satisfaction, Pearson’s correlation coefficient (r) which measures the strength and
direction of a linear relationship between two variables is used. Values of Pearson’s
correlation coefficient are always between -1 and +1. A correlation coefficient of +1
indicates that two variables are perfectly related in a positive sense; a correlation
coefficient of -1 indicates that two variables are perfectly related in a negative sense, and
a correlation coefficient of 0 indicates that there is no linear relationship between the
39

two variables. A low correlation coefficient; 0.1-0.29suggests that the relationship
between two items is weak or non-existent. If r is between 0.3 and 0.49 the relationship
is moderate. A high correlation coefficient i.e. >0.5 indicates a strong relationship
between variables. The direction of the dependent variable's change depends on the sign
of the coefficient. If the coefficient is a positive number, then the dependent variable
will move in the same direction as the independent variable; if the coefficient is
negative, then the dependent variable will move in the opposite direction of the
independent variable. Hence in this study both the direction and the level of relationship
between the dimensions of service quality and customer satisfaction are conducted using
the Pearson’s correlation coefficient. The table below presents the result of the
correlation analysis made using bivariate correlation.
40

Table 4.5 Correlations
Tangibles
Reliability
Responsiveness
Empathy
Assurance
Satisfactionlevel
Tangibles Pearson Correlation 1
Sig. (2-tailed)
N 62Reliability Pearson
Correlation .947** 1
Sig. (2-tailed) .000
N 62 62Responsiveness
Pearson Correlation .896** .882** 1
Sig. (2-tailed) .000 .000
N 62 62 62Empathy Pearson
Correlation .930** .935** .892** 1
Sig. (2-tailed) .000 .000 .000
N 62 62 62 62Assurance Pearson
Correlation .929** .963** .858** .917** 1
Sig. (2-tailed) .000 .000 .000 .000
N 62 62 62 62 62Satisfaction level
Pearson Correlation .698** .715** .703** .710** .699** 1
Sig. (2-tailed) .000 .000 .000 .000 .000
N 62 62 62 62 62 62
**. Correlation is significant at the 0.01 level (2-tailed).
HYPOTHESIS TESTING
H1o: There is no significant and positive relationship among service quality and
customer satisfaction in Bank of Abyssinia S.C.
41

H1a: There is a significant and positive relationship among service quality and
customer satisfaction in Bank of Abyssinia S.C.
From the result we can see that assurance is highly correlated to satisfaction (0.699)
followed by responsiveness (0.710), reliability (0.703), and tangibility (0.715) and
empathy (0.698). When we look at the inter correlation between the service quality
dimensions we can see that there is a positive and significant relationship which implies
that a change made in one of the service quality dimension will positively motivate the
other service quality dimension. The highest inter correlation is between assurance and
reliability (r=0.963) followed by responsiveness and reliability(r=0.666), reliability and
tangibility (r=0.947) and empathy and reliability (0.935)
Thus from this result confirmed that there is a positive and significant
relationship between service quality dimension and customer satisfaction. Henceit
answers the research question which asks about the relationship between service quality
and customer satisfaction.
Accordingly we can conclude that there is a positive relationship between the
service quality dimensions and customer satisfaction. Hence any improvement in one of
the dimensions will positively contribute in enhancing the customer satisfaction. In
addition the result confirmed that the alternative hypothesis “there is a significant
and positive relationship among service quality and customer satisfaction in Bank of
Abyssinia S.C” is accepted which leads to rejection of the null hypothesis
4.6 The impact of service quality on customer satisfaction.
In this study regression analysis is used to identify the impact of service quality
dimension on customer satisfaction thus it answers the second research question.
4.6.1 Tangibility
From the regression analysis we can see that here is a positive statistical relationship
between tangibility (the independent variable) and customer satisfaction (the dependent
variable). As the table below presents the coefficient of determination (R-squared)
42

indicates the proportionate amount of variation in the response variable (customer
satisfaction) explained by the independent variable (tangibility) in the linear regression
model. The larger the R-squared is, the more variability is explained by the linear
regression model. Thus, 49% (R2=.488) of the variation on customer satisfaction is
explained by tangibility.
Table 4.6 Model Summary for tangibility
Model R R Square Adjusted R Square Std. Error of the Estimate
1 .698a .488 .479 .81018
a. Predictors: (Constant), Tangibles
On the coefficient table we find the beta value which measures of how strongly
each independent variable influences the dependent variable. Thus a unit increase in
tangibles leads to .259 increases in customer satisfaction other things being constant.
Therefore the more the bank invests on its physical facilities equipment, technology and
appearance of its personnel the more it satisfies its customers.
Table 4.7 Coefficients for tangibility
Model
Unstandardized CoefficientsStandardized Coefficients
t Sig.B Std. Error Beta
1 (Constant) 1.212 .377 3.217 .002
Tangibles .259 .034 .698 7.556 .000
a. Dependent Variable: Satisfaction level
4.6.2 Reliability
From the regression analysis we can see that here is a positive statistical
relationship between reliability (the independent variable) and customer satisfaction
(the dependent variable). Thus 51.1% (R2=.511) of the variation on customer
satisfaction is explained by the independent variable reliability.
43

Table 4.8 Model Summary for Reliability
Model R R Square Adjusted R Square Std. Error of the Estimate
1 .715a .511 .503 .79167
a. Predictors: (Constant), Reliability
On the coefficient table we find the beta value which measures how strongly
each independent variable influences the dependent variable. Thus a unit increase in
reliability leads to .250 increases in customer satisfaction other things being
constant. The bank should invest to enhance its ability to perform the promised
service dependably and accurately so that the satisfaction level of its customers
increases.
Table 4.9 Coefficients for Reliability
Model
Unstandardized CoefficientsStandardized Coefficients
t Sig.B Std. Error Beta
1 (Constant) 1.202 .362 3.322 .002
Reliability .250 .032 .715 7.914 .000
a. Dependent Variable: Satisfaction level
4.6.3 Responsiveness
From the regression analysis we can see that here is a positive statistical relationship
between responsiveness (the independent variable) and customer satisfaction (the
dependent variable).Thus 49.4% (R2=.494) of the variation on customer satisfaction is
explained by the independent variable responsiveness which indicates a high level effect
on customer satisfaction
.
44

Table 4.10 Model Summary for Responsiveness
Model R R Square Adjusted R Square Std. Error of the Estimate
1 .703a .494 .486 .80488
a. Predictors: (Constant), Responsiveness
On the coefficient table we find the beta value which measures of how strongly
each independent variable influences the dependent variable. Thus a unit increase in
responsiveness leads to .283 an increase in customer satisfaction other things being
constant. Therefore the more the bank invests on enhancing its employee’s ability to
help customers and be responsive to customer’s enquiry, the more the customer is
satisfied.
Table 4.11 Coefficients for Responsiveness
Model
Unstandardized CoefficientsStandardized Coefficients
T Sig.B Std. Error Beta
1 (Constant) 1.180 .376 3.139 .003
Responsiveness .283 .037 .703 7.657 .000
a. Dependent Variable: Satisfaction level
4.6.4 Empathy
From the regression analysis we can see that there is a positive and statistically
significant relationship between empathy (the independent variable) and customer
satisfaction (the dependent variable). Thus 50.4% (R2 =.504) variation level of
customer satisfaction is explained by the independent variable empathy.
45

Table 4.12 Model Summary for Empathy
Model R R Square Adjusted R Square Std. Error of the Estimate
1 .710a .504 .496 .79695
a. Predictors: (Constant), Empathy
On the coefficient table we find the beta value which measures of how strongly
each independent variable influences the dependent variable. Thus a unit increase in
empathy leads to .263 increases in customer satisfaction other things being constant.
Therefore the more the bank gives care and individualized attention to customers, the
more the customer is satisfied.
Table 4.13 Coefficients for empathy
Model
Unstandardized CoefficientsStandardized Coefficients
t Sig.B Std. Error Beta
1 (Constant) 1.193 .367 3.249 .002
Empathy .263 .034 .710 7.811 .000
a. Dependent Variable: Satisfaction level
4.6.5 Assurance
From the regression analysis we can see that there is a positive and statistically
significant relationship between assurance (the independent variable) and customer
satisfaction (the dependent variable). Thus 49 %( R2 =.488) variation level of customer
satisfaction is explained by the independent variable assurance.
Table 4.14 Model Summary for Assurance
Model R R Square Adjusted R Square Std. Error of the Estimate
1 .699a .488 .480 .80952
a. Predictors: (Constant), Assurance
On the coefficient table below we find the beta value which measures how
strongly each independent variable influences the dependent variable. Thus a unit
46
increase in assurance strongly increases customer satisfaction by .231 other things
being constant. Therefore the more the bank invests on enhancing its employee’s
knowledge, skill and on their ability to instill confidence to serve customers, the more
the customer is satisfied. As it can be depicted from the result that Assurance is the
dominant service quality dimension which has the highest effect on the customer
satisfaction followed by responsiveness. Accordingly it answers the fourth research
question.
Table 4.15 Coefficients for Assurance
Model
Unstandardized CoefficientsStandardized Coefficients
t Sig.B Std. Error Beta
1 (Constant) 1.355 .358 3.785 .000
Assurance .231 .030 .699 7.568 .000
a. Dependent Variable: Satisfaction level
4.7 Overall Regression analysis
As it can be depicted from the below table there is a positive and statistically
significant relationship between the independent variables (tangibility, reliability,
responsiveness, empathy and assurance) and the dependent variable (customer
satisfaction). Thus 54% (R2 =.539) variation on customer satisfaction is explained by
the independent variables.
Table 4.16 Model Summary for service quality dimension
Model R R Square Adjusted R Square Std. Error of the Estimate
1 .734a .539 .498 .79549
a. Predictors: (Constant), Assurance, Responsiveness, Empathy, Tangibles, Reliability
HYPOTHESIS TESTING
H2o: Service Quality does not have a significant impact on Customer Satisfaction in
Bank of
Abyssinia S.C
47

H2a: Service Quality has a significant impact on Customer Satisfaction in Bank of
Abyssinia S.C.
Table 4.17 ANOVA for service quality dimension and customer satisfaction
Model Sum of Squares df Mean Square F Sig.
1 Regression 41.418 5 8.284 13.090 .000a
Residual 35.437 56 .633
Total 76.855 61
a. Predictors: (Constant), Assurance, Responsiveness, Empathy, Tangibles, Reliabilityb. Dependent Variable: Satisfaction level
From the ANOVA table it has been determined that F = 13.090 and Sig. is .000 which
confirms that service quality dimensions have significant impact on customer
satisfaction. Hence the result depicted that the alternative hypothesis “Service
Quality has a significant impact on Customer Satisfaction in bank of Abyssinia S.C’’
is accepted. Accordingly the null hypothesis is rejected. Furthermore question number
three of the research question is answered.
4.8 Identifying the dominant dimension of service quality that drives customers’
perceived service quality in Barclays Bank Dodoma.
Based on findings of the study the result indicated on the dimension of services quality
are high satisfaction and moderate satisfaction. In case of higher satisfaction to Barclays
customers was based on tangibles and appearances of the bank that made the customers
to approach the service and transaction through the bank to experience the utility, made
them to decide that Barclays bank to be their first choice for bank transactions over other
banks in Tanzania. Another was the assurance and responsiveness dimension of quality
which contributed the big role of making customers satisfied. In this sense their
customers advise the bank to maintain and improve more. Also in case of moderate
satisfaction is based on the empathy and reliability from the bank.
48

CHAPTER FIVE
SUMMARY OF FINDINGS, CONCLUSION AND RECOMMENDATION
5.0 Summary of Findings
The basic interest of this study is to find out the impact of service quality on
customer satisfaction in the case of Banking industry at Barclays Bank Dodoma. The 22
service item of the SERVPERF model is used to investigate the relationship between
the service quality dimensions and customer satisfaction. The data obtained from
the respondents was analyzed using various statistical tools.
The result of the background information of respondents indicated that the
majority of the respondents are male (61.1%) aged in the range of 30 to 40.
Regarding the education background, 59.7% of the respondents are degree holder.
From the mean result it is observed that customers were most satisfied with
assurance dimension of service quality followed by reliability dimension of service
quality.
The finding from the correlation result reveals that there is a positive and
significant relationship between the service quality dimensions and customer
satisfaction. Assurance is found to have the highest correlation with customer
satisfaction and the findings from the inter correlation indicates that the highest
relationship is found between assurance and responsiveness.
In addition the finding from the regression result indicates all the service quality
dimensions have a positive impact on customer satisfaction and assurance is the
dominant service quality dimension which affects customer satisfaction.
From the R square value it is depicted that 54% of variation in customer
satisfaction is explained by the service quality dimensions.
49

5.1 Conclusion
Undoubtedly, no business can exist without having customers. In the philosophical word
of peppers and Rogers “the only value your company will ever create is the value
that comes from customers – the ones you have now and the ones you will have in the
future”. This is absolutely true. Customer value is an asset to the organization. Hence, in
order to maintain the customer, the organization needs to ensure that the right products
and services, supported by the right promotion and making it available at the right time
for the customers.
While quality service and merchandise are essential in today’s competitive market, it is
equally important that a customer experiences the “Wow Effect” that only superior
customer services can deliver. A business that caters to its customers’ needs will
inevitably gain the loyalty of their customers, thus resulting in repeat business as
well as potential referrals.
5.2 Recommendation
In this section of recommendation the author states some issues which raised from
Barclays bank customers about the bank of Barclays such as interest rate,
collateral, lower speed and responsiveness of the services toward customers. Also the
shortage of ATM machines, branches and lack of communication about the products of
the bank. Here are some of the recommendations made by researcher as follows:
(i) It is necessary to know the demands of the customers about the services they are
being provided, what is the expectation of the customer and what type of services
are provided to him or her. The Barclays bank should focus on the reliability
issues that may overcome by the training of the employees. Some customers are
dissatisfied with the issue of waiting time for transaction with the bank. Some are not
happy with the information they get. The bank should focus on the communication
with their customer to increase the satisfaction and expectation of their customers.
Also the bank can connect their customers to the database system to contact from
50

time to time to know about the assessments of the services been provided to
them if they are satisfying and what to do for improvements.
(ii) The Barclays marketing manager should make sure that what are applicable of all
components in a service quality program are being strictly followed and
implemented effectively. Assurances, Reliability, Empathy, Tangibles, responsiveness
and customer satisfaction are all equally important. Marketing managers should not only
focus on the bank objectives of profits and gains, but must also look into the needs of the
customers as well. As a matter of fact, the management should recommend extensive
customer care and service training program for all the frontlines and tellers. In this
way it would fortify the bank’s core competency in customer satisfaction. The results of
this study has shown that SERVQUAL Model is still the effective model of
measuring customer satisfaction in banking industry. Managers from various banks
also should continuously measure and improve the level of customer satisfaction
using the SERVQUAL Model in order to maintain competitiveness in the market
place.
(iii) For the management of the Barclays they should look into the customer claims like
shortage of branches and ATMs machines in a positive way of success and
improving their services toward their customer by implementing and working on all
needs and wants of customers. What the customers claim is in order to maintain, win and
retain of their customer’s loyalty. This is because market perception and customer
expectation can change rapidly from time to time, for example from long queue in the
front desk up to now is the internet banking, perhaps there will be a new trend in the
near future.
The researcher of this study finds the impact of service quality over the
customer satisfaction through the analysis. The survey findings indicate about the
overall satisfaction of the bank. From the data collected the study found that the
positive service quality can increase a satisfaction of customer group which effects
the overall satisfaction of the organization. The customers of Barclays bank are satisfied
with the service they are provided. The customers agreed to recommend the bank to
51

others. This study has shown that the service quality can affect the overall customer
satisfaction. So the service quality can differentiate a firm form the others. Services
quality can influence customer satisfaction. From the overall findings the author
found that the better service attracts the customer, and can decrease if the service
does not satisfy the expectations. To maintain a very high satisfied customer group the
business firm should focus more on customer service.
5.3 Suggestion for Future Study
For the future study it could be better for the user to identify the specific by using the
SERVIQUA Model. The researcher can identify the services attributes; internet
banking adaptation, Mobile banking like M-Pesa, Airtel Money or other electronic
company. For a future study it is advisable to focus on how different socio
demography can impact the service quality dimension.
52

REFERENCES
Aborampah Ameah Mensah 2010, Customer Satisfaction in Banking Industry: a
comparative study between Ghana and Spain
Aleksandra PisnikKorda Boris Snoj Development, Validity and Reliability of Perceived
Service Quality in Retail Banking and its Relationship WithPerceived Value and
Customer Satisfaction
Almossawi M (2001). Bank selection criteria employed by college students in Bahrain:
an empirical analysis. Int. J. Bank. Mark. 19(3): 115-125.
Anderson, Eugene W., ClaesFornell, and Donald R. Lehmann (1994), "Customer
Satisfaction, Market Share, and Profitability: Findings from Sweden," Journal of
Marketing, 58 (3), 53-66.
Armstrong and kothler Principles of Marketing 2011
Bank of Abyssinia S.C Strategic Planning and Organizational Transformation
Consolidated Diagnostic Report: August 2015 Unpublished
Beliyu, Girma(2012) Title, Quality of Service Delivery and its Impact on Customer
Satisfaction in Four Selected Commercial Banks of Addis Ababa.
Bitner, M.J. (1990). Evaluating service encounters:the effect of physical surroundings
and employee responses. Journal of Marketing, 54, April, 69-82.
Charlene PlegerBebko, Service intangibility and its impact on consumer expectation of
service quality. Journal of service marketing vol 14 no.1 2000 pp 9-26
Cronin, J.J. Jr and Taylor, S.A. (2004), “Measuringservice quality: a re-examination and
extension”, Journal of Marketing,
53

Deborah Mamo, Measuring Service Quality and Customer Satisfaction in United Bank
S.C, 2014
Dr.RamNaresh Roy: A modern approach to operation management 2005
Dr. Sultan A Tarawneh Vol.6, No.16, 2014 Marketing for Service Quality - Contractors'
Perception: UAE Case Study European Journal of Business and Management
Clow k and kurtz D.(2003) service marketing USA Atomic Dog Publishing
Gronroos, C. (1984). A Service Quality Model and Its Marketing Implications. European
Journal of Marketing, 18(4), pp. 36-44.
Gronroos, C. (2001), “The perceived service qualityconcept – Managing Service
Quality, Vol.11 No. 3, and Bank of Abyssinia
Haile Yeshanew, Assessment of service quality in the Banking Sector: A Case Study of
Commercial Bank of Ethiopia
HosseinGazora*, BabakNematia, Amir Ehsania and KianoushNazariAmelehb Analyzing
effects of service encounter quality on customer satisfaction in banking industry
2012 Growing Science Ltd 2012
H.VasanthaKumari Customer Perception of Services Quality in The Retail Banking
Sector European Journal of Business and ManagementN 2222-2839 (Online) Vol
3, No.3 299
Ken Irons, 1997 The marketing of Service: A total approach to Achieving Competitive
Advantage, Journal of Marketing
Lehtinen, J.R. and Lehtinen, U. (1982), Service quality: a study of quality dimensions,
unpublished Working Paper, Service Management Institute, Helsinki.
LukmaanOsei-MensahBonsu Gertrude AduMensah, an examination of customer
evaluation of banking service quality in Ghana banking industry.2013
54

Lovelock and Wirtz 2004 Service Marketing U.S.A Pearson prentice-Hall
Lovelock and wirtz 2011 Services Marketing: People,Technology, Strategy (7th Edition)
7th Edition 2011
Lovelock, Christopher H. And JochenWirtz.— Services marketing : people, technology,
strategy 6th ed.2007
MesaySataShanka Bank Service Quality, Customer Satisfaction and Loyalty in
Ethiopian Banking Sector Journal of Business Administration and Management
Sciences Research Vol.1(1), pp. 001-009, December, 2012
Oliver, R.L. (1997). Satisfaction: A behavioural perspective on the consumer. New
York, NY: Irwin McGraw-Hill.
Oliver R.L.(2010) Satisfaction: A Behavioral Perspective on the Consumer 2nd Edition
Parasuraman, A. Berry, L. and Zeithaml, V.A. (1985)“A conceptual model of service
quality and its implication for future research,” Journal of Marketing, Vol.49,
No.4, pp.41-50.
Parasuraman, A., Zeithaml, V. A. and Berry, L. (1988). SERVQUAL: A Multiple- Item
Scale for Measuring Consumer Perceptions of Service Quality. Journal of
Retailing, 64, spring, pp.12-40.
Phillip kothler(2000) Marketing Management, New jersey 07458, U.S.A,Prentice Hall,
Inc Reid and sandersOperations Management an IntegratedApproach Fourth
Edition
S.anilkumar and n Suresh, Operation Management 2009
TizazuKassa, The Effect of Customer Service Quality on Customer Satisfaction in
Selected Private Banks(Addis Ababa)
55

Tse, D.K. and Wilton, P.C. (1998), “Models of consumer satisfaction formation: an
extension”, Journal of Marketing Research, Vol. 25, May, pp. 204-13.
ViririPiason, MuzividziDonnelie, Chinoda Tough, MarufuEveristo, MuzuwaTichaona Si
gnificance of Service Quality and Customer Satisfaction InZimbambwe’s
Banking Sector. European Journal of Business and Management Vol.5, No.13,
2013
Zeithaml, V.A., &Bitner M. J. (2000). Services Marketing (2nd ed.). New
York :McGrawHill. Inc.
Zeithmal V. And Bitner M.(2004) Service Marketing 7west patal Nagar, New Delhi
Zeithaml and Bitner 2013 service marketing 6th edition, integrating customer focus
across the
firm.
56

QUESTIONNAIRE
57

58
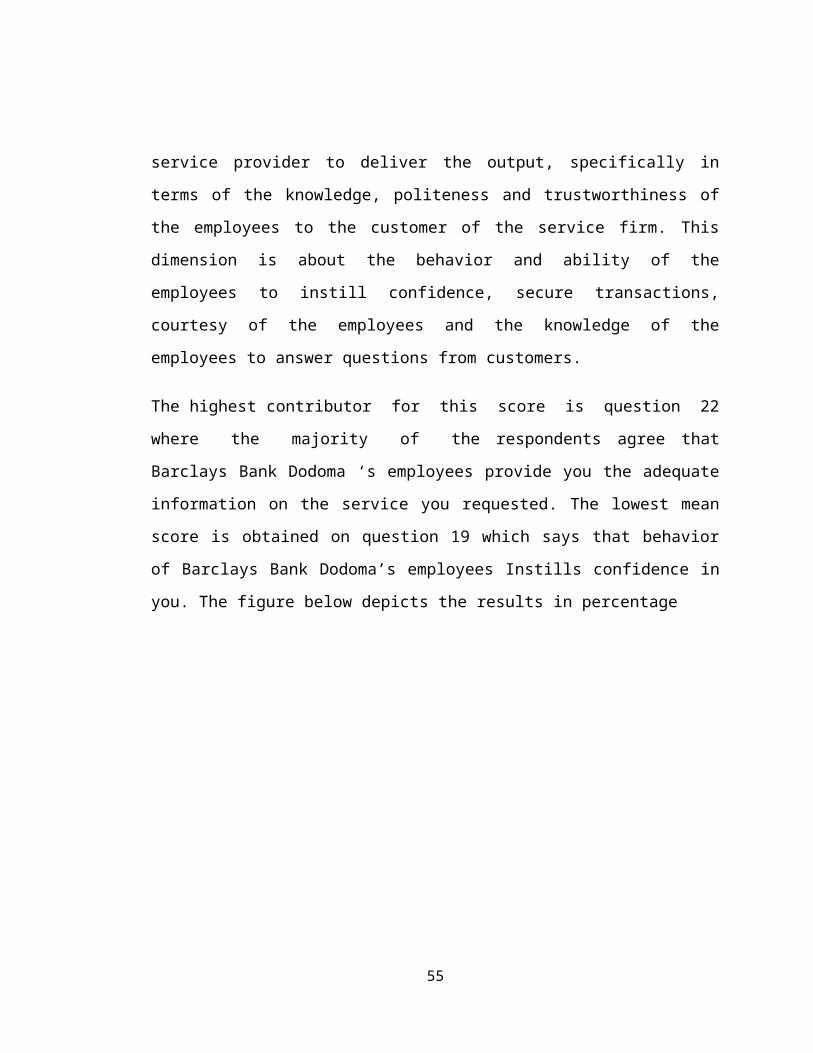
59

60


![Kiminad A. Mamo arXiv:1205.1797v2 [hep-th] 17 Sep 2012 quark … · 2018. 11. 12. · Kiminad A. Mamo Department of Physics, University of Illinois, Chicago, IL 60607-7059, USA E-mail:](https://static.fdocuments.in/doc/165x107/6101ee10f554481c3e28e4d3/kiminad-a-mamo-arxiv12051797v2-hep-th-17-sep-2012-quark-2018-11-12-kiminad.jpg)