CERT TRAC DOC... · CERT Comité d'évaluation des ressources transfrontalières TRAC Transboundary...
64
CERT Comité d'évaluation des ressources transfrontalières TRAC Transboundary Resources Assessment Committee Document de référence 2018/xx Reference Document 2018/xx Ne pas citer sans autorisation des auteurs Not to be cited without permission of the authors Ce document est disponible sur l’Internet à : This document is available on the Internet at : http://www.bio.gc.ca/info/intercol/index-en.php Stock Assessment of Georges Bank Yellowtail Flounder for 2018 Christopher M. Legault 1 and Quinn M. McCurdy 2 1 National Marine Fisheries Service Northeast Fisheries Science Center 166 Water Street Woods Hole, MA, 02543 USA 2 Fisheries and Oceans Canada St Andrews Biological Station 531 Brandy Cove Road St. Andrews, NB E5B 2L9 Canada
Transcript of CERT TRAC DOC... · CERT Comité d'évaluation des ressources transfrontalières TRAC Transboundary...

CERT
Comité d'évaluation des ressources transfrontalières
TRAC
Transboundary Resources Assessment Committee
Document de référence 2018/xx Reference Document 2018/xx
Ne pas citer sans autorisation des auteurs
Not to be cited without permission of the authors
Ce document est disponible sur l’Internet à : This document is available on the Internet at : http://www.bio.gc.ca/info/intercol/index-en.php
Stock Assessment of Georges Bank Yellowtail Flounder for 2018
Christopher M. Legault1 and Quinn M. McCurdy2
1 National Marine Fisheries Service Northeast Fisheries Science Center
166 Water Street Woods Hole, MA, 02543 USA
2 Fisheries and Oceans Canada St Andrews Biological Station
531 Brandy Cove Road St. Andrews, NB E5B 2L9 Canada

iii
TABLE OF CONTENTS
ABSTRACT ............................................................................................................................... IV
RÉSUMÉ ................................................................................................................................... V
INTRODUCTION ........................................................................................................................ 1
THE FISHERIES ......................................................................................................................... 1
UNITED STATES ................................................................................................................... 1
CANADA ................................................................................................................................ 2
LENGTH AND AGE COMPOSITION ..................................................................................... 2
ABUNDANCE INDICES .............................................................................................................. 3
EMPIRICAL APPROACH ............................................................................................................ 4
MANAGEMENT CONSIDERATIONS ......................................................................................... 6
LITERATURE CITED .................................................................................................................. 6
TABLES ...................................................................................................................................... 9
FIGURES .................................................................................................................................. 23
APPENDIX ................................................................................................................................ 55
iv
ABSTRACT
The combined Canada/US Yellowtail Flounder catch in 2017 was 95 mt, with neither country filling its portion of the quota. For only the second time, discards were greater than landings. Despite the low catch, all three bottom trawl surveys declined, two of the surveys to the lowest value in the time series.
The empirical approach recommended at the 2014 Diagnostic Benchmark and modified during last year’s TRAC was applied in this year’s assessment update. The three recent bottom trawl surveys were scaled to absolute biomass estimates, averaged, and an exploitation rate applied to generate catch advice for the following year. Last year, the TRAC external reviewers and science members recommended an exploitation rate of 2% to 6% for catch advice. Applying this range of exploitation rate to this year’s updated surveys results in catch advice of 23 mt to 68 mt for 2019. Last year, the broader TRAC considered the full range of exploitation rates from the 2014 Diagnostic and Empirical Benchmark, 2% to 16%, to still be informative. This range of exploitation rate applied to this year’s surveys results in 23 mt to 180 mt. There are no indications in the data that support increasing the catch advice for 2019 from the 300 mt quota for 2018. Catch advice of 300 mt in 2019 has an associated exploitation rate of 27%. This year the TRAC recommended 6% as an upper bound for the exploitation rate, which results in catch advice of 68 mt for 2019.

v
RÉSUMÉ
Will be translated later.

1
INTRODUCTION
The Georges Bank Yellowtail Flounder (Limanda ferruginea) stock is a transboundary resource in Canadian and US jurisdictions. The management unit currently recognized by Canada and the US for the Georges Bank stock includes the entire bank east of the Great South Channel to the Northeast Peak, encompassing Canadian fisheries statistical areas 5Zj, 5Zm, 5Zn and 5Zh (Figure 1a) and US statistical reporting areas 522, 525, 551, 552, 561 and 562 (Figure 1b). This paper updates the last stock assessment of Yellowtail Flounder on Georges Bank, completed by Canada and the US (Legault and McCurdy 2017), taking into account advice from the 2014 Diagnostic and Empirical Approach Benchmark (hereafter 2014 Diagnostic Benchmark; O’Brien and Clark 2014). During the June 2014 Transboundary Resources Assessment Committee (TRAC) assessment, it was decided to no longer use the virtual population analysis model which had previously provided stock condition and catch advice. This assessment follows that decision and does not provide any stock assessment model results. The 2014 Diagnostic Benchmark recommended an empirical approach to providing catch advice based on the three bottom trawl surveys and an assumed exploitation rate.
Last year, the empirical approach was modified to use wing width instead of door width when expanding the surveys catch per tow to population estimates and to change the catchability of all three surveys from the value of 0.37 derived from the literature to an experimentally derived value of 0.31. The TRAC external reviewers and science members recommended an exploitation rate between 2% and 6% for catch advice, which resulted in 62 mt to 187 mt for 2018. The Transboundary Management Guidance Committee (TMGC) selected the combined US-Canada catch quota for 2018 to be 300 mt.
THE FISHERIES
UNITED STATES
The principle fishing gear used in the US fishery to catch Yellowtail Flounder is the otter trawl, accounting for more than 95% of the total US landings in recent years, although scallop dredges have accounted for some historical landings. Recreational fishing for Yellowtail Flounder is negligible.
Landings of Yellowtail Flounder from Georges Bank by the US fishery during 1994-2017 were derived from the trip-based allocation algorithm (GARM 2007; Legault et al. 2008; Palmer 2008; Wigley et al. 2007a). US landings have been limited by quotas in recent years. Total US Yellowtail Flounder landings (excluding discards) for the 2017 fishery were 35 mt (Table 1 and Figure 2a-b).
US discarded catch for years 1994-2017 was estimated using the Standardized Bycatch Reporting Methodology (SBRM) as recommended in the GARM III Data meeting (GARM 2007, Wigley et al. 2007b). Observed ratios of discards of Yellowtail Flounder to kept of all species for large mesh otter trawl, small mesh otter trawl, and scallop dredge were applied to the total landings by these gears and by half-year (Table 2). Large and small mesh otter trawl gears were separated at 5.5 inch (14 cm) cod-end mesh size. Total discards of Yellowtail Flounder in the US were 57 mt in 2017.
The total US catch of Georges Bank Yellowtail Flounder in 2017, including discards, was 92 mt.
The US Georges Bank Yellowtail Flounder quota for fishing year 2017 (1 May 2017 to 30 April 2018 for groundfish and 1 March 2016 to 31 March 2018 for scallops due to a change in the fishing year) was set at 207 mt. Monitoring of the US catches relative to the quota was based on

2
Vessel Monitoring Systems (VMS) and a call-in system for both landings and discards. Reporting on the Regional Office webpage (NOAA Fisheries Northeast Multispecies (Groundfish) Monitoring Reports and NOAA Fisheries Sea Scallop Fishery Monitoring) indicates the US groundfish fishery caught 19.3% of its 162.6 mt sub-quota and the scallop fleet caught 164.3% of its 32 mt sub-quota for their 2017 fishing years. Including the other minor fisheries, the US caught 84.4 mt (41%) of the 207 mt quota (D. Caless, GARFO, pers. comm.)
No adjustments have been made to US catch of Georges Bank Yellowtail Flounder to account for catch misreporting due to lack of information. Amounts of misreported fish caught in the Carlos Rafael case are not available and Palmer (2017) did not indicate strong stock misreporting based on VMS locations during fishing activity in most years.
CANADA
Canadian fishermen initiated a directed fishery for Yellowtail Flounder on Georges Bank in 1993, but landings have been less than 100 mt every year since 2004, and less than 3 mt in the last five years. Since 2004, with the exception of 2011 and 2012, there has been no directed Canadian Yellowtail Flounder fishery (the fishery is not permitted to target Yellowtail Flounder, nor use gear appropriate for targeting this species); the Canadian quota has been reserved to cover bycatch in the commercial groundfish and scallop fisheries. From 2004-2011, and during 2013-2017, most of the reported Yellowtail Flounder landings were from trips directed for Haddock.
The Canadian offshore scallop fishery is the only source of Canadian Yellowtail Flounder discards on Georges Bank. Discards are estimated from at-sea observer deployments using the methodology documented in Van Eeckhaute et al. (2005). Since August 2004, there has been routine observer coverage on vessels in the Canadian scallop fishery on Georges Bank. Discards for the years 2004-2017 were obtained by estimating a monthly prorated discard rate (kg/(hr*meters)), using a 3-month moving-average calculation to account for the seasonal pattern in bycatch rate, applied to a monthly standardized effort (Table 3) (Sameoto et al. 2013; Van Eeckhaute et al. 2011). The result of these calculations for 2017 is a discard estimate of 2 mt, the lowest in the time series (Table 1).
For 2017, the total Canadian catch, including discards, was 3 mt, which is 3% of the 2017 quota of 93 mt.
LENGTH AND AGE COMPOSITION
Despite low landings, the level of US port sampling continued to be proportionally strong in 2017, with 1,046 length measurements available, resulting in 3,000 lengths per 100 mt of landings (Table 4). The port samples also provided 229 age measurements for use in age-length keys. This level of sampling has generally resulted in high precision (i.e. low coefficients of variation) for the US landings at age from 1994-2017 (Table 5).
In 2017, no samples were collected from the <1 mt of Canadian landings. The Canadian landings at age were assumed to follow the same proportions at age as the US landings and to have the same weights at age as the US landings.
The US discard length frequencies were generated from 1,460 length measurements provided by the Northeast Fisheries Observer Program, expanded to the total weight of discards by gear type and half year.
The size composition of Yellowtail Flounder discards in the Canadian offshore scallop fishery was estimated by half year using length measurements obtained from 18 observed trips in 2017. These were prorated to the total estimated bycatch at size using the corresponding half

3
year length-weight relationship and the estimated half year bycatch (mt) calculated using the methods of Stone and Gavaris (2005).
The low amount of landings and discards by both countries makes comparisons of length distributions uninformative.
Percent agreement on scale ages by the US readers continues to be high (>85% for most studies) with no indication of bias (Results of all QA/QC Exercises for Yellowtail Flounder, Limanda ferruginea).
For the US fishery, sample length frequencies were expanded to total landings at size using the ratio of landings to sample weight (predicted from length-weight relationships by season; Lux 1969), and apportioned to age using pooled-sex age-length keys in half year groups. Landings were converted by market category and half year, while discards were converted by gear and half-year. The age-length keys for the US landings used only age samples from US port samples, while age-length keys for the US discards used age samples from US surveys and port samples.
No scale samples were available for the Canadian fishery in 2017. Therefore, the Canadian discards at length were converted to catch at age using the US age-length keys by half-year.
Since the mid 1990s, ages 2-4 have constituted most of the exploited population, with very low catches of age 1 fish due to the implementation of larger mesh (increased from 5.5 to 6 inches in May 1994) in the cod-end of US commercial trawl gear (Table 6 and Figure 3).
The fishery mean weights at age for Canadian and US landings and discards were derived using the applicable age-length keys, length frequencies, and length-weight relationships. The combined fishery weights at age were calculated from Canadian and US landings and discards, weighted by the respective catch at age (Table 7 and Figure 4). Low catches make the recent estimates of weights at age more uncertain than earlier years when catches were much larger.
ABUNDANCE INDICES
Research bottom trawl surveys are conducted annually on Georges Bank by Fisheries and Oceans Canada (DFO) in February and by the US National Marine Fisheries Service (NMFS) Northeast Fisheries Science Center (NEFSC) in April (denoted spring) and October (denoted fall). Both agencies use a stratified random design, though different strata boundaries are used (Figure 5).
The NMFS spring and fall bottom trawl (strata 13-21) and DFO bottom trawl (strata 5Z1-5Z4) survey catches were used to estimate relative stock biomass and relative abundance at age for Georges Bank Yellowtail Flounder. Conversion coefficients, which adjust for survey door, vessel, and net changes in NMFS groundfish surveys (1.22 for BMV oval doors, 0.85 for the former NOAA ship Delaware II relative to the former NOAA ship Albatross IV, and 1.76 for the Yankee 41 net; Rago et al. 1994; Byrne and Forrester 1991) were applied to the catch of each tow for years 1973-2008.
Beginning in 2009, the NMFS bottom trawl surveys were conducted with a new vessel, the NOAA ship Henry B. Bigelow, which uses a different net and protocols from the previous survey vessel. Conversion coefficients by length have been estimated for Yellowtail Flounder (Brooks et al. 2010) and were applied in this assessment when examining the entire survey time series, but not in the empirical approach.
The 2017 NMFS fall survey was completed by NOAA ship Pisces, due to the unavailability of the regular vessel, NOAA ship Henry B. Bigelow. The Pisces and the Henry B. Bigelow are

4
sister ships, so no conversion factors were necessary. In 2018, the DFO survey was conducted by the Mersey Venture also due to unavailability of the usual survey vessels, the CCGS Alfred Needler and the Teleost. The Mersey Venture is a sister ship to the Teleost and no conversion factor was applied to account for this boat change. On May 29, 2018 a TRAC inter-sessional conference call was held to discuss the NMFS fall 2017 and DFO 2018 survey delays related to the use of different vessels. The consensus decisions were to accept both surveys as valid indicators of population trends because timing was within previous survey times (Figure 6) and to assume the replacement ships had the same catchability as the standard ships. Due to delays caused by the change of vessel in fall 2017 and a combination of weather and mechanical issues in spring 2018, fewer valid tows were made in the most recent NMFS surveys compared to recent years (Table 8, Figure 7a-b).
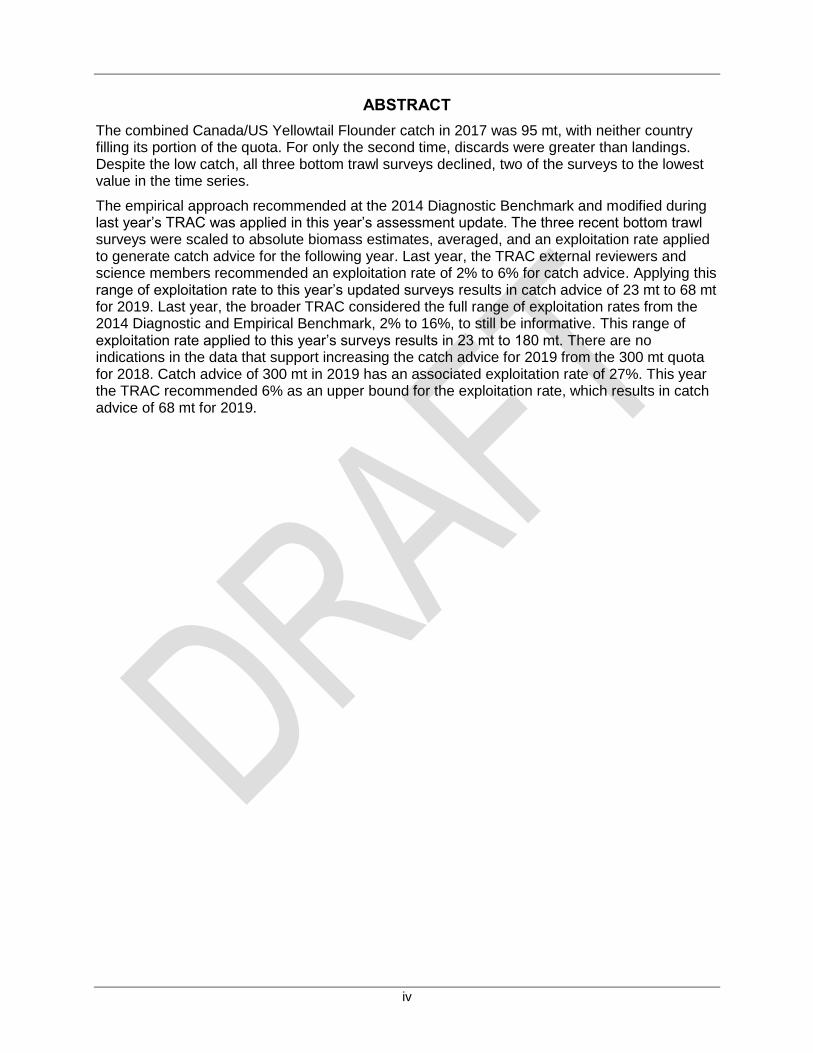
Trends in Yellowtail Flounder biomass indices from the three surveys track each other well over the past three decades, with the exception of the DFO survey in 2008 and 2009, which were influenced by single large tows (Table 9a-c; Figures 8-9). The 2018 DFO biomass is the lowest in the 32 year time series. The 2018 NMFS spring biomass is the lowest in the 51 year time series. The 2017 NMFS fall biomass is the second lowest in the 55 year time series. These survey biomass levels are below those observed in the mid-1990s when the stock was declared collapsed (Stone et al. 2004). Coefficients of variation for the survey biomass estimates have increased over time, with large spikes associated with the 2008 and 2009 DFO surveys due to the large catch in single tows (Figure 10).
The spatial distribution of catches (weight/tow) for the most recent year compared with the previous ten year average for the three groundfish surveys show that Yellowtail Flounder distribution on Georges Bank in the most recent year has been consistent relative to the previous ten years (Figure 11a-b). Most of the DFO survey biomass of Yellowtail Flounder has occurred in strata 5Z2 and 5Z4, with the notable exception of 2008 and 2009 when almost the entire Canadian survey catch occurred in just one or two tows in stratum 5Z1 (Figure 12a). NMFS bottom trawl surveys have been dominated by stratum 16 since the mid 1990s (Figure 12b-c). Note the NMFS spring 2018 survey caught only two fish, one in stratum 13 and the other in stratum 16.
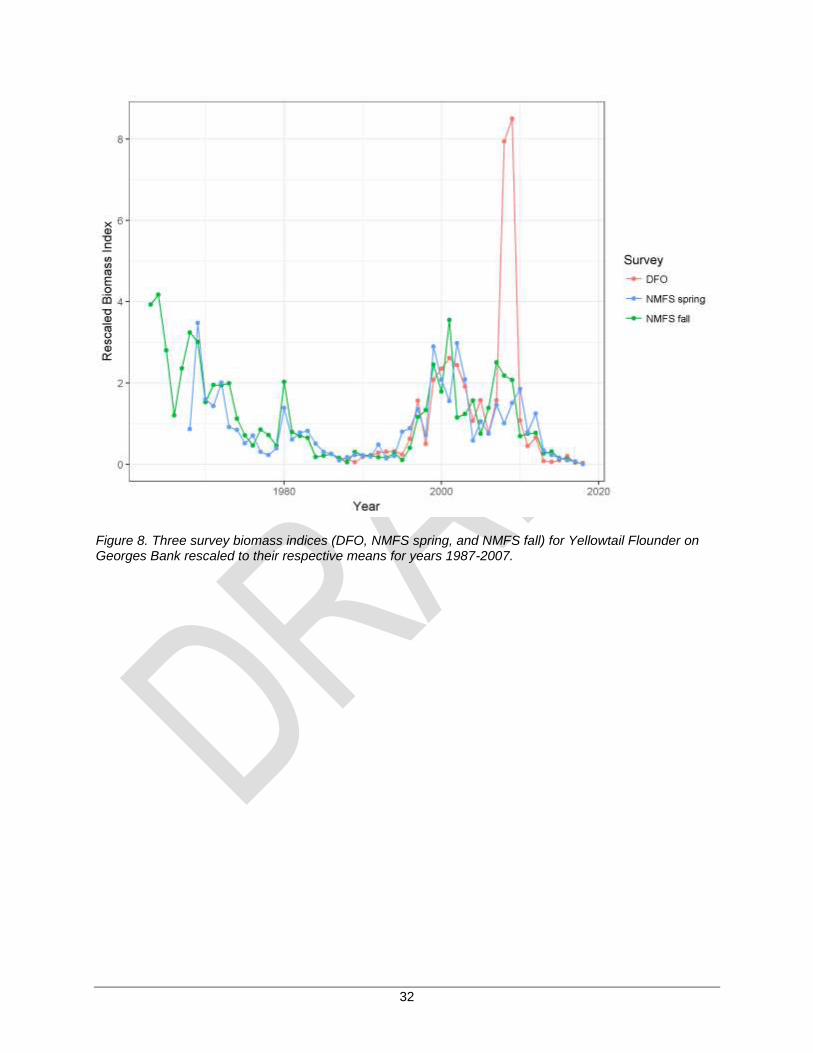
Age-structured indices of abundance for NMFS spring and fall surveys were derived using survey specific age-length keys (Table 9a-c; Figure 13a-c). There is some indication of cohort tracking in all three of the bottom trawl surveys (Figure 14a-c). Even though each index is noisy, the age specific trends track relatively well among the three surveys (Figure 15).
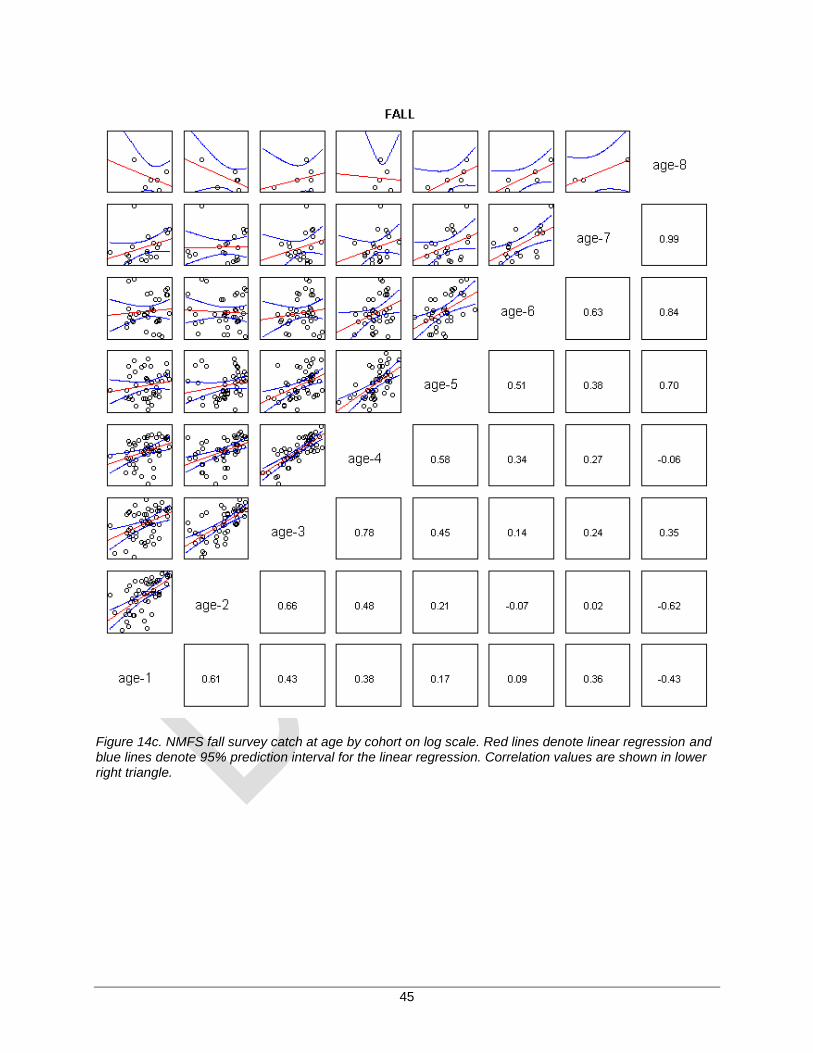
The condition factor (Fulton’s K) of Yellowtail Flounder has declined during the available time series in all three surveys (Figure 16a-b). Note the low catch of Yellowtail Flounder in the 2018 NMFS spring survey makes interpretation of Fulton’s K difficult for that year.
Relative fishing mortality (fishery catch biomass/survey biomass, scaled to the mean for 1987-2007) was quite variable but followed a similar trend for all three surveys, with a sharp decline to low levels since 1995 (Figure 17). In contrast, time series of total mortality (Z) estimated from the three bottom trawl surveys using the method of Sinclair (2001) do not show a similar decline since 1995 (Figure 18).
EMPIRICAL APPROACH
The 2014 Diagnostic Benchmark recommended an empirical approach be considered for catch advice. The three bottom trawl surveys are used to create a model-free estimate of population abundance. For the two NMFS surveys, the Henry B. Bigelow data are used directly (i.e. un-calibrated values) in these calculations to avoid the complexities that arise due to calibration

5
with the Albatross IV (Table 10). The original empirical approach used door width when computing the area of a tow, catchability of the net from the literature, and a range of 2% to 16% for the exploitation rate to apply for catch advice from a group decision based on a number of per-recruit calculations and discussion about resulting catch estimates. The literature value for catchability was derived in working paper 13 of the 2014 Diagnostic Benchmark as the mean of the value 0.22 in Harden Jones et al. (1977) and four values of 0.33, 0.42, 0.43, and 0.45 in Somerton et al. (2007). The Harden Jones et al. (1977) study was conducted with English plaice in the North Sea using a Granton otter trawl. The Somerton et al. (2007) study was conducted with four flatfish species (arrowtooth flounder, flathead sole, rex sole, and Dover sole) in the Gulf of Alaska using a Poly nor’eastern survey trawl. The survey biomass estimates from DFO and the NMFS spring survey in year t and the NMFS fall survey in year t-1 are averaged to form the estimate of population biomass in year t. Multiplying the average biomass by an exploitation rate results in the catch advice for year t+1.
A TRAC intersessional conference call on June 26, 2017 reviewed three working papers that addressed survey catchability and tow area. Two of the working papers estimated survey catchability based on a twin trawl experiment conducted in 2015 and 2016 (Miller et al. 2017, Richardson et al. 2017). One of the twin trawl nets used the NMFS standard rockhopper sweep while the other net used chain gear to prevent flounders from escaping under the sweep. After discussing the merits of both approaches, a practical consensus was achieved that set survey catchability to 0.31 based on the statistically best fitting models that incorporated length effects and diel effects. The other working paper described a bridle study experiment that examined the effect of different lengths of ground gear connecting the net to the doors to determine if herding of flatfish was occurring (Politis and Miller 2017). The results of this study were not definitive, but indicated that herding was probably not a strong feature of the NMFS bottom trawl. This led to the consensus decision to use wing width instead of door width when calculating the area of a survey tow. Both decisions were applied to all three surveys. The wing width of the DFO survey generated a fair amount of discussion during the 2017 TRAC meeting. The final decision was to use the value of 12.5 m for wing width of the DFO survey based on the Clark (1993) report. The average biomass under these new conditions is approximately three times the average biomass computed from the 2014 Diagnostic Benchmark settings, but the average biomass trend is the same. The exploitation rate to apply to the average biomass to generate catch advice also generated a lot of discussion during the 2017 TRAC meeting. The TRAC external reviewers and science members recommended using a range of 2% - 6% for the exploitation rate based on historical performance of the approach. The broader TRAC considered the full range of exploitation rates from the 2014 Diagnostic and Empirical Benchmark, 2% to 16%, to still be informative.
Applying the wing spread and survey catchability decisions from last year’s TRAC (Table 11) to the updated surveys results in an average biomass of 1,126 mt in 2018 (Table 12). An exploitation rate of 2% to 6% results in catch advice for 2019 of 23 to 68 mt. Historical exploitation rates for the quota and catch averaged 8% and 2%, respectively (Table 13). The 2019 catch advice for the full range of exploitation rates from the 2014 TRAC ranged from 23 mt to 180 mt (Table 14). Maintaining the current quota of 300 mt in 2019 has an associated exploitation rate of 27%.
The empirical approach as described above consists of point estimates for all parameters. There are a number of uncertain elements that can be incorporated in a Monte Carlo evaluation to examine the uncertainty in the catch advice. The surveys have coefficients of variation that are reported each year, the experiment that estimated the new survey catchability of 0.31 had an estimate of uncertainty reported, there may be untrawlable regions on Georges Bank where Yellowtail Flounder are not found (meaning the survey area is less than the nominal value used

6
in the calculations), there may be some herding of Yellowtail Flounder, and the chainsweep may not be 100% efficient at capturing Yellowtail Flounder. Each of these uncertainties can be examined one at a time (Figure 19) and all of them together (Figure 20) for a given exploitation rate (6% was selected for these figures). Examining the factors one at a time shows the low uncertainty of survey area (uniform 0.95 – 1.00), tow area (uniform 1.0 – 1.2, 1.2 means 20% increase in tow area due to herding), and chainsweep efficiency (90%-100% catchability) relative to the higher uncertainty of the chain to rockhopper survey catchability estimate (lognormal with CV = 0.65), and the highest uncertainty associated with the survey catch per tow. Combining the results indicates that despite these uncertainties, there is a strong indication that catch advice should have decreased during this time period because there is little overlap between the distributions early in the time series and those late in the time series.
MANAGEMENT CONSIDERATIONS
During the 2014 Diagnostic Benchmark, considerations were provided as reasons to decrease or to maintain or increase the quota. The assessment findings this year support reasons to both decrease the quota and to maintain the quota for 2019. Last year’s catch was 32% of the quota and the relative F continues to be low, which support maintaining the quota. All three of the surveys declined last year (two of the surveys to the lowest value in the time series, the other to the second lowest in its time series), recent recruitment continues to be below average, and fish condition (i.e., Fulton’s K) continues to be low relative to the available time series, which support decreasing the quota.
During the 2016 TRAC meeting, a reviewer asked whether times series of recruits per spawning stock biomass had been examined using only data from the surveys. The request was premised on the concern that changes in recruits per spawning stock biomass could be masking important trends in recruitment. For example, if recruits per spawning stock biomass increased over time, it could result in recruitment staying relatively high while spawning stock biomass declined, which would be of biological concern because this pattern could not continue indefinitely. Alternatively, if recruits per spawning stock biomass declined at low spawning stock biomass, this could be an indication of depensation in the stock-recruitment relationship, which would be concerning for the ability of the stock to rebuild even under no fishing. For each of the three surveys, both age 1 and age 2 were used for recruitment and appropriately lagged relative to total biomass from that survey to create a proxy for the recruits per spawning stock biomass. Age 2 was examined because the age 1 survey values contained many zeros. The time series of recruits per survey biomass were variable without strong trend but have been low in recent years in all cases (Figure 21). There is an indication of depensation in recent years because the recent recruits per biomass are low relative to earlier recruits per biomass at similar biomasses (Figure 22). This could have strong implications for the (in)ability of the stock to rebuild even under no fishing.
LITERATURE CITED
Brooks, E.N., T.J. Miller, C.M. Legault, L. O’Brien, K.J Clark, S. Gavaris, and L. Van Eeckhaute. 2010. Determining Length-based Calibration Factors for Cod, Haddock, and Yellowtail Flounder. TRAC Ref. Doc. 2010/08.
Byrne, C.J., and J.R.S. Forrester. 1991. Relative Fishing Power of Two Types of Trawl Doors. NEFSC Stock Assessment Workshop (SAW 12). 8 p.

7
Clark, D.S. 1993. The influence of depth and bottom type on area swept by groundtrawl, and consequences for survey indices and population estimates. DFO Atlantic Fisheries Research Document 93/40. 15 p.
GARM (Groundfish Assessment Review Meeting). 2007. Report of the Groundfish Assessment Review Meeting (GARM) Part 1. Data Methods. R. O’Boyle [chair]. Available at http://www.nefsc.noaa.gov/nefsc/saw/.
Harden Jones, F.R., A.R. Margetts, M.G. Walker, and G.P. Arnold. 1977. The Efficiency of the Granton Otter Trawl Determined by Sector-scanning Sonar and Acoustic Transponding tags. Rapp. P-v. Reun. Cons. Explor. Mer 170:45−51.
Legault, C.M. and Q.M. McCurdy. 2017. Stock Assessment of Georges Bank Yellowtail Flounder for 2017. TRAC Ref. Doc. 2017/??. 59 p. (not yet available)
Legault C.M., M. Palmer, and S. Wigley. 2008. Uncertainty in Landings Allocation Algorithm at Stock Level is Insignificant. GARM III Biological Reference Points Meeting. WP 4.6.
Lux, F.E. 1969. Length-weight Relationships of Six New England Flatfishes. Trans. Am. Fish. Soc. 98(4): 617-621.
Miller, T.J., M. Martin, P. Politis, C.M. Legault, and J. Blaylock. 2017. Some statistical approaches to combine paired observations of chain sweep and rockhopper gear and catches from NEFSC and DFO trawl surveys in estimating Georges Bank yellowtail flounder biomass. TRAC Ref. Doc. 2017/??. 36 p. (not yet available)
O’Brien, L., and K. Clark. 2014. Proceedings of the Transboundary Resources Assessment Committee for Georges Bank Yellowtail Flounder Diagnostic and Empirical Approach Benchmark. TRAC Proc. Ser. 2014/01. 55 p.
Palmer, M. 2008. A Method to Apportion Landings with Unknown Area, Month and Unspecified Market Categories Among Landings with Similar Region and Fleet Characteristics. GARM III Biological Reference Points Meeting. WP 4.4. 9 p.
Palmer, M.C. 2017. Vessel Trip Reports Catch-area Reporting Errors: Potential Impacts on the Monitoring and Management of the Northeast United States Groundfish Resource. NFSC Ref. Doc. 17-02: 53p
Politis, P.J. and T.J. Miller. 2017. Bridle herding efficiency of a survey bottom trawl with different bridle configurations. TRAC Ref. Doc. 2017/??. 33 p. (not yet available)
Rago, P., W. Gabriel, and M. Lambert. 1994. Georges Bank Yellowtail Flounder. NEFSC Ref. Doc. 94-20.
Richardson, D., J. Hoey, J. Manderson, M. Martin, and C. Roebuck. 2017. Empirical estimates of maximum catchability and minimum biomass of Georges Bank yellowtail flounder on the NEFSC bottom trawl survey. TRAC Ref. Doc. 2017/??. 28 p. (not yet available)
Sameoto, J., B. Hubley, L. Van Eeckhaute, and A. Reeves. 2013. A Review of the Standarization of Effort for the Calculation of Discards of Atlantic Cod, Haddock and Yellowtail Flounder from the 2005 to 2011 Canadian Scallop Fishery on Georges Bank. TRAC. Ref. Doc. 2013/04. 22 p.
Sinclair, A.F. 2001. Natural mortality of cod (Gadus morhua) in the Southern Gulf of St Lawrence. ICES J. Mar. Sci. 58: 1-10.
Somerton, D.A., P.T. Munro, and K.L. Weinberg. 2007. Whole-gear Efficiency of a Benthic Survey Trawl for Flatfish. Fish. Bull. 105: 278-291.

8
Stone, H.H., and S. Gavaris. 2005. An Approach to Estimating the Size and Age Composition of Discarded Yellowtail Flounder from the Canadian Scallop Fishery on Georges Bank, 1973-2003. TRAC Ref. Doc. 2005/05. 10p.
Stone, H.H., S. Gavaris, C.M. Legault, J.D. Neilson, and S.X. Cadrin. 2004. Collapse and Recovery of the Yellowtail Flounder (Limanda ferruginea) Fishery on Georges Bank. J. Sea Res. 51: 261-270.
TMGC (Transboundary Management Guidance Committee). 2002. Development of a Sharing Allocation Proposal for Transboundary Resources of Cod, Haddock and Yellowtail Flounder on Georges Bank. DFO Fisheries Management Regional Report 2002/01. 59 p.
Van Eeckhaute, L., S. Gavaris, and H.H. Stone. 2005. Estimation of Cod, Haddock and Yellowtail Flounder Discards for the Canadian Georges Bank Scallop Fishery from 1960 to 2004. TRAC Ref. Doc. 2005/02. 18p.
Van Eeckhaute, L., Y. Wang, J. Sameoto, and A. Glass. 2011. Discards of Atlantic Cod, Haddock and Yellowtail Flounder from the 2010 Canadian Scallop Fishery on Georges Bank. TRAC Ref. Doc. 2011/05. 14p.
Wigley S.E., P. Hersey, and J.E. Palmer. 2007a. A Description of the Allocation Procedure Applied to the 1994 to Present Commercial Landings Data. GARM III Data Meeting. WP A.1.
Wigley S.E., P.J. Rago, K.A. Sosebee, and D.L. Palka. 2007b. The Analytic Component to the Standardized Bycatch Reporting Methodology Omnibus Amendment: Sampling Design, and Estimation of Precision and Accuracy (2nd Edition). NEFSC Ref. Doc. 07-09. 156 p.

9
TABLES
Table 1. Annual catch (mt) of Georges Bank Yellowtail Flounder.
US US Canada Canada Other Total %
Year Landings Discards Landings Discards Landings Catch discards
1935 300 100 0 0 0 400 25%
1936 300 100 0 0 0 400 25%
1937 300 100 0 0 0 400 25%
1938 300 100 0 0 0 400 25%
1939 375 125 0 0 0 500 25%
1940 600 200 0 0 0 800 25%
1941 900 300 0 0 0 1200 25%
1942 1575 525 0 0 0 2100 25%
1943 1275 425 0 0 0 1700 25%
1944 1725 575 0 0 0 2300 25%
1945 1425 475 0 0 0 1900 25%
1946 900 300 0 0 0 1200 25%
1947 2325 775 0 0 0 3100 25%
1948 5775 1925 0 0 0 7700 25%
1949 7350 2450 0 0 0 9800 25%
1950 3975 1325 0 0 0 5300 25%
1951 4350 1450 0 0 0 5800 25%
1952 3750 1250 0 0 0 5000 25%
1953 2925 975 0 0 0 3900 25%
1954 2925 975 0 0 0 3900 25%
1955 2925 975 0 0 0 3900 25%
1956 1650 550 0 0 0 2200 25%
1957 2325 775 0 0 0 3100 25%
1958 4575 1525 0 0 0 6100 25%
1959 4125 1375 0 0 0 5500 25%
1960 4425 1475 0 0 0 5900 25%
1961 4275 1425 0 0 0 5700 25%
1962 5775 1925 0 0 0 7700 25%
1963 10990 5600 0 0 100 16690 34%
1964 14914 4900 0 0 0 19814 25%
1965 14248 4400 0 0 800 19448 23%
1966 11341 2100 0 0 300 13741 15%
1967 8407 5500 0 0 1400 15307 36%
1968 12799 3600 122 0 1800 18321 20%
1969 15944 2600 327 0 2400 21271 12%
1970 15506 5533 71 0 300 21410 26%
1971 11878 3127 105 0 500 15610 20%
1972 14157 1159 8 515 2200 18039 9%
1973 15899 364 12 378 300 16953 4%
1974 14607 980 5 619 1000 17211 9%
1975 13205 2715 8 722 100 16750 21%
1976 11336 3021 12 619 0 14988 24%
1977 9444 567 44 584 0 10639 11%
1978 4519 1669 69 687 0 6944 34%

10
Table 1. Continued.
US US Canada Canada Other Total %
Year Landings Discards Landings Discards Landings Catch discards
1979 5475 720 19 722 0 6935 21%
1980 6481 382 92 584 0 7539 13%
1981 6182 95 15 687 0 6979 11%
1982 10621 1376 22 502 0 12520 15%
1983 11350 72 106 460 0 11989 4%
1984 5763 28 8 481 0 6280 8%
1985 2477 43 25 722 0 3267 23%
1986 3041 19 57 357 0 3474 11%
1987 2742 233 69 536 0 3580 21%
1988 1866 252 56 584 0 2759 30%
1989 1134 73 40 536 0 1783 34%
1990 2751 818 25 495 0 4089 32%
1991 1784 246 81 454 0 2564 27%
1992 2859 1873 65 502 0 5299 45%
1993 2089 1089 682 440 0 4300 36%
1994 1431 148 2139 440 0 4158 14%
1995 360 43 464 268 0 1135 27%
1996 743 96 472 388 0 1700 28%
1997 888 327 810 438 0 2464 31%
1998 1619 482 1175 708 0 3985 30%
1999 1818 577 1971 597 0 4963 24%
2000 3373 694 2859 415 0 7341 15%
2001 3613 78 2913 815 0 7419 12%
2002 2476 53 2642 493 0 5663 10%
2003 3236 410 2107 809 0 6562 19%
2004 5837 460 96 422 0 6815 13%
2005 3161 414 30 247 0 3852 17%
2006 1196 384 25 452 0 2057 41%
2007 1058 493 17 97 0 1664 35%
2008 937 409 41 112 0 1499 35%
2009 959 759 5 84 0 1806 47%
2010 654 289 17 210 0 1170 43%
2011 904 192 22 53 0 1171 21%
2012 443 188 46 48 0 725 33%
2013 130 49 1 39 0 218 40%
2014 70 74 1 14 0 159 56%
2015 63 41 3 11 0 118 44%
2016 26 7 1 10 0 44 39%
2017 35 57 <1 2 0 95 63%

11
Table 2. Derivation of Georges Bank Yellowtail Flounder US discards (D mt) for 2017 calculated as the product of the ratio estimator (d:k – discard to kept all species on observed trips in a stratum) and total kept (K_all) in each stratum. Coefficient of variation (CV) provided by gear. A dash (-) indicates the value is not reported at that level of half year.
Small Mesh Trawl Half ntrips d:k K_all (mt) D (mt) CV
1 14 0.00011 1213 0 -
2 20 0.00027 1364 0 -
Total 34 - - 1 52%
Large Mesh Trawl Half ntrips d:k K_all (mt) D (mt) CV
1 56 0.00002 3604 0 -
2 52 0.00001 2666 0 -
Total 108 - - 0 39%
Scallop Dredge Half ntrips d:k K_all (mt) D (mt) CV
1 28 0.00260 10236 27 -
2 34 0.00178 16783 30 -
Total 62 - - 56 20%
Table 3. Three month moving-average (ma) discard rate (kg/hm), standardized fishing effort (hm), and discards (mt) of Georges Bank Yellowtail Flounder from the Canadian scallop fishery in 2017 based on n number of observed trips. Note April observed discards and effort were assumed equal to March discards and effort.
Month
n Monthly Prorated
Discards (kg)
Monthly Effort (hm)
3-month ma Discard Rate
(kg/hm) 3-month ma Effort (hm)
ma Discards (mt)
Cum. Annual
Discards (mt)
Jan 2 48 4134 0.012 14254 0 0
Feb 2 45 2367 0.013 14947 0 0
Mar 2 32 3191 0.012 13067 0 1
Apr 0 32 3191 0.015 2584 0 1
May 2 47 1214 0.022 17373 0 1
Jun 1 64 2110 0.030 23540 1 2
Jul 3 110 4115 0.019 19843 0 2
Aug 1 14 3685 0.015 14126 0 2
Sep 1 2 723 0.003 9275 0 2
Oct 2 1 1837 0.002 7222 0 2
Nov 1 2 538 0.001 3315 0 2
Dec 1 6 4494 0.001 2387 0 2

12
Table 4. Port samples used in the estimation of US landings at age for Georges Bank Yellowtail Flounder in 2017.
Landings (metric tons) Number of Lengths Number Lengths /
Half large small Total large small Total of Ages 100 mt
1 17 3 20 402 245 647 199 3214
2 12 2 15 299 100 399 30 2708
Total 29 5 35 701 345 1046 229 3000
Table 5. Coefficient of variation for US landings at age of Georges Bank Yellowtail Flounder by year. A dash (-) indicates fish of that age were not caught in that year.
Year Age 1 Age 2 Age 3 Age 4 Age 5 Age 6+
1994 - 57% 6% 14% 27% 41%
1995 - 27% 11% 13% 22% 40%
1996 - 23% 7% 15% 26% 60%
1997 - 17% 11% 8% 30% 35%
1998 - 64% 31% 16% 36% 30%
1999 97% 21% 9% 25% 33% 34%
2000 - 11% 9% 11% 20% 32%
2001 - 17% 11% 10% 22% 48%
2002 76% 15% 11% 11% 15% 22%
2003 - 16% 8% 9% 11% 16%
2004 - 53% 8% 6% 9% 11%
2005 - 11% 4% 6% 12% 16%
2006 - 10% 5% 6% 6% 13%
2007 103% 10% 5% 6% 14% 19%
2008 - 17% 4% 6% 17% 33%
2009 - 14% 4% 4% 6% 23%
2010 - 20% 5% 4% 6% 14%
2011 98% 19% 6% 4% 7% 15%
2012 - 23% 10% 6% 12% 45%
2013 167% 24% 10% 9% 9% 27%
2014 - 39% 12% 10% 12% 22%
2015 - 24% 18% 13% 12% 13%
2016 - - 23% 28% 28% 38%
2017 - 124% 19% 20% 13% 8%

13
Table 6. Total catch at age including discards (number in 000s of fish) for Georges Bank Yellowtail Flounder.
Age
Year 1 2 3 4 5 6 7 8 9 10 11 12 Total
1973 359 5175 13565 9473 3815 1285 283 55 23 4 0 0 34037
1974 2368 9500 8294 7658 3643 878 464 106 71 0 0 0 32982
1975 4636 26394 7375 3540 2175 708 327 132 26 14 0 0 45328
1976 635 31938 5502 1426 574 453 304 95 54 11 2 0 40993
1977 378 9094 10567 1846 419 231 134 82 37 10 0 0 22799
1978 9962 3542 4580 1914 540 120 45 16 17 7 6 0 20748
1979 321 10517 3789 1432 623 167 95 31 27 1 3 0 17006
1980 318 3994 9685 1538 352 96 5 11 1 0 0 0 16000
1981 107 1097 5963 4920 854 135 5 2 3 0 0 0 13088
1982 2164 18091 7480 3401 1095 68 20 7 0 0 0 0 32327
1983 703 7998 16661 2476 680 122 13 16 4 0 0 0 28672
1984 514 2018 4535 5043 1796 294 47 39 0 0 0 0 14285
1985 970 4374 1058 818 517 73 8 0 0 0 0 0 7817
1986 179 6402 1127 389 204 80 17 15 0 1 0 0 8414
1987 156 3284 3137 983 192 48 38 26 25 0 0 0 7890
1988 499 3003 1544 846 227 24 26 3 0 0 0 0 6172
1989 190 2175 1121 428 110 18 12 0 0 0 0 0 4054
1990 231 2114 6996 978 140 21 6 0 0 0 0 0 10485
1991 663 147 1491 3011 383 67 4 0 0 0 0 0 5767
1992 2414 9167 2971 1473 603 33 7 1 1 0 0 0 16671
1993 5233 1386 3327 2326 411 84 5 1 0 0 0 0 12773
1994 71 1336 6302 1819 477 120 20 3 0 0 0 0 10150
1995 47 313 1435 879 170 25 10 1 0 0 0 0 2880
1996 101 681 2064 885 201 13 10 5 0 0 0 0 3960
1997 82 1132 1832 1857 378 39 43 7 1 0 0 0 5371
1998 169 1991 3388 1885 1121 122 18 3 0 3 0 0 8700
1999 60 2753 4195 1548 794 264 32 4 1 0 0 0 9651
2000 132 3864 5714 3173 826 420 66 38 4 0 0 0 14237
2001 176 2884 6956 2893 1004 291 216 13 4 0 0 0 14438
2002 212 4169 3446 1916 683 269 144 57 10 6 0 0 10911
2003 160 3919 4710 2320 782 282 243 96 47 23 2 0 12585
2004 61 1152 3184 3824 1970 889 409 78 74 18 2 0 11661
2005 60 1580 4032 1707 392 132 37 16 0 0 0 0 7956
2006 150 1251 1577 923 358 123 65 14 7 3 0 0 4470
2007 51 1493 1708 664 137 44 9 2 0 0 0 0 4108
2008 28 490 1897 853 125 17 8 0 0 0 0 0 3417
2009 17 283 1266 1360 516 59 10 4 0 0 0 0 3516
2010 2 141 651 899 449 88 10 2 0 0 0 0 2241
2011 11 166 775 904 310 67 8 1 0 0 0 0 2242
2012 12 108 370 579 240 38 4 4 0 0 0 0 1355
2013 15 61 99 148 91 19 2 0 0 0 0 0 435
2014 6 43 90 98 50 19 3 0 0 0 0 0 311
2015 1 30 61 58 51 21 6 2 0 0 0 0 230
2016 1 14 19 27 17 8 4 1 0 0 0 0 91
2017 6 7 19 34 48 28 20 8 2 0 0 0 172

14
Table 7. Mean weight at age (kg) for the total catch of US and Canadian landings and discards, for Georges Bank Yellowtail Flounder. A dash (-) indicates no data available.
Age
Year 1 2 3 4 5 6 7 8 9 10 11 12
1973 0.101 0.348 0.462 0.527 0.603 0.690 1.063 1.131 1.275 1.389 1.170 -
1974 0.115 0.344 0.496 0.607 0.678 0.723 0.904 1.245 1.090 - 1.496 1.496
1975 0.113 0.316 0.489 0.554 0.619 0.690 0.691 0.654 1.052 0.812 - -
1976 0.108 0.312 0.544 0.635 0.744 0.813 0.854 0.881 1.132 1.363 1.923 -
1977 0.116 0.342 0.524 0.633 0.780 0.860 1.026 1.008 0.866 0.913 - -
1978 0.102 0.314 0.510 0.690 0.803 0.903 0.947 1.008 1.227 1.581 0.916 -
1979 0.114 0.329 0.462 0.656 0.736 0.844 0.995 0.906 1.357 1.734 1.911 -
1980 0.101 0.322 0.493 0.656 0.816 1.048 1.208 1.206 1.239 - - -
1981 0.122 0.335 0.489 0.604 0.707 0.821 0.844 1.599 1.104 - - -
1982 0.115 0.301 0.485 0.650 0.754 1.065 1.037 1.361 - - - -
1983 0.140 0.296 0.441 0.607 0.740 0.964 1.005 1.304 1.239 - - -
1984 0.162 0.239 0.379 0.500 0.647 0.743 0.944 1.032 - - - -
1985 0.181 0.361 0.505 0.642 0.729 0.808 0.728 - - - -
1986 0.181 0.341 0.540 0.674 0.854 0.976 0.950 1.250 - 1.686 - -
1987 0.121 0.324 0.524 0.680 0.784 0.993 0.838 0.771 0.809 - - -
1988 0.103 0.328 0.557 0.696 0.844 1.042 0.865 1.385 - - - -
1989 0.100 0.327 0.520 0.720 0.866 0.970 1.172 1.128 - - - -
1990 0.105 0.290 0.395 0.585 0.693 0.787 1.057 - - - - -
1991 0.121 0.237 0.369 0.486 0.723 0.850 1.306 - - - - -
1992 0.101 0.293 0.365 0.526 0.651 1.098 1.125 1.303 1.303 - - -
1993 0.100 0.285 0.379 0.501 0.564 0.843 1.130 1.044 - - - -
1994 0.193 0.260 0.353 0.472 0.621 0.780 0.678 1.148 - - - -
1995 0.174 0.275 0.347 0.465 0.607 0.720 0.916 0.532 - - - -
1996 0.119 0.276 0.407 0.552 0.707 0.918 1.031 1.216 - - - -
1997 0.214 0.302 0.408 0.538 0.718 1.039 0.827 1.136 1.113 - -
1998 0.178 0.305 0.428 0.546 0.649 0.936 1.063 1.195 - 1.442 - -
1999 0.202 0.368 0.495 0.640 0.755 0.870 1.078 1.292 1.822 - - -
2000 0.229 0.383 0.480 0.615 0.766 0.934 1.023 1.023 1.296 - - -
2001 0.251 0.362 0.460 0.612 0.812 1.011 1.024 1.278 1.552 - - -
2002 0.282 0.381 0.480 0.665 0.833 0.985 1.100 1.286 1.389 1.483 - -
2003 0.228 0.359 0.474 0.653 0.824 0.957 1.033 1.144 1.267 1.418 1.505 -
2004 0.211 0.292 0.438 0.585 0.726 0.883 1.002 1.192 1.222 1.305 1.421 -
2005 0.119 0.341 0.447 0.597 0.763 0.965 0.993 1.198 1.578 1.578 - -
2006 0.100 0.311 0.415 0.557 0.761 0.917 1.066 1.186 1.263 1.225 1.599 -
2007 0.154 0.290 0.409 0.541 0.784 0.968 1.108 1.766 - - - -
2008 0.047 0.302 0.415 0.533 0.675 0.882 1.130 - - - - -
2009 0.155 0.328 0.434 0.538 0.699 0.879 1.050 1.328 - - - -
2010 0.175 0.323 0.432 0.519 0.661 0.777 0.997 1.176 - - - -
2011 0.128 0.337 0.461 0.553 0.646 0.739 0.811 0.851 - - - -
2012 0.185 0.338 0.452 0.555 0.671 0.792 0.935 0.798 - - - -
2013 0.193 0.263 0.393 0.533 0.689 0.825 1.002 1.183 - - - -
2014 0.171 0.292 0.417 0.541 0.679 0.799 0.883 0.814 0.864 - - -
2015 0.091 0.233 0.408 0.496 0.656 0.800 0.890 0.893 - - - -
2016 0.025 0.186 0.418 0.507 0.611 0.650 0.862 0.952 - - - -
2017 0.094 0.306 0.395 0.490 0.564 0.644 0.732 0.778 0.799 0.830 - -

15
Table 8. Number of valid survey tows in the Georges Bank Yellowtail Flounder strata (5Z1-5Z4 for DFO, 13-21 for the NMFS spring and fall surveys) in recent years. A dash (-) indicates data are not available.
Year DFO NMFS Spring NMFS Fall
2009 50 48 49
2010 57 53 53
2011 74 53 49
2012 75 54 54
2013 63 60 56
2014 52 47 57
2015 47 56 58
2016 61 56 58
2017 50 57 47
2018 58 39 -

16
Table 9a. DFO survey indices of abundance for Georges Bank Yellowtail Flounder in both numbers and kg per tow, along with the coefficient of variation (CV) for the biomass estimates.
Year Age 1 Age 2 Age 3 Age 4 Age 5 Age 6+ B(kg/tow) CV(B)
1987 0.120 1.194 1.970 0.492 0.087 0.049 1.987 0.274
1988 0.000 1.776 1.275 0.610 0.278 0.024 1.964 0.217
1989 0.114 1.027 0.609 0.294 0.066 0.022 0.748 0.257
1990 0.000 2.387 3.628 0.914 0.209 0.014 2.405 0.222
1991 0.024 0.858 1.186 3.759 0.525 0.014 2.796 0.330
1992 0.055 11.039 3.677 0.990 0.350 0.030 3.937 0.163
1993 0.079 2.431 4.085 4.076 0.887 0.130 4.201 0.151
1994 0.000 6.056 3.464 3.006 0.781 0.207 4.378 0.228
1995 0.210 1.251 4.353 2.546 0.647 0.101 3.223 0.201
1996 0.446 7.142 9.174 5.406 1.155 0.123 8.433 0.223
1997 0.022 12.482 13.902 16.369 4.044 0.670 21.138 0.233
1998 0.893 3.330 4.907 4.334 1.988 0.558 6.826 0.244
1999 0.159 20.861 20.834 7.669 5.350 2.200 28.093 0.325
2000 0.011 13.765 27.442 19.243 5.069 3.689 31.723 0.253
2001 0.291 19.896 42.124 13.307 4.581 2.397 35.236 0.416
2002 0.088 11.962 31.015 12.234 5.553 2.833 32.916 0.305
2003 0.089 11.889 24.618 11.086 3.421 1.988 25.839 0.317
2004 0.033 3.599 16.260 9.205 2.273 1.416 14.397 0.313
2005 0.600 1.602 27.959 20.564 5.696 1.565 21.240 0.530
2006 0.623 4.893 18.600 6.572 0.820 0.238 10.462 0.444
2007 0.173 12.159 27.708 12.799 2.288 0.248 21.219 0.435
2008 0.000 48.315 170.363 57.119 8.059 0.055 107.052 0.939
2009 0.021 8.540 137.957 116.966 19.900 4.764 114.566 0.791
2010 0.000 0.489 9.392 20.943 3.533 1.279 14.532 0.294
2011 0.022 0.651 6.093 8.205 1.701 0.327 6.091 0.294
2012 0.044 0.644 8.243 11.423 3.096 0.453 8.937 0.356
2013 0.081 0.129 0.831 1.254 0.604 0.140 1.109 0.328
2014 0.030 0.395 0.741 0.960 0.471 0.018 0.816 0.337
2015 0.000 0.467 1.112 1.659 0.747 0.093 1.308 0.367
2016 0.000 0.218 3.151 2.104 1.257 0.657 2.748 0.608
2017 0.000 0.014 0.185 0.435 0.437 0.388 0.545 0.469
2018 0.000 0.006 0.263 0.194 0.315 0.223 0.401 0.378

17
Table 9b. NMFS spring survey indices of abundance for Georges Bank Yellowtail Flounder in both numbers and kg per tow in Albatross units, along with the CV for the biomass estimates.
Year Age 1 Age 2 Age 3 Age 4 Age 5 Age 6+ B(kg/tow) CV(B)
1968 0.335 3.176 3.580 0.304 0.073 0.310 2.791 0.214
1969 1.108 9.313 11.121 3.175 1.345 0.699 11.170 0.291
1970 0.093 4.485 6.030 2.422 0.570 0.311 5.146 0.146
1971 0.835 3.516 4.813 3.300 0.780 0.320 4.619 0.198
1972 0.141 6.923 7.050 3.705 1.127 0.239 6.455 0.214
1973 1.940 3.281 2.379 1.068 0.412 0.217 2.939 0.174
1974 0.317 2.234 1.850 1.262 0.347 0.282 2.720 0.186
1975 0.422 3.006 0.834 0.271 0.208 0.089 1.676 0.224
1976 1.112 4.315 1.253 0.312 0.197 0.112 2.273 0.162
1977 0.000 0.674 1.131 0.396 0.063 0.013 0.999 0.312
1978 0.940 0.802 0.510 0.220 0.027 0.008 0.742 0.197
1979 0.406 2.016 0.407 0.338 0.061 0.092 1.271 0.209
1980 0.057 4.666 5.787 0.475 0.057 0.036 4.456 0.350
1981 0.017 1.020 1.777 0.720 0.213 0.059 1.960 0.322
1982 0.045 3.767 1.130 1.022 0.458 0.091 2.500 0.190
1983 0.000 1.865 2.728 0.530 0.123 0.245 2.642 0.294
1984 0.000 0.093 0.831 0.863 0.896 0.183 1.646 0.428
1985 0.110 2.199 0.262 0.282 0.148 0.000 0.988 0.501
1986 0.027 1.806 0.291 0.056 0.137 0.055 0.847 0.298
1987 0.027 0.076 0.137 0.133 0.053 0.055 0.329 0.365
1988 0.078 0.275 0.366 0.242 0.199 0.027 0.566 0.257
1989 0.047 0.424 0.739 0.290 0.061 0.045 0.729 0.270
1990 0.000 0.110 1.063 0.369 0.163 0.057 0.699 0.312
1991 0.435 0.000 0.254 0.685 0.263 0.021 0.631 0.247
1992 0.000 2.048 1.897 0.641 0.165 0.017 1.566 0.470
1993 0.046 0.290 0.501 0.317 0.027 0.000 0.482 0.263
1994 0.000 0.621 0.633 0.354 0.145 0.040 0.660 0.223
1995 0.040 1.179 4.812 1.485 0.640 0.010 2.579 0.631
1996 0.025 0.987 2.626 2.701 0.610 0.058 2.853 0.320
1997 0.019 1.169 3.733 4.080 0.703 0.134 4.359 0.257
1998 0.000 2.081 1.053 1.157 0.760 0.350 2.324 0.234
1999 0.050 4.746 10.819 2.721 1.623 0.779 9.307 0.433

18
Table 9b. Continued.
Year Age 1 Age 2 Age 3 Age 4 Age 5 Age 6+ B(kg/tow) CV(B)
2000 0.183 4.819 7.666 2.914 0.813 0.524 6.696 0.221
2001 0.000 2.315 6.563 2.411 0.484 0.453 5.006 0.329
2002 0.188 2.412 12.334 4.078 1.741 0.871 9.563 0.250
2003 0.202 4.370 6.764 2.876 0.442 0.862 6.722 0.405
2004 0.049 0.986 2.179 0.735 0.255 0.217 1.891 0.261
2005 0.000 2.013 5.080 2.404 0.270 0.115 3.407 0.325
2006 0.509 0.935 3.523 2.177 0.317 0.082 2.420 0.182
2007 0.090 5.048 6.263 2.846 0.556 0.129 4.701 0.217
2008 0.000 2.274 5.071 1.732 0.310 0.027 3.247 0.218
2009 0.211 0.600 7.446 4.653 1.002 0.191 4.856 0.223
2010 0.017 0.694 5.412 8.451 2.721 0.654 5.944 0.267
2011 0.031 0.243 3.331 3.735 0.964 0.108 2.561 0.226
2012 0.095 0.718 4.178 5.745 1.411 0.200 3.995 0.455
2013 0.048 0.376 1.006 1.401 0.657 0.124 1.104 0.218
2014 0.027 0.234 0.679 0.682 0.367 0.196 0.740 0.175
2015 0.000 0.183 0.513 0.420 0.368 0.049 0.507 0.189
2016 0.006 0.022 0.233 0.283 0.072 0.133 0.312 0.252
2017 0.012 0.095 0.070 0.109 0.180 0.177 0.244 0.212
2018 0.000 0.022 0.000 0.000 0.000 0.013 0.012 0.632

19
Table 9c. NMFS fall survey indices of abundance for Georges Bank Yellowtail Flounder in both numbers and kg per tow in Albatross units, along with the CV for the biomass estimates.
Year Age 1 Age 2 Age 3 Age 4 Age 5 Age 6+ B(kg/tow) CV(B)
1963 14.722 7.896 11.227 1.859 0.495 0.549 12.788 0.187
1964 1.722 9.806 7.312 5.967 2.714 0.488 13.567 0.378
1965 1.197 5.705 5.988 3.532 1.573 0.334 9.120 0.326
1966 11.663 2.251 1.685 0.898 0.101 0.000 3.928 0.335
1967 8.985 9.407 2.727 1.037 0.342 0.103 7.670 0.270
1968 11.671 12.057 5.758 0.745 0.965 0.058 10.536 0.229
1969 9.949 10.923 5.217 1.811 0.337 0.461 9.807 0.250
1970 4.610 5.132 3.144 1.952 0.452 0.080 4.979 0.287
1971 3.627 6.976 4.914 2.250 0.498 0.298 6.365 0.209
1972 2.462 6.525 4.824 2.094 0.610 0.342 6.328 0.273
1973 2.494 5.498 5.104 2.944 1.217 0.618 6.490 0.311
1974 4.623 2.864 1.516 1.060 0.458 0.379 3.669 0.179
1975 4.625 2.511 0.877 0.572 0.334 0.063 2.326 0.164
1976 0.344 1.920 0.474 0.117 0.122 0.100 1.508 0.233
1977 0.934 2.212 1.621 0.617 0.105 0.126 2.781 0.192
1978 4.760 1.281 0.780 0.411 0.136 0.036 2.343 0.204
1979 1.321 2.069 0.261 0.120 0.138 0.112 1.494 0.294
1980 0.766 5.120 6.091 0.682 0.219 0.258 6.607 0.210
1981 1.595 2.349 1.641 0.588 0.079 0.054 2.576 0.322
1982 2.425 2.184 1.590 0.423 0.089 0.000 2.270 0.290
1983 0.109 2.284 1.915 0.511 0.031 0.049 2.131 0.222
1984 0.661 0.400 0.306 0.243 0.075 0.063 0.593 0.305
1985 1.377 0.516 0.171 0.051 0.081 0.000 0.709 0.266
1986 0.282 1.108 0.349 0.074 0.000 0.000 0.820 0.371
1987 0.129 0.373 0.396 0.053 0.080 0.000 0.509 0.280
1988 0.019 0.213 0.107 0.027 0.000 0.000 0.171 0.325
1989 0.248 1.993 0.773 0.079 0.056 0.000 0.977 0.582
1990 0.000 0.370 1.473 0.294 0.000 0.000 0.725 0.323
1991 2.101 0.275 0.439 0.358 0.000 0.000 0.730 0.293
1992 0.151 0.396 0.712 0.162 0.144 0.027 0.576 0.287
1993 0.839 0.139 0.586 0.536 0.000 0.022 0.546 0.426
1994 1.195 0.221 0.983 0.713 0.263 0.057 0.897 0.311
1995 0.276 0.119 0.346 0.275 0.046 0.013 0.354 0.359
1996 0.149 0.352 1.869 0.447 0.075 0.000 1.303 0.570
1997 1.393 0.533 3.442 2.090 1.071 0.082 3.781 0.344
1998 1.900 4.817 4.202 1.190 0.298 0.074 4.347 0.347
1999 3.090 8.423 5.727 1.433 1.437 0.261 7.973 0.215

20
Table 9c. Continued.
Year Age 1 Age 2 Age 3 Age 4 Age 5 Age 6+ B(kg/tow) CV(B)
2000 0.629 1.697 4.814 2.421 0.948 0.827 5.838 0.482
2001 3.518 6.268 8.092 2.601 1.718 2.048 11.553 0.381
2002 2.093 5.751 2.127 0.594 0.277 0.055 3.754 0.517
2003 1.077 5.031 2.809 0.565 0.100 0.191 4.038 0.316
2004 0.876 5.508 5.010 2.107 0.924 0.176 5.117 0.436
2005 0.313 2.095 3.763 0.614 0.185 0.000 2.463 0.492
2006 6.194 6.251 3.664 1.167 0.255 0.046 4.521 0.247
2007 1.058 11.447 7.866 1.998 0.383 0.094 8.151 0.309
2008 0.168 7.174 9.883 1.033 0.000 0.000 7.109 0.291
2009 0.477 4.382 12.202 2.219 0.631 0.064 6.744 0.269
2010 0.125 2.811 4.507 0.781 0.298 0.000 2.247 0.283
2011 0.237 2.865 3.897 1.106 0.145 0.010 2.452 0.264
2012 0.195 1.475 3.658 1.586 0.441 0.014 2.520 0.459
2013 0.332 1.028 0.940 0.537 0.116 0.044 0.875 0.369
2014 0.163 1.177 1.123 0.647 0.146 0.084 1.024 0.334
2015 0.031 0.394 0.589 0.303 0.069 0.020 0.469 0.619
2016 0.077 0.460 0.553 0.258 0.085 0.044 0.439 0.361
2017 0.047 0.105 0.142 0.172 0.042 0.097 0.196 0.355
Table 10. Survey indices of abundance (kg/tow) used in the Empirical Approach. The NMFS spring and fall survey values are in Henry B. Bigelow units.
Year DFO Spring Fall
(year-1)
2010 14.532 13.339 16.198
2011 6.091 5.747 5.398
2012 8.937 8.965 5.889
2013 1.109 2.477 6.053
2014 0.816 1.662 2.101
2015 1.308 1.137 2.460
2016 2.748 0.700 1.127
2017 0.545 0.547 1.054
2018 0.401 0.028 0.470

21
Table 11. Derivation of conversion factors relating catch per tow in kg to minimum swept area biomass in metric tons. See text for details.
DFO Spring Fall Units
Total Area in Survey = 25453 37286 37286 square kilometers
Wing Width = 12.5 12.6 12.6 Meters
Length of Tow = 3.241 1.852 1.852 Kilometers
Area Swept by Tow (Wing) = 0.0405 0.0233 0.0233 square kilometers Expansion Factor to Min Swept
Area Biomass in mt (Wing) = 628.275 1597.844 1597.844 None
Table 12. Empirical approach used to derive catch advice based on 2017 TRAC intersessional consensus formulation (wing width with survey catchability = 0.31). The mean of the three bottom trawl survey population biomass values is denoted Avg. The catch advice is computed as the exploitation rate multiplied by Avg. The catch advice year is applied in the year following (e.g., the 2018 row of catch advice will be applied in 2019).
Exploitation rate Biomass (mt) Wings 0.02 0.06
Year DFO Spring Fall (year-1) Average Catch Advice (mt)
2010 29452 68752 83490 60565 1211 3634
2011 12344 29621 27821 23262 465 1396
2012 18113 46209 30354 31559 631 1894
2013 2249 12766 31199 15404 308 924
2014 1654 8564 10828 7015 140 421
2015 2650 5861 12682 7064 141 424
2016 5569 3610 5811 4997 100 300
2017 1104 2819 5432 3118 62 187
2018 812 143 2424 1126 23 68
Table 13. Recent quotas and catches by year and corresponding exploitation rates (computed by dividing annual quota or catch by the average survey biomass in Table 13) based on 2017 TRAC intersessional consensus formulation (wing width with survey catchability = 0.31). Model type refers to the approach used to set the quota for that year.
Assmt Year Quota Year Quota (mt) Catch (mt) Quota/Avg Catch/Avg Model Type
2009 2010 1956 1170 3% 2% VPA
2010 2011 2650 1171 11% 5% VPA
2011 2012 1150 725 4% 2% VPA
2012 2013 500 218 3% 1% VPA
2013 2014 400 159 6% 2% VPA
2014 2015 354 118 5% 2% Empirical
2015 2016 354 44 7% 1% Empirical
2016 2017 300 95 10% 3% Empirical
2017 2018 300 27% Empirical
mean 885 462 8% 2%

22
Table 14. Catch advice for 2019 associated with the full range of exploitation rates from the 2014 benchmark.
Exploitation Rate Catch Advice (mt)
2% 23
4% 45
6% 68
8% 90
10% 113
12% 135
14% 158
16% 180

23
FIGURES
Figure 1a. Location of statistical unit areas for Canadian fisheries in NAFO Subdivision 5Ze.Catches of Yellowtail Flounder in areas 5Zhjmn are used in this assessment.

24
Figure 1b. Statistical areas used for monitoring northeast US fisheries. Catches from areas 522, 525, 551, 552, 561 and 562 are included in the Georges Bank Yellowtail Flounder assessment. Shaded areas have been closed to fishing year-round since 1994, with exceptions.
521 522
525
526
537
538
561
562
552
551
511512
513
515
514
III
NLA

25
Figure 2a. Catch (landings plus discards) of Georges Bank Yellowtail Flounder by nation and year.
Figure 2b. Recent catches by country (bars) and quotas (solid line). Note the US quota is not applied for the calendar year and that in 2010 the TMGC could not agree on a quota, so the 2010 value is the sum of the implemented quotas by each country.

26
Figure 3. Catch at age (thousands of fish) over time for Georges Bank Yellowtail Flounder (Canadian and US fisheries combined). Note the y-axes vary by age.

27
Figure 4. Trends in mean weight at age from the Georges Bank Yellowtail Flounder fishery (Canada and US combined, including discards). Dashed lines denote average of time series.

28
Figure 5. DFO (top) and NMFS (bottom) strata used to derive research survey abundance indices for Georges Bank groundfish surveys. Note NMFS stratum 22 is not used in assessment.
5Zj
5Zh
5Zn
5Zm
5Z2 5Z15Z3
5Z4
Georges Bank
Great
South
Channel
Cape
Cod
71° W 69°W 67°W
42°N
40°N

29
Figure 6. Cumulative distribution function (cdf) of the timing for the three surveys with most recent year highlighted in black.

30
Figure 7a. Total number of tows conducted in each stratum by season and year for the DFO survey compared to the number of tows that caught Yellowtail Flounder.

31
Figure 7b. Total number of tows conducted in each stratum by season and year for the two NMFS surveys compared to the number of tows that caught Yellowtail Flounder.
32
Figure 8. Three survey biomass indices (DFO, NMFS spring, and NMFS fall) for Yellowtail Flounder on Georges Bank rescaled to their respective means for years 1987-2007.

33
Figure 9. Survey biomass for Yellowtail Flounder on Georges Bank in units of kg/tow with 90% confidence intervals from +/- 1.645*stdev (DFO) or bootstrapping (NMFS spring and NMFS fall). Note the y-axes vary by survey.

34
Figure 10. Three survey coefficients of variation (CV) for Yellowtail Flounder biomass on Georges Bank.

35
Figure 11a. Catch of Yellowtail Flounder in weight (kg) per tow for DFO survey: recent ten year average (top panel) and most recent year (bottom panel).

36
Figure 11b. Catch of Yellowtail Flounder in weight (kg) per tow for NMFS spring (top) and NMFS fall (bottom) surveys. Left panels show previous 10 year averages, right panels most recent data. Note the 2009-2018 survey values were adjusted from Henry B. Bigelow to Albatross IV equivalents by dividing Henry B. Bigelow catch in weight by 2.244 (spring) or 2.402 (fall).

37
Figure 12a. DFO survey estimates of total biomass (top panel) and proportion (bottom panel) by stratum for Yellowtail Flounder on Georges Bank.

38
Figure 12b. NMFS spring survey estimates of total biomass (top panel) and proportion (bottom panel) by stratum for Yellowtail Flounder on Georges Bank.

39
Figure 12c. NMFS fall survey estimates of total biomass (top panel) and proportion (bottom panel) by stratum for Yellowtail Flounder on Georges Bank.

40
Fig 13a. Stratified mean number of fish per tow (NUM_TOW) at age over time in the DFO survey of Georges Bank Yellowtail Flounder. Note the y-axes vary by age.

41
Fig 13b. Stratified mean number of fish per tow (NUM_TOW) at age over time in the NMFS spring survey of Georges Bank Yellowtail Flounder. Note the y-axes vary by age.

42
Fig 13c. Stratified mean number of fish per tow (NUM_TOW) at age over time in the NMFS fall survey of Georges Bank Yellowtail Flounder. Note the y-axes vary by age.

43
Figure 14a. DFO survey catch at age by cohort on log scale. Red lines denote linear regression and blue lines denote 95% prediction interval for the linear regression. Correlation values are shown in lower right triangle.

44
Figure 14b. NMFS spring survey catch at age by cohort on log scale. Red lines denote linear regression and blue lines denote 95% prediction interval for the linear regression. Correlation values are shown in lower right triangle.
45
Figure 14c. NMFS fall survey catch at age by cohort on log scale. Red lines denote linear regression and blue lines denote 95% prediction interval for the linear regression. Correlation values are shown in lower right triangle.

46
Figure 15. Standardized catch/tow in numbers at age for the three surveys. The standardization was the division of each index value by the mean of the index during 1987 through 2007.
47
Figure 16a. Condition factor (Fulton’s K) of Georges Bank Yellowtail Flounder from the NMFS fall and spring surveys.

48
Figure 16b. Condition factor (Fulton’s K) for male and female Yellowtail Flounder in the DFO survey.
0.7
0.75
0.8
0.85
0.9
0.95
1
1986 1989 1992 1995 1998 2001 2004 2007 2010 2013 2016
Co
nd
itio
n F
ac
tor
Annual Mean
1987-2018 Mean
2007-2018 Mean
Male (25-40 cm FL)
0.7
0.75
0.8
0.85
0.9
0.95
1
1986 1989 1992 1995 1998 2001 2004 2007 2010 2013 2016
Co
nd
itio
n F
ac
tor
Annual Mean
1987-2018 Mean
2007-2018 Mean
Female (25-40 cm FL)Female (25-40 cm FL)

49
Figure 17. Trends in relative fishing mortality (catch biomass/survey biomass), or relative F, standardized to the mean for 1987-2007.

50
Figure 18. Total mortality (Z) estimated using method of Sinclair (2001) with four year moving window catch curve analysis using cohorts of ages 3-8. The midpoint of the four year moving window is plotted as Year (e.g., years 2015-2018 are plotted as 2016.5). The filled circles denote the estimated values and the shaded region the 95% confidence intervals.

51
Figure 19. Distribution of catch advice over time from 1000 Monte Carlo evaluations of five types of uncertainty. The dots show the point estimates.

52
Figure 20. Distribution of catch advice from 1000 Monte Carlo evaluations with all five sources of uncertainty. The dots show the point estimates.

53
Figure 21. Recruits (at age 1 in top three panels, at age 2 in bottom three panels) per total biomass (a proxy for recruits per spawning stock biomass) over time from the three bottom trawl surveys. Recruits per biomass values of zero are not shown. Note the y-axes vary by survey.

54
Figure 22. Recruits (at age 1 in top three panels, at age 2 in bottom three panels) per total biomass (a proxy for recruits per spawning stock biomass) in relation to the survey biomass. Blue filled circles denote years since 2012 (not all plots show each year due to zeros treated as missing values). Note both the x-axes and y-axes vary by survey.

55
APPENDIX
The table below was kindly initiated by Tom Nies (NEFMC). It summarizes the performance of the management system. It reports the TRAC advice, TMGC quota decision, actual catch, and realized stock conditions for Georges Bank Yellowtail Flounder.
(1) All catches are calendar year catches
(2) Values in italics are assessment results in year immediately following the catch year; values in normal font are results from this assessment
TRAC Catch Year
TRAC Analysis/Recommendation TMGC Decision Actual Catch(1)/Compared to
Risk Analysis
Actual Result(2)
Amount Rationale Amount Rationale
19991 1999 (1) 4,383 mt (2) 6,836 mt
Neutral risk of exceeding Fref
(1)VPA (2)SPM
NA NA 4,963 mt/ 50% risk of exceeding Fref (VPA)
2000 2000 7,800 mt Neutral risk of exceeding Fref
NA NA 7,341 mt/About 30% risk of exceeding Fref
2001 2001 9,200 mt Neutral risk of exceeding Fref
NA NA 7,419 mt/Less than 10% risk of exceeding Fref
2002 2002 10,300 mt Neutral risk of exceeding Fref
NA NA 5,663 mt/Less than 1% risk of exceeding Fref
Transition to TMGC process in following year; note catch year differs from TRAC year in following lines
1 Prior to implementation of US/CAN Understanding

56
TRAC Catch Year
TRAC Analysis/Recommendation TMGC Decision Actual Catch(1)/Compared to
Risk Analysis
Actual Result(2)
Amount Rationale Amount Rationale
2003 2004 No confidence in projections;
status quo catch may be
appropriate
7,900 mt Neutral risk of exceeding Fref, biomass stable; recent catches between 6,100-
7,800 mt
6,815 mt F above 1.0
Now NA
2004 2005 4,000 mt Deterministic; other models give higher
catch but less than 2004 quota
6,000 mt Moving towards Fref
3,852 mt F = 1.37 Age 3+ biomass
decreased 5% 05-06
Now NA
2005 2006 (1) 4,200 (2) 2,100
(3) 3,000 -3,500
Neutral risk of exceeding F ref (1-base case; 2 – major change) (3) Low risk of not achieving 20% biomass
increase
3,000 mt Base case TAC adjusted for retrospective
pattern, result is similar to major
change TAC (projections redone at TMGC)
2,057 mt/ (1) Less than 10% risk of
exceeding Fref (2) Neutral risk of exceeding Fref
F = 0.89 Age 3+ biomass
increased 41% 06-07
Now NA
2006 2007 1,250 mt Neutral risk of exceeding Fref; 66% increase in SSB from 2007
to 2008
1,250 mt (revised after US
objections to a 1,500 mt TAC)
Neutral risk of exceeding Fref
1,664 mt About 75 percent
probability of exceeding Fref
F = 0.29 Age 3+ biomass
increased 211% 07-08
Now NA

57
TRAC Catch Year
TRAC Analysis/Recommendation TMGC Decision Actual Catch(1)/Compared to
Risk Analysis
Actual Result(2)
Amount Rationale Amount Rationale
2007 2008 3,500 mt Neutral risk of exceeding Fref; 16% increase in age 3+ biomass
from 2008 to 2009
2,500 mt Expect F=0.17, less than
neutral risk of exceeding Fref
1,499 mt No risk plot; expected less
than median risk of exceeding Fref
F~0.09 Age 3+ biomass
increased between 35%-52%
Now NA
2008 2009 (1) 4,600 mt
2) 2,100 mt
(1) Neutral risk of exceeding
Fref; 9% increase from
2009-2010 (2) U.S.
rebuilding plan
2,100 mt U.S. rebuilding requirements; expect F=0.11;
no risk of exceeding Fref
1,806 mt No risk of exceeding Fref
F=0.15 Age 3+ biomass increased 11%
Now NA
2009 2010 (1) 5,000 – 7,000 mt
(2) 450 – 2,600 mt
(1) Neutral risk of exceeding
Fref under two model
formulations (2) U.S.
rebuilding requirements
No agreement. Individual TACs total 1,975 mt
No agreement 1,170 mt No risk of exceeding Fref About 15% increase in
median biomass expected
F=0.13 3+ Biomass increased
6% 10-11
Now Avg survey B decreased 62% 10-11
2010 2011 (1) 3,400 mt (1) Neutral risk of exceeding
Fref; no change in age 3+ biomass
2,650 mt Low probability of exceeding
Fref; expected 5% increase in biomass from
11 to 12
1,171 mt No risk of exceeding Fref About 15% increase in
biomass expected
F=0.31 Age 3+ biomass
decreased 5% 11-12
Now Avg survey B increased 35% 11-12

58
TRAC Catch Year
TRAC Analysis/Recommendation TMGC Decision Actual Catch(1)/Compared to
Risk Analysis
Actual Result(2)
Amount Rationale Amount Rationale
2011 2012 (1) 900-1,400 mt (1) trade-off between risk of overfishing and
change in biomass from
three projections
1,150 mt Low probability of exceeding
Fref; expected increase in
biomass from 12 to 13
725 mt F=0.32 Age 3+ biomass
decreased 6% 12-13
Now Avg survey B decreased 50% 12-13
2012 2013 (1) 200-500 mt
(1) trade-off between risk of overfishing and
change in biomass from
five projections
500 mt Trade-off risk of F>Fref and
biomass increase among
5 sensitivity analyses
218 mt F=0.32 (0.78 rho adjusted)
Now Avg survey B decreased 55% 13-14
2013 2014 (1) 200 mt (2) 500 mt
(1) F<Fref (2) B increase
400 mt Reduction from 2013 quota,
allow rebuilding
159 mt Now Avg survey B increased 0% 14-15
2014 2015 (1) 45-
354 mt
(2) 400 mt
(1) constant exploitation rate
2%-16%
(2) constant quota
354 mt One year quota at 16%
exploitation rate, reduction
from 2014 quota
118 mt Now Avg survey B decreased 31% 15-16
2015 2016 (1) 45-
359 mt
(2) 354 mt
(1) constant exploitation rate
2%-16%
(2) constant quota
354 mt Constant quota (and essentially
no change in surveys)
44 mt Now Avg survey B decreased 36% 16-17

59
TRAC Catch Year
TRAC Analysis/Recommendation TMGC Decision Actual Catch(1)/Compared to
Risk Analysis
Actual Result(2)
Amount Rationale Amount Rationale
2016 2017 (1) 31-
245 mt
(2)
(1) constant exploitation rate
2%-16%
(2)
300 mt Decline in surveys and low
inter-annual changes in
quota
95 mt Now Avg survey B decreased 64% 17-18
2017 2018 62-187 mt
Constant exploitation rate
2%-6%
300 mt Balance yellowtail
flounder stock conditions and the utilization of other species