CEO Overcon dence and Innovation - Boston...
54
CEO Overconfidence and Innovation * Alberto Galasso University of Toronto Timothy S. Simcoe Boston University and NBER This Draft: April 12, 2011 First Draft: November 14, 2009 * We thank Ulrike Malmendier for providing the data that made this research possible. We also thank Iain Cockburn, Avi Goldfarb, Teck Ho, Tanjim Hossain, Lisa Kramer, Mara Lederman, Mark Schankerman, Xianwen Shi, Mo Xiao and seminar participants at Harvard Business School, University of Alberta, University of Toronto, Ryerson University, the November 2009 NBER Productivity Lunch, the May 2010 Choice Symposium, the Econometric Society World Congress, the EARIE and the REER conferences for helpful suggestions. Addresses for correspondence: Joseph L. Rotman School of Management, 105 St. George Street, Toronto, ON M5S 3E6, Canada; Boston University School of Management, 595 Commonwealth Avenue, Boston, MA 02215, USA. E- mails: [email protected]; [email protected].
Transcript of CEO Overcon dence and Innovation - Boston...

CEO Overconfidence and Innovation ∗
Alberto Galasso
University of Toronto
Timothy S. Simcoe
Boston University and NBER
This Draft: April 12, 2011
First Draft: November 14, 2009
∗We thank Ulrike Malmendier for providing the data that made this research possible. We also thank IainCockburn, Avi Goldfarb, Teck Ho, Tanjim Hossain, Lisa Kramer, Mara Lederman, Mark Schankerman, XianwenShi, Mo Xiao and seminar participants at Harvard Business School, University of Alberta, University of Toronto,Ryerson University, the November 2009 NBER Productivity Lunch, the May 2010 Choice Symposium, theEconometric Society World Congress, the EARIE and the REER conferences for helpful suggestions. Addressesfor correspondence: Joseph L. Rotman School of Management, 105 St. George Street, Toronto, ON M5S 3E6,Canada; Boston University School of Management, 595 Commonwealth Avenue, Boston, MA 02215, USA. E-mails: [email protected]; [email protected].

CEO Overconfidence and Innovation
Abstract
Are CEOs’ attitudes and beliefs linked to their firms’ innovative performance? Thispaper uses Malmendier and Tate’s measure of overconfidence, based on CEO stock-option exercise, to study the relationship between a CEO’s “revealed beliefs” aboutfuture performance and standard measures of corporate innovation. We begin bydeveloping a career concern model where CEOs innovate to provide evidence oftheir ability. The model predicts that overconfident CEOs, who underestimate theprobability of failure, are more likely to pursue innovation, and that this effectis larger in more competitive industries. We test these predictions on a panel oflarge publicly traded firms for the years 1980 to 1994. We find a robust positiveassociation between overconfidence and citation-weighted patent counts in bothcross sectional and fixed-effect models. This effect is larger in more competitiveindustries. Our results suggest that overconfident CEOs are more likely to taketheir firms in a new technological direction.
Keywords: Innovation, R&D, CEO Overconfidence, Managerial Biases.
JEL Codes: D80, O31, O32, O33.

1 Introduction
Economic models typically assume that beliefs are on average correct. However, a large body
of evidence from applied psychology shows that individuals routinely over-estimate their ability
(Svenson, 1981). While much of this evidence comes from surveys and lab experiments, there
is growing interest in measuring the impact of overconfidence in the field (DellaVigna, 2008).
This paper uses a novel measure of CEO overconfidence developed by Malmendier and Tate
(2005a, 2005b, 2008) to study the relationship between managerial overconfidence and corporate
innovation.1
Prior research on managerial overconfidence finds that overconfident CEOs tend to destroy
value through unprofitable mergers and sub-optimal investment behaviour (Malmandier and
Tate 2005a, 2005b, 2008). These results raise the question of why companies hire and retain
overconfident CEOs? While several theories suggest that overconfidence may generate value
through greater exploration and risk-taking (Bernardo and Welch 2001, Goel and Thakor 2008),
there is no empirical evidence of this effect from outside the lab.
We argue that for large-firm CEOs, overconfidence is associated with an increased propen-
sity to innovate. To make this idea precise, we propose a simple career concern model where
CEOs decide whether or not to innovate. Successful innovation is rewarded because it reveals
new information about managerial ability. Conversely, failure causes the market to infer that a
CEO lacks talent. Overconfident CEOs underestimate the likelihood of failure, and are there-
fore more likely to pursue innovation. This effect is larger in more competitive industries,
where successful innovation reveals more information about CEO ability, leading to a large
payoff that overconfident CEOs are eager to capture. This simple theory provides one answer
to the puzzle posed by previous research: If the rewards from successful innovation are large,
an overconfident CEO’s increased propensity to innovate may offset the negative impacts of
unprofitable mergers and sub-optimal investment behavior.
To test these predictions, we combine standard measures of innovation, based on US patent
data, with a measure of CEO overconfidence developed in a series of papers by Malmendier and
Tate (2005a, 2005b, 2008). The measure is constructed by using CEOs’ personal investments
to capture “revealed beliefs” about their firms’ future performance. Specifically, CEOs are
classified as overconfident if they hold highly in-the-money stock options after they are fully
vested. We run panel data regressions on a sample of 290 firms and 627 CEOs during the
period 1980 to 1994. This sample consists of large firms, primarily from manufacturing and
1Throughout this paper we follow the convention adopted by Malmendier and Tate (2008), and refer to self-serving attribution bias (i.e. over-estimating outcomes related to one’s own abilities) as “overconfidence.” Weuse the term “optimism” to refer to over-estimation of exogenous positive outcomes (e.g. growth in GDP).
2

technology industries, where we observe significant patenting.
Our main result shows that the arrival of an overconfident CEO is correlated with a 25 to 35
percent increase in citation-weighted patent counts (i.e. forward citations received by patents
filed in a given year). The effect is larger if we assume that a CEO only becomes overconfident
after failing to exercise in-the-money option grants, instead of treating overconfidence as a
permanent trait. We consider several additional outcome variables, and find that overconfidence
produces similar-sized effects for unweighted patent counts, R&D expenditures and citations per
issued patent. Interacting overconfidence with industry-level measures of competition reveals
that the overconfidence effect is larger when product market competition is more intense. These
interactions provide support for our analytical framework, and also illustrate how industry
characteristics may amplify (or mute) the impact of behavioral biases.
We extend these baseline results in several directions. First, we examine the link between
overconfidence and two measures of innovative direction, based on the Hall, Jaffe and Trajten-
berg (2001) measure of patent originality and a new measure based on self-citation rates. The
results suggest that overconfidence leads to a change in direction, and not just an increase in
R&D spending and productivity. Second, we show that the link between overconfidence and
innovation is stronger for CEOs who are less constrained. Specifically, the overconfidence effect
is larger when a CEO also holds the titles of Chairman and President, or the firm has greater
cash flows. These two findings strengthen our preferred interpretation of the main results by
showing that overconfidence is more salient when a CEO has greater flexibility to make changes
in their firm’s strategic direction. Finally, we examine trends in various innovation measures
prior to hiring an overconfident CEO. While the match between firm and CEO remains (po-
tentially) endogenous, these models reassuringly find no evidence that firms “treated” with an
overconfident executive behave differently from controls beforehand.
Because we rely on indirect measures of patent value, and have no information on the
opportunity cost of R&D, our results do not reveal whether innovations by an overconfident
CEOs actually create value. In particular, these CEOs may over-invest in risky projects.
Nevertheless, we find that overconfident CEOs have greater R&D productivity (i.e. citations
per dollar of R&D invested). While this result is not conclusive, it strongly suggests that
executive overconfidence can, under the right circumstances, provide benefits that offset the
negative effects documented in previous research.
1.1 Related Literature
Psychologists provide a wealth of evidence that individuals over-estimate their own abilities.
For example, most people believe they have above average driving skills (Svenson, 1981) and
3

ability to remember trivia (Moore and Cain, 2007). CEOs and other high-ranking executives
may be particularly susceptible to this bias, since overconfidence is stronger among highly skilled
individuals (Camerer and Lovallo, 1999), and when the link between actions and outcomes is
complex (Moore and Kim, 2003).
Given the uncertainty and complexity associated with research and development, we might
expect overconfidence to play an important role in the innovation process. In fact, there have
been many studies of entrepreneurial overconfidence (see Shane 2003, pg. 12 for a review).
Much of this research invokes overconfidence to explain persistence in the face of long odds.
For instance, Astebro (2003) and Lowe and Ziedonis (2006) ask whether overconfidence is
needed to rationalize entrepreneurial behaviour. Our study departs from this tradition in two
important ways. First, we consider the role of overconfidence at the opposite end of the firm-size
distribution, among CEOs of large publicly traded companies. And second, instead of asking
whether latent overconfidence is required to rationalize observed behaviour, we examine the
correlation between a novel measure of overconfidence and firm-level innovative performance.
This paper contributes to an emerging literature at the intersection of industrial organiza-
tion and behavioral economics (see Camerer and Malmendier (2007) for a survey), and builds
upon three broad streams of prior research. First, our data and measure of overconfidence come
from Malmendier and Tate (2005a, 2005b, 2008), who use it to study corporate finance. Their
key insight is that a CEO’s personal financial decisions — specifically, whether they exercise
fully vested stock options that are highly in-the-money — can be used to infer beliefs about
future performance. As described below, Malmendier and Tate do extensive work to validate
this measure, and use it to show that overconfident CEOs are more sensitive to cash flows
(Malmendier and Tate, 2005a) and more likely to do mergers and acquisitions (Malmendier
and Tate, 2008). Closer to our work is the study by Hirshleifer et al. (2010), who indepen-
dently look at the correlation between options- and press-based measures of overconfidence and
various measures of risk taking, including patenting and stock-return volatility.
We also build on a long line of research that uses patents to measure corporate innovation.
Pakes and Griliches (1980) were the first to estimate a patent production function, and their
model was extended by and Hausman, Hall and Griliches (1984), and Blundell, Griffith and Van
Reenen (1999). Within this literature, our work is closely related to papers that emphasize
corporate governance and stock-based compensation, such as Lerner and Wulf (2006), who
study the link between innovation and incentive compensation for R&D managers, or Aghion,
Van Reenen and Zingales (2009), who examine the link between institutional shareholding and
innovation.
Finally, our paper adds to a small literature that uses asymmetric beliefs to model the inno-
vation process. For instance, in Klepper and Thompson (2007, 2010), asymmetric beliefs about
4
the potential of a new technology lead to spin-outs, whereby entrepreneurs leave incumbent
firms to work on a new idea.
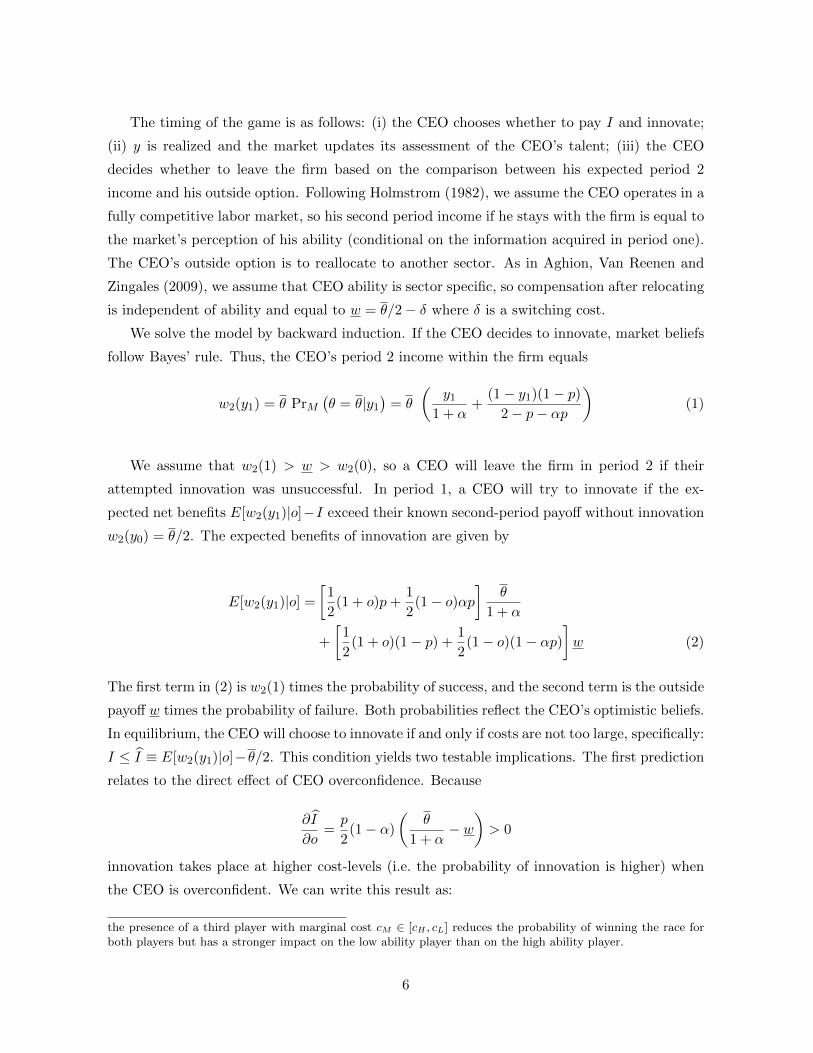
2 A Model of Overconfidence and Innovation
Aghion, Van Reenen and Zingales (2009) extend the Holmstrom (1982) career concern model
by allowing innovation to serve as an indicator of managerial ability. This section builds on
their framework by introducing managerial overconfidence.
Consider a CEO whose ability θ ∈{
0, θ}
, where θ > 0, is unknown to the market (M) and
to the CEO (C). The market and CEO have different prior beliefs about CEO ability, denoted
by PrM and PrC respectively. Specifically, we assume that
1
2= PrM (θ=θ) < PrC(θ=θ) =
1
2(1 + o).
where o ∈ (0, 1] is a parameter that measures CEO overconfidence. Since o > 0, the overcon-
fident CEO believes that the market underestimates his expected talent. This belief structure
is common knowledge.2
The model has two periods, t = 1, 2. In period 1, the CEO decides whether to stay the
present course, or try for an innovation i ∈ {0, 1}. One might think of this as an observable
choice between taking the firm in a new direction, which leads to a broad increase in exploration,
versus sticking with an established strategy. If the CEO does not innovate (i = 0), the firm’s
second period revenue is y0 = 0 and no information is revealed about the CEO’s ability. If
the CEO does innovate (i = 1), he incurs an innovation cost I, and the second period revenue
y1 ∈ {0, 1} provides information about θ. Specifically, we assume that
E[y1|θ = θ] = p > E[y1|θ = 0] = αp
where α ≡ 1 − π, and π ∈ [0, 1) is an index of product market competition. Thus, high
ability CEOs are more likely to succeed, and the link between CEO ability and performance is
stronger when competition is more intense. The term α can be interpreted as a reduced form
of an un-modeled race in which a patent is awarded to the best idea in a technology field. The
greater the degree of competition, the less likely are low ability CEOs to find innovations that
distinguish them from competitors.3
2See Galasso (2010) for a discussion of the role of common priors in economic models.3Consider this simple rent seeking game that Baye and Hoppe (2003) show is equivalent to a classic patent
race model. Two players H (high ability) and L (low ability) exert effort, x sustaining marginal costs cH andcL with cH < cL. The probability that each player obtains the patent is xi/(xi +xj). It is possible to show that
5
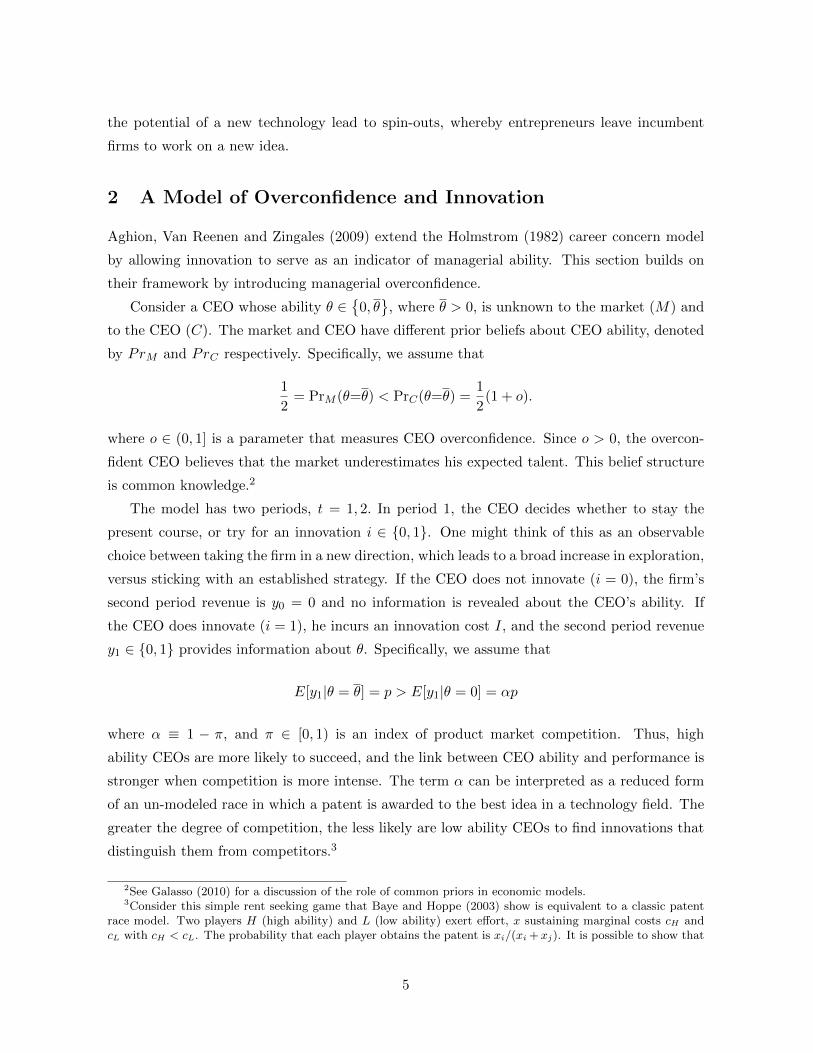
The timing of the game is as follows: (i) the CEO chooses whether to pay I and innovate;
(ii) y is realized and the market updates its assessment of the CEO’s talent; (iii) the CEO
decides whether to leave the firm based on the comparison between his expected period 2
income and his outside option. Following Holmstrom (1982), we assume the CEO operates in a
fully competitive labor market, so his second period income if he stays with the firm is equal to
the market’s perception of his ability (conditional on the information acquired in period one).
The CEO’s outside option is to reallocate to another sector. As in Aghion, Van Reenen and
Zingales (2009), we assume that CEO ability is sector specific, so compensation after relocating
is independent of ability and equal to w = θ/2− δ where δ is a switching cost.
We solve the model by backward induction. If the CEO decides to innovate, market beliefs
follow Bayes’ rule. Thus, the CEO’s period 2 income within the firm equals
w2(y1) = θ PrM(θ = θ|y1
)= θ
(y1
1 + α+
(1− y1)(1− p)2− p− αp
)(1)
We assume that w2(1) > w > w2(0), so a CEO will leave the firm in period 2 if their
attempted innovation was unsuccessful. In period 1, a CEO will try to innovate if the ex-
pected net benefits E[w2(y1)|o]−I exceed their known second-period payoff without innovation
w2(y0) = θ/2. The expected benefits of innovation are given by
E[w2(y1)|o] =
[1
2(1 + o)p+
1
2(1− o)αp
]θ
1 + α
+
[1
2(1 + o)(1− p) +
1
2(1− o)(1− αp)
]w (2)
The first term in (2) is w2(1) times the probability of success, and the second term is the outside
payoff w times the probability of failure. Both probabilities reflect the CEO’s optimistic beliefs.
In equilibrium, the CEO will choose to innovate if and only if costs are not too large, specifically:
I ≤ I ≡ E[w2(y1)|o]−θ/2. This condition yields two testable implications. The first prediction
relates to the direct effect of CEO overconfidence. Because
∂I
∂o=p
2(1− α)
(θ
1 + α− w
)> 0
innovation takes place at higher cost-levels (i.e. the probability of innovation is higher) when
the CEO is overconfident. We can write this result as:
the presence of a third player with marginal cost cM ∈ [cH , cL] reduces the probability of winning the race forboth players but has a stronger impact on the low ability player than on the high ability player.
6
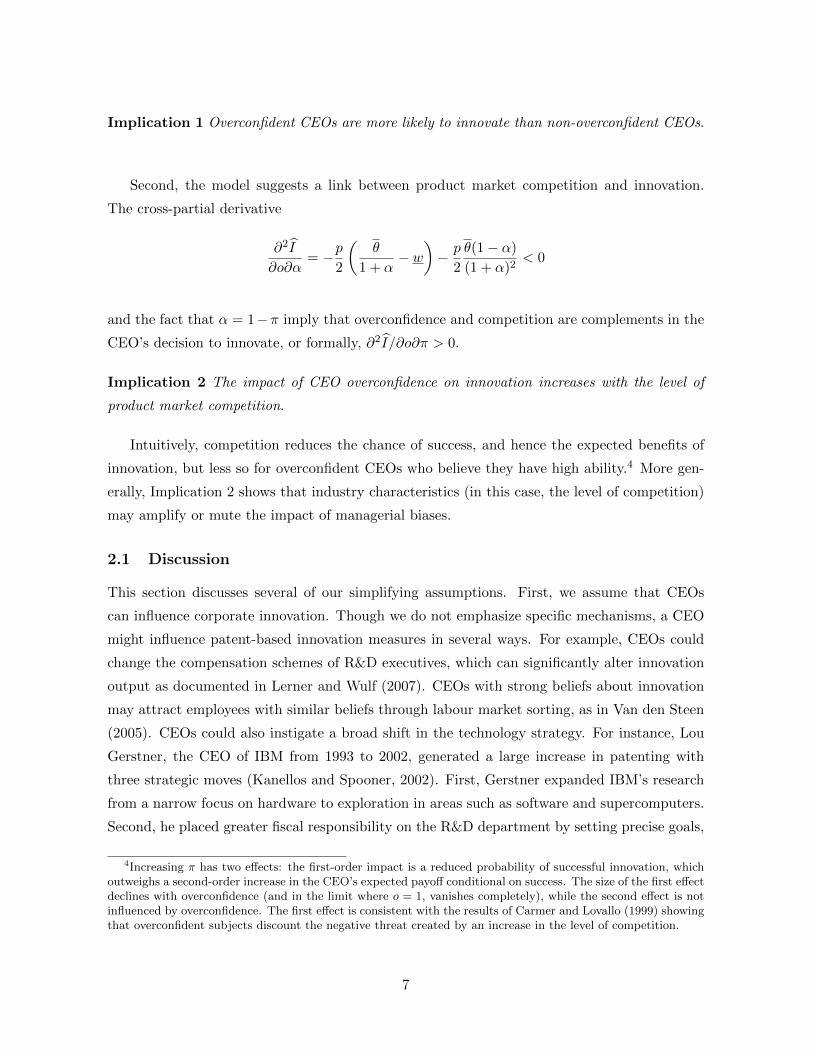
Implication 1 Overconfident CEOs are more likely to innovate than non-overconfident CEOs.
Second, the model suggests a link between product market competition and innovation.
The cross-partial derivative
∂2I
∂o∂α= −p
2
(θ
1 + α− w
)− p
2
θ(1− α)
(1 + α)2< 0
and the fact that α = 1−π imply that overconfidence and competition are complements in the
CEO’s decision to innovate, or formally, ∂2I/∂o∂π > 0.
Implication 2 The impact of CEO overconfidence on innovation increases with the level of
product market competition.
Intuitively, competition reduces the chance of success, and hence the expected benefits of
innovation, but less so for overconfident CEOs who believe they have high ability.4 More gen-
erally, Implication 2 shows that industry characteristics (in this case, the level of competition)
may amplify or mute the impact of managerial biases.
2.1 Discussion
This section discusses several of our simplifying assumptions. First, we assume that CEOs
can influence corporate innovation. Though we do not emphasize specific mechanisms, a CEO
might influence patent-based innovation measures in several ways. For example, CEOs could
change the compensation schemes of R&D executives, which can significantly alter innovation
output as documented in Lerner and Wulf (2007). CEOs with strong beliefs about innovation
may attract employees with similar beliefs through labour market sorting, as in Van den Steen
(2005). CEOs could also instigate a broad shift in the technology strategy. For instance, Lou
Gerstner, the CEO of IBM from 1993 to 2002, generated a large increase in patenting with
three strategic moves (Kanellos and Spooner, 2002). First, Gerstner expanded IBM’s research
from a narrow focus on hardware to exploration in areas such as software and supercomputers.
Second, he placed greater fiscal responsibility on the R&D department by setting precise goals,
4Increasing π has two effects: the first-order impact is a reduced probability of successful innovation, whichoutweighs a second-order increase in the CEO’s expected payoff conditional on success. The size of the first effectdeclines with overconfidence (and in the limit where o = 1, vanishes completely), while the second effect is notinfluenced by overconfidence. The first effect is consistent with the results of Carmer and Lovallo (1999) showingthat overconfident subjects discount the negative threat created by an increase in the level of competition.
7

cutting waste, and rewarding successful innovators. And third, Gerstner increased efforts to
exploit the company’s patents, generating a substantial increase in licensing revenue.
In our stylized model, the players’ beliefs should converge over longer time-horizons, thereby
weakening the link between overconfidence and innovation. However, Yildiz (2004) shows that
the conditions for complete learning become extremely onerous when the signal space — in
our model, the binary variable y1 — grows more complex. In practice, CEOs can send a large
variety of signals to the market, making it reasonable to assume that beliefs about ability need
not converge during a typical CEOs tenure.5
We consider several extensions to our baseline model in an on-line Appendix. First, building
on Malmendier and Tate (2005), we add a budget constraint to the model, and assume that
a CEO must finance innovation efforts using either internal funds (cash) or external finance
(debt). This extended model shows that innovation by overconfident CEOs is more sensitive
to cash flow than innovation by non-overconfident CEOs. Intuitively, because overconfident
CEOs accept a larger range of projects, their budget constraints are more likely to be binding.
Therefore, a marginal increase in cash-flow tends to have a greater impact on the investment
decisions of biased CEOs. A second set of extensions show that our results do not depend on
not depend on specific assumptions about how to model the CEO’s outside option (e.g. we
consider non-sector specific ability, as in Aghion, Van Reenen and Zingales (2009), and also
drop the switching cost δ). Finally, we generalize our set-up and show how our main results still
hold under alternative assumptions about the interplay between competition and innovation.
Of course, our stylized career concerns model omits many factors that might influence either
a firms innovation strategy or the market’s assessment of CEO ability. Since CEOs may respond
to all of these forces, we now turn to the data and use a novel measure of CEO overconfidence
to evaluate the main predictions of the model.
3 Data and Methods
We begin with a panel of 450 large publicly traded U.S. firms between 1980 and 1994. These
data are described in Hall and Liebman (1998) and Malmendier and Tate (2008). Each firm in
the sample appeared at least four times on a Forbes magazine list of the largest U.S. companies.
These data provide a very detailed picture of CEO’s stock option holdings, which Malmendier
and Tate (2008) use to construct the measure of CEO overconfidence described below.
5One obvious way to expand the signal space of our model is to assume that the CEO’s initial beliefs areunknown to the market. This leads to a two-dimensional career concern model, similar to the one studied inKoszegi and Li (2008). Their results suggest that overconfidence may increase innovation in this more complicatedsetting.
8

We use the Compustat firm identifier (GVKEY) to merge this panel of large publicly traded
firms to the NBER US patent data file. The NBER patent data are described in Hall et al.
(2001), and provide detailed information on all U.S. patents during our sample period, including
application and grant years, citations to other patents, and assignee codes that can be used
to identify the owner. To match U.S. patent assignee codes with Compustat firms, we started
with the name-matching tool of Bessen (2009) and then searched by hand for variations on the
names in our panel. After dropping firms in the Finance, Insurance and Real Estate sector
(one-digit SIC code 6), which has a very low rate of patenting, we arrive at an estimation
sample with 290 firms, 3,648 firm-years and 627 individual CEOs, covering the period 1980 to
1994.6 Table 1 provides summary statistics for this sample.
Our primary measure of innovation is a citation-weighted count of U.S. patents. Patent
citations identify prior knowledge upon which a patent builds and delimit the scope of the
property rights awarded to the inventor. A patent examiner who is an expert in the tech-
nology area is responsible for insuring that all appropriate patents have been cited. Because
of this important legal function of patent cites, the economics of innovation literature has of-
ten employed the number of forward-citations received by a patent as an indirect measure of
patent value (Pakes and Griliches, 1980; Hall et al., 2005; Harhoff et al., 1999; Aghion et al.,
2009, inter alia).7 Since citation counts are inherently truncated, we weight each patent by the
truncation-adjusted citation count field contained in the NBER patent data file (see Hall et al.,
2001, for details).
We match patents to firm-year observations according to their filing date, which approxi-
mates the date of invention, since the patent system provides incentives to file quickly. While
filing dates may anticipate a CEO’s ultimate payoff from innovation, we view this as a reason-
able choice given the evidence that lags from application to grant are short on average (1.89
years in our data), citations peak roughly two years after a patent is granted (Mehta, Rysman
and Simcoe 2010), and Tobin’s q is correlated with the future citations of a firm’s current
patent stock (Hall, Jaffe and Trajtenberg 2005), suggesting that cites are a lagging indicator
of value.8
Ideally, we would like to identify patents that are attributable the actions of a particular
CEO. Unfortunately, we have no information on when specific research investments were initi-
6Retaining firms from the FIRE sector does not change the main results.7A number of studies have been conducted to validate the use of patent cites. Harhoff et al. (1999) show
that the price at which a patentee was willing to sell a patent is highly correlated with the citations received bythe patent. Highly cited patents have been shown to be more frequently litigated (Lanjouw and Schankerman,2001), more frequently traded among firms (Serrano, 2010) and to boost market value (Hall et al., 2005).
8While it may take a long time to for a patented innovation to be embedded into products and to generateprofits there is evidence that markets react very quickly to patent awards (Hall, Jaffe and Trajtenberg, 2005).
9

ated, and we know of no research that tries to measure the average time lag between starting
a research project and issuance of the first related patent.9 Moreover, if R&D investments are
staged, it may be impossible to partition “responsibility” for a given patent between CEOs
who make complementary investment decisions at different stages of the research process. Nev-
ertheless, it is reasonable to think that a new CEO might quickly influence research at all
stages of the development process, through both investment decisions, and by changing the
firm’s strategic priorities. And a virtue of linking patents to CEOs based on the patent’s filing
date is that we know the overconfident CEO was responsible for the final decision to incur the
application costs.
We also consider several additional innovation metrics. First, we de-compose our primary
citation-weghted patent measure into an unweighted patent count, and the average number
of citations per patent (excluding self cites). Second, we use the research and development
expenditures (Compustat item 46) as a measure of innovation inputs. Since firms are not
required to account for their R&D expenditures, this variable has many missing values, even
after we interpolate over any gaps of three years or less. Finally, in a series of extensions, we
examine changes in originality (i.e. dispersion of citations across technology areas) and in the
share of self-citations. Table 1 shows that the distribution of innovative activity in our sample is
highly skewed. While the median firm-year observation consists of a single patent that receives
6 citations, the sample mean is much higher, at 28 patents and 489 cites.
To measure competition, we use a Lerner index, as in Aghion et al. (2009). Specifically,
we calculate the median gross margin of all firms in the Compustat database with the same
two-digit SIC code as a focal firm. Our baseline model allows this competition measure to vary
over time. However, we also consider robustness tests that use a time-invariant Lerner index,
or a dummy for firms whose average gross margin over the entire sample period falls above the
median of all firms in the estimation sample.
In our regressions we condition on size and the capital-labor ratio, as suggested by literature
on patent production functions (see inter alia Aghion et al., 2009; and Hall and Ziedonis, 2001).
At the CEO level, we control for age and tenure (and their squared terms) to capture experience
and career concern incentives of the top executives. We also include control variables for the
effects of CEO stock ownership and options holding. Our main Compustat items are sales
(item 1); a capital-labor ratio constructed from the book value of total assets (item 6) and
the number of employees (item 29); and a deflated R&D stock. To construct the R&D stock,
9We expect that in some industries (e.g. software) the time from initial idea to patent application maybe quite short, and in others (e.g. pharmaceuticals) quite long. However, such measurements would be quitedifficult if the research process is cumulative and chaotic, with overlapping projects and opportunistic patentapplications, rather than an orderly “linear” process that proceeds from investment to outcome.
10

we follow the method described in Hall (1990), depreciating all reported R&D activity at a
rate of 15 percent over a ten year period. As in Malmedier and Tate (2005a, 2005b, 2008),
we construct a measure of cash-flow adding Compustat earnings before extraordinary items
(item 18) and depreciation (item 14). We also have several CEO-level control variables used
in Malmendier and Tate (2008), including age, job tenure, and a set of dummies categorizing
their educational background as finance or technical. CEOs with a “finance” background
received a degree in accounting, finance, business (including MBA) or economics. CEOs with
a “technical” background received a degree in engineering, physics, chemistry, mathematics,
operations research, biology or applied sciences.
3.1 Measuring Overconfidence
Our measures of CEO overconfidence build on a series of papers by Malmendier and Tate.
These papers use CEOs’ personal investment decisions to construct a proxy for overconfidence,
or systematic over-estimation of the returns to holding stock in their own firm. The key idea
behind this measurement strategy is to focus on the decision to exercise executive stock options.
These options give the holder a right to purchase stock in their own company, usually at the
prevailing price on the date of the option grant. They typically have a ten year life, and are
fully exercisable after a four year vesting period. At exercise, the shares are almost always
immediately sold.
While investors may hold ordinary options because the right to delay a stock purchase has
positive value, executive stock options have several unique features that create strong incentives
for exercise, so long as they are fully vested (and in the money). In particular, executive stock
options are non-tradable, and CEOs cannot legally hedge their risk by short-selling shares in
their own firm. Moreover, most CEOs are highly exposed to idiosyncratic risk associated with
their own firm through equity compensation, stock holdings and firm-specific human capital.
Consequently, standard models of decision-making under uncertainty (e.g. Hall and Murphy,
2002) indicate that a risk-averse CEO should exercise vested executive options before expiration
as long as the stock price is sufficiently high. Nevertheless, many of the CEOs in our sample fail
to exercise their executive options, often repeatedly. Malmendier and Tate use this behavior
as an indicator of CEO overconfidence, or systematic over-estimation of expected returns from
holding the stock.
While there are other potential explanations for a CEO’s decision to hold fully vested ex-
ecutive options, Malmendier and Tate (2008) provide strong evidence for the overconfidence
interpretation. In particular, their research shows that failure to exercise in-the-money execu-
tive options is positively associated with value-destroying merger and acquisition activity, and
11

a relatively high sensitivity of investments to cash flows. These findings are consistent with
the idea that overconfident CEOs believe they can make good investments, but perceive the
market price of debt financing as too high. Malmendier and Tate also find that CEOs do not
earn abnormal returns from holding their executive options, relative to a benchmark case of
exercising the options and investing the proceeds in an S&P 500 stock index. This suggests that
“late” exercise does not reflect inside information about the future prospects of the company.10
After considering a variety of other interpretations (e.g. board pressure, risk-tolerance, taxes
and procrastination) Malmendier and Tate (2008) argue that the broad pattern of results is
most consistent with the idea that CEOs who fail to exercise their fully vested and in the money
executive options are systematically over-estimating the future performance of their own firm,
i.e. they are overconfident. We build on the measurement strategy of Malmendier and Tate
(2008) to construct two proxies for CEO overconfidence:
Holder67 This indicator variable is identical to the Holder67 variable in Malmendier and
Tate (2008). To construct this variable, they examine all fully vested CEO option packages five
years before expiration. The variable Holder 67 equals one for any CEO that fails to exercise an
executive option after their stock price has risen by at least 67 percent. This 67 percent exercise
threshold is calibrated using the Hall and Murphy (2002) framework, assuming that two-thirds
of CEO wealth is tied to company stock. Under this framework, failing to exercise an option
that is 67 percent in the money implies a constant relative risk-aversion parameter of three.
This measure treats overconfidence as an absorbing state: once a CEO becomes overconfident,
they will never change back. While a CEO may switch from “rational” to overconfident within
our sample, it is a rare event; most retain their initial classification throughout the sample
period.
In our estimation sample, Holder67 classifies roughly half of all CEOs as overconfident.
However, a large proportion of all CEOs are not classified, either because they served a short
tenure (so there was no opportunity to exercise a fully vested option package), or because their
stock price did not appreciate by 67 percent. Moreover, Holder67 is only defined for CEOs
who have been with a company for at least four years. Thus, our estimation sample contains
1,344 observations where Holder67 is defined. One can think of Holder67 as identifying CEOs
who become overconfident following a 67 percent increase in the stock price of their firm. Our
second measure is motivated by the idea that overconfidence may be a permanent trait.
Overconfidence This measure is a CEO fixed effect that equals one for all CEOs where
Holder67 equals one, and zero for all CEOs where Holder67 equals zero. In practical terms,
10A literal reading of our stylized model suggests that CEOs are waiting for uncertain innovation outcomesto be revealed. A more encompassing view is that CEO option-holding reflects a broad divergence of opinionregarding the firm’s overall prospects.
12

Overconfidence is simply the maximum value of Holder67 for a given CEO. This is useful for
models where we wish to exploit within-firm variation associated with the arrival of an over-
confident CEO, as opposed to a cross-sectional difference between firms. While Overconfidence
is defined for 2,230 observations in our sample, there are still 1,418 observations where it is
undefined because of a short tenure or a stock that did not appreciate by at least 67 percent.
Our main results are robust to re-classifying these missing CEOs as non-onverconfident, though
we have no justification for doing so.
Our data have some limitations relative those in Malmendeir and Tate (2008). For example,
while they show that the choice of a particular cut-off does not affect the main results, we
only observe the Holder67 dummy, and cannot use the detailed option-holdings to construct
alternative exercise thresholds.
3.2 Methods
Our main econometric models focus on the relationship between count-based measures of inno-
vative activity Yit at firm i in period t, and measures of CEO overconfidence Oit. We typically
model the conditional expectation of innovative activity as
E[Yit] = exp(αOit + xit−1β + γi + λt) (3)
where xit−1 is a vector of control variables (lagged one period to account for obvious forms of
simultaneity), γi is a firm-specific idiosyncratic effect, and λt is a vector of time-period effects.
Equation (3) uses the log-link formulation because of the non-negative and highly skewed
nature of our count-based dependent variables.11 We allow for arbitrary heteroskedasticity and
autocorrelation (i.e. clustering standard errors).12
When x includes measures of the firm’s R&D stock, equation (3) can be interpreted as a
“knowledge production function” that translates past research investments into new inventions.
In that formulation, α indicates whether firms led by overconfident CEOs receive more cite-
weighted patents per dollar of R&D expenditure, so it is a measure of efficiency. We also
estimate models that omit the R&D stock from x, in which case α measures the combined
impact of changes in R&D stocks and inventive efficiency.
Our identification comes primarily from changes in innovative performance across CEOs
within a firm. We do not have an instrument for CEO overconfidence, or a canonical difference-
11Wooldridge (1999) emphasizes that Poisson quasi maximum-likelihood estimation will yield consistent es-timates as long as the conditional mean is correctly specified, making it equally appropriate for positive andcontinuously-valued variables, such as R&D.
12Our results are robust to clustering standard errors at the level of two-digit SIC codes, firms or CEOs.
13

in-differences set-up where “treated” firms exogenously switch to overconfident CEOs at a point
in time. The controls xit−1 and firm effects γi therefore play an important role in our analysis,
though we perform several robustness checks designed to placate endogeneity concerns.
The main method that we use to introduce the firm-specific effects γi in equation (3) is the
“mean scaling” estimator of Blundell et al. (1999). This method uses pre-sample data on the
dependent variable to construct a mean, which then enters the estimation directly (analogously
to xit) to account for initial conditions. We use ten years of pre-sample data, though Blundell
et al. (1999) show that the approach performs well even with relatively short pre-sample periods.
While a conditional fixed effects model, such as the fixed-effects Poisson estimator of Hausman
et al. (1984), isolates the within-firm variation, it also assumes that xit is strictly exogenous (i.e.
uncorrelated with past, present and future shocks to yit). This strict exogeneity assumption
would be false if, for example, an unobserved shock in the value of firm’s technology causes
firms to increase both current R&D and future patenting efforts. The mean-scaling estimator
relaxes the strict exogeneity assumption and provides consistent estimates under the weaker
assumption of predetermined xit, as long as the first-moments of the data are stable.
4 Results
Table 2 presents our first set of regression results, which show a robust positive association
between CEO overconfidence and innovation. The dependent variable in all models is a cite-
weighted patent count, or equivalently, a total forward citation count for issued patents applied
for in year t. All models in Table 2 are estimated via Poisson, with robust standard errors to
account for over dispersion. Columns (1) through (4) use the Overconfidence measure, while (5)
and (6) consider the alternative Holder67 variable, which leads to a smaller estimation sample.
We begin in column (1) with a model that includes only firm, year and two-digit SIC
code effects, along with the overconfidence measure. Exponentiating the coefficient of 0.39
suggests that overconfident CEOs obtain 48 percent more citation-weighted patents than their
non-overconfident counterparts. Column (2) adds controls for lagged sales, the firm’s capital to
labor ratio, the CEO’s age, age squared, tenure and tenure squared, and the levels of CEO stock
ownership and vested option holdings.13 This produces almost no change in the Overconfidence
coefficient relative to the model containing only the pre-sample means of inventive output.
In columns (1) and (2), the Overconfidence coefficient α measures the combined impact
of changes in efficiency (more output per dollar of R&D) and innovative intensity (greater
13Stock Ownership measures the percent of company stock held by the CEO at the beginning of the year,while Vested options equals the number of options exercisable in the first six months of the year normalized bytotal shares outstanding.
14

spending on innovation). In column (3) we add the log of each firm’s R&D stock, so the
model becomes a patent production function, where α measures the patenting premium of
overconfident CEOs per dollar of lagged R&D spending. As expected, we observe a very
robust positive correlation between past R&D and current patenting (see Hall et al., 2005).
The coefficient on Overconfidence also declines by about 33 percent, to 0.24, indicating that
Overconfident CEOs obtain 28 percent more cite-weighted patents per dollar of lagged R&D
spending than their counterparts. This difference could reflect either a higher patent propensity
among overconfident CEOs, or a change in the direction of innovative activity that leads to
greater research productivity.14
Perhaps the results in column (3) are driven by overconfident CEOs’ greater propensity for
mergers and acquisitions? To address this concern, we collected data on M&A transactions by
firms in our sample from the Thompson Financial SDC database and created a variable called
M&A, which counts the number of completed deals for each firm-year.15 Column (4) of Table 2
shows that acquisitions are associated with an increase in forward-citations per dollar of R&D.
However, the overconfidence coefficient changes only marginally with the introduction of this
control for M&A activity.
Columns (5) and (6) estimate the same model as (2) and (3) using the alternative Holder67
measure of overconfidence. Since Holder67 is only defined starting in the year when a CEO holds
a fully vested executive stock option that has appreciated by 67 percent or more, the sample
size declines sharply. However, the pattern of results is very similar. While the coefficient on
overconfidence is slightly greater, it still falls by about 20 percent when we move to a production
function model that includes the R&D stock.
For the unreported controls, we find that CEO tenure and age are inversely related to
innovative output. In particular, the quadratic terms for both age and tenure are jointly
significant at the 1 percent level, and indicate that innovation declines with age and tenure
more steeply when CEOs are young and inexperienced (though the raw correlations between
age tenure and citations are all below 0.05).16 We take these results as support for the career
concern model, since the incentives to innovate are lower for CEOs close to retirement.
Overall, the results in Table 2 document a strong positive association between overconfi-
14Results are similar if: (i) we replace the R&D stock with a stock of cite-weighted patents or with the stockof cites before the CEO takes office; (ii) we replace SIC code effects with fixed effects for the primary USPTOsubcategory or fixed effects for the primary USPTO patent class (nclass).
15Following Malmendier and Tate (2008) we dropped the deals where the acquiring company obtains less than51% of the target share and the deals in which the acquirer already owns more than 51% before the deal. Wealso dropped deals whose targets were small (i.e. sales less than 10% of average sales in our sample).
16The estimated marginal effect for tenure implies that an extra year as a CEO is associated with a reductionin innovation of 2 percent for CEOs with 4 years of tenure (25th percentile) compared to a reduction of 1 percentfor CEOs with 13 years (75th percentile).
15

dence and innovation. The on-line Appendix shows that these findings are robust to a variety of
measurement and empirical modeling strategies, including the use of conditional fixed effects.
We take these results as support of the first prediction in the theoretical model.
4.1 Alternative Innovation Measures
Table 3 asks whether our baseline results are driven by greater output (more patents), greater
input (more R&D), or greater impact (more cites). We find evidence of all three effects.
The first two columns in Table 3 use unweighted patent counts as the dependent variable.
The results in column (1) suggest that overconfident CEOs file for about 20 percent more
patents per dollar of lagged R&D stock than CEOs who are not overconfident. Adding fixed
effects in column (2) causes the coefficients on sales and lagged R&D stock to fall, but has no
noticeable effect on the Overconfidence coefficient.
The middle two columns examine the link between Overconfidence and R&D. We drop the
lagged R&D stock in this specification, since we are focused on inputs, and rely on a conditional
fixed effects estimator because missing data complicates the construction of pre-sample means.
In column (3), we find that overconfident CEOs perform about 18 percent more R&D than a
typical CEO. Adding firm effects reduces this effect slightly (to 17 percent).17 Without more
information on the profits generated by these R&D investments, or the opportunity cost of
invested funds, we cannot say whether the increased expenditures are profit-maximizing. In
particular, since Malmendier and Tate link overconfidence to excessive M&A activity and cash-
flow sensitivity, one might expect these CEOs to over-invest. However, that interpretation
is hard to reconcile with our finding that R&D investments by overconfident CEOs are more
productive (i.e. generate more patents and citations per dollar). It is also worth noting that
if the social returns to R&D exceed the private benefits, as many economists believe, then
over-investment is generally desirable.
The last two columns in Table 3 examine the correlation between CEO overconfidence and
citations per patent.18 The results show a roughly twenty percent increase in the mean citation
rate. Interestingly, there is little correlation between the average citation rate and the firm
level controls of sales, capital-labor ratio and R&D stock. We find this last result especially
intriguing, as it evokes a change in innovative direction or impact, as opposed to merely an
increase in the amount of R&D or patenting by overconfident CEOs.
To further explore changes in the citation rate conditional on receiving a patent, we ran
17The results in Table (3) use linear interpolation (over gaps of three years or less) to replace missing valuesof R&D, but the results are robust to leaving those observations missing or treating them as zeroes.
18We set this variable to zero in firm-years where no patents were filed, but the results change very little ifthose observations are dropped.
16

a series of patent-level regressions. Specifically, we created a patent-year panel dataset that
includes all patents filed by CEOs in our baseline model between 5 years before and 19 years
after patent issuance. Our dependent variable is a count of citations received in a given calendar
year. By moving to the patent level we can add technology-class fixed effects to control for
unobserved heterogeneity in firms’ technology portfolios, along with a combination of patent-age
and citing-year effects to control for truncation (without using the Hall et al. (2001) adjustment
factors) and time-trends in the baseline citation rate.
Column (1) in Table 4 shows that the average annual citation rate for a patent filed by an
overconfident CEO is 3.7 percent higher than for a patent issued to a rational CEO in the same
year and technology category. This model includes patent-age (since grant), application-year,
and technology-class (subcat) by citing-year fixed effects. Columns (2) through (4) show that
when firm effects are added to this model — so the comparison is to a patent issued to the same
firm, in the same technology class, under a different (non-overconfident) CEO — the estimated
impact of overconfidence on citations per year increases to roughly 12 percent. Column (2)
estimates a model with firm, patent-age and citing-year effects.19 Column (3) interacts the
firm fixed-effects with a set of detailed technology codes, based on the primary 3-digit USPTO
classification. Column (4) interacts a less detailed set of technology codes (the NBER subcat
variable) with a full set of citing-year effects to capture the idea that certain technologies may
become hot, and therefore highly cited, at different points in time.
The results of the patent level analysis are consistent with the citations-per-patent findings
in the last two columns of Table 3. Together, these results suggest that patents filed under
overconfident CEOs achieve a greater impact. While we do not have direct evidence on the
underlying mechanisms, one possibility is that overconfident executives take their firms in new
directions, and are therefore more likely to generate foundational patents that receive many
cites. Another possibility is that by pursuing a riskier innovation strategy, overconfident CEOs
spread the distribution of research outcomes, and since they have an option to abandon projects
that do not work out (i.e. by not filing for a patent, or not citing one that is granted) we observe
only the increased weight at the upper end of the citation distribution. To further explore the
latter possibility, the on-line Appendix presents results from a series of patent-level linear
probability models, where the dependent variable is a dummy for cumulative forward citations
greater than 5, 10, 20, 40 or 60 cites.20 We find that patents filed under overconfident CEOs
exhibit a statistically significant 3 percentage point increase in the probability of receiving 20 or
19Note that is it not possible to separately identify the application-year, citing-year and patent-age effects ina model with firm fixed-effects. This issue is discussed at length in Mehta , Rysman and Simcoe (2010).
20These thresholds correspond to the 25th, 50th, 75th, 90th and 95th percentile in the unconditional distri-bution of total citations.
17

more cites (and we find similar effects at the 40 and 60 cite thresholds). These results suggest
that the distribution of research outcomes is more skewed under overconfident CEOs.
4.2 Overconfidence and Competition
Table 5 presents several results related to the second prediction of our model. Specifically,
the model suggests that the association between overconfidence and innovation will be stronger
when firms face more competition. To examine this relationship, we interact the Overconfidence
indicator variable with several variations on the Lerner index, or gross margin, which we assume
is inversely related to product market competition. All of these regressions use our baseline
patent production function specification (see column (3) in Table 2).
Column (1) uses a time-varying Lerner index calculated as the median gross margin of all
firms in a particular two-digit SIC code. In this specification, the main effect of Overconfidence
is economically large and statistically significant. While the main effect of the Lerner index
is negative (less competition yields less innovation), the effect is not statistically significant.
To provide a sense of the effect size, we note that a one standard deviation change in the
Lerner index (or an additional 5 points of gross margin) is associated with a roughly 3 percent
change in cite-weighted patents per dollar of R&D stock. However, the slope of this relationship
between competition and innovation is roughly an order of magnitude larger for overconfident
CEOs. In particular, the interaction between Overconfidence and the Lerner index is large and
statistically significant, as predicted by our model.
In column (2), we find a qualitatively similar pattern using the Holder67 measure of CEO
overconfidence. The main effect of overconfidence is economically large and statistically sig-
nificant. The main effect of competition is negligible. And the interaction is negative and
significant. Once again, the interpretation is that the relationship between Overconfidence and
citation-weighted patents is stronger for firms facing more competition.
Columns (3) and (4) return to our primary Overconfidence measure, but use different mea-
sures of competition. In column (3) we restrict the Lerner index to be constant over time, but
continue to base the measure on the median gross margin of all Compustat firms in a two-digit
SIC code. Note that we cannot estimate a main effect of competition in such a model, since
the measure is collinear with industry effects. The results in column (3) are nevertheless very
close to those in column (1).
Finally, column (4) measures competition using Lerner50, a dummy for firms in an industry
with a time invariant Lerner index that is above the median of all firms in our data set. Thus, we
rely on within-sample variation in competition, rather than variation in the entire Compustat
dataset. Once again, we find that the relationship between innovation and overconfidence is
18

stronger when competition is more intense.
4.3 Extensions and Robustness
4.3.1 Overconfidence and Innovative Direction
Next, we use a series of alternative outcome variables to explore the idea that overconfident
CEOs do not simply increase the level of innovation, but rather cause a change in the direction
pursued by the firms they manage. In columns (1) and (2) of Table 6, the outcome variable is
an originality weighted patent count. Originality, as defined in Hall et al. (2001), is essentially
one minus a Herfindahl of the concentration of a patent’s backwards citations across classes.
Thus, more original patents cite a more diverse array of prior art. The results in columns (1)
and (2) show that originality weighted patent counts increase with CEO Overconfidence, and
more so in industries with lower gross margins.
In columns (3) and (4), we use self-citations to construct a new measure called the Derivative
Patent Share. We classify a patent as derivative if more than half of its backward citations
are self-cites, i.e. the patent’s reference list primarily cites other patents assigned to the same
firm. We then calculate the proportion of all patents that are “derivative” for a given firm-
year and use that proportion as our outcome variable. Column (3) shows that there is no
meaningful relationship between Overconfidence and the derivative patent share in the pooled
panel regressions. However, when Overconfidence is interacted with competition, we find that
derivative patenting declines for overconfident CEOs, but increases for overconfident CEOs
when there is little competition. This result suggests that overconfident CEOs in profitable
industries increase innovation, but focus on familiar problems. Overconfident CEOs in highly
competitive fields appear to try for new innovations, perhaps in an effort to escape from the
levels of competition at their current product-market location.
4.3.2 CEO Autonomy and Cash Flow Sensitivity
To examine whether the impact of overconfidence is influenced by the degree of autonomy of
the CEO, we introduce a dummy for CEOs who also hold the titles of Chairman and President.
These titles are used in the corporate governance literature as proxies for centralized executive
control over corporate decisions. Thus, we expect the impact of overconfidence to be stronger
for CEOs who are also Chairman and President. The estimates in columns (1) and (2) of Table 7
confirm this prediction and show that the effects of overconfidence and Holder67 are roughly 42
percentage points larger when the CEO has multiple titles. This result complements the findings
of Adams et al. (2005), who show that firms with powerful CEOs experience more variability in
performance. In the absence of interaction with overconfidence, the CEO-Chairman variable has
19

a positive coefficient (0.063) but it is not statistically significant (p-value 0.33). In the smaller
sample where Holder67 is defined, CEO-Chairman also has a positive coefficient (0.122) and it
is significant at the 10 percent level. Overall these results suggest that powerful CEOs are more
likely to innovate, but that this effect is mainly driven by CEOs who are both overconfident
and powerful. Because we only have one simple measure of CEO autonomy, we leave a more
careful study of this topic for future research.
Table 6 also explores the sensitivity of R&D investments to cash flow, defined as Compustat
earnings before extraordinary items (item18) plus depreciation (item 14). As stressed in Mal-
mandier and Tate (2005, 2008), overconfident CEOs should prefer internal funds to external
funds because they perceive their company to be undervalued by the market. Therefore, we
expect R&D investments of overconfident CEOs to be more sensitive to cash flow. Columns (3)
and (4) of Table 7 add a control for cash flow and its interaction with overconfidence. The
main effect of cash-flow is statistically insignificant, suggesting that it has no impact on R&D
investments for rational CEOs. But the positive and statistically significant interaction term
shows that overconfident CEOs increase their R&D investments more when they experience
greater positive cash flows, as expected.21
4.3.3 Endogeneity
Since overconfident CEOs are not randomly matched to firms, there is a concern that our
results could be driven by companies that appoint overconfident CEOs in periods of successful
innovation. To assuage this concern, we use a sub-sample of the full data set to conduct a within-
firm analysis that identifies the Overconfidence effect purely from changes in innovative activity
before and after CEO changes that create an increase in overconfidence. While this analysis does
not solve the endogenous matching problem in the sense of having a valid instrumental variable
for CEO overconfidence, it allows us us to use methods that are familiar from difference-in-
differences estimation to ask whether firms were behaving differently in observable ways before
selecting an overconfident CEO.22
We start this CEO switching analysis by identifying 28 cases where a CEO who was either
21We also explored the impact of cash flow on the productivity of R&D (i.e. citation weighted patent counts).We found that R&D productivity of overconfident CEOs is sensitive to cash flow only for the most cash con-strained firms (those in the bottom quartile of our sample for the Kaplan and Zingales (1996) measure of internalresources).
22One might also worry that some firms are not “at risk” for selecting an overconfident CEO, or vice versa.Since we mainly rely on within-firm variation, our models should absorb time-invariant factors that influencethe CEO selection process. However, our analysis remains vulnerable to time-varying omitted variables thatdrive both CEO selection and innovative performance; the switching analysis is meant to address this concern.We also tried to collect information on candidates who were passed over for the CEO position, but this provedchallenging for two reasons: press coverage of losing candidates was minimal, and since these contenders are notin our data, we cannot use the stock-option measures to assess their overconfidence.
20

not-overconfident or unclassified was replaced by an overconfident CEO. In each case, we re-
tained data for the four years preceding the switch and all subsequent years of data for the
overconfident CEO. To obtain a control sample, we performed a similar exercise to identify
24 cases where a not-overconfident or unclassified CEO was replaced by a not-overconfident
CEO. We use the resulting dataset to compare the change in innovation when a new CEO
is overconfident to the change when the new CEO is not overconfident, which leads to the
familiar difference-in-differences estimator. However, the main purpose of this regression is not
to estimate the Overconfidence effect, but rather to test the hypothesis that the time-trend
of the dependent variable was different at the treatment and control firms prior to the CEO
switch. We estimate fixed-effects Poisson models to isolate within-firm variation, and we drop
the firm-level controls which are unlikely to be strictly exogenous. Results for these regressions
are reported in the on-line Appendix.
Figure 1 provides a look at the impact of a switch to an overconfident CEO on cite-weighted
patents. Here, we allow the “treatment effect” to vary for each year, normalizing the coefficient
for one year before the switch to zero. The figure shows that there is no discernible trend prior
to the switch. In the year of the switch, there is a sharp increase, which doubles over the next
two to four years, before levelling off.
While the analysis of CEO switching helps address concerns about endogenous matching,
one might also be concerned about reverse causality. In particular, if an exogenous increase
in innovation leads CEOs to become overconfident, and thus hold more options, overconfident
CEOs are not affecting innovation; it is innovation that causes overconfidence. However, we
have two pieces of evidence that help distinguish the direction of causality. First, columns (1)
and (2) in Table 6 indicate that the correlation between overconfidence and innovation is
stronger for CEOs that have greater autonomy. This correlation is difficult to reconcile with
reverse causality. If increased innovation is causing a change in confidence, the results in
Table 6 would imply that CEOs with less autonomy become overconfident more easily (i.e. at
a lower innovation level) than CEOs with greater control. Second, to further investigate the
direction of causality we split the overconfidence dummy into two separate dummy variables:
Pre-Holder67 and Post-Holder67. Post-Holder67 is equal to one only after the CEO reveals his
overconfidence for the first time.23 Including both variables in our baseline regression, we find
that only Post-Holder67 is statistically significant, thus suggesting that it is not an increase in
patenting activity that induces CEOs to postpone option exercise.
23More precisely, the variable Post-Holder67 equals to 1 when Holder67 is equal to one and is equal to zerowhen Holder67 is equal to zero or when Holder67 is not defined. The variable Pre-Holder67 equals 1 for the restof the CEO years.
21
4.3.4 Additional Robustness Checks
This section describes a variety of additional extensions and robustness checks that interested
readers can find in the on-line Appendix. First, we show that our main results are robust
to using a conditional fixed-effects specification. While the mean scaling estimator allows
us to include pre-determined (but not strictly exogenous) firm-level covariates, it does not
isolate the within-firm co-variation of overconfidence and innovation, as evidenced by the fact
that we can include SIC effects. To isolate such variation, we use the fixed-effects Poisson
estimator (Hausman et al., 1984) which is analogous to the familiar within group OLS estimator
and assumes that all covariates are strictly exogenous. Despite eliminating all between-firm
variation, we still find support for the two testable implications of our model: overconfidence
is positively correlated with innovation and the correlation is stronger when product market
competition is more intense.
A second series of extensions demonstrates that our main results are robust to including
extra covariates and changing the model specification. In particular, the results are not affected
when: (i) we control for investment opportunities (Tobin’s Q); (ii) we allow for dynamics using
a multiplicative feedback model that controls for the logarithm of lagged cite-weighted patent
counts; (iii) we introduce industry specific time-trends by interacting the industry fixed effects
with the calendar year, or; (iv) we use a negative binomial specification.
A third set of robustness checks considers an alternative measure of overconfidence. To
strengthen the overconfidence interpretation of their results, Malmendier and Tate (2008) use
business press coverage data to identify CEOs depicted as “optimistic” or “confident.” We
conduct a similar exercise using articles from the Wall Street Journal, New York Times, Business
Week, Financial Times and Economist during the sample period. We find that this alternative
overconfidence measure is positively correlated with citation-weighted patent counts, and that
the correlation is stronger in more competitive industries.
Finally, we show that our results can be replicated using a different sample of firms in a
later time-period. Our main analysis uses a dataset originally constructed by Hall and Liebman
(1998) and Malmandier and Tate (2005a; 2005b; 2008). The main virtue of these data is the
ability to create Holder67, a relatively precise measure of executive option-holding behavior.
Their primary limitation is the small sample, which contains only 290 innovating firms. We used
the larger S&P ExecuComp database, which reports information on executive compensation for
S&P 1,500 companies from 1992 to 2009, to construct an alternative measure of vested-option-
holding. Once again, we find support for the predictions of the model: the correlation between
innovation and overconfidence is positive and significant and the coefficient on the interaction
between the Lerner index and overconfidence is negative and significant.
22

5 Conclusions
In this paper we study the relationship between CEO overconfidence and innovation. We
use a simple career concern model to show that CEO overconfidence can increase innovation.
The model also predicts that the impact of overconfidence will be stronger when product
market competition is more intense. We find strong empirical support for these predictions.
In particular, overconfident CEOs obtain more cite-weighted patents, and this effect increases
with product market competition.
We interpret these findings as evidence that overconfident CEOs are more likely to initiate
a significant change in their firm’s innovation strategy. More broadly, our results suggest that
applying tools from behavioral economics to questions in the field of innovation may yield
novel insights into the determinants of R&D investments and patenting. Our findings also
complement those of Aghion et al. (2009), who show that institutional ownership encourages
innovation by reducing the likelihood that a CEO is dismissed after a decline in profits. Our
results show that overconfidence encourages innovation by reducing a CEO’s internal beliefs
about the likelihood of failure.
Although we show that overconfident CEOs obtain more patents and citations per dollar
of R&D, these results do not imply that overconfident CEOs make optimal, or even profitable,
R&D investments. Since we use indirect measures of innovation value, and have no information
on the opportunity cost of funds, we cannot rule out over-investment or poor project selection.
Nevertheless, the greater research productivity of overconfident CEOs may offset the negative
impacts of executive overconfidence found in previous research. And if the social returns to
innovation exceed its private benefits, over-investment in corporate R&D would be a desirable
outcome.
References
Adams, R. B., H. Almeida, and D. Ferreira (2005). Powerful CEOs and Their Impact on Corporate
Performance. Review of Financial Studies 18, 1408–1432.
Aghion, P., J. Van Reenen, and L. Zingales (2009). Innovation and Institutional Ownership. NBER
Working Paper 14769 .
Astebro, T. (2003). The Return to Independent Invention: Evidence of Risk Seeking, Extreme Optimism
or Skewness-Loving. The Economic Journal 113, 226–239.
Baye, M. R. and H. C. Hoppe (2003). The strategic equivalence of rent-seeking, innovation, and patent-
race games. Games and Economic Behavior 44 (2), 217–226.
23

Bernardo, A. E. and I. Welch (2001). On the Evolution of Overconfidence and Entrepreneurs. Journal
of Economics & Management Strategy 10 (3), 301–330.
Bessen, J. (2009). Tool for Matching Assignee Names. Technical report, NBER Patent Data Project.
Bloom, N., M. Schankerman, and J. Van Reenen (2005). Identifying Technology Spillovers and Product
Market Rivalry. CEPR Discussion Papers 4912, C.E.P.R. Discussion Papers.
Blundell, R., R. Griffith, and J. van Reenen (1999). Market Share, Market Value and Innovation in a
Panel of British Manufacturing Firms. Review of Economic Studies 66 (3), 529–54.
Camerer, C. and D. Lovallo (1999). Overconfidence and Excess Entry: An Experimental Approach.
American Economic Review 89 (1), 306–318.
Camerer, C. and U. Malmendier (2007). Behavioral Economics and its Applications, Chapter Behavioral
Economics of Organizations. Princeton University Press.
De Meza, D. and C. Southey (1996). The borrowers curse: Optimism finance and entrepreneurship. the
Economic Journal 106, 375–386.
DellaVigna, S. (2008). Psychology and Economics: Evidence from The Field. Journal of Economic
Literature 47 (2), 315–372.
Galasso, A. (2010). Over-confidence may reduce bargaining delay. Journal of Economic Behavior and
Organization 76, 716–733.
Goel, A. M. and A. V. Thakor (2008). Overconfidence, CEO Selection, and Corporate Governance.
Journal of Finance 63 (6), 2737–2784.
Hall, B. H. (1990). The Manufacturing Sector Master File: 1959-1987. NBER Working Paper No. 3366 .
Hall, B. H., A. B. Jaffe, and M. Trajtenberg (2001). The NBER Patent Citation Data File: Lessons,
Insights and Methodological Tools. Working Paper 8498, National Bureau of Economic Research.
Hall, B. H., A. B. Jaffe, and M. Trajtenberg (2005). Market Value and Patent Citations. RAND Journal
of Economics 36, 16–38.
Hall, B. H. and R. H. Ziedonis (2001). The Patent Paradox Revisited: An Empirical Study of Patenting
in the U.S. Semiconductor Industry, 1979-1995. RAND Journal of Economics 32 (1), 101–128.
Hall, B. J. and J. B. Liebman (1998). Are CEOs Really Paid Like Bureaucrats? The Quarterly Journal
of Economics 113 (3), 653–691.
Hall, B. J. and K. J. Murphy (2002). Stock options for undiversified executives. Journal of Accounting
and Economics 33 (1), 3–42.
Harhoff, D., F. Narin, F. M. Scherer, and K. Vopel (1999). Citation frequency and the value of patented
inventions. Review of Economics and Statistics 81 (3), 511–515.
24

Hausman, J., B. Hall, and Z. Griliches (1984). Econometric Models for Count Data with an Application
to the Patents-R&D Relationship. Econometrica 52 (4), 909–938.
Hirshleifer, D. A., S. H. Teoh, and A. Low (2010). Are Overconfident CEOs Better Innovators? SSRN
Working Paper .
Holmstrom, B. (1999). Managerial Incentive Problems: A Dynamic Perspective. Review of Economic
Studies 66 (1), 169–82.
Kanellos, M. and J. Spooner (2002). Ibm’s outsider: A look back at lou. CNET News February .
Kaplan, S. and L. Zingales (1997). Do investment-cash flow sensitivities provide useful measures of
financing constraints? Quarterly Journal of Economics 112, 169–215.
Klepper, S. and P. Thompson (2007). Perspectives on Innovation, Chapter Spinoff Entry in High-Tech
Industries: Motives and Consequences (chapter6), pp. 187–218. Cambridge University Press.
Klepper, S. and P. Thompson (2010). Disagreement and Intra-industry spinoffs. International Journal
of Industrial Organization forthcoming.
Koszegi, B. and W. Li (2008). Drive and Talent. Journal of the European Economic Association 6,
210–236.
Lanjouw, J. and M. Schankerman (2001). Characteristics of patent litigation: a window on competition.
RAND Journal of Economics 32, 129–151.
Lerner, J. and J. Wulf (2007). Innovation and Incentives: evidence from corporate R&D. Review of
Economics and Statistics 89, 634–644.
Lowe, R. A. and A. A. Ziedonis (2006). Overoptimism and the Performance of Entrepreneurial Firms.
Management Science 52, 173–186.
Malmendier, U. and G. Tate (2005a). CEO Overconfidence and Corporate Investment. Journal of
Finance 60 (6), 2661–2700.
Malmendier, U. and G. Tate (2005b). Does Overconfidence Affect Corporate Investment? CEO Over-
confidence Measures Revisited. European Financial Management 11 (5), 649–659.
Malmendier, U. and G. Tate (2008). Who makes acquisitions? CEO overconfidence and the market’s
reaction. Journal of Financial Economics 89 (1), 20–43.
Mehta, A., M. Rysman, and T. Simcoe (2010). Identifying the Age Profile of Patent Citations: New
Estimates of Knowledge Diffusion. Journal of Applied Econometrics.
Moore, D. and T.-G. Kim (2003). Myopic Social Prediction and the Solo Comparison Paradox. Journal
of Personality and Social Psychology 85, 1121–1135.
25
Moore, D. A. and D. M. Cain (2007). Overconfidence and underconfidence: When and why people
underestimate (and overestimate) the competition. Organizational Behavior and Human Decision
Processes 103 (2), 197–213.
Pakes, A. and Z. Griliches (1980). Patents and R&D at the firm level: A first report. Economics
Letters 5 (4), 377–381.
Serrano, C. (2010). The dynamics of the transfer and renewal of patents. RAND Journal of Economics.
Shane, S. (2003). A general theory of entrepreneurship: the individual-opportunity nexus. Edward Elgar.
Svenson, O. (1981). Are we all less risky and more skillful than our fellow drivers? Acta Psycholog-
ica 47 (2), 143–148.
VandenSteen, E. (2005). Organizational Beliefs and Managerial Vision. Journal of Law, Economics,
and Organization 21 (1), 256–283.
Wooldridge, J. M. (1999). Distribution-free estimation of some nonlinear panel data models. Journal of
Econometrics 90 (1), 77–97.
Yildiz, M. (2004). Waiting to Persuade? Quarterly Journal of Economics 119, 223–249.
26

Tables and Figures
Table 1: Summary Statistics
Mean Median Min Max S.D. Obs.
Total Cites 489.01 6.00 0.00 32,509 1,747 3648
Total Patents 27.79 1.00 0.00 1,221 81.29 3648
Cites per Patent 8.62 4.00 0.00 240 13.32 3648
log(R&D Expense) 3.80 3.92 0.00 8.73 1.94 1864
Overconfidence 0.58 1.00 0.00 1.00 0.49 2441
Holder67 0.49 0.00 0.00 1.00 0.50 1533
Lerner Index 0.11 0.09 0.03 0.22 0.05 3648
CEO Chairman 0.38 0.00 0.00 1.00 0.49 3640
log(Cash Flow) 5.31 5.33 -5.45 13.92 1.51 3624
log(Sales) 7.85 7.75 2.95 11.81 1.12 3641
log(Employees) 2.68 2.72 -2.23 6.78 1.29 3627
log(Capital/Labor) 4.29 4.01 0.09 7.47 1.35 3637
Stock Ownership 0.02 0.00 0.00 0.95 0.07 3648
Vested Options 0.26 0.00 0.00 786.00 13.10 3648
Total Firms 290
Total CEOs 627
Overconfident 168
Not-overconfident 136
Unclassified 323
Holder67 is a dummy equal to 1 for all CEO years after the CEO fails to exercisean option 67% in the money with 5 years remaining duration. Overconfidence isthe maximum value for Holder67 for a given CEO. Lerner Index is the mediangross profit margin of all Compustat firms in a 2-digit SIC code. Cash Flowequals Compustat earnings before extraordinary items (item 18) plus depreciation(item 14). CEO Chairman is a dummy equal to one if a CEO also holds the titlesof Chairman and President.
27

Table 2: Overconfidence and Innovation
Poisson Panel Regressions
Unit of Observation = Firm-Year
Dependent Variable = Total Cites
(1) (2) (3) (4) (5) (6)
Overconfidence 0.389** 0.357** 0.241** 0.228**(0.12) (0.15) (0.12) (0.11)
Holder67 0.543*** 0.407***(0.14) (0.11)
ln(Sales) 0.412*** 0.201* 0.186 0.410*** 0.054(0.12) (0.10) (0.12) (0.12) (0.13)
ln(Capital/Labor) -0.061 0.089 0.085 0.115 0.301**(0.17) (0.10) (0.10) (0.23) (0.15)
ln(R&D Stock) 0.323*** 0.331*** 0.492***(0.08) (0.08) (0.08)
Stock Ownership -0.297 -0.626 -0.527 -2.107 -2.455(2.31) (2.32) (1.42) (3.08) (2.89)
Vested Options 0.004*** 0.004*** 0.004*** -0.789 -0.458(0.00) (0.00) (0.00) (2.56) (1.56)
M&A 0.075**(0.03)
Year Effects Yes Yes Yes Yes Yes Yes
SIC 2-digit Effects Yes Yes Yes Yes Yes Yes
CEO Controls No Yes Yes Yes Yes Yes
Firm Effects BGV BGV BGV BGV BGV BGV
Observations 2441 2441 2441 2441 1512 1512Firms 229 227 227 227 226 226CEOs 303 301 301 301 301 301
Robust standard errors clustered at SIC level in parentheses: *10% significance; **5% significance;***1% significance. Holder67 is a dummy equal to 1 for all CEO years after the CEO fails to exercisean option 67% in the money with 5 years remaining duration. Overconfidence is the maximum valuefor Holder67 for a given CEO. BGV fixed effects are based on including pre-sample means of thedependent variable. CEO controls are Age, Age2, Tenure,Tenure2, Stock Ownership and VestedOption holdings.
28

Table 3: Overconfidence and Alternative Innovation Measures
Poisson Panel Regressions
Unit of Observation = Firm-Year
Unweighted R&D CitationsOutcome Variable Patents Expense per Patent
(1) (2) (3) (4) (5) (6)
Overconfidence 0.198** 0.177** 0.185* 0.145** 0.180** 0.183**(0.10) (0.07) (0.10) (0.06) (0.08) (0.07)
ln(R&D Stock) 0.428*** 0.227*** 0.011 -0.012(0.05) (0.07) (0.10) (0.10)
ln(Sales) 0.400*** 0.187*** 1.040*** 0.765*** 0.042 0.039(0.08) (0.06) (0.10) (0.06) (0.14) (0.12)
ln(Capital/Labor) 0.039 0.043 -0.335* -0.273*** 0.036 0.051(0.11) (0.11) (0.19) (0.09) (0.10) (0.10)
Year Effects Yes Yes Yes Yes Yes Yes
SIC 2-digit Effects Yes Yes Yes n/a Yes Yes
CEO Controls Yes Yes Yes Yes Yes Yes
Firm Effects No BGV No Yes No BGV
Observations 2229 2229 1216 1199 2229 2229Firms 209 209 123 119 209 209CEOs 279 279 167 163 279 279
Robust standard errors clustered at SIC level in parentheses: *10% significance; **5% significance; ***1%significance. Overconfidence is the maximum value for Holder67 for a given CEO where Holder67 is adummy equal to 1 for all CEO years after the CEO fails to exercise an option 67% in the money with 5years remaining duration. BGV fixed effects are based on including pre-sample means of the dependentvariable. CEO controls are Age, Age2, Tenure, Tenure2, Stock Ownership and Vested Option holdings(CEO Age and Tenure effects are omitted in the R&D conditional fixed effects model due to co-linearitywith the time trend).
29

Table 4: Overconfidence and Patent Citations
Poisson Panel Regressions
Unit of Observation = Patent-Year
Dependent Variable = Citation Count
(1) (2) (3) (4)
Overconfidence 0.037** 0.121*** 0.127*** 0.122***(0.01) (0.04) (0.03) (0.02)
ln(Sales) -0.016 0.030 0.035** 0.019(0.01) (0.02) (0.02) (0.01)
ln(Capital/Labor) 0.074*** -0.030 -0.024* -0.026**(0.01) (0.02) (0.01) (0.01)
ln(R&D Stock) 0.045*** 0.010 0.007 0.009*(0.01) (0.01) (0.01) (0.01)
Patent-age Effects Yes Yes Yes Yes
Firm Effects No Yes Yes
Citing-year Effects Yes Yes
App-year Effects Yes n/a n/a n/a
Tech-citeyear Effects† Yes No No Yes
Tech-firm Effects† No No Yes No
Observations 1035339 1035344 1035344 1035344
Robust standard errors in parentheses: *10% significance; **5% significance;***1% significance. Standard errors are clustered at the level of the conditionalfixed effect, which is Technology Class in models (1), (3) and (4), and Firmin model (2). Overconfidence is the maximum value for Holder67 for a givenCEO where Holder67 is a dummy equal to 1 for all CEO years after the CEOfails to exercise an option 67% in the money with 5 years remaining duration.All models control for CEO Age, Age2, Tenure, Tenure2, Stock Ownership andVested Option holdings. †Technology-year effects are based on technology sub-categories defined in the NBER patent data file, while Technology-Firm effectsare based on the primary (3-digit) US patent classification.
30

Table 5: Competition Interactions
Poisson Panel Regressions
Unit of Observation = Firm-Year
Dependent Variable = Total Cites
(1) (2) (3) (4)
Overconfidence 0.742*** 0.640*** 0.328***(0.17) (0.23) (0.12)
Lerner Index -0.495 -0.836(4.15) (3.89)
Lerner x Overconf -4.621***(0.97)
Holder67 0.669***(0.17)
Lerner x Holder67 -2.635**(1.18)
LernerSIC x Overconf -3.584**(1.47)
Lerner50 x Overconf -0.503**(0.24)
Year Effects Yes Yes Yes Yes
SIC 2-digit Effects Yes Yes Yes Yes
Firm Effects BGV BGV BGV BGV
Observations 2200 1344 2200 2200Firms 207 200 207 207CEOs 277 270 277 277
Robust standard errors clustered at SIC level in parentheses: *10% significance;**5% significance; ***1% significance. Holder67 is a dummy equal to 1 forall CEO years after the CEO fails to exercise an option 67% in the moneywith 5 years remaining duration. Overconfidence is the maximum value forHolder67 for a given CEO. Lerner Index is the median gross profit margin of allCompustat firms in a 2-digit SIC code (see text). BGV fixed effects are basedon including pre-sample means of the dependent variable. All models controlfor ln(R&D Stock), ln(Sales), ln(Capital/Labor) and CEO Age, Age2, Tenure,Tenure2, Stock Ownership and Vested Option holdings.
31

Table 6: Overconfidence and Innovative Direction
Panel Regressions
Unit of Observation = Firm-Year
Originality DerivativeOutcome Variable Weighted Patents Patent Share
Poisson Poisson OLS OLS(1) (2) (3) (4)
Overconfidence 0.173** 0.406*** -0.005 -0.028**(0.09) (0.13) (0.01) (0.01)
Lerner SIC x Overconf -2.056* 0.250**(1.24) (0.10)
Year Effects Yes Yes Yes Yes
SIC 2-digit Effects Yes Yes n/a n/a
Firm Effects BGV BGV Yes Yes
Observations 2124 2124 1343 1343Firms 199 199 155 155CEOs 268 268 206 206
Robust standard errors clustered at SIC level in parentheses: *10% signif-icance; **5% significance; ***1% significance. See Hall et al. (2001) for adefinition of originality. Derivative patents have more than 50 percent of self-citations. Overconfidence is the maximum value for Holder67 for a given CEOwhere Holder67 is a dummy equal to 1 for all CEO years after the CEO fails toexercise an option 67% in the money with 5 years remaining duration. LernerIndex is the median gross profit margin of all Compustat firms in a 2-digit SICcode (see text). LernerSIC and Lerner50 are alternative measures of industrygross-profitability that exclude longitudinal variation (see text). BGV fixedeffects are based on including pre-sample means of the dependent variable.All models control for ln(R&D Stock), ln(Sales), ln(Capital/Labor) and CEOAge, Age2, Tenure, Tenure2, Stock Ownership and Vested Option holdings.
32

Table 7: CEO Independence and Cash Flow Interactions
Poisson Panel Regressions
Unit of Observation = Firm-Year
Outcome Variable Total Cites R&D Expense
(1) (2) (3) (4)
Overconfidence 0.122 -0.292*(0.13) (0.16)
CEO-Chairman -0.194* -0.152*(0.11) (0.09)
Overconf x CEO-Chair 0.365**(0.15)
Holder67 0.303*** -0.314(0.11) (0.20)
Holder67 x CEO-Chair 0.409***(0.13)
ln(CashFlow) -0.033 -0.014(0.02) (0.03)
Overconf x ln(CashFlow) 0.062***(0.02)
Holder67 x ln(CashFlow) 0.048*(0.03)
Year Effects Yes Yes Yes Yes
SIC 2-digit Effects Yes Yes N/A N/A
CEO Controls Yes Yes No No
Firm Effects BGV BGV Yes Yes
Observations 2195 1344 1199 747Firms 207 200 119 113CEOs 277 270 163 155
Robust standard errors clustered at SIC level in parentheses: *10% significance;**5% significance; ***1% significance. CEO Chairman is a dummy equal toone if a CEO also holds the titles of Chairman and President. Cash Flowequals Compustat earnings before extraordinary items (item 18) plus deprecia-tion (item 14). Overconfidence is the maximum value for Holder67 for a givenCEO where Holder67 is a dummy equal to 1 for all CEO years after the CEO failsto exercise an option 67% in the money with 5 years remaining duration. BGVfixed effects are based on including pre-sample means of the dependent variable.All models control for ln(R&D Stock), ln(Sales), ln(Capital/Labor) and CEO Age,Age2, Tenure, Tenure2, Stock Ownership and Vested Option holdings.
33

Figure 1: Switching to Overconfident CEOs (Annual Treatment Effects)-1
-.5
0.5
1
Ov
erc
on
fid
en
ce
Co
effi
cie
nt
-4 -3 -2 -1 0 1 2 3 4 5
Years Since CEO Switch
Coefficient 95% CI
This figure plots coefficient estimates and robust standard errors from a Poissonregression with firm conditional fixed effects, a full set of calendar year effects,and a full set of year-relative-to-CEO-switch dummies (omitting the year priorto the change in CEO) for firms that hire an overconfident CEO. The dependentvariable is Total Cites. The estimation sample contains four years prior to theCEO switch and all years following the switch.
34

On-line Appendix to CEO Overconfidence and Innovation
April 12, 2011

Part A: Extensions to the Theoretical Model
Non-Sector Specific Ability
In the baseline model we assumed that CEO talent is sector specific and that after relocating to
a new sector the CEO receives a compensation that does not depend on his past performance:
w =1
2θ − δ.
We now relax this assumption and consider the case in which managerial ability is the same
in all sectors. This implies that after low revenue realization the compensation obtained in a
different sector will be
w = w2(y1 = 0) − δ =1 − p
2 − p− αpθ − δ
and that a CEO will never switch sector as long as δ > 0. If i = 1, CEO’s expected period 2
compensation is:
U(i = 1) =
[1
2(1 + o)p+
1
2(1 − o)αp
]θ
1 + α(A-1)
+
[1
2(1 + o)(1 − p) +
1
2(1 − o)(1 − αp)
](1 − p
2 − p− αpθ
)=
1
2pθ +
1
2(2 − p− αp)
1 − p
2 − p− αpθ
+ op
2(1 − α)
(θ
(1 − α)
(α+ 1) (2 − p− αp)
).
Because innovation occurs only if I ≤ I = U(i = 1) − U(i = 0) and U(i = 0) = θ/2 does
not depend on overconfidence ∂U(i = 1)/∂o ≥ 0 implies that ∂I/∂o > 0. Moreover,
∂2I
∂o∂π= pθ
(1 − α)
(α+ 1)2 (p+ pα− 2)2(3 + α− 2p(1 + α)) ≥ 0
so both of our testable implications hold in this alternative setting.
Aghion, Van Reenen and Zingales (2009) consider the extreme case in which, after a low
revenue realization, the CEO leaves the firm and is never hired by other sectors i.e. w = 0. In
this case the ex ante compensation of a manager that innovates is:
U(i = 1) =1
2pθ + o
p
2(1 − α)
θ
1 + α.
Notice that U(i = 1)−U(i = 0) ≤ 0 if o = 0 (non-overconfident CEOs never innovate when
1

w= 0) and that this difference becomes positive for overconfident CEOs as long as p is not too
small. Moreover ∂U(i = 1)/∂o ≥ 0 and ∂2U(i = 1)/∂o∂π ≥ 0 therefore this alternative model
is also consistent with our testable predictions.
No Switching Cost
In the baseline model we assumed that when a CEO reallocates to another sector he sustains a
switching cost δ. If CEOs can switch costlessy w = θ/2. The absence of switching costs renders
innovation more appealing because there is a higher payoff in the case of low revenue realization.
Nevertheless, even in this alternative setting ∂U(i = 1)/∂o ≥ 0 and ∂2U(i = 1)/∂o∂π ≥ 0.
Therefore the assumption that δ > 0 has no impact on our testable predictions.
No Innovation Cost
In the baseline model we assumed that the CEO sustains a private cost I when he innovates.
If we remove this cost innovation occurs as long as U(i = 1) ≥ U(i = 0) that is satisfied as long
as the switching cost is not too large:
δ ≤ δ = pθ (α− 1)o+ α− oα+ 1
2p− 4α+ 4pα+ 2pα2 + 2op− 2opα2 − 4.
Also in this framework innovation takes place for a larger range of parameters when the
CEO is overconfident:
∂δ
∂o= pθ
(α− 1)2
(α+ 1) (p+ pα+ op− opα− 2)2.
The cross partial derivative
∂2δ
∂o∂α= pθ
(1 − α)(2α− 5p− 4pα+ pα2 − op+ 2opα− opα2 + 6
)(α+ 1)2 (p+ pα+ op− opα− 2)3
< 0
and therefore overconfidence and competition are complements (i.e. ∂2δ/∂o∂π > 0) as in our
baseline model. To see this notice that the second term in the denominator is negative because
p+ pα+ op− opα− 2 =
p(1 + α) + op(1 − α) − 2 ≤
2p− 2 ≤ 0.
The term 2α− 5p− 4pα+ pα2 − op+ 2opα− opα2 + 6 in the numerator is positive as long
2

as
p ≤ p(o) =2α+ 6
o(1 − α)2 + 4α− α2 + 5
and because p′(o) < 0 and p(1) = 1 the term is positive for any value of α and o.
Competition Affects Non-Innovating Managers
We now relax the assumption that U(i = 0) is not affected by product market competition and
extend the model assuming that competition affects non-innovating managers because it forces
them to relocate to a different sector. We follow Aghion, Van Reenen and Zingales (2009) and
assume that with probability f(π) a non innovating firm incurs a loss and that f ′(π) > 0. We
also assume that that the CEO must relocate whenever the loss is incurred. In this case the
CEO payoff without innovation is:
U(i = 0) = (1 − f(π))θ
2+ f(π)w.
Because an increase in π increases the net gain U(i = 1) − I − U(i = 0), competition renders
innovation more appealing. It is important to notice that in this setting, as in our baseline
model, U(i = 0) does not depend on o. This implies that the two testable predictions of our
baseline model hold in this alternative environment.1
Generalization of the Competition Effect
In the baseline model we assumed that the difference in talent between high and low quality
CEOs was captured by α = 1 − π. We now generalize the framework by assuming that if the
CEO innovates (i = 1), the period 1 revenue realization is equal to:
y1 =
{1 with probability p(π)
0 with probability 1 − p(π)
if θ = θ and it is equal to
1If the probability of incurring the loss is also affected by overconfidence (i.e. f(o, π) with ∂f/∂o < 0) anincrease in o increases innovation as long as:
∣∣∣∣∂f∂o∣∣∣∣ < p
2(1 − α)
(θ
1+α− w
)(θ2− w
) .
3

y1 =
{1 with probability q(π)
0 with probability 1 − q(π)
if ability is low. We assume q′(π) < p′(π) < 0 and q(π) ≤ p(π): competition reduces the
likelihood of high revenue but its effect is stronger for low ability CEOs. In this setting
w2(y1 = 1) =p(π)
p(π) + q(π)θ (A-2)
and there is no change in
w =1
2θ − δ. (A-3)
Notice that
U(i = 1) =
[1
2(1 + o)p(π) +
1
2(1 − o)q(π)
]w2(y1 = 1) (A-4)
+
[1
2(1 + o)(1 − p(π)) +
1
2(1 − o)(1 − q(π))
]w
and that the CEO innovates when U(i = 1) − I ≥ U(i = 0). Therefore innovation occurs in
equilibrium only if innovation costs are not too large, specifically:
I ≤ I = U(i = 1) − U(i = 0).
Because∂I
∂o=
1
2(p(π) − q(π)) (w2(y1 = 1) − w) > 0
the first testable prediction holds in this generalized setting. Moreover:
∂2I
∂o∂π=
1
2
(w2(y1 = 1) − w + (p(π) − q(π))
p(π)
(p(π) + q(π))2
)[p′(π) − q′(π)
]> 0
because p′(π) − q′(π) > 0 so the second testable prediction is also valid.
Competition reduces the impact of talent
In the baseline model we assumed that α = 1−π. This assumption implies that product market
competition affects the probability that low ability CEOs have of generating high revenue from
an innovation and that talent is more valuable in a competitive environment rather than in a
non-competitive environment. We now follow Aghion, Van Reenen and Zingales (2009) and
4

assume that p = 1 − π and that α does not depend on π. Notice that in this variant of the
model talent is more valuable when competition is less intense.
In this alternative setting the direct effect of overconfidence on innovation is analogous to
the one in our baseline model:
∂I
∂o=p
2(1 − α)
(θ
1 + α− w
)> 0.
Nevertheless, because talent is less valuable when competition is intense, the cross partial
derivative has the opposite sign than the one in our model:
∂2I
∂o∂π= −1
2(1 − α)
(θ
1 + α− w
)< 0.
Therefore the impact of overconfidence on innovation is lower when π is large and the second
testable prediction of our baseline model no longer holds.
It is important to notice that, despite the negative cross partial derivative, this alternative
framework can still provide support to the idea that only overconfident CEOs innovate when
competition is intense. To see this let us fix the level of innovation cost I. Notice that U(i =
1) − I > U(i = 0) as long as
p > p(o) =(2I − 2w + θ)
(1 + α+ o(1 − α))
(1 + α)(θ − w(1 + α)
)and that p is decreasing in o. This implies that non overconfident CEOs will innovate only
if the level of product market competition is below 1 − p(0) ≡ π0. Therefore when π ≤ π0
both overconfident and non-overconfident CEOs innovate whereas if π > π0 only overconfident
CEOs innovate.
Cash Flow Sensitivity
We compare the investment decision of overconfident CEO (with o > 0) with the decision of a
non-overconfident CEO (with o = 0). Let us indicate with Iφ the maximum innovation cost for
a CEO that is not overconfident and with Io the threshold for an overconfident CEO. Specifically
a rational CEO innovates as long as the innovation cost is below Iφ and an overconfident CEO
innovates as long as the innovation cost is below Io where the two thresholds are defined as:
5

Iφ =1
2pθ +
1
2(2 − p− αp)w − 1
2θ
Io =1
2pθ +
1
2(2 − p− αp)w − 1
2θ + o
p
2(1 − α)
(θ
1 + α− w
).
Implication 1 indicates that Iφ < Io for every o > 0. Our baseline model, following Aghion
et al. (2009) assumed that the innovation cost is a private cost sustained by the CEO only.
We now introduce an innovation cost sustained by the firm F and we assume that there is
a one to one mapping between private cost I and firm cost F and that the two costs are
positively correlated (i.e. F is an increasing function of I). This assumption captures the
idea that projects requiring a large amount of firm resources are also those requiring a greater
use of CEO time and personal resources. In this extended setting we can identify two cutoffs
F φ and F o (with F φ < F o) indicating the maximum firm investment levels of unbiased and
overconfident CEOs.
Following Malmendier and Tate (2005) we assume that to finance F the CEO can use
either internal funds or external finance (debt). We assume that the firm has an exogenous
capacity for riskless debt D and a cash flow of C (for simplicity we ignore the use of equity). We
consider three cases. First if C +D ≥ F o resources are very abundant and a marginal increase
in C has no effect on the investment decisions of both overconfident and non-overconfident
CEOs. Second, if C +D < F φ resources are scarce both for rational and overconfident CEOs
so a marginal increase in C affects the investment decisions of both types of CEOs. Finally,
consider the case in which F φ ≤ C + D < F o. In this case the rational CEOs invest as long
as F ≤ F φ whereas overconfident CEOs invest in projects for which F ≤ C + D. Therefore,
in this range of values a marginal increase in C has no effect on rational CEOs but it increases
the range of projects for overconfident CEOs.
This simple extension generates a third testable implication:
Implication 3: The innovation investment of overconfident CEOs is more sensitive to cash
flow than the investment of non-overconfident CEOs.
6

Part B: Additional Empirical Results
Conditional Fixed Effects
To isolate the within-firm co-variation of overconfidence and innovation, in Table B1 we rely
on the fixed-effects Poisson estimator (Hausman et al., 1984) which is analogous to the familiar
within group OLS estimator and assumes that all covariates are strictly exogenous.
Columns (1) and (3) in Table B1 use the overconfidence dummy and therefore exploit only
variation between overconfident and non-overconfident CEOs within firms. In columns (2) and
(4) we use the Holder67 dummy and estimate its coefficient using not only within firm variation
but also variation between years when a CEO is classified as overconfident or not. Despite
eliminating all between-firm variation, we still find support for the two testable implications
of our model: overconfidence is positively correlated with innovation and the correlation is
stronger when product market competition is intense. While many of our other results are
robust to this alternative estimator, some lose statistical significance. This is not surprising
given the limited CEO turnover within firms.2
Endogeneity
The CEO switching analysis is based on 28 cases where a CEO who was either not-overconfident
or unclassified was replaced by an overconfident CEO. In each case, we retained data for the
four years preceding the switch and all subsequent years of data for the overconfident CEO.
To obtain a control sample, we performed a similar exercise to identify 24 cases where a not-
overconfident or unclassified CEO was replaced by a not-overconfident CEO. We estimate
fixed-effects Poisson models to isolate within-firm variation, and we drop the firm-level controls
which are unlikely to be strictly exogenous.
Table B2 shows that within the switching sample, as with the full sample above, we find a
statistically significant increase in innovative activity following the arrival of an overconfident
CEO. More interestingly, we find no significant difference in the time-trend of pre-switch inno-
vative activity between firms that hire rational versus overconfident CEOs. This suggests that
the selection process is not driven by ex ante differences in firm performance. As an additional
robustness check, we created an indicator for firms that ever hire an Overconfident CEO, and
use the Coarsened Exact Matching procedure of Iacus, King and Porro (2010) to balance on
firm-level observables in the first year of the sample. While this procedure drops some the
2The models in Table B1 do not include firm level controls for sales, capital-labor ratios or R&D Stock,since we do not expect those variables to be strictly exogenous. While the main effect of Overconfidence oninnovation is robust to adding these controls, the competition effects are more fragile, perhaps because of astrong within-firm correlation between growth and industry profitability.
7

largest firms, our baseline results are qualitatively unchanged within this firm-matched sample.
Overconfidence and Citation Levels
Hall et al. (2005) divide firms into categories depending on their stock of citations. Specifically,
they show that firms receiving an average of 7-10 cites per patent experience an increase in
market value that is 10% greater than those with less than 7 cites per patent. For firms with
11-20 cites per patent the difference is 35%, and for firms with more than 20 cites per patents
the difference is 54%.
From their results, it is not clear whether there is any difference between a broad based
increase in the forward-citation rate (so a firms share of patents with, say, more than 7 cites
increases) and having one or two more home runs that receive hundreds of citations. To
explore this issue we run a number of linear probability models at the patent level, using a
series of dummies for total (truncation adjusted) citations count above a series of thresholds.
For thresholds, we chose 5, 10, 20, 40 and 60 cites, which correspond (roughly) to the 25th,
50th, 75th, 90th and 95th percentile in the unconditional distribution of total citations. All
of the models contain firm by technology-class and grant-year fixed effects, so the relevant
comparison is to a patent in the same technology class filed by a non-Overconfident CEO at
the same firm. Results are presented in Table B3.
We find no effects below the 75th percentile. However, there is a statistically significant 3
percentage point increase in the probability of receiving 20 or more cites (i.e. being in the upper
quartile). Thus, the marginal effect is a 0.03 / 0.25 = 12 percent increase in the conditional
probability of being in the top quartile of the citation distribution. We find similar effects
at the 90th and 95th percentile (though the marginal effects are much larger, at 30 and 45
percent respectively, given the small baseline probability of receiving that many cites). This is
consistent with a relatively broad right shift in the citation distribution for patents filed under
Overconfident CEOs.
Alternative Controls and Specifications
In Table B4 we present a series of extensions that demonstrate the robustness of our main
results to including extra covariates and changing the model specification. Column (1) shows
that our estimates are not affected when we control for investment opportunities (Tobin’s Q)
and for firm ability to raise capital (cash flow). We computed Tobin’s Q following Kaplan and
Zingales (1997) and define cash-flow as Compustat earnings before extraordinary items (item
18) plus depreciation (item 14).3 In column (2) we control for CEO educational background.
3Kaplan and Zingales use the following Compustat items: Q=[item6+(item24*item25)-item60-item74]/item6.
8

Although we lose roughly 32 percent of the observations because of missing data on educational
background, there is essentially no change in the overconfidence coefficient. In column (3) we
allow for dynamics using a multiplicative feedback model that controls for the logarithm of
lagged cite-weighted patent counts. Not surprisingly we found strong persistence in patenting;
the coefficient on lagged patents is highly significant, while the coefficient on overconfidence is
positive and significant at the 0.1 level.4 In column (4) we control for industry specific time-
trends by interacting the industry fixed effects with the calendar year. The magnitude of the
overconfidence coefficient is similar to the one in our baseline regression and we cannot reject
the null hypothesis that the industry trends are jointly insignificant. Finally, in column (5) we
show that results are similar when using a negative binomial regression model.
Press Based Overconfidence Measures
The overconfidence measures employed above use CEOs’ private investment decisions to cap-
ture their “revealed beliefs.” To strengthen the overconfidence interpretation of their results,
Malmendier and Tate (2008) also collect data on outsiders’ perception of CEOs. Specifically,
they use business press coverage data to identify CEOs depicted as “optimistic” or “confident.”
In this sub-section, we conduct a similar exercise using articles in the Wall Street Journal,
the New York Times, Business Week, the Financial Times and the Economist during the sample
period. For each CEO, Malmendier and Tate (2008) identify the number of articles describing
the CEO as “Confident” or “Cautions.”5 Let us indicate with ait the number of articles that
refer to CEO i as “Confident” in year t. Similarly, let us indicate with bit the number of articles
that refer to CEO i as “Cautious” in year t. Following Malmendier and Tate (2008), we define
the following press-based overconfidence measure:
Totalconfidentit =
{1 if
∑t−1s=1 ais >
∑t−1s=1 bis
0 otherwise.
The correlation between Totalconfident and Holder67 is 0.09 and the correlation with Over-
confidence is 0.08 and they are both statistically significant at the 0.01 level. In Table B5 we
use this measure and control for the total number of press mentions received by the CEO
(TOTALmentions). We also control for CEO educational background and title accumulation.
4The overconfidence coefficient drops once we introduce the lagged value of citations indicating that CEOoverconfidence has mostly a long run effect on innovation (see Blundell et al. (1999)). Moreover, the estimatedlong-run impact (after accounting for autoregressive feedback through lagged cites) is equal to α
1−λ = 0.061−0.81
=
0.32, which is quite close to our baseline result.5An article identifies the CEO as “Confident” if it contains one of the following words: confident, confidence,
optimistic, optimism. An article identifies the CEO as “Cautious” if it contains one of the following words:reliable, cautious, conservative, practical, frugal or steady.
9

The correlations support the predictions of our model. Overconfidence is positively corre-
lated with citation-weighted patent counts and the correlation is stronger in more competitive
industries. In columns (3) and (4) we explore the correlation between the press-based measure
and un-weighted patent counts. While the correlation is not significant in the pooled regres-
sion we find that patenting is substantially higher for overconfident CEOs when competition is
intense.
Execucomp Data
Our main analysis uses a dataset originally constructed by Yermack (1995), Hall and Liebman
(1998) and Malmandier and Tate (2005; 2008). The main virtue of these data is the presence
of Holder67, the measure of overconfidence developed by Malmendier and Tate (2008). Their
primary limitation is the small sample, which contains only 290 innovating firms. In this final
sub-section, we explore the relation between overconfidence and innovation using the larger
S&P ExecuComp Compustat database, which reports information on executive compensation
for S&P 1,500 companies from 1992 to 2009. To avoid truncation problems with the patent
data, we focus on the period 1992-2001.
The ExecuComp dataset provides information both on the salary and on the aggregate value
of the stock options awarded to the CEOs. Because grant and expiration date of the individual
option packages are not reported, we cannot construct the Holder 67 measure. Nevertheless,
we constructed an alternative measure, Holder67-EC, based on aggregate stock option holdings
but similar in spirit to Holder67.6 Intuitively, we identified the CEOs that did not exercise
a substantial amount of their stock options despite a considerable increase in the underlying
stock value.
Specifically, we focus on CEOs that during their tenure experienced an increase of at least
67 percent in the stock price over a 5 year period. For all these CEOs, we constructed the
ratio between the value of unexercised exercisable options and the CEO’s salary and bonus.
Finally, we classified a CEO as a Holder67-EC if after a 67 percent stock price increase, the
ratio of vested option to income was above the 95th percentile of the entire options-income
distribution.7 As for the Holder67 measure, once a CEO is classified as Holder67-EC he keeps
that label for the remaining sample years. We also created a variable Overconfidence-EC equal
to the maximum of Holder67-EC.
6Dezso and Ross (2010) use a similar measure to examine the correlation between CEO options-holding andthe cost of borrowing.
7We experimented with alternative cutoff rules (75th , 85th and 90th percentiles of the option-income ratiodistribution) and found that the correlation between innovation and overconfidence is robust to variation in thevalue of the threshold. The interaction effect with product market competition is more sensitive to the cutoffrule, and results are consistent with Implication 2 only for cutoff rules above the 90th percentile.
10

In the new sample, there are 1899 CEOs for which Overconfidence-EC is defined. About
ten percent of these CEOs are classified as overconfident. The final sample contains 1491
innovating firms and 7123 observations. The mean firm-year observation consists of 20 patents
that receive 344 citations. The average firm in the new sample has 5,365 employees whereas
the average firm in the dataset described in Section 3 has 14,565 employees.
Appendix Table B6 investigates the relation between overconfidence and innovation in this
alternative sample. The coefficients on Overconfidence-EC and Holder67-EC are positive and
significant thus supporting the first testable implication of our theoretical model. We also find
support for the second prediction; specifically, the coefficient on the interaction between the
Lerner index and overconfidence is negative and significant.
11

References
Aghion, P., J. Van Reenen, and L. Zingales (2009). Innovation and Institutional Ownership. NBER
Working Paper 14769 .
Blundell, R., R. Griffith, and J. van Reenen (1999). Market Share, Market Value and Innovation in a
Panel of British Manufacturing Firms. Review of Economic Studies 66 (3), 529–54.
Dezso, C. and D. G. Ross (2010). Are Banks Happy when Managers Go Long? Vested Options and the
Cost of Private Debt. SSRN Working Paper .
Hall, B. H., A. B. Jaffe, and M. Trajtenberg (2001). The NBER Patent Citation Data File: Lessons,
Insights and Methodological Tools. Working Paper 8498, National Bureau of Economic Research.
Hall, B. H., A. B. Jaffe, and M. Trajtenberg (2005). Market Value and Patent Citations. RAND Journal
of Economics 36, 16–38.
Hall, B. J. and J. B. Liebman (1998). Are CEOs Really Paid Like Bureaucrats? The Quarterly Journal
of Economics 113 (3), 653–691.
Hausman, J., B. Hall, and Z. Griliches (1984). Econometric Models for Count Data with an Application
to the Patents-R&D Relationship. Econometrica 52 (4), 909–938.
Iacus, S., G. King, and G. Porro (2010). Causal Inference without Balance Checking: Coarsened Exact
Matching. working paper .
Kaplan, S. and L. Zingales (1997). Do investment-cash flow sensitivities provide useful measures of
financing constraints? Quarterly Journal of Economics 112, 169–215.
Malmendier, U. and G. Tate (2005). CEO Overconfidence and Corporate Investment. Journal of
Finance 60 (6), 2661–2700.
Malmendier, U. and G. Tate (2008). Who makes acquisitions? CEO overconfidence and the market’s
reaction. Journal of Financial Economics 89 (1), 20–43.
Mehta, A., M. Rysman, and T. Simcoe (2010). Identifying the Age Profile of Patent Citations: New
Estimates of Knowledge Diffusion. Journal of Applied Econometrics.
Yermack, D. (1995). Do corporations award CEO stock options effectively? Journal of Financial
Economics 39 (2-3), 237–269.
12

Table B1: Overconfidence and Innovation (Conditional FEs)
Poisson Panel Regressions
Unit of Observation = Firm-Year
Dependent Variable = Total Citations
(1) (2) (3) (4)
Overconfidence 0.319** 0.780***(0.14) (0.28)
Holder67 0.256** 0.910**(0.12) (0.39)
Lerner Index 1.435 -1.141(3.01) (2.49)
Lerner x Overconf -4.053**(1.85)
Lerner x Holder67 -6.018**(2.76)
Year Effects Yes Yes Yes Yes
CEO Controls Yes Yes Yes Yes
Firm Effects Yes Yes Yes Yes
Observations 1678 1041 1678 1041Firms 155 145 155 145CEOs 212 201 212 201
Robust standard errors clustered at firm level in parentheses: *10%significance; **5% significance; ***1% significance. Overconfidence isthe maximum value for Holder67 for a given CEO where Holder67 isa dummy equal to 1 for all CEO years after the CEO fails to exercisean option 67% in the money with 5 years remaining duration. LernerIndex is the median gross profit margin of all Compustat firms in a2-digit SIC code (see text). CEO controls are Age, Age2, Tenure andTenure2.
13

Table B2: Overconfidence and Innovation (CEO Switches)
Poisson Panel Regressions
Unit of Observation = Firm-Year
Cite-Weighted Unweighted Cites per Research &Outcome Variable Patents Patents Patent Development
(1) (2) (3) (4)
Overconfidence 0.426*** 0.312*** 0.504* 0.186*(0.08) (0.10) (0.27) (0.10)
Pre-trend*Overconf 0.003 -0.035 -0.106 -0.033(0.03) (0.03) (0.09) (0.03)
Pre-trend 0.026 0.012 0.036 -0.055(0.06) (0.04) (0.07) (0.05)
Firm Effects Yes Yes Yes Yes
Year Effects Yes Yes Yes Yes
Observations 612 612 612 375Firms 59 59 59 41CEOs 120 120 120 75
Treated Switches 28 28 28 21Control Switches 24 24 24 10
Robust standard errors clustered at firm level in parentheses: *10% significance; **5% sig-nificance; ***1% significance. Overconfidence is the maximum value for Holder67 for a givenCEO where Holder67 is a dummy equal to 1 for all CEO years after the CEO fails to exercisean option 67% in the money with 5 years remaining duration. Pre-trend is a time-trend forthe four year period prior to a change in CEO for all firms. Pre-trend * Overconf equalsPre-trend multiplied an indicator that equals one if the firm hires an Overconfident CEO.
14

Table B3: Overconfidence and Citation Levels
Linear Probability Model
Unit of Observation = Patent
Outcome Variable Cites>5 Cites>10 Cites>20 Cites>40 Cites>60
(1) (2) (3) (4) (5)
Overconfidence -0.014 0.014 0.029*** 0.032*** 0.023***(0.01) (0.01) (0.01) (0.01) (0.01)
ln(Sales) -0.006 -0.017* -0.008 -0.005 -0.007(0.01) (0.01) (0.01) (0.01) (0.00)
ln(Capital/Labor) 0.004 0.003 -0.008 -0.010* -0.004(0.01) (0.01) (0.01) (0.01) (0.00)
Year Effects Yes Yes Yes Yes Yes
CEO Controls Yes Yes Yes Yes Yes
Tech-Firm Effects Yes Yes Yes Yes Yes
Observations 76103 76103 76103 76103 76103
Mean Dependent Variable 0.703 0.486 0.257 0.100 0.049
Robust standard errors clustered at patent level in parentheses: *10% significance; **5% signif-icance; ***1% significance. BGV fixed effects are based on including pre-sample means of thedependent variable. All models control for ln(R&D Stock), ln(Sales), ln(Capital/Labor) and CEOAge, Age2, Tenure and Tenure2.
15

Table B4: Overconfidence and Innovation (Robustness Checks)
Panel Regressions
Unit of Observation = Firm-Year
Dependent Variable = Total Cites
Specification Poisson Poisson Poisson Poisson NegBin
(1) (2) (3) (4) (5)
Overconfidence 0.224** 0.244** 0.060* 0.241** 0.509***(0.11) (0.11) (0.03) (0.11) (0.17)
Tobin’s Q 0.390(0.24)
log(Cash Flow) 0.105***(0.04)
Finance Education -0.084(0.19)
Technical Education 0.134*(0.07)
Chair & President 0.039(0.07)
ln(Citest−1) 0.812***(0.03)
Year Effects Yes Yes Yes Yes Yes
SIC 2-digit Effects Yes Yes Yes Yes Yes
SIC 2-digit Trends No No No Yes No
Firm Effects BGV BGV BGV BGV BGV
Observations 2147 1491 2037 2411 2411Firms 207 153 206 227 227CEOs 277 177 275 301 301
Robust standard errors clustered at SIC level in parentheses: *10% significance; **5%significance; ***1% significance. Overconfidence is the maximum value for Holder67 fora given CEO where Holder67 is a dummy equal to 1 for all CEO years after the CEOfails to exercise an option 67% in the money with 5 years remaining duration. BGVfixed effects are based on including pre-sample means of the dependent variable. Allmodels control for ln(R&D Stock), ln(Sales), ln(Capital/Labor) and CEO Age, Age2,Tenure, Tenure2, Stock Ownership and Vested Option Holdings.
16
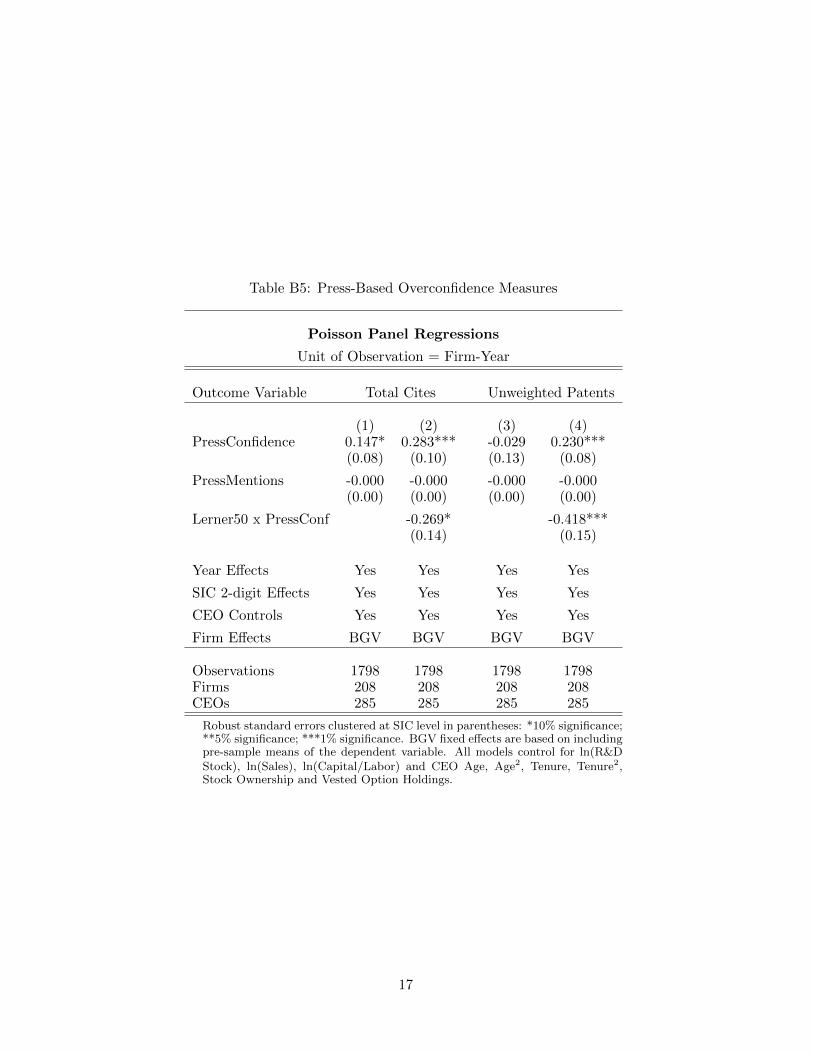
Table B5: Press-Based Overconfidence Measures
Poisson Panel Regressions
Unit of Observation = Firm-Year
Outcome Variable Total Cites Unweighted Patents
(1) (2) (3) (4)PressConfidence 0.147* 0.283*** -0.029 0.230***
(0.08) (0.10) (0.13) (0.08)
PressMentions -0.000 -0.000 -0.000 -0.000(0.00) (0.00) (0.00) (0.00)
Lerner50 x PressConf -0.269* -0.418***(0.14) (0.15)
Year Effects Yes Yes Yes Yes
SIC 2-digit Effects Yes Yes Yes Yes
CEO Controls Yes Yes Yes Yes
Firm Effects BGV BGV BGV BGV
Observations 1798 1798 1798 1798Firms 208 208 208 208CEOs 285 285 285 285
Robust standard errors clustered at SIC level in parentheses: *10% significance;**5% significance; ***1% significance. BGV fixed effects are based on includingpre-sample means of the dependent variable. All models control for ln(R&DStock), ln(Sales), ln(Capital/Labor) and CEO Age, Age2, Tenure, Tenure2,Stock Ownership and Vested Option Holdings.
17

Table B6: Overconfidence and Innovation (ExecuComp Sample)
Poisson Panel Regressions
Unit of Observation = Firm-Year
Dependent Variable = Total Citations
(1) (2) (3) (4)
Holder67-EC 0.257*** 0.409***(0.10) (0.09)
Overconfident-EC 0.379** 0.507***(0.17) (0.13)
Lerner50 x Holder67-EC -1.223***(0.09)
Lerner50 x Overconf-EC -0.665**(0.32)
Year Effects Yes Yes Yes Yes
SIC 2-digit Effects Yes Yes Yes Yes
Firm Effects BGV BGV BGV BGV
Observations 4799 7123 4799 7123Firms 1245 1491 1245 1491CEOs 1360 1674 1360 1674
Robust standard errors clustered at SIC level in parentheses: *10% significance;**5% significance; ***1% significance. BGV fixed effects are based on includingpre-sample means of the dependent variable. All models control for ln(R&DStock), ln(Sales), ln(Capital/Labor) and CEO Age, Age2, Tenure and Tenure2.
18