CEO Compensation, Performance and Corporate … annual meetings...reports in the UK, such as...
45
1 CEO Compensation, Performance and Corporate Governance: An Empirical Investigation of UK Panel Data Neslihan Ozkan 1 School of Economics, Finance and Management University of Bristol, England March 15, 2007 Abstract This paper employs a unique, hand-collected panel data set of 390 UK non-financial firms from the FTSE All Share Index for the period 1999-2005 to empirically examine the link between CEO pay and performance, and corporate governance mechanisms . Distinct from the previous studies, I use GMM-system estimation method, which controls for both the presence of unobserved firm-specific effects and the endogeneity of explanatory variables. The results show that measures of board and ownership structures explain a significant amount of variation in the total CEO compensation, which is the sum of cash and equity-based compensation, after controlling other firm-specific variables. JEL classification: G3 Keywords: CEO compensation; Corporate Governance Financial support for this paper is gratefully acknowledged from UK Economic and Social Research Council Grant no: RES-000-22-1762. I would like to thank C. Florackis, M. Umana-Aponte, C. Quinto de Valle for research assistance. 1 Tel.: +44 117 9288439; fax: +44 117 928 8577. E-mail address: [email protected].
Transcript of CEO Compensation, Performance and Corporate … annual meetings...reports in the UK, such as...

1
CEO Compensation, Performance and Corporate Governance:
An Empirical Investigation of UK Panel Data
Neslihan Ozkan1
School of Economics, Finance and Management
University of Bristol, England
March 15, 2007
Abstract
This paper employs a unique, hand-collected panel data set of 390 UK non-financial firms from the FTSE All Share Index for the period 1999-2005 to empirically examine the link between CEO pay and performance, and corporate governance mechanisms . Distinct from the previous studies, I use GMM-system estimation method, which controls for both the presence of unobserved firm-specific effects and the endogeneity of explanatory variables. The results show that measures of board and ownership structures explain a significant amount of variation in the total CEO compensation, which is the sum of cash and equity-based compensation, after controlling other firm-specific variables.
JEL classification: G3 Keywords: CEO compensation; Corporate Governance Financial support for this paper is gratefully acknowledged from UK Economic and Social Research Council Grant no: RES-000-22-1762. I would like to thank C. Florackis, M. Umana-Aponte, C. Quinto de Valle for research assistance.
1 Tel.: +44 117 9288439; fax: +44 117 928 8577. E-mail address: [email protected].

2
CEO Compensation, Performance and Corporate Governance:
An Empirical Investigation of UK Panel Data
Abstract
This paper employs a unique, hand-collected panel data set of 390 UK non-financial firms from the FTSE All Share Index for the period 1999-2005 to empirically examine the link between CEO pay and performance, and corporate governance mechanisms. Distinct from the previous studies, I use GMM-system estimation method, which controls for both the presence of unobserved firm-specific effects and the endogeneity of explanatory variables. The results show that measures of board and ownership structures explain a significant amount of variation in the total CEO compensation, which is the sum of cash and equity-based compensation, after controlling other firm-specific variables.
JEL classification: G3 Keywords: CEO compensation; Corporate Governance
3
1. Introduction
There has been a widespread public attention and academic interest in CEO pay
packages in the UK. Public anger at 'fat cat' salaries first erupted in 1995 over a 75% pay
rise given to Cedric Brown, who was the chief executive of the newly-privatised British Gas.
The second major event was about Vodafone’s CEO compensation package; in 1999, large
shareholders tried to block a £10m bonus awarded to Vodafone chief executive Chris Gent,
following his firm's takeover of German mobile phone group Mannesmann. Recently, more
and more shareholders, particularly institutional investors with large shareholdings have
started to make a stand against generous pay awards for underperforming chief executives in
the UK companies.
For example, in May 2003 GlaxoSmithKline (GSK) faced a shareholder revolt over
the proposals to boost chief executive Jean Pierre Garnier’s pay. The proposed deal would
hand Mr. Garnier discounted share options and free shares worth about $15 m (£9.6 m),
nearly doubling his remuneration. Large shareholders, mainly financial institutions, such as
Standard life and Axa, questioned whether Mr. Garnier’s track record justifies such a large
increase in pay. Then, GSK became the first company in the FTSE 100 index to have its
executive pay rejected by its shareholders2.
Moreover, the Association of British Insurers (ABI) and the National Association of
Pension Funds (NAPF), whose members own about half the shares on the London Stock
Exchange, have been threatening to vote down hefty pay increases for executives who have
been viewed as lame duck bosses. Both the NAPF and ABI have been saying that companies
2 During that year, GSK’s financial performance faltered, with profits falling by 25 %. At the same time, the company’s share price fell 30 % over the 3-year tenure of Mr. Garnier. See, www.bbc.co.uk , business news section.

4
should draft their chief executives' employment contracts in such a way that salary increa ses
are tied more closely to performance.
The aim of this paper is to investigate whether institutional shareholders provide
monitoring for CEO pay packages in the UK companies. I test whether they have a
significant impact on CEO pay-for -performance sensitivity and CEO pay level. Although
recently institutional shareholders seems to have taken an active approach to the design of
CEO compensation packages, the findings from several studies suggest that institutional
investors in the UK seem to adopt a passive stance towards monitoring and disciplining
firms’ management (see Georgen and Renneboog, 2001; Stapledon, 1996) 3. Starting with
Cadbury Report (1992) all UK codes of best practice expressed concern about the passive
approach taken by institutional investors in dealing with underperformance in UK companies
in which they invest. In addition, there was a regulatory change in 2002 aiming to increase
institutional shareholder activism in the UK companies. According to the Company Act of
2002 companies are required to hold annual shareholder votes on executive pay. Recently,
anecdotal evidence from the media shows that institutional shareholders as large investors
have been willing to voice their opinions about executive compensation packages they
consider overly generous. Given this background, it is important to examine how effective
the institutional shareholders are in the UK in the design of CEO pay packages and whether
they play a significant role in CEO’s pay-for-performance sensitivity.
Another important issue that has been a focus of attention in the UK corporate
governance reports and codes of best practice is the monitoring role of non-executive
directors. For example, the Higgs Report (2003) recommends that UK company boards be
composed of a majority of non-executive directors, who would be expected to provide a
3 One exception is Ozkan (2006) who find that institutional share ownership has a negative impact on the level of CEO compensation for a sample of 414 UK companies in 2003. However, she does not investigate whether institutional investors influence CEO pay-for-performance sensitivity.

5
more effective monitoring than executive directors. It has been argued that non-executive
directors, similar to executive directors, could be motivated to be more active monitors on
behalf of shareholders if they have a significant investment in the company. Thus, I examine
whether share ownership by non-executive directors has a significant impact on CEO
compensation packages in the UK. Additionally, I test whether higher proportion of non-
executive directors can increase pay-for-performance sensitivity and has a significant impact
on CEO compensation level.
Finally, I investigate whether other corporate governance mechanisms, such as
executive directors’ ownership, outside bloc kholder ownership, number of outside
blockholders, CEO age and tenure have an impact on the design of CEO pay packages for the
UK companies. CEOs can have substantial influence over their own pay. That is,
compensation will be higher and /or less sensitive to performance in firms, in which CEOs
have relatively more power4. Corporate governance mechanisms could play an important
role in disciplining CEO power and have an impact on CEO compensation packages. By
examining the influence of a comprehensive set of corporate governance mechanisms on
CEO pay, I hope to offer a more complete explanation of CEO pay packages for UK
companies.
For my analysis, I employ a unique, hand-collected panel data set of 390 UK non-
financial firms from the FTSE All share index for the period 1999-2005 and consider both
cash and equity-based components of CEO compensation. Distinct from previous studies I
use GMM-system estimation method, which controls for the presence of unobserved firm-
specific effects and for the endoge neity of explanatory variables. The empirical results
indicate that there is a negative and significant relation between institutional ownership and
level of CEO compensation. I find that firms with larger board size and a higher proportion
4 See, for example, Bebchuk and Fried (2003).

6
of non-execut ive directors on their boards pay their CEOs higher compensation, suggesting
that non-executive directors are not more efficient in monitoring than executive directors. In
addition, the findings show that non-executive director share ownership have a non-linear
and significant impact on the level of CEO cash compensation. These results suggest that
ownership could provide non-executive directors with an incentive to do monitoring in
determining compensation packages for the UK CEOs.
I also find that outside blockholder ownership and number of outside blockholders
matter too5. I document that blockholder ownership and number of outside blockholders has
a significant and negative impact on CEO compensation for our sample. Furthermore, the
results show that there is a significant and positive relation between level of cash
compensation and firm performance, while there is no significant relation between level of
total compensation and firm performance. This finding suggests that corporate governance
reports in the UK, such as Greenbury Report (1995) that proposed CEO compensation be
more closely linked to performance, have not been totally effective. Additionally, I find that
institutional share ownership has a positive and significant impact on CEO pay-for-
performance sensitivity of option grants, cash compensation and total compensation. This
finding is consistent with the stories from the financial press about institutional investors’
influence on CEO compensation packages.
The remainder of the paper is organized as follows: Section 2 presents outlines the
extant literature concerning the relation between corporate governance mechanisms and CEO
compensation. Section 3 presents an overview of the institutional framework in the UK.
Section 4 describes model specification and Section 5 provides information on data sources
and also presents a description of data. The empirical findings are presented in Section 6.
Section 7 presents conclusion and summarizes the findings of the paper.
5 A shareholder with 5% or more share ownership is called blockholder.

7
2. Literature Review
Agency theory suggests that corporate governance mechanisms could reduce conflicts
of interests arising from separation of ownership and control in modern corporations. The
corporate governance mechanisms that have been examined (in various contexts) include
equity ownership by institutional shareholders, outside blockholders, executive and non-
executive directors, board characteristics, CEO’s age and tenure. In this section, I present an
overview of those mechanisms and their potential impact on CEO pay process.
2a. Institutional Investors as Monitors
In many countries including the UK institutional investors have become a dominant
shareholder in financial markets. Institutions as large shareholders are expected to have greater
incentive to engage in monitoring management since the benefits that they receive could
exceed the high cost of monitoring (Shleifer and Vishny, 1986). However, some authors argue
that institutional investors rarely take action in corporate monitoring because they view
liquidity as more important than building up the concentrated ownership required to have an
influence on corporate management (Coffee, 1991; Bhide, 1994). Bhide argues that high
liquidity in U.S. stock markets serves as an impediment to effective corporate governance;
when dissatisfied with management actions, institutions sell their shares rather than hold on to
their investment and use their votes to influence the company to achieve better results.
Maug (1998) investigates the claim that liquid stock markets prevent effective
corporate governance and argues that the alleged trade -off between liquidity and control does
not exist. Although in a more liquid market it is less costly to sell a large stake, such a market
also makes it easier for investors to accumulate large stakes without substantially affecting the
stock price and to capitalize on governance-related activities. Liquid stock markets have two
opposing effects on corporate governance. On the one hand, liquid markets can facilitate the

8
exercise of corporate control because they allow large shareholders to emerge to correct
managerial failure. On the other hand, liquid markets also allow large shareholders to dispose
of their shares ahead of an expected fall in stock prices rather than become involved in
management of the company. It is theoretically ambiguous which of these effects dominates.
In the UK, institutional investors hold a considerably large ownership of total corporate
equity. According to the ONS (2004) as of December 2003 institutional investors owned
around 80 percent of UK equity, with the largest holdings being those of insurance companies
17 percent; pension funds 16 percent; unit trusts, investment trusts and other financial
institutions together holding some 15 percent; and overseas investors 32 percent.
Given their substantial ownership, the potential role of institutions in UK corporate
governance is an important area to explore. However there are only a few studies investigating
how effective institutions are in monitoring UK corporations’ management. Goergen and
Renneboog (1998) argue that despite the fact that a large percentage of the aggregate UK
market capitalization is held by institutions, these institutional investors are not major players
from a principal-agent perspective. They suggest various explanations for the institutional
investors’ passive approach in the UK. For instance, they note that institutions follow low-cost
passive index strategies and they do not spend their resources to actively monitor the large
number of companies in their portfolios.
The studies by Goergen and Renneboog (2001), and Stapledon (1996) focus on the role
of institutional investors in UK corporate governance. Their results suggest that institutions are
passive investors; monitoring by institutions is not an important governance mechanism for
UK corporate management. Mallin (1995)’s survey results from a sample of 250 large
companies show that 90 % report voting levels of less than 52 %. Plender (1997)’s
findings also provide support for the passive standing of institutional investors in the UK. He
reports that institutional investors do not frequently exercise their voting rights: only about 28

9
percent of pension funds cast their votes on a regular basis, 21 percent never vote and 32
percent vote only on extraordinary items.
However, one can observe that recently substantial changes have occurred in the
practices of institutional investors. According to a report by the Committee inquiring into
U.K. Vote Execution voting levels at U.K. companies moved from 20 % in 1990 to 50 % in
19996. Furthermore, the amendment of the Companies Act in 2002 requires the shareholders’
approval of executive compensation packages at the company annual general meeting. Thus
one important governance characteristics of the UK is that in the UK, unlike the US,
shareholders vote on CEO and other executive compensation packages. Although the vote is
not binding, companies often adhere to them. Institutional investors as large shareholders have
been willing to voice their opinions about compensation packages they considered overly
generous 7.
Recent statements by the Association of British Insurers (ABI) and National
Association of Pension Funds (NAPF) and by the Institutional Shareholders’ Committee (ISC)
emphasize the role of institutional investors in corporate governance. The ISC (2002)
recommended policies on activism, which do not imply micro-managing the affairs of investee
companies, but rather ensuring that shareholders derive value from their investments by
dealing effectively with issues of under-performance.
A recent study by Ozkan (2006) finds that institutional ownership has a significant and
negative impact on the level of CEO compensation for a sample of 414 companies for the year
2003. Her findings are consistent with the recent anecdotal evidence that institutions as large
shareholders have become more active in their monitoring role. One major limitation of her
analysis is that it is based on 1-year data. This paper adds to the literature on institutional
6 However, this is still in substantial contrast to the U.S., where voting turnout can easily reach 70-80 % at many companies (Bethel and Gillan, 2002). 7 See the article ‘Why British CEOs Earn LessThan Their U.S. Counterpart’, by Joanna L. Ossinger , The Wall Street Journal online.

10
ownership and CEO compensation by employing a panel of UK non-financial companies for
the period 1999-2005. Furthermore, different from Ozkan (2006), I investigate whether
institutional share ownership has an impact on CEO pa y-for-performance sensitivity.
2b. Board of Director Characteristics
Economic theory suggests that the board of directors is an important part of corporate
governance structure in large corporations (Fama and Jensen, 1983). The board of directors’
main function is to serve to resolve conflicts of interest among shareholders and managers.
The corporate governance reports in the UK, such as the Cadbury(1992), the Greenbury
report(1995) and the Hampel report (1998) focused attention on the company board’s
monitoring role and emphasized the contribution that non-executive directors can make to
this process. Until recently, the boards of large UK corporations were typically dominated
by senior executives from within the organization. As a response to the corporate
governance reports, there has been a change in the composition of UK company boards. For
example, Peasnell et al. (1998) reports that percentage of non-executive directors on the UK
boards increased from 33 percent in 1990 to 45 percent in 1996. For my sample, I observe
that proportion of non-executive directors increases from 49 % in 1999 to 57 % in 2005.
One difference between UK and US is that US boards are dominated by outside
directors. For example, Bhagat and Black (1998) find an average of 76 percent outside
directors on US boards. It appears that US outside directors with a higher percentage of
outside directors might be in a better position to monitor management than their UK
counterparts. Core et al. (1999) find that less independent outside directors are associated
with greater CEO compensation for his sample of US companies. For a sample of 414 UK
companies in 2003, Ozkan (2006) finds that proportion of non-executive directors has a
positive impact on CEO compensation suggesting that non-executive directors do not play a
monitoring role. However, she does not test whether share ownership by executive and/or

11
non-executive directors would induce them to provide effective monitoring. In this paper, I
investigate both the impact of proportion of non-executive directors and share ownership by
non-executive and executive directors on CEO compensation packages.
From the corporate governance point of view, another important board characteristic
is board size. Previous evidence suggests that smaller boards provide more effective
monitoring than large boards. For example, Yermack (1996) argues that smaller boards can
mitigate the free rider problem and be more open to dialogue. However, these advantages of
smaller size boards can be in conflict with having a more diverse board composition. Hence,
Morck (2004) argues that based on the findings in the social psychology literature larger,
more diverse boards can be related to more effective monitoring. In this study, I investigate
whether board size can play a role in determining CEO pay level and CEO pay-for-
performance sensitivity for a sample of 390 non-financial companies in the UK for the period
1999-2005.
2c. Executive and Non-executive Directors’ Shareholdings
The separation of ownership and control in corporations creates the potential for
conflicts of interest between directors and shareholders. There is an extensive literature that
supports the notion that director ownership can help align the interests of directors with those
of shareholders. That is, with increased director ownership, directors would be less likely to
divert resources away from value maximization as they bear part of the costs of their actions.
Thus, one would expect higher director shareholdings might limit excessive CEO
compensation packages leading to a negative relationship between director ownership and
CEO compensation (i.e. incentive alignment effect).
Hence, the relationship between directors’ ownership and the alignment of
shareholder and directors’ interests can be non-monotonic, implying that the marginal effect

12
of increased directors’ share ownership depends on the current level. At higher levels of
directors’ ownership outside investors might find it difficult to monitor the directors’
behavior since higher ownership gives directors more direct control over the company,
increasing their ability to resist outside investors’ pressures. Increased director ownership
can also give directors greater voting power and control, which could lead to their
entrenchment. Furthermore, higher director shareholdings might inhibit the external
corporate control market and, in so doing reduce the effectiveness of internal monitoring.
For instance, existence of an external control threat might increase the likelihood that the
board of directors would feel pressured to take action against a poorly performing CEO (See,
e.g., Stulz (1988)). Consequently, entrenched directors who are relatively free of external
discipline could provide less effective monitoring, which could lead to excessive level of
CEO compensation.
The net impact of these two effects would determine the sign of the relationship
between director ownership and CEO compensation. To test the hypothesized non-
monotonic nature of the relationship between director ownership and CEO compensation I
estimate a quadratic model that implies existence of a turning point. That is, as director
ownership increases, I expect to observe first a negative (i.e. incentive alignment), then a
positive effect (i.e. entrenchment) exerted by director ownership on CEO compensation.
Non-executive and executive directors could have different incentives for monitoring
the corporate management. Non-executive’s main task is to review the performance of both
the board and executive directors (Cadbury, 1992). They usually work part-time and have
positions on more than one company boards, and are paid relatively less than executive
directors. Given that monitoring requires both time and effort, non-executive directors’
shareholdings provide them with incentives to do active monitoring. Additionally, their
concern about their own reputations and future career prospects might provide them with

13
incentives to be effective in monitoring. Thus, in this paper I examine separately the impact
of executive and non-executive directors’ ownership on CEO compensation. Previously,
Morck et al. (1988) and Bhagat and Black (2002) attempt to investigate separately the impact
of share ownership by executive and non-executive directors on firm value using US data.
However, in the context of CEO compensation there has not been any empirical study
examining the role of executive and non-executive directors using their ownership. So, one
of the aims of this paper is to fill this gap.
2d. CEO age and horizon problem
I control for the CEO’s age and tenure, which is defined as the number of years he
has been CEO. One would expect that older CEO age and longer CEO tenure might lead to
entrenchment. Older CEOs and CEOs with longer tenure might have more power to design
their compensation packages. However, a CEO with longer tenure might also have larger
share ownership from the previous share awards and options. Consequently, the relation
between CEO tenure and compensation level would be expected to be ambiguous.
3. Institutional Framework and CEO compensation in the UK
In the 1990s several reports aiming to correct corporate governance problems in the UK
were issued: Cadbury (1992), Greenbury (1995) and Hampel (1998) reports. These have
helped focusing attention on the importance of corporate governance issues. The Cadbury
(1992) report viewed institutional investors as having important responsibility in corporate
governance. It included recommendations on the structure and responsibilities of corporate
boards of directors. The two key recommendations were that boards of publicly traded
companies include at least three non-executive (i.e., outside) directors and that the positions of
chief executive officer (CEO) and chairman of the board of these companies be held by two
different individuals. It was also recommended that companies should establish remuneration

14
committees. The reasoning underlying those recommendations was that greater independence
could improve board oversight. In response to the recommendations, the overwhelming
majority of publicly traded companies have established remuneration committees and they are
comprised entirely of non-executive directors.
The Greenbury report (1995) concentrated specifically on executive compensation
policies and recommended that all long term incentive schemes paid by firms, including share
options, should be subject to challenging performance criteria. In response to those
recommendations most of the publicly traded companies introduced goals for earnings per
share (EPS) and total shareholder return (TSR) for the firms to achieve before long term
incentive plans (LTIPs) would be vested. It also recommended the use of LTIPs over option
grants and ruled out the common practice of discounting options by 15 % of the grant date
share price. The report recommended that these measures should consider performance
relative to a group of comparable companies. It highlighted that directors should not be
rewarded for increases in share prices (or any other indicators) which might reflect inflation or
general market movements, i.e. which are not directly related to managerial actions. These
recommendations have seen widespread approval and rapid implementation.8
The Hampel Committee (1998) investigated the corporate governance
recommendations in force in the UK. Both the Greenbury (1995) report and Hampel (1998)
report have further made it a requirement for UK companies to disclose US style compensation
information, allowing for more detailed compensation analyses. Hampel (1998) stresses the
need to pay non-executives fixed fees and recommends the barring of giving them incentive
compensation such as LTIPs. The recommendations of all three reports were combined to
form part of the London Stock Exchange (LSE) Combined Code, which all companies listed
on the LSE must abide by. More recently, Higgs (1993) report also emphasized that UK
companies should establish a transparent procedure for developing policy on executive
8 See, Conyon et al (2000).
15
remuneration and for fixing the remuneration of individual directors. Additionally, it was
recommended that executive directors’ remuneration should be structured so as to link rewards
to corporate performance.
Overall, those reports played an important role in enforcing detailed disclosure rule s for
UK executive compensation. Now, UK company annual reports contain sufficient information
about executive compensation packages to analyse total annual compensation. Previously it
was not possible to evaluate the total executive compensation including the value of share
options, because of poor disclosure requirements for the UK companies.
To date, research on executive compensation in the UK has concentrated mainly on
cash component of compensation, which is available in electronic form9. For example,
Conyon (1997) use only cash compensation data for a sample of 213 large UK companies
between 1988 and 1993 and shows that remuneration committees, an increasingly popular
institutional device for setting top pay in the UK, may have some influence on director
compensation but his result is not particularly robust. He concludes that there is only mixed
evidence. He also finds that separating the roles of chairman and chief executive officer,
which might potentially mitigate agency problems associated with top pay setting, plays a
minor role in influencing director pay. Gregg et al. (2005) examine the relationship between
executive cash compensation and company performance for a sample of large UK companies
over the period 1994-2002. Their findings show that overall there is little relationship between
cash compensation and performance.
One possible explanation for these weak statistical results is that those researchers have
relied on total cash pay (that is the sum of salary and annual bonus) as a measure of executive
compensation. Thus, one can criticize those studies for their analysis excluding the equity-
based component of compensation. They omit potentially performance-sensitive component of
compensation, e.g., stock options and stock awards. As a result, they ignore interesting 9 Currently, other components of compensation, such as stock options and stock awards, are not available in electronic form, but only available in the companies’ annual reports.

16
differences in the extent to which the cash and equity-based components of compensation are
affected by firm performance.
One exception (in the UK literature) is a study by Main, Bruce, and Buck (1996), which
considers both cash and equity-based components of executive compensation for the period
1983 to 1989. Their findings show that the sensitivity of total compensation including share
options to share performance for the highest paid director is rather small10. Hence, their data is
for an earlier period, when the target of creating shareholder wealth was not as commonly
emphasized as it is today. Additionally, from that period to today corporate governance
mechanisms have changed considerably in the UK. Thus, one would expect that a study
analyzing a more recent period could provide a different set of results.
There is another strand of the compensation literature consisting of studies that
consider both cash and equity-based components of CEO compensation for UK companies
using one-year data. Conyon and Murphy (2000) analyses differences in CEO pay and
incentives in the U.S. and UK for 1997. Their findings show that after controlling for
economic determinants of CEO pay, CEO compensation in the US is higher tha n in the UK
based on their sample for the fiscal year 1997. Ozkan (2006) examines the influence of
corporate governance mechanisms on the level of CEO compensation for a sample of 414
UK companies for the year 2003. Her findings show that firm performance does not have a
significant impact on CEO compensation, while measures of board and ownership structures
explain a significant amount of cross-sectional variation in the total CEO compensation,
which is the sum of cash and equity-based compensation. One major caveat of those studies
is that although they use a detailed composition of CEO compensation including both cash
and equity-based components, their analysis is only limited to 1-year data, and this may
affect their results.
10 In their study they do not investigate the impact of corporate governance mechanisms on executive pay.

17
Murphy (1985) argues convincingly how cross-sectional strategies would provide
limited explanation to assess the relationship between compensation and performance. This
paper uses panel data of UK non-financial firms to investigate the relationship between CEO
compensation, performance and corporate governance mechanisms. Panel estimation
technique makes it possible to control for time-invariant firm-specific effects, thus
eliminating a potential source of omitted variable bias.
4. Model Specification and Estimation
To examine the relation between CEO pay and performance, and corporate governance
mechanisms I employ two regression analyses, one that seeks to explain the level of CEO
compensation and another one that seeks to explain changes in CEO compensation. First, I
describe the components of CEO compensation packages.
4a. Measuring the components of CEO compensation
CEOs in the UK receive base salaries and are eligible for annual bonuses, which are
based on accounting performance. They also receive share options, normally issued at the
current share price. In the UK, options are generally exercisable at the holder’s discretion after
three to seven years, subject to the achievement of a performance target, such as growth in
earnings per share. Many companies use long-term incentive plans (LTIPs) in addition to or
instead of an option scheme. Thus, LTIPs are grants of shares of stock that become vested
(i.e., ownership is transferred to the CEO) if certain performance targets are achieved. It is
notable that while the most common performance condition on options is the achievement of a
certain level of growth in earnings per share, for long-term incentive plans the most common
measure is total shareholder return, the combined dividend and capital gain return to
shareholders over a period of time. CEOs are rewarded for their relative total shareholder
return compared to an index or a group of peers. The advantage of using total shareholder
return as a performance measure is that it is aligned with shareholder return, and is perceived
18
to be outside the immediate control of the executives. Recently, institutional investor pressures
have led to performance targets being increased11.
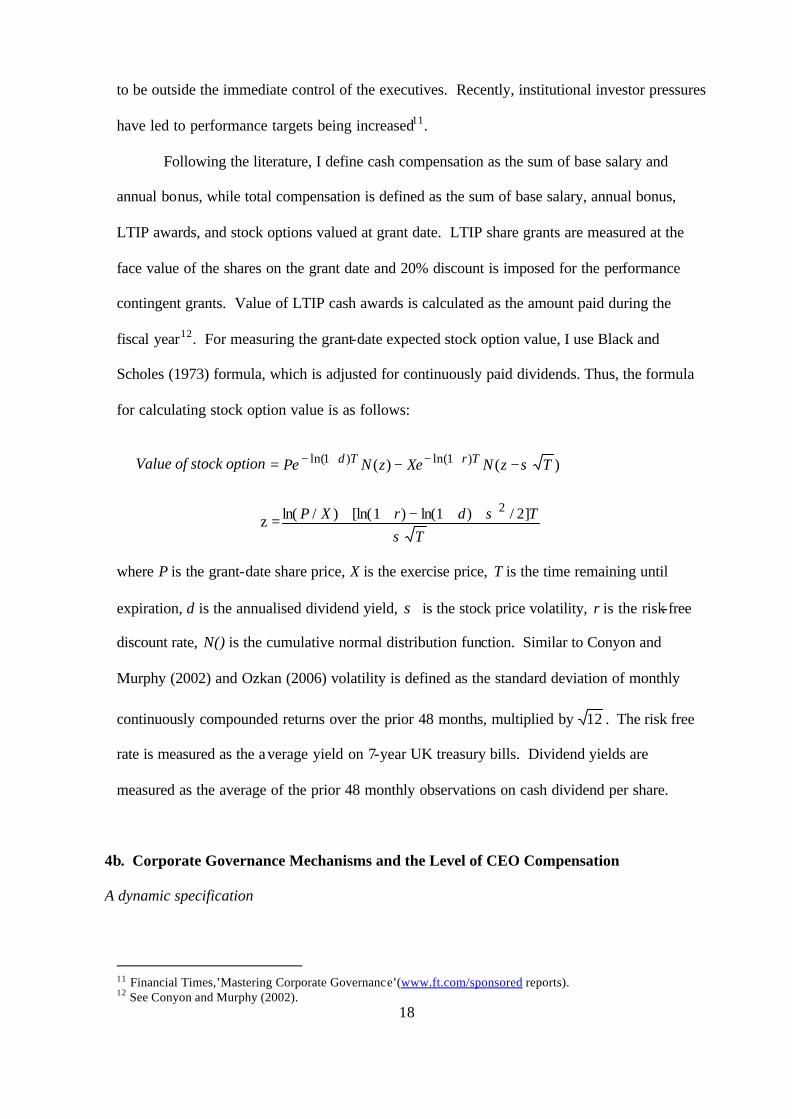
Following the literature, I define cash compensation as the sum of base salary and
annual bonus, while total compensation is defined as the sum of base salary, annual bonus,
LTIP awards, and stock options valued at grant date. LTIP share grants are measured at the
face value of the shares on the grant date and 20% discount is imposed for the performance
contingent grants. Value of LTIP cash awards is calculated as the amount paid during the
fiscal year12. For measuring the grant-date expected stock option value, I use Black and
Scholes (1973) formula, which is adjusted for continuously paid dividends. Thus, the formula
for calculating stock option value is as follows:
Value of stock option )()( )1ln()1ln( TzNXezNPe TrTd σ−−= +−+−
z =T
TdrXPσ
σ ]2/)1ln()1[ln()/ln( 2++−++
where P is the grant-date share price, X is the exercise price, T is the time remaining until
expiration, d is the annualised dividend yield, σ is the stock price volatility, r is the risk-free
discount rate, N() is the cumulative normal distribution function. Similar to Conyon and
Murphy (2002) and Ozkan (2006) volatility is defined as the standard deviation of monthly
continuously compounded returns over the prior 48 months, multiplied by 12 . The risk free
rate is measured as the average yield on 7-year UK treasury bills. Dividend yields are
measured as the average of the prior 48 monthly observations on cash dividend per share.
4b. Corporate Governance Mechanisms and the Level of CEO Compensation
A dynamic specification
11 Financial Times,’Mastering Corporate Governance’(www.ft.com/sponsored reports). 12 See Conyon and Murphy (2002).

19
To investigate whether corporate governance variables and firm performance have
significant association with level of CEO compensation, I estimate the following dynamic
model;
compensationit
= α compensationit-1 + 1η performancei,t + ∑=
m
kk
1δ corporate governance
variablei,t + ∑=
n
jj
1β control variable i,t + iθ + itε
where iθ is the firms-specific (or fixed) effect, itε is the error term, and the dependent variable
“compensation” is measured by either cash compensation (the sum of salary and bonus) or
total compensation (the sum of salary, bonus, value of stock options and LTIP). Following the
prior studies on CEO compensation, industry-specific effects and time-effects are also
included. Additionally, the model allows for persistence in CEO pay by including a lagged
dependent variable. The coefficient α gives an estimate of the degree of CEO pay persistence.
Most previous researchers have usually omitted the lagged variable for compensation in their
regression model. Thus, they implicitly imposed the restriction that 0=α . I test the validity
of such restriction for my sample data.
Firm performance is measured by the stock return13. Corporate governance variables
include institutional ownership concentration, blockholders ownership concentration, number
of blockholders, directors’ ownership concentration (the sum of executive and non-executive
directors’ share ownership), board size and percentage of non-executive board members on the
13 Also the change in shareholder wealth, ∆ ( shareholder wealth) it ,which is defined as 1−ttVr , where tr is the
rate of return on common stock realized in fiscal year t, and 1−tV is the firm value at the end of the previous year.

20
board14. Control variables are firm size, which is measured by firm’s sales, and growth
opportunities (which can be measured by Tobin’s q)15.
Previous researchers have pointed to the potential endogeneity problem in executive
compensation models. For example, Hartzell and Starks (2003) use lagged explanatory
variables to minimize the endogeneity problem in their OLS pooled regression model. In the
CEO compensantion model, all regressors are potentially endogenous since shocks that affect
CEO compensation level are also likely to affect other regressors such as growth opportunities,
size, board structure and institutional ownership. Moreover, reverse causality might
complicate relations among the variables. For instance, firms might decide on certain
compensation packages to attract institutional investors. Furthermore, increasing trends in
institutional shareholdings and CEO compensation level could lead to a spurious relationship
between the two variables. As a result, one would observe an endogeneity in the relationship
between institutional share ownership and CEO compensation level.
Another potential source of endogeneity is the presence of unobservable firm-specific
effects (fixed effects) that are correlated with the regressors. Failure to control for fixed effects
might lead to the omitted variable bias. Finally, the dynamic specification would imply a
correlation between lagged dependent variable and the fixed effects. Thus, OLS estimation
would give biased and inconsistent estimates. Furthermore, fixed-effects estimation method
would provide biased and inconsistent estimates16.
Thus, I use GMM (generalised method of moments)-system estimation method to solve
these problems. This method is a variant of the GMM estimation and it is reported to perform
14 Institutional ownership concentration is measured as the fraction of total company shares outstanding held by the institutions. Director ownership concentration is measured as the fraction of total company shares outstanding held by the directors. 15 Tobin’s q is calculated as the sum of the market value of equity and the book value of debt (that is, the difference between the book value of assets and book value of equity), divided by book value of assets. To the extent that Tobin’s q captures firm’s expected performance, I control for that by including a measure of firm performance (that is, change in shareholder wealth) 16 See also Zhou (2001) for potential problems with using fixed-effects estimation for models that include ownership variables, such as directors’ ownership etc.

21
well with highly persistent data like ownership and firm performance.17 Moreover, the GMM-
system estimator controls for the presence of unobserved firm-specific effects and for the
endogeneity of the explanatory variables.
4c. Corporate Governance Mechanisms and Pay-for Performance Sensitivity of Stock
Options
In this section, I examine the relation between corporate governance variables and pay-
for-performance sensitivity. In particular, I focus on the option grant sensitivity. I use
Yermack (1995)’s methodology to compute option grant sensitivity. I calculate the delta of
every option grant, PC ∂∂ / (where C is the value of the call option and P is the price of the
stock) using the Black-Scholes model. I then multiply the delta of the options by the number
of the options granted, and divide by the number of shares outstanding at the beginning of the
year. This number will be the sensitivity of the option grant per pound change in share value.
To analyse the relation between option-grant sensitivity and corporate governance
variables, I use a Tobit model. Some firms do not pay their CEOs with stock options, and even
those firms that use options do not necessarily grant them every year. Thus, stock options data
have large number of zero-valued observations and have a truncated distribution, which would
make Tobit approach appropriate18. The regression model is as follows:
17 The GMM estimation method was originally proposed by Arellano and Bond (1991) and Arellano and Bover (1995) and then improved by Blundell and Bond (1998). The GMM-system estimator combines a set of first-differenced equations with equations in levels and lagged first-differences are used as instruments for level equations and lagged level terms are used as instruments for equations in first differences. See also Cheung, A.W.K and Wei, K.C.J (2006) about GMM-system estimation. 18 Tobit model has been previously used by Yermack (1995) and Hartzell and Stark (2003).

22
∆ (value of options granted per unit £ change in shareholder wealth ) (1∆=νit shareholder
wealth) it + ∆2ν (shareholder wealth ) 1−it + ∑=
m
kk
1δ corporate governance variable kit ,1− +
∑=
n
jj
1β control variable
1−it
Corporate governance variables include institutional ownership, directors’ ownership,
board size and percentage of non-executive board members on the board. Control variables are
firm size (which can be measured by firm’s market capitalisation)19 and growth opportunities
(which can be measured by Tobin’s q). Industry-specific effects and time-effects are also
included. The model is also similar to Hartzell and Stark (2003), who focus on the impact of
institutional ownership on pay for performance sensitivity. However, different from their
study I also consider the impact of board structure and directors’ ownership, CEO age and
tenure on option grant sensitivity. A positive coefficient estimate for institutional ownership
would suggest that institutional shareholders provide monitoring in designing CEO
compensation packages in the UK companies. Additionally, a positive coefficient estimate for
percentage of non-executive directors on the board would be interpreted as non-executive
directors’ active monitoring in determining the structure of CEO compensation packages.
4d. Corporate Governance Mechanisms and Pay-for Performance Sensitivity of Cash
Compensation and Total Compensation
In this part, I focus on cash compensation and total compensation in measuring pay
for performance sensitivity. I examine the relation between corporate governance
mechanisms and this sensitivity using the following regression model:
19 Alternative measures are firm’s sales and total assets.

23
∆ (compensation) (1∆=νit shareholder wealth) it + ∆2ν (shareholder wealth ) 1−it +
∑=
m
kk
1
δ corporate governance variable kit ,1− + ∑=
n
jj
1β control variable
1−it
Compensation is measured by either cash compensation (the sum of salary and bonus) or
total compensation (the sum of salary, bonus, value of stock options and LTIP). Corporate
governance variables and control variables are defined similar to the regression model in the
previous section, 4b. I use change in shareholder wealth as a measure of firm performance.20
Industry-specific effects and time-effects are also included. In this model, in order to
examine whether pay-for-performance sensitivity is associated with institutional
shareholdings, I add an interaction term as an explanatory variable, e.g., ∆ (shareholder
wealth ) 1−it × (institutional ownership concentration), for which a positive coefficient would
suggest institutional shareholders play a monitoring role as contributing to an increase in
pay-for-performance sensitivity of cash compensation (or total compensation).
5. Data
The sample covers the 7-year period 1999-2005 for 390 non-financial companies from
the FTSE All Share Index21. I have an unbalanced panel with 2304 firm-year observations. I
include both cash and equity based compensation components for the sample period. Although
disclosure for director compensation in the UK has significantly improved following the
Greenbury (1995) and Hampel (1998) reports, the compensation information is still not
available in electronic form and must be hand-collected from annual reports. Furthermore, the
remuneration information is not reported in the same tabular form across different companies,
making compensation data collection more challenging.
20 This model is similar to the model used by Jensen and Murphy (1990) and Hartzell and Starks (2003) to estimate pay-performance sensitivity. They also use change in shareholder wealth as a measure of performance. 21 FTSE All Share Index represents over 95 % of the UK stock market capitalisation.

24
For each company, I collected compensation information from the remuneration section
of the annual reports. For ownership variables, I collected data from the Hemmscott Guru and
also annual reports. Data for CEO age and tenure were also collected from Hemmscott Guru
and annual reports and data for financial variables were extracted from the Datastream.
Table 1 (A) reports descriptive statistics for components of CEO compensation for the
sample period. One can observe that there has been an increase in average base salary, bonus,
value of LTIPs. The largest increase has been in the value of LTIPs. Average value of stock
options granted during the sample period has been considerably volatile and one can observe a
sharp decline in the average value of stock options granted from the year 2003 to 2005. This
decline is consistent with the findings of a report in 2005 by PwC consultants suggesting that
in the UK options as a form of executive award may not be totally dead but they are rapidly on
the way out. They argue that a significant catalyst is the new international accounting rule that
requires option grants to be charged for the first time to profit and loss account, thus removing
the accounting advantage they had over the other main form of long-term incentive plans.
Thus, average value of stock options reduce from £92,909 in 1999 to £38,031 in 2005 while
average value of LTIPs increase from £53,608 in 1999 to £194,768 in 2005. Furthermore,
average total compensation increased from £386,902 in 1999 to £700,507 in 2005.
Table 1 (B) shows descriptive statistics for ownership and board structure variables.
One can observe that both mean and median for institutional share ownership, 4 largest
institutional ownership and blockholder ownership increased from 1999 to 2005. However,
average number of blockholders seems to have been stable around 2. While average executive
share ownership decreased from 6.535 % in 1999 to 4.184 % in 2005, average non-executive
share ownership stayed stable around 2 %. One can also notice that while the average board
size was stable over the sample period, the average percentage of non-executive directors has
increased from 49.1 % to 57.1 %.

25
The descriptive statistics of the control variables are shown in Table 1(C). The average
firm size (market capitalization) is £1823.93 million and the median is £253.6 million. Stock
return, which is a measure for firm performance, has an average of 16.10 percent with a
standard deviation of 64.90 percent. Tobin’s Q, a proxy for growth options, average 1.768 and
ranges from 0.11 to 12.9922.
6. Regression results
6a. Corporate governance and CEO level of cash compensation
Table 2 reports GMM-system estimation results for CEO cash compensation level,
which is measured as the sum of base salary and cash bonus. The positive and significant
coefficient estimate for the lagged compensation shows that there is a significant persistence in
CEO cash compensation. In addition, the regression estimates in Table 2 show that larger
firms pay greater CEO compensation, which is consistent with previous studies 23. The
coefficients for the industry and time dummies are not reported in the tables, as they are not of
direct interest for this study. The coefficient on the stock return variable is positive and
significant at 10 percent level.
Tobin’s Q does not have significant impact on the level of CEO cash compensation.
The results in Table 2 also show that there is a positive and significant association between
CEO cash compensation and board size. This positive slope is consistent with an interpretation
that problems with coordination, communication, and decision-making can hinder board
effectiveness, which might be revealed as higher cash compensation for CEOs as the number
of directors increases. Thus, our finding is consistent with previous studies, which argue that
larger boards are less effective in monitoring and more susceptible to influence of CEO power
Additionally, the results show that firms with a higher proportion of non-executive
directors offer higher cash salaries for CEOs. However, the coefficient is not significant. This
22 Tobin’s Q is measured as the sum of book value of assets plus market value of common stock minus.book value of common stock divided by book value of total assets. 23 For example, see Conyon and Murphy (2000).

26
result can be considered as consistent with the findings of Franks, Mayer, Renneboog (2001).
Their results suggest tha t non-executive directors do not perform a disciplinary function in the
UK companies. They find that non-executive directors tend to entrench management by
reducing board turnover in poorly performing companies.
The results demonstrate that the level of CEOs’ cash compensation is negatively and
significantly related to institutional ownership concentration, which is measured as the sum of
institutional shareholdings and also by the sum of four largest institutional shareholdings. This
result suggests that institutional shareholders provide monitoring for CEOs’ cash compensation
level. It is also consistent with the theoretical literature regarding the role of the large
shareholder; that is, institutions have greater influence when they have large shareholdings in
firms. Our empirical results provide support for the anecdotal evidence that recently
institutional investors have become more active in the UK corporations and also they support
the results from Ozkan (2006). However, this finding is contrary to the previous empirical
evidence reported by Cosh and Hughes (1997) and Franks et al. (2001) that the institutional
shareholders in the UK companies are passive. I also find that blockholder ownership and
number of blockholders have a negative and significant impact on CEO cash compensation
level.
I find that the estimated coefficient for executive directors’ ownership is negative but
statistically insignificant in column (2) and (3) and there is no significant non-linear relation
between CEO compensa tion and executive ownership. However, I find that share ownership
by non-executive directors has a significant non-linear impact on CEO cash compensation
level. The stability of estimated coefficients across the four columns lends support to the
conclusion that the relation has a non-linear form. This result may be interpreted as evidence
that non-executive board members provide monitoring when they have financial incentives.24
24 I find that CEO age and tenure do not have a significant impact on CEO cash (and total) compensation level and adding those variables into the analysis does not change my result s. Thus, those results with CEO age and tenure are not reported for brevity.
27
As reported in table 1, during the 1999-2005 period for my sample firms share ownership by
non-executives was relatively lower than share ownership by executives, but still this level of
share ownership by non-executives seems sufficient to give them incentive to have a
significant impact on CEO cash compensation.
In addition, the model does not seem to exhibit second order serial correla tion (see the
M2 statistic). The Sargan test of over-identifying restrictions suggests that the instruments are
valid and Sargan Difference statistic validates the extra moment restrictions imposed by the
level equations in the GMM-system specification.
6b. Corporate governance and level of total CEO compensation
Table 3 reports GMM-system regression results for total CEO compensation, which is
the sum of cash compensation and equity-based compe nsation. The results indicate that the
coefficient on the stock return is not statistically significant25. Company size, sales, has a
significant and positive impact on the total compensation level. Tobin’s Q, the proxy for
growth opportunities, has positive, but insignificant impact.
Additionally, the estimated coefficients for board size and the proportion of non-
executives on the board are positive and statistically significant. So the results suggest that
board structure matters for the total CEO compensation level and non-executive directors do
not seem to provide monitoring for the level of total CEO compensation. Similar to the results
for U.S. companies, I find that institutional shareholdings have a negative and significant
impact on the total CEO compensation level. Blockholders also play a significant role in
determining the total CEO compensation as their ownership increases, the total CEO
compensation declines. The estimated coefficient for block-holder shareholding is also
negative and significant. The negative relation is consistent with the argument that
blockholders act as a check on the CEO pay level. One would expect that if block ownership 25 Other performance measures, such as industry adjusted stock returns, ROA (return on assets), industry adjusted ROA, have also been used but there has been no change in the results.

28
is more concentrated, then those blockholders would coordinate their monitoring with
relatively greater ease and exert pressure on management. Thus, they can help ensure that
management does not expropriate wealth from shareholders in the form of excess pay.
Finally, both executive and non-executive directors’ share ownership have generally
insignificant impact on total CEO compensation. In addition, the model does not seem to
exhibit second order serial correlation (see the M2 statistic). Moreover, the Sargan test of
over-identifying restrictions suggest that the instruments are not correlated with the error term.
The Sargan-difference test statistic validates the extra moment restrictions imposed by the level
equations in the GMM system specification.
6c. Institutional share ownership and CEO pay-for-performance sensitivity of option
grants
The results of the tobit regressions, provided in Table 4, show that the institutional
share ownership is important in explaining option-grant pay-for-performance sensitivity.
column (1) and column(2) show that the results hold whether concentration of institutional
shareholdings is measured by total institutional share ownership or top 4 institutional share
ownership. The finding of the significant relation between CEO compensation structure and
institutional share ownership concentration supports the hypothesis that institutional
ownership can serve as a monitoring device that influences the structure of the CEO
compensation. Additionally, column (3) and column (4) show the results for block-holder
share ownership and number of block holders. The evidence of the significant and positive
impact of block-holder ownership and number of block-holders on option-grant sensitivity
suggests that block-holders provide monitoring for the structure of CEO compensation.
The results in Table 4 show that CEO option-grant sensitivity is positively related to
Tobin’s Q. This finding is consistent with Smith and Watts (1992)’s argument that firms with
greater growth opportunities should have more incentive pay. I also find that board size and

29
proportion of non-executive directors on board have a negative impact on CEO option-grant
sensitivity. The coefficient for directors’ ownership is positive but insignificant. Furthermore,
the results show that higher CEO tenure is associated with lower option grant sensitivity
suggesting the entrenchment effect of CEO tenure.
6d. Institutional share ownership and CEO pay-for-performance sensitivity of cash and
total compensation
Column (1) and (2) of Table 5 provide the regression results when the CEO’s
compensation is defined as salary plus bonus. The two models employ the two different
specifications for institutional investor concentration. Column (3) and Column (4) expand the
definition of CEO compensation to include equity-based components of CEO compensation.
Consistent with Table 4, the results in Table 5 show that pay-for-performance
sensitivity is significantly related to the concentration of institutional share ownership. Thus,
my findings indicate that pay-for-performance sensitivity is positively and significantly
associated with institutional ownership concentration, even after controlling for growth
opportunities, firm size, industry fixed effects, board characteristics, CEO age and tenure. My
results are consistent with Black(1992)’s argument that institutional investors could take on a
stronger monitoring role by holding larger fraction of shares in companies and teaming up with
other institutions to increase their influence. Our findings provide support that such an activity
may be occurring.
Furthermore, the positive relationship between pay-for-performance sensitivity and
concentration of institutional share ownership suggests that institutional share holders provide
a complementary monitoring mechanism to CEO incentive compensation. Thus, my findings
are consistent with theoretical arguments that monitoring by large shareholders and incentive
compensation play interrelated roles (see, for example, Holmstrom and Tirole (1993)).

30
7. Conclusion
CEO compensation packages have been viewed as important in mitigating the conflict
of interest between managers and shareholders in corporations. It has been widely recognized
that compensation packages could potentially play an important role in motivating top
managers. Therefore it is important to understand how corporations set the CEO compensation
packages and what factors play an important role in determining the level of compensation.
This paper provides additional empirical evidence on the relationship between corporate
governance mechanisms and CEO compensation for a sample of 390 UK non-financial
companies from FTSE Allshare index for the period 1999-2005.
The results indicate that corporate governance mechanisms influence the level of CEO
compensation level. The findings suggest that larger firms pay their CEOs higher
compensation, which one can interpret as reflecting their demand for higher quality CEO
talent. Additionally, firms with larger board size and a higher proportion of non-executive
directors pay their CEOs higher level of cash compensation. I also docume nt that institutional
and blockholder ownership have a significant and negative impact on the level of total CEO
and cash compensation, which shows the existence of active monitoring by block-holders and
institutional shareholders. Furthermore, I find that institutional share ownership has a positive
and significant impact on CEO pay-for -performance sensitivity of option grants, cash
compensation and total compensation. This finding provides empirical support for the stories
from the financ ial press about institutional investors’ influence on CEO compensation
packages.
31
References
Alderfer, C.P., 1986. The invisible director on corporate boards. Harvard Business Review 64, 38-52. Allen, M. , 1981. Power and privilege in the large corporation: corporate control and managerial compensation. American Journal of Sociology 86, 1112-1123. Arellano, M., and Bond, S. , 1991. Some tests of specification for panel data: Monte carlo evidence and an application to employment equations. Review of Economic Studies , 58 , 277-297. Arellano, M., and Bover, O., 1995. Another look at the instrumental variable estimation of error component models, Journal of Econometrics 68, 29-51. Bacon, J., Brown, J.K, 1973. Corporate Directorship Practices: Role, Selection and Legal Status of the Board. The Conference Board, NewYork. Bebchuk, L.A., Fried, J.M., 2003. Executive compensation as an agency problem. Journal of Economic Perspectives 17,71-92. Bethel, J.E., S.L. Gillan, 2002. The impact of the institutional and regulatory environment on shareholder voting. Financial Management, 31,4, 29-54. Bhagat, S., Black, B.S., 2002. The non-correlation between board independence and long-term firm performance. Journal of Corporation Law 27, 231-273. Bhide, A., 1994. Efficient markets, deficient governance: US securities regulations protect investors and enhance market liquidity, but do they alienate managers and shareholders? Harvard Business Review 72, 128-140. Black, B., 1992. Agents watching agents: The promise of institutional investor voice, UCLA Law Review 39, 811-893. Blundell, R., Bond, S., 1998. Initial conditions and moment restrictions in dynamic panel data models, Journal of Econometrics 87, 115-143. Boyd, J., B.K., 1994. Board control and CEO compensation. Strategic Management Journal 15, 335-344. Cadbury, A., 1992. Report of the committee on the financial aspects of corporate governance, Gee & Co, London. Cheung, Y., Stouraitis, A., and Wong, A.W.S, 2005. Ownership concentration and executive compensation in closely held firms: evidence from Hong Kong, Journal of Empirical Finance 12, 511-532. Cheung, W.K.A., Wei, K.C.J.,2006. Insider ownership and corporate performance: Evidence from the adjustment cost approach, Journal of Corporate Finance 12, 906-925.

32
Coffee, J., 1991. Liquidity versus control: The institutional investor as corporate monitor. Columbia Law Review 91, 1277-1368. Conyon, M.J., 1997. Corporate Governance and executive compensation. International Journal of Industrial Organization 15, 493-509. Conyon ,M.J., Murphy, K.J, 2000. The prince and the pauper? CEO pay in the United states and United Kingdom. Economic Journal 110, 640-671. Core, E.J., Holthausen, R.W., Larcker, D.F., 1999. Corporate governance, chief executive officer compensation, and firm performance. Journal of Financial Economics 51, 371-406. Cosh, A., Hughes, A.,1997. Executive remuneration, executive dismissal and institutional shareholdings. International Journal of Industrial Organisation 15, 469-492. Fama, E., Jensen, M., 1983. Seperation of ownership and control. Journal of Law and Economics 26, 310-325. Franks , J., Mayer, C., Renneboog , L.,2001. Who disciplines management in poorly performing companies? Journal of Financial Intermediation 10, 209-248. Georgen, M., Renneboog, L., 2001. Strong managers and passive institutional investors in the UK. In Barca, F., Becht, M. (Eds.), The control of Corporate Europe. Oxford University Press. Greenbury, S.R., 1995. Directors’ Remuneration. London:Gee&Co. Ltd. Gregg, P., Jewell, S., and Tonks, I., 2005. Executive Pay and Performance in the UK 1994 - 2002, working paper, XFi Centre for Finance and Investment. Hampel, S.R., 1998. Committee on Corporate Governance: Final Report. London: Gee&Co.Ltd. Hartzell , J.C, Starks, L.T., 2003. Institutional investors and executive compensation. Journal of Finance 58, issue 6, 2351-2374. Higgs Report, 2003. Review of the role and effectiveness of non-executive directors, London, GEE. Holderness, C.G., and Sheehan, D.P., 1988. The role of majority shareholders in publicly held corporations: An exploratory analysis. Journal of Financial Economics 20, 317-346. Jensen, M.C., Meckling, W.H., 1976. Theory of the firm: Managerial behaviour,agency costs and ownership structure. Journal of Financial Economics 3, 305-360. Jensen, M.C., 1993. The modern industrial revolution, exit, and the failure of internal control systems. Journal of Finance 48, 831-880. Jensen, M.C., Murphy, K., 1990. Performance pay and top-management incentives, Journal of Political Economy 98, 225-264.

33
Lambert, R., Larcker, D., Weigelt, K., 1993. The structure of organizational incentives. Administrative Science Quarterly 38, 438-461. Lipton, M. and J.W. Lorsch , 1992. A modest proposal for improved corporate governance. Business Lawyer 48, 59-77. Main, B.G.M. , Bruce, A., and Buck, T., 1996. Total board remuneration and company performance. Economic Journal, 106, 1627-1644. Mallin, C.A,1995. Voting and institutional investors. Accountancy16/1225 Maug, E.,1998. Large shareholders as monitors: Is there a trade-off between liquidity and control? Journal of Finance, 53, 65-98. Mehran, H.,1995. Executive compensation, ownership, and firm performance. Journal of Financial Economics 38, 163-184. Morck, R., 2004. Behavioral Finance in Corporate Governance - Independent Directors and Non-Executive Chairs. NBER Working Paper 10644. Morck, R., Shleifer, A. and Vishny, R.W., 1988. Management ownership and market valuation: An Empirical Analysis, Journal of Financial Economics 20, 293-315. ONS, 2004. Share ownership. A report on ownership of shares as at 31st December 2003. London: HMSO. Ozkan, N., 2006. Do corporate governance mechanisms influence CEO compensation? An empirical investigation of UK companies, Journal of Multinational Financial Management, forthcoming. Plender, J., 1997. A Stake in the Future: The Stakeholding Solution. Nicholas Brealey, London. Ryan, H.E., Wiggins, R.A., 2001.The influence of firm- and manager-specific characteristics on the structure of executive compensation. Journal of Corporate Finance 7, 101-123. Shleifer, A., Vishny, R., 1986, Large shareholders and corporate control. Journal of Political Economy 94, 461-488. Smith, C. W., Watts, L. R., 1992. The investment opportunity set and corporate financing, dividend, and compensation policies. Journal of Financial Economics. Stapledon, G.P., 1996. Institutional shareholders and corporate governance, Claredon Press: Oxford, UK. Stulz, R., 1988, Managerial control of voting rights: Financing policies and the market for corporate control". Journal of Financial Economics 20(1/2), 25-54. Weisbach, M.,1988. Outside directors and CEO turnover. Journal of Financial Economics 20,431-460.

34
Yermack, D., 1996. Higher market valuation of companies with a small board of directors. Journal Financial Economics 40, 185-211.

35
Table 1 (A).
Descriptive statistics of components of CEO compensation (in British pound values) for 373 firms and 2304 firm-year observations over the period from 1999 to 2005. Total compensation is classified as base salary, cash bonus, stock options and long-term incentive plans (LTIPs).
1999 2000 2001 2002 2003 2004 2005
Base Salary (£000’s)
Mean 256.739 284.163 302.268 318.674 328.625 347.775 371.348
Median 220 243.5 249.3 264.5 275.625 305.0 330.0
S.D. 150.569 183.547 183.94 190.515 182.418 181.483 193.974
Bonus (£000’s)
Mean 95.879 122.280 134.200 142.177 159.141 191.903 228.911
Median 47 58.0 49.0 63.784 80 107.460 136
S.D. 135.842 248.136 383.007 278.519 267.599 267.258 305.277
Stock option (£000’s)
Mean 92.909 196.104 281.029 98.628 318.986 55.477 38.031
Median 0 0 0 0 2.499 0 0
S.D. 592.184 1076.742 2188.103 908.598 4410.682 202.854 129.0803
LTIP (£000’s)
Mean 53.608 60.265 126.106 120.304 125.670 169.973 194.768
Median 0 0 0 0 0 0 0
S.D. 403.852 191.296 566.753 443.693 374.635 391.815 416.269
Total compensation (£000’s)
Mean 386.902 433.213 533.394 516.898 591.216 634.756 700.507
Median 298.0 311.5 313.913 346.0 383.5 430.0 492.0
S.D. 397.494 431.568 984.339 552.735 710.203 658.430 695.797

36
Table 1 (B)
Descriptive statistics for firm characteristics, ownership and board structure for 390 firms and 2304 firm-year observations over the period from 1999 to 2005.
1999 2000 2001 2002 2003 2004 2005
Institutional ownership (%)
Mean 24.806 25.095 25.117 29.222 30.914 33.392 36.478
Median 23.457 22.944 23.121 27.404 29.581 32.113 33.429
S.D. 17.034 17.057 17.447 17.677 18.871 18.556 19.251
4 largest institutional ownership (%)
Mean 21.261 21.625 21.596 24.405 25.651 27.264 29.432
Median 20.949 21.979 21.109 23.170 25.058 26.375 27.324
S.D. 12.882 13.187 13.750 13.150 13.940 13.814 14.881
Blockholder ownership (%)
Mean 20.221 21.370 21.660 23.793 25.399 26.914 28.588
Median 17.802 17.677 18.541 20.179 22.680 24.899 25.800
S.D. 15.865 17.054 17.305 17.707 18.823 18.533 19.863
No. of blockholders Mean 2.051 2.165 2.175 2.330 2.451 2.604 2.743
Median 2 2 2 2 2 2 3
S.D. 1.551 1.598 1.595 1.598 1.709 1.747 1.756
Executive ownership ( % )
Mean 6.538 6.078 6.685 5.633 5.116 4.501 4.184
Median 0.586 0.567 0.496 0.416 0.367 0.361 0.311
S.D. 12.805 12.430 16.063 12.415 11.680 10.857 10.661
Non-executive ownership(%)
Mean 2.134 2.349 2.318 2.109 2.001 1.704 1.643
Median 0.063 0.076 0.080 0.059 0.062 0.080 0.070
S.D. 5.983 6.471 7.420 6.957 6.330 6.221 5.428
Board size Mean 8.574 8.450 8.347 8.217 8.282 8.270 8.306
Median 8 8 8 8 8 8 8
S.D. 2.557 2.417 2.371 2.364 2.382 2.288 2.347
Proportion of non-
executive members (%)

37
Mean 0.491 0.504 0.515 0.524 0.546 0.560 0.571
Median
S.D.
0.500
0.136
0.5
0.129
0.500
0.126
0.500
0.134
0.556
0.126
0.571
0.21
0.571
0.123
Block-holder ownership is defined as percentage of total stock held by non-managerial and non-board members having 5% or
more equity in firm.

38
Table 1 (C): Descriptive statistics for firm cha racteristics for 390 firms and 2304 firm-year observations over the period 1999-2005.
Mean Median Max Min Std. Dev.
Market
capitalisation (£ millions)
Sales
(£ millions)
1823.93
1,407,819
253.6
330937.5
158,542.9
3.04x10⁷
1.34
22
7243.968
3,447,829
Stock return
16.1
8.3
495.6
-96.5
64.9
Tobin’s Q
CEO age
CEO tenure
1.768
51 6
1.424
52 4
11.910
74
40
0.114
31 1
1.180
6.67
5.46
Return denotes percentage stock return, Tobin’s Q is measured as the sum of book value of assets plus market value of common stock minus book value of common stock divided by book value of total assets, market capitalization is measured as share price times number of outstanding shares.

39
Table 2. Governance effects on CEO’s cash compensation level: Dependent variable = lnCasht GMM-system estimation
(1) (2) (3) (4)
lnCasht-1
0.361*** (5.96)
0.341*** (5.39)
0.365*** (5.72)
0.368***
(5.42)
lnSalest 0.071*** (3.68)
0.080*** (4.20)
0.072*** (3.81)
0.066*** (3.39)
Return t 0.077* (1.90)
0.070* (1.73)
0.077* (1.93)
0.065 (1.52)
Tobin’s Qt -0.0002 (-0.04)
0.0002 (0.04)
0.0001 (0.02)
-0.001 (-0.17)
Board size t-1
0.055*** (3.08)
0.056*** (2.96)
0.057*** (3.17)
0.061***
(3.29)
Proportion of non-executive directors t
0.458 (1.22)
0.581 (1.52)
0.572 (1.63)
0.375 (1.09)
Total institutional
ownership t
-0.005** (-2.73)
-
-
-
4 largest institutional
ownership t
-
-0.005** (-2.05)
-
-
Block holder ownership t
-
-
-0.004** (-2.08)
-
No of blockholders t
-
-
-
-0.052** (-2.20)
Executive directors’
ownership t
-0.006* (-1.86)
-0.006 (-1.46)
-0.005 (-1.38)
-0.007* (-1.98)
( Executive directors’ ownership t)2
0.000 (0.39)
0.000 (0.41)
0.000 (0.48)
0.000 (0.64)
Non-executive directors’ ownership
-0.023*** (-3.11)
-0.024*** (-3.09)
-0.020*** (-2.62)
-0.018*** (-2.29)
(Non-executive directors’ ownershipt)2
0.0003** (2.31)
0.0003** (2.31)
0.0003*** (2.00)
0.0002 (1.63)
M1 (p -value) 0.000 0.000 0.000 0.000 M2 (p -value) 0.328 0.351 0.301 0.254
Sargan (p-value) 0.645 0.472 0.468 0.425 Sargan-Difference (p-
value) 0.703 0.683 0.656 0.578
This table shows coefficients from the GMM-SYS regression of the CEO cash compensation level against the lagged cash compensation level, firm size (sales), firm performance (stock return), Tobin’s Q, board size, proportion of non-executive directors on the board, percentage of total institutional share ownership, percentage of 4 largest institutional share ownership, outside blockholders’ ownership, executive and non-executive directors’ share ownership. Tobin’s Q is measured as the sum of book value of assets plus market value of common stock minus book value of common stock

40
divided by book value of total assets. For the first difference equations, levels lagged at [t -2] are used as instruments. In the level equations, first differences dated [t-1] are used as instruments. The coefficient of intercept is not reported. Our sample consists 390 firms and 2304 firm-year observations over the period from 1999 to 2005. The GMM results are two-step estimates with heteroskedasticity-consistent errors, which are based on the finite sample adjustment of Windmeijer (2005). The Sargan statistic tests for over-identifying restrictions, and is asymptotically distributed as
2χ under the null hypothesis of valid instruments. The Sargan-difference test is used to test the additional moment conditions used by GMM-SYS estimator. The M1 and M2 statistics test the absence of first and second -order correlation in residuals. They are asymptotically distributed as N(0,1) under the null hypothesis of no serial correlation. T-statistics are provided in parenthesis. ***, ** and * indicate coefficient is significant at the 1, 5 and 10 percent level, respectively. All equations include time dummies.

41
Table 3. Governance effects on CEO’s total compensation level: Dependent variable = lnTotalt GMM-system estimation
(1)
(2)
(3)
(4)
lnTotalt-1
0.352*** (5.31)
0.343*** (5.29)
0.325*** (4.70)
0.311***
(4.39)
lnSalest
0.104*** (4.48)
0.108*** (4.78)
0.108*** (4.85)
0.104***
(4.65) Return t 0.080
(1.31) 0.069 (1.19)
0.083 (1.40)
0.067 (1.07)
Tobin’s Qt 0.027 (1.08)
0.026 (1.04)
0.030 (1.13)
0.028 (1.21)
Board size t-1
0.070*** (2.93)
0.065*** (2.71)
0.077*** (3.22)
0.089***
(3.51) Proportion of
non-executive directors t
0.845* (1.94)
0.881** (2.02)
0.959** (2.09)
1.041** (2.14)
Total institutional
ownership t
-0.006** (-2.31)
-
-
-
4 largest institutional
ownership t
-
-0.007** (-2.08)
-
-
Block holder ownership t
-
-
-0.004* (-1.64)
-
No of blockholders t
-
-
-
-0.060** (-2.10)
Executive directors’
ownership t
-0.007* (-1.65)
-0.005 (-1.25)
-0.005 (-1.08)
-0.007 (-1.56)
(Executive directors’ ownership t)2
0.000 (0.27)
0.000 (0.03)
-0.000 (-0.05)
0.000 (0.30)
Non-executive directors’ ownershipt
-0.024* (-1.81)
-0.023* (-1.64)
-0.018 (-1.46)
-0.016 (-1.55)
(Non-executive directors’ ownershipt)2
0.0003 (1.49)
0.0003 (1.35)
0.0003 (1.13)
0.000 (1.01)
M1 0.000 0.000 0.000 0.000 M2 0.653 0.662 0.646 0.663
Sargan 0.666 0.784 0.711 0.573 Sargan-difference 0.844 0.923 0.809 0.502
This table shows coefficients from the GMM-SYS regression of the CEO total compensation level against the lagged total compensation level, firm size (sales), firm performance (stock return), Tobin’s Q, board size, proportion of non-executive directors on the board, percentage of total institutional share ownership, percentage of 4 largest institutional share ownership, outside blockholders’ ownership, executive and non-executive directors’ share ownership. Tobin’s Q is measured as the sum of book value of assets plus market value of common stock minus book value of common stock

42
divided by book value of total assets. For the first difference equations, levels lagged at [t -2] are used as instruments. In the level equations, first differences dated [t-1] are used as instruments. The coefficient of intercept is not reported. Our sample consists 390 firms and 2304 firm-year observations over the period from 1999 to 2005. The GMM results are two-step estimates with heteroskedasticity-consistent errors, which are based on the finite sample adjustment of Windmeijer (2005). The Sargan statistic tests for over-identifying restrictions, and is asymptotically distributed as
2χ under the null hypothesis of valid instruments. The Sargan-difference test is used to test the additional moment conditions used by GMM-SYS estimator. The M1 and M2 statistics test the absence of first and second -order correlation in residuals. They are asymptotically distributed as N(0,1) under the null hypothesis of no serial correlation. T-statistics are provided in parenthesis. ***, ** and * indicate coefficient is significant at the 1, 5 and 10 percent level, respectively. All equations include time dummies.

43
Table 4. Tobit analysis: Governance effects on CEO pay-performance sensitivity of option grants Dependent Variable: Change in the value of options granted a manager per £1 change in shareholder wealth
Independent variables
(1) (2) (3) (4)
? (Shareholder wealtht )
0.005
(0.16)
0.004 (0.14)
0.006 (0.19)
0.005 (0.15)
? (Shareholder
wealtht-1)
0.008 (0.27)
0.007 (0.25)
0.009 (0.32)
0.008 (0.29)
Tobin’s Qt-1
Market capitalisationt-1
0.050** (2.07)
0.006 (0.49)
0.048** (1.99)
0.006 (0.45
0.049** (2.07)
0.007 (0.61)
0.050** (2.09)
0.006 (0.56)
Board size t-1
-0.137*** (-3.99)
-0.131*** (-3.82)
-0.127*** (-3.73)
-0.136*** (-4.03)
Proportion of non-executive directors t-1
-0.840 (-1.43)
-0.941 (-1.61)
-1.089* (-1.87)
-0.824 (-1.41)
Total institutional
ownership t-1
0.013*** (3.16)
-
-
-
4 largest
institutional ownership t-1
-
0.020*** (3.56)
-
-
Block holder ownership t-1
-
-
0.019*** (4.77)
-
No of
blockholders t-1
-
-
-
0.191*** (4.33)
CEO age CEO tenure Directors’ ownership t-1
-0.0001 (-0.01)
-0.031** (-2.27)
0.008 (1.24)
0.0001 (0.01)
-0.031** (-2.21)
0.008 (1.25)
-0.001 (-0.04)
-0.030** (-2.17)
0.005 (0.71)
-0.001 (-0.05)
-0.031** (-2.20)
0.006 (0.96)
This table shows coefficients from the Tobit regression of the CEO compensation against the change and lagged change in shareholder’s wealth, firm size (market capitalization), Tobin’s Q, board size, proportion of non-executive directors on the board, percentage of total institutional share ownership, percentage of 4 largest institutional share ownership, outside blockholders’ ownership. Tobin’s Q is measured as the sum of book value of assets plus market value of common stock minus book value of common stock divided by book value of total assets. The coefficient of intercept is not reported. Our sample consists 390 firms and 2304 firm-year observations over the period from 1999 to 2005. T-statistics are provided in parenthesis. ***, ** and * indicate coefficient is significant at the 1, 5 and 10 percent level, respectively. All equations include time and industry dummies.
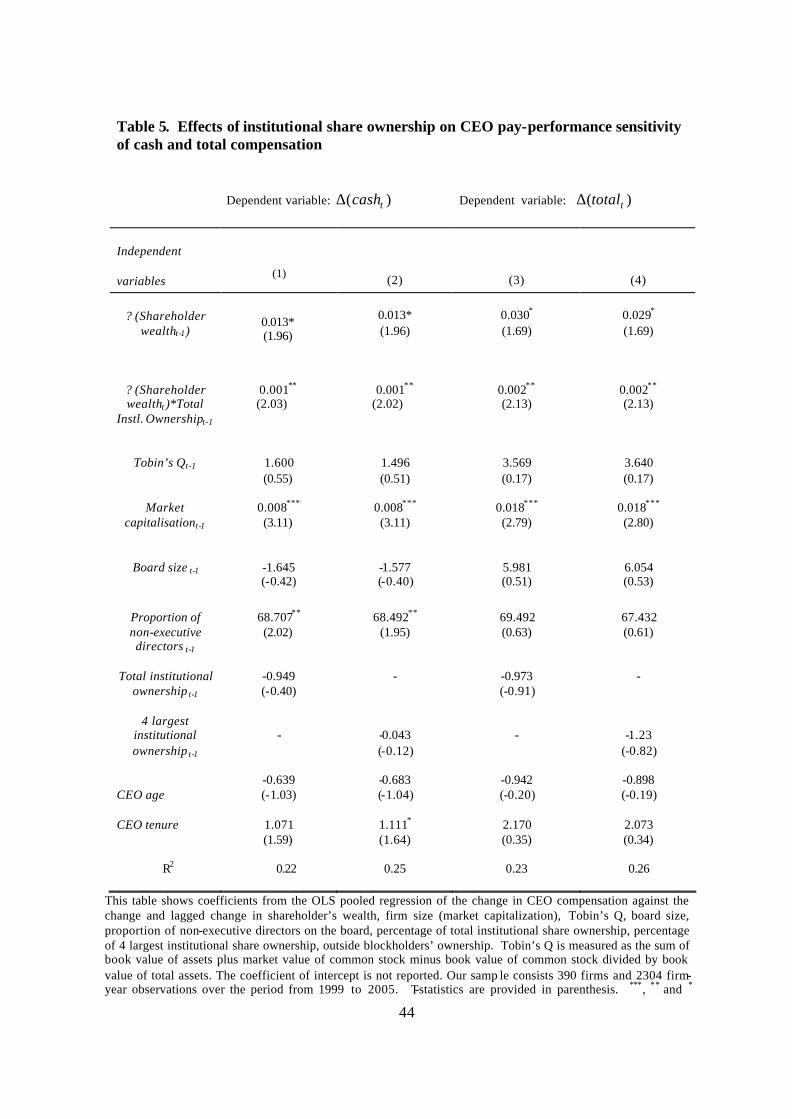
44
Table 5. Effects of institutional share ownership on CEO pay-performance sensitivity of cash and total compensation Dependent variable: )( tcash∆ Dependent variable: )( ttotal∆
Independent
variables
(1)
(2)
(3)
(4)
? (Shareholder wealtht-1)
0.013* (1.96)
0.013* (1.96)
0.030* (1.69)
0.029* (1.69)
? (Shareholder wealtht )*Total
Instl. Ownershipt-1
0.001** (2.03)
0.001**
(2.02)
0.002** (2.13)
0.002** (2.13)
Tobin’s Qt-1
Market capitalisationt-1
1.600 (0.55)
0.008*** (3.11)
1.496 (0.51)
0.008*** (3.11)
3.569 (0.17)
0.018*** (2.79)
3.640 (0.17)
0.018*** (2.80)
Board size t-1
-1.645 (-0.42)
-1.577 (-0.40)
5.981 (0.51)
6.054 (0.53)
Proportion of non-executive directors t-1
68.707** (2.02)
68.492**
(1.95)
69.492 (0.63)
67.432 (0.61)
Total institutional
ownership t-1
-0.949 (-0.40)
-
-0.973 (-0.91)
-
4 largest
institutional ownership t-1
-
-0.043 (-0.12)
-
-1.23 (-0.82)
CEO age
-0.639 (-1.03)
-0.683 (-1.04)
-0.942 (-0.20)
-0.898 (-0.19)
CEO tenure
1.071 (1.59)
1.111* (1.64)
2.170 (0.35)
2.073 (0.34)
R2
0.22
0.25
0.23
0.26
This table shows coefficients from the OLS pooled regression of the change in CEO compensation against the change and lagged change in shareholder’s wealth, firm size (market capitalization), Tobin’s Q, board size, proportion of non-executive directors on the board, percentage of total institutional share ownership, percentage of 4 largest institutional share ownership, outside blockholders’ ownership. Tobin’s Q is measured as the sum of book value of assets plus market value of common stock minus book value of common stock divided by book value of total assets. The coefficient of intercept is not reported. Our samp le consists 390 firms and 2304 firm-year observations over the period from 1999 to 2005. T-statistics are provided in parenthesis. ***, ** and *

45
indicate coefficient is significant at the 1, 5 and 10 percent level, respectively. All equations include time and industry dummies. The standard errors of the coefficients in columns 1 through 5 are corrected for serial correlation on a firm level and for heteroskedasticity using the Huber-White-Sandwich estimator.