CEO Compensation and the Seasoned Equity …jfbrazel/MyResearch/SEOpaper.pdfCEO Compensation and the...
30
CEO Compensation and the Seasoned Equity Offering Decision Joseph F. Brazel Department of Accounting College of Management North Carolina State University Raleigh, NC 27695 919-513-1772 [email protected] Elizabeth Webb* School of Business Administration University of San Diego San Diego, CA 92110 619-260-7673 [email protected] Current draft: March 2004 *Contact author. Part of the work for this paper was done while the authors were at Drexel University. We would like to thank Shreesh Deshpande, Don Pagach, Andrew Saporoschenko and participants at the 2003 Financial Management Association meeting for helpful comments and suggestions. We retain responsibility for any errors.
Transcript of CEO Compensation and the Seasoned Equity …jfbrazel/MyResearch/SEOpaper.pdfCEO Compensation and the...
CEO Compensation and the Seasoned Equity Offering Decision
Joseph F. Brazel Department of Accounting
College of Management North Carolina State University
Raleigh, NC 27695 919-513-1772
Elizabeth Webb* School of Business Administration
University of San Diego San Diego, CA 92110
619-260-7673 [email protected]
Current draft: March 2004
*Contact author. Part of the work for this paper was done while the authors were at Drexel University. We would like to thank Shreesh Deshpande, Don Pagach, Andrew Saporoschenko and participants at the 2003 Financial Management Association meeting for helpful comments and suggestions. We retain responsibility for any errors.
CEO Compensation and the Seasoned Equity Offering Decision
Abstract Empirical research on seasoned equity offerings indicates that the decision to announce
an SEO typically engenders a decline in firm value, as investors interpret this decision as
a signal of poor financial health or that the stock is overpriced. We analyze the short-
term market reaction to SEO announcements and the executives’ link to firm value (i.e.,
the proportion of CEO equity-based compensation). Results support the hypothesis that
investors interpret the announcement of an SEO as a last resort form of raising capital
when the proportion of CEO equity-based compensation is high. We also find this
relationship to be stronger when information asymmetries between management and
investors are larger. Thus, managers should consider the ramifications of executive
compensation structure when considering an SEO.
Keywords: Equity-Based Compensation; Seasoned Equity Offering; Signaling

1. Introduction In the wake of Wall Street scandals involving managerial misrepresentation of
financial statements and investment opportunities, a signal from firm insiders that may
indicate financial distress is valued in the marketplace. In this paper, we test the
hypothesis that the market’s reaction to the announcement of seasoned equity offerings is
more pronounced for firms where the CEO is paid with more equity-based compensation
(versus cash-based compensation) since this may signal that the firm is using an equity
issuance as a “last resort” form of raising capital. In addition, we investigate whether
increased levels of information asymmetry between management and shareholders
augments this relationship.
The notion of managerial signaling starts with the assumption that information
regarding firm earnings and investment opportunities is asymmetrically distributed
between managers and investors. Miller and Rock (1985) and Myers and Majluf (1984)
explain how a firm’s decisions, specifically the decision to issue securities, can convey
information to the market. In this way, managers signal positive or negative information
to investors who otherwise would not have this inside knowledge.
A signal is only credible if it is costly, so a signal with negative information
content carries more credibility than one with positive information.1 Mikkelson and
Partch (1986) show that seasoned equity offerings (SEOs) convey unfavorable
information to investors since, they suggest, managers issue common stock when shares
1 Miller and Rock (1985) propose that the information content in dividend reductions and omissions is stronger than that of a dividend increase since the former signals unfavorable information to investors and managers would reduce or omit dividends only by force, not by choice. In addition, studies from behavioral finance research, starting with Tversky and Kahneman (1986), show that investors’ response to losses is more extreme than the response to gains. This effect is called loss aversion, and can explain why investors react more strongly to negative information (“bad news”) signaled by managers as opposed to positive information (“good news”).
2
are overvalued, and the observed negative market reaction of an SEO announcement is
consistent with their hypothesis. Investors may infer from the SEO announcement that
the stock is overpriced to a larger degree when the chief executive officer’s wealth is tied
to that of the firm. Datta, Datta, and Raman (2004) develop a model based on the work
by Myers and Majluf (1984) that shows that managers with more stock options should
issue equity when the difference between the offer price and the intrinsic stock value is
larger since this benefits existing shareholders.
The decrease in stock value after an SEO announcement is well-documented in
the literature.2 Here, we examine whether the percent of a CEO’s equity-based
compensation influences the market reaction to the SEO announcement signal. Since
equity-based compensation increases the alignment of management with current
shareholders, CEOs will issue overvalued equity as this practice benefits existing
shareholders at the expense of new shareholders. Having high proportions of equity-
based compensation may also encourage CEOs to use SEOs only as a last-resort form of
raising capital since the event is associated with a decline in stock value and, in turn,
CEO personal wealth. Thus, when CEO compensation is more tied to firm value, the
negative SEO signal to the market may be stronger and therefore result in a more adverse
market reaction. This paper documents a negative relation between the proportion CEO
equity-based compensation and the change in shareholder wealth after an SEO
announcement. Firms that pay their CEOs with more equity-based compensation
generally have a more pronounced negative price reaction to a seasoned equity offering
announcement than firms paying more cash-based compensation to their CEOs. Further,
2 See, for instance, Mikkelson and Partch (1986), Asquith and Mullins (1986), and Eberhart and Siddique (2002).
3
this relationship is greater for firms with higher levels of information asymmetry between
managers and outside investors, where investors’ sensitivity to management signaling is
expected to be higher. We use CEO compensation structure due to the tremendous
market scrutiny of CEO equity-based compensation packages (Wall Street Journal 2004),
and include all forms of equity-based compensation in this paper, thus expanding on
Datta, Datta, and Raman’s (2004) results.
The remainder of the paper is organized as follows. Section 2 discusses several
hypotheses concerning the relationship between equity-based compensation and SEO
announcement effects. Section 3 summarizes the data and methodology. Section 4
describes the test results. Section 5 concludes.
2. Hypotheses
2.1 Seasoned equity offering announcements
Mikkelson and Partch (1986) find that the announcement of a seasoned equity
offering of common stock leads to a 3.56 – 4.46% decline in firm value.3 This negative
reaction is stronger than that of their documented debt and preferred stock offerings
announcement reactions combined.
There are several interpretations of this negative reaction following equity
offering announcements. Myers and Majluf (1984) propose that equity issues signal “bad
news” to the market. Shareholders infer that managers will only issue additional shares
of stock when the firm is overvalued; that is, when the market price per share exceeds the
managers’ assessment of the stock price. In this way, a seasoned equity offering can be
3 This result is in agreement with other empirical work documenting a negative stock price reaction on announcement of equity issuance including Harris and Raviv (1990), Stulz (1990), Noe (1988), Lucas and McDonald (1990), and Loughran and Ritter (1995).
4
viewed as an application of Akerlof’s (1970) lemons problem. Consistent with this
theory, Clark, Dunbar, and Kahle (2001) study insider trading activity around SEO issues
and find that insiders issue overvalued equity and thus exploit windows of opportunity.
Myers and Majluf (1984) further suggest a pecking order theory for capital structure
whereby firms prefer retained earnings as their main source of funds. When this option is
no longer available, the next preference is debt, and as a last resort, firms use external
equity financing. If CEOs have close personal ties to firm value, it may be more likely
that the issue of a seasoned equity offering is a “last resort” since the decline in share
price following the announcement reduces the CEO’s personal compensation.
Several authors find that the market reaction to SEO announcements and
managerial signaling can be influenced by various factors. For instance, Brennan and
Kraus (1987) document that the firm’s stated purpose for the equity issuance influences
the market reaction to the announcement. Also, Krasker (1986) develops a model which
demonstrates how the number of shares issued is inversely related to the stock price
reaction to the SEO announcement. In this paper, we analyze whether CEO
compensation structure influences the market reaction to an equity issuance. According to
Datta, Datta, and Raman (2004), managerial stock options are associated with a sharper
decline in shareholder wealth following an SEO announcement since the market infers
that the stock is overvalued when equity is issued by managers who are aligned with
current shareholder interests. Here, we test whether investor perceptions of SEO
announcements as a “last resort” form of raising capital (through the issuance of
overvalued equity) increase as overall CEO equity-based compensation increases. In the
5
next section, we analyze literature on equity-based compensation as a measure of the link
between CEO personal wealth and firm performance.
2.2 Compensation structure
Equity-based compensation has traditionally been used to align interests between
managers and shareholders. As a form of monitoring, equity-based compensation
theoretically mitigates the agency problem. Executives are able to maximize personal
welfare while at the same time work toward maximizing firm value, which is in the best
interest of the shareholders. Traditionally, equity-based compensation consists of non-
cash sources of compensation including stock options, restricted stock grants, and long-
term incentive plans.
Core, Guay, and Larker (2002) show that equity-based compensation works to
motivate executives to maximize firm value, largely contributing to the mitigation of
agency costs. Using a combination of monitoring and incentive contracts, Hall and
Liebman (1998) argue that this compensation structure can effectively align interests
between executives and shareholders. In addition, they show that the growth in stock
options and other sources of equity-based CEO compensation have increased
dramatically in the 1980s and 1990s. About 70% of CEOs in 1994 were paid with stock
options in addition to traditional cash-based compensation, up from 30% in 1980.
Shleifer and Vishny (1988) contend that equity-based compensation should reduce the
instance of managers engaging in “non-value-maximizing behavior” since manager’s
personal wealth is tied to that of the firm. Guay (1999) and Smith and Stulz (1985)
suggest that equity-based compensation increases the relationship between executives’
6
wealth and firm performance, thus providing more incentives for the executives to work
to maximize shareholder wealth. In addition, Guay (1999) finds that executives with
incentive contracting in their compensation structure will be more likely to engage in
risky projects that will increase firm performance.
Previous studies have linked executive compensation structure to various
corporate decisions. Datta, Datta, and Raman (2001) look at merger and acquisition
decisions and the relationship with equity-based compensation. They find a positive
relationship between acquiring managers’ proportion of equity-based compensation and
stock price performance around the acquisition announcement. This may indicate that
shareholders perceive this to be a positive NPV investment since CEO personal welfare is
tied to that of firm performance. Mehran, Nogler, and Schwartz (1998) suggest that
executives with incentive-based compensation are more likely to engage in voluntary
liquidation that enhances shareholder value. In addition, Tehranian, Travlos, and
Waegelein (1987) find that in the case of divestitures, investors react more positively for
firms that have executive equity-based compensation than for firms that do not have such
performance-based pay. The commonality in these studies is that investors appear to
factor in executive compensation packages, especially more widely-known CEO
compensation structures, when interpreting management signals.4
Prior studies have shown that shareholder wealth declines following the
announcement of a SEO (see, for instance, Eberhart and Siddique (2002) who find
negative long-term abnormal stock returns following SEOs). This is generally attributed
to asymmetric information and management signals. If investors react negatively to this
4 See the Wall Street Journal November 14, 2003 for a recent discussion of management concerns over investor reactions to executive compensation policies.
7
event, managers with equity stakes in the firm should discourage SEOs since their
personal wealth is tied to the welfare of the firm. Mehran, Nogler, and Schwartz (1998)
find that these executives are more inclined to engage in higher levels of risk-taking
behavior in order to invest in positive net present value projects to enhance firm value.
Since CEOs are closely aligned to existing shareholders when they receive equity-based
pay (including long-term incentive plans, restricted stock options, and other equity-based
compensation in addition to stock options), they may only issue equity in the secondary
market as a last resort and when the stock is overvalued. Shareholders would then
interpret such an SEO announcement as a negative signal that the firm may be in
financial distress since the CEO is forced to raise capital though secondary markets at the
risk of his or her own personal wealth. Thus, the resulting decline in share price
following an SEO should be greater when the proportion CEO equity-based
compensation is higher.
If higher proportions of CEO equity-based compensation augment the negative
SEO signal, this phenomenon should be more pronounced in firms with more agency
problems. Smith and Watts (1992) report that firms with more agency problems have
large differences in terms of management and shareholder information, and consequently,
more information asymmetries. Under conditions of high information asymmetry any
information from firm insiders is at a premium. Therefore, in firms with high
information asymmetry environments, we expect to see a significant difference between
the market reactions to SEOs from firms that pay their CEOs with high amounts of
equity-based compensation, compared to firms where CEO equity-based compensation is
low. On the other hand, under conditions of low information asymmetry, information is
8
more plentiful to investors and thus they should be less sensitive to the “last resort” signal
from insiders. We postulate that the difference in market reactions for the two high and
low equity compensation groups to be negligible under low information asymmetry.
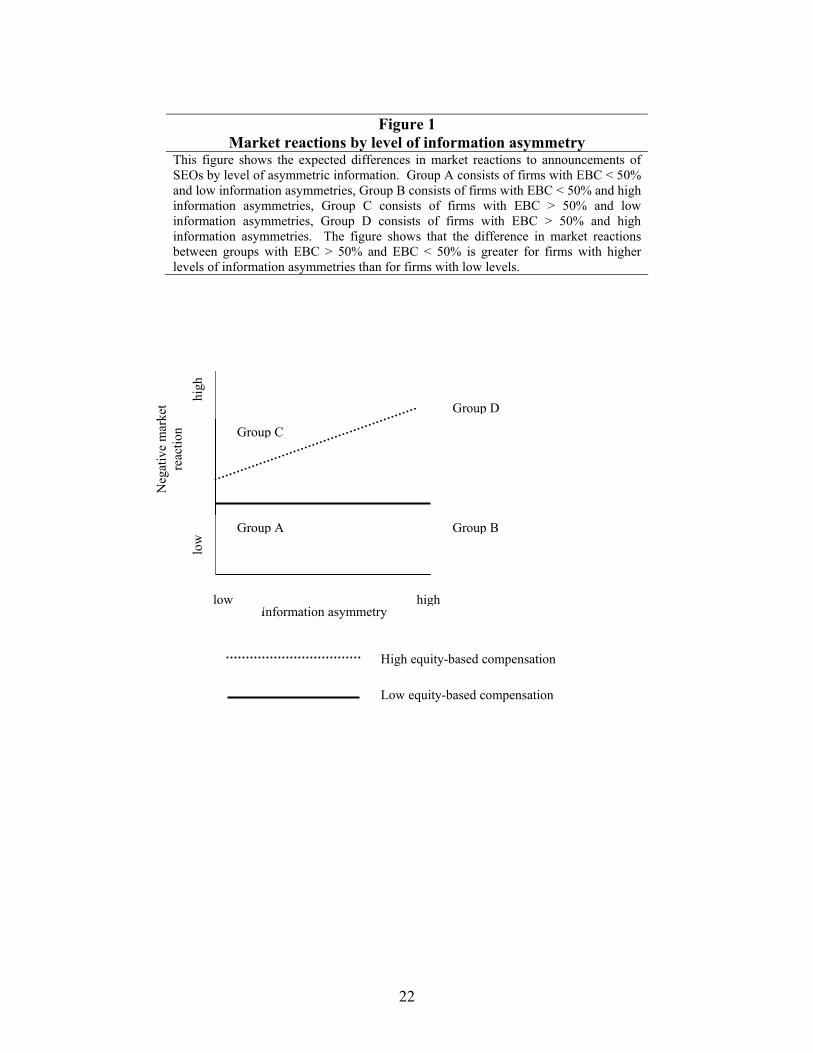
Figure 1 presents a graphical illustration of our expectations of market reactions to SEOs
under high and low information asymmetry environments. The next section describes the
methodology used to test these hypotheses.
3. Data and Methodology
To test the hypothesis that investors react more strongly to an SEO announcement
when the CEO’s compensation package is comprised of larger proportions of equity-
based compensation, we use a standard event study methodology, followed by a cross
sectional regression of the abnormal returns. The data consists of all SEO
announcements made between 1993 and 2000 from the SDC Platinum database. CEO
compensation data is obtained from Standard & Poor’s ExecuComp database. The
ExecuComp database includes detailed compensation information on the top executives
for firms in the S&P 500, the S&P Midcap 400, and the S&P Smallcap 600. Those firms
that announced a seasoned equity offering during the period and that are listed in the
ExecuComp database are included in the sample. The final sample consists of 221 firms.
Firm characteristics and returns are obtained from the CompuStat and CRSP databases,
respectively. Table 1 displays the sample size per year. The average number of SEOs
announced per year in the sample is 27.6.
We use the following variables from ExecuComp: CEO salary, bonus, other
annual compensation, restricted stock grants, stock options, long-term incentive plans,
9
and other compensation types. Salary consists of the dollar value of the base salary,
while bonus is the dollar value of the bonus earned by the CEO during the fiscal year.
Other annual compensation includes annual compensation that is not categorized as
salary or bonus. It includes items such as perquisites and other personal benefits, above-
market earnings on restricted stock and options, tax reimbursements, and the dollar value
difference between the price paid by the CEO for company stock and the actual market
price of the stock under a stock purchase plan that is not generally available to
shareholders or employees of the company. Restricted stock grants represent the value of
restricted stock granted during the year, whose resale is barred for about three to five
years. If the employee terminates his or her employment before the stock vests, they
forfeit the reward. Stock options are valued using the Black-Scholes model and represent
the total value of all options received during the year. Long term incentive plans
represent the amount paid out to the CEO under the company's long-term incentive plan,
which measures company stock performance over a period of more than one year
(generally three years). All other compensation includes the following: severance
payments, debt forgiveness, payment for unused vacation, signing bonuses, 401K
contributions and life insurance premiums.
The sample is divided into two groups classified by the proportion of CEO equity-
based compensation. Rather than focusing on one specific equity-based compensation
item, we use a broader measure of equity-based compensation than previous studies. For
the purposes of this paper, equity-based compensation is the sum of restricted stock
grants, stock options, long-term incentive plans, and other compensation. The proportion
of equity-based compensation is calculated by the total equity-based compensation
10
divided by total compensation (which includes salary and bonus), consistent with Hall
and Liebman (1998). The two samples consist of firms where the CEO is compensated
with less than 50% equity-based compensation (EBC) and those firms where the CEO is
compensated with more than 50% EBC. Summary statistics for both samples are listed in
Table 2. As expected, there is a significant difference between the two samples in terms
of compensation structure, yet there is no difference in firm characteristics between the
two samples. We also divide the sample into quartiles for analysis in multivariate
regressions. Quartiles are based on CEOs’ percentages of equity-based compensation
where Quartile 1 represents the lowest EBC proportion and Quartile 4 the highest.
A standard event study is employed using the methodology as described in Brown
and Warner (1985). The event date is the filing date listed in SDC Platinum. The market
model is estimated by ordinary least squares, using data from a 255 trading-day
estimation period ending 46 trading days before the event date. The event period is
defined as 30 days before through 30 days after the event date.
Tests for market reactions around SEO announcements are done for the full
sample, the sample with less than 50% EBC, and the sample with greater than 50% EBC.
Differences between the reactions are tested so as to analyze the relationship between
SEO market reactions and equity-based compensation.
We use multiple regression to assess determinants of the abnormal returns found
in the event studies. The dependent variable in each regression is the abnormal return on
the event date generated from the full sample event study. Four models are calculated
using both quartiles and proportion of equity-based compensation.
11
Tsui, Jaggi, and Gul (2001) find that agency problems and information
asymmetries are more inherent in high growth firms. Likewise, McConnell and Servaes
(1995) find that firms with greater proximity for growth are more difficult to monitor and
governance mechanisms, such as incentive based compensation plans, should play a more
significant role in firms with higher growth opportunities. To test this, we calculate the
level of growth opportunities/information asymmetry using Goyal, Lehn, and Racic’s
(2002) proxy where growth equals capital expenditures divided by total assets. We
calculate the median growth opportunity value and separate the sample into high (above
the median) and low (below the median) growth firms. Next we divide the sample into
four groups: EBC < 50% and low growth (Group A), EBC < 50% and high growth
(Group B), EBC > 50% and low growth (Group C), and EBC > 50% and high growth
(Group D). Figure 1 presents for a graphical illustration of our expectations of market
reactions to SEOs for these four groups. We repeat the event study analysis for these four
groups using the market model and a 255 trading-day estimation period ending 46 trading
days before the event date and test the difference in cumulative abnormal returns between
each group. We also test this hypothesis using the following planned contrast model:
(mean CAR Group D – mean CAR Group B) – (mean CAR Group C – mean CAR group
A) < 0. We test this for three different event windows.
4. Results
Table 3 reports the market reaction to announcements of SEOs for the full sample,
and the samples split by equity-based compensation proportion.5 Consistent with prior
5 We also divide the sample into quartiles based on the percentage of equity-based compensation and repeat the event study calculations. Results are similar to the split samples; higher equity-based compensation is
12
literature, the reaction to an SEO on announcement day is significantly negative (0.92%
decrease in shareholder wealth) for the full sample. A negative reaction is also reported
for the day prior and post- announcement (-0.20% and -0.63%, respectively).
The magnitude of the reaction changes when the sample is divided between firms
where the executive is compensated with less than 50% equity-based pay and more than
50% equity-based pay. In all groups, the negative market response is significant on the
day of the SEO announcement and the following day. On the day prior to the
announcement (day -1), the reaction is significantly negative for the EBC > 50% sample,
yet not for the EBC < 50% sample. Also, a more pronounced negative effect takes place
in the EBC > 50% sample than the EBC < 50% sample on the announcement date (-
0.97% compared to -0.87%, respectively). The difference for the day before the
announcement is statistically significant at the 5% level between the two groups.
EW – changing table 4 and we need to change the wording in the paragraph below
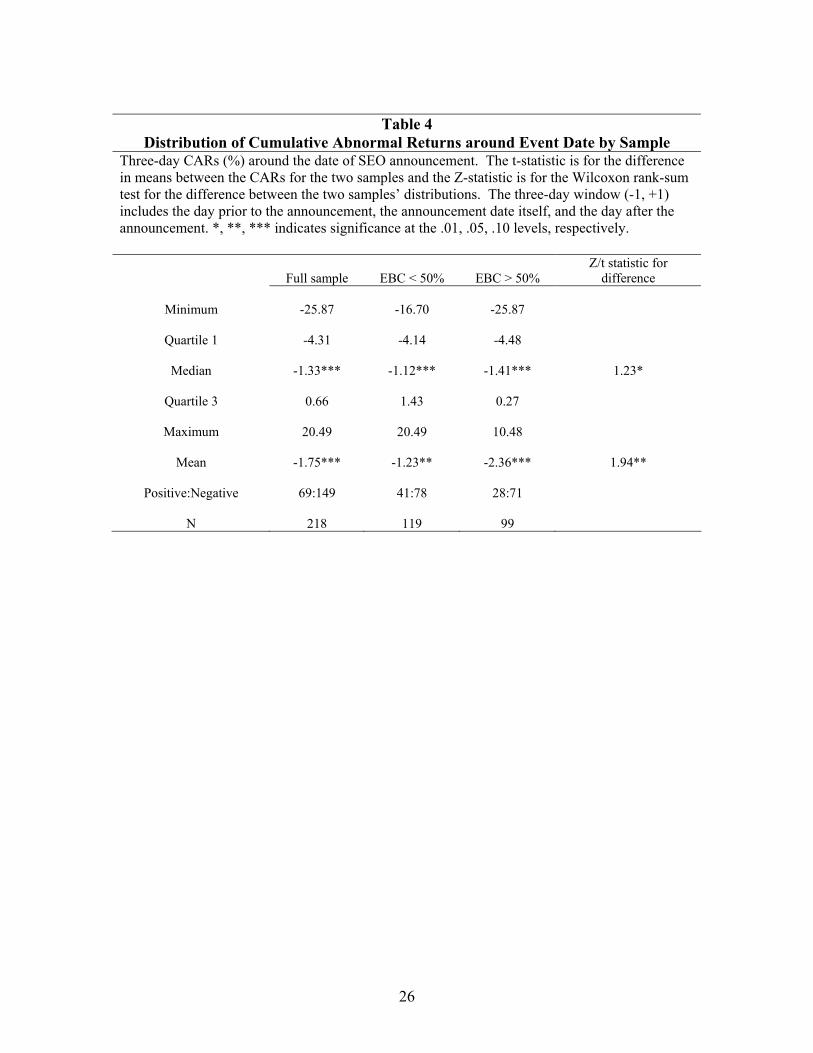
Table 4 compares the cumulative abnormal returns for the days surrounding the
event date for both the EBC > 50% and EBC < 50% sample. While in the expected
direction, there are no statistically significant differences between the market reactions
for the two samples when looking at the day prior to the announcement plus the
announcement date, the announcement date itself, and the announcement date plus the
date following the announcement. Yet when the cumulative abnormal returns for the
three days (-1, 1) around the event date are compared, there is a statistically significant
difference between the two samples. The EBC > 50% sample experiences a 2.6% decline
in firm value during these days around the announcement of an SEO while the EBC <
associated with larger drops in shareholder wealth on the date of the SEO announcement. Since the sample sizes for the quartile samples are relatively small, we report only the split sample results here.

13
50% sample experiences a 1.2% decrease. These returns are significantly different at the
5% level (t-statistic is 2.09). 6 The results so far suggest that shareholders react more
adversely to SEO announcements when CEO compensation is linked to firm
performance. The reaction here is of lesser significance than in Datta et al. (2004), where
the only the value of new stock options granted to the top five executive officers was
used as a surrogate for equity-based compensation. This suggests that shareholders may
value the option proportion of total compensation for the top five executives to a greater
extent than the overall equity-based compensation proportion of the CEO.
Next, we examine the strength of this relationship in a multivariate setting. We
analyze the determinants of the abnormal returns of the full sample on the date of the
SEO announcement using two measures of equity-based compensation as independent
variables. We use the percentage of equity-based compensation in the smallest and
largest quartiles (Q1 and Q4) and the EBC > 50% and EBC < 50% samples. Ordinary
least squares methodology is used to calculate coefficient estimates for four model
specifications.
Friday, Howton, and Howton (2000) and Denis and Sarin (2001) use the number
of shares issued in the SEO as a percentage of shares outstanding to proxy for the size of
the offer. We collect the number of shares issued from SDC Platinum and divide that by
the number of shares of common stock outstanding before the SEO. In addition, we
include the natural logarithm of total sales and firm leverage as control variables, since
6 We also calculate the long-run performance of firms issuing SEOs following Barber and Lyon’s (1999) methodology. We calculate holding period abnormal returns with the CRSP equally-weighted index as the benchmark portfolio. We find that for the three-year holding period, SEO firms with EBC > 50% significantly underperformed firms with EBC < 50% (both underperformed the benchmark portfolio). However, Mitchell and Stafford (2000) and Jegadeesh (2000) caution that results for long-run event studies for seasoned equity offerings can be erroneous and interpretations may be misleading.
14
Denis and Sarin (2001) suggest that these variables may affect the market’s reaction to
SEO announcements. We also include a dummy variable for the year that the SEO
announcement took place and a dummy variable indicating the reason for the seasoned
equity offering. Brennan and Kraus (1987) state that the reported reason for the SEO
issuance may influence market reaction. Therefore, we compile reasons for the SEO
from Lexis Nexis Academic Universe and divide them into five groups, which include the
following: reduce bank debt (10.4%), general corporate purposes (9.1%), investments or
expansion projects (15.8%), not for corporate purposes (14.9%), and no reason
given/other reason given (47.9%).
Table 5 reports the results of the multivariate regressions. Quartiles 1 and 4
(dummy variables equal 1 and 4 for the smallest and largest equity-based compensation
proportions, respectively, multiplied by the proportion of EBC) are used as independent
variables in Models 2 and 4, while the proportion of equity-based compensation is used
in Models 1 and 3. Control variables in Models 1 and 2 include the shares issued as a
percent of shares outstanding, sales, and leverage. Models 3 and 4 add the issue year
dummy and reason for issue dummy as control variables. In each specification using the
quartile dummies (Models 2 and 4), the firms granting CEOs large portions of equity-
based compensation (Quartile 4 firms) have a significantly negative relation with
abnormal returns on the date of SEO announcements (p-values of 0.07, 0.09 for Models 2
and 4, respectively). Further, Quartile 1 percentages of equity-based compensation are
not significantly related to abnormal returns. This result supports the hypothesis that the
proportion of equity-based compensation is negatively related to changes in shareholder
15
wealth following an SEO announcement. The result is not significant, however, using the
proportion of equity-based compensation as in Models 1 and 3.
In environments of greater information asymmetry, this result may be more
pronounced. Firms with greater proximity for growth are more difficult to monitor and
governance mechanisms, such as incentive based compensation plans, should play a more
significant role in firms with higher growth opportunities. Tsui, Jaggi, and Gul (2001)
find that high growth firms have more information asymmetries and agency problems due
to the existence of discretionary investments and measurement problems associated with
future assets. We expect that the negative relationship between equity-based
compensation and market reactions to SEOs documented above will be strengthened in
high information asymmetry environments. Under conditions of high information
asymmetry, investors may be more sensitive to a signal because inside information is at a
premium. Conversely, if information asymmetries are low, investors may not be
influenced to a large extent by the CEO’s equity-based compensation proportion since
more information is already imbedded in share price.
To test this, we calculate the level of growth opportunities using Goyal, Lehn, and
Racic’s (2002) proxy where growth equals capital expenditures divided by total assets.
With our sample now divided into four groups as discussed above, we repeat the event
study analysis for these groups using the market model and a 30 day pre- and post-
announcement event window.
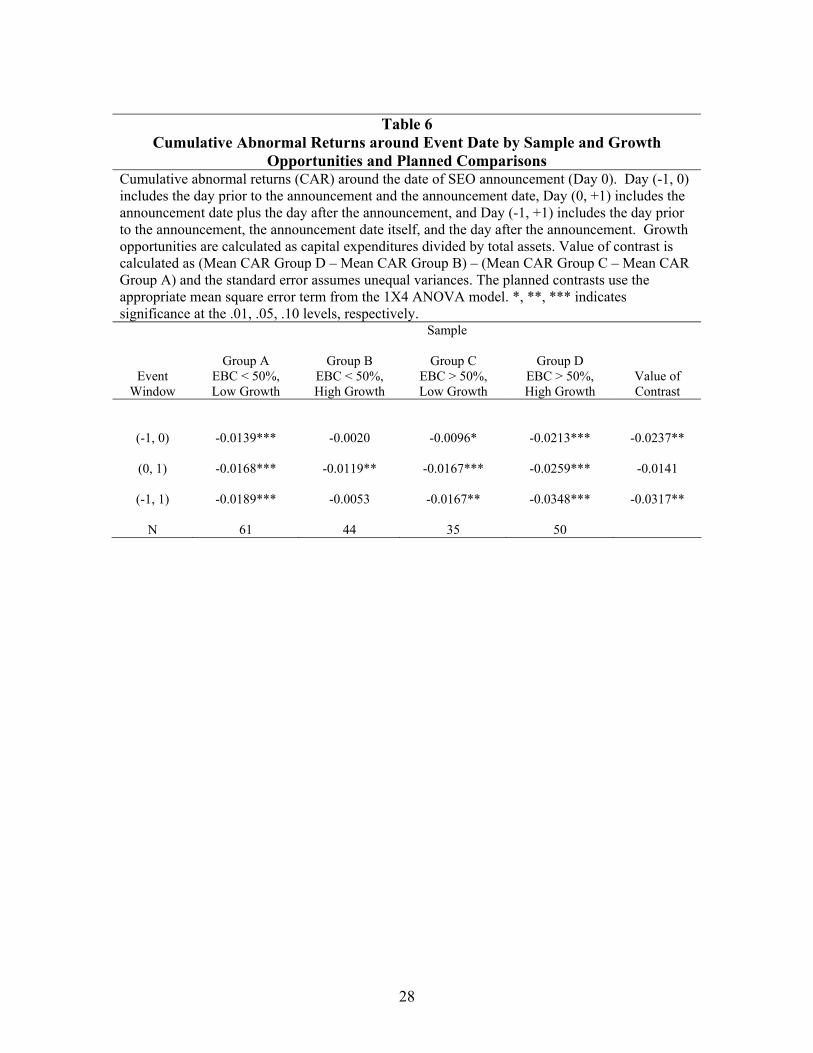
Cumulative abnormal returns for three windows are presented in Table 6. As
expected, it appears that SEO announcements from firms with high growth opportunities
(high information asymmetry) and whose CEOs are paid with large proportions of EBC
16
(Group D) are met with a more negative market reaction than any other type of firm.
Column 5 of Table 6 shows the CARs for Group D to be negative and significant for each
window. The CARs from this group are significantly different from that of the sample of
EBC < 50% and high growth firms (Group B) at the 0.08, 0.15, and 0.02 levels, for
windows (-1,0), (0,1), and (-1,1), respectively. Thus, shareholders in a high information
asymmetry environment appear to react more strongly to an equity-issuance
announcement when more of the CEO’s wealth is tied to firm value (i.e., SEO is a “last
resort”). The sample of firms consisting of EBC > 50% and high growth opportunities
(Group D) have lower abnormal returns than the sample of EBC > 50% and low growth
firms (Group C), but this difference is only significant at the 0.14 level for the window (-
1,1). Since we expect that shareholders value the “last resort” signal to a greater extent in
a high growth environment, this result is consistent with our hypothesis. Also,
differences between the cumulative abnormal returns for both samples of low growth
opportunity firms (Groups A and C) are not significantly different, thus supporting the
theory that the market values signals to a smaller extent in firms with lower levels of
information asymmetries.
Planned comparison results are also shown in Table 6. The value of contrast is
calculated as (mean CAR Group D – mean CAR Group B) – (mean CAR Group C –
mean CAR group A) for each event window. We expect that the difference between
Group D and B should be larger than that of Groups C and A since the former set is under
high information asymmetry (i.e., where the market is more sensitive to bad news). As
shown in the last column of Table 6, the difference in market reaction between high and
low EBC groups is more pronounced (negative) in the high growth opportunity firms
17
than in low growth firms for each window. The value of the contrasts in all three
windows is in the expected negative direction. This difference is significant in two of the
three event windows, thus supporting the hypothesis that investors interpret the issuance
of SEOs as a bad news signal to a greater extent when in high information asymmetry
environments.
5. Conclusion
In this paper, we analyze the market reaction to SEO announcements by firms
where the CEO is paid with large and small proportions of equity-based compensation.
Using an event study approach, results support the hypothesis that SEO firms paying
higher equity-based compensation to their CEOs perform worse in the days surrounding
the announcement than do firms with higher cash-based CEO compensation structures.
This may indicate that investors interpret the SEO issuance from CEOs whose wealth is
tied to firm performance as a signal that the firm is using the issue as a “last resort” form
of raising capital through the issuance of overvalued shares. Cross-sectional results that
include non-linear equity-based compensation percentage variables confirm the notion
that the percent of equity-based compensation is directly related to the strength of the
firm value decline associated with an SEO announcement. Further, this result is
exacerbated in firms that have high levels of information asymmetry between
management and investors. In higher information asymmetry environments, investors
appear to be more sensitive to a signal that the SEO is a “last resort” form of financing.
These results have several important practical and academic implications. First,
managers should consider the external ramifications of compensation structure decisions
18
on shareholder value. Having high proportions of equity-based compensation may lead
to indirect costs to shareholders following certain corporate decisions, such as the
decision to issue seasoned equity as analyzed here. However, it appears that CEO equity-
based compensation plays a more minor role in shareholder response than does the
proportion of stock options granted to the top five corporate executives. Second, the
benefits of a seasoned equity offering may outweigh the costs for a firm whose CEO is
paid with low levels of equity-based compensation. Therefore, these firms should
consider an SEO as an effective way to raise capital, since the costs to them may be lower
than traditionally reported. Finally, this study shows that compensation structure impacts
theories on capital structure. Therefore, future research that incorporates the form of
management compensation into traditional capital structure theories may be worthwhile.
19
References
Akerlof, G., 1970, “The market for ‘lemons’: quality uncertainty and the market mechanism.” Quarterly Journal of Economics 84: 488-500. Asquith, P. and D. Mullins, 1986, “Equity issues and offering dilution.” Journal of Financial Economics 15: 61-89. Brennan, M. and A. Kraus, 1987, “Efficient financing under asymmetric information.” Journal of Finance 42: 1225-1243. Brown, S. and J. Warner, 1985, “Using daily stock returns: the case of event studies.” Journal of Financial Economics 14: 3-31. Clark, J., C. Dunbar, and K. Kahle, 2001, “Long-run performance and insider trading in completed and canceled seasoned equity offerings.” Journal of Financial and Quantitative Analysis 36: 415-430. Core, J. E., W.R. Guay, and D.F. Larcker, 2003, “Executive equity compensation and incentives: A survey,” Economic Policy Review 9: 27-50. Datta, S., M. Iskandar-Datta, and K. Raman, 2001, “Executive compensation and corporate acquisition decisions.” Journal of Finance 56: 2299-2336. Datta, S., M. Iskandar-Datta, and K. Raman, 2004, “Executive compensation structure and financing decisions.” Journal of Business forthcoming. Denis, D.J. and A. Sarin, 2001, “Is the market surprised by poor earnings realizations following seasoned equity offerings?” Journal of Financial and Quantitative Analysis 36: 169-193. Eberhart, A. and A. Siddique, 2002, “The long-term performance of corporate bonds (and stocks) following seasoned equity offerings.” Review of Financial Studies 15: 1385-1406. Eckbo, E.B., R.W. Masulis, and O. Norli, 2000, "Seasoned Equity Offerings: Resolution of the 'New Issues Puzzle." Journal of Financial Economics 56(2): 251-291. Friday, S., S. Howton, and S. Howton, 2000, “Anomalous evidence on operating performance following seasoned equity offerings: the case of REITs.” Financial Management 29: 76-87. Goyal, V., K. Lehn, and S. Racic 2002, “Growth opportunities and corporate debt policy: the case of the U.S. defense industry.” Journal of Financial Economics 64: 35-59.
20
Guay, W., 1999, “The sensitivity of CEO wealth to equity risk: An analysis of the magnitude and determinants.” Journal of Financial Economics 53: 43-71. Hall, B.J. and J.B. Liebman, 1998, “Are CEOs really paid like bureaucrats?” Quarterly Journal of Economics 113: 653-692. Harris, M. and A. Raviv, 1991, “The theory of capital structure.” Journal of Finance 46: 297-355. Jegadeesh, N., 2000, “Long-term performance of seasoned equity offerings: benchmark errors and biases in expectations.” Financial Management 29: 5-30. Krasker, W., 1986, “Stock price movements in response to stock issues under asymmetric information.” Journal of Finance 41: 93-105. Loughran, T. and J. Ritter, 1995, “The new issues puzzle.” Journal of Finance 50: 23-51. Lucas, D. and R. McDonald, 1990, “Equity issues and stock price dynamics.” Journal of Finance 45: 1019-1043. McConnell, J. and H. Servaes, 1995, “Equity ownership and the two faces of debt.” Journal of Financial Economics 39: 131-157. Mehran, H., G. Nogler, and K. Schwartz, 1998, “CEO incentive plans and corporate liquidation policy.” Journal of Financial Economics 50: 293-316. Mikkelson, W. and M. Partch, 1986, “Valuation effects of security offerings and the issuance process.” Journal of Financial Economics 15: 31-60. Miller, M. and K. Rock, 1985, “Dividend policy under asymmetric information.” Journal of Finance 40: 1031-1051. Mitchell, M. and E. Stafford, 2000, “Managerial decisions and long-term stock price performance.” Journal of Business 73: 287-329. Myers, S. and N. Majluf, 1984, “Corporate financing and investment decisions when firms have information that investors do not have.” Journal of Financial Economics 13: 187-221. Noe, T., 1988, “Capital structure and signaling game equilibria.” Review of Financial Studies 1: 331-356. Shleifer, A. and R. Vishny, 1988, “Value maximization and the acquisition process.” Journal of Economic Perspectives 2: 7-20.
21
Smith, C. and R. Stulz, 1985, “The determinants of firms’ hedging policies.” Journal of Financial and Quantitative Analysis 20,: 391-406. Smith, C. and R. Watts, 1992, “The investment opportunity set and corporate financing, dividend, and compensation policies.” Journal of Financial Economics 32: 263-292. Stulz, R., 1990, “Managerial discretion and optimal financing policies.” Journal of Financial Economics 26: 3-27. Tehranian, H., N. Travlos, and J. Waegelein, 1987, “The effect of long-term performance plans on corporate sell-off induced abnormal returns.” Journal of Finance 42: 933-942. Traversky, A. and D. Kahneman, 1986, “Rational choice and the framing of decisions.” Journal of Business 59, 251-278. Tsui, J., B. Jaggi, and F. Gul, 2001, “CEO determination, growth opportunities, and their impact on audit fees.” Journal of Accounting, Auditing, and Finance 16: 189-208. Wall Street Journal, 2003, “In tough times for CEOs, they head to Warren Buffett's table,” by Monica Langley, November 14, A.1. Wall Street Journal, 2004, “Fewer CEOs get ‘megagrants’ as incentives,” by Joan Lublin, March 2, B.1.
22
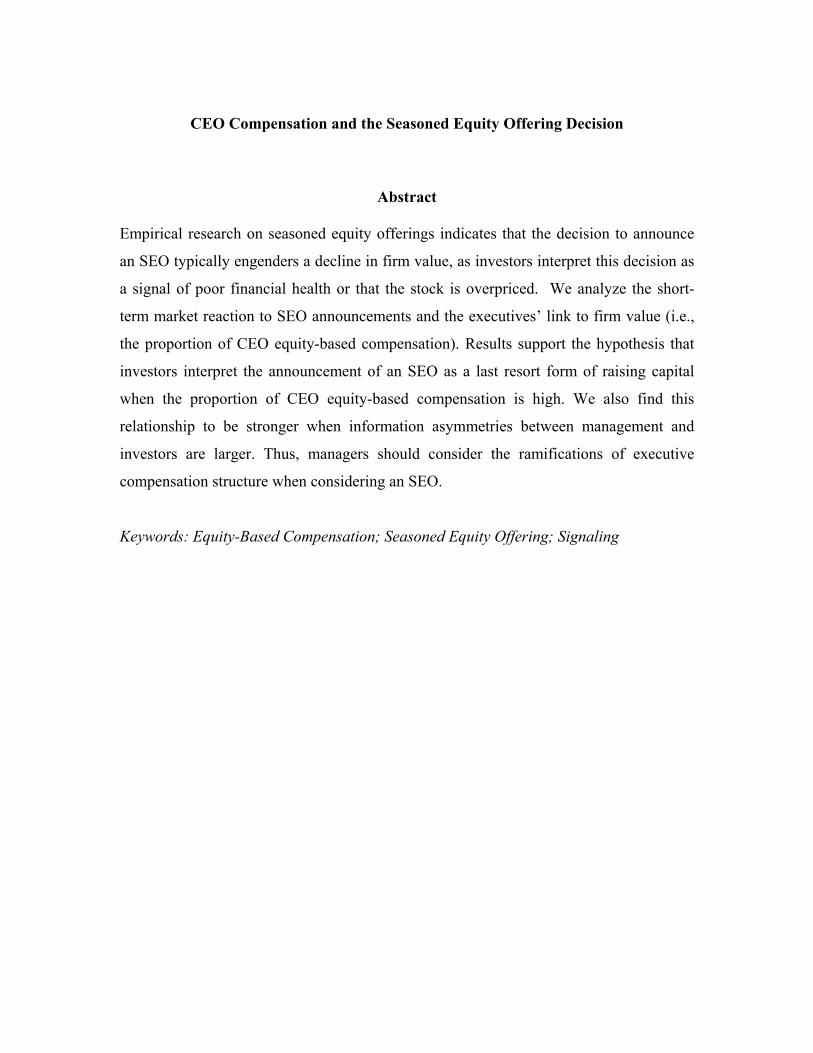
Figure 1
Market reactions by level of information asymmetry This figure shows the expected differences in market reactions to announcements of SEOs by level of asymmetric information. Group A consists of firms with EBC < 50% and low information asymmetries, Group B consists of firms with EBC < 50% and high information asymmetries, Group C consists of firms with EBC > 50% and low information asymmetries, Group D consists of firms with EBC > 50% and high information asymmetries. The figure shows that the difference in market reactions between groups with EBC > 50% and EBC < 50% is greater for firms with higher levels of information asymmetries than for firms with low levels.
Information asymmetry highlow
Neg
ativ
e m
arke
t re
actio
n lo
w
high
Group D
Group BGroup A
Group C
High equity-based compensation
Low equity-based compensation

23
Table 1 Sample Firms by Year
This table shows the number of SEO announcements from 1993-2000 that are used in the sample. To be used in the sample, the firm announcing the SEO must also be listed in the Execucomp database.
Year SEO announcements 1993
34
1994
21
1995
16
1996
27
1997
31
1998
35
1999
37
2000
20
Total 221
24
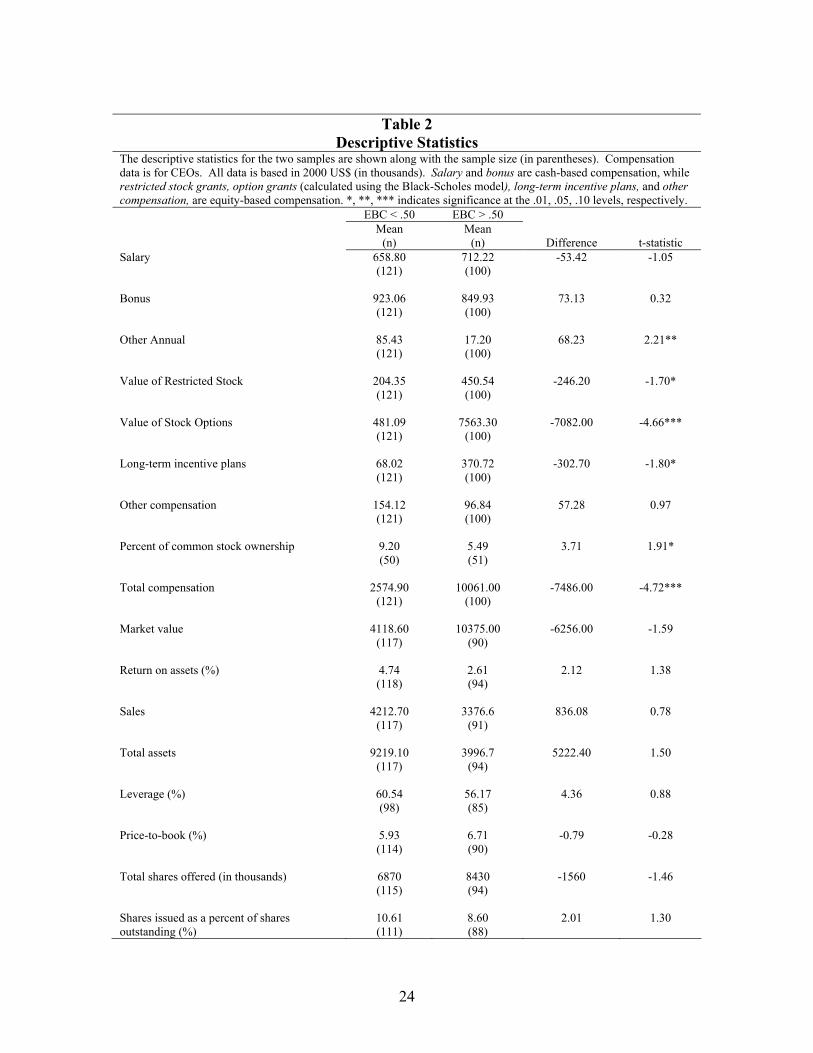
Table 2
Descriptive Statistics The descriptive statistics for the two samples are shown along with the sample size (in parentheses). Compensation data is for CEOs. All data is based in 2000 US$ (in thousands). Salary and bonus are cash-based compensation, while restricted stock grants, option grants (calculated using the Black-Scholes model), long-term incentive plans, and other compensation, are equity-based compensation. *, **, *** indicates significance at the .01, .05, .10 levels, respectively. EBC < .50 EBC > .50 Mean
(n) Mean
(n) Difference t-statistic Salary
658.80 (121)
712.22 (100)
-53.42 -1.05
Bonus
923.06 (121)
849.93 (100)
73.13 0.32
Other Annual
85.43 (121)
17.20 (100)
68.23 2.21**
Value of Restricted Stock
204.35 (121)
450.54 (100)
-246.20 -1.70*
Value of Stock Options
481.09 (121)
7563.30 (100)
-7082.00 -4.66***
Long-term incentive plans
68.02 (121)
370.72 (100)
-302.70
-1.80*
Other compensation
154.12 (121)
96.84 (100)
57.28 0.97
Percent of common stock ownership
9.20 (50)
5.49 (51)
3.71 1.91*
Total compensation
2574.90 (121)
10061.00 (100)
-7486.00 -4.72***
Market value
4118.60 (117)
10375.00 (90)
-6256.00 -1.59
Return on assets (%)
4.74 (118)
2.61 (94)
2.12 1.38
Sales
4212.70 (117)
3376.6 (91)
836.08 0.78
Total assets
9219.10 (117)
3996.7 (94)
5222.40 1.50
Leverage (%)
60.54 (98)
56.17 (85)
4.36 0.88
Price-to-book (%)
5.93 (114)
6.71 (90)
-0.79 -0.28
Total shares offered (in thousands)
6870 (115)
8430 (94)
-1560 -1.46
Shares issued as a percent of shares outstanding (%)
10.61 (111)
8.60 (88)
2.01 1.30

25
Table 3 Abnormal Returns around SEO Announcement
Day 0 is classified as the “event date” (the announcement of the seasoned equity offering as listed in the WSJ). Mean AR indicates the mean abnormal return on the day in relation to the event date for each of the three samples (full, EBC < 50%, and EBC > 50%). *, **, *** indicates significance at the .01, .05, .10 levels, respectively.
Full Sample EBC < 50% EBC > 50%
Day Mean AR
(%) Z Mean AR (%) Z Mean AR (%) Z -10 -0.18 -1.20* -0.28 -1.19
-0.06 -0.47
-9 -0.03 0.49 0.10 1.28
-0.19 -0.67
-8 0.02 -0.12 0.01 -0.29
0.03 0.14
-7 -0.16 -1.42* -0.26 -1.31*
-0.04 -0.67
-6 0.22 0.30 0.28 0.68
0.15 -0.30
-5 -0.14 -0.66 -0.59 -2.36***
0.40 1.60*
-4 0.22 0.95 -0.21 -1.50*
0.73 3.04***
-3 0.12 1.47* 0.30 1.78**
-0.10 -0.35
-2 0.07 0.49 0.07 -0.08
0.07 0.23
-1 -0.20 -1.41* -0.09 -0.47*
-0.54 -1.58*
0 -0.92 -5.60*** -0.87 -4.36***
-0.97 -3.54***
1 -0.63 -3.65*** -0.45 -2.61***
-0.85 -2.56***
2 0.09 0.24 -0.02 0.02
0.23 0.32
3 0.13 1.72** 0.10 1.22
0.17 1.21
4 0.35 1.95** 0.02 0.28
0.76 2.59***
5 0.41 1.46* 0.42 0.79
0.41 1.29*
6 0.13 0.39 0.04 -0.25
0.25 0.84
7 -0.12 -0.01 -0.08 0.28
-0.17 -0.32
8 -0.31 -1.15 -0.32 -0.85
-0.31 -0.77
9 -0.33 -1.44* -0.13 -0.19
-0.57 -1.93**
10 0.33 1.47* 0.25 1.03
0.42 1.04
N 218 119 99
26
Table 4
Distribution of Cumulative Abnormal Returns around Event Date by Sample Three-day CARs (%) around the date of SEO announcement. The t-statistic is for the difference in means between the CARs for the two samples and the Z-statistic is for the Wilcoxon rank-sum test for the difference between the two samples’ distributions. The three-day window (-1, +1) includes the day prior to the announcement, the announcement date itself, and the day after the announcement. *, **, *** indicates significance at the .01, .05, .10 levels, respectively.
Full sample EBC < 50% EBC > 50%
Z/t statistic for difference
Minimum -25.87 -16.70 -25.87
Quartile 1 -4.31 -4.14 -4.48
Median -1.33*** -1.12*** -1.41*** 1.23*
Quartile 3 0.66 1.43 0.27
Maximum 20.49 20.49 10.48
Mean -1.75*** -1.23** -2.36*** 1.94**
Positive:Negative 69:149 41:78 28:71
N 218 119 99

27
Table 5
Determinants of Abnormal Returns surrounding SEO Announcements This table shows the results of ordinary least squares regressions using standardized announcement window (-1, 1) abnormal returns as the dependent variable. Quartiles are based on whether the proportion of equity-based compensation is <.25 (Q1), ≥.25 or < .50 (Q2), ≥.50 or < .75 (Q3), ≥.75 (Q4). Interaction variables are obtained by multiplying percent of equity-based compensation by a dummy variable that is equal to one if a firm is in the quartile of interest, and zero otherwise. Percent equity-based compensation is the sum of restricted stock grants, stock options, long-term incentive plans, other annual compensation, and other compensation divided by total compensation (which includes salary and bonus). Shares issued as a percent of share outstanding represents the number of shares issued in the SEO divided by the number of shares outstanding before the SEO. Sales is the natural logarithm of annual sales. Leverage is total debt divided by total assets. Year dummy is a number 1-8 corresponding to the SEO announcement years 1993-2000. Reason dummy is a number 1-5 corresponding to the reason given for the SEO issuance. P-values are reported in parentheses under the coefficients. Dependant variable = AR (-1, 1)
Model 1 Model 2 Model 3 Model 4 Quartile 1*percent equity-based compensation
-0.0592 (0.613)
-0.0459 (0.670)
Quartile 4*percent equity-based compensation
-0.0276 (0.028)
-0.0224 (0.097)
Percent equity-based compensation -0.0262 (0.053)
-0.0226 (0.127)
Shares issued as a percent of shares outstanding
-0.1026 (0.133)
-0.1240 (0.077)
-0.106 (0.124)
-0.124 (0.081)
Sales 0.0037 (0.226)
0.0033 (0.284)
0.0042 (0.176)
0.0038 (0.225)
Leverage -0.0001 (0.963)
0.0018 (0.901)
-0.0036 (0.810)
0.0054 (0.720)
Year dummy -0.0006 (0.778)
-0.0008 (0.689)
Reason dummy 0.0051 (0.113)
0.0044 (0.185)
Intercept -0.0253 (0.301)
-0.0282 (0.236)
0.0308 (0.110)
-0.0477 (0.128)
N
160 160 160 160
F-statistic (p-value)
2.27 (0.065)
2.04 (0.076)
1.96 (0.075)
1.74 (0.103)
28
Table 6
Cumulative Abnormal Returns around Event Date by Sample and Growth Opportunities and Planned Comparisons
Cumulative abnormal returns (CAR) around the date of SEO announcement (Day 0). Day (-1, 0) includes the day prior to the announcement and the announcement date, Day (0, +1) includes the announcement date plus the day after the announcement, and Day (-1, +1) includes the day prior to the announcement, the announcement date itself, and the day after the announcement. Growth opportunities are calculated as capital expenditures divided by total assets. Value of contrast is calculated as (Mean CAR Group D – Mean CAR Group B) – (Mean CAR Group C – Mean CAR Group A) and the standard error assumes unequal variances. The planned contrasts use the appropriate mean square error term from the 1X4 ANOVA model. *, **, *** indicates significance at the .01, .05, .10 levels, respectively.
Sample
Event Window
Group A
EBC < 50%, Low Growth
Group B EBC < 50%, High Growth
Group C EBC > 50%, Low Growth
Group D EBC > 50%, High Growth
Value of Contrast
(-1, 0)
-0.0139*** -0.0020 -0.0096* -0.0213*** -0.0237**
(0, 1)
-0.0168*** -0.0119** -0.0167*** -0.0259*** -0.0141
(-1, 1)
-0.0189*** -0.0053 -0.0167** -0.0348*** -0.0317**
N 61 44 35 50