Centro Healthcare Category
35
HEALTHCARE Category Overview April 2015
-
Upload
centro -
Category
Healthcare
-
view
288 -
download
0
Transcript of Centro Healthcare Category

HEALTHCARE Category Overview April 2015

A SHIFTING INDUSTRY

The U.S. healthcare industry is currently worth $2.8 trillion with consumer healthcare spending projected to increase 6.8% in 2015; the biggest increase since
the recession began in 2008.
With the Affordable Care Act, the number of insured Americans will drastically increase in the next 4 years, bringing millions of new consumers into
the healthcare marketplace.
Additionally, there is a major demographic shift happening in America. Baby Boomers are getting older, and soon 1 in 5 Americans will be a senior citizen. As these consumers age, they will have a
greater need for healthcare.
The U.S is also seeing an increase in many preventable diseases, such as diabetes, obesity, and
hypertension. Healthcare providers have an opportunity to educate consumers about
preventative care and create a sense of urgency to visit a medical provider on a regular basis.
INDUSTRY OPPORTUNITIES
THERE IS A GOLDEN OPPORTUNITY
IN FRONT OF US
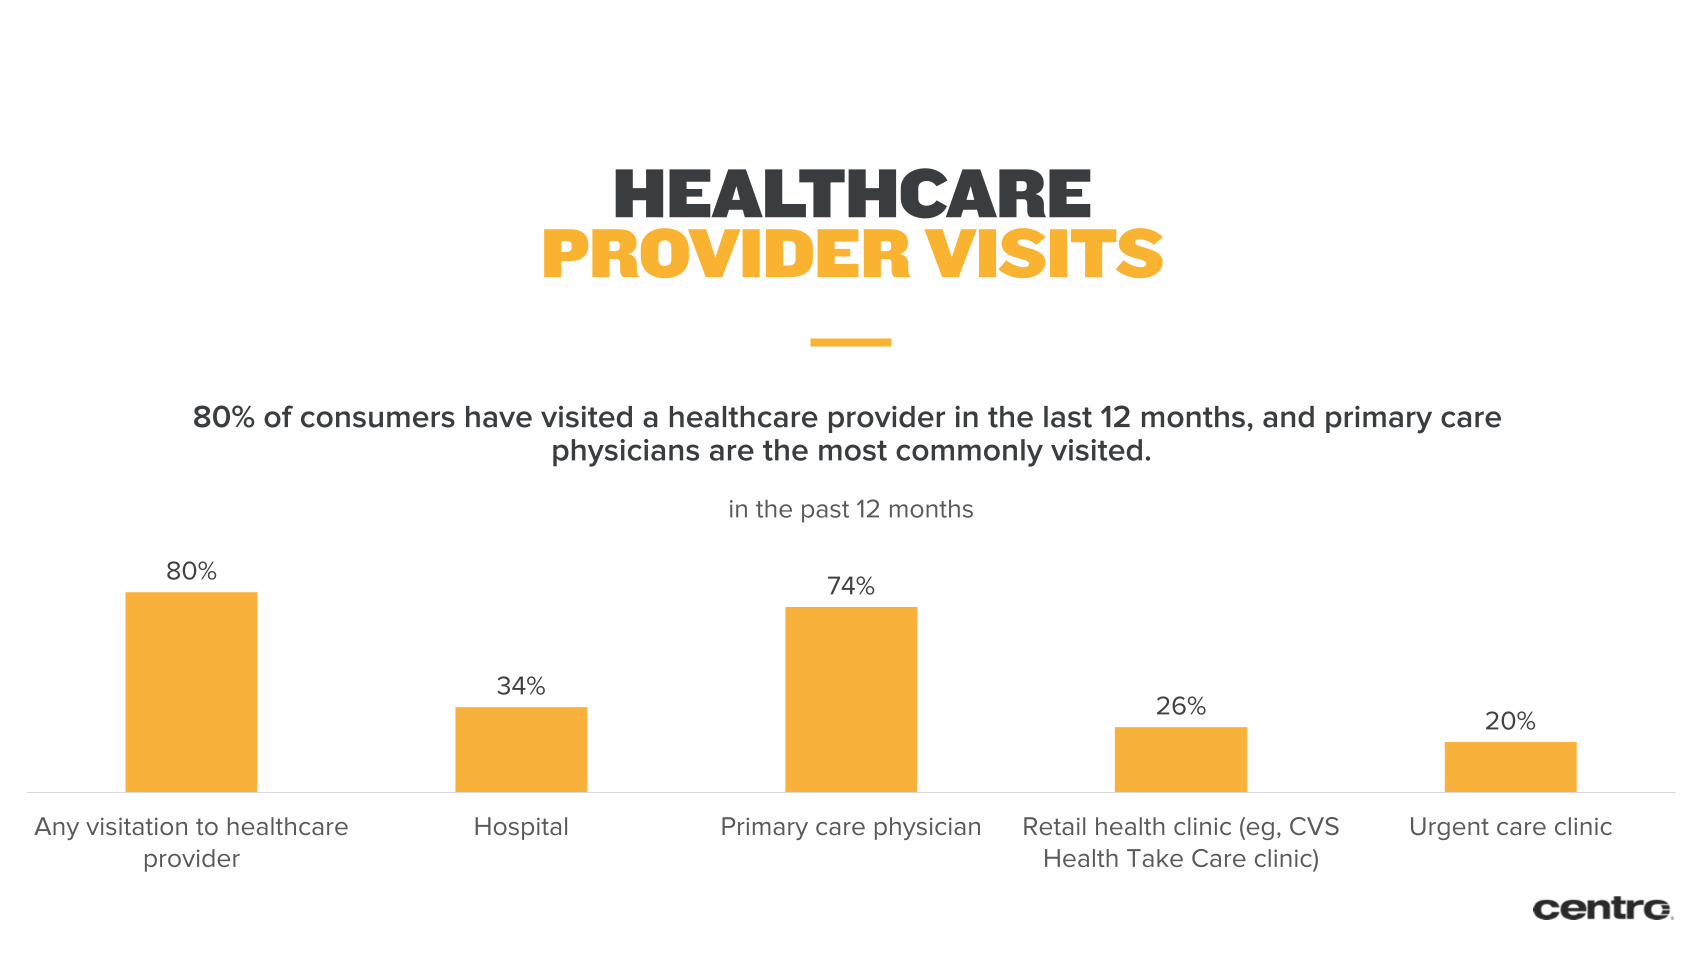
HEALTHCARE PROVIDER VISITS
80% of consumers have visited a healthcare provider in the last 12 months, and primary care physicians are the most commonly visited.
80%
34%
74%
26% 20%
Any visitation to healthcare provider
Hospital Primary care physician Retail health clinic (eg, CVS Health Take Care clinic)
Urgent care clinic
in the past 12 months

Projected health insurance enrollment over the next 4 years will bring millions of new consumers into the marketplace.
THE NEWLY INSURED

SELECTING A HEALTHCARE PROVIDER
Managing Your Health - US - January 2015 - Selecting a Healthcare Provider
Hospital Primary care
physician
Retail health clinic (eg, CVS Health Take Care clinic) Urgent care clinic
% % % % Best quality of care 19 59 4 5 Closest to my home/work 16 49 13 12 Most convenient hours 22 29 15 22 Accepts my insurance 18 62 5 6 In my network 12 67 4 3 Least expensive 5 40 22 9 Fastest treatment 10 36 16 25 Has the newest technology 51 25 4 5 Most approachable staff 12 61 9 6 Newest facility 33 28 8 13 Best reputation 28 48 4 4
The reasons consumers select a healthcare provider vary by the type of provider. Consumers visiting a primary care physician value the best quality of care, those visiting a hospital value the newest in technology, and those visiting a retail health clinic value the least expensive option.

BABY BOOMERS DOMINATE HEALTHCARE SPENDING
of All Prescription
Drug Use
of All Doctor Visits
of All Healthcare Spending
Citizens age 65+ spend an average of $4,769 out-of-pocket on health expenditures, while the total population spends an average of $3,313.
60% of adults 50-64 suffer from at least 1 chronic health condition.
40% 1/3 1/3

In 2014, 8 million Americans gained health insurance through the Affordable Care Act. This
increase is leading to longer wait times, less available physicians, and ultimately more visits to retail health clinics. Retail healthcare clinics are currently estimated to account for 10.8 million
visits per year.
Additionally, younger generations are relying less on traditional medical care. Millennials are even seeking options that could bypass a trip to the physical doctor’s office like health monitoring
apps/systems and virtual opportunities.
Finally, consumers are adopting more healthful habits like taking vitamins, watching their diet, and regularly exercising. This could impact the industry long-term if these reduce reliance on
medication and lead to a diminishing of avoidable ailments, both of which drive doctor visits.
INDUSTRY THREATS
FACING A BUMPY
ROAD AHEAD

IMPACT OF RETAIL HEALTHCARE CLINICS
of all consumers will have visited a retail healthcare clinic by 2015
The increase in the number of retail
healthcare clinics by 2015
of consumers are interested in a self-serve clinic
at retailers
Visits to retail healthcare clinics will save an estimated $800 million per year in overall healthcare expenditures.
Of all visits to retail healthcare clinics in 2014, 54% went for an immunization/shot, 31%
went for an ailment/injury, and 15% went for another reason.
25%-30% 26% 37%

In 2014, about half of Millennials visited a doctors office – compared to three-quarters
of non-Millennials.
71% of Millennials believe they’re already doing everything they can to maintain a
healthy lifestyle.
74% of Millennials prefer retail care clinics, and 25% prefer acute care clinics – double the number of baby boomers and seniors.
Millennials are more inclined than other
generations to request and receive estimates before undergoing treatment.
54% of Millennials have reported delaying or avoiding treatment due to costs, double that
of baby boomers and seniors.
MILLENNIALS & HEALTHCARE

HEALTH TECHNOLOGIES THAT U.S. MILLENNIAL PATIENTS ARE INTERESTED IN USING
73%
71%
63%
61%
60%
57%
Having their doctor use mobile devices during appointments to share info
Mobile apps to actively manage well-being for preventative care, review health records, schedule appointments
Proactively providing health data to doctor/provider via Wi-Fi/wearable devices so they can monitor their well-being
3-D printing for necessary health devices (prosthetics, hearing aids, etc.)
Using telehealth options (e.g., video chat with a doctor) so they don't have to come into the office for an appointment
Cutting-edge devices like pills that can monitor their internal vitals when swallowed

THE IMPACT OF TECHNOLOGY

As the healthcare industry is growing it is also evolving and taking a more digital approach.
This year, the U.S. Food and Drug
Administration is poised to review a record number of mobile health apps to respond to
the growing demand for mHealth.
According to a recent report by Mintel, 31% of consumers would use a mobile app to detect
or diagnose illness.
The number of electronic health records increased from 38% in 2008 to 78% in 2013.
Half of doctors believe that e-visits could replace more than 10% of in-office patient
appointments.
75% of doctors said they would prescribe an app to help patients manage chronic diseases,
such as diabetes.
TECHNOLOGY’S ROLE
HEALTHCARE IS BECOMING MORE
DIGITALLY-DRIVEN

TIME SPENT RESEARCHING HEALTH INFORMATION
Consumers are researching their health information online more frequently, with more than 60%
of consumers 45+ spending up to 5 hours per week researching.
Weekly Time Spent Researching Health Information* Among US Internet Users, by Age, Jan 2015 (% of respondents in each group)
18-34 35-44 45-65 66+ Total None 18% 16% 27% 35% 23%
<1 hour 34% 36% 40% 41% 37% 1-5 hours 35% 39% 31% 21% 32%
6-10 hours 7% 5% 2% 1% 4% 11-15 hours 3% 3% 1% 1% 2%
16-20 hours 1% 1% na 1% na 20+ hours 2% 1% 1% 1% 1%

METHODS FOR MANAGING HEALTH
Preferred Method for Managing Health According to US Internet Users, by Age, March 2014 (% of respondents in each group)
Digital channels Facility visits Phone/mail In-home/in person Other 18-24 40% 23% 18% 12% 6% 25-34 39% 27% 18% 10% 6% 35-44 36% 31% 20% 8% 6% 45-54 28% 38% 18% 11% 5% 55-64 22% 40% 19% 13% 5% 65+ 18% 43% 19% 15% 5%
Source: Strategy& (formerly Booz & Company), "The Birth of the Healthcare Consumer" in partnership with PricewaterhouseCoopers (PwC), Oct 14, 2014
Methodology: Data is from the October 2014 Strategy& (formerly Booz & Company) report titled "The Birth of the Healthcare Consumer" in partnership with PricewaterhouseCoopers (PwC). 2,339 US internet users ages 18+ were surveyed online during March 2014. The survey captured a representative sample of consumers across age, gender, health status (e.g., healthy, high risk/catastrophic, low risk/acute), income level and insurance type (e.g., employer outside exchange, Medicaid, Medicare, private exchange, public exchange and other).
Note: n=2,339; numbers may not add up to 100% due to rounding; read as 40% of respondents ages 18-24 prefer to manage their health via digital channels
Among younger generations, digital channels are becoming the preferred way to manage health.

HEALTH RELATED DIGITAL ACTIVITIES
Gen Y (21-33) Gen X (34-48) Baby boomers (49-67) Silent generation (68+) Total Find info about medical condition or drug 77% 79% 84% 78% 80% Find info about doctors 62% 51% 44% 34% 48% Visit a website to see personal health info 37% 30% 27% 22% 29% Find how much a medical procedure may cost 41% 22% 23% 13% 25% Visit a website to request a prescription refill 30% 23% 18% 16% 22%
Source: Catalyst Healthcare Research, "What's Reasonable?" May 13, 2014
Methodology: Data is from the May 2014 Catalyst Healthcare Research study titled "What's Reasonable?" 433 US internet users ages 21+ were surveyed online during December 20, 2013-February, 19, 2014. The margin of error is +/-4.7 percentage points at a 95% confidence level.
Note: n=433; in the past 2 years
Health-Related Digital Activities Conducted by US Internet Users, by Generation, Feb 2014 (% of respondents in each group)
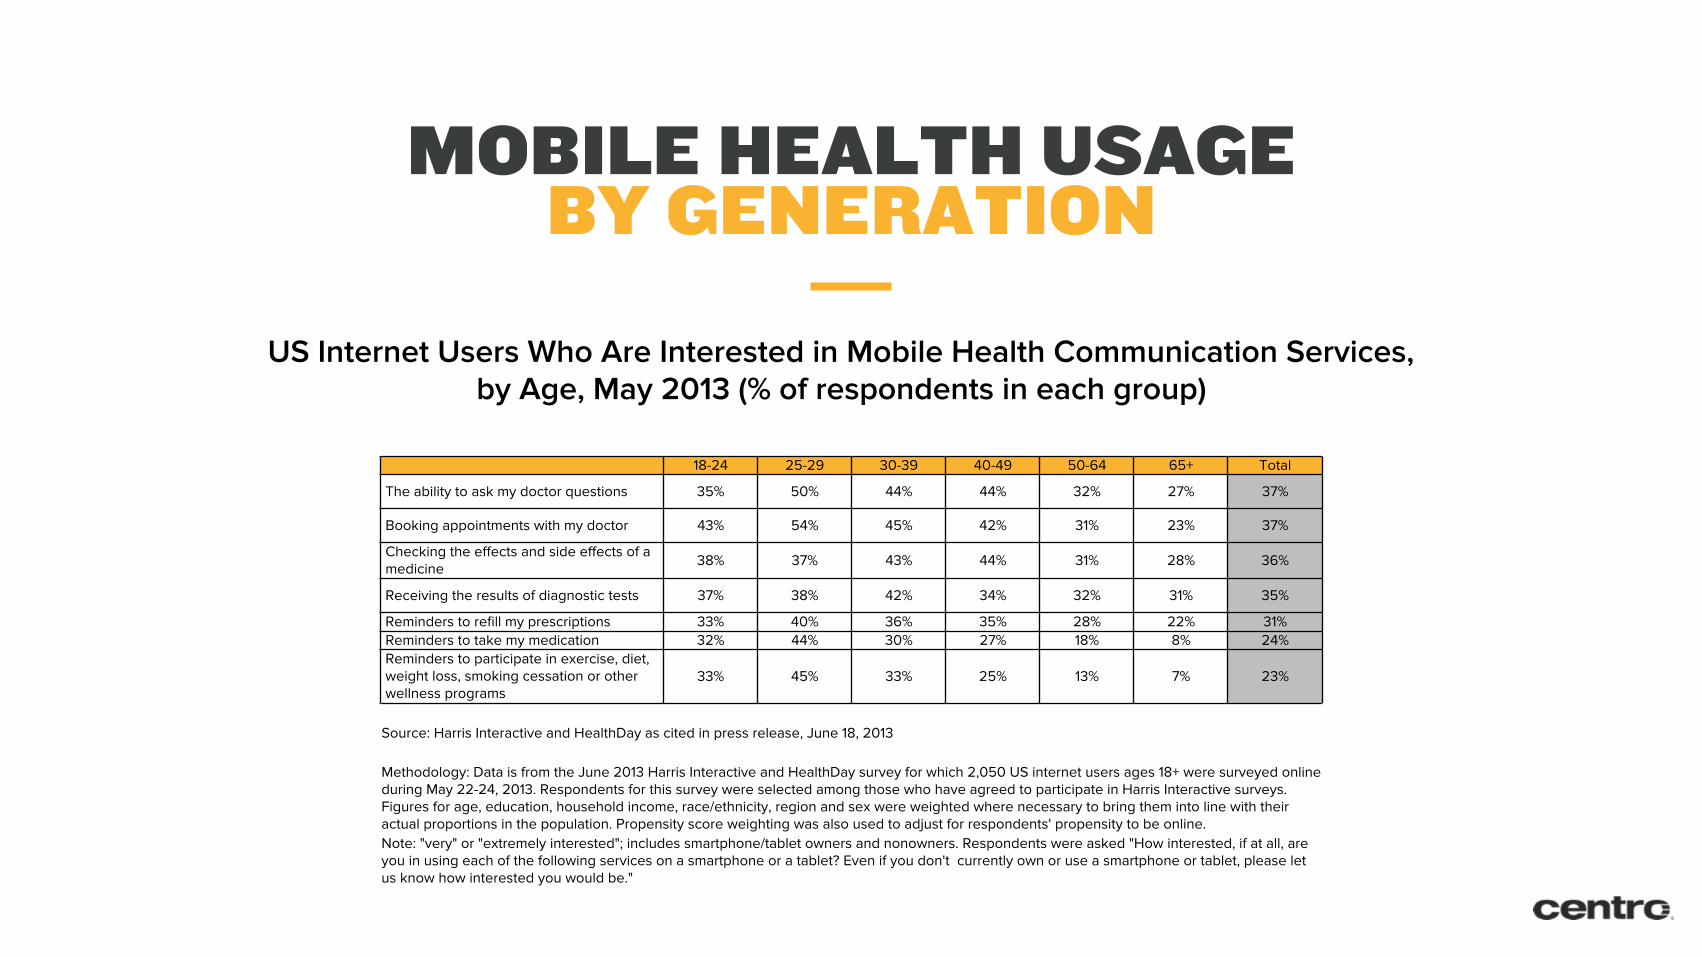
MOBILE HEALTH USAGE BY GENERATION
18-24 25-29 30-39 40-49 50-64 65+ Total
The ability to ask my doctor questions 35% 50% 44% 44% 32% 27% 37%
Booking appointments with my doctor 43% 54% 45% 42% 31% 23% 37%
Checking the effects and side effects of a medicine 38% 37% 43% 44% 31% 28% 36%
Receiving the results of diagnostic tests 37% 38% 42% 34% 32% 31% 35%
Reminders to refill my prescriptions 33% 40% 36% 35% 28% 22% 31% Reminders to take my medication 32% 44% 30% 27% 18% 8% 24% Reminders to participate in exercise, diet, weight loss, smoking cessation or other wellness programs
33% 45% 33% 25% 13% 7% 23%
Source: Harris Interactive and HealthDay as cited in press release, June 18, 2013
Methodology: Data is from the June 2013 Harris Interactive and HealthDay survey for which 2,050 US internet users ages 18+ were surveyed online during May 22-24, 2013. Respondents for this survey were selected among those who have agreed to participate in Harris Interactive surveys. Figures for age, education, household income, race/ethnicity, region and sex were weighted where necessary to bring them into line with their actual proportions in the population. Propensity score weighting was also used to adjust for respondents' propensity to be online. Note: "very" or "extremely interested"; includes smartphone/tablet owners and nonowners. Respondents were asked "How interested, if at all, are you in using each of the following services on a smartphone or a tablet? Even if you don't currently own or use a smartphone or tablet, please let us know how interested you would be."
US Internet Users Who Are Interested in Mobile Health Communication Services, by Age, May 2013 (% of respondents in each group)

HEALTHCARE AD SPENDING TRENDS

DIGITAL AD SPENDING BY INDUSTRY
Healthcare & Pharma are expected to see 12.6% digital ad spend growth per year from 2014-2019, the 5th highest of all industries.
US Digital Ad Spending, by Industry, 2014-2019 (billions and CAGR)
2014 2015 2016 2017 2018 2019 CAGR (2014-2019)
Retail $11.19 $12.91 $14.71 $16.38 $18.17 $19.98 12.30% Automotive $6.23 $7.30 $8.49 $9.60 $10.82 $12.08 14.20% Financial services $6.28 $7.19 $8.16 $9.08 $9.99 $10.90 11.70% Telecom $5.67 $6.49 $7.36 $8.11 $8.92 $9.72 11.40% CPG & consumer products $4.25 $4.97 $5.82 $6.55 $7.35 $8.17 14.00% Travel $4.20 $4.85 $5.55 $6.10 $6.69 $7.27 11.60% Computing products & consumer electronics $3.85 $4.44 $5.08 $5.66 $6.28 $6.90 12.40% Media $2.83 $3.39 $3.95 $4.32 $4.79 $5.27 13.20% Entertainment $2.38 $2.80 $3.21 $3.65 $4.13 $4.63 14.30% Healthcare & pharma $1.41 $1.61 $1.81 $2.09 $2.32 $2.55 12.60% Other $2.43 $2.64 $2.95 $3.22 $3.48 $3.74 9.00% Total $50.73 $58.61 $67.09 $74.77 $82.95 $91.22 12.50%
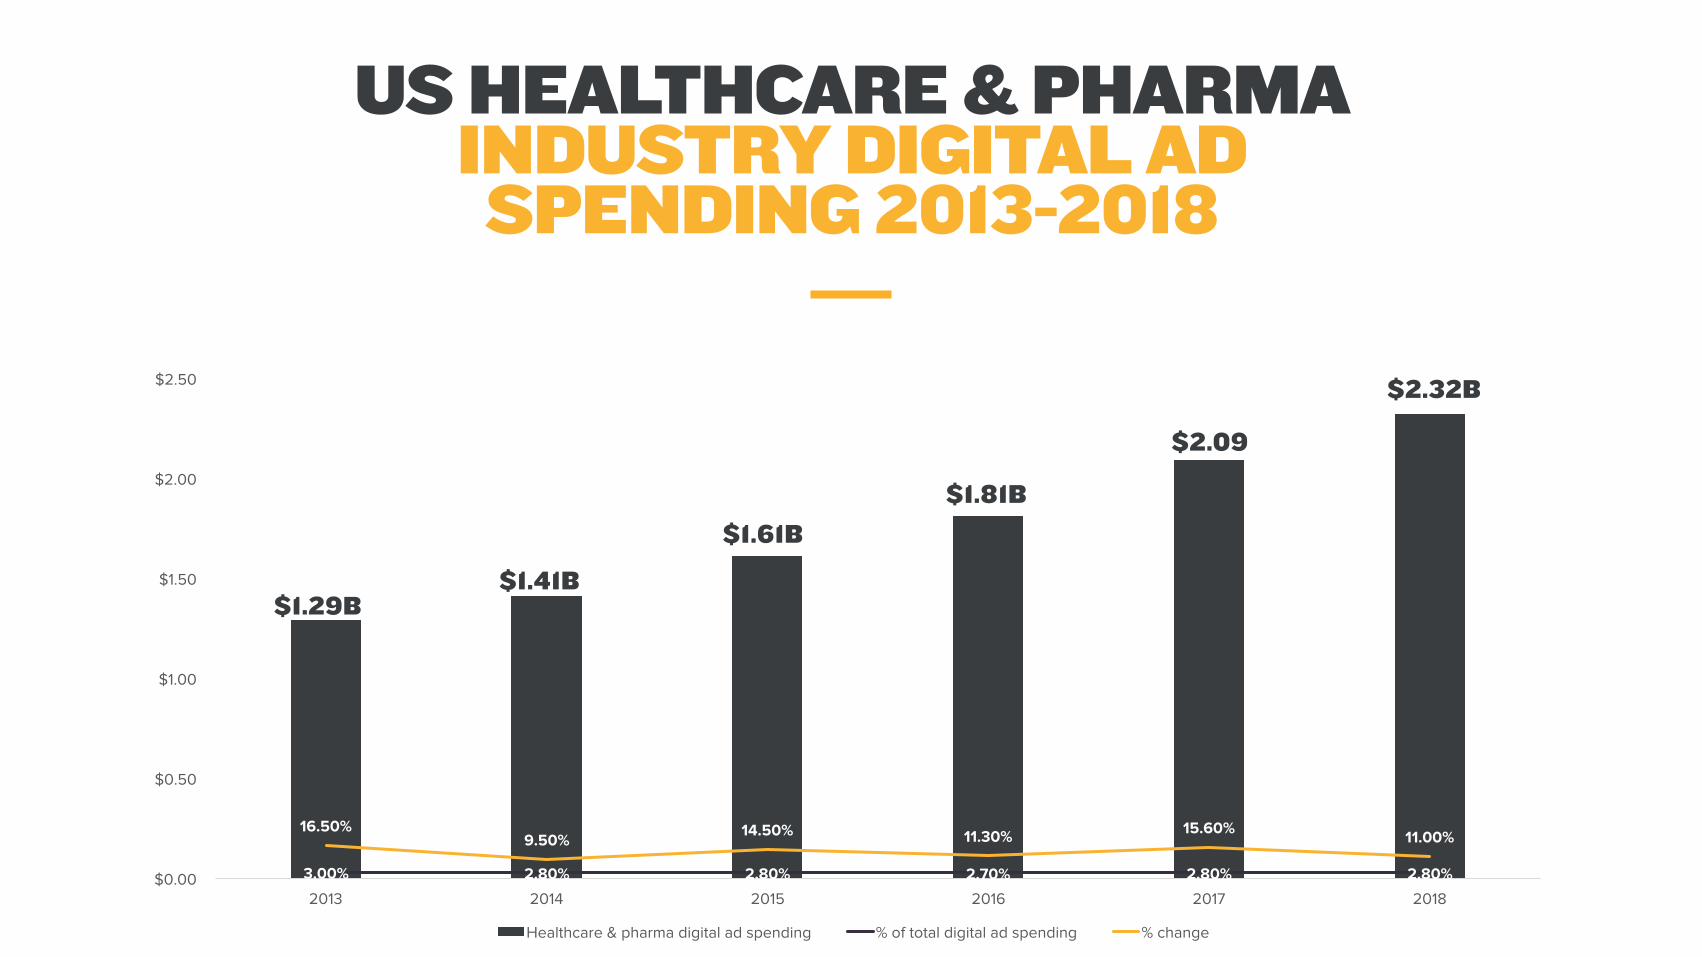
US HEALTHCARE & PHARMA INDUSTRY DIGITAL AD SPENDING 2013-2018
3.00% 2.80% 2.80% 2.70% 2.80% 2.80%
16.50% 9.50% 14.50% 11.30% 15.60% 11.00%
$0.00
$0.50
$1.00
$1.50
$2.00
$2.50
2013 2014 2015 2016 2017 2018
Healthcare & pharma digital ad spending % of total digital ad spending % change
$1.29B $1.41B
$1.61B $1.81B
$2.09B
$2.32B

$-
$500,000,000.00
$1,000,000,000.00
$1,500,000,000.00
$2,000,000,000.00
$2,500,000,000.00
YEAR 2010 YEAR 2011 YEAR 2012 YEAR 2013 YEAR 2014
Non-Digital Digital
TOTAL SPEND OF HOSPITALS, CLINICS & MEDICAL CENTERS
2010-2014
$1.2B
$1.6B $1.8B
$2.0B
$2.3B
From 2010-2014, non-digital media investments grew +76% but digital media investments grew +125%.
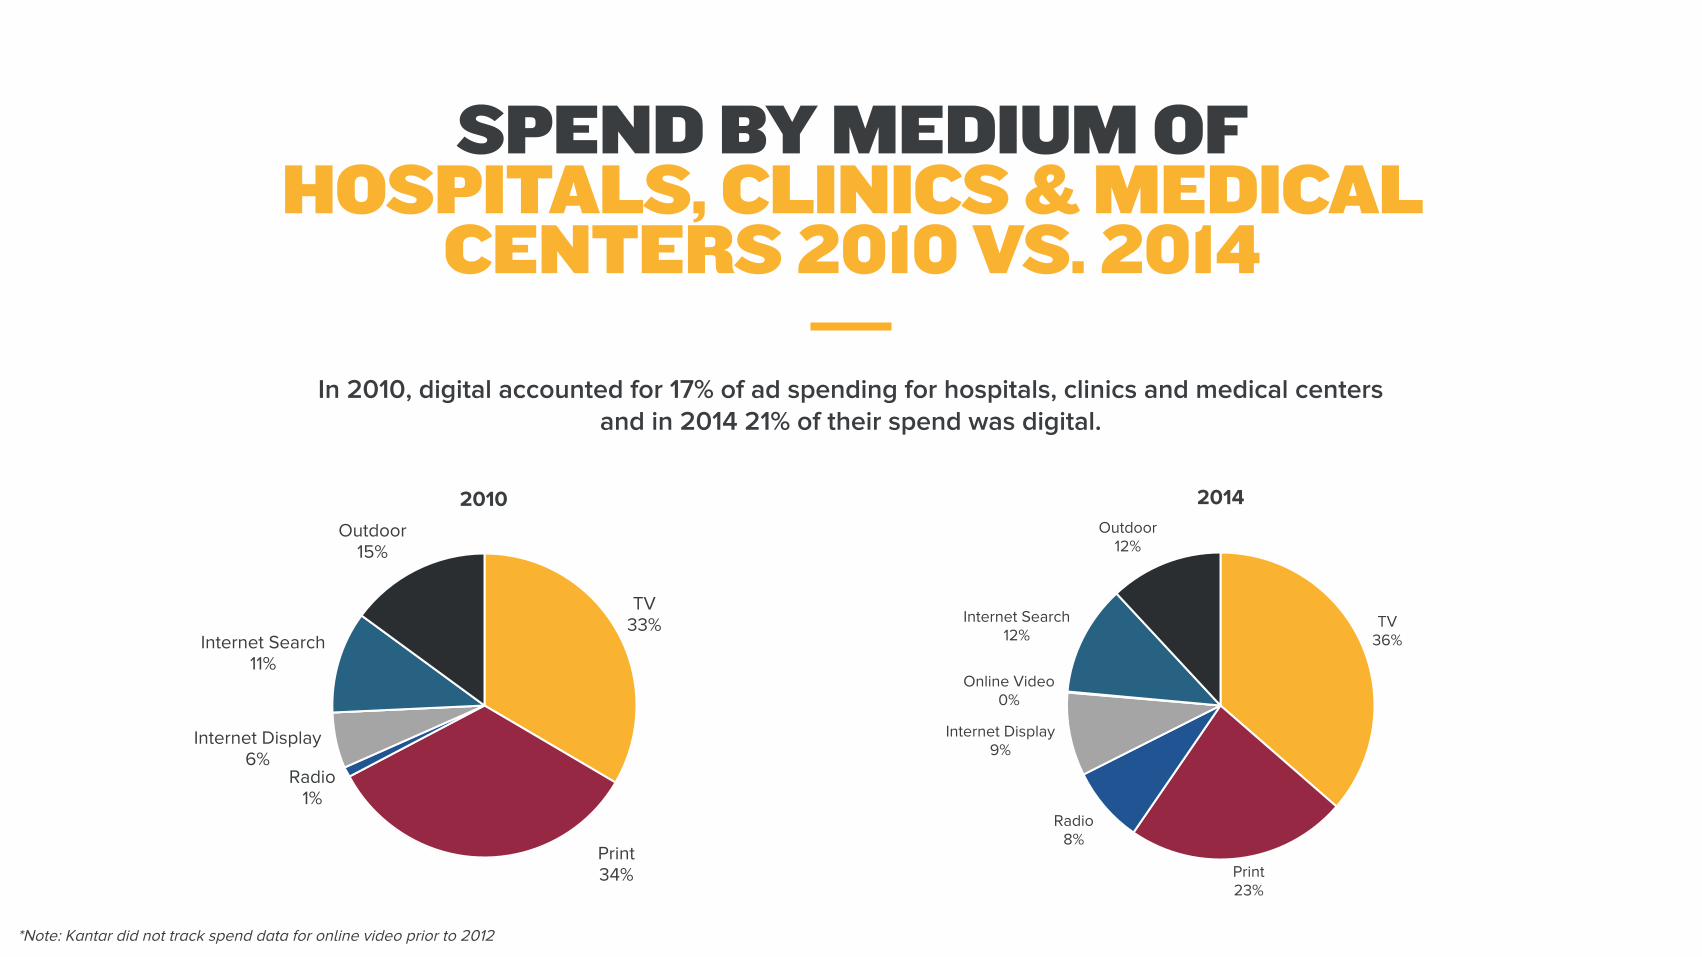
SPEND BY MEDIUM OF HOSPITALS, CLINICS & MEDICAL
CENTERS 2010 VS. 2014
TV 36%
Print 23%
Radio 8%
Internet Display 9%
Online Video 0%
Internet Search 12%
Outdoor 12%
2014
TV 33%
Print 34%
Radio 1%
Internet Display 6%
Internet Search 11%
Outdoor 15%
2010
*Note: Kantar did not track spend data for online video prior to 2012
In 2010, digital accounted for 17% of ad spending for hospitals, clinics and medical centers and in 2014 21% of their spend was digital.

CHANGE IN MARKETING SPEND BY INDUSTRY
Change in Marketing Spend According to US Marketers, by Industry, Feb 2015 (% change)
Healthcare/pharmaceutical
Digital marketing spending 19.20%
New product introductions 1.10%
Customer relationship management 4.00%
Brand building 9.40%
Traditional ad spending -0.20%
New service introductions 4.20%
Total marketing spending 10.70%
Of all marketing efforts, healthcare & pharma marketers reported the largest increase in
digital marketing spend at 19.2%. The second highest category was brand building at 9.4%

YOY SPEND OF TOP HOSPITAL GROUPS
2010 2011 2012 2013 2014 Adventist Health $ 526,787.00 $ 605,545.00 $ 637,771.00 $ 995,066.00 $ 738,410.00 Ascension Health $ 1,199,963.00 $ 1,420,780.00 $ 2,231,881.00 $ 3,236,077.00 $ 6,698,400.00 CHE Trinity Inc $ 2,664,480.00 $ 4,067,343.00 $ 10,170,997.00 $ 9,661,722.00 $ 2,845,069.00 Community Health Systems Inc $ 1,080,008.00 $ 1,296,389.00 $ 1,029,413.00 $ 1,048,420.00 $ 1,328,186.00 Dignity Health $ 1,188,884.00 $ 951,679.00 $ 3,151,357.00 $ 11,917,507.00 $ 11,328,573.00 Kaiser Permanente $ 4,750,141.00 $ 5,985,530.00 $ 7,238,948.00 $ 8,257,192.00 $ 10,844,577.00 Lifepoint Hospitals Inc $ 7,107.00 $ 46,599.00 $ 128,987.00 $ 247,735.00 $ 340,090.00 Mayo Clinic $ 1,741,699.00 $ 4,321,953.00 $ 3,488,622.00 $ 3,528,775.00 $ 9,916,411.00 Tenet Healthcare Corp $ 4,842,855.00 $ 6,166,062.00 $ 4,338,390.00 $ 4,744,689.00 $ 5,440,718.00 Universal Health Services Inc $ 1,938,224.00 $ 1,987,410.00 $ 2,050,203.00 $ 2,670,105.00 $ 2,550,529.00 TOTAL $ 19,940,148.00 $ 26,849,290.00 $ 34,466,569.00 $ 46,307,288.00 $ 52,030,963.00

SPEND BY MEDIUM OF TOP HOSPITAL GROUPS
2010 VS 2014
**Note: Kantar did not track spend data for online video prior to 2012
*Note: Data is representative of 10 hospital groups displayed in the previous slide
TV 31%
Print 28%
Radio 0%
Internet Display 6%
Internet Search 3%
Outdoor 32%
2010
TV 26%
Print 13%
Radio 15%
Internet Display 19%
Online Video 1%
Internet Search 6%
Outdoor 20%
2014
Leading hospital groups are adopting digital tactics at a quicker rate. In 2010 9% of their spend was digital and in 2014, 26% of their spend was digital.

MARKETING OPPORTUNITIES

2000+ AGENCIES
6,000+ BRANDS
50,000+ CAMPAIGNS
Centro has supported 500+ healthcare organizations in the past 2 years.

• Top trusted local news & broadcast sites
• Geo-targeted banner & mobile ads
• Homepage take-overs, display, video, mobile
LOCAL AND ENDEMIC
• Sight + sound across variety of screens: desktop, mobile, tablet, digital place based, connected TV
• TV retargeting based on demo, daypart, location, weather, device, carrier, and behavioral
VIDEO AND AUDIO
• Reach consumers on-the-go with mobile, during work/leisure time with tablet
• Use geo-fencing to pinpoint exact location of consumer and enable conquest strategies
MOBILE AND TABLET
• Target consumers currently in-market for a healthcare provider
• Target based on insurance coverage
• Use Nielsen and Neustar for more defined audience targeting
PROGRAMMATIC
DIGITAL OPPORTUNITIES

SAMPLE HEALTHCARE
CONSUMER PROFILE

“My family is the most important thing in my life and knowing that we are all healthy means a lot to me. The internet has made it easier than ever to be sure we’re
getting quality care. I use my mobile device to research hospitals and medical centers, and read their reviews at
home or on-the-go. I’ve also used social media to get the opinions on doctors and facilities of my friends and
relatives. When it comes to my family’s health I won’t trust just anyone.”
Adults 25-54
Female skew (index 105)
56% are parents (index 178)
50% have graduated college or higher (index 176)
HHI $50k+
Has visited any doctor in the last 12 months
Has medical insurance
83% are Caucasian (index 109)
11% are Hispanic
8% are African American
4% are Asian (index 131)
HEALTHCARE CONSUMER
WHAT MATTERS TO ME
“I value services that are quality and can fit into my lifestyle, especially with healthcare.”
If a product is made by a company I trust, I’ll buy it
even if it is more expensive. (index 102)
Spending time with my family is my top priority.
(index 113)
I often use the internet to obtain medical
information. (index 140)
Juggling work and family demands is very
stressful for me. (index 111)
I am so busy, I often can’t finish everything I
need to do in a day (index 121)
My children and spouse have a significant impact on the brands I choose.
(index 105)
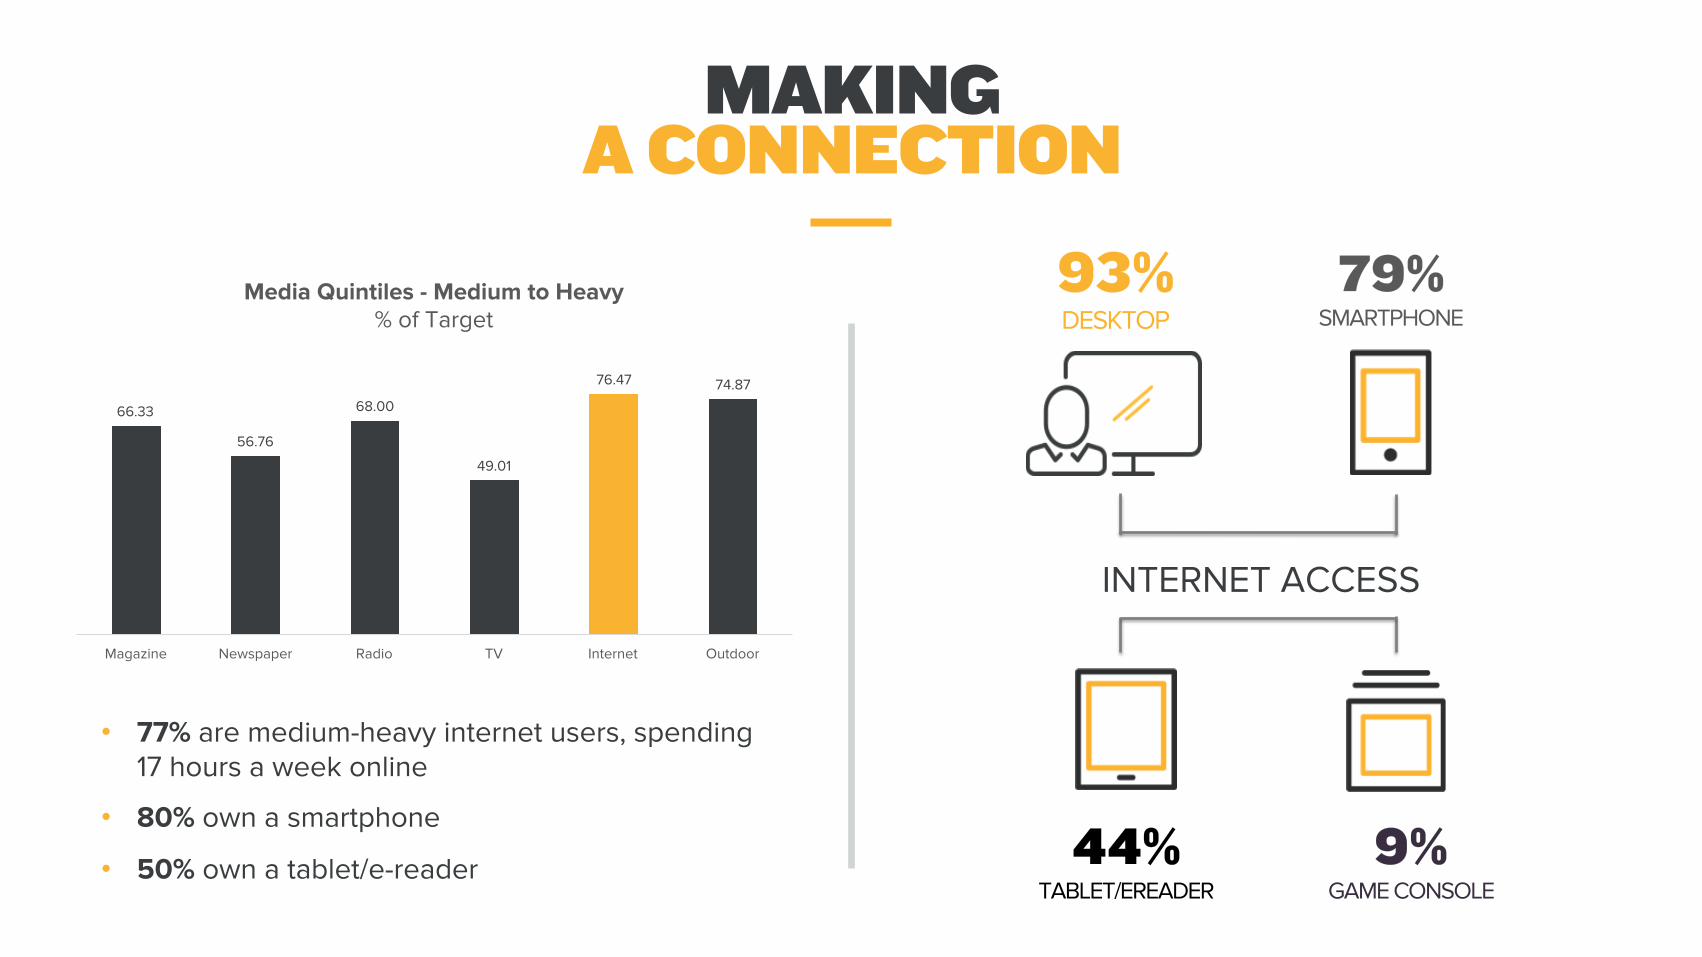
66.33
56.76
68.00
49.01
76.47 74.87
Magazine Newspaper Radio TV Internet Outdoor
Media Quintiles - Medium to Heavy % of Target
MAKING A CONNECTION
• 77% are medium-heavy internet users, spending 17 hours a week online
• 80% own a smartphone
• 50% own a tablet/e-reader
INTERNET ACCESS
44% TABLET/EREADER
9% GAME CONSOLE
93% DESKTOP
79% SMARTPHONE

92% used Google in the last 30 days
24% used Bing in the
last 30 days
64% used search engines on their mobile phone
41% used Yahoo! in the
last 30 days
SEARCH
20% are mobile ad and app happy
58% used apps
40% listen to music
53% visit a website for news
14% use health/fitness apps
MOBILE
44% watched a video on social media
20% watched a video on their
mobile phone
18% watched a movie online
11% uploaded video to social media
VIDEO
85% used a social network in the last 30 days
47% used social networks on
their mobile phone
42% posted that they like something
43% posted a picture
SOCIAL
DIGITAL MEDIA CONSUMPTION

48% go to the doctor regularly for checkups
29% are always looking for new ways to live a healthier life
23% say medication has improved their quality of life
66% agree that doctor knows best
After seeing a healthcare ad:
9% have made an appointment to see a doctor (index 127)
7% have visited a product or drug website (index 159)
4% discussed the ad with a friend or family member (index 127)
In the last 12 months:
55% have visited a general/family practitioner (index 133)
28% have visited an OBGYN (index 181)
15% have visited a pediatrician (index 227)
HEALTH ATTITUDES & BEHAVIORS
GET TO KNOW YOUR PATIENTS

THANK YOU.