Centre for Health Systems and Safety Research Examination of changes in pathology tests ordered by...
20
Centre for Health Systems and Safety Research Examination of changes in pathology tests ordered by Diagnosis-Related Group (DRGs) following CPOE introduction E Vecellio 1 , A Georgiou 1 , G Toouli 1 , A Eigenstetter 2 , L Li 1 , R Wilson 2 , JI Westbrook 1 1 Centre for Health Systems and Safety Research, University of New South Wales, Sydney, NSW 2 South Eastern Area Laboratory Services, Prince of Wales Hospital, Sydney, NSW
-
Upload
samantha-harper -
Category
Documents
-
view
214 -
download
0
Transcript of Centre for Health Systems and Safety Research Examination of changes in pathology tests ordered by...

Centre for Health Systems and Safety Research
Examination of changes in pathology tests ordered by Diagnosis-Related Group (DRGs) following CPOE introduction
E Vecellio 1, A Georgiou 1, G Toouli 1, A Eigenstetter 2, L Li 1, R Wilson 2, JI Westbrook 1
1 Centre for Health Systems and Safety Research, University of New South Wales, Sydney, NSW2 South Eastern Area Laboratory Services, Prince of Wales Hospital, Sydney, NSW
Research Areas
Background
• Too many tests?
• Too few tests?
• The ‘just right’ number of tests?
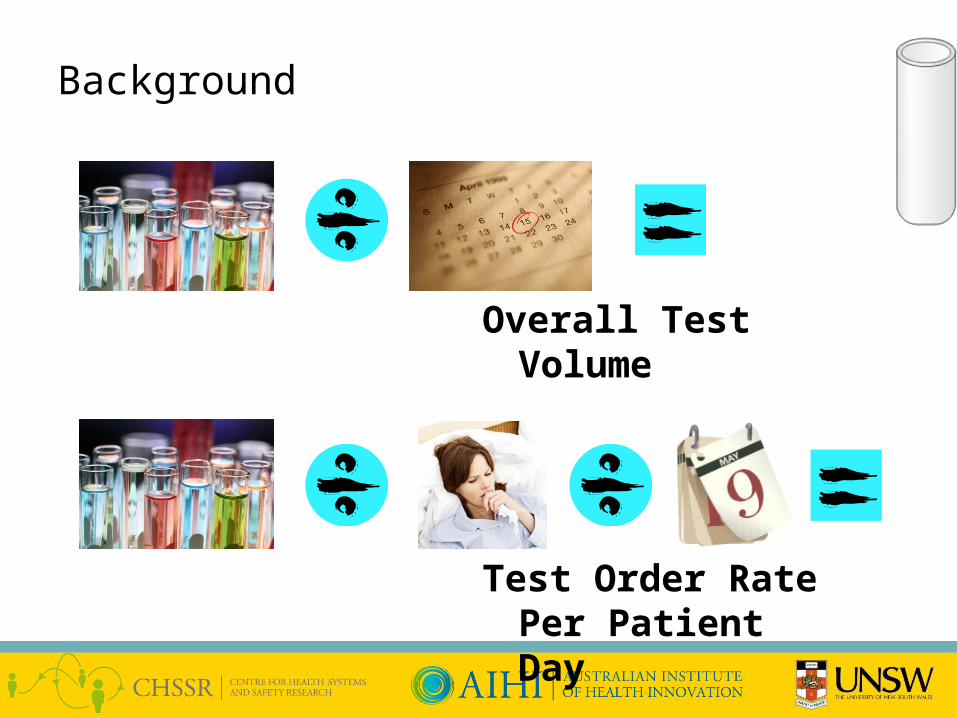
Background
Overall Test Volume
Test Order Rate Per Patient Day
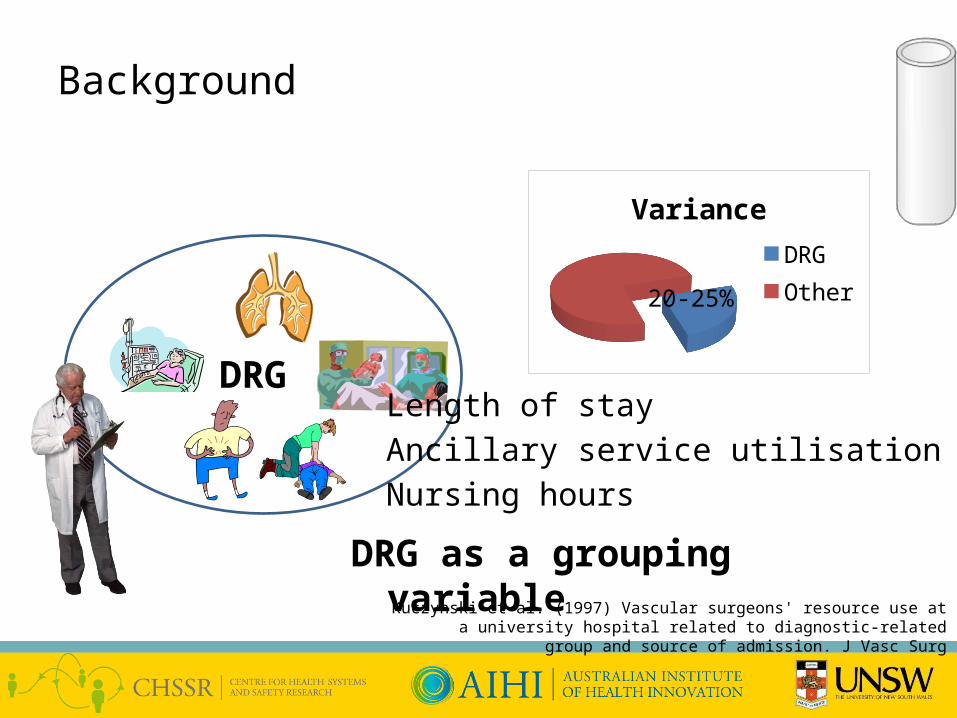
Background
DRG as a grouping variable
DRG
Variance
DRGOther
Length of stay
Ancillary service utilisation
Nursing hours
Kuczynski et al. (1997) Vascular surgeons' resource use at a university hospital related to diagnostic-related group and source of admission. J Vasc Surg
20-25%
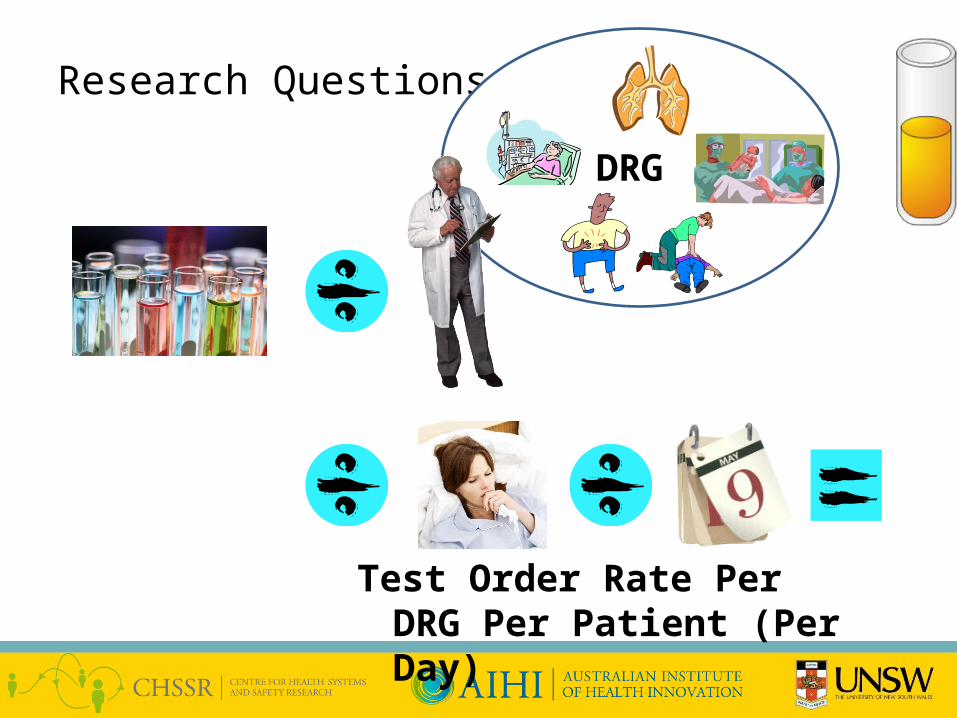
Research Questions
Test Order Rate Per DRG Per Patient (Per Day)
DRG

Research Questions
Monitor test volume during the implementation of EMR
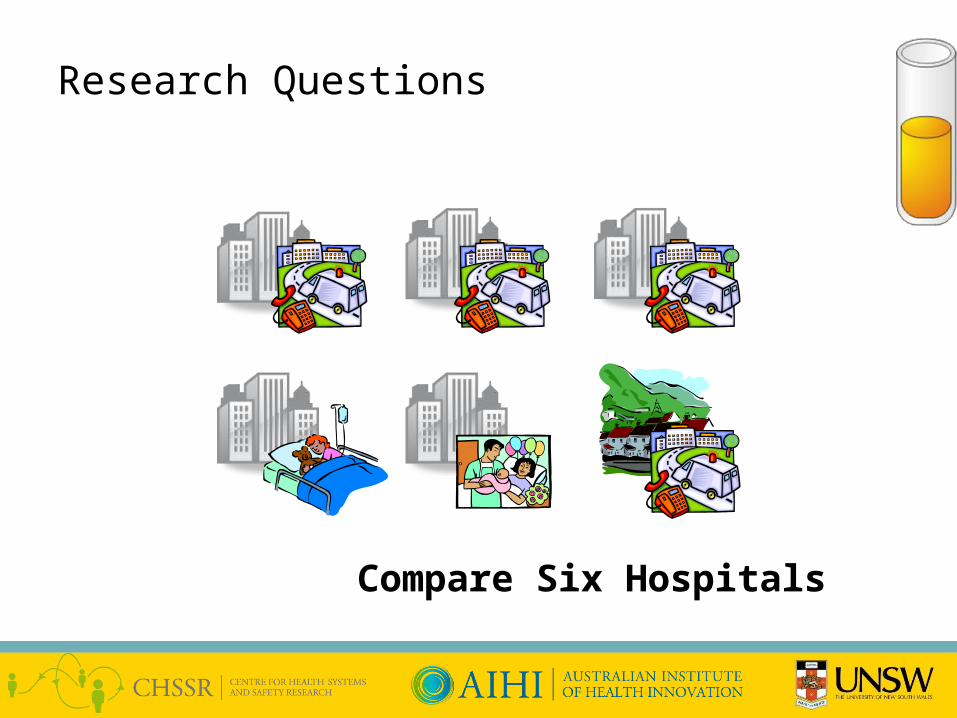
Research Questions
Compare Six Hospitals
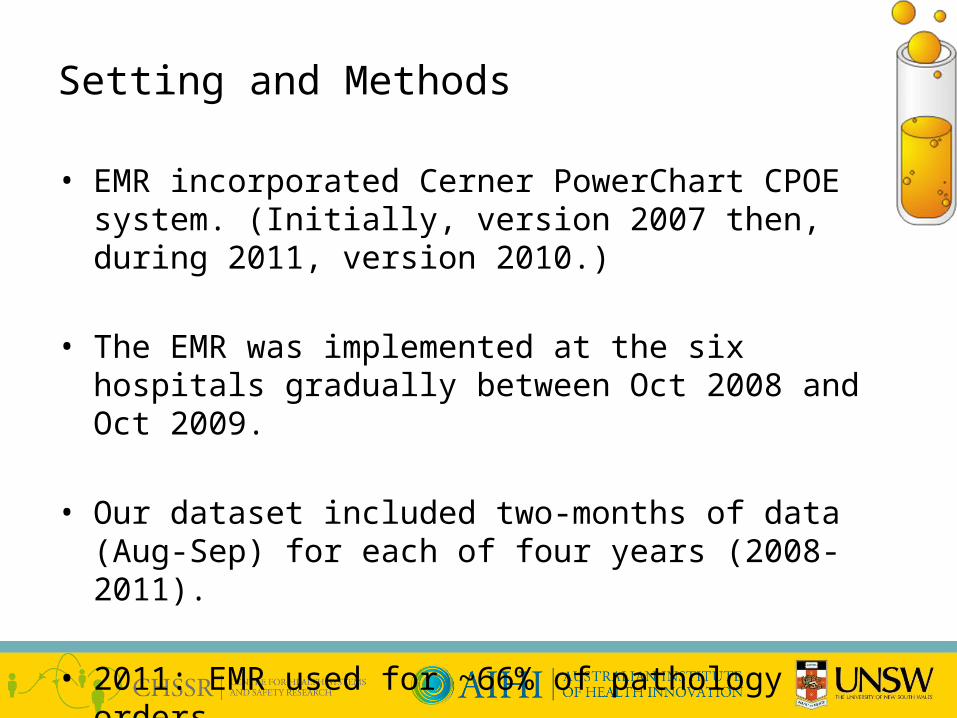
• EMR incorporated Cerner PowerChart CPOE system. (Initially, version 2007 then, during 2011, version 2010.)
• The EMR was implemented at the six hospitals gradually between Oct 2008 and Oct 2009.
• Our dataset included two-months of data (Aug-Sep) for each of four years (2008-2011).
• 2011: EMR used for ~66% of pathology orders
Setting and Methods
Data Linkage
Image: FreeDigitalPhotos.net renjith krishnan
Data Linkage
Image: FreeDigitalPhotos.net renjith krishnan
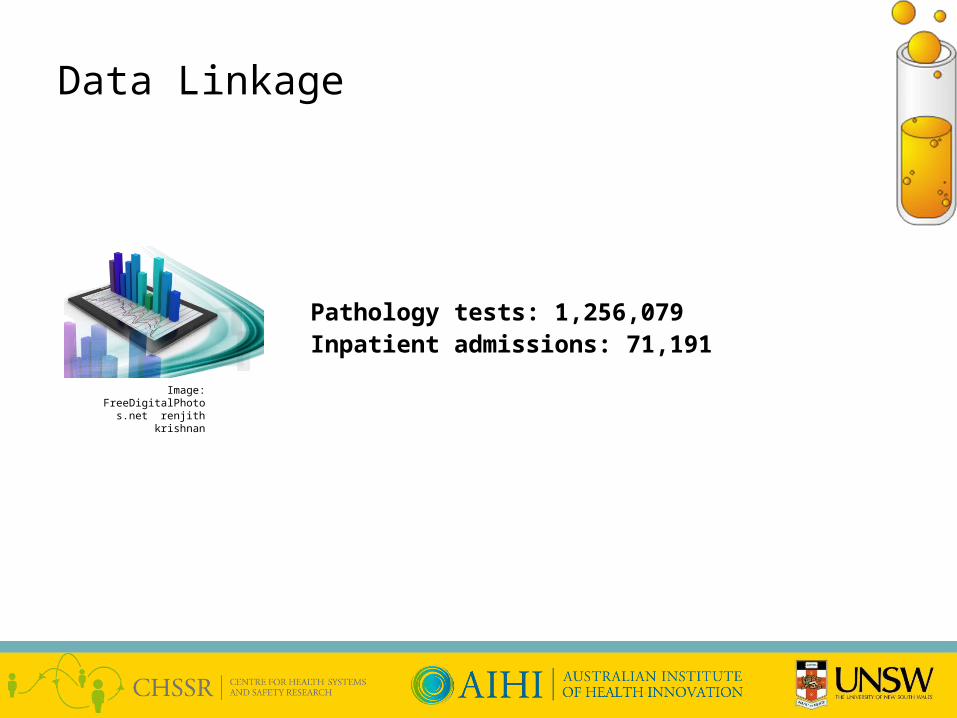
Pathology tests: 1,256,079Inpatient admissions: 71,191
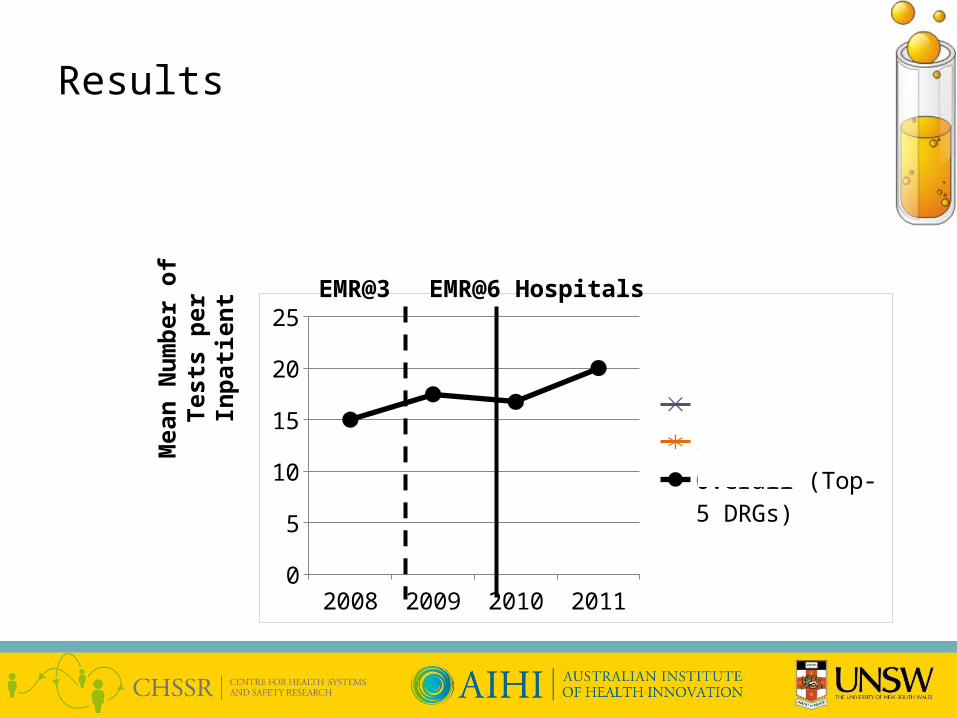
Results
2008 2009 2010 20110
5
10
15
20
25
Series1Series2Overall (Top-5 DRGs)
Mea
n N
um
ber
of
Test
s p
er I
np
atie
nt
EMR@6 HospitalsEMR@3
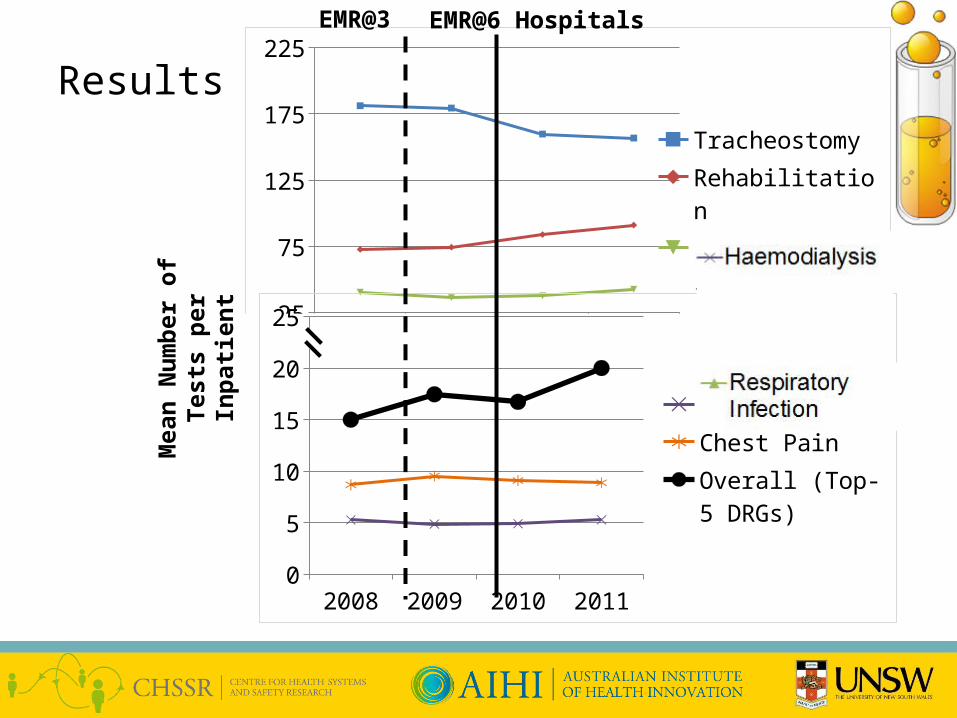
2008 2009 2010 201125
75
125
175
225
TracheostomyRehabilitationRespiratory Infec-tion
Results
2008 2009 2010 20110
5
10
15
20
25
HaemodialysisChest PainOverall (Top-5 DRGs)
Mea
n N
um
ber
of
Test
s p
er I
np
atie
nt
EMR@6 HospitalsEMR@3
Research Questions
Compare Four EDsDRG: Chest Pain (F74Z)
Image: FreeDigitalPhotos.net / nokhoog_buchachon
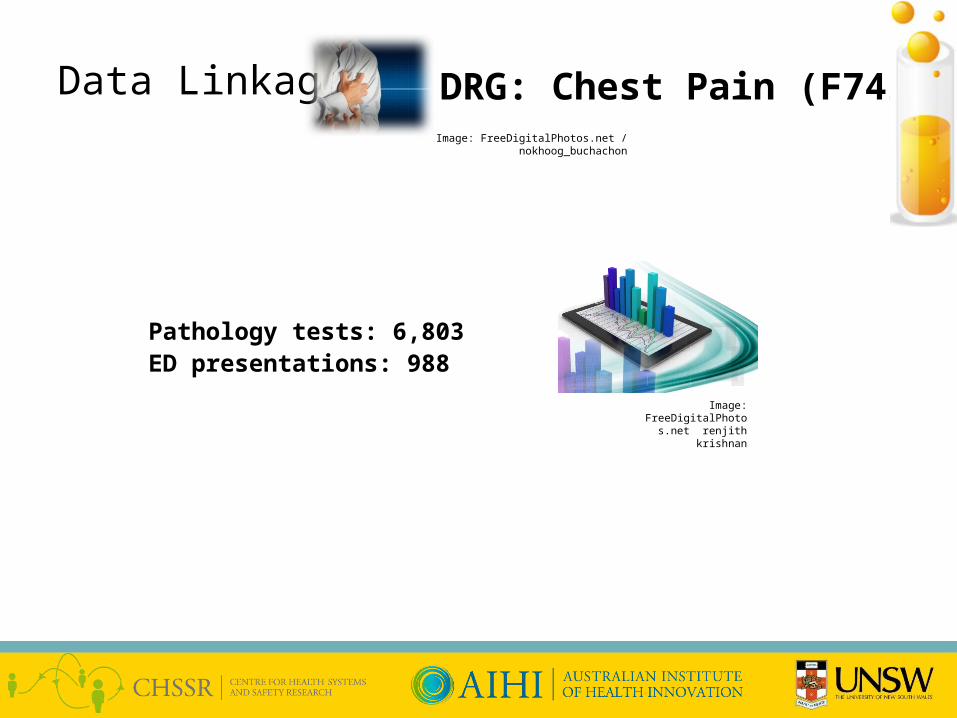
Data Linkage
Image: FreeDigitalPhotos.net renjith krishnan
Pathology tests: 6,803ED presentations: 988
DRG: Chest Pain (F74Z)Image: FreeDigitalPhotos.net / nokhoog_buchachon
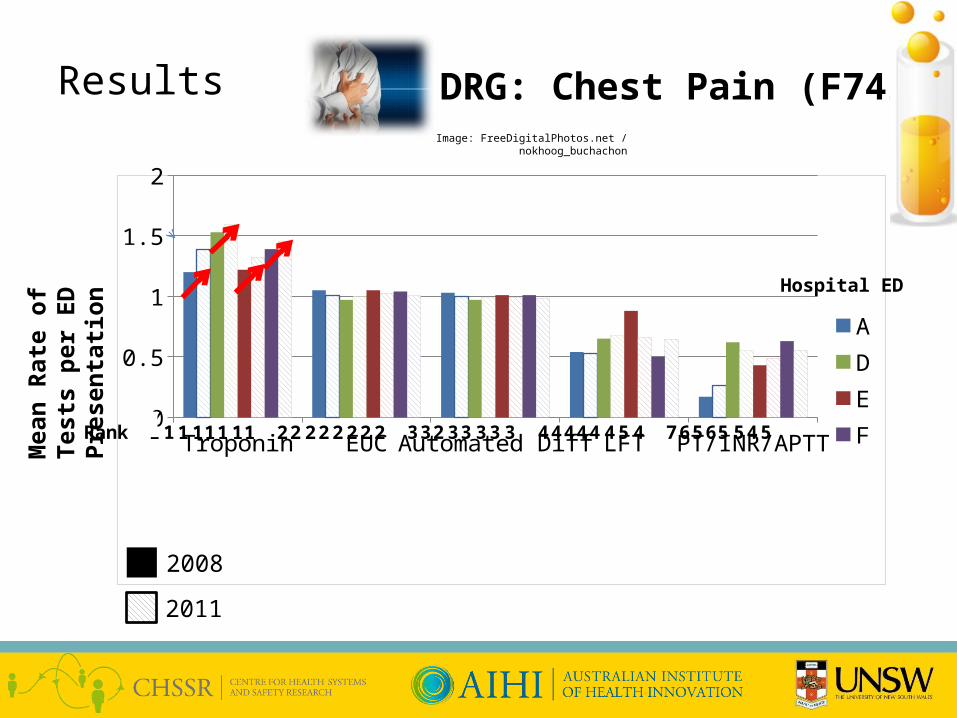
ResultsM
ean
Rat
e o
f Te
sts
per
ED
P
rese
nta
tio
n
Troponin EUC Automated Diff
LFT PT/INR/
APTT
00.20.40.60.8
11.21.41.61.8
ADEF1 1 1 11 1 11 2 2 2 22 2 2 2 3 32 33 3 3 3 4 44 44 4 5 4 7 65 56 4 55
Hospital ED
Rank
2008
2011
DRG: Chest Pain (F74Z)Image: FreeDigitalPhotos.net / nokhoog_buchachon
So, what does it mean?
Thank You
This project was funded by a grant from:
Australian Government
Department of Health and Ageing,
Quality Use of Pathology Program.
Email: [email protected]
www.aihi.unsw.edu.au
Centre for Health Systems and Safety Research
Examination of changes in pathology tests ordered by Diagnosis-Related Group (DRGs) following CPOE introduction
E Vecellio 1, A Georgiou 1, G Toouli 1, A Eigenstetter 2, L Li 1, R Wilson 2, JI Westbrook 1
1 Centre for Health Systems and Safety Research, University of New South Wales, Sydney, NSW2 South Eastern Area Laboratory Services, Prince of Wales Hospital, Sydney, NSW
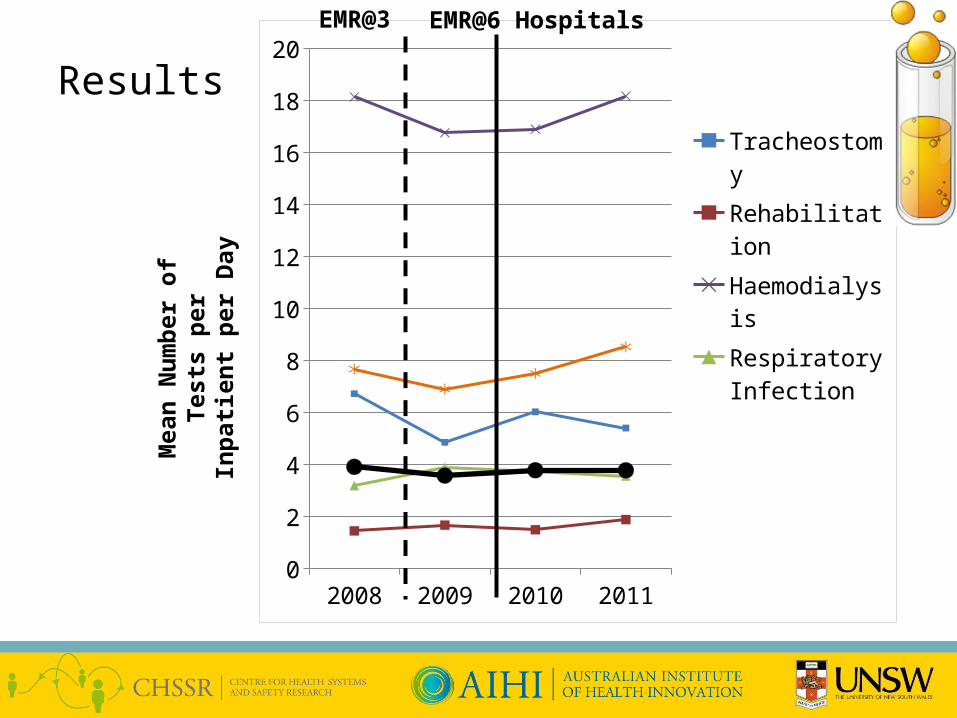
Results
2008 2009 2010 20110
2
4
6
8
10
12
14
16
18
20
Tracheostomy
Rehabilitation
Haemodialysis
Respiratory In-fection
Chest Pain
Overall (Top-5 DRGs)
Mea
n N
um
ber
of
Test
s p
er I
np
atie
nt
per
Day
EMR@6 HospitalsEMR@3