Centre for Economic Performance, London School of ...
74
econstor Make Your Publications Visible. A Service of zbw Leibniz-Informationszentrum Wirtschaft Leibniz Information Centre for Economics Disney, Richard; Gathergood, John; Machin, Stephen; Sandi, Matteo Working Paper Does homeownership reduce crime? A radical housing reform from the UK CFS Working Paper Series, No. 651 Provided in Cooperation with: Center for Financial Studies (CFS), Goethe University Frankfurt Suggested Citation: Disney, Richard; Gathergood, John; Machin, Stephen; Sandi, Matteo (2020) : Does homeownership reduce crime? A radical housing reform from the UK, CFS Working Paper Series, No. 651, Goethe University Frankfurt, Center for Financial Studies (CFS), Frankfurt a. M., http://nbn-resolving.de/urn:nbn:de:hebis:30:3-573897 This Version is available at: http://hdl.handle.net/10419/229160 Standard-Nutzungsbedingungen: Die Dokumente auf EconStor dürfen zu eigenen wissenschaftlichen Zwecken und zum Privatgebrauch gespeichert und kopiert werden. Sie dürfen die Dokumente nicht für öffentliche oder kommerzielle Zwecke vervielfältigen, öffentlich ausstellen, öffentlich zugänglich machen, vertreiben oder anderweitig nutzen. Sofern die Verfasser die Dokumente unter Open-Content-Lizenzen (insbesondere CC-Lizenzen) zur Verfügung gestellt haben sollten, gelten abweichend von diesen Nutzungsbedingungen die in der dort genannten Lizenz gewährten Nutzungsrechte. Terms of use: Documents in EconStor may be saved and copied for your personal and scholarly purposes. You are not to copy documents for public or commercial purposes, to exhibit the documents publicly, to make them publicly available on the internet, or to distribute or otherwise use the documents in public. If the documents have been made available under an Open Content Licence (especially Creative Commons Licences), you may exercise further usage rights as specified in the indicated licence. www.econstor.eu
Transcript of Centre for Economic Performance, London School of ...

econstorMake Your Publications Visible
A Service of
zbwLeibniz-InformationszentrumWirtschaftLeibniz Information Centrefor Economics
Disney Richard Gathergood John Machin Stephen Sandi Matteo
Working Paper
Does homeownership reduce crime A radicalhousing reform from the UK
CFS Working Paper Series No 651
Provided in Cooperation withCenter for Financial Studies (CFS) Goethe University Frankfurt
Suggested Citation Disney Richard Gathergood John Machin Stephen Sandi Matteo(2020) Does homeownership reduce crime A radical housing reform from the UK CFSWorking Paper Series No 651 Goethe University Frankfurt Center for Financial Studies(CFS) Frankfurt a Mhttpnbn-resolvingdeurnnbndehebis303-573897
This Version is available athttphdlhandlenet10419229160
Standard-Nutzungsbedingungen
Die Dokumente auf EconStor duumlrfen zu eigenen wissenschaftlichenZwecken und zum Privatgebrauch gespeichert und kopiert werden
Sie duumlrfen die Dokumente nicht fuumlr oumlffentliche oder kommerzielleZwecke vervielfaumlltigen oumlffentlich ausstellen oumlffentlich zugaumlnglichmachen vertreiben oder anderweitig nutzen
Sofern die Verfasser die Dokumente unter Open-Content-Lizenzen(insbesondere CC-Lizenzen) zur Verfuumlgung gestellt haben solltengelten abweichend von diesen Nutzungsbedingungen die in der dortgenannten Lizenz gewaumlhrten Nutzungsrechte
Terms of use
Documents in EconStor may be saved and copied for yourpersonal and scholarly purposes
You are not to copy documents for public or commercialpurposes to exhibit the documents publicly to make thempublicly available on the internet or to distribute or otherwiseuse the documents in public
If the documents have been made available under an OpenContent Licence (especially Creative Commons Licences) youmay exercise further usage rights as specified in the indicatedlicence
wwweconstoreu
No 651
Richard Disney John Gathergood Stephen Machin and Matteo Sandi
Does Homeownership Reduce Crime A Radical Housing Reform from the UK
The CFS Working Paper Series
presents ongoing research on selected topics in the fields of money banking and finance The papers are circulated to encourage discussion and comment Any opinions expressed in CFS Working Papers are those of the author(s) and not of the CFS The Center for Financial Studies located in Goethe University Frankfurtrsquos House of Finance conducts independent and internationally oriented research in important areas of Finance It serves as a forum for dialogue between academia policy-making institutions and the financial industry It offers a platform for top-level fundamental research as well as applied research relevant for the financial sector in Europe CFS is funded by the non-profit-organization Gesellschaft fuumlr Kapitalmarktforschung eV (GfK) Established in 1967 and closely affiliated with the University of Frankfurt it provides a strong link between the financial community and academia GfK members comprise major players in Germanyrsquos financial industry The funding institutions do not give prior review to CFS publications nor do they necessarily share the views expressed therein
Does Homeownership Reduce Crime
A Radical Housing Reform from the UK
Richard Disney John Gathergooddagger Stephen Machinsect and Matteo SandiDagger
September 2020
Centre for Economic Performance London School of Economics Institute for Fiscal Studies and University of Sussex
dagger School of Economics University of Nottingham sect Department of Economics and Centre for Economic Performance London School of
Economics Dagger Centre for Economic Performance London School of Economics
Abstract ldquoRight to Buyrdquo (RTB) a large-scale natural experiment by which incumbent tenants in public housing could buy properties at heavily-subsidised prices increased the UK homeownership rate by over 10 percentage points between 1980 and the late 1990s This paper studies its impact on crime showing that RTB generated significant reductions in property and violent crime that persist up to today The behavioural changes of incumbent tenants and the renovation of public properties were the main drivers of the crime reduction This is evidence of a novel means by which subsidised homeownership and housing policy may contribute to reduce criminality
JEL keywords Crime Homeownership Public Housing JEL classifications H44 K14 R31
Acknowledgements We should like to thank the Chartered Institute of Public Finance and Accounting (CIPFA) for guidance and enabling us to access council house stock and sales data Useful comments on earlier drafts of the paper were received from Anna Bindler Steve Billings Chris Blattman Jennifer Doleac Ingrid Gould Ellen Paul Heaton Randi Hjalmarsson Steve Ross Kevin Schnepel and seminar participants at the Centre for Economic Performance at the London School of Economics the University of Sussex the Online Seminar Series on the Economics of Crime Summer 2020 and the NBER Summer Institute 2020
1
1 Introduction
In many countries crime is spatially concentrated in areas characterised by low incomes and
low rates of homeownership Localities with high rates of tenancy in public housing commonly
exhibit high crime rates and the UK is no exception This association between crime rates and
housing tenure arises not only because of differences in affluence between predominantly
public and private housing areas but also because residents in public housing have lower
incentives to maintain the security and upkeep of their property and to invest in neighbourhood
monitoring
Boosting homeownership is often viewed as a means of delivering benefits to
communities one of which is reduced crime Underlying this is the idea that when public
housing tenants take on ownership of their properties their incentives adjust as they experience
the positive private returns of crime-reducing investments (such as improving the security of
the home) which capitalize into house prices and therefore household wealth Generating an
understanding of the effects of homeownership on crime is therefore a first order research
question in the economics of crime
This paper provides a novel study of the impact of homeownership on crime by
examining a large-scale nationwide program of subsidised public housing sales to incumbent
tenants in the United Kingdom (UK) known as the ldquoRight to Buyrdquo policy (hereafter RTB) This
was established as one of the first legislative acts of the newly elected UK Conservative
government led by Margaret Thatcher in 1979 Through the RTB policy incumbent tenants in
publicly-owned ldquocouncil housingrdquo (housing built and owned by local public authorities and
rented to private tenants henceforth called ldquopublic housingrdquo) in the UK could purchase their
rented accommodation at heavily-subsidised prices1 The intention of the policy was to increase
the long-run homeownership rate with the underlying ethic of ldquoan Englishmanrsquos home is his
castlerdquo It was heralded by the Conservative government as a means of improving local
amenities and generating upward social mobility by giving citizens control over their housing
and access to housing wealth2
1 The terms ldquocouncil housingrdquo and ldquosocial housingrdquo indicate public housing in the UK Public housing in the United Kingdom is managed in local jurisdictions by councils ndash hence the term for public housing is ldquocouncil housingrdquo in the UK There are also social housing tenancies provided by co-operatives and local housing associations rather than private homeowners A limited form of tenancy purchase of such properties was introduced in the 2000s under the policy ldquoRight to Acquirerdquo 2 In a speech delivered to the National Housebuilding Council in December 1984 Margaret Thatcher stated ldquoSpreading the ownership of property more widely is central to this Governments philosophy It is central
2
The RTB policy had a significant impact on housing tenure as it dramatically changed
the ownership composition of housing in the country It was largely responsible for an increase
in the UK homeownership rate from around 60 in 1979 to over 70 in the early 2000s
Specifically whereas around 32 of dwellings in the UK were publicly-owned in 1979
totalling some 62 million properties by the early 2000s around 28 million of these properties
had been sold to their tenants (Jones and Murie 2006) Although an innovative and large scale
policy RTB has until recently been little analysed (but see Disney and Luo 2017) Analysis
of RTB is useful to derive policy prescriptions that extend beyond the UK as the RTB scheme
shares many of the same characteristics as reforms implemented in Israel (eg Hausman
Ramot-Nyska and Zussman 2020) Sweden (Sodini Van Nieuwerburgh Vestman and Von
Lilienfeld-Toal 2017) and multiple post-Communist countries
This paper studies the causal impact of the RTB policy on local crime rates The
empirical analysis uses large-scale data from all regions in England and Wales from the early
1970s to the late 2010s in order to utilise the RTB policy as a nationwide policy experiment3
The bulk of public house sales occurred in the 1980s and area-level sales of public housing
were matched to crime data over several decades to estimate both the short-run and long run
effects of homeownership on crime The analysis shows that the large movements in housing
tenures induced by the RTB led to lasting falls in crime rates for certain types of crime
An important contribution of this study is to document the mechanism behind the crime-
reducing effect of sales of public housing in local areas It shows that the reduction in crime
rates was driven primarily by behavioural changes within the local community rather than a
lsquoreshufflingrsquo of households between low and high crime areas which might have had a smaller
effect on overall crime This is in contrast to the focus of many recent studies of the crime-
reducing effect of gentrification (eg Autor Palmer and Pathak 2019) whereby changes in
the composition of households induced by inward and outward migration are thought to explain
local trends in crime rates Our study thereby reveals a novel means not documented to date
by which subsidised homeownership and housing policy may have contributed to the decline
because where property is widely owned freedom flourishes Since we took office in 1979 17 million more people have come to own their homes mdash 17 million more sole kings upon their own sole ground That increase is one of our proudest achievementshellip But a house is more than this It is a symbol of security and a stake in the future People who own houses do so not just for themselves but for their children They do so as members of a responsible society mdash proud of the heritage derived from the past glad to care for it and eager to give the next generation a bit of capital to give them a startrdquo (See httpswwwmargaretthatcherorgdocument105815) 3 The analysis covers only England and Wales owing to a need for comparable crime data which is not available for Scotland and Northern Ireland
3
in crime in the United States and other Western economies in the 1990s and early 2000s (see
Van Dijk and Vollaard 2012)
The RTB experiment provides a unique opportunity both to assess the effectiveness of
selling public housing to grant homeownership rights to families in public housing and to
measure the causal impact of sales of public housing on crime outcomes From the perspective
of a policy maker designing a policy that would alter homeownership rights for the general
population the parameters estimated here are directly of interest4 As such this study
complements the literature that has examined neighbourhood effects on crime by exploiting
the variation in residential locations induced by the Moving To Opportunity (MTO) experiment
in the United States and by other housing policy initiatives in Western economies5
The study of the causal impact of homeownership on crime exploits the unfolding of
the RTB policy and it is investigated separately in the short-run and in the long-run To estimate
the short-run impact of the RTB policy on crime difference-in-differences specifications
exploit the differential intention-to-treat (ITT) effect of the RTB policy across localities RTB
was introduced as a national policy but the intensity of treatment across localities varied with
the predetermined length of tenure duration of incumbent tenants in public housing We explain
how these differences in average tenures across localities arose in the later part of Section 2
Tenure duration determined access to the policy with a minimum tenure duration requirement
of three years together with larger purchase price discounts for those with longer tenures
Variations in the length of tenure duration in public housing at the start of the RTB policy are
shown to be unrelated with other local area socio-economic circumstances such as
unemployment wages fraction of juveniles and fraction of public housing they arise from
historical locality-specific factors and this variation is a key part of the research design
Estimates reveal sizeable negative short-run effects of increased incidence of RTB sales
of public housing on crime The crime reduction appears sizeable since the early 1980s and it
remains visible in the late 1980s and early 1990s until the end of the Thatcher era These short-
run estimates uncover an elasticity of crime with respect to RTB incidence of roughly -03 so
4 Homeownership is likely to have important implications also for intergenerational mobility a link that until recently has been little analysed (see Blanden and Machin 2017 and Bell Blundell and Machin 2018) 5 See eg Katz Kling and Liebman (2001) Ludwig Duncan and Hirschfield (2001) Kling Ludwig and Katz (2005) Ludwig and Kling (2007) Kling Liebman and Katz (2007) Sanbonmatsu Ludwig Katz Gennetian Duncan Kessler Adam McDade and Lindau (2011) Ludwig Duncan Gennetian Katz Kessler Kling and Sanbonmatsu (2013) Sciandra Sanbonmatsu Duncan Gennetian Katz Kessler Kling and Ludwig (2013) Damm and Dustmann (2014) Bernasco de Graaf Rouwendal and Steenbeek (2017) and Rotger and Galster (2019)
4
that a 10 percent increase in incidence of RTB public housing sales reduces crime by around 3
percent This conclusion is robust to a battery of additional tests including variations in the
specification of the econometric model We explain in later sections how we deal with the
obvious issue of feedback insofar as local crime rates may affect the willingness of public
tenants to exercise their right to purchase their public house through the RTB policy
The paper examines other potential mechanisms that could underlie the finding that
RTB purchases reduce crime rates These hypothesised channels include varying local area
circumstances local household compositional changes arising from the RTB policy and the
potential role of feet-dragging practices in certain localities arising from the political affiliation
of the local authorities responsible for administering the policy at the local level The findings
suggest that none of these factors explains the crime reduction generated by the RTB policy
The market value of the RTB sales at the onset of the scheme does not predict the evolution of
crime either suggesting that the crime reduction attributed to the RTB scheme is genuine and
it is not the spurious result of better amenities in areas with more RTB sales
By contrast the findings are strongly indicative of the likelihood that local communities
were induced to change their behaviour and attitudes towards criminal activity Indeed as
suggested in the quote by Margaret Thatcher cited previously this was one of the aims of the
RTB policy That is to give (generally) working class households access to an owned asset in
order to change their behaviour such as taking greater care of and improving the security of
their property and to change their economic position by giving these households a collateral
asset in financial markets Hence RTB was viewed as a mechanism for improving and
upgrading the economic position of households in neighbourhoods that had been previously
dominated by public housing
The analysis reveals that immediate reductions in crime resulted from the RTB policy
These are very unlikely to be attributable to in-migration as the rules of the RTB scheme
effectively barred resale of the RTB-purchased property for a fixed period after purchase We
show that crime rates were reduced immediately after the introduction of the policy and not
once the restraint on resale was no longer binding The analysis also shows that after
purchasing their properties from the local council incumbent ex-tenants started to gentrify their
properties by installing double locks on doors and windows by installing burglar alarms and
by purchasing insurance for their home contents Locality-specific estimates show that
incumbent tenants who bought under the RTB scheme experienced greater crime reduction in
counties in which the RTB scheme was associated with greater home improvement On the
5
other hand they did not become more likely to participate in a neighbourhood watch scheme
suggesting that the RTB policy did not generate detectable changes in social capital The
changing behaviour of incumbent ex-tenants resulting from RTB purchases did not result in
increased victimisation of neighbouring householders nor in a substitution of offenders away
from burglary towards other crimes Results indicate that the RTB policy led to significant
reductions in burglaries and robberies while theft and handling of stolen goods offences as
well as other violent crime offences remained unchanged
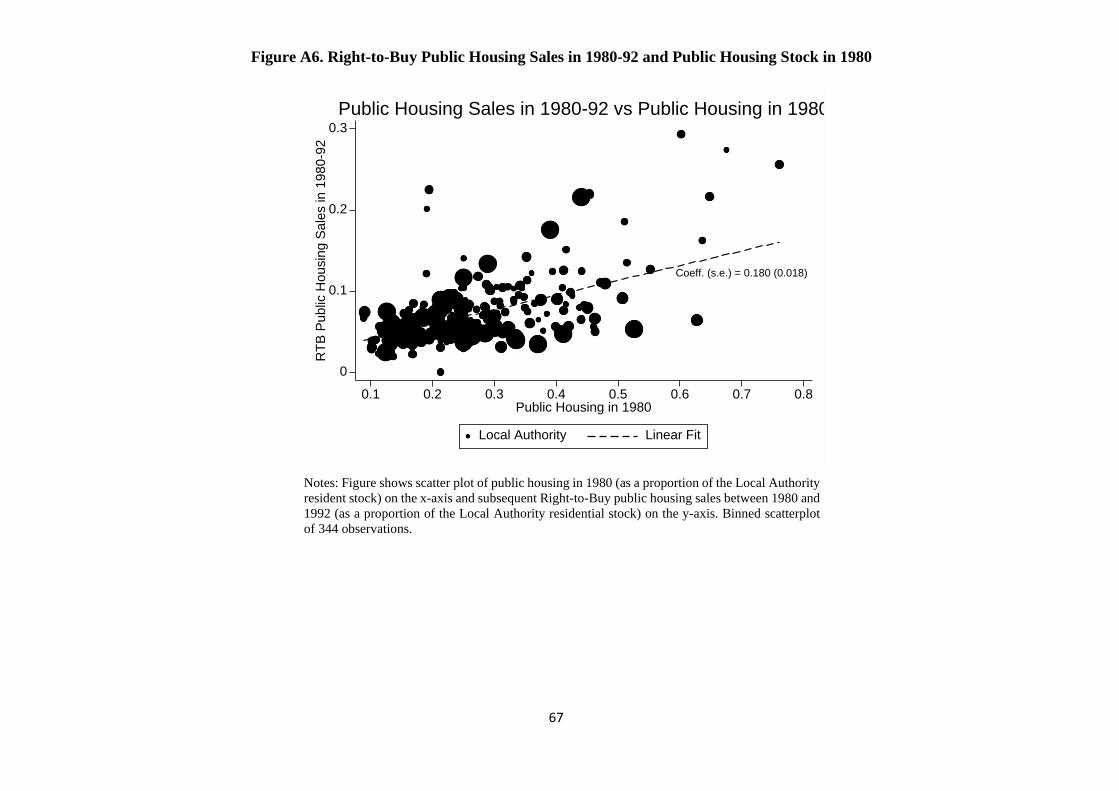
The paper next moves on to study the long-run persistence of the impact of the RTB
policy on crime To estimate the long-run crime effects of the RTB policy extended crime data
from 2003 to 2017 are used Instrumental variable regressions are used to quantify the effects
of public housing sales from 1980 to 1992 on the change in the crime rate from 2003 to 2017
Public housing sales are instrumented using variation in the initial public housing stock which
is a valid instrumental variable once the initial level of local crime and contemporaneous
community characteristics are controlled for In line with the short-run estimates long-run
estimates show that localities where the RTB policy triggered larger increases in
homeownership also experienced faster reductions in crime throughout the later period
Additional tests reveal that by 2017 these localities also experienced slower increases
in house prices In the standard definition gentrification arises as middle-class salary earners
displace lower income or unwaged households as a result of rising house prices In the case of
tenure changes induced by RTB sales the long time horizon of this research is required to
identify displacement since it takes time before RTB purchasers who are ex-tenants move on
sell or rent out their properties allowing other households to move into the neighbourhood
However the reduced growth in house prices documented here in areas of high RTB sales is
inconsistent with the standard gentrification story and suggests that the supply-side shock of
low-quality properties entering the housing market induced by the RTB policy outweighed any
displacement of original tenants There is also a political response as by 2017 Conservative
votes increased more rapidly in localities most affected by the RTB scheme This further points
towards RTB resulting in changing attitudes and behaviour of local communities
The rest of the paper is structured as follows Section 2 outlines the relevant literature
and describes the RTB policy In doing so it seeks to emphasise the scale of public housing in
the UK by 1980 (in comparison to say the United States) and to explain why the spatial
distribution of public housing does not simply map into low income areas at the start of the
RTB policy Data sources are described in Section 3 and the empirical analysis is presented in
6
Section 4 Finally section 5 provides a concluding discussion including an important word of
caution in assessing the overall merits of the RTB policy
2 Housing and Crime
i Previous literature
A large spatial crime literature shows that crime rates especially crimes against property are
higher in areas with high concentrations of public housing even when controlling for other
salient characteristics of the resident population This has been a major driver of policy in the
United States towards the replacement of inner city public housing projects by rent subsidies
and by shifting tenants to mixed-tenure low housing density urban neighbourhoods (see for
example Schill 1993 Olsen 2003 and Kling Ludwig and Katz 2005) A similar association
between crime and public housing has been observed in the UK (Murie 1997) More broadly
studies show that increased local homeownership rates are associated with a range of spillover
effects on the locality such as lower crime rates greater civic involvement and improved child
development (see for example DiPasquale and Glaeser 1999 and Haurin Dietz and
Weinberg 2003)
A well-known difficulty in the large literature on housing tenure type household
composition and crime is the range of feedback effects which suggest a number of channels
exist by which crime affects the composition of neighbourhoods and vice versa Cullen and
Levitt (1999) is one of a number of studies that suggest that higher rates of crime especially in
inner cities led to changes in neighbourhood composition by social class and economic status
Much of this literature on the lsquoflight to the suburbsrsquo took place against the backdrop of rising
crime in inner cities in the United States in the 1990s It has been more challenging to show
that falling crime in both earlier and later periods has been the primary driver of the so-called
gentrification of inner city areas (contrast the findings of McDonald 1986 with Ellen Horn
and Reed 2017)
In addition there is robust evidence that higher crime is associated with lower property
values (see Gibbons 2004 for an illustration using data for London) and this feedback effect
will induce spatial equilibria of neighbourhood composition when account is taken of not just
crime rates but other neighbourhood (dis)amenities transport costs and so on For example
Owens Mioduszewski and Bates (2019) show that civil gang injunctions in Southern
California a common type of place-based crime control policy in the area led to approximately
a 3 decline of residential propertiesrsquo values from 2002 to 2015 reflecting individual
7
willingness-to-pay for the civil liberties affected by the injunction6 Morales-Mosquera (2019)
finds that police station openings generate localized crime reductions and housing value
increases in three major cities in Colombia
A large literature has addressed the basic identification problem of assessing
neighbourhood effects on crime by exploiting the variation in residential locations generated
by the Moving To Opportunity (MTO) experiment in the United States Starting in 1994 the
MTO experiment assigned housing vouchers via random lottery to thousands of public housing
residents with children in five cities in the United States to relocate to less-distressed areas
Exposure to violence and crime victimization in distressed areas were in fact key reasons for
low-income families to participate in the MTO experiment Katz Kling and Liebman (2001)
show that the MTO experiment improved childrenrsquos behaviour adult mental health and
perceived safety in treatment group families in Boston while also reducing exposure to
violence and crime victimization Similar findings emerge in Baltimore in the study of Ludwig
Duncan and Hirschfield (2001) who find that the MTO experiment led to a large reduction in
juvenile arrests for violent crimes and to some increase in property-crime arrests
Kling Ludwig and Katz (2005) document important gender differences in the impact
of the MTO experiment on crime While both property and violent crime decreased among
young women young men experienced a decrease in violent crime but also an increase in
property crime a few years after relocating to the new neighbourhood7 Ludwig and Kling
(2007) show the importance of racial segregation among other neighbourhood characteristics
in predicting youth violence while Kling Liebman and Katz (2007) document the beneficial
impact of the MTO experiment on the education risky behaviour and physical health of young
women As the opposite effects are found for young men their findings further suggest that
young men and women respond differently to similar new neighbourhood circumstances
Using more recent data Sanbonmatsu et al (2011) conclude that the MTO initiative
enhanced safety in treatment group families while Ludwig et al (2013) find gender differences
in the impact of the MTO experiment on risky behaviour and health of juveniles to persist 10-
15 years after the start of the experiment while finding no evidence of persistent reductions in
youth violence rates However Sciandra et al (2013) show little evidence of crime reductions
6 Grogger (2002) and Ridgeway Grogger Moyer and MacDonald (2018) are two earlier studies of the effects of gang injunctions on crime 7 The comparative advantage of juveniles relocated from disadvantaged backgrounds in exploiting the available property-crime opportunities in their new neighbourhoods and the different ways in which male and female juveniles respond to similar new neighbourhood circumstances help the authors rationalize these findings
8
in the long run as neighbourhood conditionsrsquo effects of MTO dissipate reflecting that crime is
more affected by contemporaneous neighbourhood circumstances than by past neighbourhood
circumstances8 To understand why low-income families remain segregated into high-poverty
areas Bergman et al (2020) randomly allocate housing vouchers to 430 recipient families with
a child in the Seattle and King County areas concluding that barriers in the housing search
process are a critical source of residential segregation by income
Our findings on homeownership also relate to Engelhardt et al (2010) who analyse an
experiment in Oklahoma that subsidised saving for down payments for homeownership among
a group of low-income individuals using Individual Development Accounts (IDA) with
randomly assigned treatment status In their setting the treatment is the offer of matching
funding to the IDA since only a fraction of those who were treated chose to take up the offer
and to undertake a purchase and of course these may not be a random group among the treated
They find only weak evidence that homeowners who benefited from the policy spent more
money on lsquocommunity-facingrsquo activities such as external improvements to their house or
involvement in civic events in the 30 months after the take-up of homeownership status
Recent studies have sought to estimate the effects of homeownership and gentrification
on crime focusing on neighbourhood composition effects of policy changes Aliprantis and
Hartley (2015) and Sandler (2017) examine the effect on local crime rates in Chicago when
20000 units of concentrated high-rise public housing were demolished over the period 1999
to 2011 Both studies albeit using slightly different methodologies track relocated individuals
to other neighbourhoods and they conclude that these demolitions led to a net reduction in
crime rates ndash primarily violent (gang-related) crime but also theft robbery and use of guns
Chyn (2018) shows the lasting beneficial effects of housing demolitions in Chicago on the
schooling professional and criminal trajectories of displaced individuals Autor Palmer and
Pathak (2019) examine the impact of the deregulation of rents in Cambridge Massachusetts
on local crime rates They hypothesize that rent deregulation raised property values and caused
a differential mix of households to locate across local neighbourhoods thereby
disproportionately reducing the rate of property crime in neighbourhoods that had previously
been subject to rent control They find a significant reduction in crime overall which was then
8 The MTO experiment of course affected also other dimensions of familiesrsquo and childrenrsquos lives Most notably it generated moderate improvements in school quality (Fryer and Katz 2013) as well as educational and economic benefits for young children including for young boys (Chetty Hendren and Katz 2016) Substantial exposure effects of neighbourhoods are also presented in Damm and Dustmann (2014) Bernasco de Graaf Rouwendal and Steenbeek (2017) Altonji and Mansfield (2018) Chetty and Hendren (2018a) Chetty and Hendren (2018b) Rotger and Galster (2019) and Aliprantis and Richter (forthcoming)
9
capitalised into higher property values9 In a related study Diamond and McQuade (2019)
document the crime-reducing effect of the Low Income Housing Tax Credit
Most of the studies that have examined the effects of gentrification on crime exploit
policy changes such as the lifting of rent controls and removal of public housing that led low-
income neighbourhoods to increasingly become middle-income neighbourhoods through
outward migration of low-income households and inward migration of higher-income
households Studies that have examined the impact on crime rates of moving tenants out of
public housing into the private sector in the United States and experiments that gave households
incentives to purchase properties are typically based on highly localised data and results are
obtained from relatively short time periods after implementation of the policy10
The main contribution of this study by contrast is to estimate the effect on local crime
rates of increasing homeownership of indigenous communities and to examine the extent to
which this induced behavioural change in these communities This is a novel means which has
not been documented to date and which complements the existing literature by which
homeownership and housing policy may contribute to reduce crime The RTB policy
constitutes an ideal policy experiment to study this and it is therefore exploited here using
large-scale data over multiple decades
ii Public Housing in England and Wales
The stock of public housing in England and Wales grew rapidly throughout the
twentieth century over the period from the end of World War I in 1918 until the start of the
Right-to-Buy policy in 1980 By 1980 public housing in England and Wales was more
extensive more heterogeneous and more spatially dispersed than in the United States11 These
spatial outcomes arose from the decisions to rebuild outside as well as within inner city areas
in turn stemming from the partially random distribution of war destruction and from the
differential application of planning restrictions across the UK12
9 A recent paper on the UK (Alonso Andrews and Jorda Gil 2019) suggests that crime rates were reduced by expenditures from the Urban Renewal Fund although these expenditures did not directly involve changes in housing tenure their idea is closely related to the lsquoneighbourhood externalitiesrsquo argument 10 The reviewed literature examining the MTO experiment constitutes an exception 11 For examples of the heterogeneous nature of public housing across towns see Table 1 in Disney and Luo (2017) 12 For evidence on the continued important role of planning restrictions on private housing supply in England see Hilber and Vermeulen (2014)
10
Figure 1 illustrates housing tenure shares by tenure types in England and Wales
between 1918 and 2011 As illustrated in the Figure in 1918 more than three-quarters of
residential housing in England and Wales was privately rented with public housing accounting
for only 1 of the housing stock As a result of a public sector building program and the
development of the mortgage market both private homeownership and public renting
(primarily from local public authorities) rose steadily until 1980 by which time private renting
had shrunk to a little over one tenth of housing tenure While the increase in homeownership
prior to 1980 is mostly explained by the development of a formal mortgage market in the
deepening retail financial sector two main factors explain the increase in public housing prior
to 1980
First municipal government investment programs developed after the World War I
Much of the stock of privately-owned housing which was rented out was in very poor
conditions post-1918 Replacement of the housing stock was hindered by high re-building costs
coupled with borrowing constraints for many small landlords (Disney and Luo 2017) Under
the Housing and Town Planning Act 1919 much of the responsibility for replacement housing
and slum clearance was taken over by local authorities However replacement public housing
was not simply built in inner-city areas where slum clearance had taken place but also in so-
called suburban lsquogardenrsquo estates and even lsquogarden townsrsquo located on greenfield sites Some of
these sites were developed as large-scale public housing projects often with low-density low-
rise properties others in mixed estates with a mixture of public and private housing Later in
the interwar period as economic conditions improved local authorities reverted to replacing
inner-city slums with local high-rise buildings in the same neighbourhood while private
developers tended to build in suburbs and rural areas13 However planning (zoning) restrictions
which tend to be much tighter in the UK than in the United States limited the growth of private
housing in some areas
Second a further impetus to public housebuilding occurred after 1945 Between 1939
and 1945 around four million homes in the UK were destroyed or seriously damaged by
bombing Although bombing campaigns were initially targeted at military targets during 1939-
45 they gradually evolved into area bombing strategies focusing on cities Until near the end
of the World War II bombing (by all sides) was notoriously inaccurate lacking precision
instruments for target identification Target visibility relied on key geographical features such
13 For further discussion see httpsfetuweacukconwebhouse_agescouncil_housingprinthtm and Jones and Murie (2006)
11
as coasts and large rivers and towns and cities in such localities were bombed heavily Other
areas remained relatively unscathed because of weather conditions distance counter-jamming
measures lsquofakersquo fires lit to divert bombers to relatively uninhabited areas and so on14 This
scattering of war destruction implies that there was a random element to where replacement
housing was required once the hostilities had ended As a result of war damage many areas
saw the rapid construction of publicly-owned housing estates to replace damaged and destroyed
homes This link at the local level between bombing and public housebuilding is illustrated in
Figure A1 in Appendix A which uses official Bomb Census data from
httpbombsightorgdatasources to show that the location of bombings across boroughs in
London during the World War II is a significant predictor of where publicly-owned housing
estates were built in the post-war period in London
The somewhat random nature of bombing is illustrated by the fact that whilst areas that
were targeted such as the London Docks already contained high-density low income housing
bombs also fell heavily in the more affluent boroughs of south and south east London which
thereby constructed more public housing after 1945 than equally affluent suburbs to the north
of the capital Other areas where major rebuilding took place were also mixed-income
communities Nevertheless after the post-war reconstruction period that lasted well into the
1950s new public properties tended to be built to replace slums in low-income
neighbourhoods often as high-rise developments with private housebuilding being the
dominant feature of more affluent areas By 1980 close to one-third of the residential housing
stock in England and Wales was public housing
For the analysis that follows in particular to understand the identification strategy that
is taken it is very important to understand how a household accessed a public house and how
the length of tenure within public housing was determined Policies varied between local
authorities but priority for access to public housing would initially be given to local residents
who required rehousing as a result of slum clearance or war destruction Thereafter most local
authorities operated a queuing system by which eligibility depended on evidence that the
person or household would otherwise be homeless on family size and on means of household
income support if any Local residents were prioritised The extent of rationing (waiting time)
for public housing if any in a given area would depend on the supply of public housing that
had been constructed relative to demand Incoming applicants from outside the local authority
14 There is a vast literature on this An early volume that revealed efforts to thwart the accuracy of the German bombing campaign is Jones (1978)
12
area would typically be at the back of the queue In turn residents already within public housing
could apply to move from one public property to another ndash typically by requesting lsquoupgradingrsquo
as a nicer property became available ndash for example a house with a yard or garden rather than
an apartment Tenure within any given property would therefore depend on the availability and
heterogeneity of the public housing stock within an area
iii The ldquoRight to Buyrdquo Policy
Shortly after Margaret Thatcherrsquos election as UK Prime Minister the Housing Act 1980
introduced a statutory Right to Buy (RTB) for public tenants with at least 3 yearsrsquo tenure
duration in their council house ndash lsquostatutoryrsquo in the sense that the policy had to be implemented
by all local councils (previously a few Conservative councils had allowed their tenants to buy
their public property generally at market price) The RTB policy allowed tenants to buy their
properties at substantial discounts to market value ranging from 33 with three yearsrsquo
residence to a maximum of 50 after 20 yearsrsquo residence Local councils were also obliged to
make mortgages available to would-be purchasers although this feature became less pertinent
as capital markets were liberalised during the 1980s The discount on the sale price would be
repayable if the property was resold within five years of an RTB purchase although a
purchased property could be rented out
There were additional constraints in the 1980 legislation particularly in relation to the
sale of publicly-owned apartments but these too were relaxed in the mid-1980s Purchase of
public housing under RTB also became more attractive with later efforts to raise heavily-
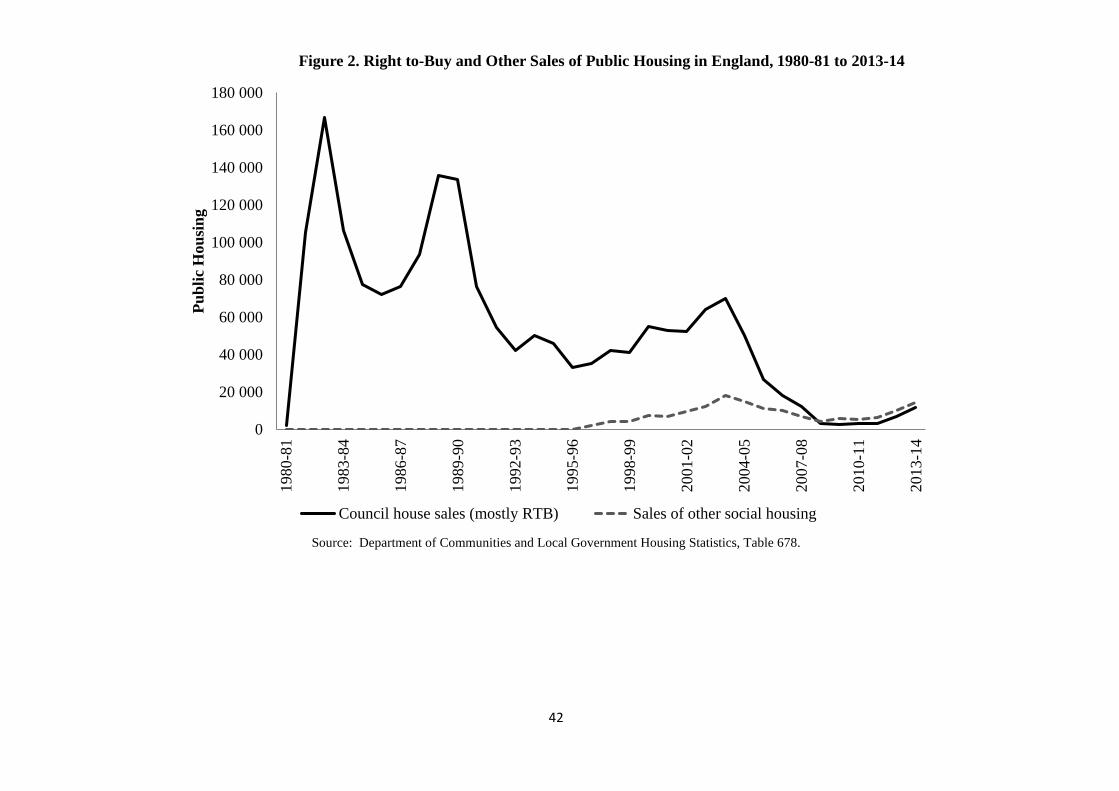
subsidised rents on public tenancies towards lsquomarketrsquo levels15 Figure 2 indicates the pattern of
sales under the RTB policy in England (the other UK nations had similar patterns ndash indeed the
large stock of public houses in Scotland was sold even more rapidly leading to a blanket ban
on further sales by the Scottish government some decades later) The two peaks in sales in the
1980s are associated with the introduction of the RTB policy and its liberalisation in the mid-
1980s thereafter with the better-quality tenants (and public housing) having moved into the
private sector the rate of sales declines
The Thatcher era ended in 1992 and the incoming Labour government in 1997 did not
attempt to reverse the policy completely but did tighten eligibility conditions limit access to
publicly-provided mortgages and impose caps on the maximum discounts in some areas where
15 The economic incentives implied by these various policies are explored at some length in Disney and Luo (2017) but not considered in detail here
13
sales had diminished the public housing stock quickly (since local authorities still had a
statutory responsibility to house homeless families) On the other hand the government also
introduced a similar but less generous version of RTB known as lsquoRight to Acquirersquo which
allowed tenants in some cases to purchase public housing (typically managed by lsquoarms lengthrsquo
housing associations and charities rather than directly by local public authorities) This led to
a brief upsurge in sale volumes as illustrated in Figure 2 although sales continued in any event
as public tenants acquired sufficient yearsrsquo residency in their property to be eligible for the
RTB scheme
Not surprisingly RTB purchases were selective both by household type and by quality
of property For example in Derby a prosperous town in mid-England which has traditionally
specialised in high-end manufacturing since at least the 1920s over 80 of the large stock of
public properties in 1980 were in the form of detached semi-detached or terraced housing in
suburbs and less than 20 in the form of (mostly) high-rise apartments in the inner city By
1991 27 of Derbyrsquos stock of public housing had been sold off with apartments now
constituting nearly 30 of the residual stock
In contrast in Hackney an inner London borough in 1980 around 80 of the public
housing stock was in apartments mostly in high-rise estates By 1991 most of the non-
apartment stock in Hackney had been sold off but the overall stock of public housing had
increased because the local council had constructed or purchased further apartments RTB
purchasers themselves were typically older had higher incomes and they were less likely to
be unemployed (Gregg Machin and Manning 2004) Hence sales of public houses were
evidently non-random and related to local crime rates resulting in a well-known endogeneity
issue in the regression analysis that is addressed empirically in Section 4
3 Data
Our empirical analysis combines multiple data sources at annual frequency Housing data are
provided by the Chartered Institute of Public Finance and Accounting (CIPFA) The data are
provided at the Local Authority (LA) level for the 314 LAs in England and Wales in 198016
The data include details of the composition of the residential housing stock (owned privately
rented and public housing) and the number of sales under the Right-to-Buy (RTB) scheme in
each year LAs had a statutory requirement to report RTB sales to CIPFA and provide details
16 The number of LAs changes over time due to some mergers and due to boundary redrawing There were 314 LAs in England and Wales in 1980 at the onset of the RTB policy
14
of the revenue flow received from the sales Data on average length of tenure duration in public
housing by locality in 1980 are derived from the UK General Household Survey (GHS)
Two sources of crime data complement the housing data The short-run analysis which
covers the period 1975 to 1992 uses administrative crime records collected by the police and
published annually by the UK Home Office in Criminal Statistics This period spans five years
prior to the introduction of the RTB policy in 1980 through to the end of the period of
Thatcher-led Conservative governments in 1992 These data are provided at the Police Force
Area (PFA) geography a geographic unit that sits above and nests LAs17 With the sole
exception of Londonrsquos financial district commonly known as ldquothe City of Londonrdquo and which
constitutes an independent PFA data are used for all 42 PFAs that exist in England and
Wales18
The long-run analysis which covers the period 2003 to 2017 draws upon
administrative crime records at the LA level recorded by the police and published online by
the UK Office for National Statistics (ONS) The long-run analysis starts in 2003 because there
was a very substantial change in reporting rules in the late 1990s and early 2000s in the UK
that had different effects across PFAs and crime types Thus it is not possible to use police
recorded crime data before and after 2002 in the same analysis The City of London PFA is
also excluded from the long-run analysis For both the short-run and long-run analyses the
measures of crime used in the empirical analysis are the numbers of recorded offences of
different crime categories per population Thus the data capture incidents of crime recorded
and classified by all UK local police forces The data contain offence rates for five crime
categories property crime defined as the sum of burglary and theft and handling of stolen
goods offences and violent crime defined as the sum of violence against the person sexual
offences and robbery offences
The LA-level housing data were combined with the crime data to create two data sets
for the analysis For the short-run analysis running from 1975 to 1992 the LA-level crime data
were aggregated at the PFA level using the ONS Open Geography database and then joined to
the PFA-level crime data The construction of the short-run panel is not affected by changes in
LA geographical boundaries as in all cases these occur within PFA units Hence a balanced
17 For example London LAs sit within the Metropolitan Police PFA 18 The City of London constitutes an additional PFA that is independent from the rest of London However this PFA is excluded from this analysis because most property in the area is non-residential hardly anybody lives there and consequently few RTB sales took place there
15
panel of 42 PFAs spanning 18 years was obtained with the PFA-year being the unit of analysis
Data from the GHS on tenure were matched to PFA from regional data subdivided into lsquoruralrsquo
lsquourbanrsquo and lsquomixed urban-ruralrsquo areas
For the long-run analysis (2003 to 2017) which uses a long-difference model
observations of the change in crime measured at the LA level for the period 2003-2017 were
joined with observations of total RTB sales also at the LA level for the period 1980-1992 Not
all observations could be joined due to changes in LA geographical boundaries that preclude a
one-to-one mapping between LAs in the earlier and later period This analysis is therefore
based on 293 observations that could be joined between the earlier and latter periods
These data sources were complemented with administrative records of local area
conditions In the short run analysis data from the New Earnings Survey (NES) and the
Department for Employment were used to calculate local area conditions from 1975 to 1992 in
each PFA In the long run analysis local area conditions at the LA level from the Annual
Population Survey (APS) complement the housing and crime data19
i Summary Statistics
Summary data for the composition of the housing stock in 1980 just prior to the RTB
policy start are provided in the first five rows of Table 1 On average 272 of all residential
properties in a PFA were publicly-owned equating to approximately 14000 individual
properties per LA More than 1 of all residential properties were sold under the RTB scheme
by 1981 ie in the first year of the policy20 A key criterion for eligibility to the RTB scheme
and for the size of the discount on the market value of public properties was the length of tenure
duration in public housing of incumbent tenants Table 1 shows that on average incumbent
tenants in 1980 had spent 11 years in their public properties with some areas featuring much
larger average years of tenure duration than others The distribution of the public housing rate
as well as of public housing sales and tenure duration in 1980 are heterogeneous across PFAs
The data show a quite high standard deviation of public housing stock as a proportion of the
residential stock (the standard deviation shown in Table 1 is 86) as well as some outlier
LAs ndash in 10 of LAs public housing accounted for more than one third of the residential
housing stock
19 Additional details of the data used in the empirical analysis and instructions for data access are provided in the Appendix 20 Our data are for England and Wales The higher proportion of the public housing stock at the start of RTB for the UK arises from the initial high levels of public houses in Scotland and Northern Ireland
16
Figure A2 Panel A in Appendix A illustrates the distribution of public housing across
LAs in 1980 (expressed as a percentage of the residential housing stock) Panel B illustrates
the distribution of public housing in absolute terms and Panel C shows the distribution of
residential housing in absolute terms Similarly Figure A3 Panel A in Appendix A illustrates
the distribution of public housing sales across LAs in the 1980s-90s (expressed as a percentage
of the residential housing stock in 1980) Panel B illustrates the distribution of public housing
sales in the 1980s-90s in absolute terms and Panel C shows the distribution of public housing
sales across LAs in the 1980s-90s (expressed as a percentage of the public housing stock in
1980) All distributions in Figures A2 and A3 have a long right tail further illustrating the
uneven distribution of the public housing stock public housing sales the total residential stock
and the ratios of these across LAs in 1980
The remaining rows of Table 1 provide summary data for crime rates and other
covariates in 1980 Crime rates are measured as cases per individuals Thus Table 1 shows that
45 criminal offences per 100 individuals were recorded on average in a PFA in 1980 Total
crime is defined as the sum of property crime and violent crime and these measures of crime
are the key outcomes of interest here21 Property Crime defined as the sum of burglary and
theft and handling of stolen goodsrsquo offences is overwhelmingly the most common category of
crime in 1980 Only the most serious types of violent offences such as homicide aggravated
assault sexual offences and robberies were recorded and published by the Home Office since
the 1970s in England and Wales Minor violent offences only started to be recorded in the UK
in the early 2000s Thus violent crime is defined here as the sum of serious violence against
the person sexual offences and robbery
Table 1 also shows four additional variables which are used as covariates in regression
models the local log real hourly wages at the 25th and 50th percentiles of the distribution the
local log unemployment rate and the local share of 15-24 years olds in the population in the
PFA Since potential offenders are likely to earn low wages and have low levels of labour
market attachment (Machin and Meghir 2004) the 25th percentile of log wages and log
unemployment are likely to be relevant features of the labour market in the determination of
criminal activity while the 50th percentile of log wages is also included to depict the
distribution of wages Finally Table 1 also suggests that approximately 16 of the overall
population is aged 15 to 24 Since the likelihood to commit crime is observed almost
21 The analysis does not include drugs offences as no data on drugs offences in England and Wales was collected and published by the UK Home Office for the period of this study
17
universally to be highest in the late teens and then decrease later in life (Quetelet 1831 and
Landersoslash Nielsen and Simonsen 2016) the fraction of individuals aged 15 to 24 in the
population is also likely to be a relevant determinant of the local criminal activity
4 Empirical Analysis
i Public housing and crime in the initial conditions
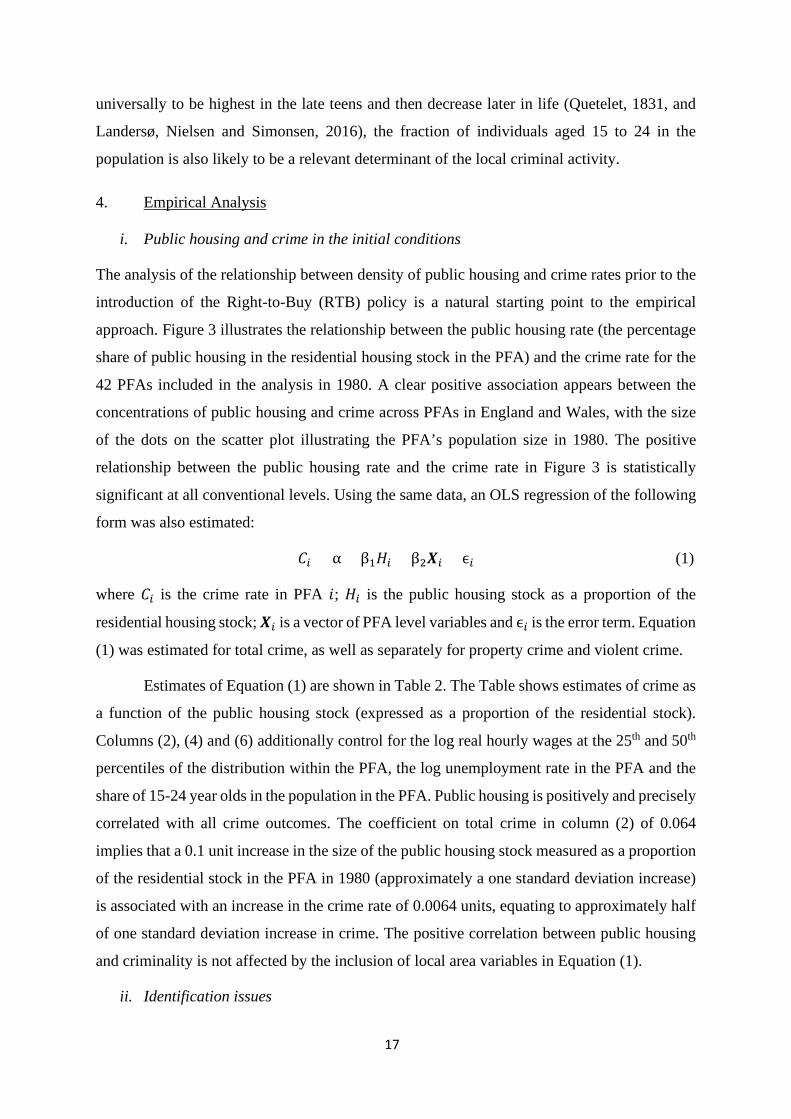
The analysis of the relationship between density of public housing and crime rates prior to the
introduction of the Right-to-Buy (RTB) policy is a natural starting point to the empirical
approach Figure 3 illustrates the relationship between the public housing rate (the percentage
share of public housing in the residential housing stock in the PFA) and the crime rate for the
42 PFAs included in the analysis in 1980 A clear positive association appears between the
concentrations of public housing and crime across PFAs in England and Wales with the size
of the dots on the scatter plot illustrating the PFArsquos population size in 1980 The positive
relationship between the public housing rate and the crime rate in Figure 3 is statistically
significant at all conventional levels Using the same data an OLS regression of the following
form was also estimated
119862119862119894119894 = α + β1119867119867119894119894 + β2119935119935119894119894 + ϵ119894119894 (1)
where 119862119862119894119894 is the crime rate in PFA 119894119894 119867119867119894119894 is the public housing stock as a proportion of the
residential housing stock 119935119935119894119894 is a vector of PFA level variables and ϵ119894119894 is the error term Equation
(1) was estimated for total crime as well as separately for property crime and violent crime
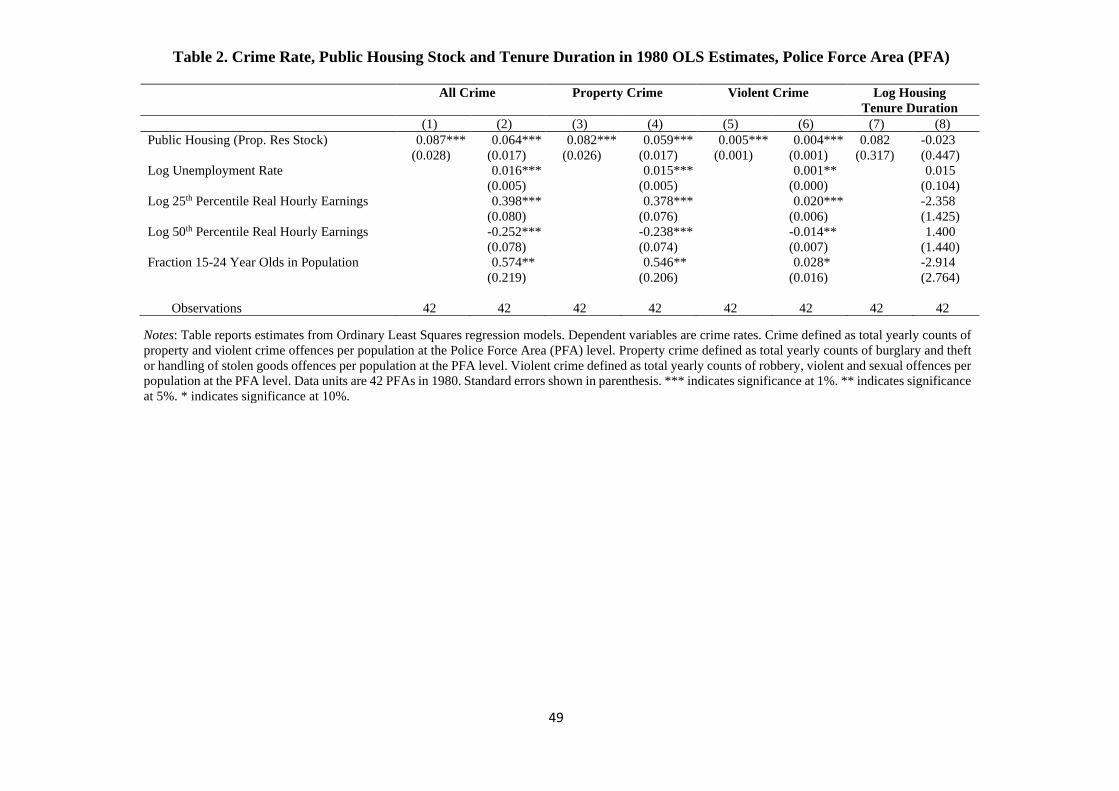
Estimates of Equation (1) are shown in Table 2 The Table shows estimates of crime as
a function of the public housing stock (expressed as a proportion of the residential stock)
Columns (2) (4) and (6) additionally control for the log real hourly wages at the 25th and 50th
percentiles of the distribution within the PFA the log unemployment rate in the PFA and the
share of 15-24 year olds in the population in the PFA Public housing is positively and precisely
correlated with all crime outcomes The coefficient on total crime in column (2) of 0064
implies that a 01 unit increase in the size of the public housing stock measured as a proportion
of the residential stock in the PFA in 1980 (approximately a one standard deviation increase)
is associated with an increase in the crime rate of 00064 units equating to approximately half
of one standard deviation increase in crime The positive correlation between public housing
and criminality is not affected by the inclusion of local area variables in Equation (1)
ii Identification issues
18
The primary object of this study is to quantify the causal impact of homeownership on
crime rates In our empirical setting the Right-to-Buy (RTB) policy can be interpreted as a
relaxation of a supply constraint on available property for homeownership by allowing public
housing tenants to purchase their homes at a subsidy Of course this policy does not directly
generate a pure natural experiment in observed RTB sales for at least two reasons First there
may be important time-varying omitted factors that drive both the decision by a tenant to
purchase the house and the local crime rate Second RTB sales are a result of demand for
public housing purchases together with the local supply of housing for sale With demand being
determined at least in part by local crime rates OLS estimates of the relationship between
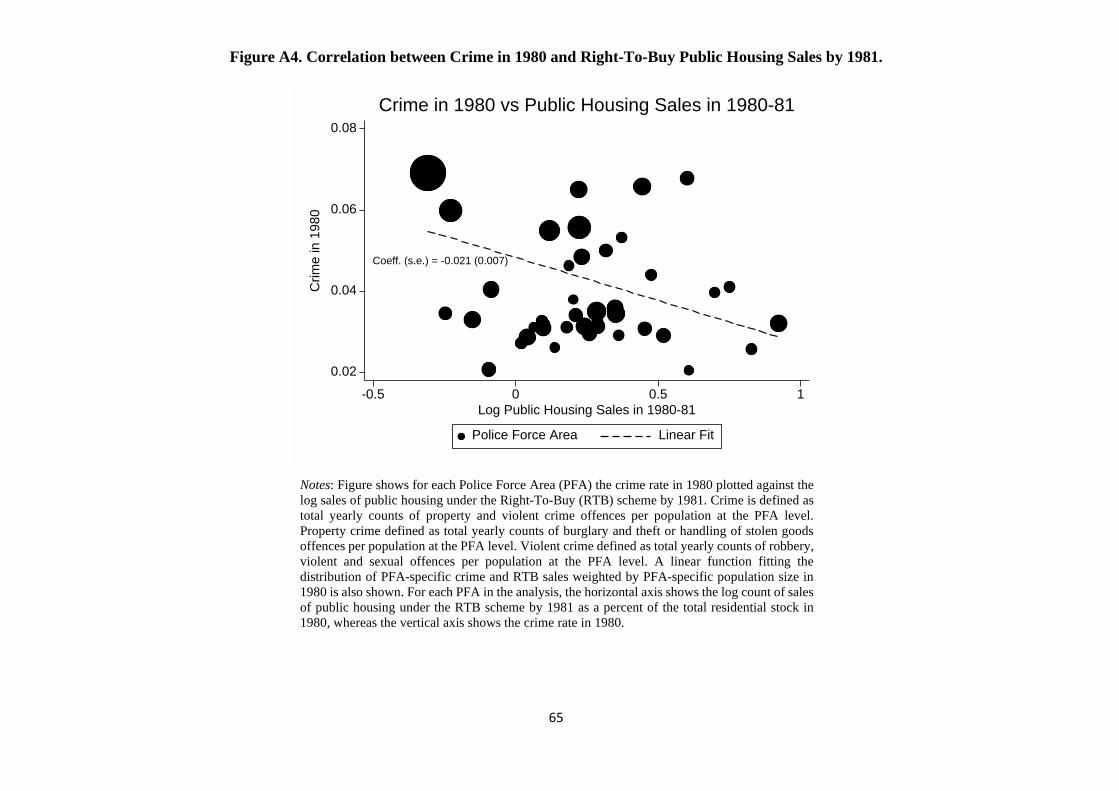
crime rate and public housing sales will suffer from endogeneity bias It is very likely that the
decision by the tenant to purchase the house may itself be partly determined by the level and
dynamics of local crime Indeed unsurprisingly a negative relationship appears between crime
rates and public housing sales in 1980 in Figure A4 in Appendix A further suggesting that
RTB sales were not orthogonal to crime rates at the onset of the RTB policy
iii Short-run estimates
a Empirical strategy
Our empirical strategy exploits two approaches to estimating the effect of sales of
public housing on crime rates that isolate supply-side variation in exposure to the RTB policy
This variation arises from differences across localities in the potential exposure to RTB sales
The analysis of the short-run impact of public housing sales on crime defines a series of
difference-in-differences specifications whereby the years of tenure duration in public housing
of incumbent tenants in 1980 are used to proxy the Intention-To-Treat (ITT) intensity of the
RTB treatment at the PFA level The national level policy albeit introduced uniformly across
localities in 1980 was specified in such a way that eligibility to the RTB scheme and the size
of the discounts varied across localities depending on the average number of years spent in
public properties by the incumbent tenants prior to the reform
In particular the Housing Act of 1980 introduced a statutory right to buy for public
tenants with at least three yearsrsquo tenure duration in their public house Moreover discounts on
the sale price relative to the market value of the property linearly increased with public housing
tenure duration ranging from 33 percent for public housing tenants with three yearsrsquo residence
through to a maximum of 50 percent after twenty yearsrsquo residence Thus the discounts to
purchase a public property generated by RTB were directly related with the years of tenure
19
duration in public housing when the RTB scheme was introduced and years of tenure duration
in public housing in 1980 constitutes a predetermined source of differential exposure to the
RTB scheme that could not be gamed in 1980
In Columns (7) and (8) in Table 2 equation (1) is re-estimated and the fraction of public
housing in the PFA the log real hourly wages at the 25th and 50th percentiles of the distribution
within the PFA the log unemployment rate in the PFA and the share of 15-24 year olds in the
population in the PFA are used to predict log average years of tenure duration in public housing
in the PFA in 1980 As Table 2 shows none of these variables predicts public housing tenure
duration in 1980 suggesting that its distribution across regions and thus RTB eligibility in 1980
is orthogonal to local area circumstances and the average socio-economic status of individuals
Combined with the fact that RTB came into force shortly after the 1979 election of the new
Thatcher Government and people in the 1970s could not freely move across public properties
(especially between local authorities) but rather had to apply and join a potentially long queue
prior to being able to move in and out of public properties this makes the distribution of RTB
eligibility at the onset of the policy quasi-random
Eligibility to the RTB scheme and in turn intensity of adoption varied across regions
according to the composition of the local housing stock which was determined by historical
factors Public housing sales under the RTB policy began in most LAs in October 1980 (the
1980 Housing Act was passed on 8 August with most LAs starting to process applications for
public housing purchases soon thereafter) Figure 2 shows that the RTB policy resulted in an
initial peak in public housing sales from October 1980 to 1982 after which RTB sales
continued at a slower pace The initial eligibility to the RTB scheme was mainly responsible
for this and it is therefore exploited empirically in the econometric analysis
Since the discount on the sale price would be repayable if a property was resold within
five years of an RTB purchase and the RTB scheme was extended to flats in 1986 the short-
run analysis is conducted separately on the first five years of the RTB scheme ie up until
1985 and on the entire Thatcher era ie up until 1992 When the analysis is restricted to the
first five years of the RTB scheme years of tenure duration in public housing of incumbent
tenants in 1980 are also used as an instrumental variable (IV) for the actual sales of public
housing under the RTB scheme in the first year of the RTB scheme The same IV approach is
not used for later years because starting from 1986 the possibility that properties bought under
the RTB scheme were resold in the private market cannot be ruled out ex ante
20
Figure 4 illustrates a strong positive correlation between the log average years of tenure
duration in public housing in the PFA in 1980 (on the x-axis) and the log percentage of the
residential stock in the PFA which was sold-off in the first year of the RTB scheme ie by
1981 (on the y-axis) These initial sales of the residential stock in the first year of the RTB
scheme are also shown in Figure 5 to be positively correlated with the percentage sold-off
between 1980 and 1992 (on the y-axis) Therefore while RTB public housing sales by 1992
may be the endogenous result of the evolution of crime post 1980 and thereby result in a well-
known problem of reverse causation in our estimates the public housing tenure duration in
1980 constitute an ITT proxy that strongly predicts the actual intensity of the RTB scheme at
the PFA level
For this analysis data on crime rates public housing tenure duration and local area are
used from 1975 to 1992 The estimating difference-in-differences specification can be
expressed as follows
119862119862119894119894119905119905 = αi+αt + 1205731205731 lowast 11987711987711987711987711987711987711989411989480 + 1205731205732 lowast 119875119875119875119875119875119875119875119875119905119905 + 1205731205733 lowast 11987711987711987711987711987711987711989411989480 lowast 119875119875119875119875119875119875119875119875119905119905 + 1205731205734119935119935119946119946119946119946 + 120598120598119894119894 (2)
where 119862119862119894119894119905119905 is the crime rate in PFA i in each year t from 1975 to 1992 αi is a set of PFA fixed
effects and αt is a set of year fixed effects 11987711987711987711987711987711987711989411989480 is log average years of tenure duration in
public housing ie a measure of RTB eligibility in 1980 defined both as a continuous variable
and as a binary variable indicating if average years of public housing tenure duration in PFA i
were greater than or equal to the median value of average years of public housing tenure
duration at the national level in 1980 Post is a dummy variable that takes up value 1 starting
from 1980
The main estimand of interest is 1205731205733 the coefficient associated with the interaction
between 11987711987711987711987711987711987711989411989480 and Post which measures the impact of the initial RTB eligibility-induced
shock to homeownership on crime A negative coefficient associated with 1205731205733 would imply that
PFAs that experienced greater RTB eligibility in 1980 experienced lower relative crime rates
by 1992 due to the RTB scheme This parameter is directly of interest to a policy maker wishing
to modify homeownership rights for the general population as tenure duration in public
housing was an explicit predetermined policy criterion in the Housing Act of 1980 that could
not be gamed in the short run and that determined eligibility to the RTB scheme
The causal interpretation of 1205731205733 crucially relies on the absence of differential pre-
treatment trends between PFAs exposed to different degrees of RTB eligibility in 1980 Insofar
as RTB eligibility in 1980 does not predict crime trends prior to the RTB policy then 1205731205733 can
21
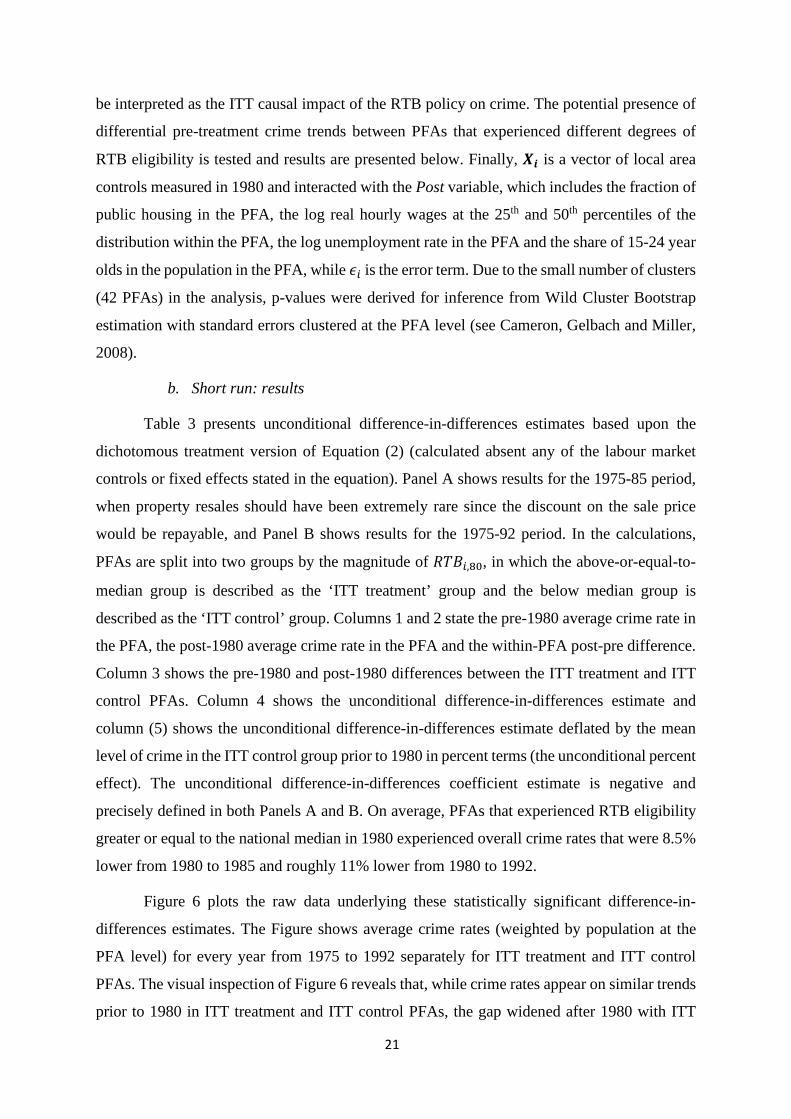
be interpreted as the ITT causal impact of the RTB policy on crime The potential presence of
differential pre-treatment crime trends between PFAs that experienced different degrees of
RTB eligibility is tested and results are presented below Finally 119935119935119946119946 is a vector of local area
controls measured in 1980 and interacted with the Post variable which includes the fraction of
public housing in the PFA the log real hourly wages at the 25th and 50th percentiles of the
distribution within the PFA the log unemployment rate in the PFA and the share of 15-24 year
olds in the population in the PFA while 120598120598119894119894 is the error term Due to the small number of clusters
(42 PFAs) in the analysis p-values were derived for inference from Wild Cluster Bootstrap
estimation with standard errors clustered at the PFA level (see Cameron Gelbach and Miller
2008)
b Short run results
Table 3 presents unconditional difference-in-differences estimates based upon the
dichotomous treatment version of Equation (2) (calculated absent any of the labour market
controls or fixed effects stated in the equation) Panel A shows results for the 1975-85 period
when property resales should have been extremely rare since the discount on the sale price
would be repayable and Panel B shows results for the 1975-92 period In the calculations
PFAs are split into two groups by the magnitude of 11987711987711987711987711987711987711989411989480 in which the above-or-equal-to-
median group is described as the lsquoITT treatmentrsquo group and the below median group is
described as the lsquoITT controlrsquo group Columns 1 and 2 state the pre-1980 average crime rate in
the PFA the post-1980 average crime rate in the PFA and the within-PFA post-pre difference
Column 3 shows the pre-1980 and post-1980 differences between the ITT treatment and ITT
control PFAs Column 4 shows the unconditional difference-in-differences estimate and
column (5) shows the unconditional difference-in-differences estimate deflated by the mean
level of crime in the ITT control group prior to 1980 in percent terms (the unconditional percent
effect) The unconditional difference-in-differences coefficient estimate is negative and
precisely defined in both Panels A and B On average PFAs that experienced RTB eligibility
greater or equal to the national median in 1980 experienced overall crime rates that were 85
lower from 1980 to 1985 and roughly 11 lower from 1980 to 1992
Figure 6 plots the raw data underlying these statistically significant difference-in-
differences estimates The Figure shows average crime rates (weighted by population at the
PFA level) for every year from 1975 to 1992 separately for ITT treatment and ITT control
PFAs The visual inspection of Figure 6 reveals that while crime rates appear on similar trends
prior to 1980 in ITT treatment and ITT control PFAs the gap widened after 1980 with ITT
22
control PFAs experiencing a greater increase in crime rates starting from the early 1980s
Compared with the 1970s a wider gap in crime rates is also observed in the early 1990s when
the short run analysis terminates These unconditional estimates and those in Table 3 suggest
that sales of public housing under the RTB scheme may have helped tackle the nationwide
rising trend in criminality experienced in England and Wales in the 1980s
Table 4 subjects these results to a set of more robust econometric specifications
Columns (1)-(3) show ITT results for the 1975-85 period columns (4) and (5) show IV results
for the 1975-85 period and Columns (6)-(9) show ITT results for the 1975-92 period All
estimated specifications include PFA fixed effects and year fixed effects and the models in
Columns (2)-(5) and (7)-(9) additionally include the interaction between the Post variable in
equation (2) and local area variables measured in 1980 (ie fraction of public housing log of
the unemployment rate log of real hourly earnings at the 25th and 50th percentiles of the
distribution and the fraction of 15-24 year olds in the population) Columns (1) to (8) report
the ITT and IV estimates of 1205731205733 the coefficient associated with the interaction between 11987711987711987711987711987711987711989411989480
and Post in equation (2) whereas the model in Column (9) shows the results separately for the
first eight years of the RTB policy 1980-87 and for the subsequent years that followed the
1987 UK General Elections when Margaret Thatcher was re-elected as UK Prime Minister
1987-92 In all specifications standard errors were clustered at the PFA level and Wild Cluster
Bootstrap techniques were used for inference due to the small number of clusters
Column (1) shows results based upon the dichotomous treatment version of 11987711987711987711987711987711987711989411989480 in
Equation (2) indicating that ITT treatment group PFAs experienced a 10 percent reduction in
crime by 1985 Column (2) shows results based upon the continuous treatment version of
11987711987711987711987711987711987711989411989480 and when the interactions between local area circumstances measured in 1980 and the
Post variable are also added to the estimated specification Column (2) also shows negative
and statistically significant estimates suggesting that the conclusion from Table 3 that RTB
eligibility led to a reduction in crime in the 1980s and early 1990s is robust to equation
specification In particular estimates in Column (2) uncover an elasticity of crime with respect
to RTB eligibility of approximately -019 implying that a 10 percent increase in eligibility to
the RTB scheme reduced crime by around 19 percent within the first five years of the scheme
The causal interpretation of these estimates crucially relies on the absence of
differential pre-treatment crime trends between PFAs that were exposed to different degrees of
RTB eligibility in 1980 Column (3) shows event-study estimates where the log average years
23
of tenure duration in public housing in 1980 was interacted with three pre-reform years Two
key facts emerge from Column (3) First Column (3) shows there to be no differential pre-
treatment trends between PFAs that received different exposures to the RTB scheme In other
words RTB eligibility in 1980 does not predict crime trends across PFAs prior to 1980 This
implies that any post-1980 deviation from the existing trend that is predicted by the eligibility
to the RTB scheme in 1980 can be interpreted as the ITT impact of the RTB scheme on crime
Second estimates in Column (3) show a reduction in crime rates among PFAs that experienced
greater RTB eligibility in 1980 uncovering an elasticity of crime with respect to RTB
eligibility of approximately -028
Columns (4) and (5) show the IV estimates for the period 1975-85 and they retrieve
similar slightly larger negative elasticities In both columns the actual public housing sales
under the RTB scheme in the first year of the policy ie in 1980-81 are instrumented using
the log average years of tenure duration of incumbent tenants in public housing in 1980 Both
columns show negative and statistically significant estimates with Column (5) also showing
there to be no differential pre-treatment trends between PFAs that received different exposures
to the RTB scheme Similarly to the ITT estimates in Column (3) IV estimates in columns (4)
and (5) uncover an elasticity of crime with respect to RTB sales of approximately -028 to -
042 implying that a 10 percent increase in the RTB public housing sales reduced crime by
around 3 to 4 percent by 1985
In the remaining Columns (6)-(9) the analysis is extended up until 1992 the year when
the Thatcher era ended but very similar conclusions emerge Column (6) shows results based
upon the dichotomous treatment version of 11987711987711987711987711987711987711989411989480 in Equation (2) and it indicates that ITT
treatment group PFAs experienced a 128 percent reduction in crime by 1992 Columns (7) and
(8) show results based upon the continuous treatment version of 11987711987711987711987711987711987711989411989480 and when the
interactions between local area circumstances measured in 1980 and the Post variable are also
added to the estimated specification Columns (7) and (8) also show negative and statistically
significant estimates uncovering an elasticity of crime with respect to RTB eligibility of
roughly -028 to -036 implying that a 10 percent increase in eligibility to the RTB scheme
reduced crime by around 28 to 36 percent by 1992 When broken down between the years
prior to 1987 and later years Column (9) shows that a sizeable and statistically significant
crime-reducing effect of RTB eligibility appears in both the 1980s and early 1990s with little
variation appearing in the estimated crime-reducing effects of RTB across time and model
specifications
24
Throughout these estimates the magnitude of the crime reduction caused by the RTB
scheme by 1992 appears very similar to the magnitude observed by 1985 In the early years of
the RTB scheme no one who purchased a property under the RTB scheme could have possibly
resold it while continuing to benefit from the large discounts offered by the Thatcher-led
government under the RTB scheme as explained above Thus crime reductions from 1980-
85 as well as 1980-87 are very unlikely to result from the practice of reselling properties
previously bought under the RTB scheme to incomers that are more affluent If the ldquomigration-
basedrdquo gentrification of certain areas of the country was the underlying mechanism driving
these crime reductions significance in the estimates should not appear until the late 1980s
when the first properties bought under the RTB scheme in 1980 could be resold without having
to renounce the RTB discounts However this is not what is found here A crime reduction
appears in the early years of the RTB scheme a result that is rather consistent with behavioural
changes within the local communities that were more exposed to the provisions of the scheme
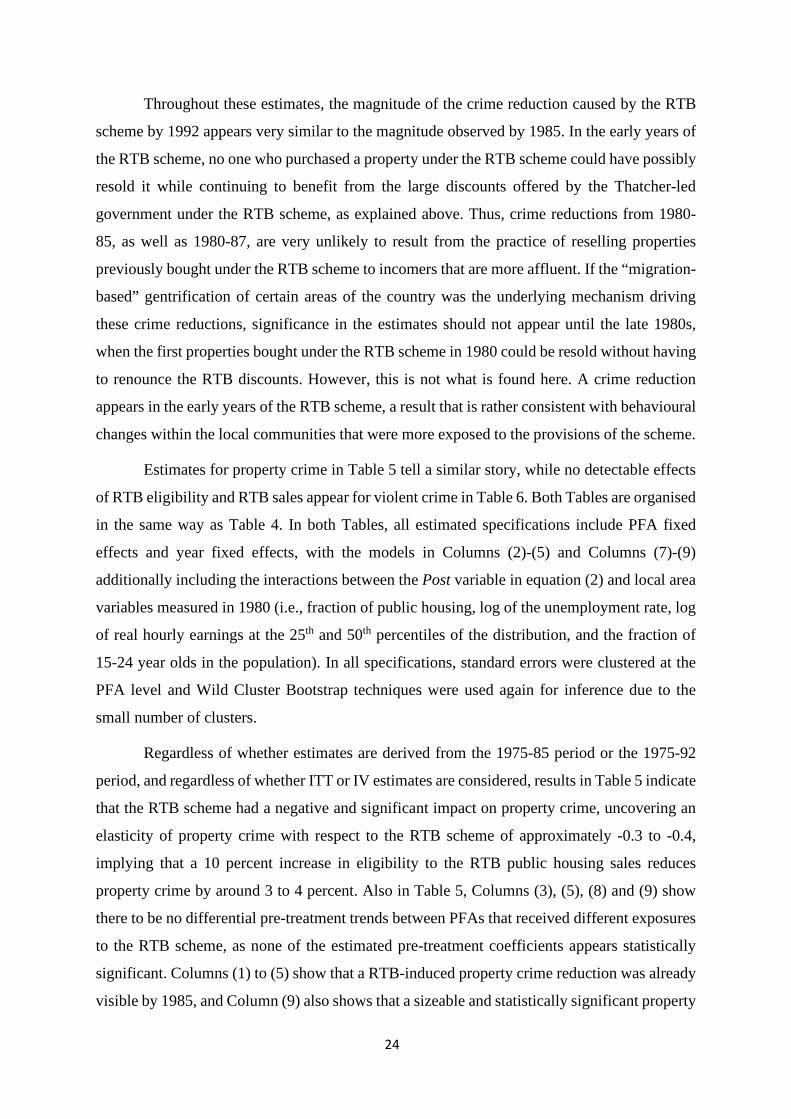
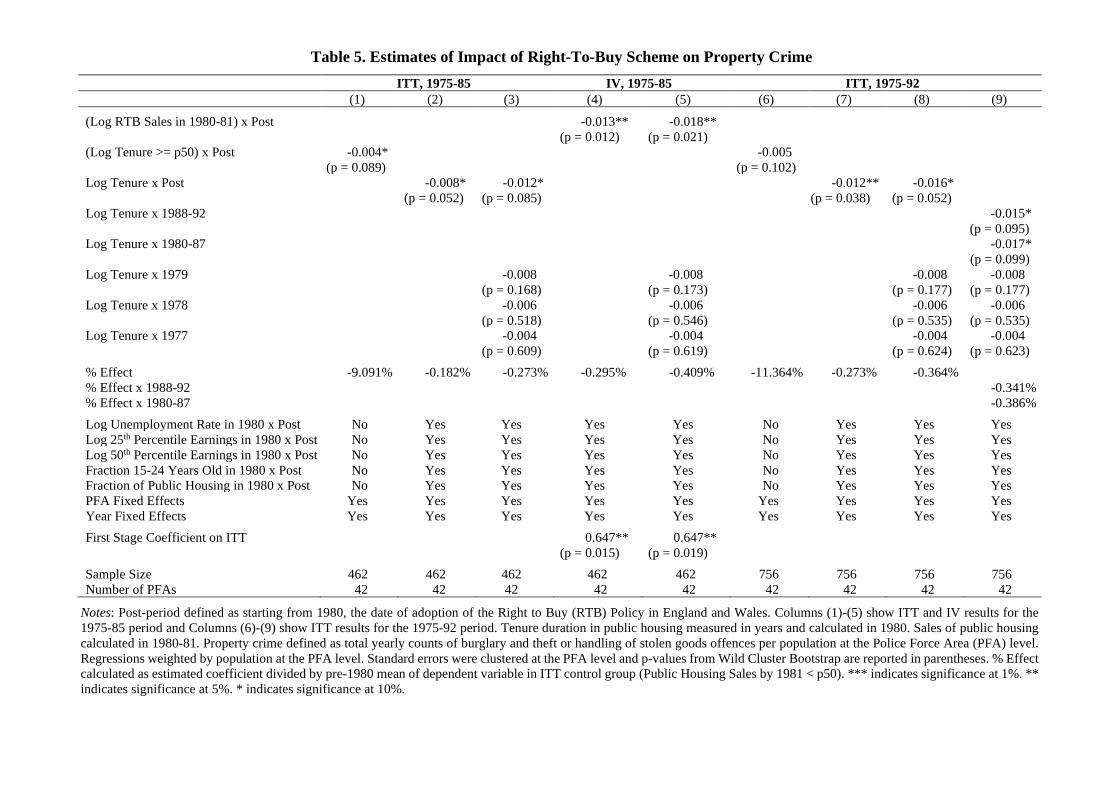
Estimates for property crime in Table 5 tell a similar story while no detectable effects
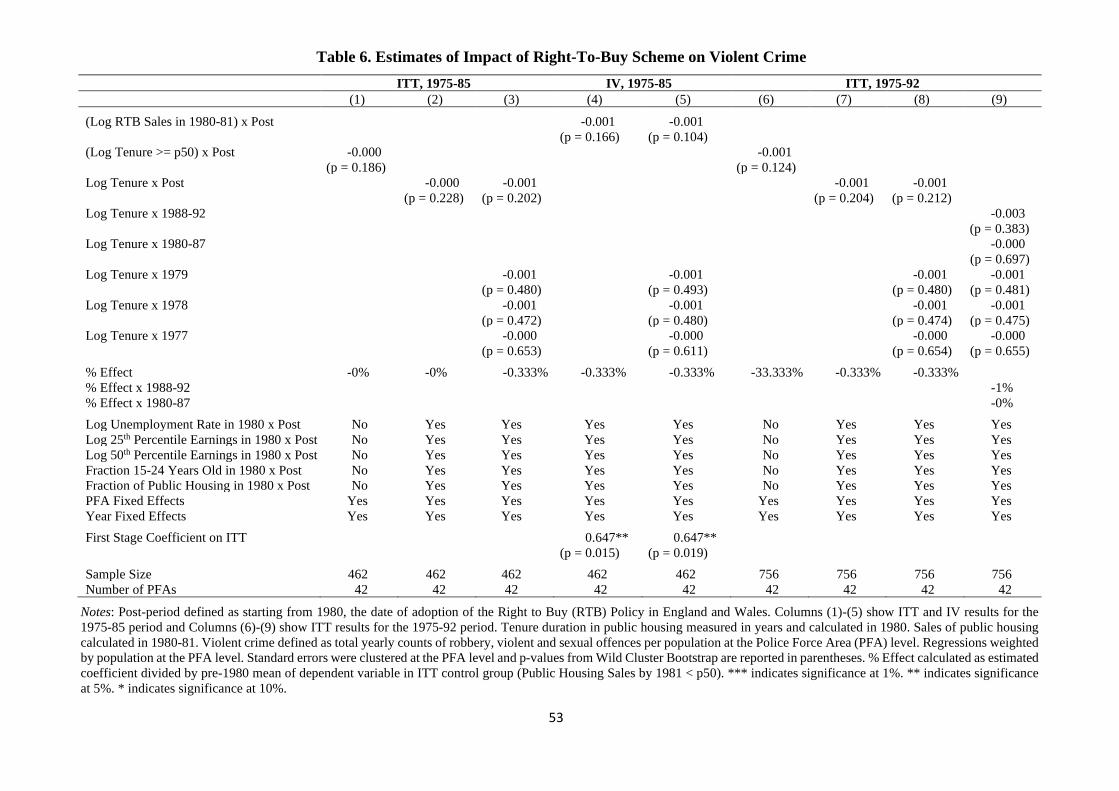
of RTB eligibility and RTB sales appear for violent crime in Table 6 Both Tables are organised
in the same way as Table 4 In both Tables all estimated specifications include PFA fixed
effects and year fixed effects with the models in Columns (2)-(5) and Columns (7)-(9)
additionally including the interactions between the Post variable in equation (2) and local area
variables measured in 1980 (ie fraction of public housing log of the unemployment rate log
of real hourly earnings at the 25th and 50th percentiles of the distribution and the fraction of
15-24 year olds in the population) In all specifications standard errors were clustered at the
PFA level and Wild Cluster Bootstrap techniques were used again for inference due to the
small number of clusters
Regardless of whether estimates are derived from the 1975-85 period or the 1975-92
period and regardless of whether ITT or IV estimates are considered results in Table 5 indicate
that the RTB scheme had a negative and significant impact on property crime uncovering an
elasticity of property crime with respect to the RTB scheme of approximately -03 to -04
implying that a 10 percent increase in eligibility to the RTB public housing sales reduces
property crime by around 3 to 4 percent Also in Table 5 Columns (3) (5) (8) and (9) show
there to be no differential pre-treatment trends between PFAs that received different exposures
to the RTB scheme as none of the estimated pre-treatment coefficients appears statistically
significant Columns (1) to (5) show that a RTB-induced property crime reduction was already
visible by 1985 and Column (9) also shows that a sizeable and statistically significant property
25
crime-reducing effect of RTB eligibility appears both in the 1980s and early 1990s consistent
with the notion that RTB eligibility led to behavioural changes within the local communities
rather than gentrification induced by in-migration
Table 6 studies the effect of RTB eligibility on violent crime and no significance
appears in the estimates Also in this case ITT and IV estimates from the 1975-85 period reach
the same conclusion as ITT estimates from the 1975-92 period Estimates Columns (3) (5) (8)
and (9) show there to be no differential pre-treatment trends between PFAs that received
different exposures to the RTB scheme suggesting that RTB eligibility in 1980 does not predict
violent crime trends either across PFAs prior to 1980 and further supporting the causal
interpretation of the estimates presented in Tables 4 and 5 and discussed in this section
c Political Colour Labour Markets Local Amenities and Police Deployment
Why did greater eligibility to the RTB scheme lead to a detectable reduction in crime
The mechanisms underlying the findings in Tables 3-6 and Figure 6 were investigated through
a variety of statistical tests First one may worry that this analysis is spuriously picking up
some other PFA-specific characteristics such as the political affiliation of the local
administration To test this data on the political ldquocomplexionrdquo of the PFA in the local elections
in 1977 the latest local elections prior to the election of Margaret Thatcher as UK Prime
Minister in 1979 were used Although RTB sales were only used in the IV estimates and not
in the ITT reduced-form estimates of equation (2) presented in Tables 4-6 one may worry that
the de facto supply-side availability of public housing for RTB sales might have differed by
local political control If for example pro-Thatcher Conservative-controlled LAs were more
willing to fulfil their statutory responsibility to accelerate sales through faster processing (or
potentially be more likely to advertise and encourage the possibility locally) then this omitted
confound might weaken the predictive power of public housing tenure duration and co-
determine RTB sales and crime However a scatter plot in Figure A5 in Appendix A suggests
no correlation between the conservative vote share within the PFA and RTB sales from 1980-
92 as a percentage of the residential stock in 1980 Estimates of the impact of eligibility to the
RTB scheme on crime were also produced when a set of interactions between the Conservative
vote share within the PFA in the 1977 local elections and year fixed effects were added to the
econometric specification22 Results are unchanged with the inclusion of this additional
variable which suggests that our results are not caused by Labour controlled LAs opposing
22 The Conservative vote share is the share of Conservative votes in all votes cast in the parliamentary constituencies nested within the PFA
26
this policy for political reasons while facing greater local crime rates This holds true regardless
of whether local area variables are included in the analysis
One additional concern may be that the reduction in crime rates observed in areas with
greater RTB eligibility in 1980 may reflect some underlying trends in local labour markets If
for example incumbent tenants spent more years in public housing prior to 1980 in areas that
faced more favourable labour market prospects thus facing greater discounts under the RTB
scheme and these same areas then experienced reduced criminality thanks to the improved
labour market circumstances then the reduction in crime observed in Tables 3-6 and Figure 6
would be erroneously attributed to the RTB scheme Models to test for the effects of RTB
eligibility on local labour market conditions were therefore estimated and results are displayed
in Table 7 Whether the unemployment rate the 25th percentile real hourly earnings or the 50th
percentile real hourly earnings are modelled as dependent variable no evidence appears that
eligibility to the RTB scheme in 1980 predicted the evolution of local labour market conditions
in the 1980s and early 1990s These results mitigate the concern that our estimates might be
picking up the effect of other local area circumstances that interacted with public housing sales
over time in the 1980s
Eligibility to the RTB scheme in 1980 does not even seem to predict the local fraction
of 15-24 year olds in the population in the 1980s and early 1990s a relevant finding that further
suggests that migration and a compositional change in the local population do not seem to be
the key mechanisms at play here If a ldquomigration-basedrdquo gentrification was behind the main
results of this paper RTB eligibility would predict the composition of the local population in
the 1980s and 1990s If for example all RTB purchasers had rented out their properties to
students right after purchasing them (and this was the true driver of the crime reduction in
Tables 4 and 5) then RTB eligibility should be a positive predictor of the fraction of 15-24
year olds in the population However this is not what is found here
One further concern may be that initial RTB eligibility positively correlates with the
quality of local amenities across regions in England and Wales The initial uptake of the RTB
scheme may have been greater in areas with ldquobetter-qualityrdquo public housing Similarly one
may worry that in 1980 only the ldquowell-offrdquo public tenants were able to exploit the RTB scheme
and purchase their houses while ldquothe very poorrdquo were left behind Both these scenarios would
imply that in the short run analysis initial RTB sales may be picking up other relevant
socioeconomic components of communities If initial RTB sales were concentrated among
27
better-off areas or individuals the crime-reducing effect that is observed may not be due to the
sales of public housing but rather due to the fact that we are not comparing like-with-like
To test for the possibility that RTB sales grew faster in areas with greater-quality public
housing the main model was re-estimated and the treatment variable replaced with the value
of RTB sales in the first year of the RTB scheme in place of the eligibility to the RTB scheme
in 1980 The result of this exercise is shown in column (5) of Table 7 When crime is regressed
on the average (log) value of RTB transactions in the first year of the RTB scheme the
estimated coefficient appears small in magnitude as well as in percent terms and very
statistically insignificant Thus unlike RTB eligibility the value of RTB sales does not predict
the evolution of crime This conclusion is robust to the set of controls added to the estimating
equation (fixed effects only or fixed effects and local area variables) In sum the initial
eligibility to RTB sales not their average value predicts the reduction in crime since the 1980s
Finally one may worry that the RTB scheme may have coincided with differential
policing strategies across regions and that this may have resulted in differential crime detection
rates across regions If for example fewer police officers were deployed in areas with greater
RTB sales in 1980 our findings may reflect the lower crime detection rates of the police in
these areas rather than a genuine reduction in crime Availability of data on the number of
officers employed in each PFA since 1975 allowed us to estimate the impact of RTB eligibility
on police deployment This is a further test of whether indeed the RTB scheme made some
areas of the country safer or whether it coincided with a decrease in police deployment To
examine this idea the dependent variable in the difference-in-differences specification was
replaced with the log number of police officers deployed by the PFA Results are displayed in
column (6) of Table 7 and the coefficient of interest is economically small and not statistically
significant suggesting that the greater exposure to the RTB scheme of some PFAs did not
coincide with differential policing strategies In turn this mitigates the concern that differential
policing strategies and crime detection rates across regions may have coincided with the RTB
scheme and further suggests that our main results reveal the genuine reduction in criminality
generated by the RTB scheme
d Homeownership and Behavioural Change
Did the RTB policy induce indigenous local communities to refurbish their properties
One possibility is that home upgrading by purchasers under the RTB scheme explains the
observed reduction in crime (absent any clear migration labour market or amenity differential
28
between areas that were exposed to differing degrees to the RTB policy) The British Crime
Survey (BCS) 1988 contains a rich set of variables concerning homeownership and crime23
Based on the information contained in the BCS 1988 it was possible to define a treatment
group of incumbent tenants who had previously rented from the council then subsequently
purchased the property in which they currently reside and a control group of council rental
tenants who stated that they currently intend to buy the public property in which they reside
within two years This provides a natural comparison group against which to estimate the
effects of purchase on behavioural change to build at least strongly suggestive evidence for the
effects of the policy Table A1 in the Appendix shows these treatment group individuals and
control group individuals to be observably indistinguishable in terms of age gender ethnicity
income number of rooms in the household household type (eg flat or house) and past
experiences of burglary victimization For each of these individual and household
characteristics Table A1 presents a balancing test that retrieves an insignificant estimate thus
showing the suitability of the comparison group
Table 8 shows a comparison of home improvement expenditure insurance and social
behaviour between these two groups of observably similar individuals Panel A shows
unconditional OLS estimates thus providing a simple comparison of the means between these
two groups OLS estimates in Panel B were derived controlling for the set of variables for
which balancing was tested in Appendix Table A1 ie gender ethnicity a quadratic of age
past experiences of burglary victimization in the property of residence type of property (eg
flat or house) number of rooms in the property household income band and county fixed
effects Thus while self-selection into the treatment group is a possibility controlling for this
large set of observables and restricting the treatment and control groups to incumbent
individuals that only seem to differ in their timing of willingness to purchase their property
from the council within two years should mitigate the concern that self-selection is driving our
results here To be consistent with all other results at PFA level standard errors were clustered
at the county level the closest geography to a PFA that was available in these data As
respondents are drawn from 52 counties Wild Cluster Bootstrap p-values were estimated again
as in all the analysis discussed above
The results in Table 8 show that incumbent tenants who bought from the council were
significantly more likely to install double locks to outside doors to install locks in windows
23 The same detail of information is not available from any other BCS survey from 1982 to 1992 when the short run analysis ends
29
and have the contents of their home insured against theft The same individuals were also
significantly more likely to install burglar alarms a relatively rare security device in England
and Wales in 1988 Finally these individuals were not more likely to join a neighbourhood
watch scheme a community-based crime prevention measure in which neighbours help each
other in a form of informal guardianship The comparison group here is always council tenants
who intended to buy the public property in which they resided in 1988 within two years
Consistent with the finding in Appendix Table A1 that observable characteristics are equally
distributed between treatment group individuals and control group individuals the comparison
of Panel A and Panel B shows that these conclusions are unchanged whether the set of
observable controls described above is included in the estimating equation or not
Additional analysis using the BCS data corroborates our main findings for the effects
of the RTB policy on crime Table A2 in the Appendix uses the BCS data to compare crime
victimization rates among treated versus control group individuals The Table shows that in
1988 treatment group homeowners reported between 20 and 25 less cases of crime
victimisation since the beginning of 1987 than control group council tenants Columns (1) and
(3) show that this holds true regardless of whether county fixed effects are controlled for
Column (5) of the Table also shows results when county fixed effects are replaced by the share
of treatment group homeowners in the county24 The coefficient associated with
homeownership under the RTB scheme remains negative and statistically significant In
contrast the share of treatment group homeowners in the county itself does not predict crime
victimisation Thus while reiterating that the crime reductions in Tables 3-6 and Figure 6 are
indeed driven by RTB sales these results also show that RTB sales did not lead to increased
crime victimisation of neighbouring occupiers of public housing
Figure 7 shows county-specific estimates of the correlation between RTB sales and
crime victimisation plotted against county-specific estimates of the correlation between RTB
sales and home improvement A linear function fitting the distribution of county-specific
estimates is also shown This appears negative and statistically significant showing that on
average incumbent tenants who bought under the RTB scheme experienced greater crime
reduction in counties in which the RTB scheme was associated with greater home
improvement
24 For each respondent this share was calculated at the county level leaving out the respondent herselfhimself from the calculation
30
The low-income homeownership experiment in Oklahoma investigated by Engelhardt
et al (2010) showed little or no significant evidence of home improvements of this sort
subsequent to purchase but that study covered a relatively short time interval post-purchase
and take-up of the subsidy was relatively low In contrast the results in Table 8 for doorsrsquo and
windowsrsquo locks and burglar alarms are consistent with the notion that homeownership led
people to refurbish their properties Homeownership may have given greater access to loans
and financial markets in general and the result for theft insurance plausibly reflects this These
results help rationalise the reduction in property crime Controlling for past experiences of
burglary victimisation also mitigates the concern that RTB purchasers may have experienced
greater crime victimisation in the past and that this may drive the results in Table 8 In contrast
since homeowners were no more likely to join a neighbourhood watch scheme no evidence
appears here that the RTB induced greater investment in social capital in local communities
where RTB unfolded more intensively
Table A2 in the Appendix suggested that no crime displacement occurred from public
houses sold under the RTB scheme to neighbouring public housing not yet sold under the RTB
scheme However one may also worry that the property crime reduction in Table 5 is entirely
driven by reductions in burglary with potential thieves shifting albeit to a lesser extent to
other thefts in the street Table 9 shows the results of our analyses in Tables 4-6 broken down
by crime categories Panel A shows results for the 1975-85 period and Panel B shows results
for the 1975-92 period Results are displayed separately for the crime categories that constitute
our measure of property crime namely burglary and theft and handling of stolen goods as well
as for the crime categories that constitute our measure of violent crime namely violence against
the person sexual offences and robbery
Breaking down property crime into burglary and theft and handling of stolen goods
reveals that no evidence of such ldquodisplacementrdquo of crime appears The reduction in property
crime is driven by a reduction in burglaries although a reduction in theft and handling of stolen
goods appears in the 1975-85 period ie in Panel A The reduction in theft and handling of
stolen goods does not appear statistically significant by 1992 but certainly no increase in this
crime category appears Moreover and similarly the breakdown of the results for violent crime
by crime category shows no evidence of crime displacement across categories as violence
against the person and sexual offences remain unchanged Interestingly both by 1985 and by
1992 a significant negative effect of the RTB scheme is found on robberies which are
31
categorised as violent crimes here because they involve a violent act but they are also often
economically motivated criminal offences
iv Long-Run Estimates
a Empirical strategy
But what of the long-run consequences of homeownership on crime This section
presents estimates of the long-run effects of homeownership induced by the Right-to-Buy
(RTB) policy on local crime rates To do so an instrumental variable (IV) long-differenced
model specification is used which exploits variation in the size of the public housing stock in
1980 across localities As argued above exposure to the policy was bounded by the size of the
public housing stock in 1980 Localities with less public housing would not experience large
increases in the homeownership rate due to the more limited supply As discussed in Section
2 variation in the size of the public housing stock across localities arose due to historical events
around the period of the two World Wars events which are unrelated to recent dynamics of
crime In formal terms the set of estimating equations can be expressed as follows
1198621198621198941198942017 minus 1198621198621198941198942003 = 119886119886 + 1205731205731 lowast 11986711986712048412048492 + 1205731205732 lowast 11986211986211989411989480 + 1205731205733 lowast 119883119883119894119894 + 120598120598119894119894 (3)
11986711986711989411989492 = 119886119886 + 1205731205731 lowast 11986711986711989411989480 + 120598120598119894119894 (4)
where 1198621198621198941198942017 minus 1198621198621198941198942003 is the change in the crime rate in locality i from 2003 to 2017 and
11986711986711989411989492 is the endogenous change in the size of the public housing stock from 1980 to 1992
expressed as a proportion of the residential stock in 1980 11986711986711989411989492 is therefore instrumented with
11986711986711989411989480 the 1980 level of the public housing stock 11986211986211989411989480 is the crime rate in locality i in 1980 119883119883119894119894
is a vector of contemporaneous local area variables (ie the local log real hourly wages at the
25th and 50th percentiles of the distribution the local log unemployment rate and the local share
of 15-24 years olds in the population) and 120598120598119894119894 is the error term As crime data is available from
2003 at the Local Authority (LA) level this model can be estimated at the LA level
The identifying assumption in the model described in Equations (3) and (4) is that
conditional on the level of crime in 1980 and the set of contemporaneous local area variables
captured in the vector 119883119883119894119894 the size of the public housing stock in 1980 in the LA is exogenous
to the dynamics of crime within the LA in the 2000s The exclusion restriction is that
conditional on the level of crime in 1980 and the set of contemporaneous local area variables
in the vector 119883119883119894119894 the size of the public housing stock in 1980 affects the dynamics of crime in
the 2000s only through public housing sales over the subsequent period
32
b Results
Summary data for the dependent variable in Equation 3 and the set of local area
variables in the vector 119883119883119894119894 are shown in Table 10 The crime rate fell over the period in more
than 90 of LAs The 25th percentile log real hourly wage fell too over the period while the
share of 15-24 year olds in the population remained unchanged and the log unemployment rate
rose (at a national level the unemployment rate rose from 5 in March 2003 to 76 by March
2013 during the period following the financial crisis)
The instrumental variable regression requires a strong first-stage relationship between
the public housing stock in 1980 and subsequent RTB sales over the period 1980-92 Figure
A6 in Appendix A illustrates that there is a strong correlation between the size of the public
housing stock in the LA in 1980 and subsequent sales under the RTB policy The scatterplot in
the Figure shows a strong positive relationship The coefficient (standard error) on the
instrument in the first-stage regression is 0242 (0017) with a F-statistic from the regression
of 19555
Estimates of Equation 3 are shown in Table 11 Estimates are grouped by the three
measures of crime examined above the overall crime rate in columns (1)-(3) property crime
rate in columns (4)-(6) and violent crime rate in columns (7)-(9) The leftmost specification for
each outcome includes only the independent variable of interest 11986711986711989411989492 instrumented by 11986711986711989411989480
For each outcome the coefficient on 11986711986711989411989492 is negative and precisely defined The middle
column of each sub-panel adds local area variables to the model with the rightmost column of
each sub-panel also adding a control for the crime rate in 1980 The coefficient on 11986711986711989411989492 remains
negative and precisely defined in each specification
The coefficient estimates imply that LAs experiencing larger increases in
homeownership experienced more rapid crime reductions The coefficient value of 0244 in
column (3) of Table 11 implies that a five percentage point higher increase in the
homeownership rate due to RTB sales caused an approximately fifty percent faster decline in
crime rate over the period 2003-2017 an effect approximately equal to a one standard deviation
higher speed of reduction in crime Among the covariates in all of the regressions the controls
for the level of crime in 1980 return negative and precisely defined coefficients These imply
a degree of convergence in LA level crime rates LAs with higher crime rates in 1980
experienced a faster decline in crime in the early 2000s conditional on the other covariates in
the regression
33
c Additional Long-Run Estimates
Did the RTB scheme leave any detectable mark on house prices and political
preferences of indigenous communities In this final sub-section the long-run effects of
increases in the homeownership rate brought about by RTB sales on house prices and on voting
behaviour are examined The increase in the homeownership rate via RTB sales increased the
potential housing supply to the private resale market Hence all else being equal RTB sales
would be expected to decrease house prices over time On the other hand the RTB scheme
may have also potentially increased the demand for housing in the private resale market
Moreover in the presence of outward migration of low-income households and inward
migration of higher-income households RTB sales may have had a positive impact on house
prices over time
To explore the impact of RTB sales on house prices in column (1) of Table 12 the
dependent variable was replaced with the change in the log of the average house price in the
LA over the period 2003 to 2014 House price data is obtained from the Land Registry house
price index The set of control variables is the same as in the models shown in Column (2) of
Table 11 The coefficient on RTB sales is negative and precisely defined and it implies that a
five percentage point increase in the homeownership rate due to RTB sales decreased house
prices over the period by approximately 65 This is an economically modest effect in the
context of an approximate doubling of house prices on average in LAs over the sample period
However this result highlights the general equilibrium effects of RTB sales on the housing
market
Second the effects of RTB sales on voting behaviour in LA elections were also
estimated To do so LA-level data on vote shares in the local election were matched to the
housing and crime data used so far and the changes in the Conservative vote share within the
LA over the period 1995 ndash 2015 were constructed and modelled as the dependent variable in
the regression The sample size in these estimates is smaller owing to the fact that the timing
of LA election cycles varies across LAs In Table 12 the coefficient on the RTB sales variable
is positive and precisely defined Hence these estimates suggest that the RTB policy was
effective in increasing the Conservative vote share in localities that saw larger increases in the
homeownership rate under the policy This result echoes the conclusion in Di Tella Galiani
and Schargrodsky (2007) that show that lucky squatters who received legal titles in Buenos
Aires in the 1990s report beliefs closer to those that favour the workings of a free market
34
5 Conclusion
This paper studies local crime reduction connected to the increase in homeownership rates
induced by the UK Governmentrsquos Right To Buy (RTB) scheme since 1980 One of the key
goals of the RTB scheme was as it were to lsquogentrifyrsquo households endogenously Specifically
it aimed to ease access to an owned property for (broadly) working class families and in doing
so to alter their behaviour and induce them to take greater care of their property as well as to
alter their economic position by giving them a collateral asset in financial markets The RTB
scheme offered a means of upgrading the economic position of households in neighbourhoods
previously dominated by public housing
The RTB scheme led to a reduction in crime Estimates from the Thatcher era uncover
an elasticity of crime with respect to eligibility to sales of public housing of roughly -03
implying that a 10 percent increase in eligibility to public housing sales reduced crime by
around 3 percent The RTB scheme led to a reduction in both property crime and robberies
and both short run and longer run evidence of crime reduction is presented However rather
than being driven by changes in the composition of households through inward and outward
migration the key mechanisms underlying the reduction in crime rates appear to be the
behavioural changes that the RTB scheme induced within the local community The findings
suggest that new renters-come-homeowners as a result of RTB altered their behaviour in
response to the incentives arising from acquisition of housing wealth They made their
properties safer and gained greater access to the insurance markets
While no evidence is found of compositional changes in the local population of
different regions of the country signs of this behavioural change appear from the early years
of the policy when no resales of properties bought under the RTB scheme could have taken
place while continuing to benefit from the discounts offered under this scheme In line with
this conclusion and contrary to what a migration-based model of gentrification would predict
house prices decreased in the long run and Conservative votes increased in areas most affected
by the RTB scheme These results therefore vindicate the Thatcher rationale for the policy
More broadly they suggest that increasing homeownership reduces local crime as public
housing tenants become owners of their own homes separately from the process of
gentrification whereby low-income neighbourhoods become middle-income neighbourhoods
through outward migration of low-income households and inward migration of higher-income
households These results complement the existing literature and inform policy by showing
how granting homeownership to indigenous communities can also act to reduce crime
35
Before concluding some words of caution are necessary First although the results
conform to the Thatcher rationale for the policy they certainly do not vindicate it overall to
show that would require a more general welfare analysis Indeed an analysis of this sort
presented in Disney and Guo (2017) suggests that the RTB policy generated complex inter-
and intra-generational welfare effects and that welfare-improving adjustments to the policy
should have been considered The welfare implications of the broad shift from direct provision
of public housing to cash transfers for purchase of housing services in the UK implied by RTB
and other policies akin to the US also requires further analysis Nonetheless the change in
behaviour and beliefs in indigenous communities documented here shows a novel means not
fully documented to date that complements the existing literature based on different research
designs and settings by which homeownership and housing policy may contribute to reduce
criminality Thus housing provision and subsidized homeownership have scope to act as
potentially important features of the sizable crime drops observed in the United States and
several other Western economies since the 1990s
36
References
Aliprantis D and D Hartley (2015) Blowing it up and knocking it down the local and city-
wide effects of demolishing high concentration public housing on crime Journal of Urban
Economics 88 67-81
Aliprantis D and F G-C Richter (forthcoming) Evidence of Neighborhood Effects from
Moving to Opportunity LATEs of Neighborhood Quality Review of Economics and
Statistics Forthcoming
Alonso J R Andrews and V Jorda Gil (2019) Do neighbourhood renewal programs reduce
crime rates Evidence from England Journal of Urban Economics 110 March 51-69
Altonji J G and R K Mansfield (2018) Estimating Group Effects Using Averages of
Observables to Control for Sorting on Unobservables School and Neighborhood Effects
American Economic Review 108 (10) 2902-46
Autor D C Palmer and P Pathak (2019) Ending rent control reduced crime in Cambridge
American Economic Association papers and Proceedings 109 381-384
Bell B J Blundell and S Machin (2018) The changing geography of intergenerational
mobility CEP Discussion Paper No 1591 Centre for Economic Performance London School
of Economics and Political Science London UK
Bergman P R Chetty S DeLuca N Hendren L F Katz and C Palmer (2020) Creating
Moves to Opportunity Experimental Evidence on Barriers to Neighborhood Choice Working
paper
Bernasco W T de Graaf J Rouwendal and W Steenbeek (2017) Social interactions and
crime revisited an investigation using individual offender data in Dutch neighborhoods The
Review of Economics and Statistics 99 622ndash636
Blanden J and S Machin (2017) Home Ownership and Social Mobility CEP Discussion
Paper No 1466 Centre for Economic Performance London School of Economics and Political
Science London UK
Cameron A C J G Gelbach and D L Miller (2008) Bootstrap-based improvements for
inference with clustered errors Review of Economics and Statistics 90(3)414ndash27
37
Chetty R and N Hendren (2018a) The Impacts of Neighborhoods on Intergenerational
Mobility I Childhood Exposure Effects Quarterly Journal of Economics 133 (2018a) 1107ndash
1162
Chetty R and N Hendren (2018b) The Impacts of Neighborhoods on Intergenerational
Mobility II County-Level Estimates Quarterly Journal of Economics 133 (2018b) 1163ndash
1228
Chetty R N Hendren and L F Katz (2016) The Effects of Exposure to Better
Neighborhoods on Children New Evidence from the Moving to Opportunity Experiment
American Economic Review 106 (4) 855-902
Chyn E (2018) Moved to opportunity the long-run effects of public housing demolition on
children American Economic Review 108 (10) 3028-56
Cullen J and S Levitt (1999) Crime urban flight and the consequences for cities Review of
Economics and Statistics 81 2 159-169
Damm A and C Dustmann (2014) Does growing up in a high crime neighborhood affect
youth criminal behavior American Economic Review 104 1806ndash1832
Di Pasquale D and E Glaeser (1999) Incentives and social capital are homeowners better
citizens Journal of Urban Economics 45 354-384
Di Tella R S Galiani and E Schargrodsky (2007) The formation of beliefs evidence from
the allocation of land titles to squatters The Quarterly Journal of Economics 122(1) 209-241
Diamond R and T McQuade (2019) Who wants affordable housing in their backyard An
equilibrium analysis of low-income property development Journal of Political Economy 127
no 3 (June 2019) 1063-1117
Disney R and G Luo (2017) The Right to Buy public housing in Britain a welfare analysis
Journal of Housing Economics 35 51-68
Ellen I K Horn and D Reed (2017) Has falling crime invited gentrification US Census
Bureau Center for Economic Studies Paper No CES-WP-17-27 March Washington DC
Engelhardt G M Eriksen W Gale and G Mills (2010) What are the social benefits of home
ownership Experimental evidence for low income households Journal of Urban Economics
67 249-258
38
Fryer R G Jr and L F Katz (2013) Achieving Escape Velocity Neighborhood and School
Interventions to Reduce Persistent Inequality American Economic Review 103 (3) 232ndash37
Gibbons S (2004) The costs of urban property crime The Economic Journal 113 F441-462
Gregg P S Machin and A Manning (2004) Mobility and joblessness In Card D Blundell
R and Freeman R (eds) Seeking a premier economy the economic effects of British economic
reform 1980-2000 371-410 NBER Chicago Chicago University Press
Grogger J (2002) The effects of civil gang injunctions on reported violent crime evidence
from Los Angeles County The Journal of Law amp Economics 45(1) 69-90
doi101086338348
Haurin D R Dietz and B Weinberg (2003) The impact of neighbourhood homeownership
rates a review of the theoretical and empirical literature Journal of Housing Research 13
119-151
Hausman N T Ramot-Nyska and N Zussman (2020) Homeownership Labor Supply and
Neighborhood Quality Working paper 2020
Hilber C and W Vermuelen (2014) The impact of supply constraints on house prices in
England The Economic Journal 126 March 358-405
Jones C and A Murie (2006) The Right to Buy analysis and evaluation of a housing policy
Blackwell Oxford
Jones RV (1978) Most Secret War London Hamish Hamilton
Katz L J R Kling and J B Liebman (2001) Moving to opportunity in Boston early results
of a randomized mobility experiment Quarterly Journal of Economics 116 607ndash654
Kling J R J B Liebman and L F Katz (2007) Experimental Analysis of Neighborhood
Effects Econometrica 75 (1) 83ndash119
Kling J R J Ludwig and L F Katz (2005) Neighborhood Effects on Crime for Female and
Male Youth Evidence from a Randomized Housing Voucher Experiment Quarterly Journal
of Economics 120 87ndash130
Landersoslash R HS Nielsen and M Simonsen (2016) School starting age and the crime-age
profile The Economic Journal 127 1096ndash1118
39
Ludwig J G J Duncan L A Gennetian L F Katz R C Kessler J R Kling and L
Sanbonmatsu (2013) Long-Term Neighborhood Effects on Low Income Families Evidence
from Moving to Opportunity American Economic Review 103 (3) 226ndash31
Ludwig J G J Duncan and P Hirschfield (2001) Urban poverty and juvenile crime
evidence from a randomized experiment Quarterly Journal of Economics 116 655ndash679
Ludwig J and J R Kling (2007) Is Crime Contagious The Journal of Law and Economics
50(3) 491ndash518
McDonald S (1986) Does gentrification affect crime rates Crime and Justice 8 163-201
Machin S and C Meghir (2004) Crime and economic incentives Journal of Human
Resources 39(4) 958-79
Morales-Mosquera M (2019) The economic value of crime control evidence from a large
investment on police infrastructure in Colombia Unpublished draft Harris School of Public
Policy at the University of Chicago
Murie A (1997) Linking housing changes to crime Social Policy and Administration 31 5
22-36
Office of National Statistics (2013) A century of home ownership in England and Wales
London
Olsen E (2003) Housing programs for low-income households In Moffitt R (ed) Means-
tested transfer programs in the United States 365-442 Chicago Chicago University Press
Owens E M Mioduszewski and C Bates (2019) How valuable are civil liberties Evidence
from gang injunctions crime and housing prices in Southern California Unpublished draft
Department of Criminology Law and Society and Department of Economics University of
California Irvine
Quetelet A (1831) [1984] Research on the propensity for crime at different ages translated
and introduced by Sawyer F Sylvester Cincinnati Anderson
Ridgeway G J Grogger R A Moyer and J M MacDonald (2018) Effect of gang
injunctions on crime a study of Los Angeles from 1988ndash2014 Journal of Quantitative
Criminology httpsdoi101007s10940-018-9396-7
40
Rotger G P and G C Galster (2019) Neighborhood peer effects on youth crime natural
experimental evidence Journal of Economic Geography Volume 19 Issue 3 May 2019 Pages
655ndash676 httpsdoiorg101093jeglby053
Sanbonmatsu L J Ludwig L Katz L Gennetian G Duncan R Kessler E Adam T
McDade and S Lindau (2011) Impacts of the Moving to Opportunity for Fair Housing
Demonstration Program after 10 to 15 Years Washington (DC) US Department of Housing
and Urban Development Office of Policy Development and Research November published
at httpwwwhuduserorgportalpublicationspdfMTOFHD_fullreport_v2pdf
Sandler D (2017) Externalities of public housing the effect of public housing demolition on
local crime Regional Science and Urban Economics 62 January 24-35
Schill M (1993) Distressed public housing where do we go from here University of Chicago
Law Review 60 2 497-554
Sciandra M L Sanbonmatsu G J Duncan L A Gennetian L F Katz R C Kessler J R
Kling and J Ludwig (2013) Long-Term Effects of the Moving to Opportunity Residential
Mobility Experiment on Crime and Delinquency Journal of Experimental Criminology 9 (4)
451ndash89
Sodini P S Van Nieuwerburgh R Vestman and U Von Lilienfeld-Toal (2017) Identifying
the Benefits from Home Ownership A Swedish Experiment Working paper
Van Dijk J and B Vollaard (2012) Self-Limiting crime waves in J Van Dijk A Tseloni
and G Farrell (eds) The International Crime Drop 2012 Palgrave MacMillan New York
Source Reproduced from Disney and Luo (2017) Chart 1 calculated from Office for National Statistics (2013)
0
10
20
30
40
50
60
70
80
90
100
1918 1939 1953 1961 1971 1981 1991 2001 2011
Figure 1 Housing Tenure Shares by Tenure Type England and Wales 1918-2011
Owning Private renting Social renting
42
Source Department of Communities and Local Government Housing Statistics Table 678
0
20 000
40 000
60 000
80 000
100 000
120 000
140 000
160 000
180 000
1980
-81
1983
-84
1986
-87
1989
-90
1992
-93
1995
-96
1998
-99
2001
-02
2004
-05
2007
-08
2010
-11
2013
-14
Publ
ic H
ousi
ng
Figure 2 Right to-Buy and Other Sales of Public Housing in England 1980-81 to 2013-14
Council house sales (mostly RTB) Sales of other social housing
43
Figure 3 Correlation Between Crime and Public Housing in 1980 Police Force Area (PFA)
Coeff (se) = 0001 (0000)
0
002
004
006
008
01
Crim
e in
198
0
10 20 30 40 50 Public Housing in 1980
Police Force Area Linear Fit
Crime vs Public Housing in 1980
Notes Figure shows for each Police Force Area (PFA) the crime rate in 1980 plotted against the fraction of public housing as a percent of the total residential stock in 1980 Crime is defined as total yearly counts of property and violent crime offences per population at the PFA level Property crime defined as total yearly counts of burglary and theft or handling of stolen goods offences per population at the PFA level Violent crime defined as total yearly counts of robbery violent and sexual offences per population at the PFA level A linear function fitting the correlation between the PFA-specific fraction of public housing and the crime rate weighted by PFA-specific population size in 1980 is also shown
44
Figure 4 Correlation Between Right-To-Buy (RTB) Public Housing Sales by 1981 and Tenure Duration in Public Housing in 1980
Coeff (se) = 0969 (0270)
0
1
-05
05
Log
Publ
ic H
ousi
ng S
ales
in 1
980-
81
2 22 24 26 28 3Log Public Housing Tenure in 1980
Police Force Area Linear Fit
Public Housing Sales in 1980-81 vs Tenure in 1980
Notes Figure shows for each Police Force Area (PFA) the log sales of public housing under the Right-To-Buy (RTB) scheme by 1981 plotted against PFA-specific log average years of tenure duration in public housing in 1980 A linear function fitting the distribution of PFA-specific log sales and log tenure duration weighted by PFA-specific population size in 1980 is also shown For each PFA in the analysis the horizontal axis shows the log value of average years of tenure duration in public housing in 1980 whereas the vertical axis shows the log count of sales of public housing under the RTB scheme by 1981 as a percent of the total residential stock in 1980
45
Figure 5 Correlation Between Right-To-Buy (RTB) Public Housing Sales in 1980-92 and RTB Public Housing Sales by 1981
Coeff (se) = 0513 (0090)
15
2
25
3
Log
Publ
ic H
ousi
ng S
ales
in 1
980-
92
0 1-05 05Log Public Housing Sales in 1980-81
Police Force Area Linear Fit
Public Housing Sales in 1980-92 vs 1980-81
Notes Figure shows for each Police Force Area (PFA) the log sales of public housing under the Right-To-Buy (RTB) scheme by 1992 plotted against PFA-specific log sales of public housing under the RTB scheme by 1981 A linear function fitting the distribution of PFA-specific log sales weighted by PFA-specific population size in 1980 is also shown For each PFA in the analysis the horizontal axis shows the log count of sales of public housing under the RTB scheme by 1981 as a percent of the total residential stock in 1980 whereas the vertical axis shows the log count of sales of public housing under the RTB scheme by 1992 as a percent of the total residential stock in 1980
46
Figure 6 Crime Rates in Intention-To-Treat (ITT) Treatment Police Force Areas (PFAs) and in ITT Control PFAs 1975-1992
002
004
006
008
01
Wei
ghte
d A
vera
ge a
nd 9
5 C
I
1975 1980 1987 1992Year
ITT Treatment PFAs (Housing Tenure in 1980 gt= p50)ITT Control PFAs (Housing Tenure in 1980 lt p50)
Crime Rates in ITT Treatment vs ITT Control PFAs
Notes Figure shows crime rates separately for ITT Treatment PFAs (Housing Tenure duration in 1980 gt= p50) and ITT Control PFAs (Housing Tenure duration in 1980 lt p50) Crime defined as total yearly counts of property and violent crime offences per population at the PFA level Property crime defined as total yearly counts of burglary and theft or handling of stolen goods offences per population at the PFA level Violent crime defined as total yearly counts of robbery violent and sexual offences per population at the PFA level Reported dots are averages weighted by population at the PFA level and capped bars are 95 confidence intervals
47
Figure 7 County-Specific Estimates of Correlation between Right-To-Buy (RTB) Public Housing Sales and Crime Victimisation against County-Specific Estimates of Correlation between RTB Public Housing Sales and Home Improvement 1988
Coeff (se) = -0518 (0271)
-2
-1
0
1
2
RTB
and
Crim
e Vi
ctim
isat
ion
-1 0 1-05 05RTB and Home Improvement
County-specific Effect Linear Fit
RTB and Crime Victimisation vs RTB and Home Improvement
Notes The figure shows county-specific estimates of the correlation between Right-To-Buy Scheme (RTB) public housing sales and crime victimisation plotted against county-specific estimates of the correlation between RTB public housing sales and home improvement A linear function fitting the distribution of county-specific estimates is also shown For each county in the analysis the horizontal axis shows the estimate of the correlation between RTB public housing sales and home improvement whereas the vertical axis shows county-specific estimates of the correlation between RTB public housing sales and crime victimisation Treatment group defined as homeowners who rented from the council the property in which they currently reside prior to buying it Control group defined as council tenants who currently intend to buy the public property in which they reside within two years
48
Table 1 Summary Data for 1980 Police Force Authorities (PFA)
Percentiles Mean Standard
Deviation Min Max p25 p50 p75 p90
Housing Stock Public Housing Stock ( Residential Stock) 27202 8574 14568 43798 21865 22966 34096 41869 Public Housing Sales by 1981 ( Residential Stock) 1231 0410 0735 2516 0910 1248 1417 1680 Public Housing Years of Tenure 11052 1875 8274 17936 9977 11302 11721 12843 Public Housing Units 191721 177523 27612 563046 71116 98794 246040 563046 Residential Stock Units 725288 738428 128410 2462295 301632 427384 639665 2462295 Crime Variables All Crime Rate 0045 0016 0020 0069 0031 0038 0060 0069 Property Crime Rate 0042 0015 0019 0065 0030 0035 0057 0065 Violent Crime Rate 0003 0001 0001 0006 0002 0003 0003 0004 Covariates Log Unemployment Rate -2885 0357 -3730 -2120 -3219 -2882 -2688 -2435 Log 25th Percentile Real Hourly Earnings 1345 0070 1228 1497 1305 1327 1360 1497 Log 50th Percentile Real Hourly Earnings 1613 0069 1488 1751 1565 1606 1635 1751 Fraction 15-24 Year Olds in Population 0157 0008 0138 0173 0152 0158 0162 0165 Observations 42
Notes Crime variables are measured as crime rates at the Police Force Area (PFA) level Crime defined as total yearly counts of property and violent crime offences per population at the PFA level Property crime defined as total yearly counts of burglary and theft or handling of stolen goods offences per population at the PFA level Violent crime defined as total yearly counts of robbery violent and sexual offences per population at the PFA level Local area variables are the log of the unemployment rate the 25th percentile log real hourly wage and the share of 15-24 year olds in the population each measured at the PFA geography
49
Table 2 Crime Rate Public Housing Stock and Tenure Duration in 1980 OLS Estimates Police Force Area (PFA)
All Crime
Property Crime
Violent Crime
Log Housing Tenure Duration
(1) (2) (3) (4) (5) (6) (7) (8) Public Housing (Prop Res Stock) 0087
(0028) 0064
(0017) 0082
(0026) 0059
(0017) 0005
(0001) 0004
(0001) 0082
(0317) -0023 (0447)
Log Unemployment Rate 0016 (0005)
0015 (0005)
0001 (0000)
0015 (0104)
Log 25th Percentile Real Hourly Earnings 0398 (0080)
0378 (0076)
0020 (0006)
-2358 (1425)
Log 50th Percentile Real Hourly Earnings -0252 (0078)
-0238 (0074)
-0014 (0007)
1400 (1440)
Fraction 15-24 Year Olds in Population 0574 (0219)
0546 (0206)
0028 (0016)
-2914 (2764)
Observations 42 42 42 42 42 42 42 42
Notes Table reports estimates from Ordinary Least Squares regression models Dependent variables are crime rates Crime defined as total yearly counts of property and violent crime offences per population at the Police Force Area (PFA) level Property crime defined as total yearly counts of burglary and theft or handling of stolen goods offences per population at the PFA level Violent crime defined as total yearly counts of robbery violent and sexual offences per population at the PFA level Data units are 42 PFAs in 1980 Standard errors shown in parenthesis indicates significance at 1 indicates significance at 5 indicates significance at 10
50
Table 3 Difference-in-Differences Before and After the Right-To-Buy Scheme
Intention-To-Treat (ITT)
Treatment PFAs (Log Public Housing Tenure Duration in 1980
gt= p50)
Intention-To-Treat (ITT)
Control PFAs (Log Public Housing Tenure Duration in 1980
lt p50)
Difference ((1) - (2))
Unconditional
DiD
Unconditional DiD Effect ((4) Pre (2))
(1) (2) (3) (4) (5) Panel A All Crime 1975-85 Pre- 0034 0047 -0013 Post- 0043 0060 -0017 Post ndash Pre 0009 0013 -0004
(p = 0085) -85
Number of Police Force Areas 21 21 Number of Observations 231 231 Panel B All Crime 1975-92 Pre- 0035 0047 -0012 Post- 0053 0070 -0017 Post ndash Pre 0018 0023 -0005
(p = 0072) -106
Number of Police Force Areas 21 21 Number of Observations 378 378
Notes Post-period defined as starting from 1980 the date of adoption of the Right to Buy (RTB) Policy in England and Wales Panel A shows results for the 1975-85 period and Panel B shows results for the 1975-92 period Crime defined as total yearly counts of property and violent crime offences per population at the Police Force Area (PFA) level Property crime defined as total yearly counts of burglary and theft or handling of stolen goods offences per population at the PFA level Violent crime defined as total yearly counts of robbery violent and sexual offences per population at the PFA level Averages weighted by population at the PFA level Standard errors were clustered at the PFA level and p-values from Wild Cluster Bootstrap are reported in parentheses Effect calculated as estimated coefficient divided by mean of dependent variable prior to 1980 in the ITT control group PFAs (Public Housing Tenure duration in 1980 lt p50)
Table 4 Estimates of Impact of Right-To-Buy Scheme on Crime
ITT 1975-85 IV 1975-85 ITT 1975-92 (1) (2) (3) (4) (5) (6) (7) (8) (9)
(Log RTB Sales in 1980-81) x Post -0013 (p = 0012)
-0020 (p = 0026)
(Log Tenure gt= p50) x Post -0005 (p = 0085)
-0006 (p = 0073)
Log Tenure x Post -0009 (p = 0055)
-0013 (p = 0087)
-0013 (p = 0038)
-0017 (p = 0049)
Log Tenure x 1988-92 -0018 (p = 0047)
Log Tenure x 1980-87 -0017 (p = 0090)
Log Tenure x 1979 -0009 (p = 0183)
-0009 (p = 0183)
-0009 (p = 0189)
-0009 (p = 0189)
Log Tenure x 1978 -0007 (p = 0514)
-0007 (p = 0541)
-0007 (p = 0525)
-0007 (p = 0525)
Log Tenure x 1977 -0005 (p = 0611)
-0005 (p = 0623)
-0005 (p = 0628)
-0005 (p = 0628)
Effect -10638 -0191 -0277 -0277 -0425 -12766 -0277 -0362 Effect x 1988-92 -0383 Effect x 1980-87 -0362
Log Unemployment Rate in 1980 x Post No Yes Yes Yes Yes No Yes Yes Yes Log 25th Percentile Earnings in 1980 x Post No Yes Yes Yes Yes No Yes Yes Yes Log 50th Percentile Earnings in 1980 x Post No Yes Yes Yes Yes No Yes Yes Yes Fraction 15-24 Years Old in 1980 x Post No Yes Yes Yes Yes No Yes Yes Yes Fraction of Public Housing in 1980 x Post No Yes Yes Yes Yes No Yes Yes Yes PFA Fixed Effects Yes Yes Yes Yes Yes Yes Yes Yes Yes Year Fixed Effects Yes Yes Yes Yes Yes Yes Yes Yes Yes
First Stage Coefficient on ITT 0647 (p = 0015)
0647 (p = 0019)
Sample Size 462 462 462 462 462 756 756 756 756 Number of PFAs 42 42 42 42 42 42 42 42 42
Notes Post-period defined as starting from 1980 the date of adoption of the Right to Buy (RTB) Policy in England and Wales Columns (1)-(5) show ITT and IV results for the 1975-85 period and Columns (6)-(9) show ITT results for the 1975-92 period Tenure duration in public housing measured in years and calculated in 1980 Sales of public housing calculated in 1980-81 Crime defined as total yearly counts of property and violent crime offences per population at the Police Force Area (PFA) level Property crime defined as total yearly counts of burglary and theft or handling of stolen goods offences per population at the PFA level Violent crime defined as total yearly counts of robbery violent and sexual offences per population at the PFA level Regressions weighted by population at the PFA level Standard errors were clustered at the PFA level and p-values from Wild Cluster Bootstrap are reported in parentheses Effect calculated as estimated coefficient divided by pre-1980 mean of dependent variable in ITT control group (Public Housing Sales by 1981 lt p50) indicates significance at 1 indicates significance at 5 indicates significance at 10
Table 5 Estimates of Impact of Right-To-Buy Scheme on Property Crime
ITT 1975-85 IV 1975-85 ITT 1975-92 (1) (2) (3) (4) (5) (6) (7) (8) (9)
(Log RTB Sales in 1980-81) x Post -0013 (p = 0012)
-0018 (p = 0021)
(Log Tenure gt= p50) x Post -0004 (p = 0089)
-0005 (p = 0102)
Log Tenure x Post -0008 (p = 0052)
-0012 (p = 0085)
-0012 (p = 0038)
-0016 (p = 0052)
Log Tenure x 1988-92 -0015 (p = 0095)
Log Tenure x 1980-87 -0017 (p = 0099)
Log Tenure x 1979 -0008 (p = 0168)
-0008 (p = 0173)
-0008 (p = 0177)
-0008 (p = 0177)
Log Tenure x 1978 -0006 (p = 0518)
-0006 (p = 0546)
-0006 (p = 0535)
-0006 (p = 0535)
Log Tenure x 1977 -0004 (p = 0609)
-0004 (p = 0619)
-0004 (p = 0624)
-0004 (p = 0623)
Effect -9091 -0182 -0273 -0295 -0409 -11364 -0273 -0364 Effect x 1988-92 -0341 Effect x 1980-87 -0386
Log Unemployment Rate in 1980 x Post No Yes Yes Yes Yes No Yes Yes Yes Log 25th Percentile Earnings in 1980 x Post No Yes Yes Yes Yes No Yes Yes Yes Log 50th Percentile Earnings in 1980 x Post No Yes Yes Yes Yes No Yes Yes Yes Fraction 15-24 Years Old in 1980 x Post No Yes Yes Yes Yes No Yes Yes Yes Fraction of Public Housing in 1980 x Post No Yes Yes Yes Yes No Yes Yes Yes PFA Fixed Effects Yes Yes Yes Yes Yes Yes Yes Yes Yes Year Fixed Effects Yes Yes Yes Yes Yes Yes Yes Yes Yes
First Stage Coefficient on ITT 0647 (p = 0015)
0647 (p = 0019)
Sample Size 462 462 462 462 462 756 756 756 756 Number of PFAs 42 42 42 42 42 42 42 42 42
Notes Post-period defined as starting from 1980 the date of adoption of the Right to Buy (RTB) Policy in England and Wales Columns (1)-(5) show ITT and IV results for the 1975-85 period and Columns (6)-(9) show ITT results for the 1975-92 period Tenure duration in public housing measured in years and calculated in 1980 Sales of public housing calculated in 1980-81 Property crime defined as total yearly counts of burglary and theft or handling of stolen goods offences per population at the Police Force Area (PFA) level Regressions weighted by population at the PFA level Standard errors were clustered at the PFA level and p-values from Wild Cluster Bootstrap are reported in parentheses Effect calculated as estimated coefficient divided by pre-1980 mean of dependent variable in ITT control group (Public Housing Sales by 1981 lt p50) indicates significance at 1 indicates significance at 5 indicates significance at 10
53
Table 6 Estimates of Impact of Right-To-Buy Scheme on Violent Crime
ITT 1975-85 IV 1975-85 ITT 1975-92 (1) (2) (3) (4) (5) (6) (7) (8) (9)
(Log RTB Sales in 1980-81) x Post -0001 (p = 0166)
-0001 (p = 0104)
(Log Tenure gt= p50) x Post -0000 (p = 0186)
-0001 (p = 0124)
Log Tenure x Post -0000 (p = 0228)
-0001 (p = 0202)
-0001 (p = 0204)
-0001 (p = 0212)
Log Tenure x 1988-92 -0003 (p = 0383)
Log Tenure x 1980-87 -0000 (p = 0697)
Log Tenure x 1979 -0001 (p = 0480)
-0001 (p = 0493)
-0001 (p = 0480)
-0001 (p = 0481)
Log Tenure x 1978 -0001 (p = 0472)
-0001 (p = 0480)
-0001 (p = 0474)
-0001 (p = 0475)
Log Tenure x 1977 -0000 (p = 0653)
-0000 (p = 0611)
-0000 (p = 0654)
-0000 (p = 0655)
Effect -0 -0 -0333 -0333 -0333 -33333 -0333 -0333 Effect x 1988-92 -1 Effect x 1980-87 -0
Log Unemployment Rate in 1980 x Post No Yes Yes Yes Yes No Yes Yes Yes Log 25th Percentile Earnings in 1980 x Post No Yes Yes Yes Yes No Yes Yes Yes Log 50th Percentile Earnings in 1980 x Post No Yes Yes Yes Yes No Yes Yes Yes Fraction 15-24 Years Old in 1980 x Post No Yes Yes Yes Yes No Yes Yes Yes Fraction of Public Housing in 1980 x Post No Yes Yes Yes Yes No Yes Yes Yes PFA Fixed Effects Yes Yes Yes Yes Yes Yes Yes Yes Yes Year Fixed Effects Yes Yes Yes Yes Yes Yes Yes Yes Yes
First Stage Coefficient on ITT 0647 (p = 0015)
0647 (p = 0019)
Sample Size 462 462 462 462 462 756 756 756 756 Number of PFAs 42 42 42 42 42 42 42 42 42
Notes Post-period defined as starting from 1980 the date of adoption of the Right to Buy (RTB) Policy in England and Wales Columns (1)-(5) show ITT and IV results for the 1975-85 period and Columns (6)-(9) show ITT results for the 1975-92 period Tenure duration in public housing measured in years and calculated in 1980 Sales of public housing calculated in 1980-81 Violent crime defined as total yearly counts of robbery violent and sexual offences per population at the Police Force Area (PFA) level Regressions weighted by population at the PFA level Standard errors were clustered at the PFA level and p-values from Wild Cluster Bootstrap are reported in parentheses Effect calculated as estimated coefficient divided by pre-1980 mean of dependent variable in ITT control group (Public Housing Sales by 1981 lt p50) indicates significance at 1 indicates significance at 5 indicates significance at 10
54
Table 7 Estimates of Impact of Right-To-Buy (RTB) Public Housing Tenure Duration on Local Area Outcomes and (Log) Value of RTB Public Housing Sales on Crime 1975 ndash 1992
Log
Unemployment Rate
Log 25th Percentile Real
Hourly Earnings
Log 50th Percentile Real
Hourly Earnings
Fraction 15-24 Years Old in Population
Total Crime Log Count of Police Officers
(1) (2) (3) (4) (5) (6) Log Tenure x Post -0168
(p = 0313) -0079
(p = 0269) -0076
(p = 0346) 0002
(p = 0746) -0024
(p = 0594) Log Value Sales x Post 0002
(p = 0280)
Effect 0014 0043 Log Unemployment Rate in 1980 x Post No Yes Yes Yes Yes Yes Log 25th Percentile Earnings in 1980 x Post Yes No No Yes Yes Yes Log 50th Percentile Earnings in 1980 x Post Yes No No Yes Yes Yes Fraction 15-24 Years Old in 1980 x Post Yes Yes Yes No Yes Yes Fraction of Public Housing in 1980 x Post Yes Yes Yes Yes Yes Yes PFA Fixed Effects Yes Yes Yes Yes Yes Yes Year Fixed Effects Yes Yes Yes Yes Yes Yes Sample Size 756 756 756 756 756 756 Number of PFAs 42 42 42 42 42 42
Notes Post-period defined as starting from 1980 the date of adoption of the Right to Buy (RTB) Policy in England and Wales Tenure duration in public housing measured in years and calculated in 1980 Value of sales of public housing calculated by 1981 Local area outcomes measured at the PFA level Crime defined as total yearly counts of property and violent crime offences per population at the Police Force Area (PFA) level Property crime defined as total yearly counts of burglary and theft or handling of stolen goods offences per population at the PFA level Violent crime defined as total yearly counts of robbery violent and sexual offences per population at the PFA level Regressions weighted by population at the PFA level Standard errors were clustered at the PFA level and p-values from Wild Cluster Bootstrap are reported in parentheses Effect calculated as estimated coefficient divided by pre-1980 mean of dependent variable in ITT control group (Public Housing Tenure duration in 1980 lt p50) except in columns (1) (2) and (5) where the dependent variable is measured in log values
55
Table 8 Correlation between Right-To-Buy Public Housing Sales and Home Improvement Insurance and Social Behaviour 1988
Installed Double Locks on Outside
Doors
Installed Locks on Windows
Theft Insurance of Home Contents
Installed Burglar Alarm
Neighbourhood Watch Scheme
(1) (2) (3) (4) (5) Panel A RTB Scheme 0217
(p = 0000) 0193
(p = 0000) 0251
(p = 0000) 0043
(p = 0037) 0005
(p = 0828) Effect 606 1304 384 2263 81 Panel B RTB Scheme 0232
(p = 0000) 0168
(p = 0003) 0239
(p = 0000) 0048
(p = 0046) 0018
(p = 0505) Effect 648 1135 365 2526 29 Gender Yes Yes Yes Yes Yes Ethnicity Yes Yes Yes Yes Yes Log Age (quadratic) Yes Yes Yes Yes Yes Past Burglary Victimization Yes Yes Yes Yes Yes Household Type Yes Yes Yes Yes Yes Household Rooms Yes Yes Yes Yes Yes Household Income Yes Yes Yes Yes Yes County Fixed Effects Yes Yes Yes Yes Yes Mean Dep Var Control Group 0358 0148 0654 0019 0062 Sample Size 520 520 520 520 520 Number of Counties 52 52 52 52 52
Notes Treatment group defined as homeowners who rented from the council the property in which they currently reside prior to buying it Control group defined as council tenants who currently intend to buy the public property in which they reside within two years Standard errors were clustered at the county level and p-values from Wild Cluster Bootstrap are reported in parentheses Effect calculated as estimated coefficient divided by mean of dependent variable in the control group (council tenants who intend to buy the public property in which they reside within two years) reported here Panel A reports unconditional OLS estimates and Panel B reports conditional OLS estimates where controls for gender ethnicity age burglary victimization household type household rooms household income employment status and county fixed effects were included in the estimating equation indicates significance at 1 indicates significance at 5 indicates significance at 10
56
Table 9 ITT Estimates of Impact of Right-To-Buy Scheme on Crime Separately by Crime Category
Property Crime Violent Crime Burglary Theft and
Handling of Stolen Goods
Violence Against the Person
Sexual Offences
Robbery
(1) (2) (3) (4) (5)
Panel A Crime Category 1975 ndash 1985
Log Tenure x Post -0004 (p = 0083)
-0004 (p = 0070)
-00002 (p = 0531)
0000 (p = 0894)
-00003 (p = 0082)
Effect -0309 -0132 -0104 0021 -87392 Log Unemployment Rate in 1980 x Post Yes Yes Yes Yes Yes Log 25th Percentile Earnings in 1980 x Post Yes Yes Yes Yes Yes Log 50th Percentile Earnings in 1980 x Post Yes Yes Yes Yes Yes Fraction 15-24 Years Old in 1980 x Post Yes Yes Yes Yes Yes Fraction of Public Housing in 1980 x Post Yes Yes Yes Yes Yes PFA Fixed Effects Yes Yes Yes Yes Yes Year Fixed Effects Yes Yes Yes Yes Yes
Sample Size 462 462 462 462 462 Number of PFAs 42 42 42 42 42
Panel B Crime Category 1975 ndash 1992
Log Tenure x Post -0006 (p = 0016)
-0006 (p = 0130)
-00004 (p = 0447)
0000 (p = 0987)
-00004 (p = 0090)
Effect -0489 -0191 -0191 0002 -127
Log Unemployment Rate in 1980 x Post Yes Yes Yes Yes Yes Log 25th Percentile Earnings in 1980 x Post Yes Yes Yes Yes Yes Log 50th Percentile Earnings in 1980 x Post Yes Yes Yes Yes Yes Fraction 15-24 Years Old in 1980 x Post Yes Yes Yes Yes Yes Fraction of Public Housing in 1980 x Post Yes Yes Yes Yes Yes PFA Fixed Effects Yes Yes Yes Yes Yes Year Fixed Effects Yes Yes Yes Yes Yes
Sample Size 756 756 756 756 756 Number of PFAs 42 42 42 42 42
Notes Post-period defined as starting from 1980 the date of adoption of the Right to Buy (RTB) Policy in England and Wales Panel A shows results for the 1975-85 period and Panel B shows results for the 1975-92 period Tenure duration in public housing measured in years and calculated in 1980 Yearly counts of crime were measured at the Police Force Area (PFA) level for all crime categories Regressions weighted by population at the PFA level Standard errors were clustered at the PFA level and p-values from Wild Cluster Bootstrap are reported in parentheses Effect calculated as estimated coefficient divided by pre-1980 mean of dependent variable in ITT control group (Public Housing Tenure duration in 1980 lt p50) indicates significance at 1 indicates significance at 5 indicates significance at 10
57
Table 10 Summary Data for Long-Difference Analysis
Percentiles Mean Standard Deviation Min Max p25 p50 p75 p90 Housing Variables 1Public House Sales 1980-1992 3718 3429 151 33386 1843 2643 4223 7857 2Public House Stock 1980 15032 16757 2180 148394 6358 8912 18018 32832 12 29 13 0 116 22 27 35 42 Crime Variables All Crime Rate -0020 0011 -0075 0002 -0026 -0019 -0013 -0008 Property Crime Rate -0015 0009 -0064 0001 -0019 -0013 -0009 -0006 Violent Crime Rate -0005 0004 -0018 0001 -0007 -0005 -0003 -0001 Covariates Log Unemployment Rate 0466 0462 -0816 1901 0183 0476 0768 1004 Log 25th Percentile Real Hourly Earnings -0084 0058 -0278 0139 -0117 -0080 -0047 -0018 Log 50th Percentile Real Hourly Earnings -0080 0064 -0288 0096 -0114 -0083 -0036 -0002 Fraction of 15-24 Year Olds in Population -0000 0009 -0035 0034 -0004 0001 0004 0009 Observations 293
Notes Crime variables are measured as crime rates at the Local Authority (LA) level Crime defined as total yearly counts of property and violent crime offences per population at the LA level Property crime defined as total yearly counts of burglary and theft or handling of stolen goods offences per population at the LA level Violent crime defined as total yearly counts of robbery violent and sexual offences per population at the LA level Local area variables are the log of the unemployment rate the 25th percentile log real hourly wage and the share of 15-24 year olds in the population each measured at the LA geography
58
Table 11 IV Estimates of Impact of Change in Public Housing Stock 1980-1992 on Change in Crime Rate 2003-2017
Δ All Crime Rate
Δ Property Crime Rate
Δ Violent Crime Rate
(1) (2) (3) (4) (5) (6) (7) (8) (9) RTB Sales 1980-1992 1980 Residential Stock
-0339 (0053)
-0310 (0050)
-0245 (0042)
-0236 (0038)
-0218 (0037)
-0179 (0032)
-0103 (0017)
-0092 (0016)
-0073 (0014)
Changes in Covariates Log Unemployment Rate 0003
(0002) 0002
(0002) 0002
(0002) 0001
(0002) 0001
(0001) 0001
(0001) Log 25th Percentile Earnings -0048
(0023) -0055 (0020)
-0034 (0017)
-0039 (0016)
-0014 (0008)
-0013 (0006)
Log 50th Percentile Earnings 0009 (0022)
0011 (0018)
0009 (0016)
0001 (0001)
-0001 (0007)
-0001 (0001)
Fraction 15-24 Year Olds 0428 (0104)
0250 (0095)
0278 (0077)
0169 (0074)
0149 (0034)
0119 (0029)
Crime Rate in 1980 All Crime Rate in 1980 -0319
(0053)
Property Crime Rate in 1980 -0203 (0043)
Violent Crime Rate in 1980 -1718 (0287)
Observations 293 293 293 293 293 293 293 293 293
Notes Table reports Instrumental Variable estimates Crime defined as total yearly counts of property and violent crime offences per population at the LA level Property crime defined as total yearly counts of burglary and theft or handling of stolen goods offences per population at the LA level Violent crime defined as total yearly counts of robbery violent and sexual offences per population at the LA level Dependent variable is the change in the Local Authority (LA) crime rate between 2003 and 2017 for each crime type denoted by column headings Independent variables are i) total Right-to-Buy sales within the LA for the period 1980 to 1992 (divided by 1980 residential stock) ii) changes in the log unemployment rate in the 25th percentile log real hourly wage and in the share of 15-24 year olds in the population each measured at the LA level iii) crime rates in 1980 for each crime type denoted by column headings measured at the Police Force Area (PFA) level The instrument for i) is the stock of public housing in the local authority in 1980 (divided by 1980 residential stock) indicates significance at 1 indicates significance at 5 indicates significance at 10
59
Table 12 IV Estimates of Impact of Change in Public Housing Stock 1980-1992 on Changes in (Log) Average House Price and Conservative Vote Share
Δ (Log) Average
House Price
Δ Con Vote Share
in LA
(1) (2) RTB Sales 1980-1992 1980 Residential Stock -1327
(0475) 1757
(0352) Changes in Covariates Log Unemployment Rate -0070
(0021) -0014 (0017)
Log 25th Percentile Earnings -0740 (0213)
0379 (0177)
Log 50th Percentile Earnings -0069 (0198)
-0111 (0158)
Fraction 15-24 Year Olds -8575 (1005)
-1188 (0891)
Observations 290 235
Notes Table reports Instrumental Variable estimates In Column (1) the dependent variable is the change in the log of the average house price in the Local Authority (LA) between 2003 and 2017 In Column (2) the dependent variable is the change in the Conservative vote share in Local Authority elections between 19956 and 201415 Independent variables are i) total Right-to-Buy sales within the LA for the period 1980 to 1992 (divided by 1980 residential stock) ii) changes in the log unemployment rate in the 25th percentile log real hourly wage and in the share of 15-24 year olds in the population each measured at the LA level The instrument for i) is the stock of public housing in the local authority in 1980 (divided by 1980 residential stock) indicates significance at 1 indicates significance at 5 indicates significance at 10
APPENDIX ndash ONLINE ONLY
A Data Sources
a Public Housing Stock and Residential Stock in 1980
Public housing stock records for 1980 are sourced from the Chartered Institute of Public Finance and Accountancy (CIPFA) Rate Collection Statistics 1980-81 Actuals SIS ref 4282 This publication is based on data returned by authorities from DoE forms VO7140 The data covers 33 London Boroughs 34 Metropolitan District Councils 286 English Non-Metropolitan District Councils and 37 Welsh District Councils which we refer to in the main paper as Local Authorities The data cover 973 of total rateable hereditaments The number of residential properties in the Local Authority is stated at Column 2 lsquoDomesticrsquo with the number of public house properties in the Local Authority stated at Column 22 lsquoCouncil Dwellingsrsquo These data were extracted from hard copy held by UK libraries
b Right-to-Buy Public Housing Sales
Data on the number of public housing properties sold each year through the Right-to-Buy scheme by each Local Authority for the period 1980 - 2001 are sourced from the CIPFA Housing Revenue Account (HRA) The HRA records expenditure and income on running a councilrsquos own housing stock and closely related services or facilities which are provided primarily for the benefit of the councilrsquos own tenants Under the Housing Act 1985 Local Authorities are obliged to report revenues from public house sales via their HRA These data are accessed under license from CIPFA For further details see httpswwwcipfaorgpolicy-and-guidancepublications (link last accessed on 28 March 2020) We use these data in our main analysis For Figures 1 and 2 we also source data on sales under the Right-to-Buy scheme after 2001 These data are provided by the Department for Communities and Local Government Table 685 For further details see httpswwwgovukgovernmentstatistical-data-setslive-tables-on-social-housing-sales (link last accessed on 28 March 2020)
c Crime Area-level crime data compiled by the Home Office and published annually in Criminal Statistics for the period between 1975 and 1992 were sourced from the archives of the LSE Library where both hard and soft copies of the data can be accessed Yearly crime records of all Local Police Forces in England and Wales were available at the Police Force Area (PFA) level and with the sole exception of the City of London they were used in this analysis Area-level crime data compiled by the Office for National Statistics (ONS) and published annually on the ONS website for the period between 2003 and 2017 were available at the Local Authority (LA) level Due to the redrawing of LA boundaries over time it was not possible to include all LAs in the analysis Our analysis for the period between 2003 and 2017 therefore includes 293 LAs These data can be freely accessed here httpswwwonsgovukpeoplepopulationandcommunitycrimeandjusticedatasetsrecordedcrimedataatcommunitysafetypartnershiplocalauthoritylevelcurrent (link last accessed on 28 March 2020)
d Local Area Circumstances and Housing Tenure Local area circumstances were measured using the New Earnings Survey (NES) provided by the Department for Employment for the period 1975-1992 and using the version of the Annual Population Survey (APS) that is publicly available on the Nomis website for the period 2003-2017 Access to data on local unemployment rates during the period 1975-1992 was obtained from the Department of Employment Permission to access the NES data must
61
be obtained via the UK Data Service and are downloadable at the following link httpsbetaukdataserviceacukdatacataloguestudiesSearch=new20earnings20surveyampRows=10ampSort=1ampDateFrom=440ampDateTo=2020ampPage=1 (link last accessed on 28 March 2020) The Nomis website can be freely accessed here httpswwwnomiswebcouk (link last accessed on 28 March 2020) Local area population data compiled by the Home Office and published annually in Criminal Statistics for the period between 1975 and 1992 were sourced from the archives of the LSE Library where both hard and soft copies of the data can be accessed Area-level population data compiled by the Office for National Statistics (ONS) and published annually on the ONS website for the period between 2003 and 2017 were available at the Local Authority (LA) level These data can be freely accessed here httpswwwonsgovukpeoplepopulationandcommunitypopulationandmigrationpopulationestimatesdatasetspopulationestimatesforukenglandandwalesscotlandandnorthernireland (link last accessed on 28 March 2020) Data on local housing tenure duration were obtained from the 1980 General Household Survey which can be accessed via the UK Data Service and are downloadable at this link (last accessed on 09 July 2020) httpsbetaukdataserviceacukdatacatalogueseriesseriesid=200019
e Home Improvement Insurance and Social Behaviour (Table 8 Appendix Tables A1 and A2) Individual level data on homeownership expenditure individual and property characteristics income employment status and locality of residence used in Table 8 were obtained from the British Crime Survey (BCS) 1988 Access to the BCS 1988 data must be obtained via the UK Data Service and are downloadable at the following link httpsbetaukdataserviceacukdatacataloguestudiesstudyid=2706amptype=Data20catalogue (link last accessed on 28 March 2020)
f Election Results Data on the Conservative vote share in Local Elections for the period 19956 to 201415 are sourced from the British Local Elections Database maintained by the University of Plymouth UK The Conservative vote share is calculated as the proportion of all votes cast in the election for Conservative candidates Ware L Rallings C Thrasher M (2006) British Local Election Database 1889-2003 [data collection] UK Data Service SN 5319 httpdoiorg105255UKDA-SN-5319-1 (link last accessed on 28 March 2020)
g House Prices
House price data is obtained from the UK Land Registry House Price Index (HPI) the UKrsquos official house price index The HPI uses house sales data from HM Land Registry Registers of Scotland and Land and Property Services Northern Ireland and is calculated and maintained by the Office for National Statistics Local Authority house price index values were extracted from the HPI Full File For further details see httpslandregistrydatagovukappdocukhpi (link last accessed on 28 March 2020)
Figure A1 Correlation between Public House building in 1945-64 and Bombs per Dwelling dropped during World War II by Borough in London
Coeff (se) = 2915 (1337)
0
005
01
015
02
Frac
tion
Pub
lic H
ousi
ng in
194
5-64
0 0005 001 0015 002 0025Bombs per Dwelling
Borough Linear Fit
LondonPublic Housing vs Bombs per Dwelling during World War II
Notes The figure shows for each Borough in London the public houses built from 1945-64 as a fraction of the residential stock plotted against the average number of bombs per dwelling A linear function fitting the correlation between the Borough-specific average number of bombs per dwelling and the public housing built from 1945-64 as a fraction of the residential stock is also shown in the figure
63
Figure A2 Residential Housing Stock in 1980 by Local Authority (LA)
a) Public Housing Stock ( Residential Stock)
b) Public Housing Stock (N) c) Residential Stock (N)
Notes Data from 344 Local Authority (LA) Districts in 1980 Panel a shows public housing stock in 1980 within the LA (shown in Panel b) divided by the total residential housing stock in 1980 within the LA (shown in Panel c)
64
Figure A3 Right-to-Buy Public Housing Sales 1980-1992 by Local Authority (LA)
a) Right-to-Buy Public Housing Sales ( 1980 Residential Stock)
b) Right-to-Buy Public Housing Sales (N) c) Right-to-Buy Public Housing Sales ( 1980 Public
Housing Stock)
Notes Data from 344 Local Authority (LA) Districts Panel A shows total RTB public housing sales in the period 1980-1992 as a percentage of the 1980 residential stock in the LA Panel B shows a count of total RTB public housing sales over the period 1980-1992 in the LA Panel C shows total RTB public housing sales in the period 1980-1992 as a percentage of the 1980 public housing stock in the LA
65
Figure A4 Correlation between Crime in 1980 and Right-To-Buy Public Housing Sales by 1981
Coeff (se) = -0021 (0007)
002
004
006
008
Crim
e in
198
0
0 1-05 05Log Public Housing Sales in 1980-81
Police Force Area Linear Fit
Crime in 1980 vs Public Housing Sales in 1980-81
Notes Figure shows for each Police Force Area (PFA) the crime rate in 1980 plotted against the log sales of public housing under the Right-To-Buy (RTB) scheme by 1981 Crime is defined as total yearly counts of property and violent crime offences per population at the PFA level Property crime defined as total yearly counts of burglary and theft or handling of stolen goods offences per population at the PFA level Violent crime defined as total yearly counts of robbery violent and sexual offences per population at the PFA level A linear function fitting the distribution of PFA-specific crime and RTB sales weighted by PFA-specific population size in 1980 is also shown For each PFA in the analysis the horizontal axis shows the log count of sales of public housing under the RTB scheme by 1981 as a percent of the total residential stock in 1980 whereas the vertical axis shows the crime rate in 1980
66
Figure A5 Correlation between Right-To-Buy Public Housing Sales in 1980-92 and Conservative Share in 1977 Local Elections
Coeff (se) = -0000 (0007)
15
2
25
3
Log
Publ
ic H
ousi
ng S
ales
in 1
980-
92
20 30 40 50Conservative Share in 1977 Local Elections
Police Force Area Linear Fit
Public Housing Sales in 1980-92 vs Conservative Share
Notes Figure shows for each Police Force Area (PFA) the sales of public housing under the Right-To-Buy (RTB) scheme by 1992 plotted against the share of conservative votes in the local elections of 1977 A linear function fitting the distribution of PFA-specific sales and conservative votes weighted by PFA-specific population size in 1980 is also shown For each PFA in the analysis the horizontal axis shows the share of conservative votes in the local elections of 1977 whereas the vertical axis shows the log count of sales of public housing under the RTB scheme by 1992 as a percent of the total residential stock in 1980
67
Figure A6 Right-to-Buy Public Housing Sales in 1980-92 and Public Housing Stock in 1980
Coeff (se) = 0180 (0018)
0
01
02
03
RTB
Pub
lic H
ousi
ng S
ales
in 1
980-
92
02 04 06 0801 03 05 07Public Housing in 1980
Local Authority Linear Fit
Public Housing Sales in 1980-92 vs Public Housing in 1980
Notes Figure shows scatter plot of public housing in 1980 (as a proportion of the Local Authority resident stock) on the x-axis and subsequent Right-to-Buy public housing sales between 1980 and 1992 (as a proportion of the Local Authority residential stock) on the y-axis Binned scatterplot of 344 observations
68
Table A1 Correlation between Right-To-Buy Public Housing Sales and Characteristics of Individuals and Households 1988
(Log) Age
Male White British
Income Group
No Rooms Housing Type
Past Burglary Victimization
(1) (2) (3) (4) (5) (6) (7) RTB Scheme 0055
(p = 0230) 0015
(p = 0713) 0018
(p = 0366) -0031
(p = 0489) 0017
(p = 0802) -0078
(p = 0105) 0005
(p = 0886) County Fixed Effects Yes Yes Yes Yes Yes Yes Yes Effect 55 3 19 -34 04 -69 38 Mean Dep Var Control Group 3614 05 0938 0920 4715 1123 0130 Sample Size 520 520 520 520 520 520 520 Number of Counties 52 52 52 52 52 52 52
Notes Treatment group defined as homeowners who rented from the council the property in which they currently reside prior to buying it Control group defined as council tenants who currently intend to buy the public property in which they reside within two years Standard errors were clustered at the county level and p-values from Wild Cluster Bootstrap are reported in parentheses Effect calculated as estimated coefficient divided by mean of dependent variable in the control group (council tenants who intend to buy the public property in which they reside within two years) reported here indicates significance at 1 indicates significance at 5 indicates significance at 10
69
Table A2 Correlation between Right-To-Buy Public Housing Sales and Crime Victimisation 1988
Crime Victimisation (1) (2) (3) (4) (5) (6) Effect Effect Effect RTB Scheme -0202
(p = 0002) -249 -0171
(p = 0059) -211 -0193
(p = 0005) -238
RTB Share -0013 (p = 0430)
-16
County Fixed Effects No Yes No Mean Dep Var Control Group 0810 0810 0810 Sample Size 1058 1058 1058 Number of Counties 53 53 53
Notes Treatment group defined as homeowners who rented from the council the property in which they currently reside prior to buying it Control group defined as council tenants who currently intend to buy the public property in which they reside within two years For each respondent RTB Share calculated as share of other treatment group respondents at the county level (leaving out the respondent herselfhimself) Standard errors were clustered at the county level and p-values from Wild Cluster Bootstrap are reported in parentheses Effect calculated as estimated coefficient divided by mean of dependent variable in the control group (council tenants who intend to buy the public property in which they reside within two years) reported here indicates significance at 1 indicates significance at 5 indicates significance at 10
Recent Issues All CFS Working Papers are available at wwwifk-cfsde
No Authors Title
650 Atsushi Inoue and Lutz Kilian Joint Bayesian Inference about Impulse Responses in VAR Models
649 Lutz Kilian Understanding the Estimation of Oil Demand and Oil Supply Elasticities
648 Lutz Kilian Nikos Nomikos and Xiaoqing Zhou
A Quantitative Model of the Oil Tanker Market in the Arabian Gulf
647 Lutz Kilian and Xiaoqing Zhou Does Drawing Down the US Strategic Petroleum Reserve Help Stabilize Oil Prices
646 Lutz Kilian and Xiaoqing Zhou Oil Prices Exchange Rates and Interest Rates
645 Lutz Kilian and Xiaoqing Zhou Oil Prices Gasoline Prices and Inflation Expectations A New Model and New Facts
644 Olivia S Mitchell Building Better Retirement Systems in the Wake of the Global Pandemic
643 Volker Bruumlhl Mehr Nachhaltigkeit im deutschen Leitindex DAX - Reformvorschlaumlge im Lichte des Wirecard-Skandals
642 Refet S Guumlrkaynak A Hakan Kara Burccedilin Kısacıkoğlu and Sang Seok Lee
Monetary Policy Surprises and Exchange Rate Behavior
641 Sergey Kovbasyuk and Marco Pagano Advertising Arbitrage
640 Sylwia Hubar Christos Koulovatianos and Jian Li
The Role of Labor-Income Risk in Household Risk-Taking
- September 2020
- Abstract
-

No 651
Richard Disney John Gathergood Stephen Machin and Matteo Sandi
Does Homeownership Reduce Crime A Radical Housing Reform from the UK
The CFS Working Paper Series
presents ongoing research on selected topics in the fields of money banking and finance The papers are circulated to encourage discussion and comment Any opinions expressed in CFS Working Papers are those of the author(s) and not of the CFS The Center for Financial Studies located in Goethe University Frankfurtrsquos House of Finance conducts independent and internationally oriented research in important areas of Finance It serves as a forum for dialogue between academia policy-making institutions and the financial industry It offers a platform for top-level fundamental research as well as applied research relevant for the financial sector in Europe CFS is funded by the non-profit-organization Gesellschaft fuumlr Kapitalmarktforschung eV (GfK) Established in 1967 and closely affiliated with the University of Frankfurt it provides a strong link between the financial community and academia GfK members comprise major players in Germanyrsquos financial industry The funding institutions do not give prior review to CFS publications nor do they necessarily share the views expressed therein
Does Homeownership Reduce Crime
A Radical Housing Reform from the UK
Richard Disney John Gathergooddagger Stephen Machinsect and Matteo SandiDagger
September 2020
Centre for Economic Performance London School of Economics Institute for Fiscal Studies and University of Sussex
dagger School of Economics University of Nottingham sect Department of Economics and Centre for Economic Performance London School of
Economics Dagger Centre for Economic Performance London School of Economics
Abstract ldquoRight to Buyrdquo (RTB) a large-scale natural experiment by which incumbent tenants in public housing could buy properties at heavily-subsidised prices increased the UK homeownership rate by over 10 percentage points between 1980 and the late 1990s This paper studies its impact on crime showing that RTB generated significant reductions in property and violent crime that persist up to today The behavioural changes of incumbent tenants and the renovation of public properties were the main drivers of the crime reduction This is evidence of a novel means by which subsidised homeownership and housing policy may contribute to reduce criminality
JEL keywords Crime Homeownership Public Housing JEL classifications H44 K14 R31
Acknowledgements We should like to thank the Chartered Institute of Public Finance and Accounting (CIPFA) for guidance and enabling us to access council house stock and sales data Useful comments on earlier drafts of the paper were received from Anna Bindler Steve Billings Chris Blattman Jennifer Doleac Ingrid Gould Ellen Paul Heaton Randi Hjalmarsson Steve Ross Kevin Schnepel and seminar participants at the Centre for Economic Performance at the London School of Economics the University of Sussex the Online Seminar Series on the Economics of Crime Summer 2020 and the NBER Summer Institute 2020
1
1 Introduction
In many countries crime is spatially concentrated in areas characterised by low incomes and
low rates of homeownership Localities with high rates of tenancy in public housing commonly
exhibit high crime rates and the UK is no exception This association between crime rates and
housing tenure arises not only because of differences in affluence between predominantly
public and private housing areas but also because residents in public housing have lower
incentives to maintain the security and upkeep of their property and to invest in neighbourhood
monitoring
Boosting homeownership is often viewed as a means of delivering benefits to
communities one of which is reduced crime Underlying this is the idea that when public
housing tenants take on ownership of their properties their incentives adjust as they experience
the positive private returns of crime-reducing investments (such as improving the security of
the home) which capitalize into house prices and therefore household wealth Generating an
understanding of the effects of homeownership on crime is therefore a first order research
question in the economics of crime
This paper provides a novel study of the impact of homeownership on crime by
examining a large-scale nationwide program of subsidised public housing sales to incumbent
tenants in the United Kingdom (UK) known as the ldquoRight to Buyrdquo policy (hereafter RTB) This
was established as one of the first legislative acts of the newly elected UK Conservative
government led by Margaret Thatcher in 1979 Through the RTB policy incumbent tenants in
publicly-owned ldquocouncil housingrdquo (housing built and owned by local public authorities and
rented to private tenants henceforth called ldquopublic housingrdquo) in the UK could purchase their
rented accommodation at heavily-subsidised prices1 The intention of the policy was to increase
the long-run homeownership rate with the underlying ethic of ldquoan Englishmanrsquos home is his
castlerdquo It was heralded by the Conservative government as a means of improving local
amenities and generating upward social mobility by giving citizens control over their housing
and access to housing wealth2
1 The terms ldquocouncil housingrdquo and ldquosocial housingrdquo indicate public housing in the UK Public housing in the United Kingdom is managed in local jurisdictions by councils ndash hence the term for public housing is ldquocouncil housingrdquo in the UK There are also social housing tenancies provided by co-operatives and local housing associations rather than private homeowners A limited form of tenancy purchase of such properties was introduced in the 2000s under the policy ldquoRight to Acquirerdquo 2 In a speech delivered to the National Housebuilding Council in December 1984 Margaret Thatcher stated ldquoSpreading the ownership of property more widely is central to this Governments philosophy It is central
2
The RTB policy had a significant impact on housing tenure as it dramatically changed
the ownership composition of housing in the country It was largely responsible for an increase
in the UK homeownership rate from around 60 in 1979 to over 70 in the early 2000s
Specifically whereas around 32 of dwellings in the UK were publicly-owned in 1979
totalling some 62 million properties by the early 2000s around 28 million of these properties
had been sold to their tenants (Jones and Murie 2006) Although an innovative and large scale
policy RTB has until recently been little analysed (but see Disney and Luo 2017) Analysis
of RTB is useful to derive policy prescriptions that extend beyond the UK as the RTB scheme
shares many of the same characteristics as reforms implemented in Israel (eg Hausman
Ramot-Nyska and Zussman 2020) Sweden (Sodini Van Nieuwerburgh Vestman and Von
Lilienfeld-Toal 2017) and multiple post-Communist countries
This paper studies the causal impact of the RTB policy on local crime rates The
empirical analysis uses large-scale data from all regions in England and Wales from the early
1970s to the late 2010s in order to utilise the RTB policy as a nationwide policy experiment3
The bulk of public house sales occurred in the 1980s and area-level sales of public housing
were matched to crime data over several decades to estimate both the short-run and long run
effects of homeownership on crime The analysis shows that the large movements in housing
tenures induced by the RTB led to lasting falls in crime rates for certain types of crime
An important contribution of this study is to document the mechanism behind the crime-
reducing effect of sales of public housing in local areas It shows that the reduction in crime
rates was driven primarily by behavioural changes within the local community rather than a
lsquoreshufflingrsquo of households between low and high crime areas which might have had a smaller
effect on overall crime This is in contrast to the focus of many recent studies of the crime-
reducing effect of gentrification (eg Autor Palmer and Pathak 2019) whereby changes in
the composition of households induced by inward and outward migration are thought to explain
local trends in crime rates Our study thereby reveals a novel means not documented to date
by which subsidised homeownership and housing policy may have contributed to the decline
because where property is widely owned freedom flourishes Since we took office in 1979 17 million more people have come to own their homes mdash 17 million more sole kings upon their own sole ground That increase is one of our proudest achievementshellip But a house is more than this It is a symbol of security and a stake in the future People who own houses do so not just for themselves but for their children They do so as members of a responsible society mdash proud of the heritage derived from the past glad to care for it and eager to give the next generation a bit of capital to give them a startrdquo (See httpswwwmargaretthatcherorgdocument105815) 3 The analysis covers only England and Wales owing to a need for comparable crime data which is not available for Scotland and Northern Ireland
3
in crime in the United States and other Western economies in the 1990s and early 2000s (see
Van Dijk and Vollaard 2012)
The RTB experiment provides a unique opportunity both to assess the effectiveness of
selling public housing to grant homeownership rights to families in public housing and to
measure the causal impact of sales of public housing on crime outcomes From the perspective
of a policy maker designing a policy that would alter homeownership rights for the general
population the parameters estimated here are directly of interest4 As such this study
complements the literature that has examined neighbourhood effects on crime by exploiting
the variation in residential locations induced by the Moving To Opportunity (MTO) experiment
in the United States and by other housing policy initiatives in Western economies5
The study of the causal impact of homeownership on crime exploits the unfolding of
the RTB policy and it is investigated separately in the short-run and in the long-run To estimate
the short-run impact of the RTB policy on crime difference-in-differences specifications
exploit the differential intention-to-treat (ITT) effect of the RTB policy across localities RTB
was introduced as a national policy but the intensity of treatment across localities varied with
the predetermined length of tenure duration of incumbent tenants in public housing We explain
how these differences in average tenures across localities arose in the later part of Section 2
Tenure duration determined access to the policy with a minimum tenure duration requirement
of three years together with larger purchase price discounts for those with longer tenures
Variations in the length of tenure duration in public housing at the start of the RTB policy are
shown to be unrelated with other local area socio-economic circumstances such as
unemployment wages fraction of juveniles and fraction of public housing they arise from
historical locality-specific factors and this variation is a key part of the research design
Estimates reveal sizeable negative short-run effects of increased incidence of RTB sales
of public housing on crime The crime reduction appears sizeable since the early 1980s and it
remains visible in the late 1980s and early 1990s until the end of the Thatcher era These short-
run estimates uncover an elasticity of crime with respect to RTB incidence of roughly -03 so
4 Homeownership is likely to have important implications also for intergenerational mobility a link that until recently has been little analysed (see Blanden and Machin 2017 and Bell Blundell and Machin 2018) 5 See eg Katz Kling and Liebman (2001) Ludwig Duncan and Hirschfield (2001) Kling Ludwig and Katz (2005) Ludwig and Kling (2007) Kling Liebman and Katz (2007) Sanbonmatsu Ludwig Katz Gennetian Duncan Kessler Adam McDade and Lindau (2011) Ludwig Duncan Gennetian Katz Kessler Kling and Sanbonmatsu (2013) Sciandra Sanbonmatsu Duncan Gennetian Katz Kessler Kling and Ludwig (2013) Damm and Dustmann (2014) Bernasco de Graaf Rouwendal and Steenbeek (2017) and Rotger and Galster (2019)
4
that a 10 percent increase in incidence of RTB public housing sales reduces crime by around 3
percent This conclusion is robust to a battery of additional tests including variations in the
specification of the econometric model We explain in later sections how we deal with the
obvious issue of feedback insofar as local crime rates may affect the willingness of public
tenants to exercise their right to purchase their public house through the RTB policy
The paper examines other potential mechanisms that could underlie the finding that
RTB purchases reduce crime rates These hypothesised channels include varying local area
circumstances local household compositional changes arising from the RTB policy and the
potential role of feet-dragging practices in certain localities arising from the political affiliation
of the local authorities responsible for administering the policy at the local level The findings
suggest that none of these factors explains the crime reduction generated by the RTB policy
The market value of the RTB sales at the onset of the scheme does not predict the evolution of
crime either suggesting that the crime reduction attributed to the RTB scheme is genuine and
it is not the spurious result of better amenities in areas with more RTB sales
By contrast the findings are strongly indicative of the likelihood that local communities
were induced to change their behaviour and attitudes towards criminal activity Indeed as
suggested in the quote by Margaret Thatcher cited previously this was one of the aims of the
RTB policy That is to give (generally) working class households access to an owned asset in
order to change their behaviour such as taking greater care of and improving the security of
their property and to change their economic position by giving these households a collateral
asset in financial markets Hence RTB was viewed as a mechanism for improving and
upgrading the economic position of households in neighbourhoods that had been previously
dominated by public housing
The analysis reveals that immediate reductions in crime resulted from the RTB policy
These are very unlikely to be attributable to in-migration as the rules of the RTB scheme
effectively barred resale of the RTB-purchased property for a fixed period after purchase We
show that crime rates were reduced immediately after the introduction of the policy and not
once the restraint on resale was no longer binding The analysis also shows that after
purchasing their properties from the local council incumbent ex-tenants started to gentrify their
properties by installing double locks on doors and windows by installing burglar alarms and
by purchasing insurance for their home contents Locality-specific estimates show that
incumbent tenants who bought under the RTB scheme experienced greater crime reduction in
counties in which the RTB scheme was associated with greater home improvement On the
5
other hand they did not become more likely to participate in a neighbourhood watch scheme
suggesting that the RTB policy did not generate detectable changes in social capital The
changing behaviour of incumbent ex-tenants resulting from RTB purchases did not result in
increased victimisation of neighbouring householders nor in a substitution of offenders away
from burglary towards other crimes Results indicate that the RTB policy led to significant
reductions in burglaries and robberies while theft and handling of stolen goods offences as
well as other violent crime offences remained unchanged
The paper next moves on to study the long-run persistence of the impact of the RTB
policy on crime To estimate the long-run crime effects of the RTB policy extended crime data
from 2003 to 2017 are used Instrumental variable regressions are used to quantify the effects
of public housing sales from 1980 to 1992 on the change in the crime rate from 2003 to 2017
Public housing sales are instrumented using variation in the initial public housing stock which
is a valid instrumental variable once the initial level of local crime and contemporaneous
community characteristics are controlled for In line with the short-run estimates long-run
estimates show that localities where the RTB policy triggered larger increases in
homeownership also experienced faster reductions in crime throughout the later period
Additional tests reveal that by 2017 these localities also experienced slower increases
in house prices In the standard definition gentrification arises as middle-class salary earners
displace lower income or unwaged households as a result of rising house prices In the case of
tenure changes induced by RTB sales the long time horizon of this research is required to
identify displacement since it takes time before RTB purchasers who are ex-tenants move on
sell or rent out their properties allowing other households to move into the neighbourhood
However the reduced growth in house prices documented here in areas of high RTB sales is
inconsistent with the standard gentrification story and suggests that the supply-side shock of
low-quality properties entering the housing market induced by the RTB policy outweighed any
displacement of original tenants There is also a political response as by 2017 Conservative
votes increased more rapidly in localities most affected by the RTB scheme This further points
towards RTB resulting in changing attitudes and behaviour of local communities
The rest of the paper is structured as follows Section 2 outlines the relevant literature
and describes the RTB policy In doing so it seeks to emphasise the scale of public housing in
the UK by 1980 (in comparison to say the United States) and to explain why the spatial
distribution of public housing does not simply map into low income areas at the start of the
RTB policy Data sources are described in Section 3 and the empirical analysis is presented in
6
Section 4 Finally section 5 provides a concluding discussion including an important word of
caution in assessing the overall merits of the RTB policy
2 Housing and Crime
i Previous literature
A large spatial crime literature shows that crime rates especially crimes against property are
higher in areas with high concentrations of public housing even when controlling for other
salient characteristics of the resident population This has been a major driver of policy in the
United States towards the replacement of inner city public housing projects by rent subsidies
and by shifting tenants to mixed-tenure low housing density urban neighbourhoods (see for
example Schill 1993 Olsen 2003 and Kling Ludwig and Katz 2005) A similar association
between crime and public housing has been observed in the UK (Murie 1997) More broadly
studies show that increased local homeownership rates are associated with a range of spillover
effects on the locality such as lower crime rates greater civic involvement and improved child
development (see for example DiPasquale and Glaeser 1999 and Haurin Dietz and
Weinberg 2003)
A well-known difficulty in the large literature on housing tenure type household
composition and crime is the range of feedback effects which suggest a number of channels
exist by which crime affects the composition of neighbourhoods and vice versa Cullen and
Levitt (1999) is one of a number of studies that suggest that higher rates of crime especially in
inner cities led to changes in neighbourhood composition by social class and economic status
Much of this literature on the lsquoflight to the suburbsrsquo took place against the backdrop of rising
crime in inner cities in the United States in the 1990s It has been more challenging to show
that falling crime in both earlier and later periods has been the primary driver of the so-called
gentrification of inner city areas (contrast the findings of McDonald 1986 with Ellen Horn
and Reed 2017)
In addition there is robust evidence that higher crime is associated with lower property
values (see Gibbons 2004 for an illustration using data for London) and this feedback effect
will induce spatial equilibria of neighbourhood composition when account is taken of not just
crime rates but other neighbourhood (dis)amenities transport costs and so on For example
Owens Mioduszewski and Bates (2019) show that civil gang injunctions in Southern
California a common type of place-based crime control policy in the area led to approximately
a 3 decline of residential propertiesrsquo values from 2002 to 2015 reflecting individual
7
willingness-to-pay for the civil liberties affected by the injunction6 Morales-Mosquera (2019)
finds that police station openings generate localized crime reductions and housing value
increases in three major cities in Colombia
A large literature has addressed the basic identification problem of assessing
neighbourhood effects on crime by exploiting the variation in residential locations generated
by the Moving To Opportunity (MTO) experiment in the United States Starting in 1994 the
MTO experiment assigned housing vouchers via random lottery to thousands of public housing
residents with children in five cities in the United States to relocate to less-distressed areas
Exposure to violence and crime victimization in distressed areas were in fact key reasons for
low-income families to participate in the MTO experiment Katz Kling and Liebman (2001)
show that the MTO experiment improved childrenrsquos behaviour adult mental health and
perceived safety in treatment group families in Boston while also reducing exposure to
violence and crime victimization Similar findings emerge in Baltimore in the study of Ludwig
Duncan and Hirschfield (2001) who find that the MTO experiment led to a large reduction in
juvenile arrests for violent crimes and to some increase in property-crime arrests
Kling Ludwig and Katz (2005) document important gender differences in the impact
of the MTO experiment on crime While both property and violent crime decreased among
young women young men experienced a decrease in violent crime but also an increase in
property crime a few years after relocating to the new neighbourhood7 Ludwig and Kling
(2007) show the importance of racial segregation among other neighbourhood characteristics
in predicting youth violence while Kling Liebman and Katz (2007) document the beneficial
impact of the MTO experiment on the education risky behaviour and physical health of young
women As the opposite effects are found for young men their findings further suggest that
young men and women respond differently to similar new neighbourhood circumstances
Using more recent data Sanbonmatsu et al (2011) conclude that the MTO initiative
enhanced safety in treatment group families while Ludwig et al (2013) find gender differences
in the impact of the MTO experiment on risky behaviour and health of juveniles to persist 10-
15 years after the start of the experiment while finding no evidence of persistent reductions in
youth violence rates However Sciandra et al (2013) show little evidence of crime reductions
6 Grogger (2002) and Ridgeway Grogger Moyer and MacDonald (2018) are two earlier studies of the effects of gang injunctions on crime 7 The comparative advantage of juveniles relocated from disadvantaged backgrounds in exploiting the available property-crime opportunities in their new neighbourhoods and the different ways in which male and female juveniles respond to similar new neighbourhood circumstances help the authors rationalize these findings
8
in the long run as neighbourhood conditionsrsquo effects of MTO dissipate reflecting that crime is
more affected by contemporaneous neighbourhood circumstances than by past neighbourhood
circumstances8 To understand why low-income families remain segregated into high-poverty
areas Bergman et al (2020) randomly allocate housing vouchers to 430 recipient families with
a child in the Seattle and King County areas concluding that barriers in the housing search
process are a critical source of residential segregation by income
Our findings on homeownership also relate to Engelhardt et al (2010) who analyse an
experiment in Oklahoma that subsidised saving for down payments for homeownership among
a group of low-income individuals using Individual Development Accounts (IDA) with
randomly assigned treatment status In their setting the treatment is the offer of matching
funding to the IDA since only a fraction of those who were treated chose to take up the offer
and to undertake a purchase and of course these may not be a random group among the treated
They find only weak evidence that homeowners who benefited from the policy spent more
money on lsquocommunity-facingrsquo activities such as external improvements to their house or
involvement in civic events in the 30 months after the take-up of homeownership status
Recent studies have sought to estimate the effects of homeownership and gentrification
on crime focusing on neighbourhood composition effects of policy changes Aliprantis and
Hartley (2015) and Sandler (2017) examine the effect on local crime rates in Chicago when
20000 units of concentrated high-rise public housing were demolished over the period 1999
to 2011 Both studies albeit using slightly different methodologies track relocated individuals
to other neighbourhoods and they conclude that these demolitions led to a net reduction in
crime rates ndash primarily violent (gang-related) crime but also theft robbery and use of guns
Chyn (2018) shows the lasting beneficial effects of housing demolitions in Chicago on the
schooling professional and criminal trajectories of displaced individuals Autor Palmer and
Pathak (2019) examine the impact of the deregulation of rents in Cambridge Massachusetts
on local crime rates They hypothesize that rent deregulation raised property values and caused
a differential mix of households to locate across local neighbourhoods thereby
disproportionately reducing the rate of property crime in neighbourhoods that had previously
been subject to rent control They find a significant reduction in crime overall which was then
8 The MTO experiment of course affected also other dimensions of familiesrsquo and childrenrsquos lives Most notably it generated moderate improvements in school quality (Fryer and Katz 2013) as well as educational and economic benefits for young children including for young boys (Chetty Hendren and Katz 2016) Substantial exposure effects of neighbourhoods are also presented in Damm and Dustmann (2014) Bernasco de Graaf Rouwendal and Steenbeek (2017) Altonji and Mansfield (2018) Chetty and Hendren (2018a) Chetty and Hendren (2018b) Rotger and Galster (2019) and Aliprantis and Richter (forthcoming)
9
capitalised into higher property values9 In a related study Diamond and McQuade (2019)
document the crime-reducing effect of the Low Income Housing Tax Credit
Most of the studies that have examined the effects of gentrification on crime exploit
policy changes such as the lifting of rent controls and removal of public housing that led low-
income neighbourhoods to increasingly become middle-income neighbourhoods through
outward migration of low-income households and inward migration of higher-income
households Studies that have examined the impact on crime rates of moving tenants out of
public housing into the private sector in the United States and experiments that gave households
incentives to purchase properties are typically based on highly localised data and results are
obtained from relatively short time periods after implementation of the policy10
The main contribution of this study by contrast is to estimate the effect on local crime
rates of increasing homeownership of indigenous communities and to examine the extent to
which this induced behavioural change in these communities This is a novel means which has
not been documented to date and which complements the existing literature by which
homeownership and housing policy may contribute to reduce crime The RTB policy
constitutes an ideal policy experiment to study this and it is therefore exploited here using
large-scale data over multiple decades
ii Public Housing in England and Wales
The stock of public housing in England and Wales grew rapidly throughout the
twentieth century over the period from the end of World War I in 1918 until the start of the
Right-to-Buy policy in 1980 By 1980 public housing in England and Wales was more
extensive more heterogeneous and more spatially dispersed than in the United States11 These
spatial outcomes arose from the decisions to rebuild outside as well as within inner city areas
in turn stemming from the partially random distribution of war destruction and from the
differential application of planning restrictions across the UK12
9 A recent paper on the UK (Alonso Andrews and Jorda Gil 2019) suggests that crime rates were reduced by expenditures from the Urban Renewal Fund although these expenditures did not directly involve changes in housing tenure their idea is closely related to the lsquoneighbourhood externalitiesrsquo argument 10 The reviewed literature examining the MTO experiment constitutes an exception 11 For examples of the heterogeneous nature of public housing across towns see Table 1 in Disney and Luo (2017) 12 For evidence on the continued important role of planning restrictions on private housing supply in England see Hilber and Vermeulen (2014)
10
Figure 1 illustrates housing tenure shares by tenure types in England and Wales
between 1918 and 2011 As illustrated in the Figure in 1918 more than three-quarters of
residential housing in England and Wales was privately rented with public housing accounting
for only 1 of the housing stock As a result of a public sector building program and the
development of the mortgage market both private homeownership and public renting
(primarily from local public authorities) rose steadily until 1980 by which time private renting
had shrunk to a little over one tenth of housing tenure While the increase in homeownership
prior to 1980 is mostly explained by the development of a formal mortgage market in the
deepening retail financial sector two main factors explain the increase in public housing prior
to 1980
First municipal government investment programs developed after the World War I
Much of the stock of privately-owned housing which was rented out was in very poor
conditions post-1918 Replacement of the housing stock was hindered by high re-building costs
coupled with borrowing constraints for many small landlords (Disney and Luo 2017) Under
the Housing and Town Planning Act 1919 much of the responsibility for replacement housing
and slum clearance was taken over by local authorities However replacement public housing
was not simply built in inner-city areas where slum clearance had taken place but also in so-
called suburban lsquogardenrsquo estates and even lsquogarden townsrsquo located on greenfield sites Some of
these sites were developed as large-scale public housing projects often with low-density low-
rise properties others in mixed estates with a mixture of public and private housing Later in
the interwar period as economic conditions improved local authorities reverted to replacing
inner-city slums with local high-rise buildings in the same neighbourhood while private
developers tended to build in suburbs and rural areas13 However planning (zoning) restrictions
which tend to be much tighter in the UK than in the United States limited the growth of private
housing in some areas
Second a further impetus to public housebuilding occurred after 1945 Between 1939
and 1945 around four million homes in the UK were destroyed or seriously damaged by
bombing Although bombing campaigns were initially targeted at military targets during 1939-
45 they gradually evolved into area bombing strategies focusing on cities Until near the end
of the World War II bombing (by all sides) was notoriously inaccurate lacking precision
instruments for target identification Target visibility relied on key geographical features such
13 For further discussion see httpsfetuweacukconwebhouse_agescouncil_housingprinthtm and Jones and Murie (2006)
11
as coasts and large rivers and towns and cities in such localities were bombed heavily Other
areas remained relatively unscathed because of weather conditions distance counter-jamming
measures lsquofakersquo fires lit to divert bombers to relatively uninhabited areas and so on14 This
scattering of war destruction implies that there was a random element to where replacement
housing was required once the hostilities had ended As a result of war damage many areas
saw the rapid construction of publicly-owned housing estates to replace damaged and destroyed
homes This link at the local level between bombing and public housebuilding is illustrated in
Figure A1 in Appendix A which uses official Bomb Census data from
httpbombsightorgdatasources to show that the location of bombings across boroughs in
London during the World War II is a significant predictor of where publicly-owned housing
estates were built in the post-war period in London
The somewhat random nature of bombing is illustrated by the fact that whilst areas that
were targeted such as the London Docks already contained high-density low income housing
bombs also fell heavily in the more affluent boroughs of south and south east London which
thereby constructed more public housing after 1945 than equally affluent suburbs to the north
of the capital Other areas where major rebuilding took place were also mixed-income
communities Nevertheless after the post-war reconstruction period that lasted well into the
1950s new public properties tended to be built to replace slums in low-income
neighbourhoods often as high-rise developments with private housebuilding being the
dominant feature of more affluent areas By 1980 close to one-third of the residential housing
stock in England and Wales was public housing
For the analysis that follows in particular to understand the identification strategy that
is taken it is very important to understand how a household accessed a public house and how
the length of tenure within public housing was determined Policies varied between local
authorities but priority for access to public housing would initially be given to local residents
who required rehousing as a result of slum clearance or war destruction Thereafter most local
authorities operated a queuing system by which eligibility depended on evidence that the
person or household would otherwise be homeless on family size and on means of household
income support if any Local residents were prioritised The extent of rationing (waiting time)
for public housing if any in a given area would depend on the supply of public housing that
had been constructed relative to demand Incoming applicants from outside the local authority
14 There is a vast literature on this An early volume that revealed efforts to thwart the accuracy of the German bombing campaign is Jones (1978)
12
area would typically be at the back of the queue In turn residents already within public housing
could apply to move from one public property to another ndash typically by requesting lsquoupgradingrsquo
as a nicer property became available ndash for example a house with a yard or garden rather than
an apartment Tenure within any given property would therefore depend on the availability and
heterogeneity of the public housing stock within an area
iii The ldquoRight to Buyrdquo Policy
Shortly after Margaret Thatcherrsquos election as UK Prime Minister the Housing Act 1980
introduced a statutory Right to Buy (RTB) for public tenants with at least 3 yearsrsquo tenure
duration in their council house ndash lsquostatutoryrsquo in the sense that the policy had to be implemented
by all local councils (previously a few Conservative councils had allowed their tenants to buy
their public property generally at market price) The RTB policy allowed tenants to buy their
properties at substantial discounts to market value ranging from 33 with three yearsrsquo
residence to a maximum of 50 after 20 yearsrsquo residence Local councils were also obliged to
make mortgages available to would-be purchasers although this feature became less pertinent
as capital markets were liberalised during the 1980s The discount on the sale price would be
repayable if the property was resold within five years of an RTB purchase although a
purchased property could be rented out
There were additional constraints in the 1980 legislation particularly in relation to the
sale of publicly-owned apartments but these too were relaxed in the mid-1980s Purchase of
public housing under RTB also became more attractive with later efforts to raise heavily-
subsidised rents on public tenancies towards lsquomarketrsquo levels15 Figure 2 indicates the pattern of
sales under the RTB policy in England (the other UK nations had similar patterns ndash indeed the
large stock of public houses in Scotland was sold even more rapidly leading to a blanket ban
on further sales by the Scottish government some decades later) The two peaks in sales in the
1980s are associated with the introduction of the RTB policy and its liberalisation in the mid-
1980s thereafter with the better-quality tenants (and public housing) having moved into the
private sector the rate of sales declines
The Thatcher era ended in 1992 and the incoming Labour government in 1997 did not
attempt to reverse the policy completely but did tighten eligibility conditions limit access to
publicly-provided mortgages and impose caps on the maximum discounts in some areas where
15 The economic incentives implied by these various policies are explored at some length in Disney and Luo (2017) but not considered in detail here
13
sales had diminished the public housing stock quickly (since local authorities still had a
statutory responsibility to house homeless families) On the other hand the government also
introduced a similar but less generous version of RTB known as lsquoRight to Acquirersquo which
allowed tenants in some cases to purchase public housing (typically managed by lsquoarms lengthrsquo
housing associations and charities rather than directly by local public authorities) This led to
a brief upsurge in sale volumes as illustrated in Figure 2 although sales continued in any event
as public tenants acquired sufficient yearsrsquo residency in their property to be eligible for the
RTB scheme
Not surprisingly RTB purchases were selective both by household type and by quality
of property For example in Derby a prosperous town in mid-England which has traditionally
specialised in high-end manufacturing since at least the 1920s over 80 of the large stock of
public properties in 1980 were in the form of detached semi-detached or terraced housing in
suburbs and less than 20 in the form of (mostly) high-rise apartments in the inner city By
1991 27 of Derbyrsquos stock of public housing had been sold off with apartments now
constituting nearly 30 of the residual stock
In contrast in Hackney an inner London borough in 1980 around 80 of the public
housing stock was in apartments mostly in high-rise estates By 1991 most of the non-
apartment stock in Hackney had been sold off but the overall stock of public housing had
increased because the local council had constructed or purchased further apartments RTB
purchasers themselves were typically older had higher incomes and they were less likely to
be unemployed (Gregg Machin and Manning 2004) Hence sales of public houses were
evidently non-random and related to local crime rates resulting in a well-known endogeneity
issue in the regression analysis that is addressed empirically in Section 4
3 Data
Our empirical analysis combines multiple data sources at annual frequency Housing data are
provided by the Chartered Institute of Public Finance and Accounting (CIPFA) The data are
provided at the Local Authority (LA) level for the 314 LAs in England and Wales in 198016
The data include details of the composition of the residential housing stock (owned privately
rented and public housing) and the number of sales under the Right-to-Buy (RTB) scheme in
each year LAs had a statutory requirement to report RTB sales to CIPFA and provide details
16 The number of LAs changes over time due to some mergers and due to boundary redrawing There were 314 LAs in England and Wales in 1980 at the onset of the RTB policy
14
of the revenue flow received from the sales Data on average length of tenure duration in public
housing by locality in 1980 are derived from the UK General Household Survey (GHS)
Two sources of crime data complement the housing data The short-run analysis which
covers the period 1975 to 1992 uses administrative crime records collected by the police and
published annually by the UK Home Office in Criminal Statistics This period spans five years
prior to the introduction of the RTB policy in 1980 through to the end of the period of
Thatcher-led Conservative governments in 1992 These data are provided at the Police Force
Area (PFA) geography a geographic unit that sits above and nests LAs17 With the sole
exception of Londonrsquos financial district commonly known as ldquothe City of Londonrdquo and which
constitutes an independent PFA data are used for all 42 PFAs that exist in England and
Wales18
The long-run analysis which covers the period 2003 to 2017 draws upon
administrative crime records at the LA level recorded by the police and published online by
the UK Office for National Statistics (ONS) The long-run analysis starts in 2003 because there
was a very substantial change in reporting rules in the late 1990s and early 2000s in the UK
that had different effects across PFAs and crime types Thus it is not possible to use police
recorded crime data before and after 2002 in the same analysis The City of London PFA is
also excluded from the long-run analysis For both the short-run and long-run analyses the
measures of crime used in the empirical analysis are the numbers of recorded offences of
different crime categories per population Thus the data capture incidents of crime recorded
and classified by all UK local police forces The data contain offence rates for five crime
categories property crime defined as the sum of burglary and theft and handling of stolen
goods offences and violent crime defined as the sum of violence against the person sexual
offences and robbery offences
The LA-level housing data were combined with the crime data to create two data sets
for the analysis For the short-run analysis running from 1975 to 1992 the LA-level crime data
were aggregated at the PFA level using the ONS Open Geography database and then joined to
the PFA-level crime data The construction of the short-run panel is not affected by changes in
LA geographical boundaries as in all cases these occur within PFA units Hence a balanced
17 For example London LAs sit within the Metropolitan Police PFA 18 The City of London constitutes an additional PFA that is independent from the rest of London However this PFA is excluded from this analysis because most property in the area is non-residential hardly anybody lives there and consequently few RTB sales took place there
15
panel of 42 PFAs spanning 18 years was obtained with the PFA-year being the unit of analysis
Data from the GHS on tenure were matched to PFA from regional data subdivided into lsquoruralrsquo
lsquourbanrsquo and lsquomixed urban-ruralrsquo areas
For the long-run analysis (2003 to 2017) which uses a long-difference model
observations of the change in crime measured at the LA level for the period 2003-2017 were
joined with observations of total RTB sales also at the LA level for the period 1980-1992 Not
all observations could be joined due to changes in LA geographical boundaries that preclude a
one-to-one mapping between LAs in the earlier and later period This analysis is therefore
based on 293 observations that could be joined between the earlier and latter periods
These data sources were complemented with administrative records of local area
conditions In the short run analysis data from the New Earnings Survey (NES) and the
Department for Employment were used to calculate local area conditions from 1975 to 1992 in
each PFA In the long run analysis local area conditions at the LA level from the Annual
Population Survey (APS) complement the housing and crime data19
i Summary Statistics
Summary data for the composition of the housing stock in 1980 just prior to the RTB
policy start are provided in the first five rows of Table 1 On average 272 of all residential
properties in a PFA were publicly-owned equating to approximately 14000 individual
properties per LA More than 1 of all residential properties were sold under the RTB scheme
by 1981 ie in the first year of the policy20 A key criterion for eligibility to the RTB scheme
and for the size of the discount on the market value of public properties was the length of tenure
duration in public housing of incumbent tenants Table 1 shows that on average incumbent
tenants in 1980 had spent 11 years in their public properties with some areas featuring much
larger average years of tenure duration than others The distribution of the public housing rate
as well as of public housing sales and tenure duration in 1980 are heterogeneous across PFAs
The data show a quite high standard deviation of public housing stock as a proportion of the
residential stock (the standard deviation shown in Table 1 is 86) as well as some outlier
LAs ndash in 10 of LAs public housing accounted for more than one third of the residential
housing stock
19 Additional details of the data used in the empirical analysis and instructions for data access are provided in the Appendix 20 Our data are for England and Wales The higher proportion of the public housing stock at the start of RTB for the UK arises from the initial high levels of public houses in Scotland and Northern Ireland
16
Figure A2 Panel A in Appendix A illustrates the distribution of public housing across
LAs in 1980 (expressed as a percentage of the residential housing stock) Panel B illustrates
the distribution of public housing in absolute terms and Panel C shows the distribution of
residential housing in absolute terms Similarly Figure A3 Panel A in Appendix A illustrates
the distribution of public housing sales across LAs in the 1980s-90s (expressed as a percentage
of the residential housing stock in 1980) Panel B illustrates the distribution of public housing
sales in the 1980s-90s in absolute terms and Panel C shows the distribution of public housing
sales across LAs in the 1980s-90s (expressed as a percentage of the public housing stock in
1980) All distributions in Figures A2 and A3 have a long right tail further illustrating the
uneven distribution of the public housing stock public housing sales the total residential stock
and the ratios of these across LAs in 1980
The remaining rows of Table 1 provide summary data for crime rates and other
covariates in 1980 Crime rates are measured as cases per individuals Thus Table 1 shows that
45 criminal offences per 100 individuals were recorded on average in a PFA in 1980 Total
crime is defined as the sum of property crime and violent crime and these measures of crime
are the key outcomes of interest here21 Property Crime defined as the sum of burglary and
theft and handling of stolen goodsrsquo offences is overwhelmingly the most common category of
crime in 1980 Only the most serious types of violent offences such as homicide aggravated
assault sexual offences and robberies were recorded and published by the Home Office since
the 1970s in England and Wales Minor violent offences only started to be recorded in the UK
in the early 2000s Thus violent crime is defined here as the sum of serious violence against
the person sexual offences and robbery
Table 1 also shows four additional variables which are used as covariates in regression
models the local log real hourly wages at the 25th and 50th percentiles of the distribution the
local log unemployment rate and the local share of 15-24 years olds in the population in the
PFA Since potential offenders are likely to earn low wages and have low levels of labour
market attachment (Machin and Meghir 2004) the 25th percentile of log wages and log
unemployment are likely to be relevant features of the labour market in the determination of
criminal activity while the 50th percentile of log wages is also included to depict the
distribution of wages Finally Table 1 also suggests that approximately 16 of the overall
population is aged 15 to 24 Since the likelihood to commit crime is observed almost
21 The analysis does not include drugs offences as no data on drugs offences in England and Wales was collected and published by the UK Home Office for the period of this study
17
universally to be highest in the late teens and then decrease later in life (Quetelet 1831 and
Landersoslash Nielsen and Simonsen 2016) the fraction of individuals aged 15 to 24 in the
population is also likely to be a relevant determinant of the local criminal activity
4 Empirical Analysis
i Public housing and crime in the initial conditions
The analysis of the relationship between density of public housing and crime rates prior to the
introduction of the Right-to-Buy (RTB) policy is a natural starting point to the empirical
approach Figure 3 illustrates the relationship between the public housing rate (the percentage
share of public housing in the residential housing stock in the PFA) and the crime rate for the
42 PFAs included in the analysis in 1980 A clear positive association appears between the
concentrations of public housing and crime across PFAs in England and Wales with the size
of the dots on the scatter plot illustrating the PFArsquos population size in 1980 The positive
relationship between the public housing rate and the crime rate in Figure 3 is statistically
significant at all conventional levels Using the same data an OLS regression of the following
form was also estimated
119862119862119894119894 = α + β1119867119867119894119894 + β2119935119935119894119894 + ϵ119894119894 (1)
where 119862119862119894119894 is the crime rate in PFA 119894119894 119867119867119894119894 is the public housing stock as a proportion of the
residential housing stock 119935119935119894119894 is a vector of PFA level variables and ϵ119894119894 is the error term Equation
(1) was estimated for total crime as well as separately for property crime and violent crime
Estimates of Equation (1) are shown in Table 2 The Table shows estimates of crime as
a function of the public housing stock (expressed as a proportion of the residential stock)
Columns (2) (4) and (6) additionally control for the log real hourly wages at the 25th and 50th
percentiles of the distribution within the PFA the log unemployment rate in the PFA and the
share of 15-24 year olds in the population in the PFA Public housing is positively and precisely
correlated with all crime outcomes The coefficient on total crime in column (2) of 0064
implies that a 01 unit increase in the size of the public housing stock measured as a proportion
of the residential stock in the PFA in 1980 (approximately a one standard deviation increase)
is associated with an increase in the crime rate of 00064 units equating to approximately half
of one standard deviation increase in crime The positive correlation between public housing
and criminality is not affected by the inclusion of local area variables in Equation (1)
ii Identification issues
18
The primary object of this study is to quantify the causal impact of homeownership on
crime rates In our empirical setting the Right-to-Buy (RTB) policy can be interpreted as a
relaxation of a supply constraint on available property for homeownership by allowing public
housing tenants to purchase their homes at a subsidy Of course this policy does not directly
generate a pure natural experiment in observed RTB sales for at least two reasons First there
may be important time-varying omitted factors that drive both the decision by a tenant to
purchase the house and the local crime rate Second RTB sales are a result of demand for
public housing purchases together with the local supply of housing for sale With demand being
determined at least in part by local crime rates OLS estimates of the relationship between
crime rate and public housing sales will suffer from endogeneity bias It is very likely that the
decision by the tenant to purchase the house may itself be partly determined by the level and
dynamics of local crime Indeed unsurprisingly a negative relationship appears between crime
rates and public housing sales in 1980 in Figure A4 in Appendix A further suggesting that
RTB sales were not orthogonal to crime rates at the onset of the RTB policy
iii Short-run estimates
a Empirical strategy
Our empirical strategy exploits two approaches to estimating the effect of sales of
public housing on crime rates that isolate supply-side variation in exposure to the RTB policy
This variation arises from differences across localities in the potential exposure to RTB sales
The analysis of the short-run impact of public housing sales on crime defines a series of
difference-in-differences specifications whereby the years of tenure duration in public housing
of incumbent tenants in 1980 are used to proxy the Intention-To-Treat (ITT) intensity of the
RTB treatment at the PFA level The national level policy albeit introduced uniformly across
localities in 1980 was specified in such a way that eligibility to the RTB scheme and the size
of the discounts varied across localities depending on the average number of years spent in
public properties by the incumbent tenants prior to the reform
In particular the Housing Act of 1980 introduced a statutory right to buy for public
tenants with at least three yearsrsquo tenure duration in their public house Moreover discounts on
the sale price relative to the market value of the property linearly increased with public housing
tenure duration ranging from 33 percent for public housing tenants with three yearsrsquo residence
through to a maximum of 50 percent after twenty yearsrsquo residence Thus the discounts to
purchase a public property generated by RTB were directly related with the years of tenure
19
duration in public housing when the RTB scheme was introduced and years of tenure duration
in public housing in 1980 constitutes a predetermined source of differential exposure to the
RTB scheme that could not be gamed in 1980
In Columns (7) and (8) in Table 2 equation (1) is re-estimated and the fraction of public
housing in the PFA the log real hourly wages at the 25th and 50th percentiles of the distribution
within the PFA the log unemployment rate in the PFA and the share of 15-24 year olds in the
population in the PFA are used to predict log average years of tenure duration in public housing
in the PFA in 1980 As Table 2 shows none of these variables predicts public housing tenure
duration in 1980 suggesting that its distribution across regions and thus RTB eligibility in 1980
is orthogonal to local area circumstances and the average socio-economic status of individuals
Combined with the fact that RTB came into force shortly after the 1979 election of the new
Thatcher Government and people in the 1970s could not freely move across public properties
(especially between local authorities) but rather had to apply and join a potentially long queue
prior to being able to move in and out of public properties this makes the distribution of RTB
eligibility at the onset of the policy quasi-random
Eligibility to the RTB scheme and in turn intensity of adoption varied across regions
according to the composition of the local housing stock which was determined by historical
factors Public housing sales under the RTB policy began in most LAs in October 1980 (the
1980 Housing Act was passed on 8 August with most LAs starting to process applications for
public housing purchases soon thereafter) Figure 2 shows that the RTB policy resulted in an
initial peak in public housing sales from October 1980 to 1982 after which RTB sales
continued at a slower pace The initial eligibility to the RTB scheme was mainly responsible
for this and it is therefore exploited empirically in the econometric analysis
Since the discount on the sale price would be repayable if a property was resold within
five years of an RTB purchase and the RTB scheme was extended to flats in 1986 the short-
run analysis is conducted separately on the first five years of the RTB scheme ie up until
1985 and on the entire Thatcher era ie up until 1992 When the analysis is restricted to the
first five years of the RTB scheme years of tenure duration in public housing of incumbent
tenants in 1980 are also used as an instrumental variable (IV) for the actual sales of public
housing under the RTB scheme in the first year of the RTB scheme The same IV approach is
not used for later years because starting from 1986 the possibility that properties bought under
the RTB scheme were resold in the private market cannot be ruled out ex ante
20
Figure 4 illustrates a strong positive correlation between the log average years of tenure
duration in public housing in the PFA in 1980 (on the x-axis) and the log percentage of the
residential stock in the PFA which was sold-off in the first year of the RTB scheme ie by
1981 (on the y-axis) These initial sales of the residential stock in the first year of the RTB
scheme are also shown in Figure 5 to be positively correlated with the percentage sold-off
between 1980 and 1992 (on the y-axis) Therefore while RTB public housing sales by 1992
may be the endogenous result of the evolution of crime post 1980 and thereby result in a well-
known problem of reverse causation in our estimates the public housing tenure duration in
1980 constitute an ITT proxy that strongly predicts the actual intensity of the RTB scheme at
the PFA level
For this analysis data on crime rates public housing tenure duration and local area are
used from 1975 to 1992 The estimating difference-in-differences specification can be
expressed as follows
119862119862119894119894119905119905 = αi+αt + 1205731205731 lowast 11987711987711987711987711987711987711989411989480 + 1205731205732 lowast 119875119875119875119875119875119875119875119875119905119905 + 1205731205733 lowast 11987711987711987711987711987711987711989411989480 lowast 119875119875119875119875119875119875119875119875119905119905 + 1205731205734119935119935119946119946119946119946 + 120598120598119894119894 (2)
where 119862119862119894119894119905119905 is the crime rate in PFA i in each year t from 1975 to 1992 αi is a set of PFA fixed
effects and αt is a set of year fixed effects 11987711987711987711987711987711987711989411989480 is log average years of tenure duration in
public housing ie a measure of RTB eligibility in 1980 defined both as a continuous variable
and as a binary variable indicating if average years of public housing tenure duration in PFA i
were greater than or equal to the median value of average years of public housing tenure
duration at the national level in 1980 Post is a dummy variable that takes up value 1 starting
from 1980
The main estimand of interest is 1205731205733 the coefficient associated with the interaction
between 11987711987711987711987711987711987711989411989480 and Post which measures the impact of the initial RTB eligibility-induced
shock to homeownership on crime A negative coefficient associated with 1205731205733 would imply that
PFAs that experienced greater RTB eligibility in 1980 experienced lower relative crime rates
by 1992 due to the RTB scheme This parameter is directly of interest to a policy maker wishing
to modify homeownership rights for the general population as tenure duration in public
housing was an explicit predetermined policy criterion in the Housing Act of 1980 that could
not be gamed in the short run and that determined eligibility to the RTB scheme
The causal interpretation of 1205731205733 crucially relies on the absence of differential pre-
treatment trends between PFAs exposed to different degrees of RTB eligibility in 1980 Insofar
as RTB eligibility in 1980 does not predict crime trends prior to the RTB policy then 1205731205733 can
21
be interpreted as the ITT causal impact of the RTB policy on crime The potential presence of
differential pre-treatment crime trends between PFAs that experienced different degrees of
RTB eligibility is tested and results are presented below Finally 119935119935119946119946 is a vector of local area
controls measured in 1980 and interacted with the Post variable which includes the fraction of
public housing in the PFA the log real hourly wages at the 25th and 50th percentiles of the
distribution within the PFA the log unemployment rate in the PFA and the share of 15-24 year
olds in the population in the PFA while 120598120598119894119894 is the error term Due to the small number of clusters
(42 PFAs) in the analysis p-values were derived for inference from Wild Cluster Bootstrap
estimation with standard errors clustered at the PFA level (see Cameron Gelbach and Miller
2008)
b Short run results
Table 3 presents unconditional difference-in-differences estimates based upon the
dichotomous treatment version of Equation (2) (calculated absent any of the labour market
controls or fixed effects stated in the equation) Panel A shows results for the 1975-85 period
when property resales should have been extremely rare since the discount on the sale price
would be repayable and Panel B shows results for the 1975-92 period In the calculations
PFAs are split into two groups by the magnitude of 11987711987711987711987711987711987711989411989480 in which the above-or-equal-to-
median group is described as the lsquoITT treatmentrsquo group and the below median group is
described as the lsquoITT controlrsquo group Columns 1 and 2 state the pre-1980 average crime rate in
the PFA the post-1980 average crime rate in the PFA and the within-PFA post-pre difference
Column 3 shows the pre-1980 and post-1980 differences between the ITT treatment and ITT
control PFAs Column 4 shows the unconditional difference-in-differences estimate and
column (5) shows the unconditional difference-in-differences estimate deflated by the mean
level of crime in the ITT control group prior to 1980 in percent terms (the unconditional percent
effect) The unconditional difference-in-differences coefficient estimate is negative and
precisely defined in both Panels A and B On average PFAs that experienced RTB eligibility
greater or equal to the national median in 1980 experienced overall crime rates that were 85
lower from 1980 to 1985 and roughly 11 lower from 1980 to 1992
Figure 6 plots the raw data underlying these statistically significant difference-in-
differences estimates The Figure shows average crime rates (weighted by population at the
PFA level) for every year from 1975 to 1992 separately for ITT treatment and ITT control
PFAs The visual inspection of Figure 6 reveals that while crime rates appear on similar trends
prior to 1980 in ITT treatment and ITT control PFAs the gap widened after 1980 with ITT
22
control PFAs experiencing a greater increase in crime rates starting from the early 1980s
Compared with the 1970s a wider gap in crime rates is also observed in the early 1990s when
the short run analysis terminates These unconditional estimates and those in Table 3 suggest
that sales of public housing under the RTB scheme may have helped tackle the nationwide
rising trend in criminality experienced in England and Wales in the 1980s
Table 4 subjects these results to a set of more robust econometric specifications
Columns (1)-(3) show ITT results for the 1975-85 period columns (4) and (5) show IV results
for the 1975-85 period and Columns (6)-(9) show ITT results for the 1975-92 period All
estimated specifications include PFA fixed effects and year fixed effects and the models in
Columns (2)-(5) and (7)-(9) additionally include the interaction between the Post variable in
equation (2) and local area variables measured in 1980 (ie fraction of public housing log of
the unemployment rate log of real hourly earnings at the 25th and 50th percentiles of the
distribution and the fraction of 15-24 year olds in the population) Columns (1) to (8) report
the ITT and IV estimates of 1205731205733 the coefficient associated with the interaction between 11987711987711987711987711987711987711989411989480
and Post in equation (2) whereas the model in Column (9) shows the results separately for the
first eight years of the RTB policy 1980-87 and for the subsequent years that followed the
1987 UK General Elections when Margaret Thatcher was re-elected as UK Prime Minister
1987-92 In all specifications standard errors were clustered at the PFA level and Wild Cluster
Bootstrap techniques were used for inference due to the small number of clusters
Column (1) shows results based upon the dichotomous treatment version of 11987711987711987711987711987711987711989411989480 in
Equation (2) indicating that ITT treatment group PFAs experienced a 10 percent reduction in
crime by 1985 Column (2) shows results based upon the continuous treatment version of
11987711987711987711987711987711987711989411989480 and when the interactions between local area circumstances measured in 1980 and the
Post variable are also added to the estimated specification Column (2) also shows negative
and statistically significant estimates suggesting that the conclusion from Table 3 that RTB
eligibility led to a reduction in crime in the 1980s and early 1990s is robust to equation
specification In particular estimates in Column (2) uncover an elasticity of crime with respect
to RTB eligibility of approximately -019 implying that a 10 percent increase in eligibility to
the RTB scheme reduced crime by around 19 percent within the first five years of the scheme
The causal interpretation of these estimates crucially relies on the absence of
differential pre-treatment crime trends between PFAs that were exposed to different degrees of
RTB eligibility in 1980 Column (3) shows event-study estimates where the log average years
23
of tenure duration in public housing in 1980 was interacted with three pre-reform years Two
key facts emerge from Column (3) First Column (3) shows there to be no differential pre-
treatment trends between PFAs that received different exposures to the RTB scheme In other
words RTB eligibility in 1980 does not predict crime trends across PFAs prior to 1980 This
implies that any post-1980 deviation from the existing trend that is predicted by the eligibility
to the RTB scheme in 1980 can be interpreted as the ITT impact of the RTB scheme on crime
Second estimates in Column (3) show a reduction in crime rates among PFAs that experienced
greater RTB eligibility in 1980 uncovering an elasticity of crime with respect to RTB
eligibility of approximately -028
Columns (4) and (5) show the IV estimates for the period 1975-85 and they retrieve
similar slightly larger negative elasticities In both columns the actual public housing sales
under the RTB scheme in the first year of the policy ie in 1980-81 are instrumented using
the log average years of tenure duration of incumbent tenants in public housing in 1980 Both
columns show negative and statistically significant estimates with Column (5) also showing
there to be no differential pre-treatment trends between PFAs that received different exposures
to the RTB scheme Similarly to the ITT estimates in Column (3) IV estimates in columns (4)
and (5) uncover an elasticity of crime with respect to RTB sales of approximately -028 to -
042 implying that a 10 percent increase in the RTB public housing sales reduced crime by
around 3 to 4 percent by 1985
In the remaining Columns (6)-(9) the analysis is extended up until 1992 the year when
the Thatcher era ended but very similar conclusions emerge Column (6) shows results based
upon the dichotomous treatment version of 11987711987711987711987711987711987711989411989480 in Equation (2) and it indicates that ITT
treatment group PFAs experienced a 128 percent reduction in crime by 1992 Columns (7) and
(8) show results based upon the continuous treatment version of 11987711987711987711987711987711987711989411989480 and when the
interactions between local area circumstances measured in 1980 and the Post variable are also
added to the estimated specification Columns (7) and (8) also show negative and statistically
significant estimates uncovering an elasticity of crime with respect to RTB eligibility of
roughly -028 to -036 implying that a 10 percent increase in eligibility to the RTB scheme
reduced crime by around 28 to 36 percent by 1992 When broken down between the years
prior to 1987 and later years Column (9) shows that a sizeable and statistically significant
crime-reducing effect of RTB eligibility appears in both the 1980s and early 1990s with little
variation appearing in the estimated crime-reducing effects of RTB across time and model
specifications
24
Throughout these estimates the magnitude of the crime reduction caused by the RTB
scheme by 1992 appears very similar to the magnitude observed by 1985 In the early years of
the RTB scheme no one who purchased a property under the RTB scheme could have possibly
resold it while continuing to benefit from the large discounts offered by the Thatcher-led
government under the RTB scheme as explained above Thus crime reductions from 1980-
85 as well as 1980-87 are very unlikely to result from the practice of reselling properties
previously bought under the RTB scheme to incomers that are more affluent If the ldquomigration-
basedrdquo gentrification of certain areas of the country was the underlying mechanism driving
these crime reductions significance in the estimates should not appear until the late 1980s
when the first properties bought under the RTB scheme in 1980 could be resold without having
to renounce the RTB discounts However this is not what is found here A crime reduction
appears in the early years of the RTB scheme a result that is rather consistent with behavioural
changes within the local communities that were more exposed to the provisions of the scheme
Estimates for property crime in Table 5 tell a similar story while no detectable effects
of RTB eligibility and RTB sales appear for violent crime in Table 6 Both Tables are organised
in the same way as Table 4 In both Tables all estimated specifications include PFA fixed
effects and year fixed effects with the models in Columns (2)-(5) and Columns (7)-(9)
additionally including the interactions between the Post variable in equation (2) and local area
variables measured in 1980 (ie fraction of public housing log of the unemployment rate log
of real hourly earnings at the 25th and 50th percentiles of the distribution and the fraction of
15-24 year olds in the population) In all specifications standard errors were clustered at the
PFA level and Wild Cluster Bootstrap techniques were used again for inference due to the
small number of clusters
Regardless of whether estimates are derived from the 1975-85 period or the 1975-92
period and regardless of whether ITT or IV estimates are considered results in Table 5 indicate
that the RTB scheme had a negative and significant impact on property crime uncovering an
elasticity of property crime with respect to the RTB scheme of approximately -03 to -04
implying that a 10 percent increase in eligibility to the RTB public housing sales reduces
property crime by around 3 to 4 percent Also in Table 5 Columns (3) (5) (8) and (9) show
there to be no differential pre-treatment trends between PFAs that received different exposures
to the RTB scheme as none of the estimated pre-treatment coefficients appears statistically
significant Columns (1) to (5) show that a RTB-induced property crime reduction was already
visible by 1985 and Column (9) also shows that a sizeable and statistically significant property
25
crime-reducing effect of RTB eligibility appears both in the 1980s and early 1990s consistent
with the notion that RTB eligibility led to behavioural changes within the local communities
rather than gentrification induced by in-migration
Table 6 studies the effect of RTB eligibility on violent crime and no significance
appears in the estimates Also in this case ITT and IV estimates from the 1975-85 period reach
the same conclusion as ITT estimates from the 1975-92 period Estimates Columns (3) (5) (8)
and (9) show there to be no differential pre-treatment trends between PFAs that received
different exposures to the RTB scheme suggesting that RTB eligibility in 1980 does not predict
violent crime trends either across PFAs prior to 1980 and further supporting the causal
interpretation of the estimates presented in Tables 4 and 5 and discussed in this section
c Political Colour Labour Markets Local Amenities and Police Deployment
Why did greater eligibility to the RTB scheme lead to a detectable reduction in crime
The mechanisms underlying the findings in Tables 3-6 and Figure 6 were investigated through
a variety of statistical tests First one may worry that this analysis is spuriously picking up
some other PFA-specific characteristics such as the political affiliation of the local
administration To test this data on the political ldquocomplexionrdquo of the PFA in the local elections
in 1977 the latest local elections prior to the election of Margaret Thatcher as UK Prime
Minister in 1979 were used Although RTB sales were only used in the IV estimates and not
in the ITT reduced-form estimates of equation (2) presented in Tables 4-6 one may worry that
the de facto supply-side availability of public housing for RTB sales might have differed by
local political control If for example pro-Thatcher Conservative-controlled LAs were more
willing to fulfil their statutory responsibility to accelerate sales through faster processing (or
potentially be more likely to advertise and encourage the possibility locally) then this omitted
confound might weaken the predictive power of public housing tenure duration and co-
determine RTB sales and crime However a scatter plot in Figure A5 in Appendix A suggests
no correlation between the conservative vote share within the PFA and RTB sales from 1980-
92 as a percentage of the residential stock in 1980 Estimates of the impact of eligibility to the
RTB scheme on crime were also produced when a set of interactions between the Conservative
vote share within the PFA in the 1977 local elections and year fixed effects were added to the
econometric specification22 Results are unchanged with the inclusion of this additional
variable which suggests that our results are not caused by Labour controlled LAs opposing
22 The Conservative vote share is the share of Conservative votes in all votes cast in the parliamentary constituencies nested within the PFA
26
this policy for political reasons while facing greater local crime rates This holds true regardless
of whether local area variables are included in the analysis
One additional concern may be that the reduction in crime rates observed in areas with
greater RTB eligibility in 1980 may reflect some underlying trends in local labour markets If
for example incumbent tenants spent more years in public housing prior to 1980 in areas that
faced more favourable labour market prospects thus facing greater discounts under the RTB
scheme and these same areas then experienced reduced criminality thanks to the improved
labour market circumstances then the reduction in crime observed in Tables 3-6 and Figure 6
would be erroneously attributed to the RTB scheme Models to test for the effects of RTB
eligibility on local labour market conditions were therefore estimated and results are displayed
in Table 7 Whether the unemployment rate the 25th percentile real hourly earnings or the 50th
percentile real hourly earnings are modelled as dependent variable no evidence appears that
eligibility to the RTB scheme in 1980 predicted the evolution of local labour market conditions
in the 1980s and early 1990s These results mitigate the concern that our estimates might be
picking up the effect of other local area circumstances that interacted with public housing sales
over time in the 1980s
Eligibility to the RTB scheme in 1980 does not even seem to predict the local fraction
of 15-24 year olds in the population in the 1980s and early 1990s a relevant finding that further
suggests that migration and a compositional change in the local population do not seem to be
the key mechanisms at play here If a ldquomigration-basedrdquo gentrification was behind the main
results of this paper RTB eligibility would predict the composition of the local population in
the 1980s and 1990s If for example all RTB purchasers had rented out their properties to
students right after purchasing them (and this was the true driver of the crime reduction in
Tables 4 and 5) then RTB eligibility should be a positive predictor of the fraction of 15-24
year olds in the population However this is not what is found here
One further concern may be that initial RTB eligibility positively correlates with the
quality of local amenities across regions in England and Wales The initial uptake of the RTB
scheme may have been greater in areas with ldquobetter-qualityrdquo public housing Similarly one
may worry that in 1980 only the ldquowell-offrdquo public tenants were able to exploit the RTB scheme
and purchase their houses while ldquothe very poorrdquo were left behind Both these scenarios would
imply that in the short run analysis initial RTB sales may be picking up other relevant
socioeconomic components of communities If initial RTB sales were concentrated among
27
better-off areas or individuals the crime-reducing effect that is observed may not be due to the
sales of public housing but rather due to the fact that we are not comparing like-with-like
To test for the possibility that RTB sales grew faster in areas with greater-quality public
housing the main model was re-estimated and the treatment variable replaced with the value
of RTB sales in the first year of the RTB scheme in place of the eligibility to the RTB scheme
in 1980 The result of this exercise is shown in column (5) of Table 7 When crime is regressed
on the average (log) value of RTB transactions in the first year of the RTB scheme the
estimated coefficient appears small in magnitude as well as in percent terms and very
statistically insignificant Thus unlike RTB eligibility the value of RTB sales does not predict
the evolution of crime This conclusion is robust to the set of controls added to the estimating
equation (fixed effects only or fixed effects and local area variables) In sum the initial
eligibility to RTB sales not their average value predicts the reduction in crime since the 1980s
Finally one may worry that the RTB scheme may have coincided with differential
policing strategies across regions and that this may have resulted in differential crime detection
rates across regions If for example fewer police officers were deployed in areas with greater
RTB sales in 1980 our findings may reflect the lower crime detection rates of the police in
these areas rather than a genuine reduction in crime Availability of data on the number of
officers employed in each PFA since 1975 allowed us to estimate the impact of RTB eligibility
on police deployment This is a further test of whether indeed the RTB scheme made some
areas of the country safer or whether it coincided with a decrease in police deployment To
examine this idea the dependent variable in the difference-in-differences specification was
replaced with the log number of police officers deployed by the PFA Results are displayed in
column (6) of Table 7 and the coefficient of interest is economically small and not statistically
significant suggesting that the greater exposure to the RTB scheme of some PFAs did not
coincide with differential policing strategies In turn this mitigates the concern that differential
policing strategies and crime detection rates across regions may have coincided with the RTB
scheme and further suggests that our main results reveal the genuine reduction in criminality
generated by the RTB scheme
d Homeownership and Behavioural Change
Did the RTB policy induce indigenous local communities to refurbish their properties
One possibility is that home upgrading by purchasers under the RTB scheme explains the
observed reduction in crime (absent any clear migration labour market or amenity differential
28
between areas that were exposed to differing degrees to the RTB policy) The British Crime
Survey (BCS) 1988 contains a rich set of variables concerning homeownership and crime23
Based on the information contained in the BCS 1988 it was possible to define a treatment
group of incumbent tenants who had previously rented from the council then subsequently
purchased the property in which they currently reside and a control group of council rental
tenants who stated that they currently intend to buy the public property in which they reside
within two years This provides a natural comparison group against which to estimate the
effects of purchase on behavioural change to build at least strongly suggestive evidence for the
effects of the policy Table A1 in the Appendix shows these treatment group individuals and
control group individuals to be observably indistinguishable in terms of age gender ethnicity
income number of rooms in the household household type (eg flat or house) and past
experiences of burglary victimization For each of these individual and household
characteristics Table A1 presents a balancing test that retrieves an insignificant estimate thus
showing the suitability of the comparison group
Table 8 shows a comparison of home improvement expenditure insurance and social
behaviour between these two groups of observably similar individuals Panel A shows
unconditional OLS estimates thus providing a simple comparison of the means between these
two groups OLS estimates in Panel B were derived controlling for the set of variables for
which balancing was tested in Appendix Table A1 ie gender ethnicity a quadratic of age
past experiences of burglary victimization in the property of residence type of property (eg
flat or house) number of rooms in the property household income band and county fixed
effects Thus while self-selection into the treatment group is a possibility controlling for this
large set of observables and restricting the treatment and control groups to incumbent
individuals that only seem to differ in their timing of willingness to purchase their property
from the council within two years should mitigate the concern that self-selection is driving our
results here To be consistent with all other results at PFA level standard errors were clustered
at the county level the closest geography to a PFA that was available in these data As
respondents are drawn from 52 counties Wild Cluster Bootstrap p-values were estimated again
as in all the analysis discussed above
The results in Table 8 show that incumbent tenants who bought from the council were
significantly more likely to install double locks to outside doors to install locks in windows
23 The same detail of information is not available from any other BCS survey from 1982 to 1992 when the short run analysis ends
29
and have the contents of their home insured against theft The same individuals were also
significantly more likely to install burglar alarms a relatively rare security device in England
and Wales in 1988 Finally these individuals were not more likely to join a neighbourhood
watch scheme a community-based crime prevention measure in which neighbours help each
other in a form of informal guardianship The comparison group here is always council tenants
who intended to buy the public property in which they resided in 1988 within two years
Consistent with the finding in Appendix Table A1 that observable characteristics are equally
distributed between treatment group individuals and control group individuals the comparison
of Panel A and Panel B shows that these conclusions are unchanged whether the set of
observable controls described above is included in the estimating equation or not
Additional analysis using the BCS data corroborates our main findings for the effects
of the RTB policy on crime Table A2 in the Appendix uses the BCS data to compare crime
victimization rates among treated versus control group individuals The Table shows that in
1988 treatment group homeowners reported between 20 and 25 less cases of crime
victimisation since the beginning of 1987 than control group council tenants Columns (1) and
(3) show that this holds true regardless of whether county fixed effects are controlled for
Column (5) of the Table also shows results when county fixed effects are replaced by the share
of treatment group homeowners in the county24 The coefficient associated with
homeownership under the RTB scheme remains negative and statistically significant In
contrast the share of treatment group homeowners in the county itself does not predict crime
victimisation Thus while reiterating that the crime reductions in Tables 3-6 and Figure 6 are
indeed driven by RTB sales these results also show that RTB sales did not lead to increased
crime victimisation of neighbouring occupiers of public housing
Figure 7 shows county-specific estimates of the correlation between RTB sales and
crime victimisation plotted against county-specific estimates of the correlation between RTB
sales and home improvement A linear function fitting the distribution of county-specific
estimates is also shown This appears negative and statistically significant showing that on
average incumbent tenants who bought under the RTB scheme experienced greater crime
reduction in counties in which the RTB scheme was associated with greater home
improvement
24 For each respondent this share was calculated at the county level leaving out the respondent herselfhimself from the calculation
30
The low-income homeownership experiment in Oklahoma investigated by Engelhardt
et al (2010) showed little or no significant evidence of home improvements of this sort
subsequent to purchase but that study covered a relatively short time interval post-purchase
and take-up of the subsidy was relatively low In contrast the results in Table 8 for doorsrsquo and
windowsrsquo locks and burglar alarms are consistent with the notion that homeownership led
people to refurbish their properties Homeownership may have given greater access to loans
and financial markets in general and the result for theft insurance plausibly reflects this These
results help rationalise the reduction in property crime Controlling for past experiences of
burglary victimisation also mitigates the concern that RTB purchasers may have experienced
greater crime victimisation in the past and that this may drive the results in Table 8 In contrast
since homeowners were no more likely to join a neighbourhood watch scheme no evidence
appears here that the RTB induced greater investment in social capital in local communities
where RTB unfolded more intensively
Table A2 in the Appendix suggested that no crime displacement occurred from public
houses sold under the RTB scheme to neighbouring public housing not yet sold under the RTB
scheme However one may also worry that the property crime reduction in Table 5 is entirely
driven by reductions in burglary with potential thieves shifting albeit to a lesser extent to
other thefts in the street Table 9 shows the results of our analyses in Tables 4-6 broken down
by crime categories Panel A shows results for the 1975-85 period and Panel B shows results
for the 1975-92 period Results are displayed separately for the crime categories that constitute
our measure of property crime namely burglary and theft and handling of stolen goods as well
as for the crime categories that constitute our measure of violent crime namely violence against
the person sexual offences and robbery
Breaking down property crime into burglary and theft and handling of stolen goods
reveals that no evidence of such ldquodisplacementrdquo of crime appears The reduction in property
crime is driven by a reduction in burglaries although a reduction in theft and handling of stolen
goods appears in the 1975-85 period ie in Panel A The reduction in theft and handling of
stolen goods does not appear statistically significant by 1992 but certainly no increase in this
crime category appears Moreover and similarly the breakdown of the results for violent crime
by crime category shows no evidence of crime displacement across categories as violence
against the person and sexual offences remain unchanged Interestingly both by 1985 and by
1992 a significant negative effect of the RTB scheme is found on robberies which are
31
categorised as violent crimes here because they involve a violent act but they are also often
economically motivated criminal offences
iv Long-Run Estimates
a Empirical strategy
But what of the long-run consequences of homeownership on crime This section
presents estimates of the long-run effects of homeownership induced by the Right-to-Buy
(RTB) policy on local crime rates To do so an instrumental variable (IV) long-differenced
model specification is used which exploits variation in the size of the public housing stock in
1980 across localities As argued above exposure to the policy was bounded by the size of the
public housing stock in 1980 Localities with less public housing would not experience large
increases in the homeownership rate due to the more limited supply As discussed in Section
2 variation in the size of the public housing stock across localities arose due to historical events
around the period of the two World Wars events which are unrelated to recent dynamics of
crime In formal terms the set of estimating equations can be expressed as follows
1198621198621198941198942017 minus 1198621198621198941198942003 = 119886119886 + 1205731205731 lowast 11986711986712048412048492 + 1205731205732 lowast 11986211986211989411989480 + 1205731205733 lowast 119883119883119894119894 + 120598120598119894119894 (3)
11986711986711989411989492 = 119886119886 + 1205731205731 lowast 11986711986711989411989480 + 120598120598119894119894 (4)
where 1198621198621198941198942017 minus 1198621198621198941198942003 is the change in the crime rate in locality i from 2003 to 2017 and
11986711986711989411989492 is the endogenous change in the size of the public housing stock from 1980 to 1992
expressed as a proportion of the residential stock in 1980 11986711986711989411989492 is therefore instrumented with
11986711986711989411989480 the 1980 level of the public housing stock 11986211986211989411989480 is the crime rate in locality i in 1980 119883119883119894119894
is a vector of contemporaneous local area variables (ie the local log real hourly wages at the
25th and 50th percentiles of the distribution the local log unemployment rate and the local share
of 15-24 years olds in the population) and 120598120598119894119894 is the error term As crime data is available from
2003 at the Local Authority (LA) level this model can be estimated at the LA level
The identifying assumption in the model described in Equations (3) and (4) is that
conditional on the level of crime in 1980 and the set of contemporaneous local area variables
captured in the vector 119883119883119894119894 the size of the public housing stock in 1980 in the LA is exogenous
to the dynamics of crime within the LA in the 2000s The exclusion restriction is that
conditional on the level of crime in 1980 and the set of contemporaneous local area variables
in the vector 119883119883119894119894 the size of the public housing stock in 1980 affects the dynamics of crime in
the 2000s only through public housing sales over the subsequent period
32
b Results
Summary data for the dependent variable in Equation 3 and the set of local area
variables in the vector 119883119883119894119894 are shown in Table 10 The crime rate fell over the period in more
than 90 of LAs The 25th percentile log real hourly wage fell too over the period while the
share of 15-24 year olds in the population remained unchanged and the log unemployment rate
rose (at a national level the unemployment rate rose from 5 in March 2003 to 76 by March
2013 during the period following the financial crisis)
The instrumental variable regression requires a strong first-stage relationship between
the public housing stock in 1980 and subsequent RTB sales over the period 1980-92 Figure
A6 in Appendix A illustrates that there is a strong correlation between the size of the public
housing stock in the LA in 1980 and subsequent sales under the RTB policy The scatterplot in
the Figure shows a strong positive relationship The coefficient (standard error) on the
instrument in the first-stage regression is 0242 (0017) with a F-statistic from the regression
of 19555
Estimates of Equation 3 are shown in Table 11 Estimates are grouped by the three
measures of crime examined above the overall crime rate in columns (1)-(3) property crime
rate in columns (4)-(6) and violent crime rate in columns (7)-(9) The leftmost specification for
each outcome includes only the independent variable of interest 11986711986711989411989492 instrumented by 11986711986711989411989480
For each outcome the coefficient on 11986711986711989411989492 is negative and precisely defined The middle
column of each sub-panel adds local area variables to the model with the rightmost column of
each sub-panel also adding a control for the crime rate in 1980 The coefficient on 11986711986711989411989492 remains
negative and precisely defined in each specification
The coefficient estimates imply that LAs experiencing larger increases in
homeownership experienced more rapid crime reductions The coefficient value of 0244 in
column (3) of Table 11 implies that a five percentage point higher increase in the
homeownership rate due to RTB sales caused an approximately fifty percent faster decline in
crime rate over the period 2003-2017 an effect approximately equal to a one standard deviation
higher speed of reduction in crime Among the covariates in all of the regressions the controls
for the level of crime in 1980 return negative and precisely defined coefficients These imply
a degree of convergence in LA level crime rates LAs with higher crime rates in 1980
experienced a faster decline in crime in the early 2000s conditional on the other covariates in
the regression
33
c Additional Long-Run Estimates
Did the RTB scheme leave any detectable mark on house prices and political
preferences of indigenous communities In this final sub-section the long-run effects of
increases in the homeownership rate brought about by RTB sales on house prices and on voting
behaviour are examined The increase in the homeownership rate via RTB sales increased the
potential housing supply to the private resale market Hence all else being equal RTB sales
would be expected to decrease house prices over time On the other hand the RTB scheme
may have also potentially increased the demand for housing in the private resale market
Moreover in the presence of outward migration of low-income households and inward
migration of higher-income households RTB sales may have had a positive impact on house
prices over time
To explore the impact of RTB sales on house prices in column (1) of Table 12 the
dependent variable was replaced with the change in the log of the average house price in the
LA over the period 2003 to 2014 House price data is obtained from the Land Registry house
price index The set of control variables is the same as in the models shown in Column (2) of
Table 11 The coefficient on RTB sales is negative and precisely defined and it implies that a
five percentage point increase in the homeownership rate due to RTB sales decreased house
prices over the period by approximately 65 This is an economically modest effect in the
context of an approximate doubling of house prices on average in LAs over the sample period
However this result highlights the general equilibrium effects of RTB sales on the housing
market
Second the effects of RTB sales on voting behaviour in LA elections were also
estimated To do so LA-level data on vote shares in the local election were matched to the
housing and crime data used so far and the changes in the Conservative vote share within the
LA over the period 1995 ndash 2015 were constructed and modelled as the dependent variable in
the regression The sample size in these estimates is smaller owing to the fact that the timing
of LA election cycles varies across LAs In Table 12 the coefficient on the RTB sales variable
is positive and precisely defined Hence these estimates suggest that the RTB policy was
effective in increasing the Conservative vote share in localities that saw larger increases in the
homeownership rate under the policy This result echoes the conclusion in Di Tella Galiani
and Schargrodsky (2007) that show that lucky squatters who received legal titles in Buenos
Aires in the 1990s report beliefs closer to those that favour the workings of a free market
34
5 Conclusion
This paper studies local crime reduction connected to the increase in homeownership rates
induced by the UK Governmentrsquos Right To Buy (RTB) scheme since 1980 One of the key
goals of the RTB scheme was as it were to lsquogentrifyrsquo households endogenously Specifically
it aimed to ease access to an owned property for (broadly) working class families and in doing
so to alter their behaviour and induce them to take greater care of their property as well as to
alter their economic position by giving them a collateral asset in financial markets The RTB
scheme offered a means of upgrading the economic position of households in neighbourhoods
previously dominated by public housing
The RTB scheme led to a reduction in crime Estimates from the Thatcher era uncover
an elasticity of crime with respect to eligibility to sales of public housing of roughly -03
implying that a 10 percent increase in eligibility to public housing sales reduced crime by
around 3 percent The RTB scheme led to a reduction in both property crime and robberies
and both short run and longer run evidence of crime reduction is presented However rather
than being driven by changes in the composition of households through inward and outward
migration the key mechanisms underlying the reduction in crime rates appear to be the
behavioural changes that the RTB scheme induced within the local community The findings
suggest that new renters-come-homeowners as a result of RTB altered their behaviour in
response to the incentives arising from acquisition of housing wealth They made their
properties safer and gained greater access to the insurance markets
While no evidence is found of compositional changes in the local population of
different regions of the country signs of this behavioural change appear from the early years
of the policy when no resales of properties bought under the RTB scheme could have taken
place while continuing to benefit from the discounts offered under this scheme In line with
this conclusion and contrary to what a migration-based model of gentrification would predict
house prices decreased in the long run and Conservative votes increased in areas most affected
by the RTB scheme These results therefore vindicate the Thatcher rationale for the policy
More broadly they suggest that increasing homeownership reduces local crime as public
housing tenants become owners of their own homes separately from the process of
gentrification whereby low-income neighbourhoods become middle-income neighbourhoods
through outward migration of low-income households and inward migration of higher-income
households These results complement the existing literature and inform policy by showing
how granting homeownership to indigenous communities can also act to reduce crime
35
Before concluding some words of caution are necessary First although the results
conform to the Thatcher rationale for the policy they certainly do not vindicate it overall to
show that would require a more general welfare analysis Indeed an analysis of this sort
presented in Disney and Guo (2017) suggests that the RTB policy generated complex inter-
and intra-generational welfare effects and that welfare-improving adjustments to the policy
should have been considered The welfare implications of the broad shift from direct provision
of public housing to cash transfers for purchase of housing services in the UK implied by RTB
and other policies akin to the US also requires further analysis Nonetheless the change in
behaviour and beliefs in indigenous communities documented here shows a novel means not
fully documented to date that complements the existing literature based on different research
designs and settings by which homeownership and housing policy may contribute to reduce
criminality Thus housing provision and subsidized homeownership have scope to act as
potentially important features of the sizable crime drops observed in the United States and
several other Western economies since the 1990s
36
References
Aliprantis D and D Hartley (2015) Blowing it up and knocking it down the local and city-
wide effects of demolishing high concentration public housing on crime Journal of Urban
Economics 88 67-81
Aliprantis D and F G-C Richter (forthcoming) Evidence of Neighborhood Effects from
Moving to Opportunity LATEs of Neighborhood Quality Review of Economics and
Statistics Forthcoming
Alonso J R Andrews and V Jorda Gil (2019) Do neighbourhood renewal programs reduce
crime rates Evidence from England Journal of Urban Economics 110 March 51-69
Altonji J G and R K Mansfield (2018) Estimating Group Effects Using Averages of
Observables to Control for Sorting on Unobservables School and Neighborhood Effects
American Economic Review 108 (10) 2902-46
Autor D C Palmer and P Pathak (2019) Ending rent control reduced crime in Cambridge
American Economic Association papers and Proceedings 109 381-384
Bell B J Blundell and S Machin (2018) The changing geography of intergenerational
mobility CEP Discussion Paper No 1591 Centre for Economic Performance London School
of Economics and Political Science London UK
Bergman P R Chetty S DeLuca N Hendren L F Katz and C Palmer (2020) Creating
Moves to Opportunity Experimental Evidence on Barriers to Neighborhood Choice Working
paper
Bernasco W T de Graaf J Rouwendal and W Steenbeek (2017) Social interactions and
crime revisited an investigation using individual offender data in Dutch neighborhoods The
Review of Economics and Statistics 99 622ndash636
Blanden J and S Machin (2017) Home Ownership and Social Mobility CEP Discussion
Paper No 1466 Centre for Economic Performance London School of Economics and Political
Science London UK
Cameron A C J G Gelbach and D L Miller (2008) Bootstrap-based improvements for
inference with clustered errors Review of Economics and Statistics 90(3)414ndash27
37
Chetty R and N Hendren (2018a) The Impacts of Neighborhoods on Intergenerational
Mobility I Childhood Exposure Effects Quarterly Journal of Economics 133 (2018a) 1107ndash
1162
Chetty R and N Hendren (2018b) The Impacts of Neighborhoods on Intergenerational
Mobility II County-Level Estimates Quarterly Journal of Economics 133 (2018b) 1163ndash
1228
Chetty R N Hendren and L F Katz (2016) The Effects of Exposure to Better
Neighborhoods on Children New Evidence from the Moving to Opportunity Experiment
American Economic Review 106 (4) 855-902
Chyn E (2018) Moved to opportunity the long-run effects of public housing demolition on
children American Economic Review 108 (10) 3028-56
Cullen J and S Levitt (1999) Crime urban flight and the consequences for cities Review of
Economics and Statistics 81 2 159-169
Damm A and C Dustmann (2014) Does growing up in a high crime neighborhood affect
youth criminal behavior American Economic Review 104 1806ndash1832
Di Pasquale D and E Glaeser (1999) Incentives and social capital are homeowners better
citizens Journal of Urban Economics 45 354-384
Di Tella R S Galiani and E Schargrodsky (2007) The formation of beliefs evidence from
the allocation of land titles to squatters The Quarterly Journal of Economics 122(1) 209-241
Diamond R and T McQuade (2019) Who wants affordable housing in their backyard An
equilibrium analysis of low-income property development Journal of Political Economy 127
no 3 (June 2019) 1063-1117
Disney R and G Luo (2017) The Right to Buy public housing in Britain a welfare analysis
Journal of Housing Economics 35 51-68
Ellen I K Horn and D Reed (2017) Has falling crime invited gentrification US Census
Bureau Center for Economic Studies Paper No CES-WP-17-27 March Washington DC
Engelhardt G M Eriksen W Gale and G Mills (2010) What are the social benefits of home
ownership Experimental evidence for low income households Journal of Urban Economics
67 249-258
38
Fryer R G Jr and L F Katz (2013) Achieving Escape Velocity Neighborhood and School
Interventions to Reduce Persistent Inequality American Economic Review 103 (3) 232ndash37
Gibbons S (2004) The costs of urban property crime The Economic Journal 113 F441-462
Gregg P S Machin and A Manning (2004) Mobility and joblessness In Card D Blundell
R and Freeman R (eds) Seeking a premier economy the economic effects of British economic
reform 1980-2000 371-410 NBER Chicago Chicago University Press
Grogger J (2002) The effects of civil gang injunctions on reported violent crime evidence
from Los Angeles County The Journal of Law amp Economics 45(1) 69-90
doi101086338348
Haurin D R Dietz and B Weinberg (2003) The impact of neighbourhood homeownership
rates a review of the theoretical and empirical literature Journal of Housing Research 13
119-151
Hausman N T Ramot-Nyska and N Zussman (2020) Homeownership Labor Supply and
Neighborhood Quality Working paper 2020
Hilber C and W Vermuelen (2014) The impact of supply constraints on house prices in
England The Economic Journal 126 March 358-405
Jones C and A Murie (2006) The Right to Buy analysis and evaluation of a housing policy
Blackwell Oxford
Jones RV (1978) Most Secret War London Hamish Hamilton
Katz L J R Kling and J B Liebman (2001) Moving to opportunity in Boston early results
of a randomized mobility experiment Quarterly Journal of Economics 116 607ndash654
Kling J R J B Liebman and L F Katz (2007) Experimental Analysis of Neighborhood
Effects Econometrica 75 (1) 83ndash119
Kling J R J Ludwig and L F Katz (2005) Neighborhood Effects on Crime for Female and
Male Youth Evidence from a Randomized Housing Voucher Experiment Quarterly Journal
of Economics 120 87ndash130
Landersoslash R HS Nielsen and M Simonsen (2016) School starting age and the crime-age
profile The Economic Journal 127 1096ndash1118
39
Ludwig J G J Duncan L A Gennetian L F Katz R C Kessler J R Kling and L
Sanbonmatsu (2013) Long-Term Neighborhood Effects on Low Income Families Evidence
from Moving to Opportunity American Economic Review 103 (3) 226ndash31
Ludwig J G J Duncan and P Hirschfield (2001) Urban poverty and juvenile crime
evidence from a randomized experiment Quarterly Journal of Economics 116 655ndash679
Ludwig J and J R Kling (2007) Is Crime Contagious The Journal of Law and Economics
50(3) 491ndash518
McDonald S (1986) Does gentrification affect crime rates Crime and Justice 8 163-201
Machin S and C Meghir (2004) Crime and economic incentives Journal of Human
Resources 39(4) 958-79
Morales-Mosquera M (2019) The economic value of crime control evidence from a large
investment on police infrastructure in Colombia Unpublished draft Harris School of Public
Policy at the University of Chicago
Murie A (1997) Linking housing changes to crime Social Policy and Administration 31 5
22-36
Office of National Statistics (2013) A century of home ownership in England and Wales
London
Olsen E (2003) Housing programs for low-income households In Moffitt R (ed) Means-
tested transfer programs in the United States 365-442 Chicago Chicago University Press
Owens E M Mioduszewski and C Bates (2019) How valuable are civil liberties Evidence
from gang injunctions crime and housing prices in Southern California Unpublished draft
Department of Criminology Law and Society and Department of Economics University of
California Irvine
Quetelet A (1831) [1984] Research on the propensity for crime at different ages translated
and introduced by Sawyer F Sylvester Cincinnati Anderson
Ridgeway G J Grogger R A Moyer and J M MacDonald (2018) Effect of gang
injunctions on crime a study of Los Angeles from 1988ndash2014 Journal of Quantitative
Criminology httpsdoi101007s10940-018-9396-7
40
Rotger G P and G C Galster (2019) Neighborhood peer effects on youth crime natural
experimental evidence Journal of Economic Geography Volume 19 Issue 3 May 2019 Pages
655ndash676 httpsdoiorg101093jeglby053
Sanbonmatsu L J Ludwig L Katz L Gennetian G Duncan R Kessler E Adam T
McDade and S Lindau (2011) Impacts of the Moving to Opportunity for Fair Housing
Demonstration Program after 10 to 15 Years Washington (DC) US Department of Housing
and Urban Development Office of Policy Development and Research November published
at httpwwwhuduserorgportalpublicationspdfMTOFHD_fullreport_v2pdf
Sandler D (2017) Externalities of public housing the effect of public housing demolition on
local crime Regional Science and Urban Economics 62 January 24-35
Schill M (1993) Distressed public housing where do we go from here University of Chicago
Law Review 60 2 497-554
Sciandra M L Sanbonmatsu G J Duncan L A Gennetian L F Katz R C Kessler J R
Kling and J Ludwig (2013) Long-Term Effects of the Moving to Opportunity Residential
Mobility Experiment on Crime and Delinquency Journal of Experimental Criminology 9 (4)
451ndash89
Sodini P S Van Nieuwerburgh R Vestman and U Von Lilienfeld-Toal (2017) Identifying
the Benefits from Home Ownership A Swedish Experiment Working paper
Van Dijk J and B Vollaard (2012) Self-Limiting crime waves in J Van Dijk A Tseloni
and G Farrell (eds) The International Crime Drop 2012 Palgrave MacMillan New York
Source Reproduced from Disney and Luo (2017) Chart 1 calculated from Office for National Statistics (2013)
0
10
20
30
40
50
60
70
80
90
100
1918 1939 1953 1961 1971 1981 1991 2001 2011
Figure 1 Housing Tenure Shares by Tenure Type England and Wales 1918-2011
Owning Private renting Social renting
42
Source Department of Communities and Local Government Housing Statistics Table 678
0
20 000
40 000
60 000
80 000
100 000
120 000
140 000
160 000
180 000
1980
-81
1983
-84
1986
-87
1989
-90
1992
-93
1995
-96
1998
-99
2001
-02
2004
-05
2007
-08
2010
-11
2013
-14
Publ
ic H
ousi
ng
Figure 2 Right to-Buy and Other Sales of Public Housing in England 1980-81 to 2013-14
Council house sales (mostly RTB) Sales of other social housing
43
Figure 3 Correlation Between Crime and Public Housing in 1980 Police Force Area (PFA)
Coeff (se) = 0001 (0000)
0
002
004
006
008
01
Crim
e in
198
0
10 20 30 40 50 Public Housing in 1980
Police Force Area Linear Fit
Crime vs Public Housing in 1980
Notes Figure shows for each Police Force Area (PFA) the crime rate in 1980 plotted against the fraction of public housing as a percent of the total residential stock in 1980 Crime is defined as total yearly counts of property and violent crime offences per population at the PFA level Property crime defined as total yearly counts of burglary and theft or handling of stolen goods offences per population at the PFA level Violent crime defined as total yearly counts of robbery violent and sexual offences per population at the PFA level A linear function fitting the correlation between the PFA-specific fraction of public housing and the crime rate weighted by PFA-specific population size in 1980 is also shown
44
Figure 4 Correlation Between Right-To-Buy (RTB) Public Housing Sales by 1981 and Tenure Duration in Public Housing in 1980
Coeff (se) = 0969 (0270)
0
1
-05
05
Log
Publ
ic H
ousi
ng S
ales
in 1
980-
81
2 22 24 26 28 3Log Public Housing Tenure in 1980
Police Force Area Linear Fit
Public Housing Sales in 1980-81 vs Tenure in 1980
Notes Figure shows for each Police Force Area (PFA) the log sales of public housing under the Right-To-Buy (RTB) scheme by 1981 plotted against PFA-specific log average years of tenure duration in public housing in 1980 A linear function fitting the distribution of PFA-specific log sales and log tenure duration weighted by PFA-specific population size in 1980 is also shown For each PFA in the analysis the horizontal axis shows the log value of average years of tenure duration in public housing in 1980 whereas the vertical axis shows the log count of sales of public housing under the RTB scheme by 1981 as a percent of the total residential stock in 1980
45
Figure 5 Correlation Between Right-To-Buy (RTB) Public Housing Sales in 1980-92 and RTB Public Housing Sales by 1981
Coeff (se) = 0513 (0090)
15
2
25
3
Log
Publ
ic H
ousi
ng S
ales
in 1
980-
92
0 1-05 05Log Public Housing Sales in 1980-81
Police Force Area Linear Fit
Public Housing Sales in 1980-92 vs 1980-81
Notes Figure shows for each Police Force Area (PFA) the log sales of public housing under the Right-To-Buy (RTB) scheme by 1992 plotted against PFA-specific log sales of public housing under the RTB scheme by 1981 A linear function fitting the distribution of PFA-specific log sales weighted by PFA-specific population size in 1980 is also shown For each PFA in the analysis the horizontal axis shows the log count of sales of public housing under the RTB scheme by 1981 as a percent of the total residential stock in 1980 whereas the vertical axis shows the log count of sales of public housing under the RTB scheme by 1992 as a percent of the total residential stock in 1980
46
Figure 6 Crime Rates in Intention-To-Treat (ITT) Treatment Police Force Areas (PFAs) and in ITT Control PFAs 1975-1992
002
004
006
008
01
Wei
ghte
d A
vera
ge a
nd 9
5 C
I
1975 1980 1987 1992Year
ITT Treatment PFAs (Housing Tenure in 1980 gt= p50)ITT Control PFAs (Housing Tenure in 1980 lt p50)
Crime Rates in ITT Treatment vs ITT Control PFAs
Notes Figure shows crime rates separately for ITT Treatment PFAs (Housing Tenure duration in 1980 gt= p50) and ITT Control PFAs (Housing Tenure duration in 1980 lt p50) Crime defined as total yearly counts of property and violent crime offences per population at the PFA level Property crime defined as total yearly counts of burglary and theft or handling of stolen goods offences per population at the PFA level Violent crime defined as total yearly counts of robbery violent and sexual offences per population at the PFA level Reported dots are averages weighted by population at the PFA level and capped bars are 95 confidence intervals
47
Figure 7 County-Specific Estimates of Correlation between Right-To-Buy (RTB) Public Housing Sales and Crime Victimisation against County-Specific Estimates of Correlation between RTB Public Housing Sales and Home Improvement 1988
Coeff (se) = -0518 (0271)
-2
-1
0
1
2
RTB
and
Crim
e Vi
ctim
isat
ion
-1 0 1-05 05RTB and Home Improvement
County-specific Effect Linear Fit
RTB and Crime Victimisation vs RTB and Home Improvement
Notes The figure shows county-specific estimates of the correlation between Right-To-Buy Scheme (RTB) public housing sales and crime victimisation plotted against county-specific estimates of the correlation between RTB public housing sales and home improvement A linear function fitting the distribution of county-specific estimates is also shown For each county in the analysis the horizontal axis shows the estimate of the correlation between RTB public housing sales and home improvement whereas the vertical axis shows county-specific estimates of the correlation between RTB public housing sales and crime victimisation Treatment group defined as homeowners who rented from the council the property in which they currently reside prior to buying it Control group defined as council tenants who currently intend to buy the public property in which they reside within two years
48
Table 1 Summary Data for 1980 Police Force Authorities (PFA)
Percentiles Mean Standard
Deviation Min Max p25 p50 p75 p90
Housing Stock Public Housing Stock ( Residential Stock) 27202 8574 14568 43798 21865 22966 34096 41869 Public Housing Sales by 1981 ( Residential Stock) 1231 0410 0735 2516 0910 1248 1417 1680 Public Housing Years of Tenure 11052 1875 8274 17936 9977 11302 11721 12843 Public Housing Units 191721 177523 27612 563046 71116 98794 246040 563046 Residential Stock Units 725288 738428 128410 2462295 301632 427384 639665 2462295 Crime Variables All Crime Rate 0045 0016 0020 0069 0031 0038 0060 0069 Property Crime Rate 0042 0015 0019 0065 0030 0035 0057 0065 Violent Crime Rate 0003 0001 0001 0006 0002 0003 0003 0004 Covariates Log Unemployment Rate -2885 0357 -3730 -2120 -3219 -2882 -2688 -2435 Log 25th Percentile Real Hourly Earnings 1345 0070 1228 1497 1305 1327 1360 1497 Log 50th Percentile Real Hourly Earnings 1613 0069 1488 1751 1565 1606 1635 1751 Fraction 15-24 Year Olds in Population 0157 0008 0138 0173 0152 0158 0162 0165 Observations 42
Notes Crime variables are measured as crime rates at the Police Force Area (PFA) level Crime defined as total yearly counts of property and violent crime offences per population at the PFA level Property crime defined as total yearly counts of burglary and theft or handling of stolen goods offences per population at the PFA level Violent crime defined as total yearly counts of robbery violent and sexual offences per population at the PFA level Local area variables are the log of the unemployment rate the 25th percentile log real hourly wage and the share of 15-24 year olds in the population each measured at the PFA geography
49
Table 2 Crime Rate Public Housing Stock and Tenure Duration in 1980 OLS Estimates Police Force Area (PFA)
All Crime
Property Crime
Violent Crime
Log Housing Tenure Duration
(1) (2) (3) (4) (5) (6) (7) (8) Public Housing (Prop Res Stock) 0087
(0028) 0064
(0017) 0082
(0026) 0059
(0017) 0005
(0001) 0004
(0001) 0082
(0317) -0023 (0447)
Log Unemployment Rate 0016 (0005)
0015 (0005)
0001 (0000)
0015 (0104)
Log 25th Percentile Real Hourly Earnings 0398 (0080)
0378 (0076)
0020 (0006)
-2358 (1425)
Log 50th Percentile Real Hourly Earnings -0252 (0078)
-0238 (0074)
-0014 (0007)
1400 (1440)
Fraction 15-24 Year Olds in Population 0574 (0219)
0546 (0206)
0028 (0016)
-2914 (2764)
Observations 42 42 42 42 42 42 42 42
Notes Table reports estimates from Ordinary Least Squares regression models Dependent variables are crime rates Crime defined as total yearly counts of property and violent crime offences per population at the Police Force Area (PFA) level Property crime defined as total yearly counts of burglary and theft or handling of stolen goods offences per population at the PFA level Violent crime defined as total yearly counts of robbery violent and sexual offences per population at the PFA level Data units are 42 PFAs in 1980 Standard errors shown in parenthesis indicates significance at 1 indicates significance at 5 indicates significance at 10
50
Table 3 Difference-in-Differences Before and After the Right-To-Buy Scheme
Intention-To-Treat (ITT)
Treatment PFAs (Log Public Housing Tenure Duration in 1980
gt= p50)
Intention-To-Treat (ITT)
Control PFAs (Log Public Housing Tenure Duration in 1980
lt p50)
Difference ((1) - (2))
Unconditional
DiD
Unconditional DiD Effect ((4) Pre (2))
(1) (2) (3) (4) (5) Panel A All Crime 1975-85 Pre- 0034 0047 -0013 Post- 0043 0060 -0017 Post ndash Pre 0009 0013 -0004
(p = 0085) -85
Number of Police Force Areas 21 21 Number of Observations 231 231 Panel B All Crime 1975-92 Pre- 0035 0047 -0012 Post- 0053 0070 -0017 Post ndash Pre 0018 0023 -0005
(p = 0072) -106
Number of Police Force Areas 21 21 Number of Observations 378 378
Notes Post-period defined as starting from 1980 the date of adoption of the Right to Buy (RTB) Policy in England and Wales Panel A shows results for the 1975-85 period and Panel B shows results for the 1975-92 period Crime defined as total yearly counts of property and violent crime offences per population at the Police Force Area (PFA) level Property crime defined as total yearly counts of burglary and theft or handling of stolen goods offences per population at the PFA level Violent crime defined as total yearly counts of robbery violent and sexual offences per population at the PFA level Averages weighted by population at the PFA level Standard errors were clustered at the PFA level and p-values from Wild Cluster Bootstrap are reported in parentheses Effect calculated as estimated coefficient divided by mean of dependent variable prior to 1980 in the ITT control group PFAs (Public Housing Tenure duration in 1980 lt p50)
Table 4 Estimates of Impact of Right-To-Buy Scheme on Crime
ITT 1975-85 IV 1975-85 ITT 1975-92 (1) (2) (3) (4) (5) (6) (7) (8) (9)
(Log RTB Sales in 1980-81) x Post -0013 (p = 0012)
-0020 (p = 0026)
(Log Tenure gt= p50) x Post -0005 (p = 0085)
-0006 (p = 0073)
Log Tenure x Post -0009 (p = 0055)
-0013 (p = 0087)
-0013 (p = 0038)
-0017 (p = 0049)
Log Tenure x 1988-92 -0018 (p = 0047)
Log Tenure x 1980-87 -0017 (p = 0090)
Log Tenure x 1979 -0009 (p = 0183)
-0009 (p = 0183)
-0009 (p = 0189)
-0009 (p = 0189)
Log Tenure x 1978 -0007 (p = 0514)
-0007 (p = 0541)
-0007 (p = 0525)
-0007 (p = 0525)
Log Tenure x 1977 -0005 (p = 0611)
-0005 (p = 0623)
-0005 (p = 0628)
-0005 (p = 0628)
Effect -10638 -0191 -0277 -0277 -0425 -12766 -0277 -0362 Effect x 1988-92 -0383 Effect x 1980-87 -0362
Log Unemployment Rate in 1980 x Post No Yes Yes Yes Yes No Yes Yes Yes Log 25th Percentile Earnings in 1980 x Post No Yes Yes Yes Yes No Yes Yes Yes Log 50th Percentile Earnings in 1980 x Post No Yes Yes Yes Yes No Yes Yes Yes Fraction 15-24 Years Old in 1980 x Post No Yes Yes Yes Yes No Yes Yes Yes Fraction of Public Housing in 1980 x Post No Yes Yes Yes Yes No Yes Yes Yes PFA Fixed Effects Yes Yes Yes Yes Yes Yes Yes Yes Yes Year Fixed Effects Yes Yes Yes Yes Yes Yes Yes Yes Yes
First Stage Coefficient on ITT 0647 (p = 0015)
0647 (p = 0019)
Sample Size 462 462 462 462 462 756 756 756 756 Number of PFAs 42 42 42 42 42 42 42 42 42
Notes Post-period defined as starting from 1980 the date of adoption of the Right to Buy (RTB) Policy in England and Wales Columns (1)-(5) show ITT and IV results for the 1975-85 period and Columns (6)-(9) show ITT results for the 1975-92 period Tenure duration in public housing measured in years and calculated in 1980 Sales of public housing calculated in 1980-81 Crime defined as total yearly counts of property and violent crime offences per population at the Police Force Area (PFA) level Property crime defined as total yearly counts of burglary and theft or handling of stolen goods offences per population at the PFA level Violent crime defined as total yearly counts of robbery violent and sexual offences per population at the PFA level Regressions weighted by population at the PFA level Standard errors were clustered at the PFA level and p-values from Wild Cluster Bootstrap are reported in parentheses Effect calculated as estimated coefficient divided by pre-1980 mean of dependent variable in ITT control group (Public Housing Sales by 1981 lt p50) indicates significance at 1 indicates significance at 5 indicates significance at 10
Table 5 Estimates of Impact of Right-To-Buy Scheme on Property Crime
ITT 1975-85 IV 1975-85 ITT 1975-92 (1) (2) (3) (4) (5) (6) (7) (8) (9)
(Log RTB Sales in 1980-81) x Post -0013 (p = 0012)
-0018 (p = 0021)
(Log Tenure gt= p50) x Post -0004 (p = 0089)
-0005 (p = 0102)
Log Tenure x Post -0008 (p = 0052)
-0012 (p = 0085)
-0012 (p = 0038)
-0016 (p = 0052)
Log Tenure x 1988-92 -0015 (p = 0095)
Log Tenure x 1980-87 -0017 (p = 0099)
Log Tenure x 1979 -0008 (p = 0168)
-0008 (p = 0173)
-0008 (p = 0177)
-0008 (p = 0177)
Log Tenure x 1978 -0006 (p = 0518)
-0006 (p = 0546)
-0006 (p = 0535)
-0006 (p = 0535)
Log Tenure x 1977 -0004 (p = 0609)
-0004 (p = 0619)
-0004 (p = 0624)
-0004 (p = 0623)
Effect -9091 -0182 -0273 -0295 -0409 -11364 -0273 -0364 Effect x 1988-92 -0341 Effect x 1980-87 -0386
Log Unemployment Rate in 1980 x Post No Yes Yes Yes Yes No Yes Yes Yes Log 25th Percentile Earnings in 1980 x Post No Yes Yes Yes Yes No Yes Yes Yes Log 50th Percentile Earnings in 1980 x Post No Yes Yes Yes Yes No Yes Yes Yes Fraction 15-24 Years Old in 1980 x Post No Yes Yes Yes Yes No Yes Yes Yes Fraction of Public Housing in 1980 x Post No Yes Yes Yes Yes No Yes Yes Yes PFA Fixed Effects Yes Yes Yes Yes Yes Yes Yes Yes Yes Year Fixed Effects Yes Yes Yes Yes Yes Yes Yes Yes Yes
First Stage Coefficient on ITT 0647 (p = 0015)
0647 (p = 0019)
Sample Size 462 462 462 462 462 756 756 756 756 Number of PFAs 42 42 42 42 42 42 42 42 42
Notes Post-period defined as starting from 1980 the date of adoption of the Right to Buy (RTB) Policy in England and Wales Columns (1)-(5) show ITT and IV results for the 1975-85 period and Columns (6)-(9) show ITT results for the 1975-92 period Tenure duration in public housing measured in years and calculated in 1980 Sales of public housing calculated in 1980-81 Property crime defined as total yearly counts of burglary and theft or handling of stolen goods offences per population at the Police Force Area (PFA) level Regressions weighted by population at the PFA level Standard errors were clustered at the PFA level and p-values from Wild Cluster Bootstrap are reported in parentheses Effect calculated as estimated coefficient divided by pre-1980 mean of dependent variable in ITT control group (Public Housing Sales by 1981 lt p50) indicates significance at 1 indicates significance at 5 indicates significance at 10
53
Table 6 Estimates of Impact of Right-To-Buy Scheme on Violent Crime
ITT 1975-85 IV 1975-85 ITT 1975-92 (1) (2) (3) (4) (5) (6) (7) (8) (9)
(Log RTB Sales in 1980-81) x Post -0001 (p = 0166)
-0001 (p = 0104)
(Log Tenure gt= p50) x Post -0000 (p = 0186)
-0001 (p = 0124)
Log Tenure x Post -0000 (p = 0228)
-0001 (p = 0202)
-0001 (p = 0204)
-0001 (p = 0212)
Log Tenure x 1988-92 -0003 (p = 0383)
Log Tenure x 1980-87 -0000 (p = 0697)
Log Tenure x 1979 -0001 (p = 0480)
-0001 (p = 0493)
-0001 (p = 0480)
-0001 (p = 0481)
Log Tenure x 1978 -0001 (p = 0472)
-0001 (p = 0480)
-0001 (p = 0474)
-0001 (p = 0475)
Log Tenure x 1977 -0000 (p = 0653)
-0000 (p = 0611)
-0000 (p = 0654)
-0000 (p = 0655)
Effect -0 -0 -0333 -0333 -0333 -33333 -0333 -0333 Effect x 1988-92 -1 Effect x 1980-87 -0
Log Unemployment Rate in 1980 x Post No Yes Yes Yes Yes No Yes Yes Yes Log 25th Percentile Earnings in 1980 x Post No Yes Yes Yes Yes No Yes Yes Yes Log 50th Percentile Earnings in 1980 x Post No Yes Yes Yes Yes No Yes Yes Yes Fraction 15-24 Years Old in 1980 x Post No Yes Yes Yes Yes No Yes Yes Yes Fraction of Public Housing in 1980 x Post No Yes Yes Yes Yes No Yes Yes Yes PFA Fixed Effects Yes Yes Yes Yes Yes Yes Yes Yes Yes Year Fixed Effects Yes Yes Yes Yes Yes Yes Yes Yes Yes
First Stage Coefficient on ITT 0647 (p = 0015)
0647 (p = 0019)
Sample Size 462 462 462 462 462 756 756 756 756 Number of PFAs 42 42 42 42 42 42 42 42 42
Notes Post-period defined as starting from 1980 the date of adoption of the Right to Buy (RTB) Policy in England and Wales Columns (1)-(5) show ITT and IV results for the 1975-85 period and Columns (6)-(9) show ITT results for the 1975-92 period Tenure duration in public housing measured in years and calculated in 1980 Sales of public housing calculated in 1980-81 Violent crime defined as total yearly counts of robbery violent and sexual offences per population at the Police Force Area (PFA) level Regressions weighted by population at the PFA level Standard errors were clustered at the PFA level and p-values from Wild Cluster Bootstrap are reported in parentheses Effect calculated as estimated coefficient divided by pre-1980 mean of dependent variable in ITT control group (Public Housing Sales by 1981 lt p50) indicates significance at 1 indicates significance at 5 indicates significance at 10
54
Table 7 Estimates of Impact of Right-To-Buy (RTB) Public Housing Tenure Duration on Local Area Outcomes and (Log) Value of RTB Public Housing Sales on Crime 1975 ndash 1992
Log
Unemployment Rate
Log 25th Percentile Real
Hourly Earnings
Log 50th Percentile Real
Hourly Earnings
Fraction 15-24 Years Old in Population
Total Crime Log Count of Police Officers
(1) (2) (3) (4) (5) (6) Log Tenure x Post -0168
(p = 0313) -0079
(p = 0269) -0076
(p = 0346) 0002
(p = 0746) -0024
(p = 0594) Log Value Sales x Post 0002
(p = 0280)
Effect 0014 0043 Log Unemployment Rate in 1980 x Post No Yes Yes Yes Yes Yes Log 25th Percentile Earnings in 1980 x Post Yes No No Yes Yes Yes Log 50th Percentile Earnings in 1980 x Post Yes No No Yes Yes Yes Fraction 15-24 Years Old in 1980 x Post Yes Yes Yes No Yes Yes Fraction of Public Housing in 1980 x Post Yes Yes Yes Yes Yes Yes PFA Fixed Effects Yes Yes Yes Yes Yes Yes Year Fixed Effects Yes Yes Yes Yes Yes Yes Sample Size 756 756 756 756 756 756 Number of PFAs 42 42 42 42 42 42
Notes Post-period defined as starting from 1980 the date of adoption of the Right to Buy (RTB) Policy in England and Wales Tenure duration in public housing measured in years and calculated in 1980 Value of sales of public housing calculated by 1981 Local area outcomes measured at the PFA level Crime defined as total yearly counts of property and violent crime offences per population at the Police Force Area (PFA) level Property crime defined as total yearly counts of burglary and theft or handling of stolen goods offences per population at the PFA level Violent crime defined as total yearly counts of robbery violent and sexual offences per population at the PFA level Regressions weighted by population at the PFA level Standard errors were clustered at the PFA level and p-values from Wild Cluster Bootstrap are reported in parentheses Effect calculated as estimated coefficient divided by pre-1980 mean of dependent variable in ITT control group (Public Housing Tenure duration in 1980 lt p50) except in columns (1) (2) and (5) where the dependent variable is measured in log values
55
Table 8 Correlation between Right-To-Buy Public Housing Sales and Home Improvement Insurance and Social Behaviour 1988
Installed Double Locks on Outside
Doors
Installed Locks on Windows
Theft Insurance of Home Contents
Installed Burglar Alarm
Neighbourhood Watch Scheme
(1) (2) (3) (4) (5) Panel A RTB Scheme 0217
(p = 0000) 0193
(p = 0000) 0251
(p = 0000) 0043
(p = 0037) 0005
(p = 0828) Effect 606 1304 384 2263 81 Panel B RTB Scheme 0232
(p = 0000) 0168
(p = 0003) 0239
(p = 0000) 0048
(p = 0046) 0018
(p = 0505) Effect 648 1135 365 2526 29 Gender Yes Yes Yes Yes Yes Ethnicity Yes Yes Yes Yes Yes Log Age (quadratic) Yes Yes Yes Yes Yes Past Burglary Victimization Yes Yes Yes Yes Yes Household Type Yes Yes Yes Yes Yes Household Rooms Yes Yes Yes Yes Yes Household Income Yes Yes Yes Yes Yes County Fixed Effects Yes Yes Yes Yes Yes Mean Dep Var Control Group 0358 0148 0654 0019 0062 Sample Size 520 520 520 520 520 Number of Counties 52 52 52 52 52
Notes Treatment group defined as homeowners who rented from the council the property in which they currently reside prior to buying it Control group defined as council tenants who currently intend to buy the public property in which they reside within two years Standard errors were clustered at the county level and p-values from Wild Cluster Bootstrap are reported in parentheses Effect calculated as estimated coefficient divided by mean of dependent variable in the control group (council tenants who intend to buy the public property in which they reside within two years) reported here Panel A reports unconditional OLS estimates and Panel B reports conditional OLS estimates where controls for gender ethnicity age burglary victimization household type household rooms household income employment status and county fixed effects were included in the estimating equation indicates significance at 1 indicates significance at 5 indicates significance at 10
56
Table 9 ITT Estimates of Impact of Right-To-Buy Scheme on Crime Separately by Crime Category
Property Crime Violent Crime Burglary Theft and
Handling of Stolen Goods
Violence Against the Person
Sexual Offences
Robbery
(1) (2) (3) (4) (5)
Panel A Crime Category 1975 ndash 1985
Log Tenure x Post -0004 (p = 0083)
-0004 (p = 0070)
-00002 (p = 0531)
0000 (p = 0894)
-00003 (p = 0082)
Effect -0309 -0132 -0104 0021 -87392 Log Unemployment Rate in 1980 x Post Yes Yes Yes Yes Yes Log 25th Percentile Earnings in 1980 x Post Yes Yes Yes Yes Yes Log 50th Percentile Earnings in 1980 x Post Yes Yes Yes Yes Yes Fraction 15-24 Years Old in 1980 x Post Yes Yes Yes Yes Yes Fraction of Public Housing in 1980 x Post Yes Yes Yes Yes Yes PFA Fixed Effects Yes Yes Yes Yes Yes Year Fixed Effects Yes Yes Yes Yes Yes
Sample Size 462 462 462 462 462 Number of PFAs 42 42 42 42 42
Panel B Crime Category 1975 ndash 1992
Log Tenure x Post -0006 (p = 0016)
-0006 (p = 0130)
-00004 (p = 0447)
0000 (p = 0987)
-00004 (p = 0090)
Effect -0489 -0191 -0191 0002 -127
Log Unemployment Rate in 1980 x Post Yes Yes Yes Yes Yes Log 25th Percentile Earnings in 1980 x Post Yes Yes Yes Yes Yes Log 50th Percentile Earnings in 1980 x Post Yes Yes Yes Yes Yes Fraction 15-24 Years Old in 1980 x Post Yes Yes Yes Yes Yes Fraction of Public Housing in 1980 x Post Yes Yes Yes Yes Yes PFA Fixed Effects Yes Yes Yes Yes Yes Year Fixed Effects Yes Yes Yes Yes Yes
Sample Size 756 756 756 756 756 Number of PFAs 42 42 42 42 42
Notes Post-period defined as starting from 1980 the date of adoption of the Right to Buy (RTB) Policy in England and Wales Panel A shows results for the 1975-85 period and Panel B shows results for the 1975-92 period Tenure duration in public housing measured in years and calculated in 1980 Yearly counts of crime were measured at the Police Force Area (PFA) level for all crime categories Regressions weighted by population at the PFA level Standard errors were clustered at the PFA level and p-values from Wild Cluster Bootstrap are reported in parentheses Effect calculated as estimated coefficient divided by pre-1980 mean of dependent variable in ITT control group (Public Housing Tenure duration in 1980 lt p50) indicates significance at 1 indicates significance at 5 indicates significance at 10
57
Table 10 Summary Data for Long-Difference Analysis
Percentiles Mean Standard Deviation Min Max p25 p50 p75 p90 Housing Variables 1Public House Sales 1980-1992 3718 3429 151 33386 1843 2643 4223 7857 2Public House Stock 1980 15032 16757 2180 148394 6358 8912 18018 32832 12 29 13 0 116 22 27 35 42 Crime Variables All Crime Rate -0020 0011 -0075 0002 -0026 -0019 -0013 -0008 Property Crime Rate -0015 0009 -0064 0001 -0019 -0013 -0009 -0006 Violent Crime Rate -0005 0004 -0018 0001 -0007 -0005 -0003 -0001 Covariates Log Unemployment Rate 0466 0462 -0816 1901 0183 0476 0768 1004 Log 25th Percentile Real Hourly Earnings -0084 0058 -0278 0139 -0117 -0080 -0047 -0018 Log 50th Percentile Real Hourly Earnings -0080 0064 -0288 0096 -0114 -0083 -0036 -0002 Fraction of 15-24 Year Olds in Population -0000 0009 -0035 0034 -0004 0001 0004 0009 Observations 293
Notes Crime variables are measured as crime rates at the Local Authority (LA) level Crime defined as total yearly counts of property and violent crime offences per population at the LA level Property crime defined as total yearly counts of burglary and theft or handling of stolen goods offences per population at the LA level Violent crime defined as total yearly counts of robbery violent and sexual offences per population at the LA level Local area variables are the log of the unemployment rate the 25th percentile log real hourly wage and the share of 15-24 year olds in the population each measured at the LA geography
58
Table 11 IV Estimates of Impact of Change in Public Housing Stock 1980-1992 on Change in Crime Rate 2003-2017
Δ All Crime Rate
Δ Property Crime Rate
Δ Violent Crime Rate
(1) (2) (3) (4) (5) (6) (7) (8) (9) RTB Sales 1980-1992 1980 Residential Stock
-0339 (0053)
-0310 (0050)
-0245 (0042)
-0236 (0038)
-0218 (0037)
-0179 (0032)
-0103 (0017)
-0092 (0016)
-0073 (0014)
Changes in Covariates Log Unemployment Rate 0003
(0002) 0002
(0002) 0002
(0002) 0001
(0002) 0001
(0001) 0001
(0001) Log 25th Percentile Earnings -0048
(0023) -0055 (0020)
-0034 (0017)
-0039 (0016)
-0014 (0008)
-0013 (0006)
Log 50th Percentile Earnings 0009 (0022)
0011 (0018)
0009 (0016)
0001 (0001)
-0001 (0007)
-0001 (0001)
Fraction 15-24 Year Olds 0428 (0104)
0250 (0095)
0278 (0077)
0169 (0074)
0149 (0034)
0119 (0029)
Crime Rate in 1980 All Crime Rate in 1980 -0319
(0053)
Property Crime Rate in 1980 -0203 (0043)
Violent Crime Rate in 1980 -1718 (0287)
Observations 293 293 293 293 293 293 293 293 293
Notes Table reports Instrumental Variable estimates Crime defined as total yearly counts of property and violent crime offences per population at the LA level Property crime defined as total yearly counts of burglary and theft or handling of stolen goods offences per population at the LA level Violent crime defined as total yearly counts of robbery violent and sexual offences per population at the LA level Dependent variable is the change in the Local Authority (LA) crime rate between 2003 and 2017 for each crime type denoted by column headings Independent variables are i) total Right-to-Buy sales within the LA for the period 1980 to 1992 (divided by 1980 residential stock) ii) changes in the log unemployment rate in the 25th percentile log real hourly wage and in the share of 15-24 year olds in the population each measured at the LA level iii) crime rates in 1980 for each crime type denoted by column headings measured at the Police Force Area (PFA) level The instrument for i) is the stock of public housing in the local authority in 1980 (divided by 1980 residential stock) indicates significance at 1 indicates significance at 5 indicates significance at 10
59
Table 12 IV Estimates of Impact of Change in Public Housing Stock 1980-1992 on Changes in (Log) Average House Price and Conservative Vote Share
Δ (Log) Average
House Price
Δ Con Vote Share
in LA
(1) (2) RTB Sales 1980-1992 1980 Residential Stock -1327
(0475) 1757
(0352) Changes in Covariates Log Unemployment Rate -0070
(0021) -0014 (0017)
Log 25th Percentile Earnings -0740 (0213)
0379 (0177)
Log 50th Percentile Earnings -0069 (0198)
-0111 (0158)
Fraction 15-24 Year Olds -8575 (1005)
-1188 (0891)
Observations 290 235
Notes Table reports Instrumental Variable estimates In Column (1) the dependent variable is the change in the log of the average house price in the Local Authority (LA) between 2003 and 2017 In Column (2) the dependent variable is the change in the Conservative vote share in Local Authority elections between 19956 and 201415 Independent variables are i) total Right-to-Buy sales within the LA for the period 1980 to 1992 (divided by 1980 residential stock) ii) changes in the log unemployment rate in the 25th percentile log real hourly wage and in the share of 15-24 year olds in the population each measured at the LA level The instrument for i) is the stock of public housing in the local authority in 1980 (divided by 1980 residential stock) indicates significance at 1 indicates significance at 5 indicates significance at 10
APPENDIX ndash ONLINE ONLY
A Data Sources
a Public Housing Stock and Residential Stock in 1980
Public housing stock records for 1980 are sourced from the Chartered Institute of Public Finance and Accountancy (CIPFA) Rate Collection Statistics 1980-81 Actuals SIS ref 4282 This publication is based on data returned by authorities from DoE forms VO7140 The data covers 33 London Boroughs 34 Metropolitan District Councils 286 English Non-Metropolitan District Councils and 37 Welsh District Councils which we refer to in the main paper as Local Authorities The data cover 973 of total rateable hereditaments The number of residential properties in the Local Authority is stated at Column 2 lsquoDomesticrsquo with the number of public house properties in the Local Authority stated at Column 22 lsquoCouncil Dwellingsrsquo These data were extracted from hard copy held by UK libraries
b Right-to-Buy Public Housing Sales
Data on the number of public housing properties sold each year through the Right-to-Buy scheme by each Local Authority for the period 1980 - 2001 are sourced from the CIPFA Housing Revenue Account (HRA) The HRA records expenditure and income on running a councilrsquos own housing stock and closely related services or facilities which are provided primarily for the benefit of the councilrsquos own tenants Under the Housing Act 1985 Local Authorities are obliged to report revenues from public house sales via their HRA These data are accessed under license from CIPFA For further details see httpswwwcipfaorgpolicy-and-guidancepublications (link last accessed on 28 March 2020) We use these data in our main analysis For Figures 1 and 2 we also source data on sales under the Right-to-Buy scheme after 2001 These data are provided by the Department for Communities and Local Government Table 685 For further details see httpswwwgovukgovernmentstatistical-data-setslive-tables-on-social-housing-sales (link last accessed on 28 March 2020)
c Crime Area-level crime data compiled by the Home Office and published annually in Criminal Statistics for the period between 1975 and 1992 were sourced from the archives of the LSE Library where both hard and soft copies of the data can be accessed Yearly crime records of all Local Police Forces in England and Wales were available at the Police Force Area (PFA) level and with the sole exception of the City of London they were used in this analysis Area-level crime data compiled by the Office for National Statistics (ONS) and published annually on the ONS website for the period between 2003 and 2017 were available at the Local Authority (LA) level Due to the redrawing of LA boundaries over time it was not possible to include all LAs in the analysis Our analysis for the period between 2003 and 2017 therefore includes 293 LAs These data can be freely accessed here httpswwwonsgovukpeoplepopulationandcommunitycrimeandjusticedatasetsrecordedcrimedataatcommunitysafetypartnershiplocalauthoritylevelcurrent (link last accessed on 28 March 2020)
d Local Area Circumstances and Housing Tenure Local area circumstances were measured using the New Earnings Survey (NES) provided by the Department for Employment for the period 1975-1992 and using the version of the Annual Population Survey (APS) that is publicly available on the Nomis website for the period 2003-2017 Access to data on local unemployment rates during the period 1975-1992 was obtained from the Department of Employment Permission to access the NES data must
61
be obtained via the UK Data Service and are downloadable at the following link httpsbetaukdataserviceacukdatacataloguestudiesSearch=new20earnings20surveyampRows=10ampSort=1ampDateFrom=440ampDateTo=2020ampPage=1 (link last accessed on 28 March 2020) The Nomis website can be freely accessed here httpswwwnomiswebcouk (link last accessed on 28 March 2020) Local area population data compiled by the Home Office and published annually in Criminal Statistics for the period between 1975 and 1992 were sourced from the archives of the LSE Library where both hard and soft copies of the data can be accessed Area-level population data compiled by the Office for National Statistics (ONS) and published annually on the ONS website for the period between 2003 and 2017 were available at the Local Authority (LA) level These data can be freely accessed here httpswwwonsgovukpeoplepopulationandcommunitypopulationandmigrationpopulationestimatesdatasetspopulationestimatesforukenglandandwalesscotlandandnorthernireland (link last accessed on 28 March 2020) Data on local housing tenure duration were obtained from the 1980 General Household Survey which can be accessed via the UK Data Service and are downloadable at this link (last accessed on 09 July 2020) httpsbetaukdataserviceacukdatacatalogueseriesseriesid=200019
e Home Improvement Insurance and Social Behaviour (Table 8 Appendix Tables A1 and A2) Individual level data on homeownership expenditure individual and property characteristics income employment status and locality of residence used in Table 8 were obtained from the British Crime Survey (BCS) 1988 Access to the BCS 1988 data must be obtained via the UK Data Service and are downloadable at the following link httpsbetaukdataserviceacukdatacataloguestudiesstudyid=2706amptype=Data20catalogue (link last accessed on 28 March 2020)
f Election Results Data on the Conservative vote share in Local Elections for the period 19956 to 201415 are sourced from the British Local Elections Database maintained by the University of Plymouth UK The Conservative vote share is calculated as the proportion of all votes cast in the election for Conservative candidates Ware L Rallings C Thrasher M (2006) British Local Election Database 1889-2003 [data collection] UK Data Service SN 5319 httpdoiorg105255UKDA-SN-5319-1 (link last accessed on 28 March 2020)
g House Prices
House price data is obtained from the UK Land Registry House Price Index (HPI) the UKrsquos official house price index The HPI uses house sales data from HM Land Registry Registers of Scotland and Land and Property Services Northern Ireland and is calculated and maintained by the Office for National Statistics Local Authority house price index values were extracted from the HPI Full File For further details see httpslandregistrydatagovukappdocukhpi (link last accessed on 28 March 2020)
Figure A1 Correlation between Public House building in 1945-64 and Bombs per Dwelling dropped during World War II by Borough in London
Coeff (se) = 2915 (1337)
0
005
01
015
02
Frac
tion
Pub
lic H
ousi
ng in
194
5-64
0 0005 001 0015 002 0025Bombs per Dwelling
Borough Linear Fit
LondonPublic Housing vs Bombs per Dwelling during World War II
Notes The figure shows for each Borough in London the public houses built from 1945-64 as a fraction of the residential stock plotted against the average number of bombs per dwelling A linear function fitting the correlation between the Borough-specific average number of bombs per dwelling and the public housing built from 1945-64 as a fraction of the residential stock is also shown in the figure
63
Figure A2 Residential Housing Stock in 1980 by Local Authority (LA)
a) Public Housing Stock ( Residential Stock)
b) Public Housing Stock (N) c) Residential Stock (N)
Notes Data from 344 Local Authority (LA) Districts in 1980 Panel a shows public housing stock in 1980 within the LA (shown in Panel b) divided by the total residential housing stock in 1980 within the LA (shown in Panel c)
64
Figure A3 Right-to-Buy Public Housing Sales 1980-1992 by Local Authority (LA)
a) Right-to-Buy Public Housing Sales ( 1980 Residential Stock)
b) Right-to-Buy Public Housing Sales (N) c) Right-to-Buy Public Housing Sales ( 1980 Public
Housing Stock)
Notes Data from 344 Local Authority (LA) Districts Panel A shows total RTB public housing sales in the period 1980-1992 as a percentage of the 1980 residential stock in the LA Panel B shows a count of total RTB public housing sales over the period 1980-1992 in the LA Panel C shows total RTB public housing sales in the period 1980-1992 as a percentage of the 1980 public housing stock in the LA
65
Figure A4 Correlation between Crime in 1980 and Right-To-Buy Public Housing Sales by 1981
Coeff (se) = -0021 (0007)
002
004
006
008
Crim
e in
198
0
0 1-05 05Log Public Housing Sales in 1980-81
Police Force Area Linear Fit
Crime in 1980 vs Public Housing Sales in 1980-81
Notes Figure shows for each Police Force Area (PFA) the crime rate in 1980 plotted against the log sales of public housing under the Right-To-Buy (RTB) scheme by 1981 Crime is defined as total yearly counts of property and violent crime offences per population at the PFA level Property crime defined as total yearly counts of burglary and theft or handling of stolen goods offences per population at the PFA level Violent crime defined as total yearly counts of robbery violent and sexual offences per population at the PFA level A linear function fitting the distribution of PFA-specific crime and RTB sales weighted by PFA-specific population size in 1980 is also shown For each PFA in the analysis the horizontal axis shows the log count of sales of public housing under the RTB scheme by 1981 as a percent of the total residential stock in 1980 whereas the vertical axis shows the crime rate in 1980
66
Figure A5 Correlation between Right-To-Buy Public Housing Sales in 1980-92 and Conservative Share in 1977 Local Elections
Coeff (se) = -0000 (0007)
15
2
25
3
Log
Publ
ic H
ousi
ng S
ales
in 1
980-
92
20 30 40 50Conservative Share in 1977 Local Elections
Police Force Area Linear Fit
Public Housing Sales in 1980-92 vs Conservative Share
Notes Figure shows for each Police Force Area (PFA) the sales of public housing under the Right-To-Buy (RTB) scheme by 1992 plotted against the share of conservative votes in the local elections of 1977 A linear function fitting the distribution of PFA-specific sales and conservative votes weighted by PFA-specific population size in 1980 is also shown For each PFA in the analysis the horizontal axis shows the share of conservative votes in the local elections of 1977 whereas the vertical axis shows the log count of sales of public housing under the RTB scheme by 1992 as a percent of the total residential stock in 1980
67
Figure A6 Right-to-Buy Public Housing Sales in 1980-92 and Public Housing Stock in 1980
Coeff (se) = 0180 (0018)
0
01
02
03
RTB
Pub
lic H
ousi
ng S
ales
in 1
980-
92
02 04 06 0801 03 05 07Public Housing in 1980
Local Authority Linear Fit
Public Housing Sales in 1980-92 vs Public Housing in 1980
Notes Figure shows scatter plot of public housing in 1980 (as a proportion of the Local Authority resident stock) on the x-axis and subsequent Right-to-Buy public housing sales between 1980 and 1992 (as a proportion of the Local Authority residential stock) on the y-axis Binned scatterplot of 344 observations
68
Table A1 Correlation between Right-To-Buy Public Housing Sales and Characteristics of Individuals and Households 1988
(Log) Age
Male White British
Income Group
No Rooms Housing Type
Past Burglary Victimization
(1) (2) (3) (4) (5) (6) (7) RTB Scheme 0055
(p = 0230) 0015
(p = 0713) 0018
(p = 0366) -0031
(p = 0489) 0017
(p = 0802) -0078
(p = 0105) 0005
(p = 0886) County Fixed Effects Yes Yes Yes Yes Yes Yes Yes Effect 55 3 19 -34 04 -69 38 Mean Dep Var Control Group 3614 05 0938 0920 4715 1123 0130 Sample Size 520 520 520 520 520 520 520 Number of Counties 52 52 52 52 52 52 52
Notes Treatment group defined as homeowners who rented from the council the property in which they currently reside prior to buying it Control group defined as council tenants who currently intend to buy the public property in which they reside within two years Standard errors were clustered at the county level and p-values from Wild Cluster Bootstrap are reported in parentheses Effect calculated as estimated coefficient divided by mean of dependent variable in the control group (council tenants who intend to buy the public property in which they reside within two years) reported here indicates significance at 1 indicates significance at 5 indicates significance at 10
69
Table A2 Correlation between Right-To-Buy Public Housing Sales and Crime Victimisation 1988
Crime Victimisation (1) (2) (3) (4) (5) (6) Effect Effect Effect RTB Scheme -0202
(p = 0002) -249 -0171
(p = 0059) -211 -0193
(p = 0005) -238
RTB Share -0013 (p = 0430)
-16
County Fixed Effects No Yes No Mean Dep Var Control Group 0810 0810 0810 Sample Size 1058 1058 1058 Number of Counties 53 53 53
Notes Treatment group defined as homeowners who rented from the council the property in which they currently reside prior to buying it Control group defined as council tenants who currently intend to buy the public property in which they reside within two years For each respondent RTB Share calculated as share of other treatment group respondents at the county level (leaving out the respondent herselfhimself) Standard errors were clustered at the county level and p-values from Wild Cluster Bootstrap are reported in parentheses Effect calculated as estimated coefficient divided by mean of dependent variable in the control group (council tenants who intend to buy the public property in which they reside within two years) reported here indicates significance at 1 indicates significance at 5 indicates significance at 10
Recent Issues All CFS Working Papers are available at wwwifk-cfsde
No Authors Title
650 Atsushi Inoue and Lutz Kilian Joint Bayesian Inference about Impulse Responses in VAR Models
649 Lutz Kilian Understanding the Estimation of Oil Demand and Oil Supply Elasticities
648 Lutz Kilian Nikos Nomikos and Xiaoqing Zhou
A Quantitative Model of the Oil Tanker Market in the Arabian Gulf
647 Lutz Kilian and Xiaoqing Zhou Does Drawing Down the US Strategic Petroleum Reserve Help Stabilize Oil Prices
646 Lutz Kilian and Xiaoqing Zhou Oil Prices Exchange Rates and Interest Rates
645 Lutz Kilian and Xiaoqing Zhou Oil Prices Gasoline Prices and Inflation Expectations A New Model and New Facts
644 Olivia S Mitchell Building Better Retirement Systems in the Wake of the Global Pandemic
643 Volker Bruumlhl Mehr Nachhaltigkeit im deutschen Leitindex DAX - Reformvorschlaumlge im Lichte des Wirecard-Skandals
642 Refet S Guumlrkaynak A Hakan Kara Burccedilin Kısacıkoğlu and Sang Seok Lee
Monetary Policy Surprises and Exchange Rate Behavior
641 Sergey Kovbasyuk and Marco Pagano Advertising Arbitrage
640 Sylwia Hubar Christos Koulovatianos and Jian Li
The Role of Labor-Income Risk in Household Risk-Taking
- September 2020
- Abstract
-

1
1 Introduction
In many countries crime is spatially concentrated in areas characterised by low incomes and
low rates of homeownership Localities with high rates of tenancy in public housing commonly
exhibit high crime rates and the UK is no exception This association between crime rates and
housing tenure arises not only because of differences in affluence between predominantly
public and private housing areas but also because residents in public housing have lower
incentives to maintain the security and upkeep of their property and to invest in neighbourhood
monitoring
Boosting homeownership is often viewed as a means of delivering benefits to
communities one of which is reduced crime Underlying this is the idea that when public
housing tenants take on ownership of their properties their incentives adjust as they experience
the positive private returns of crime-reducing investments (such as improving the security of
the home) which capitalize into house prices and therefore household wealth Generating an
understanding of the effects of homeownership on crime is therefore a first order research
question in the economics of crime
This paper provides a novel study of the impact of homeownership on crime by
examining a large-scale nationwide program of subsidised public housing sales to incumbent
tenants in the United Kingdom (UK) known as the ldquoRight to Buyrdquo policy (hereafter RTB) This
was established as one of the first legislative acts of the newly elected UK Conservative
government led by Margaret Thatcher in 1979 Through the RTB policy incumbent tenants in
publicly-owned ldquocouncil housingrdquo (housing built and owned by local public authorities and
rented to private tenants henceforth called ldquopublic housingrdquo) in the UK could purchase their
rented accommodation at heavily-subsidised prices1 The intention of the policy was to increase
the long-run homeownership rate with the underlying ethic of ldquoan Englishmanrsquos home is his
castlerdquo It was heralded by the Conservative government as a means of improving local
amenities and generating upward social mobility by giving citizens control over their housing
and access to housing wealth2
1 The terms ldquocouncil housingrdquo and ldquosocial housingrdquo indicate public housing in the UK Public housing in the United Kingdom is managed in local jurisdictions by councils ndash hence the term for public housing is ldquocouncil housingrdquo in the UK There are also social housing tenancies provided by co-operatives and local housing associations rather than private homeowners A limited form of tenancy purchase of such properties was introduced in the 2000s under the policy ldquoRight to Acquirerdquo 2 In a speech delivered to the National Housebuilding Council in December 1984 Margaret Thatcher stated ldquoSpreading the ownership of property more widely is central to this Governments philosophy It is central
2
The RTB policy had a significant impact on housing tenure as it dramatically changed
the ownership composition of housing in the country It was largely responsible for an increase
in the UK homeownership rate from around 60 in 1979 to over 70 in the early 2000s
Specifically whereas around 32 of dwellings in the UK were publicly-owned in 1979
totalling some 62 million properties by the early 2000s around 28 million of these properties
had been sold to their tenants (Jones and Murie 2006) Although an innovative and large scale
policy RTB has until recently been little analysed (but see Disney and Luo 2017) Analysis
of RTB is useful to derive policy prescriptions that extend beyond the UK as the RTB scheme
shares many of the same characteristics as reforms implemented in Israel (eg Hausman
Ramot-Nyska and Zussman 2020) Sweden (Sodini Van Nieuwerburgh Vestman and Von
Lilienfeld-Toal 2017) and multiple post-Communist countries
This paper studies the causal impact of the RTB policy on local crime rates The
empirical analysis uses large-scale data from all regions in England and Wales from the early
1970s to the late 2010s in order to utilise the RTB policy as a nationwide policy experiment3
The bulk of public house sales occurred in the 1980s and area-level sales of public housing
were matched to crime data over several decades to estimate both the short-run and long run
effects of homeownership on crime The analysis shows that the large movements in housing
tenures induced by the RTB led to lasting falls in crime rates for certain types of crime
An important contribution of this study is to document the mechanism behind the crime-
reducing effect of sales of public housing in local areas It shows that the reduction in crime
rates was driven primarily by behavioural changes within the local community rather than a
lsquoreshufflingrsquo of households between low and high crime areas which might have had a smaller
effect on overall crime This is in contrast to the focus of many recent studies of the crime-
reducing effect of gentrification (eg Autor Palmer and Pathak 2019) whereby changes in
the composition of households induced by inward and outward migration are thought to explain
local trends in crime rates Our study thereby reveals a novel means not documented to date
by which subsidised homeownership and housing policy may have contributed to the decline
because where property is widely owned freedom flourishes Since we took office in 1979 17 million more people have come to own their homes mdash 17 million more sole kings upon their own sole ground That increase is one of our proudest achievementshellip But a house is more than this It is a symbol of security and a stake in the future People who own houses do so not just for themselves but for their children They do so as members of a responsible society mdash proud of the heritage derived from the past glad to care for it and eager to give the next generation a bit of capital to give them a startrdquo (See httpswwwmargaretthatcherorgdocument105815) 3 The analysis covers only England and Wales owing to a need for comparable crime data which is not available for Scotland and Northern Ireland
3
in crime in the United States and other Western economies in the 1990s and early 2000s (see
Van Dijk and Vollaard 2012)
The RTB experiment provides a unique opportunity both to assess the effectiveness of
selling public housing to grant homeownership rights to families in public housing and to
measure the causal impact of sales of public housing on crime outcomes From the perspective
of a policy maker designing a policy that would alter homeownership rights for the general
population the parameters estimated here are directly of interest4 As such this study
complements the literature that has examined neighbourhood effects on crime by exploiting
the variation in residential locations induced by the Moving To Opportunity (MTO) experiment
in the United States and by other housing policy initiatives in Western economies5
The study of the causal impact of homeownership on crime exploits the unfolding of
the RTB policy and it is investigated separately in the short-run and in the long-run To estimate
the short-run impact of the RTB policy on crime difference-in-differences specifications
exploit the differential intention-to-treat (ITT) effect of the RTB policy across localities RTB
was introduced as a national policy but the intensity of treatment across localities varied with
the predetermined length of tenure duration of incumbent tenants in public housing We explain
how these differences in average tenures across localities arose in the later part of Section 2
Tenure duration determined access to the policy with a minimum tenure duration requirement
of three years together with larger purchase price discounts for those with longer tenures
Variations in the length of tenure duration in public housing at the start of the RTB policy are
shown to be unrelated with other local area socio-economic circumstances such as
unemployment wages fraction of juveniles and fraction of public housing they arise from
historical locality-specific factors and this variation is a key part of the research design
Estimates reveal sizeable negative short-run effects of increased incidence of RTB sales
of public housing on crime The crime reduction appears sizeable since the early 1980s and it
remains visible in the late 1980s and early 1990s until the end of the Thatcher era These short-
run estimates uncover an elasticity of crime with respect to RTB incidence of roughly -03 so
4 Homeownership is likely to have important implications also for intergenerational mobility a link that until recently has been little analysed (see Blanden and Machin 2017 and Bell Blundell and Machin 2018) 5 See eg Katz Kling and Liebman (2001) Ludwig Duncan and Hirschfield (2001) Kling Ludwig and Katz (2005) Ludwig and Kling (2007) Kling Liebman and Katz (2007) Sanbonmatsu Ludwig Katz Gennetian Duncan Kessler Adam McDade and Lindau (2011) Ludwig Duncan Gennetian Katz Kessler Kling and Sanbonmatsu (2013) Sciandra Sanbonmatsu Duncan Gennetian Katz Kessler Kling and Ludwig (2013) Damm and Dustmann (2014) Bernasco de Graaf Rouwendal and Steenbeek (2017) and Rotger and Galster (2019)
4
that a 10 percent increase in incidence of RTB public housing sales reduces crime by around 3
percent This conclusion is robust to a battery of additional tests including variations in the
specification of the econometric model We explain in later sections how we deal with the
obvious issue of feedback insofar as local crime rates may affect the willingness of public
tenants to exercise their right to purchase their public house through the RTB policy
The paper examines other potential mechanisms that could underlie the finding that
RTB purchases reduce crime rates These hypothesised channels include varying local area
circumstances local household compositional changes arising from the RTB policy and the
potential role of feet-dragging practices in certain localities arising from the political affiliation
of the local authorities responsible for administering the policy at the local level The findings
suggest that none of these factors explains the crime reduction generated by the RTB policy
The market value of the RTB sales at the onset of the scheme does not predict the evolution of
crime either suggesting that the crime reduction attributed to the RTB scheme is genuine and
it is not the spurious result of better amenities in areas with more RTB sales
By contrast the findings are strongly indicative of the likelihood that local communities
were induced to change their behaviour and attitudes towards criminal activity Indeed as
suggested in the quote by Margaret Thatcher cited previously this was one of the aims of the
RTB policy That is to give (generally) working class households access to an owned asset in
order to change their behaviour such as taking greater care of and improving the security of
their property and to change their economic position by giving these households a collateral
asset in financial markets Hence RTB was viewed as a mechanism for improving and
upgrading the economic position of households in neighbourhoods that had been previously
dominated by public housing
The analysis reveals that immediate reductions in crime resulted from the RTB policy
These are very unlikely to be attributable to in-migration as the rules of the RTB scheme
effectively barred resale of the RTB-purchased property for a fixed period after purchase We
show that crime rates were reduced immediately after the introduction of the policy and not
once the restraint on resale was no longer binding The analysis also shows that after
purchasing their properties from the local council incumbent ex-tenants started to gentrify their
properties by installing double locks on doors and windows by installing burglar alarms and
by purchasing insurance for their home contents Locality-specific estimates show that
incumbent tenants who bought under the RTB scheme experienced greater crime reduction in
counties in which the RTB scheme was associated with greater home improvement On the
5
other hand they did not become more likely to participate in a neighbourhood watch scheme
suggesting that the RTB policy did not generate detectable changes in social capital The
changing behaviour of incumbent ex-tenants resulting from RTB purchases did not result in
increased victimisation of neighbouring householders nor in a substitution of offenders away
from burglary towards other crimes Results indicate that the RTB policy led to significant
reductions in burglaries and robberies while theft and handling of stolen goods offences as
well as other violent crime offences remained unchanged
The paper next moves on to study the long-run persistence of the impact of the RTB
policy on crime To estimate the long-run crime effects of the RTB policy extended crime data
from 2003 to 2017 are used Instrumental variable regressions are used to quantify the effects
of public housing sales from 1980 to 1992 on the change in the crime rate from 2003 to 2017
Public housing sales are instrumented using variation in the initial public housing stock which
is a valid instrumental variable once the initial level of local crime and contemporaneous
community characteristics are controlled for In line with the short-run estimates long-run
estimates show that localities where the RTB policy triggered larger increases in
homeownership also experienced faster reductions in crime throughout the later period
Additional tests reveal that by 2017 these localities also experienced slower increases
in house prices In the standard definition gentrification arises as middle-class salary earners
displace lower income or unwaged households as a result of rising house prices In the case of
tenure changes induced by RTB sales the long time horizon of this research is required to
identify displacement since it takes time before RTB purchasers who are ex-tenants move on
sell or rent out their properties allowing other households to move into the neighbourhood
However the reduced growth in house prices documented here in areas of high RTB sales is
inconsistent with the standard gentrification story and suggests that the supply-side shock of
low-quality properties entering the housing market induced by the RTB policy outweighed any
displacement of original tenants There is also a political response as by 2017 Conservative
votes increased more rapidly in localities most affected by the RTB scheme This further points
towards RTB resulting in changing attitudes and behaviour of local communities
The rest of the paper is structured as follows Section 2 outlines the relevant literature
and describes the RTB policy In doing so it seeks to emphasise the scale of public housing in
the UK by 1980 (in comparison to say the United States) and to explain why the spatial
distribution of public housing does not simply map into low income areas at the start of the
RTB policy Data sources are described in Section 3 and the empirical analysis is presented in
6
Section 4 Finally section 5 provides a concluding discussion including an important word of
caution in assessing the overall merits of the RTB policy
2 Housing and Crime
i Previous literature
A large spatial crime literature shows that crime rates especially crimes against property are
higher in areas with high concentrations of public housing even when controlling for other
salient characteristics of the resident population This has been a major driver of policy in the
United States towards the replacement of inner city public housing projects by rent subsidies
and by shifting tenants to mixed-tenure low housing density urban neighbourhoods (see for
example Schill 1993 Olsen 2003 and Kling Ludwig and Katz 2005) A similar association
between crime and public housing has been observed in the UK (Murie 1997) More broadly
studies show that increased local homeownership rates are associated with a range of spillover
effects on the locality such as lower crime rates greater civic involvement and improved child
development (see for example DiPasquale and Glaeser 1999 and Haurin Dietz and
Weinberg 2003)
A well-known difficulty in the large literature on housing tenure type household
composition and crime is the range of feedback effects which suggest a number of channels
exist by which crime affects the composition of neighbourhoods and vice versa Cullen and
Levitt (1999) is one of a number of studies that suggest that higher rates of crime especially in
inner cities led to changes in neighbourhood composition by social class and economic status
Much of this literature on the lsquoflight to the suburbsrsquo took place against the backdrop of rising
crime in inner cities in the United States in the 1990s It has been more challenging to show
that falling crime in both earlier and later periods has been the primary driver of the so-called
gentrification of inner city areas (contrast the findings of McDonald 1986 with Ellen Horn
and Reed 2017)
In addition there is robust evidence that higher crime is associated with lower property
values (see Gibbons 2004 for an illustration using data for London) and this feedback effect
will induce spatial equilibria of neighbourhood composition when account is taken of not just
crime rates but other neighbourhood (dis)amenities transport costs and so on For example
Owens Mioduszewski and Bates (2019) show that civil gang injunctions in Southern
California a common type of place-based crime control policy in the area led to approximately
a 3 decline of residential propertiesrsquo values from 2002 to 2015 reflecting individual
7
willingness-to-pay for the civil liberties affected by the injunction6 Morales-Mosquera (2019)
finds that police station openings generate localized crime reductions and housing value
increases in three major cities in Colombia
A large literature has addressed the basic identification problem of assessing
neighbourhood effects on crime by exploiting the variation in residential locations generated
by the Moving To Opportunity (MTO) experiment in the United States Starting in 1994 the
MTO experiment assigned housing vouchers via random lottery to thousands of public housing
residents with children in five cities in the United States to relocate to less-distressed areas
Exposure to violence and crime victimization in distressed areas were in fact key reasons for
low-income families to participate in the MTO experiment Katz Kling and Liebman (2001)
show that the MTO experiment improved childrenrsquos behaviour adult mental health and
perceived safety in treatment group families in Boston while also reducing exposure to
violence and crime victimization Similar findings emerge in Baltimore in the study of Ludwig
Duncan and Hirschfield (2001) who find that the MTO experiment led to a large reduction in
juvenile arrests for violent crimes and to some increase in property-crime arrests
Kling Ludwig and Katz (2005) document important gender differences in the impact
of the MTO experiment on crime While both property and violent crime decreased among
young women young men experienced a decrease in violent crime but also an increase in
property crime a few years after relocating to the new neighbourhood7 Ludwig and Kling
(2007) show the importance of racial segregation among other neighbourhood characteristics
in predicting youth violence while Kling Liebman and Katz (2007) document the beneficial
impact of the MTO experiment on the education risky behaviour and physical health of young
women As the opposite effects are found for young men their findings further suggest that
young men and women respond differently to similar new neighbourhood circumstances
Using more recent data Sanbonmatsu et al (2011) conclude that the MTO initiative
enhanced safety in treatment group families while Ludwig et al (2013) find gender differences
in the impact of the MTO experiment on risky behaviour and health of juveniles to persist 10-
15 years after the start of the experiment while finding no evidence of persistent reductions in
youth violence rates However Sciandra et al (2013) show little evidence of crime reductions
6 Grogger (2002) and Ridgeway Grogger Moyer and MacDonald (2018) are two earlier studies of the effects of gang injunctions on crime 7 The comparative advantage of juveniles relocated from disadvantaged backgrounds in exploiting the available property-crime opportunities in their new neighbourhoods and the different ways in which male and female juveniles respond to similar new neighbourhood circumstances help the authors rationalize these findings
8
in the long run as neighbourhood conditionsrsquo effects of MTO dissipate reflecting that crime is
more affected by contemporaneous neighbourhood circumstances than by past neighbourhood
circumstances8 To understand why low-income families remain segregated into high-poverty
areas Bergman et al (2020) randomly allocate housing vouchers to 430 recipient families with
a child in the Seattle and King County areas concluding that barriers in the housing search
process are a critical source of residential segregation by income
Our findings on homeownership also relate to Engelhardt et al (2010) who analyse an
experiment in Oklahoma that subsidised saving for down payments for homeownership among
a group of low-income individuals using Individual Development Accounts (IDA) with
randomly assigned treatment status In their setting the treatment is the offer of matching
funding to the IDA since only a fraction of those who were treated chose to take up the offer
and to undertake a purchase and of course these may not be a random group among the treated
They find only weak evidence that homeowners who benefited from the policy spent more
money on lsquocommunity-facingrsquo activities such as external improvements to their house or
involvement in civic events in the 30 months after the take-up of homeownership status
Recent studies have sought to estimate the effects of homeownership and gentrification
on crime focusing on neighbourhood composition effects of policy changes Aliprantis and
Hartley (2015) and Sandler (2017) examine the effect on local crime rates in Chicago when
20000 units of concentrated high-rise public housing were demolished over the period 1999
to 2011 Both studies albeit using slightly different methodologies track relocated individuals
to other neighbourhoods and they conclude that these demolitions led to a net reduction in
crime rates ndash primarily violent (gang-related) crime but also theft robbery and use of guns
Chyn (2018) shows the lasting beneficial effects of housing demolitions in Chicago on the
schooling professional and criminal trajectories of displaced individuals Autor Palmer and
Pathak (2019) examine the impact of the deregulation of rents in Cambridge Massachusetts
on local crime rates They hypothesize that rent deregulation raised property values and caused
a differential mix of households to locate across local neighbourhoods thereby
disproportionately reducing the rate of property crime in neighbourhoods that had previously
been subject to rent control They find a significant reduction in crime overall which was then
8 The MTO experiment of course affected also other dimensions of familiesrsquo and childrenrsquos lives Most notably it generated moderate improvements in school quality (Fryer and Katz 2013) as well as educational and economic benefits for young children including for young boys (Chetty Hendren and Katz 2016) Substantial exposure effects of neighbourhoods are also presented in Damm and Dustmann (2014) Bernasco de Graaf Rouwendal and Steenbeek (2017) Altonji and Mansfield (2018) Chetty and Hendren (2018a) Chetty and Hendren (2018b) Rotger and Galster (2019) and Aliprantis and Richter (forthcoming)
9
capitalised into higher property values9 In a related study Diamond and McQuade (2019)
document the crime-reducing effect of the Low Income Housing Tax Credit
Most of the studies that have examined the effects of gentrification on crime exploit
policy changes such as the lifting of rent controls and removal of public housing that led low-
income neighbourhoods to increasingly become middle-income neighbourhoods through
outward migration of low-income households and inward migration of higher-income
households Studies that have examined the impact on crime rates of moving tenants out of
public housing into the private sector in the United States and experiments that gave households
incentives to purchase properties are typically based on highly localised data and results are
obtained from relatively short time periods after implementation of the policy10
The main contribution of this study by contrast is to estimate the effect on local crime
rates of increasing homeownership of indigenous communities and to examine the extent to
which this induced behavioural change in these communities This is a novel means which has
not been documented to date and which complements the existing literature by which
homeownership and housing policy may contribute to reduce crime The RTB policy
constitutes an ideal policy experiment to study this and it is therefore exploited here using
large-scale data over multiple decades
ii Public Housing in England and Wales
The stock of public housing in England and Wales grew rapidly throughout the
twentieth century over the period from the end of World War I in 1918 until the start of the
Right-to-Buy policy in 1980 By 1980 public housing in England and Wales was more
extensive more heterogeneous and more spatially dispersed than in the United States11 These
spatial outcomes arose from the decisions to rebuild outside as well as within inner city areas
in turn stemming from the partially random distribution of war destruction and from the
differential application of planning restrictions across the UK12
9 A recent paper on the UK (Alonso Andrews and Jorda Gil 2019) suggests that crime rates were reduced by expenditures from the Urban Renewal Fund although these expenditures did not directly involve changes in housing tenure their idea is closely related to the lsquoneighbourhood externalitiesrsquo argument 10 The reviewed literature examining the MTO experiment constitutes an exception 11 For examples of the heterogeneous nature of public housing across towns see Table 1 in Disney and Luo (2017) 12 For evidence on the continued important role of planning restrictions on private housing supply in England see Hilber and Vermeulen (2014)
10
Figure 1 illustrates housing tenure shares by tenure types in England and Wales
between 1918 and 2011 As illustrated in the Figure in 1918 more than three-quarters of
residential housing in England and Wales was privately rented with public housing accounting
for only 1 of the housing stock As a result of a public sector building program and the
development of the mortgage market both private homeownership and public renting
(primarily from local public authorities) rose steadily until 1980 by which time private renting
had shrunk to a little over one tenth of housing tenure While the increase in homeownership
prior to 1980 is mostly explained by the development of a formal mortgage market in the
deepening retail financial sector two main factors explain the increase in public housing prior
to 1980
First municipal government investment programs developed after the World War I
Much of the stock of privately-owned housing which was rented out was in very poor
conditions post-1918 Replacement of the housing stock was hindered by high re-building costs
coupled with borrowing constraints for many small landlords (Disney and Luo 2017) Under
the Housing and Town Planning Act 1919 much of the responsibility for replacement housing
and slum clearance was taken over by local authorities However replacement public housing
was not simply built in inner-city areas where slum clearance had taken place but also in so-
called suburban lsquogardenrsquo estates and even lsquogarden townsrsquo located on greenfield sites Some of
these sites were developed as large-scale public housing projects often with low-density low-
rise properties others in mixed estates with a mixture of public and private housing Later in
the interwar period as economic conditions improved local authorities reverted to replacing
inner-city slums with local high-rise buildings in the same neighbourhood while private
developers tended to build in suburbs and rural areas13 However planning (zoning) restrictions
which tend to be much tighter in the UK than in the United States limited the growth of private
housing in some areas
Second a further impetus to public housebuilding occurred after 1945 Between 1939
and 1945 around four million homes in the UK were destroyed or seriously damaged by
bombing Although bombing campaigns were initially targeted at military targets during 1939-
45 they gradually evolved into area bombing strategies focusing on cities Until near the end
of the World War II bombing (by all sides) was notoriously inaccurate lacking precision
instruments for target identification Target visibility relied on key geographical features such
13 For further discussion see httpsfetuweacukconwebhouse_agescouncil_housingprinthtm and Jones and Murie (2006)
11
as coasts and large rivers and towns and cities in such localities were bombed heavily Other
areas remained relatively unscathed because of weather conditions distance counter-jamming
measures lsquofakersquo fires lit to divert bombers to relatively uninhabited areas and so on14 This
scattering of war destruction implies that there was a random element to where replacement
housing was required once the hostilities had ended As a result of war damage many areas
saw the rapid construction of publicly-owned housing estates to replace damaged and destroyed
homes This link at the local level between bombing and public housebuilding is illustrated in
Figure A1 in Appendix A which uses official Bomb Census data from
httpbombsightorgdatasources to show that the location of bombings across boroughs in
London during the World War II is a significant predictor of where publicly-owned housing
estates were built in the post-war period in London
The somewhat random nature of bombing is illustrated by the fact that whilst areas that
were targeted such as the London Docks already contained high-density low income housing
bombs also fell heavily in the more affluent boroughs of south and south east London which
thereby constructed more public housing after 1945 than equally affluent suburbs to the north
of the capital Other areas where major rebuilding took place were also mixed-income
communities Nevertheless after the post-war reconstruction period that lasted well into the
1950s new public properties tended to be built to replace slums in low-income
neighbourhoods often as high-rise developments with private housebuilding being the
dominant feature of more affluent areas By 1980 close to one-third of the residential housing
stock in England and Wales was public housing
For the analysis that follows in particular to understand the identification strategy that
is taken it is very important to understand how a household accessed a public house and how
the length of tenure within public housing was determined Policies varied between local
authorities but priority for access to public housing would initially be given to local residents
who required rehousing as a result of slum clearance or war destruction Thereafter most local
authorities operated a queuing system by which eligibility depended on evidence that the
person or household would otherwise be homeless on family size and on means of household
income support if any Local residents were prioritised The extent of rationing (waiting time)
for public housing if any in a given area would depend on the supply of public housing that
had been constructed relative to demand Incoming applicants from outside the local authority
14 There is a vast literature on this An early volume that revealed efforts to thwart the accuracy of the German bombing campaign is Jones (1978)
12
area would typically be at the back of the queue In turn residents already within public housing
could apply to move from one public property to another ndash typically by requesting lsquoupgradingrsquo
as a nicer property became available ndash for example a house with a yard or garden rather than
an apartment Tenure within any given property would therefore depend on the availability and
heterogeneity of the public housing stock within an area
iii The ldquoRight to Buyrdquo Policy
Shortly after Margaret Thatcherrsquos election as UK Prime Minister the Housing Act 1980
introduced a statutory Right to Buy (RTB) for public tenants with at least 3 yearsrsquo tenure
duration in their council house ndash lsquostatutoryrsquo in the sense that the policy had to be implemented
by all local councils (previously a few Conservative councils had allowed their tenants to buy
their public property generally at market price) The RTB policy allowed tenants to buy their
properties at substantial discounts to market value ranging from 33 with three yearsrsquo
residence to a maximum of 50 after 20 yearsrsquo residence Local councils were also obliged to
make mortgages available to would-be purchasers although this feature became less pertinent
as capital markets were liberalised during the 1980s The discount on the sale price would be
repayable if the property was resold within five years of an RTB purchase although a
purchased property could be rented out
There were additional constraints in the 1980 legislation particularly in relation to the
sale of publicly-owned apartments but these too were relaxed in the mid-1980s Purchase of
public housing under RTB also became more attractive with later efforts to raise heavily-
subsidised rents on public tenancies towards lsquomarketrsquo levels15 Figure 2 indicates the pattern of
sales under the RTB policy in England (the other UK nations had similar patterns ndash indeed the
large stock of public houses in Scotland was sold even more rapidly leading to a blanket ban
on further sales by the Scottish government some decades later) The two peaks in sales in the
1980s are associated with the introduction of the RTB policy and its liberalisation in the mid-
1980s thereafter with the better-quality tenants (and public housing) having moved into the
private sector the rate of sales declines
The Thatcher era ended in 1992 and the incoming Labour government in 1997 did not
attempt to reverse the policy completely but did tighten eligibility conditions limit access to
publicly-provided mortgages and impose caps on the maximum discounts in some areas where
15 The economic incentives implied by these various policies are explored at some length in Disney and Luo (2017) but not considered in detail here
13
sales had diminished the public housing stock quickly (since local authorities still had a
statutory responsibility to house homeless families) On the other hand the government also
introduced a similar but less generous version of RTB known as lsquoRight to Acquirersquo which
allowed tenants in some cases to purchase public housing (typically managed by lsquoarms lengthrsquo
housing associations and charities rather than directly by local public authorities) This led to
a brief upsurge in sale volumes as illustrated in Figure 2 although sales continued in any event
as public tenants acquired sufficient yearsrsquo residency in their property to be eligible for the
RTB scheme
Not surprisingly RTB purchases were selective both by household type and by quality
of property For example in Derby a prosperous town in mid-England which has traditionally
specialised in high-end manufacturing since at least the 1920s over 80 of the large stock of
public properties in 1980 were in the form of detached semi-detached or terraced housing in
suburbs and less than 20 in the form of (mostly) high-rise apartments in the inner city By
1991 27 of Derbyrsquos stock of public housing had been sold off with apartments now
constituting nearly 30 of the residual stock
In contrast in Hackney an inner London borough in 1980 around 80 of the public
housing stock was in apartments mostly in high-rise estates By 1991 most of the non-
apartment stock in Hackney had been sold off but the overall stock of public housing had
increased because the local council had constructed or purchased further apartments RTB
purchasers themselves were typically older had higher incomes and they were less likely to
be unemployed (Gregg Machin and Manning 2004) Hence sales of public houses were
evidently non-random and related to local crime rates resulting in a well-known endogeneity
issue in the regression analysis that is addressed empirically in Section 4
3 Data
Our empirical analysis combines multiple data sources at annual frequency Housing data are
provided by the Chartered Institute of Public Finance and Accounting (CIPFA) The data are
provided at the Local Authority (LA) level for the 314 LAs in England and Wales in 198016
The data include details of the composition of the residential housing stock (owned privately
rented and public housing) and the number of sales under the Right-to-Buy (RTB) scheme in
each year LAs had a statutory requirement to report RTB sales to CIPFA and provide details
16 The number of LAs changes over time due to some mergers and due to boundary redrawing There were 314 LAs in England and Wales in 1980 at the onset of the RTB policy
14
of the revenue flow received from the sales Data on average length of tenure duration in public
housing by locality in 1980 are derived from the UK General Household Survey (GHS)
Two sources of crime data complement the housing data The short-run analysis which
covers the period 1975 to 1992 uses administrative crime records collected by the police and
published annually by the UK Home Office in Criminal Statistics This period spans five years
prior to the introduction of the RTB policy in 1980 through to the end of the period of
Thatcher-led Conservative governments in 1992 These data are provided at the Police Force
Area (PFA) geography a geographic unit that sits above and nests LAs17 With the sole
exception of Londonrsquos financial district commonly known as ldquothe City of Londonrdquo and which
constitutes an independent PFA data are used for all 42 PFAs that exist in England and
Wales18
The long-run analysis which covers the period 2003 to 2017 draws upon
administrative crime records at the LA level recorded by the police and published online by
the UK Office for National Statistics (ONS) The long-run analysis starts in 2003 because there
was a very substantial change in reporting rules in the late 1990s and early 2000s in the UK
that had different effects across PFAs and crime types Thus it is not possible to use police
recorded crime data before and after 2002 in the same analysis The City of London PFA is
also excluded from the long-run analysis For both the short-run and long-run analyses the
measures of crime used in the empirical analysis are the numbers of recorded offences of
different crime categories per population Thus the data capture incidents of crime recorded
and classified by all UK local police forces The data contain offence rates for five crime
categories property crime defined as the sum of burglary and theft and handling of stolen
goods offences and violent crime defined as the sum of violence against the person sexual
offences and robbery offences
The LA-level housing data were combined with the crime data to create two data sets
for the analysis For the short-run analysis running from 1975 to 1992 the LA-level crime data
were aggregated at the PFA level using the ONS Open Geography database and then joined to
the PFA-level crime data The construction of the short-run panel is not affected by changes in
LA geographical boundaries as in all cases these occur within PFA units Hence a balanced
17 For example London LAs sit within the Metropolitan Police PFA 18 The City of London constitutes an additional PFA that is independent from the rest of London However this PFA is excluded from this analysis because most property in the area is non-residential hardly anybody lives there and consequently few RTB sales took place there
15
panel of 42 PFAs spanning 18 years was obtained with the PFA-year being the unit of analysis
Data from the GHS on tenure were matched to PFA from regional data subdivided into lsquoruralrsquo
lsquourbanrsquo and lsquomixed urban-ruralrsquo areas
For the long-run analysis (2003 to 2017) which uses a long-difference model
observations of the change in crime measured at the LA level for the period 2003-2017 were
joined with observations of total RTB sales also at the LA level for the period 1980-1992 Not
all observations could be joined due to changes in LA geographical boundaries that preclude a
one-to-one mapping between LAs in the earlier and later period This analysis is therefore
based on 293 observations that could be joined between the earlier and latter periods
These data sources were complemented with administrative records of local area
conditions In the short run analysis data from the New Earnings Survey (NES) and the
Department for Employment were used to calculate local area conditions from 1975 to 1992 in
each PFA In the long run analysis local area conditions at the LA level from the Annual
Population Survey (APS) complement the housing and crime data19
i Summary Statistics
Summary data for the composition of the housing stock in 1980 just prior to the RTB
policy start are provided in the first five rows of Table 1 On average 272 of all residential
properties in a PFA were publicly-owned equating to approximately 14000 individual
properties per LA More than 1 of all residential properties were sold under the RTB scheme
by 1981 ie in the first year of the policy20 A key criterion for eligibility to the RTB scheme
and for the size of the discount on the market value of public properties was the length of tenure
duration in public housing of incumbent tenants Table 1 shows that on average incumbent
tenants in 1980 had spent 11 years in their public properties with some areas featuring much
larger average years of tenure duration than others The distribution of the public housing rate
as well as of public housing sales and tenure duration in 1980 are heterogeneous across PFAs
The data show a quite high standard deviation of public housing stock as a proportion of the
residential stock (the standard deviation shown in Table 1 is 86) as well as some outlier
LAs ndash in 10 of LAs public housing accounted for more than one third of the residential
housing stock
19 Additional details of the data used in the empirical analysis and instructions for data access are provided in the Appendix 20 Our data are for England and Wales The higher proportion of the public housing stock at the start of RTB for the UK arises from the initial high levels of public houses in Scotland and Northern Ireland
16
Figure A2 Panel A in Appendix A illustrates the distribution of public housing across
LAs in 1980 (expressed as a percentage of the residential housing stock) Panel B illustrates
the distribution of public housing in absolute terms and Panel C shows the distribution of
residential housing in absolute terms Similarly Figure A3 Panel A in Appendix A illustrates
the distribution of public housing sales across LAs in the 1980s-90s (expressed as a percentage
of the residential housing stock in 1980) Panel B illustrates the distribution of public housing
sales in the 1980s-90s in absolute terms and Panel C shows the distribution of public housing
sales across LAs in the 1980s-90s (expressed as a percentage of the public housing stock in
1980) All distributions in Figures A2 and A3 have a long right tail further illustrating the
uneven distribution of the public housing stock public housing sales the total residential stock
and the ratios of these across LAs in 1980
The remaining rows of Table 1 provide summary data for crime rates and other
covariates in 1980 Crime rates are measured as cases per individuals Thus Table 1 shows that
45 criminal offences per 100 individuals were recorded on average in a PFA in 1980 Total
crime is defined as the sum of property crime and violent crime and these measures of crime
are the key outcomes of interest here21 Property Crime defined as the sum of burglary and
theft and handling of stolen goodsrsquo offences is overwhelmingly the most common category of
crime in 1980 Only the most serious types of violent offences such as homicide aggravated
assault sexual offences and robberies were recorded and published by the Home Office since
the 1970s in England and Wales Minor violent offences only started to be recorded in the UK
in the early 2000s Thus violent crime is defined here as the sum of serious violence against
the person sexual offences and robbery
Table 1 also shows four additional variables which are used as covariates in regression
models the local log real hourly wages at the 25th and 50th percentiles of the distribution the
local log unemployment rate and the local share of 15-24 years olds in the population in the
PFA Since potential offenders are likely to earn low wages and have low levels of labour
market attachment (Machin and Meghir 2004) the 25th percentile of log wages and log
unemployment are likely to be relevant features of the labour market in the determination of
criminal activity while the 50th percentile of log wages is also included to depict the
distribution of wages Finally Table 1 also suggests that approximately 16 of the overall
population is aged 15 to 24 Since the likelihood to commit crime is observed almost
21 The analysis does not include drugs offences as no data on drugs offences in England and Wales was collected and published by the UK Home Office for the period of this study
17
universally to be highest in the late teens and then decrease later in life (Quetelet 1831 and
Landersoslash Nielsen and Simonsen 2016) the fraction of individuals aged 15 to 24 in the
population is also likely to be a relevant determinant of the local criminal activity
4 Empirical Analysis
i Public housing and crime in the initial conditions
The analysis of the relationship between density of public housing and crime rates prior to the
introduction of the Right-to-Buy (RTB) policy is a natural starting point to the empirical
approach Figure 3 illustrates the relationship between the public housing rate (the percentage
share of public housing in the residential housing stock in the PFA) and the crime rate for the
42 PFAs included in the analysis in 1980 A clear positive association appears between the
concentrations of public housing and crime across PFAs in England and Wales with the size
of the dots on the scatter plot illustrating the PFArsquos population size in 1980 The positive
relationship between the public housing rate and the crime rate in Figure 3 is statistically
significant at all conventional levels Using the same data an OLS regression of the following
form was also estimated
119862119862119894119894 = α + β1119867119867119894119894 + β2119935119935119894119894 + ϵ119894119894 (1)
where 119862119862119894119894 is the crime rate in PFA 119894119894 119867119867119894119894 is the public housing stock as a proportion of the
residential housing stock 119935119935119894119894 is a vector of PFA level variables and ϵ119894119894 is the error term Equation
(1) was estimated for total crime as well as separately for property crime and violent crime
Estimates of Equation (1) are shown in Table 2 The Table shows estimates of crime as
a function of the public housing stock (expressed as a proportion of the residential stock)
Columns (2) (4) and (6) additionally control for the log real hourly wages at the 25th and 50th
percentiles of the distribution within the PFA the log unemployment rate in the PFA and the
share of 15-24 year olds in the population in the PFA Public housing is positively and precisely
correlated with all crime outcomes The coefficient on total crime in column (2) of 0064
implies that a 01 unit increase in the size of the public housing stock measured as a proportion
of the residential stock in the PFA in 1980 (approximately a one standard deviation increase)
is associated with an increase in the crime rate of 00064 units equating to approximately half
of one standard deviation increase in crime The positive correlation between public housing
and criminality is not affected by the inclusion of local area variables in Equation (1)
ii Identification issues
18
The primary object of this study is to quantify the causal impact of homeownership on
crime rates In our empirical setting the Right-to-Buy (RTB) policy can be interpreted as a
relaxation of a supply constraint on available property for homeownership by allowing public
housing tenants to purchase their homes at a subsidy Of course this policy does not directly
generate a pure natural experiment in observed RTB sales for at least two reasons First there
may be important time-varying omitted factors that drive both the decision by a tenant to
purchase the house and the local crime rate Second RTB sales are a result of demand for
public housing purchases together with the local supply of housing for sale With demand being
determined at least in part by local crime rates OLS estimates of the relationship between
crime rate and public housing sales will suffer from endogeneity bias It is very likely that the
decision by the tenant to purchase the house may itself be partly determined by the level and
dynamics of local crime Indeed unsurprisingly a negative relationship appears between crime
rates and public housing sales in 1980 in Figure A4 in Appendix A further suggesting that
RTB sales were not orthogonal to crime rates at the onset of the RTB policy
iii Short-run estimates
a Empirical strategy
Our empirical strategy exploits two approaches to estimating the effect of sales of
public housing on crime rates that isolate supply-side variation in exposure to the RTB policy
This variation arises from differences across localities in the potential exposure to RTB sales
The analysis of the short-run impact of public housing sales on crime defines a series of
difference-in-differences specifications whereby the years of tenure duration in public housing
of incumbent tenants in 1980 are used to proxy the Intention-To-Treat (ITT) intensity of the
RTB treatment at the PFA level The national level policy albeit introduced uniformly across
localities in 1980 was specified in such a way that eligibility to the RTB scheme and the size
of the discounts varied across localities depending on the average number of years spent in
public properties by the incumbent tenants prior to the reform
In particular the Housing Act of 1980 introduced a statutory right to buy for public
tenants with at least three yearsrsquo tenure duration in their public house Moreover discounts on
the sale price relative to the market value of the property linearly increased with public housing
tenure duration ranging from 33 percent for public housing tenants with three yearsrsquo residence
through to a maximum of 50 percent after twenty yearsrsquo residence Thus the discounts to
purchase a public property generated by RTB were directly related with the years of tenure
19
duration in public housing when the RTB scheme was introduced and years of tenure duration
in public housing in 1980 constitutes a predetermined source of differential exposure to the
RTB scheme that could not be gamed in 1980
In Columns (7) and (8) in Table 2 equation (1) is re-estimated and the fraction of public
housing in the PFA the log real hourly wages at the 25th and 50th percentiles of the distribution
within the PFA the log unemployment rate in the PFA and the share of 15-24 year olds in the
population in the PFA are used to predict log average years of tenure duration in public housing
in the PFA in 1980 As Table 2 shows none of these variables predicts public housing tenure
duration in 1980 suggesting that its distribution across regions and thus RTB eligibility in 1980
is orthogonal to local area circumstances and the average socio-economic status of individuals
Combined with the fact that RTB came into force shortly after the 1979 election of the new
Thatcher Government and people in the 1970s could not freely move across public properties
(especially between local authorities) but rather had to apply and join a potentially long queue
prior to being able to move in and out of public properties this makes the distribution of RTB
eligibility at the onset of the policy quasi-random
Eligibility to the RTB scheme and in turn intensity of adoption varied across regions
according to the composition of the local housing stock which was determined by historical
factors Public housing sales under the RTB policy began in most LAs in October 1980 (the
1980 Housing Act was passed on 8 August with most LAs starting to process applications for
public housing purchases soon thereafter) Figure 2 shows that the RTB policy resulted in an
initial peak in public housing sales from October 1980 to 1982 after which RTB sales
continued at a slower pace The initial eligibility to the RTB scheme was mainly responsible
for this and it is therefore exploited empirically in the econometric analysis
Since the discount on the sale price would be repayable if a property was resold within
five years of an RTB purchase and the RTB scheme was extended to flats in 1986 the short-
run analysis is conducted separately on the first five years of the RTB scheme ie up until
1985 and on the entire Thatcher era ie up until 1992 When the analysis is restricted to the
first five years of the RTB scheme years of tenure duration in public housing of incumbent
tenants in 1980 are also used as an instrumental variable (IV) for the actual sales of public
housing under the RTB scheme in the first year of the RTB scheme The same IV approach is
not used for later years because starting from 1986 the possibility that properties bought under
the RTB scheme were resold in the private market cannot be ruled out ex ante
20
Figure 4 illustrates a strong positive correlation between the log average years of tenure
duration in public housing in the PFA in 1980 (on the x-axis) and the log percentage of the
residential stock in the PFA which was sold-off in the first year of the RTB scheme ie by
1981 (on the y-axis) These initial sales of the residential stock in the first year of the RTB
scheme are also shown in Figure 5 to be positively correlated with the percentage sold-off
between 1980 and 1992 (on the y-axis) Therefore while RTB public housing sales by 1992
may be the endogenous result of the evolution of crime post 1980 and thereby result in a well-
known problem of reverse causation in our estimates the public housing tenure duration in
1980 constitute an ITT proxy that strongly predicts the actual intensity of the RTB scheme at
the PFA level
For this analysis data on crime rates public housing tenure duration and local area are
used from 1975 to 1992 The estimating difference-in-differences specification can be
expressed as follows
119862119862119894119894119905119905 = αi+αt + 1205731205731 lowast 11987711987711987711987711987711987711989411989480 + 1205731205732 lowast 119875119875119875119875119875119875119875119875119905119905 + 1205731205733 lowast 11987711987711987711987711987711987711989411989480 lowast 119875119875119875119875119875119875119875119875119905119905 + 1205731205734119935119935119946119946119946119946 + 120598120598119894119894 (2)
where 119862119862119894119894119905119905 is the crime rate in PFA i in each year t from 1975 to 1992 αi is a set of PFA fixed
effects and αt is a set of year fixed effects 11987711987711987711987711987711987711989411989480 is log average years of tenure duration in
public housing ie a measure of RTB eligibility in 1980 defined both as a continuous variable
and as a binary variable indicating if average years of public housing tenure duration in PFA i
were greater than or equal to the median value of average years of public housing tenure
duration at the national level in 1980 Post is a dummy variable that takes up value 1 starting
from 1980
The main estimand of interest is 1205731205733 the coefficient associated with the interaction
between 11987711987711987711987711987711987711989411989480 and Post which measures the impact of the initial RTB eligibility-induced
shock to homeownership on crime A negative coefficient associated with 1205731205733 would imply that
PFAs that experienced greater RTB eligibility in 1980 experienced lower relative crime rates
by 1992 due to the RTB scheme This parameter is directly of interest to a policy maker wishing
to modify homeownership rights for the general population as tenure duration in public
housing was an explicit predetermined policy criterion in the Housing Act of 1980 that could
not be gamed in the short run and that determined eligibility to the RTB scheme
The causal interpretation of 1205731205733 crucially relies on the absence of differential pre-
treatment trends between PFAs exposed to different degrees of RTB eligibility in 1980 Insofar
as RTB eligibility in 1980 does not predict crime trends prior to the RTB policy then 1205731205733 can
21
be interpreted as the ITT causal impact of the RTB policy on crime The potential presence of
differential pre-treatment crime trends between PFAs that experienced different degrees of
RTB eligibility is tested and results are presented below Finally 119935119935119946119946 is a vector of local area
controls measured in 1980 and interacted with the Post variable which includes the fraction of
public housing in the PFA the log real hourly wages at the 25th and 50th percentiles of the
distribution within the PFA the log unemployment rate in the PFA and the share of 15-24 year
olds in the population in the PFA while 120598120598119894119894 is the error term Due to the small number of clusters
(42 PFAs) in the analysis p-values were derived for inference from Wild Cluster Bootstrap
estimation with standard errors clustered at the PFA level (see Cameron Gelbach and Miller
2008)
b Short run results
Table 3 presents unconditional difference-in-differences estimates based upon the
dichotomous treatment version of Equation (2) (calculated absent any of the labour market
controls or fixed effects stated in the equation) Panel A shows results for the 1975-85 period
when property resales should have been extremely rare since the discount on the sale price
would be repayable and Panel B shows results for the 1975-92 period In the calculations
PFAs are split into two groups by the magnitude of 11987711987711987711987711987711987711989411989480 in which the above-or-equal-to-
median group is described as the lsquoITT treatmentrsquo group and the below median group is
described as the lsquoITT controlrsquo group Columns 1 and 2 state the pre-1980 average crime rate in
the PFA the post-1980 average crime rate in the PFA and the within-PFA post-pre difference
Column 3 shows the pre-1980 and post-1980 differences between the ITT treatment and ITT
control PFAs Column 4 shows the unconditional difference-in-differences estimate and
column (5) shows the unconditional difference-in-differences estimate deflated by the mean
level of crime in the ITT control group prior to 1980 in percent terms (the unconditional percent
effect) The unconditional difference-in-differences coefficient estimate is negative and
precisely defined in both Panels A and B On average PFAs that experienced RTB eligibility
greater or equal to the national median in 1980 experienced overall crime rates that were 85
lower from 1980 to 1985 and roughly 11 lower from 1980 to 1992
Figure 6 plots the raw data underlying these statistically significant difference-in-
differences estimates The Figure shows average crime rates (weighted by population at the
PFA level) for every year from 1975 to 1992 separately for ITT treatment and ITT control
PFAs The visual inspection of Figure 6 reveals that while crime rates appear on similar trends
prior to 1980 in ITT treatment and ITT control PFAs the gap widened after 1980 with ITT
22
control PFAs experiencing a greater increase in crime rates starting from the early 1980s
Compared with the 1970s a wider gap in crime rates is also observed in the early 1990s when
the short run analysis terminates These unconditional estimates and those in Table 3 suggest
that sales of public housing under the RTB scheme may have helped tackle the nationwide
rising trend in criminality experienced in England and Wales in the 1980s
Table 4 subjects these results to a set of more robust econometric specifications
Columns (1)-(3) show ITT results for the 1975-85 period columns (4) and (5) show IV results
for the 1975-85 period and Columns (6)-(9) show ITT results for the 1975-92 period All
estimated specifications include PFA fixed effects and year fixed effects and the models in
Columns (2)-(5) and (7)-(9) additionally include the interaction between the Post variable in
equation (2) and local area variables measured in 1980 (ie fraction of public housing log of
the unemployment rate log of real hourly earnings at the 25th and 50th percentiles of the
distribution and the fraction of 15-24 year olds in the population) Columns (1) to (8) report
the ITT and IV estimates of 1205731205733 the coefficient associated with the interaction between 11987711987711987711987711987711987711989411989480
and Post in equation (2) whereas the model in Column (9) shows the results separately for the
first eight years of the RTB policy 1980-87 and for the subsequent years that followed the
1987 UK General Elections when Margaret Thatcher was re-elected as UK Prime Minister
1987-92 In all specifications standard errors were clustered at the PFA level and Wild Cluster
Bootstrap techniques were used for inference due to the small number of clusters
Column (1) shows results based upon the dichotomous treatment version of 11987711987711987711987711987711987711989411989480 in
Equation (2) indicating that ITT treatment group PFAs experienced a 10 percent reduction in
crime by 1985 Column (2) shows results based upon the continuous treatment version of
11987711987711987711987711987711987711989411989480 and when the interactions between local area circumstances measured in 1980 and the
Post variable are also added to the estimated specification Column (2) also shows negative
and statistically significant estimates suggesting that the conclusion from Table 3 that RTB
eligibility led to a reduction in crime in the 1980s and early 1990s is robust to equation
specification In particular estimates in Column (2) uncover an elasticity of crime with respect
to RTB eligibility of approximately -019 implying that a 10 percent increase in eligibility to
the RTB scheme reduced crime by around 19 percent within the first five years of the scheme
The causal interpretation of these estimates crucially relies on the absence of
differential pre-treatment crime trends between PFAs that were exposed to different degrees of
RTB eligibility in 1980 Column (3) shows event-study estimates where the log average years
23
of tenure duration in public housing in 1980 was interacted with three pre-reform years Two
key facts emerge from Column (3) First Column (3) shows there to be no differential pre-
treatment trends between PFAs that received different exposures to the RTB scheme In other
words RTB eligibility in 1980 does not predict crime trends across PFAs prior to 1980 This
implies that any post-1980 deviation from the existing trend that is predicted by the eligibility
to the RTB scheme in 1980 can be interpreted as the ITT impact of the RTB scheme on crime
Second estimates in Column (3) show a reduction in crime rates among PFAs that experienced
greater RTB eligibility in 1980 uncovering an elasticity of crime with respect to RTB
eligibility of approximately -028
Columns (4) and (5) show the IV estimates for the period 1975-85 and they retrieve
similar slightly larger negative elasticities In both columns the actual public housing sales
under the RTB scheme in the first year of the policy ie in 1980-81 are instrumented using
the log average years of tenure duration of incumbent tenants in public housing in 1980 Both
columns show negative and statistically significant estimates with Column (5) also showing
there to be no differential pre-treatment trends between PFAs that received different exposures
to the RTB scheme Similarly to the ITT estimates in Column (3) IV estimates in columns (4)
and (5) uncover an elasticity of crime with respect to RTB sales of approximately -028 to -
042 implying that a 10 percent increase in the RTB public housing sales reduced crime by
around 3 to 4 percent by 1985
In the remaining Columns (6)-(9) the analysis is extended up until 1992 the year when
the Thatcher era ended but very similar conclusions emerge Column (6) shows results based
upon the dichotomous treatment version of 11987711987711987711987711987711987711989411989480 in Equation (2) and it indicates that ITT
treatment group PFAs experienced a 128 percent reduction in crime by 1992 Columns (7) and
(8) show results based upon the continuous treatment version of 11987711987711987711987711987711987711989411989480 and when the
interactions between local area circumstances measured in 1980 and the Post variable are also
added to the estimated specification Columns (7) and (8) also show negative and statistically
significant estimates uncovering an elasticity of crime with respect to RTB eligibility of
roughly -028 to -036 implying that a 10 percent increase in eligibility to the RTB scheme
reduced crime by around 28 to 36 percent by 1992 When broken down between the years
prior to 1987 and later years Column (9) shows that a sizeable and statistically significant
crime-reducing effect of RTB eligibility appears in both the 1980s and early 1990s with little
variation appearing in the estimated crime-reducing effects of RTB across time and model
specifications
24
Throughout these estimates the magnitude of the crime reduction caused by the RTB
scheme by 1992 appears very similar to the magnitude observed by 1985 In the early years of
the RTB scheme no one who purchased a property under the RTB scheme could have possibly
resold it while continuing to benefit from the large discounts offered by the Thatcher-led
government under the RTB scheme as explained above Thus crime reductions from 1980-
85 as well as 1980-87 are very unlikely to result from the practice of reselling properties
previously bought under the RTB scheme to incomers that are more affluent If the ldquomigration-
basedrdquo gentrification of certain areas of the country was the underlying mechanism driving
these crime reductions significance in the estimates should not appear until the late 1980s
when the first properties bought under the RTB scheme in 1980 could be resold without having
to renounce the RTB discounts However this is not what is found here A crime reduction
appears in the early years of the RTB scheme a result that is rather consistent with behavioural
changes within the local communities that were more exposed to the provisions of the scheme
Estimates for property crime in Table 5 tell a similar story while no detectable effects
of RTB eligibility and RTB sales appear for violent crime in Table 6 Both Tables are organised
in the same way as Table 4 In both Tables all estimated specifications include PFA fixed
effects and year fixed effects with the models in Columns (2)-(5) and Columns (7)-(9)
additionally including the interactions between the Post variable in equation (2) and local area
variables measured in 1980 (ie fraction of public housing log of the unemployment rate log
of real hourly earnings at the 25th and 50th percentiles of the distribution and the fraction of
15-24 year olds in the population) In all specifications standard errors were clustered at the
PFA level and Wild Cluster Bootstrap techniques were used again for inference due to the
small number of clusters
Regardless of whether estimates are derived from the 1975-85 period or the 1975-92
period and regardless of whether ITT or IV estimates are considered results in Table 5 indicate
that the RTB scheme had a negative and significant impact on property crime uncovering an
elasticity of property crime with respect to the RTB scheme of approximately -03 to -04
implying that a 10 percent increase in eligibility to the RTB public housing sales reduces
property crime by around 3 to 4 percent Also in Table 5 Columns (3) (5) (8) and (9) show
there to be no differential pre-treatment trends between PFAs that received different exposures
to the RTB scheme as none of the estimated pre-treatment coefficients appears statistically
significant Columns (1) to (5) show that a RTB-induced property crime reduction was already
visible by 1985 and Column (9) also shows that a sizeable and statistically significant property
25
crime-reducing effect of RTB eligibility appears both in the 1980s and early 1990s consistent
with the notion that RTB eligibility led to behavioural changes within the local communities
rather than gentrification induced by in-migration
Table 6 studies the effect of RTB eligibility on violent crime and no significance
appears in the estimates Also in this case ITT and IV estimates from the 1975-85 period reach
the same conclusion as ITT estimates from the 1975-92 period Estimates Columns (3) (5) (8)
and (9) show there to be no differential pre-treatment trends between PFAs that received
different exposures to the RTB scheme suggesting that RTB eligibility in 1980 does not predict
violent crime trends either across PFAs prior to 1980 and further supporting the causal
interpretation of the estimates presented in Tables 4 and 5 and discussed in this section
c Political Colour Labour Markets Local Amenities and Police Deployment
Why did greater eligibility to the RTB scheme lead to a detectable reduction in crime
The mechanisms underlying the findings in Tables 3-6 and Figure 6 were investigated through
a variety of statistical tests First one may worry that this analysis is spuriously picking up
some other PFA-specific characteristics such as the political affiliation of the local
administration To test this data on the political ldquocomplexionrdquo of the PFA in the local elections
in 1977 the latest local elections prior to the election of Margaret Thatcher as UK Prime
Minister in 1979 were used Although RTB sales were only used in the IV estimates and not
in the ITT reduced-form estimates of equation (2) presented in Tables 4-6 one may worry that
the de facto supply-side availability of public housing for RTB sales might have differed by
local political control If for example pro-Thatcher Conservative-controlled LAs were more
willing to fulfil their statutory responsibility to accelerate sales through faster processing (or
potentially be more likely to advertise and encourage the possibility locally) then this omitted
confound might weaken the predictive power of public housing tenure duration and co-
determine RTB sales and crime However a scatter plot in Figure A5 in Appendix A suggests
no correlation between the conservative vote share within the PFA and RTB sales from 1980-
92 as a percentage of the residential stock in 1980 Estimates of the impact of eligibility to the
RTB scheme on crime were also produced when a set of interactions between the Conservative
vote share within the PFA in the 1977 local elections and year fixed effects were added to the
econometric specification22 Results are unchanged with the inclusion of this additional
variable which suggests that our results are not caused by Labour controlled LAs opposing
22 The Conservative vote share is the share of Conservative votes in all votes cast in the parliamentary constituencies nested within the PFA
26
this policy for political reasons while facing greater local crime rates This holds true regardless
of whether local area variables are included in the analysis
One additional concern may be that the reduction in crime rates observed in areas with
greater RTB eligibility in 1980 may reflect some underlying trends in local labour markets If
for example incumbent tenants spent more years in public housing prior to 1980 in areas that
faced more favourable labour market prospects thus facing greater discounts under the RTB
scheme and these same areas then experienced reduced criminality thanks to the improved
labour market circumstances then the reduction in crime observed in Tables 3-6 and Figure 6
would be erroneously attributed to the RTB scheme Models to test for the effects of RTB
eligibility on local labour market conditions were therefore estimated and results are displayed
in Table 7 Whether the unemployment rate the 25th percentile real hourly earnings or the 50th
percentile real hourly earnings are modelled as dependent variable no evidence appears that
eligibility to the RTB scheme in 1980 predicted the evolution of local labour market conditions
in the 1980s and early 1990s These results mitigate the concern that our estimates might be
picking up the effect of other local area circumstances that interacted with public housing sales
over time in the 1980s
Eligibility to the RTB scheme in 1980 does not even seem to predict the local fraction
of 15-24 year olds in the population in the 1980s and early 1990s a relevant finding that further
suggests that migration and a compositional change in the local population do not seem to be
the key mechanisms at play here If a ldquomigration-basedrdquo gentrification was behind the main
results of this paper RTB eligibility would predict the composition of the local population in
the 1980s and 1990s If for example all RTB purchasers had rented out their properties to
students right after purchasing them (and this was the true driver of the crime reduction in
Tables 4 and 5) then RTB eligibility should be a positive predictor of the fraction of 15-24
year olds in the population However this is not what is found here
One further concern may be that initial RTB eligibility positively correlates with the
quality of local amenities across regions in England and Wales The initial uptake of the RTB
scheme may have been greater in areas with ldquobetter-qualityrdquo public housing Similarly one
may worry that in 1980 only the ldquowell-offrdquo public tenants were able to exploit the RTB scheme
and purchase their houses while ldquothe very poorrdquo were left behind Both these scenarios would
imply that in the short run analysis initial RTB sales may be picking up other relevant
socioeconomic components of communities If initial RTB sales were concentrated among
27
better-off areas or individuals the crime-reducing effect that is observed may not be due to the
sales of public housing but rather due to the fact that we are not comparing like-with-like
To test for the possibility that RTB sales grew faster in areas with greater-quality public
housing the main model was re-estimated and the treatment variable replaced with the value
of RTB sales in the first year of the RTB scheme in place of the eligibility to the RTB scheme
in 1980 The result of this exercise is shown in column (5) of Table 7 When crime is regressed
on the average (log) value of RTB transactions in the first year of the RTB scheme the
estimated coefficient appears small in magnitude as well as in percent terms and very
statistically insignificant Thus unlike RTB eligibility the value of RTB sales does not predict
the evolution of crime This conclusion is robust to the set of controls added to the estimating
equation (fixed effects only or fixed effects and local area variables) In sum the initial
eligibility to RTB sales not their average value predicts the reduction in crime since the 1980s
Finally one may worry that the RTB scheme may have coincided with differential
policing strategies across regions and that this may have resulted in differential crime detection
rates across regions If for example fewer police officers were deployed in areas with greater
RTB sales in 1980 our findings may reflect the lower crime detection rates of the police in
these areas rather than a genuine reduction in crime Availability of data on the number of
officers employed in each PFA since 1975 allowed us to estimate the impact of RTB eligibility
on police deployment This is a further test of whether indeed the RTB scheme made some
areas of the country safer or whether it coincided with a decrease in police deployment To
examine this idea the dependent variable in the difference-in-differences specification was
replaced with the log number of police officers deployed by the PFA Results are displayed in
column (6) of Table 7 and the coefficient of interest is economically small and not statistically
significant suggesting that the greater exposure to the RTB scheme of some PFAs did not
coincide with differential policing strategies In turn this mitigates the concern that differential
policing strategies and crime detection rates across regions may have coincided with the RTB
scheme and further suggests that our main results reveal the genuine reduction in criminality
generated by the RTB scheme
d Homeownership and Behavioural Change
Did the RTB policy induce indigenous local communities to refurbish their properties
One possibility is that home upgrading by purchasers under the RTB scheme explains the
observed reduction in crime (absent any clear migration labour market or amenity differential
28
between areas that were exposed to differing degrees to the RTB policy) The British Crime
Survey (BCS) 1988 contains a rich set of variables concerning homeownership and crime23
Based on the information contained in the BCS 1988 it was possible to define a treatment
group of incumbent tenants who had previously rented from the council then subsequently
purchased the property in which they currently reside and a control group of council rental
tenants who stated that they currently intend to buy the public property in which they reside
within two years This provides a natural comparison group against which to estimate the
effects of purchase on behavioural change to build at least strongly suggestive evidence for the
effects of the policy Table A1 in the Appendix shows these treatment group individuals and
control group individuals to be observably indistinguishable in terms of age gender ethnicity
income number of rooms in the household household type (eg flat or house) and past
experiences of burglary victimization For each of these individual and household
characteristics Table A1 presents a balancing test that retrieves an insignificant estimate thus
showing the suitability of the comparison group
Table 8 shows a comparison of home improvement expenditure insurance and social
behaviour between these two groups of observably similar individuals Panel A shows
unconditional OLS estimates thus providing a simple comparison of the means between these
two groups OLS estimates in Panel B were derived controlling for the set of variables for
which balancing was tested in Appendix Table A1 ie gender ethnicity a quadratic of age
past experiences of burglary victimization in the property of residence type of property (eg
flat or house) number of rooms in the property household income band and county fixed
effects Thus while self-selection into the treatment group is a possibility controlling for this
large set of observables and restricting the treatment and control groups to incumbent
individuals that only seem to differ in their timing of willingness to purchase their property
from the council within two years should mitigate the concern that self-selection is driving our
results here To be consistent with all other results at PFA level standard errors were clustered
at the county level the closest geography to a PFA that was available in these data As
respondents are drawn from 52 counties Wild Cluster Bootstrap p-values were estimated again
as in all the analysis discussed above
The results in Table 8 show that incumbent tenants who bought from the council were
significantly more likely to install double locks to outside doors to install locks in windows
23 The same detail of information is not available from any other BCS survey from 1982 to 1992 when the short run analysis ends
29
and have the contents of their home insured against theft The same individuals were also
significantly more likely to install burglar alarms a relatively rare security device in England
and Wales in 1988 Finally these individuals were not more likely to join a neighbourhood
watch scheme a community-based crime prevention measure in which neighbours help each
other in a form of informal guardianship The comparison group here is always council tenants
who intended to buy the public property in which they resided in 1988 within two years
Consistent with the finding in Appendix Table A1 that observable characteristics are equally
distributed between treatment group individuals and control group individuals the comparison
of Panel A and Panel B shows that these conclusions are unchanged whether the set of
observable controls described above is included in the estimating equation or not
Additional analysis using the BCS data corroborates our main findings for the effects
of the RTB policy on crime Table A2 in the Appendix uses the BCS data to compare crime
victimization rates among treated versus control group individuals The Table shows that in
1988 treatment group homeowners reported between 20 and 25 less cases of crime
victimisation since the beginning of 1987 than control group council tenants Columns (1) and
(3) show that this holds true regardless of whether county fixed effects are controlled for
Column (5) of the Table also shows results when county fixed effects are replaced by the share
of treatment group homeowners in the county24 The coefficient associated with
homeownership under the RTB scheme remains negative and statistically significant In
contrast the share of treatment group homeowners in the county itself does not predict crime
victimisation Thus while reiterating that the crime reductions in Tables 3-6 and Figure 6 are
indeed driven by RTB sales these results also show that RTB sales did not lead to increased
crime victimisation of neighbouring occupiers of public housing
Figure 7 shows county-specific estimates of the correlation between RTB sales and
crime victimisation plotted against county-specific estimates of the correlation between RTB
sales and home improvement A linear function fitting the distribution of county-specific
estimates is also shown This appears negative and statistically significant showing that on
average incumbent tenants who bought under the RTB scheme experienced greater crime
reduction in counties in which the RTB scheme was associated with greater home
improvement
24 For each respondent this share was calculated at the county level leaving out the respondent herselfhimself from the calculation
30
The low-income homeownership experiment in Oklahoma investigated by Engelhardt
et al (2010) showed little or no significant evidence of home improvements of this sort
subsequent to purchase but that study covered a relatively short time interval post-purchase
and take-up of the subsidy was relatively low In contrast the results in Table 8 for doorsrsquo and
windowsrsquo locks and burglar alarms are consistent with the notion that homeownership led
people to refurbish their properties Homeownership may have given greater access to loans
and financial markets in general and the result for theft insurance plausibly reflects this These
results help rationalise the reduction in property crime Controlling for past experiences of
burglary victimisation also mitigates the concern that RTB purchasers may have experienced
greater crime victimisation in the past and that this may drive the results in Table 8 In contrast
since homeowners were no more likely to join a neighbourhood watch scheme no evidence
appears here that the RTB induced greater investment in social capital in local communities
where RTB unfolded more intensively
Table A2 in the Appendix suggested that no crime displacement occurred from public
houses sold under the RTB scheme to neighbouring public housing not yet sold under the RTB
scheme However one may also worry that the property crime reduction in Table 5 is entirely
driven by reductions in burglary with potential thieves shifting albeit to a lesser extent to
other thefts in the street Table 9 shows the results of our analyses in Tables 4-6 broken down
by crime categories Panel A shows results for the 1975-85 period and Panel B shows results
for the 1975-92 period Results are displayed separately for the crime categories that constitute
our measure of property crime namely burglary and theft and handling of stolen goods as well
as for the crime categories that constitute our measure of violent crime namely violence against
the person sexual offences and robbery
Breaking down property crime into burglary and theft and handling of stolen goods
reveals that no evidence of such ldquodisplacementrdquo of crime appears The reduction in property
crime is driven by a reduction in burglaries although a reduction in theft and handling of stolen
goods appears in the 1975-85 period ie in Panel A The reduction in theft and handling of
stolen goods does not appear statistically significant by 1992 but certainly no increase in this
crime category appears Moreover and similarly the breakdown of the results for violent crime
by crime category shows no evidence of crime displacement across categories as violence
against the person and sexual offences remain unchanged Interestingly both by 1985 and by
1992 a significant negative effect of the RTB scheme is found on robberies which are
31
categorised as violent crimes here because they involve a violent act but they are also often
economically motivated criminal offences
iv Long-Run Estimates
a Empirical strategy
But what of the long-run consequences of homeownership on crime This section
presents estimates of the long-run effects of homeownership induced by the Right-to-Buy
(RTB) policy on local crime rates To do so an instrumental variable (IV) long-differenced
model specification is used which exploits variation in the size of the public housing stock in
1980 across localities As argued above exposure to the policy was bounded by the size of the
public housing stock in 1980 Localities with less public housing would not experience large
increases in the homeownership rate due to the more limited supply As discussed in Section
2 variation in the size of the public housing stock across localities arose due to historical events
around the period of the two World Wars events which are unrelated to recent dynamics of
crime In formal terms the set of estimating equations can be expressed as follows
1198621198621198941198942017 minus 1198621198621198941198942003 = 119886119886 + 1205731205731 lowast 11986711986712048412048492 + 1205731205732 lowast 11986211986211989411989480 + 1205731205733 lowast 119883119883119894119894 + 120598120598119894119894 (3)
11986711986711989411989492 = 119886119886 + 1205731205731 lowast 11986711986711989411989480 + 120598120598119894119894 (4)
where 1198621198621198941198942017 minus 1198621198621198941198942003 is the change in the crime rate in locality i from 2003 to 2017 and
11986711986711989411989492 is the endogenous change in the size of the public housing stock from 1980 to 1992
expressed as a proportion of the residential stock in 1980 11986711986711989411989492 is therefore instrumented with
11986711986711989411989480 the 1980 level of the public housing stock 11986211986211989411989480 is the crime rate in locality i in 1980 119883119883119894119894
is a vector of contemporaneous local area variables (ie the local log real hourly wages at the
25th and 50th percentiles of the distribution the local log unemployment rate and the local share
of 15-24 years olds in the population) and 120598120598119894119894 is the error term As crime data is available from
2003 at the Local Authority (LA) level this model can be estimated at the LA level
The identifying assumption in the model described in Equations (3) and (4) is that
conditional on the level of crime in 1980 and the set of contemporaneous local area variables
captured in the vector 119883119883119894119894 the size of the public housing stock in 1980 in the LA is exogenous
to the dynamics of crime within the LA in the 2000s The exclusion restriction is that
conditional on the level of crime in 1980 and the set of contemporaneous local area variables
in the vector 119883119883119894119894 the size of the public housing stock in 1980 affects the dynamics of crime in
the 2000s only through public housing sales over the subsequent period
32
b Results
Summary data for the dependent variable in Equation 3 and the set of local area
variables in the vector 119883119883119894119894 are shown in Table 10 The crime rate fell over the period in more
than 90 of LAs The 25th percentile log real hourly wage fell too over the period while the
share of 15-24 year olds in the population remained unchanged and the log unemployment rate
rose (at a national level the unemployment rate rose from 5 in March 2003 to 76 by March
2013 during the period following the financial crisis)
The instrumental variable regression requires a strong first-stage relationship between
the public housing stock in 1980 and subsequent RTB sales over the period 1980-92 Figure
A6 in Appendix A illustrates that there is a strong correlation between the size of the public
housing stock in the LA in 1980 and subsequent sales under the RTB policy The scatterplot in
the Figure shows a strong positive relationship The coefficient (standard error) on the
instrument in the first-stage regression is 0242 (0017) with a F-statistic from the regression
of 19555
Estimates of Equation 3 are shown in Table 11 Estimates are grouped by the three
measures of crime examined above the overall crime rate in columns (1)-(3) property crime
rate in columns (4)-(6) and violent crime rate in columns (7)-(9) The leftmost specification for
each outcome includes only the independent variable of interest 11986711986711989411989492 instrumented by 11986711986711989411989480
For each outcome the coefficient on 11986711986711989411989492 is negative and precisely defined The middle
column of each sub-panel adds local area variables to the model with the rightmost column of
each sub-panel also adding a control for the crime rate in 1980 The coefficient on 11986711986711989411989492 remains
negative and precisely defined in each specification
The coefficient estimates imply that LAs experiencing larger increases in
homeownership experienced more rapid crime reductions The coefficient value of 0244 in
column (3) of Table 11 implies that a five percentage point higher increase in the
homeownership rate due to RTB sales caused an approximately fifty percent faster decline in
crime rate over the period 2003-2017 an effect approximately equal to a one standard deviation
higher speed of reduction in crime Among the covariates in all of the regressions the controls
for the level of crime in 1980 return negative and precisely defined coefficients These imply
a degree of convergence in LA level crime rates LAs with higher crime rates in 1980
experienced a faster decline in crime in the early 2000s conditional on the other covariates in
the regression
33
c Additional Long-Run Estimates
Did the RTB scheme leave any detectable mark on house prices and political
preferences of indigenous communities In this final sub-section the long-run effects of
increases in the homeownership rate brought about by RTB sales on house prices and on voting
behaviour are examined The increase in the homeownership rate via RTB sales increased the
potential housing supply to the private resale market Hence all else being equal RTB sales
would be expected to decrease house prices over time On the other hand the RTB scheme
may have also potentially increased the demand for housing in the private resale market
Moreover in the presence of outward migration of low-income households and inward
migration of higher-income households RTB sales may have had a positive impact on house
prices over time
To explore the impact of RTB sales on house prices in column (1) of Table 12 the
dependent variable was replaced with the change in the log of the average house price in the
LA over the period 2003 to 2014 House price data is obtained from the Land Registry house
price index The set of control variables is the same as in the models shown in Column (2) of
Table 11 The coefficient on RTB sales is negative and precisely defined and it implies that a
five percentage point increase in the homeownership rate due to RTB sales decreased house
prices over the period by approximately 65 This is an economically modest effect in the
context of an approximate doubling of house prices on average in LAs over the sample period
However this result highlights the general equilibrium effects of RTB sales on the housing
market
Second the effects of RTB sales on voting behaviour in LA elections were also
estimated To do so LA-level data on vote shares in the local election were matched to the
housing and crime data used so far and the changes in the Conservative vote share within the
LA over the period 1995 ndash 2015 were constructed and modelled as the dependent variable in
the regression The sample size in these estimates is smaller owing to the fact that the timing
of LA election cycles varies across LAs In Table 12 the coefficient on the RTB sales variable
is positive and precisely defined Hence these estimates suggest that the RTB policy was
effective in increasing the Conservative vote share in localities that saw larger increases in the
homeownership rate under the policy This result echoes the conclusion in Di Tella Galiani
and Schargrodsky (2007) that show that lucky squatters who received legal titles in Buenos
Aires in the 1990s report beliefs closer to those that favour the workings of a free market
34
5 Conclusion
This paper studies local crime reduction connected to the increase in homeownership rates
induced by the UK Governmentrsquos Right To Buy (RTB) scheme since 1980 One of the key
goals of the RTB scheme was as it were to lsquogentrifyrsquo households endogenously Specifically
it aimed to ease access to an owned property for (broadly) working class families and in doing
so to alter their behaviour and induce them to take greater care of their property as well as to
alter their economic position by giving them a collateral asset in financial markets The RTB
scheme offered a means of upgrading the economic position of households in neighbourhoods
previously dominated by public housing
The RTB scheme led to a reduction in crime Estimates from the Thatcher era uncover
an elasticity of crime with respect to eligibility to sales of public housing of roughly -03
implying that a 10 percent increase in eligibility to public housing sales reduced crime by
around 3 percent The RTB scheme led to a reduction in both property crime and robberies
and both short run and longer run evidence of crime reduction is presented However rather
than being driven by changes in the composition of households through inward and outward
migration the key mechanisms underlying the reduction in crime rates appear to be the
behavioural changes that the RTB scheme induced within the local community The findings
suggest that new renters-come-homeowners as a result of RTB altered their behaviour in
response to the incentives arising from acquisition of housing wealth They made their
properties safer and gained greater access to the insurance markets
While no evidence is found of compositional changes in the local population of
different regions of the country signs of this behavioural change appear from the early years
of the policy when no resales of properties bought under the RTB scheme could have taken
place while continuing to benefit from the discounts offered under this scheme In line with
this conclusion and contrary to what a migration-based model of gentrification would predict
house prices decreased in the long run and Conservative votes increased in areas most affected
by the RTB scheme These results therefore vindicate the Thatcher rationale for the policy
More broadly they suggest that increasing homeownership reduces local crime as public
housing tenants become owners of their own homes separately from the process of
gentrification whereby low-income neighbourhoods become middle-income neighbourhoods
through outward migration of low-income households and inward migration of higher-income
households These results complement the existing literature and inform policy by showing
how granting homeownership to indigenous communities can also act to reduce crime
35
Before concluding some words of caution are necessary First although the results
conform to the Thatcher rationale for the policy they certainly do not vindicate it overall to
show that would require a more general welfare analysis Indeed an analysis of this sort
presented in Disney and Guo (2017) suggests that the RTB policy generated complex inter-
and intra-generational welfare effects and that welfare-improving adjustments to the policy
should have been considered The welfare implications of the broad shift from direct provision
of public housing to cash transfers for purchase of housing services in the UK implied by RTB
and other policies akin to the US also requires further analysis Nonetheless the change in
behaviour and beliefs in indigenous communities documented here shows a novel means not
fully documented to date that complements the existing literature based on different research
designs and settings by which homeownership and housing policy may contribute to reduce
criminality Thus housing provision and subsidized homeownership have scope to act as
potentially important features of the sizable crime drops observed in the United States and
several other Western economies since the 1990s
36
References
Aliprantis D and D Hartley (2015) Blowing it up and knocking it down the local and city-
wide effects of demolishing high concentration public housing on crime Journal of Urban
Economics 88 67-81
Aliprantis D and F G-C Richter (forthcoming) Evidence of Neighborhood Effects from
Moving to Opportunity LATEs of Neighborhood Quality Review of Economics and
Statistics Forthcoming
Alonso J R Andrews and V Jorda Gil (2019) Do neighbourhood renewal programs reduce
crime rates Evidence from England Journal of Urban Economics 110 March 51-69
Altonji J G and R K Mansfield (2018) Estimating Group Effects Using Averages of
Observables to Control for Sorting on Unobservables School and Neighborhood Effects
American Economic Review 108 (10) 2902-46
Autor D C Palmer and P Pathak (2019) Ending rent control reduced crime in Cambridge
American Economic Association papers and Proceedings 109 381-384
Bell B J Blundell and S Machin (2018) The changing geography of intergenerational
mobility CEP Discussion Paper No 1591 Centre for Economic Performance London School
of Economics and Political Science London UK
Bergman P R Chetty S DeLuca N Hendren L F Katz and C Palmer (2020) Creating
Moves to Opportunity Experimental Evidence on Barriers to Neighborhood Choice Working
paper
Bernasco W T de Graaf J Rouwendal and W Steenbeek (2017) Social interactions and
crime revisited an investigation using individual offender data in Dutch neighborhoods The
Review of Economics and Statistics 99 622ndash636
Blanden J and S Machin (2017) Home Ownership and Social Mobility CEP Discussion
Paper No 1466 Centre for Economic Performance London School of Economics and Political
Science London UK
Cameron A C J G Gelbach and D L Miller (2008) Bootstrap-based improvements for
inference with clustered errors Review of Economics and Statistics 90(3)414ndash27
37
Chetty R and N Hendren (2018a) The Impacts of Neighborhoods on Intergenerational
Mobility I Childhood Exposure Effects Quarterly Journal of Economics 133 (2018a) 1107ndash
1162
Chetty R and N Hendren (2018b) The Impacts of Neighborhoods on Intergenerational
Mobility II County-Level Estimates Quarterly Journal of Economics 133 (2018b) 1163ndash
1228
Chetty R N Hendren and L F Katz (2016) The Effects of Exposure to Better
Neighborhoods on Children New Evidence from the Moving to Opportunity Experiment
American Economic Review 106 (4) 855-902
Chyn E (2018) Moved to opportunity the long-run effects of public housing demolition on
children American Economic Review 108 (10) 3028-56
Cullen J and S Levitt (1999) Crime urban flight and the consequences for cities Review of
Economics and Statistics 81 2 159-169
Damm A and C Dustmann (2014) Does growing up in a high crime neighborhood affect
youth criminal behavior American Economic Review 104 1806ndash1832
Di Pasquale D and E Glaeser (1999) Incentives and social capital are homeowners better
citizens Journal of Urban Economics 45 354-384
Di Tella R S Galiani and E Schargrodsky (2007) The formation of beliefs evidence from
the allocation of land titles to squatters The Quarterly Journal of Economics 122(1) 209-241
Diamond R and T McQuade (2019) Who wants affordable housing in their backyard An
equilibrium analysis of low-income property development Journal of Political Economy 127
no 3 (June 2019) 1063-1117
Disney R and G Luo (2017) The Right to Buy public housing in Britain a welfare analysis
Journal of Housing Economics 35 51-68
Ellen I K Horn and D Reed (2017) Has falling crime invited gentrification US Census
Bureau Center for Economic Studies Paper No CES-WP-17-27 March Washington DC
Engelhardt G M Eriksen W Gale and G Mills (2010) What are the social benefits of home
ownership Experimental evidence for low income households Journal of Urban Economics
67 249-258
38
Fryer R G Jr and L F Katz (2013) Achieving Escape Velocity Neighborhood and School
Interventions to Reduce Persistent Inequality American Economic Review 103 (3) 232ndash37
Gibbons S (2004) The costs of urban property crime The Economic Journal 113 F441-462
Gregg P S Machin and A Manning (2004) Mobility and joblessness In Card D Blundell
R and Freeman R (eds) Seeking a premier economy the economic effects of British economic
reform 1980-2000 371-410 NBER Chicago Chicago University Press
Grogger J (2002) The effects of civil gang injunctions on reported violent crime evidence
from Los Angeles County The Journal of Law amp Economics 45(1) 69-90
doi101086338348
Haurin D R Dietz and B Weinberg (2003) The impact of neighbourhood homeownership
rates a review of the theoretical and empirical literature Journal of Housing Research 13
119-151
Hausman N T Ramot-Nyska and N Zussman (2020) Homeownership Labor Supply and
Neighborhood Quality Working paper 2020
Hilber C and W Vermuelen (2014) The impact of supply constraints on house prices in
England The Economic Journal 126 March 358-405
Jones C and A Murie (2006) The Right to Buy analysis and evaluation of a housing policy
Blackwell Oxford
Jones RV (1978) Most Secret War London Hamish Hamilton
Katz L J R Kling and J B Liebman (2001) Moving to opportunity in Boston early results
of a randomized mobility experiment Quarterly Journal of Economics 116 607ndash654
Kling J R J B Liebman and L F Katz (2007) Experimental Analysis of Neighborhood
Effects Econometrica 75 (1) 83ndash119
Kling J R J Ludwig and L F Katz (2005) Neighborhood Effects on Crime for Female and
Male Youth Evidence from a Randomized Housing Voucher Experiment Quarterly Journal
of Economics 120 87ndash130
Landersoslash R HS Nielsen and M Simonsen (2016) School starting age and the crime-age
profile The Economic Journal 127 1096ndash1118
39
Ludwig J G J Duncan L A Gennetian L F Katz R C Kessler J R Kling and L
Sanbonmatsu (2013) Long-Term Neighborhood Effects on Low Income Families Evidence
from Moving to Opportunity American Economic Review 103 (3) 226ndash31
Ludwig J G J Duncan and P Hirschfield (2001) Urban poverty and juvenile crime
evidence from a randomized experiment Quarterly Journal of Economics 116 655ndash679
Ludwig J and J R Kling (2007) Is Crime Contagious The Journal of Law and Economics
50(3) 491ndash518
McDonald S (1986) Does gentrification affect crime rates Crime and Justice 8 163-201
Machin S and C Meghir (2004) Crime and economic incentives Journal of Human
Resources 39(4) 958-79
Morales-Mosquera M (2019) The economic value of crime control evidence from a large
investment on police infrastructure in Colombia Unpublished draft Harris School of Public
Policy at the University of Chicago
Murie A (1997) Linking housing changes to crime Social Policy and Administration 31 5
22-36
Office of National Statistics (2013) A century of home ownership in England and Wales
London
Olsen E (2003) Housing programs for low-income households In Moffitt R (ed) Means-
tested transfer programs in the United States 365-442 Chicago Chicago University Press
Owens E M Mioduszewski and C Bates (2019) How valuable are civil liberties Evidence
from gang injunctions crime and housing prices in Southern California Unpublished draft
Department of Criminology Law and Society and Department of Economics University of
California Irvine
Quetelet A (1831) [1984] Research on the propensity for crime at different ages translated
and introduced by Sawyer F Sylvester Cincinnati Anderson
Ridgeway G J Grogger R A Moyer and J M MacDonald (2018) Effect of gang
injunctions on crime a study of Los Angeles from 1988ndash2014 Journal of Quantitative
Criminology httpsdoi101007s10940-018-9396-7
40
Rotger G P and G C Galster (2019) Neighborhood peer effects on youth crime natural
experimental evidence Journal of Economic Geography Volume 19 Issue 3 May 2019 Pages
655ndash676 httpsdoiorg101093jeglby053
Sanbonmatsu L J Ludwig L Katz L Gennetian G Duncan R Kessler E Adam T
McDade and S Lindau (2011) Impacts of the Moving to Opportunity for Fair Housing
Demonstration Program after 10 to 15 Years Washington (DC) US Department of Housing
and Urban Development Office of Policy Development and Research November published
at httpwwwhuduserorgportalpublicationspdfMTOFHD_fullreport_v2pdf
Sandler D (2017) Externalities of public housing the effect of public housing demolition on
local crime Regional Science and Urban Economics 62 January 24-35
Schill M (1993) Distressed public housing where do we go from here University of Chicago
Law Review 60 2 497-554
Sciandra M L Sanbonmatsu G J Duncan L A Gennetian L F Katz R C Kessler J R
Kling and J Ludwig (2013) Long-Term Effects of the Moving to Opportunity Residential
Mobility Experiment on Crime and Delinquency Journal of Experimental Criminology 9 (4)
451ndash89
Sodini P S Van Nieuwerburgh R Vestman and U Von Lilienfeld-Toal (2017) Identifying
the Benefits from Home Ownership A Swedish Experiment Working paper
Van Dijk J and B Vollaard (2012) Self-Limiting crime waves in J Van Dijk A Tseloni
and G Farrell (eds) The International Crime Drop 2012 Palgrave MacMillan New York
Source Reproduced from Disney and Luo (2017) Chart 1 calculated from Office for National Statistics (2013)
0
10
20
30
40
50
60
70
80
90
100
1918 1939 1953 1961 1971 1981 1991 2001 2011
Figure 1 Housing Tenure Shares by Tenure Type England and Wales 1918-2011
Owning Private renting Social renting
42
Source Department of Communities and Local Government Housing Statistics Table 678
0
20 000
40 000
60 000
80 000
100 000
120 000
140 000
160 000
180 000
1980
-81
1983
-84
1986
-87
1989
-90
1992
-93
1995
-96
1998
-99
2001
-02
2004
-05
2007
-08
2010
-11
2013
-14
Publ
ic H
ousi
ng
Figure 2 Right to-Buy and Other Sales of Public Housing in England 1980-81 to 2013-14
Council house sales (mostly RTB) Sales of other social housing
43
Figure 3 Correlation Between Crime and Public Housing in 1980 Police Force Area (PFA)
Coeff (se) = 0001 (0000)
0
002
004
006
008
01
Crim
e in
198
0
10 20 30 40 50 Public Housing in 1980
Police Force Area Linear Fit
Crime vs Public Housing in 1980
Notes Figure shows for each Police Force Area (PFA) the crime rate in 1980 plotted against the fraction of public housing as a percent of the total residential stock in 1980 Crime is defined as total yearly counts of property and violent crime offences per population at the PFA level Property crime defined as total yearly counts of burglary and theft or handling of stolen goods offences per population at the PFA level Violent crime defined as total yearly counts of robbery violent and sexual offences per population at the PFA level A linear function fitting the correlation between the PFA-specific fraction of public housing and the crime rate weighted by PFA-specific population size in 1980 is also shown
44
Figure 4 Correlation Between Right-To-Buy (RTB) Public Housing Sales by 1981 and Tenure Duration in Public Housing in 1980
Coeff (se) = 0969 (0270)
0
1
-05
05
Log
Publ
ic H
ousi
ng S
ales
in 1
980-
81
2 22 24 26 28 3Log Public Housing Tenure in 1980
Police Force Area Linear Fit
Public Housing Sales in 1980-81 vs Tenure in 1980
Notes Figure shows for each Police Force Area (PFA) the log sales of public housing under the Right-To-Buy (RTB) scheme by 1981 plotted against PFA-specific log average years of tenure duration in public housing in 1980 A linear function fitting the distribution of PFA-specific log sales and log tenure duration weighted by PFA-specific population size in 1980 is also shown For each PFA in the analysis the horizontal axis shows the log value of average years of tenure duration in public housing in 1980 whereas the vertical axis shows the log count of sales of public housing under the RTB scheme by 1981 as a percent of the total residential stock in 1980
45
Figure 5 Correlation Between Right-To-Buy (RTB) Public Housing Sales in 1980-92 and RTB Public Housing Sales by 1981
Coeff (se) = 0513 (0090)
15
2
25
3
Log
Publ
ic H
ousi
ng S
ales
in 1
980-
92
0 1-05 05Log Public Housing Sales in 1980-81
Police Force Area Linear Fit
Public Housing Sales in 1980-92 vs 1980-81
Notes Figure shows for each Police Force Area (PFA) the log sales of public housing under the Right-To-Buy (RTB) scheme by 1992 plotted against PFA-specific log sales of public housing under the RTB scheme by 1981 A linear function fitting the distribution of PFA-specific log sales weighted by PFA-specific population size in 1980 is also shown For each PFA in the analysis the horizontal axis shows the log count of sales of public housing under the RTB scheme by 1981 as a percent of the total residential stock in 1980 whereas the vertical axis shows the log count of sales of public housing under the RTB scheme by 1992 as a percent of the total residential stock in 1980
46
Figure 6 Crime Rates in Intention-To-Treat (ITT) Treatment Police Force Areas (PFAs) and in ITT Control PFAs 1975-1992
002
004
006
008
01
Wei
ghte
d A
vera
ge a
nd 9
5 C
I
1975 1980 1987 1992Year
ITT Treatment PFAs (Housing Tenure in 1980 gt= p50)ITT Control PFAs (Housing Tenure in 1980 lt p50)
Crime Rates in ITT Treatment vs ITT Control PFAs
Notes Figure shows crime rates separately for ITT Treatment PFAs (Housing Tenure duration in 1980 gt= p50) and ITT Control PFAs (Housing Tenure duration in 1980 lt p50) Crime defined as total yearly counts of property and violent crime offences per population at the PFA level Property crime defined as total yearly counts of burglary and theft or handling of stolen goods offences per population at the PFA level Violent crime defined as total yearly counts of robbery violent and sexual offences per population at the PFA level Reported dots are averages weighted by population at the PFA level and capped bars are 95 confidence intervals
47
Figure 7 County-Specific Estimates of Correlation between Right-To-Buy (RTB) Public Housing Sales and Crime Victimisation against County-Specific Estimates of Correlation between RTB Public Housing Sales and Home Improvement 1988
Coeff (se) = -0518 (0271)
-2
-1
0
1
2
RTB
and
Crim
e Vi
ctim
isat
ion
-1 0 1-05 05RTB and Home Improvement
County-specific Effect Linear Fit
RTB and Crime Victimisation vs RTB and Home Improvement
Notes The figure shows county-specific estimates of the correlation between Right-To-Buy Scheme (RTB) public housing sales and crime victimisation plotted against county-specific estimates of the correlation between RTB public housing sales and home improvement A linear function fitting the distribution of county-specific estimates is also shown For each county in the analysis the horizontal axis shows the estimate of the correlation between RTB public housing sales and home improvement whereas the vertical axis shows county-specific estimates of the correlation between RTB public housing sales and crime victimisation Treatment group defined as homeowners who rented from the council the property in which they currently reside prior to buying it Control group defined as council tenants who currently intend to buy the public property in which they reside within two years
48
Table 1 Summary Data for 1980 Police Force Authorities (PFA)
Percentiles Mean Standard
Deviation Min Max p25 p50 p75 p90
Housing Stock Public Housing Stock ( Residential Stock) 27202 8574 14568 43798 21865 22966 34096 41869 Public Housing Sales by 1981 ( Residential Stock) 1231 0410 0735 2516 0910 1248 1417 1680 Public Housing Years of Tenure 11052 1875 8274 17936 9977 11302 11721 12843 Public Housing Units 191721 177523 27612 563046 71116 98794 246040 563046 Residential Stock Units 725288 738428 128410 2462295 301632 427384 639665 2462295 Crime Variables All Crime Rate 0045 0016 0020 0069 0031 0038 0060 0069 Property Crime Rate 0042 0015 0019 0065 0030 0035 0057 0065 Violent Crime Rate 0003 0001 0001 0006 0002 0003 0003 0004 Covariates Log Unemployment Rate -2885 0357 -3730 -2120 -3219 -2882 -2688 -2435 Log 25th Percentile Real Hourly Earnings 1345 0070 1228 1497 1305 1327 1360 1497 Log 50th Percentile Real Hourly Earnings 1613 0069 1488 1751 1565 1606 1635 1751 Fraction 15-24 Year Olds in Population 0157 0008 0138 0173 0152 0158 0162 0165 Observations 42
Notes Crime variables are measured as crime rates at the Police Force Area (PFA) level Crime defined as total yearly counts of property and violent crime offences per population at the PFA level Property crime defined as total yearly counts of burglary and theft or handling of stolen goods offences per population at the PFA level Violent crime defined as total yearly counts of robbery violent and sexual offences per population at the PFA level Local area variables are the log of the unemployment rate the 25th percentile log real hourly wage and the share of 15-24 year olds in the population each measured at the PFA geography
49
Table 2 Crime Rate Public Housing Stock and Tenure Duration in 1980 OLS Estimates Police Force Area (PFA)
All Crime
Property Crime
Violent Crime
Log Housing Tenure Duration
(1) (2) (3) (4) (5) (6) (7) (8) Public Housing (Prop Res Stock) 0087
(0028) 0064
(0017) 0082
(0026) 0059
(0017) 0005
(0001) 0004
(0001) 0082
(0317) -0023 (0447)
Log Unemployment Rate 0016 (0005)
0015 (0005)
0001 (0000)
0015 (0104)
Log 25th Percentile Real Hourly Earnings 0398 (0080)
0378 (0076)
0020 (0006)
-2358 (1425)
Log 50th Percentile Real Hourly Earnings -0252 (0078)
-0238 (0074)
-0014 (0007)
1400 (1440)
Fraction 15-24 Year Olds in Population 0574 (0219)
0546 (0206)
0028 (0016)
-2914 (2764)
Observations 42 42 42 42 42 42 42 42
Notes Table reports estimates from Ordinary Least Squares regression models Dependent variables are crime rates Crime defined as total yearly counts of property and violent crime offences per population at the Police Force Area (PFA) level Property crime defined as total yearly counts of burglary and theft or handling of stolen goods offences per population at the PFA level Violent crime defined as total yearly counts of robbery violent and sexual offences per population at the PFA level Data units are 42 PFAs in 1980 Standard errors shown in parenthesis indicates significance at 1 indicates significance at 5 indicates significance at 10
50
Table 3 Difference-in-Differences Before and After the Right-To-Buy Scheme
Intention-To-Treat (ITT)
Treatment PFAs (Log Public Housing Tenure Duration in 1980
gt= p50)
Intention-To-Treat (ITT)
Control PFAs (Log Public Housing Tenure Duration in 1980
lt p50)
Difference ((1) - (2))
Unconditional
DiD
Unconditional DiD Effect ((4) Pre (2))
(1) (2) (3) (4) (5) Panel A All Crime 1975-85 Pre- 0034 0047 -0013 Post- 0043 0060 -0017 Post ndash Pre 0009 0013 -0004
(p = 0085) -85
Number of Police Force Areas 21 21 Number of Observations 231 231 Panel B All Crime 1975-92 Pre- 0035 0047 -0012 Post- 0053 0070 -0017 Post ndash Pre 0018 0023 -0005
(p = 0072) -106
Number of Police Force Areas 21 21 Number of Observations 378 378
Notes Post-period defined as starting from 1980 the date of adoption of the Right to Buy (RTB) Policy in England and Wales Panel A shows results for the 1975-85 period and Panel B shows results for the 1975-92 period Crime defined as total yearly counts of property and violent crime offences per population at the Police Force Area (PFA) level Property crime defined as total yearly counts of burglary and theft or handling of stolen goods offences per population at the PFA level Violent crime defined as total yearly counts of robbery violent and sexual offences per population at the PFA level Averages weighted by population at the PFA level Standard errors were clustered at the PFA level and p-values from Wild Cluster Bootstrap are reported in parentheses Effect calculated as estimated coefficient divided by mean of dependent variable prior to 1980 in the ITT control group PFAs (Public Housing Tenure duration in 1980 lt p50)
Table 4 Estimates of Impact of Right-To-Buy Scheme on Crime
ITT 1975-85 IV 1975-85 ITT 1975-92 (1) (2) (3) (4) (5) (6) (7) (8) (9)
(Log RTB Sales in 1980-81) x Post -0013 (p = 0012)
-0020 (p = 0026)
(Log Tenure gt= p50) x Post -0005 (p = 0085)
-0006 (p = 0073)
Log Tenure x Post -0009 (p = 0055)
-0013 (p = 0087)
-0013 (p = 0038)
-0017 (p = 0049)
Log Tenure x 1988-92 -0018 (p = 0047)
Log Tenure x 1980-87 -0017 (p = 0090)
Log Tenure x 1979 -0009 (p = 0183)
-0009 (p = 0183)
-0009 (p = 0189)
-0009 (p = 0189)
Log Tenure x 1978 -0007 (p = 0514)
-0007 (p = 0541)
-0007 (p = 0525)
-0007 (p = 0525)
Log Tenure x 1977 -0005 (p = 0611)
-0005 (p = 0623)
-0005 (p = 0628)
-0005 (p = 0628)
Effect -10638 -0191 -0277 -0277 -0425 -12766 -0277 -0362 Effect x 1988-92 -0383 Effect x 1980-87 -0362
Log Unemployment Rate in 1980 x Post No Yes Yes Yes Yes No Yes Yes Yes Log 25th Percentile Earnings in 1980 x Post No Yes Yes Yes Yes No Yes Yes Yes Log 50th Percentile Earnings in 1980 x Post No Yes Yes Yes Yes No Yes Yes Yes Fraction 15-24 Years Old in 1980 x Post No Yes Yes Yes Yes No Yes Yes Yes Fraction of Public Housing in 1980 x Post No Yes Yes Yes Yes No Yes Yes Yes PFA Fixed Effects Yes Yes Yes Yes Yes Yes Yes Yes Yes Year Fixed Effects Yes Yes Yes Yes Yes Yes Yes Yes Yes
First Stage Coefficient on ITT 0647 (p = 0015)
0647 (p = 0019)
Sample Size 462 462 462 462 462 756 756 756 756 Number of PFAs 42 42 42 42 42 42 42 42 42
Notes Post-period defined as starting from 1980 the date of adoption of the Right to Buy (RTB) Policy in England and Wales Columns (1)-(5) show ITT and IV results for the 1975-85 period and Columns (6)-(9) show ITT results for the 1975-92 period Tenure duration in public housing measured in years and calculated in 1980 Sales of public housing calculated in 1980-81 Crime defined as total yearly counts of property and violent crime offences per population at the Police Force Area (PFA) level Property crime defined as total yearly counts of burglary and theft or handling of stolen goods offences per population at the PFA level Violent crime defined as total yearly counts of robbery violent and sexual offences per population at the PFA level Regressions weighted by population at the PFA level Standard errors were clustered at the PFA level and p-values from Wild Cluster Bootstrap are reported in parentheses Effect calculated as estimated coefficient divided by pre-1980 mean of dependent variable in ITT control group (Public Housing Sales by 1981 lt p50) indicates significance at 1 indicates significance at 5 indicates significance at 10
Table 5 Estimates of Impact of Right-To-Buy Scheme on Property Crime
ITT 1975-85 IV 1975-85 ITT 1975-92 (1) (2) (3) (4) (5) (6) (7) (8) (9)
(Log RTB Sales in 1980-81) x Post -0013 (p = 0012)
-0018 (p = 0021)
(Log Tenure gt= p50) x Post -0004 (p = 0089)
-0005 (p = 0102)
Log Tenure x Post -0008 (p = 0052)
-0012 (p = 0085)
-0012 (p = 0038)
-0016 (p = 0052)
Log Tenure x 1988-92 -0015 (p = 0095)
Log Tenure x 1980-87 -0017 (p = 0099)
Log Tenure x 1979 -0008 (p = 0168)
-0008 (p = 0173)
-0008 (p = 0177)
-0008 (p = 0177)
Log Tenure x 1978 -0006 (p = 0518)
-0006 (p = 0546)
-0006 (p = 0535)
-0006 (p = 0535)
Log Tenure x 1977 -0004 (p = 0609)
-0004 (p = 0619)
-0004 (p = 0624)
-0004 (p = 0623)
Effect -9091 -0182 -0273 -0295 -0409 -11364 -0273 -0364 Effect x 1988-92 -0341 Effect x 1980-87 -0386
Log Unemployment Rate in 1980 x Post No Yes Yes Yes Yes No Yes Yes Yes Log 25th Percentile Earnings in 1980 x Post No Yes Yes Yes Yes No Yes Yes Yes Log 50th Percentile Earnings in 1980 x Post No Yes Yes Yes Yes No Yes Yes Yes Fraction 15-24 Years Old in 1980 x Post No Yes Yes Yes Yes No Yes Yes Yes Fraction of Public Housing in 1980 x Post No Yes Yes Yes Yes No Yes Yes Yes PFA Fixed Effects Yes Yes Yes Yes Yes Yes Yes Yes Yes Year Fixed Effects Yes Yes Yes Yes Yes Yes Yes Yes Yes
First Stage Coefficient on ITT 0647 (p = 0015)
0647 (p = 0019)
Sample Size 462 462 462 462 462 756 756 756 756 Number of PFAs 42 42 42 42 42 42 42 42 42
Notes Post-period defined as starting from 1980 the date of adoption of the Right to Buy (RTB) Policy in England and Wales Columns (1)-(5) show ITT and IV results for the 1975-85 period and Columns (6)-(9) show ITT results for the 1975-92 period Tenure duration in public housing measured in years and calculated in 1980 Sales of public housing calculated in 1980-81 Property crime defined as total yearly counts of burglary and theft or handling of stolen goods offences per population at the Police Force Area (PFA) level Regressions weighted by population at the PFA level Standard errors were clustered at the PFA level and p-values from Wild Cluster Bootstrap are reported in parentheses Effect calculated as estimated coefficient divided by pre-1980 mean of dependent variable in ITT control group (Public Housing Sales by 1981 lt p50) indicates significance at 1 indicates significance at 5 indicates significance at 10
53
Table 6 Estimates of Impact of Right-To-Buy Scheme on Violent Crime
ITT 1975-85 IV 1975-85 ITT 1975-92 (1) (2) (3) (4) (5) (6) (7) (8) (9)
(Log RTB Sales in 1980-81) x Post -0001 (p = 0166)
-0001 (p = 0104)
(Log Tenure gt= p50) x Post -0000 (p = 0186)
-0001 (p = 0124)
Log Tenure x Post -0000 (p = 0228)
-0001 (p = 0202)
-0001 (p = 0204)
-0001 (p = 0212)
Log Tenure x 1988-92 -0003 (p = 0383)
Log Tenure x 1980-87 -0000 (p = 0697)
Log Tenure x 1979 -0001 (p = 0480)
-0001 (p = 0493)
-0001 (p = 0480)
-0001 (p = 0481)
Log Tenure x 1978 -0001 (p = 0472)
-0001 (p = 0480)
-0001 (p = 0474)
-0001 (p = 0475)
Log Tenure x 1977 -0000 (p = 0653)
-0000 (p = 0611)
-0000 (p = 0654)
-0000 (p = 0655)
Effect -0 -0 -0333 -0333 -0333 -33333 -0333 -0333 Effect x 1988-92 -1 Effect x 1980-87 -0
Log Unemployment Rate in 1980 x Post No Yes Yes Yes Yes No Yes Yes Yes Log 25th Percentile Earnings in 1980 x Post No Yes Yes Yes Yes No Yes Yes Yes Log 50th Percentile Earnings in 1980 x Post No Yes Yes Yes Yes No Yes Yes Yes Fraction 15-24 Years Old in 1980 x Post No Yes Yes Yes Yes No Yes Yes Yes Fraction of Public Housing in 1980 x Post No Yes Yes Yes Yes No Yes Yes Yes PFA Fixed Effects Yes Yes Yes Yes Yes Yes Yes Yes Yes Year Fixed Effects Yes Yes Yes Yes Yes Yes Yes Yes Yes
First Stage Coefficient on ITT 0647 (p = 0015)
0647 (p = 0019)
Sample Size 462 462 462 462 462 756 756 756 756 Number of PFAs 42 42 42 42 42 42 42 42 42
Notes Post-period defined as starting from 1980 the date of adoption of the Right to Buy (RTB) Policy in England and Wales Columns (1)-(5) show ITT and IV results for the 1975-85 period and Columns (6)-(9) show ITT results for the 1975-92 period Tenure duration in public housing measured in years and calculated in 1980 Sales of public housing calculated in 1980-81 Violent crime defined as total yearly counts of robbery violent and sexual offences per population at the Police Force Area (PFA) level Regressions weighted by population at the PFA level Standard errors were clustered at the PFA level and p-values from Wild Cluster Bootstrap are reported in parentheses Effect calculated as estimated coefficient divided by pre-1980 mean of dependent variable in ITT control group (Public Housing Sales by 1981 lt p50) indicates significance at 1 indicates significance at 5 indicates significance at 10
54
Table 7 Estimates of Impact of Right-To-Buy (RTB) Public Housing Tenure Duration on Local Area Outcomes and (Log) Value of RTB Public Housing Sales on Crime 1975 ndash 1992
Log
Unemployment Rate
Log 25th Percentile Real
Hourly Earnings
Log 50th Percentile Real
Hourly Earnings
Fraction 15-24 Years Old in Population
Total Crime Log Count of Police Officers
(1) (2) (3) (4) (5) (6) Log Tenure x Post -0168
(p = 0313) -0079
(p = 0269) -0076
(p = 0346) 0002
(p = 0746) -0024
(p = 0594) Log Value Sales x Post 0002
(p = 0280)
Effect 0014 0043 Log Unemployment Rate in 1980 x Post No Yes Yes Yes Yes Yes Log 25th Percentile Earnings in 1980 x Post Yes No No Yes Yes Yes Log 50th Percentile Earnings in 1980 x Post Yes No No Yes Yes Yes Fraction 15-24 Years Old in 1980 x Post Yes Yes Yes No Yes Yes Fraction of Public Housing in 1980 x Post Yes Yes Yes Yes Yes Yes PFA Fixed Effects Yes Yes Yes Yes Yes Yes Year Fixed Effects Yes Yes Yes Yes Yes Yes Sample Size 756 756 756 756 756 756 Number of PFAs 42 42 42 42 42 42
Notes Post-period defined as starting from 1980 the date of adoption of the Right to Buy (RTB) Policy in England and Wales Tenure duration in public housing measured in years and calculated in 1980 Value of sales of public housing calculated by 1981 Local area outcomes measured at the PFA level Crime defined as total yearly counts of property and violent crime offences per population at the Police Force Area (PFA) level Property crime defined as total yearly counts of burglary and theft or handling of stolen goods offences per population at the PFA level Violent crime defined as total yearly counts of robbery violent and sexual offences per population at the PFA level Regressions weighted by population at the PFA level Standard errors were clustered at the PFA level and p-values from Wild Cluster Bootstrap are reported in parentheses Effect calculated as estimated coefficient divided by pre-1980 mean of dependent variable in ITT control group (Public Housing Tenure duration in 1980 lt p50) except in columns (1) (2) and (5) where the dependent variable is measured in log values
55
Table 8 Correlation between Right-To-Buy Public Housing Sales and Home Improvement Insurance and Social Behaviour 1988
Installed Double Locks on Outside
Doors
Installed Locks on Windows
Theft Insurance of Home Contents
Installed Burglar Alarm
Neighbourhood Watch Scheme
(1) (2) (3) (4) (5) Panel A RTB Scheme 0217
(p = 0000) 0193
(p = 0000) 0251
(p = 0000) 0043
(p = 0037) 0005
(p = 0828) Effect 606 1304 384 2263 81 Panel B RTB Scheme 0232
(p = 0000) 0168
(p = 0003) 0239
(p = 0000) 0048
(p = 0046) 0018
(p = 0505) Effect 648 1135 365 2526 29 Gender Yes Yes Yes Yes Yes Ethnicity Yes Yes Yes Yes Yes Log Age (quadratic) Yes Yes Yes Yes Yes Past Burglary Victimization Yes Yes Yes Yes Yes Household Type Yes Yes Yes Yes Yes Household Rooms Yes Yes Yes Yes Yes Household Income Yes Yes Yes Yes Yes County Fixed Effects Yes Yes Yes Yes Yes Mean Dep Var Control Group 0358 0148 0654 0019 0062 Sample Size 520 520 520 520 520 Number of Counties 52 52 52 52 52
Notes Treatment group defined as homeowners who rented from the council the property in which they currently reside prior to buying it Control group defined as council tenants who currently intend to buy the public property in which they reside within two years Standard errors were clustered at the county level and p-values from Wild Cluster Bootstrap are reported in parentheses Effect calculated as estimated coefficient divided by mean of dependent variable in the control group (council tenants who intend to buy the public property in which they reside within two years) reported here Panel A reports unconditional OLS estimates and Panel B reports conditional OLS estimates where controls for gender ethnicity age burglary victimization household type household rooms household income employment status and county fixed effects were included in the estimating equation indicates significance at 1 indicates significance at 5 indicates significance at 10
56
Table 9 ITT Estimates of Impact of Right-To-Buy Scheme on Crime Separately by Crime Category
Property Crime Violent Crime Burglary Theft and
Handling of Stolen Goods
Violence Against the Person
Sexual Offences
Robbery
(1) (2) (3) (4) (5)
Panel A Crime Category 1975 ndash 1985
Log Tenure x Post -0004 (p = 0083)
-0004 (p = 0070)
-00002 (p = 0531)
0000 (p = 0894)
-00003 (p = 0082)
Effect -0309 -0132 -0104 0021 -87392 Log Unemployment Rate in 1980 x Post Yes Yes Yes Yes Yes Log 25th Percentile Earnings in 1980 x Post Yes Yes Yes Yes Yes Log 50th Percentile Earnings in 1980 x Post Yes Yes Yes Yes Yes Fraction 15-24 Years Old in 1980 x Post Yes Yes Yes Yes Yes Fraction of Public Housing in 1980 x Post Yes Yes Yes Yes Yes PFA Fixed Effects Yes Yes Yes Yes Yes Year Fixed Effects Yes Yes Yes Yes Yes
Sample Size 462 462 462 462 462 Number of PFAs 42 42 42 42 42
Panel B Crime Category 1975 ndash 1992
Log Tenure x Post -0006 (p = 0016)
-0006 (p = 0130)
-00004 (p = 0447)
0000 (p = 0987)
-00004 (p = 0090)
Effect -0489 -0191 -0191 0002 -127
Log Unemployment Rate in 1980 x Post Yes Yes Yes Yes Yes Log 25th Percentile Earnings in 1980 x Post Yes Yes Yes Yes Yes Log 50th Percentile Earnings in 1980 x Post Yes Yes Yes Yes Yes Fraction 15-24 Years Old in 1980 x Post Yes Yes Yes Yes Yes Fraction of Public Housing in 1980 x Post Yes Yes Yes Yes Yes PFA Fixed Effects Yes Yes Yes Yes Yes Year Fixed Effects Yes Yes Yes Yes Yes
Sample Size 756 756 756 756 756 Number of PFAs 42 42 42 42 42
Notes Post-period defined as starting from 1980 the date of adoption of the Right to Buy (RTB) Policy in England and Wales Panel A shows results for the 1975-85 period and Panel B shows results for the 1975-92 period Tenure duration in public housing measured in years and calculated in 1980 Yearly counts of crime were measured at the Police Force Area (PFA) level for all crime categories Regressions weighted by population at the PFA level Standard errors were clustered at the PFA level and p-values from Wild Cluster Bootstrap are reported in parentheses Effect calculated as estimated coefficient divided by pre-1980 mean of dependent variable in ITT control group (Public Housing Tenure duration in 1980 lt p50) indicates significance at 1 indicates significance at 5 indicates significance at 10
57
Table 10 Summary Data for Long-Difference Analysis
Percentiles Mean Standard Deviation Min Max p25 p50 p75 p90 Housing Variables 1Public House Sales 1980-1992 3718 3429 151 33386 1843 2643 4223 7857 2Public House Stock 1980 15032 16757 2180 148394 6358 8912 18018 32832 12 29 13 0 116 22 27 35 42 Crime Variables All Crime Rate -0020 0011 -0075 0002 -0026 -0019 -0013 -0008 Property Crime Rate -0015 0009 -0064 0001 -0019 -0013 -0009 -0006 Violent Crime Rate -0005 0004 -0018 0001 -0007 -0005 -0003 -0001 Covariates Log Unemployment Rate 0466 0462 -0816 1901 0183 0476 0768 1004 Log 25th Percentile Real Hourly Earnings -0084 0058 -0278 0139 -0117 -0080 -0047 -0018 Log 50th Percentile Real Hourly Earnings -0080 0064 -0288 0096 -0114 -0083 -0036 -0002 Fraction of 15-24 Year Olds in Population -0000 0009 -0035 0034 -0004 0001 0004 0009 Observations 293
Notes Crime variables are measured as crime rates at the Local Authority (LA) level Crime defined as total yearly counts of property and violent crime offences per population at the LA level Property crime defined as total yearly counts of burglary and theft or handling of stolen goods offences per population at the LA level Violent crime defined as total yearly counts of robbery violent and sexual offences per population at the LA level Local area variables are the log of the unemployment rate the 25th percentile log real hourly wage and the share of 15-24 year olds in the population each measured at the LA geography
58
Table 11 IV Estimates of Impact of Change in Public Housing Stock 1980-1992 on Change in Crime Rate 2003-2017
Δ All Crime Rate
Δ Property Crime Rate
Δ Violent Crime Rate
(1) (2) (3) (4) (5) (6) (7) (8) (9) RTB Sales 1980-1992 1980 Residential Stock
-0339 (0053)
-0310 (0050)
-0245 (0042)
-0236 (0038)
-0218 (0037)
-0179 (0032)
-0103 (0017)
-0092 (0016)
-0073 (0014)
Changes in Covariates Log Unemployment Rate 0003
(0002) 0002
(0002) 0002
(0002) 0001
(0002) 0001
(0001) 0001
(0001) Log 25th Percentile Earnings -0048
(0023) -0055 (0020)
-0034 (0017)
-0039 (0016)
-0014 (0008)
-0013 (0006)
Log 50th Percentile Earnings 0009 (0022)
0011 (0018)
0009 (0016)
0001 (0001)
-0001 (0007)
-0001 (0001)
Fraction 15-24 Year Olds 0428 (0104)
0250 (0095)
0278 (0077)
0169 (0074)
0149 (0034)
0119 (0029)
Crime Rate in 1980 All Crime Rate in 1980 -0319
(0053)
Property Crime Rate in 1980 -0203 (0043)
Violent Crime Rate in 1980 -1718 (0287)
Observations 293 293 293 293 293 293 293 293 293
Notes Table reports Instrumental Variable estimates Crime defined as total yearly counts of property and violent crime offences per population at the LA level Property crime defined as total yearly counts of burglary and theft or handling of stolen goods offences per population at the LA level Violent crime defined as total yearly counts of robbery violent and sexual offences per population at the LA level Dependent variable is the change in the Local Authority (LA) crime rate between 2003 and 2017 for each crime type denoted by column headings Independent variables are i) total Right-to-Buy sales within the LA for the period 1980 to 1992 (divided by 1980 residential stock) ii) changes in the log unemployment rate in the 25th percentile log real hourly wage and in the share of 15-24 year olds in the population each measured at the LA level iii) crime rates in 1980 for each crime type denoted by column headings measured at the Police Force Area (PFA) level The instrument for i) is the stock of public housing in the local authority in 1980 (divided by 1980 residential stock) indicates significance at 1 indicates significance at 5 indicates significance at 10
59
Table 12 IV Estimates of Impact of Change in Public Housing Stock 1980-1992 on Changes in (Log) Average House Price and Conservative Vote Share
Δ (Log) Average
House Price
Δ Con Vote Share
in LA
(1) (2) RTB Sales 1980-1992 1980 Residential Stock -1327
(0475) 1757
(0352) Changes in Covariates Log Unemployment Rate -0070
(0021) -0014 (0017)
Log 25th Percentile Earnings -0740 (0213)
0379 (0177)
Log 50th Percentile Earnings -0069 (0198)
-0111 (0158)
Fraction 15-24 Year Olds -8575 (1005)
-1188 (0891)
Observations 290 235
Notes Table reports Instrumental Variable estimates In Column (1) the dependent variable is the change in the log of the average house price in the Local Authority (LA) between 2003 and 2017 In Column (2) the dependent variable is the change in the Conservative vote share in Local Authority elections between 19956 and 201415 Independent variables are i) total Right-to-Buy sales within the LA for the period 1980 to 1992 (divided by 1980 residential stock) ii) changes in the log unemployment rate in the 25th percentile log real hourly wage and in the share of 15-24 year olds in the population each measured at the LA level The instrument for i) is the stock of public housing in the local authority in 1980 (divided by 1980 residential stock) indicates significance at 1 indicates significance at 5 indicates significance at 10
APPENDIX ndash ONLINE ONLY
A Data Sources
a Public Housing Stock and Residential Stock in 1980
Public housing stock records for 1980 are sourced from the Chartered Institute of Public Finance and Accountancy (CIPFA) Rate Collection Statistics 1980-81 Actuals SIS ref 4282 This publication is based on data returned by authorities from DoE forms VO7140 The data covers 33 London Boroughs 34 Metropolitan District Councils 286 English Non-Metropolitan District Councils and 37 Welsh District Councils which we refer to in the main paper as Local Authorities The data cover 973 of total rateable hereditaments The number of residential properties in the Local Authority is stated at Column 2 lsquoDomesticrsquo with the number of public house properties in the Local Authority stated at Column 22 lsquoCouncil Dwellingsrsquo These data were extracted from hard copy held by UK libraries
b Right-to-Buy Public Housing Sales
Data on the number of public housing properties sold each year through the Right-to-Buy scheme by each Local Authority for the period 1980 - 2001 are sourced from the CIPFA Housing Revenue Account (HRA) The HRA records expenditure and income on running a councilrsquos own housing stock and closely related services or facilities which are provided primarily for the benefit of the councilrsquos own tenants Under the Housing Act 1985 Local Authorities are obliged to report revenues from public house sales via their HRA These data are accessed under license from CIPFA For further details see httpswwwcipfaorgpolicy-and-guidancepublications (link last accessed on 28 March 2020) We use these data in our main analysis For Figures 1 and 2 we also source data on sales under the Right-to-Buy scheme after 2001 These data are provided by the Department for Communities and Local Government Table 685 For further details see httpswwwgovukgovernmentstatistical-data-setslive-tables-on-social-housing-sales (link last accessed on 28 March 2020)
c Crime Area-level crime data compiled by the Home Office and published annually in Criminal Statistics for the period between 1975 and 1992 were sourced from the archives of the LSE Library where both hard and soft copies of the data can be accessed Yearly crime records of all Local Police Forces in England and Wales were available at the Police Force Area (PFA) level and with the sole exception of the City of London they were used in this analysis Area-level crime data compiled by the Office for National Statistics (ONS) and published annually on the ONS website for the period between 2003 and 2017 were available at the Local Authority (LA) level Due to the redrawing of LA boundaries over time it was not possible to include all LAs in the analysis Our analysis for the period between 2003 and 2017 therefore includes 293 LAs These data can be freely accessed here httpswwwonsgovukpeoplepopulationandcommunitycrimeandjusticedatasetsrecordedcrimedataatcommunitysafetypartnershiplocalauthoritylevelcurrent (link last accessed on 28 March 2020)
d Local Area Circumstances and Housing Tenure Local area circumstances were measured using the New Earnings Survey (NES) provided by the Department for Employment for the period 1975-1992 and using the version of the Annual Population Survey (APS) that is publicly available on the Nomis website for the period 2003-2017 Access to data on local unemployment rates during the period 1975-1992 was obtained from the Department of Employment Permission to access the NES data must
61
be obtained via the UK Data Service and are downloadable at the following link httpsbetaukdataserviceacukdatacataloguestudiesSearch=new20earnings20surveyampRows=10ampSort=1ampDateFrom=440ampDateTo=2020ampPage=1 (link last accessed on 28 March 2020) The Nomis website can be freely accessed here httpswwwnomiswebcouk (link last accessed on 28 March 2020) Local area population data compiled by the Home Office and published annually in Criminal Statistics for the period between 1975 and 1992 were sourced from the archives of the LSE Library where both hard and soft copies of the data can be accessed Area-level population data compiled by the Office for National Statistics (ONS) and published annually on the ONS website for the period between 2003 and 2017 were available at the Local Authority (LA) level These data can be freely accessed here httpswwwonsgovukpeoplepopulationandcommunitypopulationandmigrationpopulationestimatesdatasetspopulationestimatesforukenglandandwalesscotlandandnorthernireland (link last accessed on 28 March 2020) Data on local housing tenure duration were obtained from the 1980 General Household Survey which can be accessed via the UK Data Service and are downloadable at this link (last accessed on 09 July 2020) httpsbetaukdataserviceacukdatacatalogueseriesseriesid=200019
e Home Improvement Insurance and Social Behaviour (Table 8 Appendix Tables A1 and A2) Individual level data on homeownership expenditure individual and property characteristics income employment status and locality of residence used in Table 8 were obtained from the British Crime Survey (BCS) 1988 Access to the BCS 1988 data must be obtained via the UK Data Service and are downloadable at the following link httpsbetaukdataserviceacukdatacataloguestudiesstudyid=2706amptype=Data20catalogue (link last accessed on 28 March 2020)
f Election Results Data on the Conservative vote share in Local Elections for the period 19956 to 201415 are sourced from the British Local Elections Database maintained by the University of Plymouth UK The Conservative vote share is calculated as the proportion of all votes cast in the election for Conservative candidates Ware L Rallings C Thrasher M (2006) British Local Election Database 1889-2003 [data collection] UK Data Service SN 5319 httpdoiorg105255UKDA-SN-5319-1 (link last accessed on 28 March 2020)
g House Prices
House price data is obtained from the UK Land Registry House Price Index (HPI) the UKrsquos official house price index The HPI uses house sales data from HM Land Registry Registers of Scotland and Land and Property Services Northern Ireland and is calculated and maintained by the Office for National Statistics Local Authority house price index values were extracted from the HPI Full File For further details see httpslandregistrydatagovukappdocukhpi (link last accessed on 28 March 2020)
Figure A1 Correlation between Public House building in 1945-64 and Bombs per Dwelling dropped during World War II by Borough in London
Coeff (se) = 2915 (1337)
0
005
01
015
02
Frac
tion
Pub
lic H
ousi
ng in
194
5-64
0 0005 001 0015 002 0025Bombs per Dwelling
Borough Linear Fit
LondonPublic Housing vs Bombs per Dwelling during World War II
Notes The figure shows for each Borough in London the public houses built from 1945-64 as a fraction of the residential stock plotted against the average number of bombs per dwelling A linear function fitting the correlation between the Borough-specific average number of bombs per dwelling and the public housing built from 1945-64 as a fraction of the residential stock is also shown in the figure
63
Figure A2 Residential Housing Stock in 1980 by Local Authority (LA)
a) Public Housing Stock ( Residential Stock)
b) Public Housing Stock (N) c) Residential Stock (N)
Notes Data from 344 Local Authority (LA) Districts in 1980 Panel a shows public housing stock in 1980 within the LA (shown in Panel b) divided by the total residential housing stock in 1980 within the LA (shown in Panel c)
64
Figure A3 Right-to-Buy Public Housing Sales 1980-1992 by Local Authority (LA)
a) Right-to-Buy Public Housing Sales ( 1980 Residential Stock)
b) Right-to-Buy Public Housing Sales (N) c) Right-to-Buy Public Housing Sales ( 1980 Public
Housing Stock)
Notes Data from 344 Local Authority (LA) Districts Panel A shows total RTB public housing sales in the period 1980-1992 as a percentage of the 1980 residential stock in the LA Panel B shows a count of total RTB public housing sales over the period 1980-1992 in the LA Panel C shows total RTB public housing sales in the period 1980-1992 as a percentage of the 1980 public housing stock in the LA
65
Figure A4 Correlation between Crime in 1980 and Right-To-Buy Public Housing Sales by 1981
Coeff (se) = -0021 (0007)
002
004
006
008
Crim
e in
198
0
0 1-05 05Log Public Housing Sales in 1980-81
Police Force Area Linear Fit
Crime in 1980 vs Public Housing Sales in 1980-81
Notes Figure shows for each Police Force Area (PFA) the crime rate in 1980 plotted against the log sales of public housing under the Right-To-Buy (RTB) scheme by 1981 Crime is defined as total yearly counts of property and violent crime offences per population at the PFA level Property crime defined as total yearly counts of burglary and theft or handling of stolen goods offences per population at the PFA level Violent crime defined as total yearly counts of robbery violent and sexual offences per population at the PFA level A linear function fitting the distribution of PFA-specific crime and RTB sales weighted by PFA-specific population size in 1980 is also shown For each PFA in the analysis the horizontal axis shows the log count of sales of public housing under the RTB scheme by 1981 as a percent of the total residential stock in 1980 whereas the vertical axis shows the crime rate in 1980
66
Figure A5 Correlation between Right-To-Buy Public Housing Sales in 1980-92 and Conservative Share in 1977 Local Elections
Coeff (se) = -0000 (0007)
15
2
25
3
Log
Publ
ic H
ousi
ng S
ales
in 1
980-
92
20 30 40 50Conservative Share in 1977 Local Elections
Police Force Area Linear Fit
Public Housing Sales in 1980-92 vs Conservative Share
Notes Figure shows for each Police Force Area (PFA) the sales of public housing under the Right-To-Buy (RTB) scheme by 1992 plotted against the share of conservative votes in the local elections of 1977 A linear function fitting the distribution of PFA-specific sales and conservative votes weighted by PFA-specific population size in 1980 is also shown For each PFA in the analysis the horizontal axis shows the share of conservative votes in the local elections of 1977 whereas the vertical axis shows the log count of sales of public housing under the RTB scheme by 1992 as a percent of the total residential stock in 1980
67
Figure A6 Right-to-Buy Public Housing Sales in 1980-92 and Public Housing Stock in 1980
Coeff (se) = 0180 (0018)
0
01
02
03
RTB
Pub
lic H
ousi
ng S
ales
in 1
980-
92
02 04 06 0801 03 05 07Public Housing in 1980
Local Authority Linear Fit
Public Housing Sales in 1980-92 vs Public Housing in 1980
Notes Figure shows scatter plot of public housing in 1980 (as a proportion of the Local Authority resident stock) on the x-axis and subsequent Right-to-Buy public housing sales between 1980 and 1992 (as a proportion of the Local Authority residential stock) on the y-axis Binned scatterplot of 344 observations
68
Table A1 Correlation between Right-To-Buy Public Housing Sales and Characteristics of Individuals and Households 1988
(Log) Age
Male White British
Income Group
No Rooms Housing Type
Past Burglary Victimization
(1) (2) (3) (4) (5) (6) (7) RTB Scheme 0055
(p = 0230) 0015
(p = 0713) 0018
(p = 0366) -0031
(p = 0489) 0017
(p = 0802) -0078
(p = 0105) 0005
(p = 0886) County Fixed Effects Yes Yes Yes Yes Yes Yes Yes Effect 55 3 19 -34 04 -69 38 Mean Dep Var Control Group 3614 05 0938 0920 4715 1123 0130 Sample Size 520 520 520 520 520 520 520 Number of Counties 52 52 52 52 52 52 52
Notes Treatment group defined as homeowners who rented from the council the property in which they currently reside prior to buying it Control group defined as council tenants who currently intend to buy the public property in which they reside within two years Standard errors were clustered at the county level and p-values from Wild Cluster Bootstrap are reported in parentheses Effect calculated as estimated coefficient divided by mean of dependent variable in the control group (council tenants who intend to buy the public property in which they reside within two years) reported here indicates significance at 1 indicates significance at 5 indicates significance at 10
69
Table A2 Correlation between Right-To-Buy Public Housing Sales and Crime Victimisation 1988
Crime Victimisation (1) (2) (3) (4) (5) (6) Effect Effect Effect RTB Scheme -0202
(p = 0002) -249 -0171
(p = 0059) -211 -0193
(p = 0005) -238
RTB Share -0013 (p = 0430)
-16
County Fixed Effects No Yes No Mean Dep Var Control Group 0810 0810 0810 Sample Size 1058 1058 1058 Number of Counties 53 53 53
Notes Treatment group defined as homeowners who rented from the council the property in which they currently reside prior to buying it Control group defined as council tenants who currently intend to buy the public property in which they reside within two years For each respondent RTB Share calculated as share of other treatment group respondents at the county level (leaving out the respondent herselfhimself) Standard errors were clustered at the county level and p-values from Wild Cluster Bootstrap are reported in parentheses Effect calculated as estimated coefficient divided by mean of dependent variable in the control group (council tenants who intend to buy the public property in which they reside within two years) reported here indicates significance at 1 indicates significance at 5 indicates significance at 10
Recent Issues All CFS Working Papers are available at wwwifk-cfsde
No Authors Title
650 Atsushi Inoue and Lutz Kilian Joint Bayesian Inference about Impulse Responses in VAR Models
649 Lutz Kilian Understanding the Estimation of Oil Demand and Oil Supply Elasticities
648 Lutz Kilian Nikos Nomikos and Xiaoqing Zhou
A Quantitative Model of the Oil Tanker Market in the Arabian Gulf
647 Lutz Kilian and Xiaoqing Zhou Does Drawing Down the US Strategic Petroleum Reserve Help Stabilize Oil Prices
646 Lutz Kilian and Xiaoqing Zhou Oil Prices Exchange Rates and Interest Rates
645 Lutz Kilian and Xiaoqing Zhou Oil Prices Gasoline Prices and Inflation Expectations A New Model and New Facts
644 Olivia S Mitchell Building Better Retirement Systems in the Wake of the Global Pandemic
643 Volker Bruumlhl Mehr Nachhaltigkeit im deutschen Leitindex DAX - Reformvorschlaumlge im Lichte des Wirecard-Skandals
642 Refet S Guumlrkaynak A Hakan Kara Burccedilin Kısacıkoğlu and Sang Seok Lee
Monetary Policy Surprises and Exchange Rate Behavior
641 Sergey Kovbasyuk and Marco Pagano Advertising Arbitrage
640 Sylwia Hubar Christos Koulovatianos and Jian Li
The Role of Labor-Income Risk in Household Risk-Taking
- September 2020
- Abstract
-

2
The RTB policy had a significant impact on housing tenure as it dramatically changed
the ownership composition of housing in the country It was largely responsible for an increase
in the UK homeownership rate from around 60 in 1979 to over 70 in the early 2000s
Specifically whereas around 32 of dwellings in the UK were publicly-owned in 1979
totalling some 62 million properties by the early 2000s around 28 million of these properties
had been sold to their tenants (Jones and Murie 2006) Although an innovative and large scale
policy RTB has until recently been little analysed (but see Disney and Luo 2017) Analysis
of RTB is useful to derive policy prescriptions that extend beyond the UK as the RTB scheme
shares many of the same characteristics as reforms implemented in Israel (eg Hausman
Ramot-Nyska and Zussman 2020) Sweden (Sodini Van Nieuwerburgh Vestman and Von
Lilienfeld-Toal 2017) and multiple post-Communist countries
This paper studies the causal impact of the RTB policy on local crime rates The
empirical analysis uses large-scale data from all regions in England and Wales from the early
1970s to the late 2010s in order to utilise the RTB policy as a nationwide policy experiment3
The bulk of public house sales occurred in the 1980s and area-level sales of public housing
were matched to crime data over several decades to estimate both the short-run and long run
effects of homeownership on crime The analysis shows that the large movements in housing
tenures induced by the RTB led to lasting falls in crime rates for certain types of crime
An important contribution of this study is to document the mechanism behind the crime-
reducing effect of sales of public housing in local areas It shows that the reduction in crime
rates was driven primarily by behavioural changes within the local community rather than a
lsquoreshufflingrsquo of households between low and high crime areas which might have had a smaller
effect on overall crime This is in contrast to the focus of many recent studies of the crime-
reducing effect of gentrification (eg Autor Palmer and Pathak 2019) whereby changes in
the composition of households induced by inward and outward migration are thought to explain
local trends in crime rates Our study thereby reveals a novel means not documented to date
by which subsidised homeownership and housing policy may have contributed to the decline
because where property is widely owned freedom flourishes Since we took office in 1979 17 million more people have come to own their homes mdash 17 million more sole kings upon their own sole ground That increase is one of our proudest achievementshellip But a house is more than this It is a symbol of security and a stake in the future People who own houses do so not just for themselves but for their children They do so as members of a responsible society mdash proud of the heritage derived from the past glad to care for it and eager to give the next generation a bit of capital to give them a startrdquo (See httpswwwmargaretthatcherorgdocument105815) 3 The analysis covers only England and Wales owing to a need for comparable crime data which is not available for Scotland and Northern Ireland
3
in crime in the United States and other Western economies in the 1990s and early 2000s (see
Van Dijk and Vollaard 2012)
The RTB experiment provides a unique opportunity both to assess the effectiveness of
selling public housing to grant homeownership rights to families in public housing and to
measure the causal impact of sales of public housing on crime outcomes From the perspective
of a policy maker designing a policy that would alter homeownership rights for the general
population the parameters estimated here are directly of interest4 As such this study
complements the literature that has examined neighbourhood effects on crime by exploiting
the variation in residential locations induced by the Moving To Opportunity (MTO) experiment
in the United States and by other housing policy initiatives in Western economies5
The study of the causal impact of homeownership on crime exploits the unfolding of
the RTB policy and it is investigated separately in the short-run and in the long-run To estimate
the short-run impact of the RTB policy on crime difference-in-differences specifications
exploit the differential intention-to-treat (ITT) effect of the RTB policy across localities RTB
was introduced as a national policy but the intensity of treatment across localities varied with
the predetermined length of tenure duration of incumbent tenants in public housing We explain
how these differences in average tenures across localities arose in the later part of Section 2
Tenure duration determined access to the policy with a minimum tenure duration requirement
of three years together with larger purchase price discounts for those with longer tenures
Variations in the length of tenure duration in public housing at the start of the RTB policy are
shown to be unrelated with other local area socio-economic circumstances such as
unemployment wages fraction of juveniles and fraction of public housing they arise from
historical locality-specific factors and this variation is a key part of the research design
Estimates reveal sizeable negative short-run effects of increased incidence of RTB sales
of public housing on crime The crime reduction appears sizeable since the early 1980s and it
remains visible in the late 1980s and early 1990s until the end of the Thatcher era These short-
run estimates uncover an elasticity of crime with respect to RTB incidence of roughly -03 so
4 Homeownership is likely to have important implications also for intergenerational mobility a link that until recently has been little analysed (see Blanden and Machin 2017 and Bell Blundell and Machin 2018) 5 See eg Katz Kling and Liebman (2001) Ludwig Duncan and Hirschfield (2001) Kling Ludwig and Katz (2005) Ludwig and Kling (2007) Kling Liebman and Katz (2007) Sanbonmatsu Ludwig Katz Gennetian Duncan Kessler Adam McDade and Lindau (2011) Ludwig Duncan Gennetian Katz Kessler Kling and Sanbonmatsu (2013) Sciandra Sanbonmatsu Duncan Gennetian Katz Kessler Kling and Ludwig (2013) Damm and Dustmann (2014) Bernasco de Graaf Rouwendal and Steenbeek (2017) and Rotger and Galster (2019)
4
that a 10 percent increase in incidence of RTB public housing sales reduces crime by around 3
percent This conclusion is robust to a battery of additional tests including variations in the
specification of the econometric model We explain in later sections how we deal with the
obvious issue of feedback insofar as local crime rates may affect the willingness of public
tenants to exercise their right to purchase their public house through the RTB policy
The paper examines other potential mechanisms that could underlie the finding that
RTB purchases reduce crime rates These hypothesised channels include varying local area
circumstances local household compositional changes arising from the RTB policy and the
potential role of feet-dragging practices in certain localities arising from the political affiliation
of the local authorities responsible for administering the policy at the local level The findings
suggest that none of these factors explains the crime reduction generated by the RTB policy
The market value of the RTB sales at the onset of the scheme does not predict the evolution of
crime either suggesting that the crime reduction attributed to the RTB scheme is genuine and
it is not the spurious result of better amenities in areas with more RTB sales
By contrast the findings are strongly indicative of the likelihood that local communities
were induced to change their behaviour and attitudes towards criminal activity Indeed as
suggested in the quote by Margaret Thatcher cited previously this was one of the aims of the
RTB policy That is to give (generally) working class households access to an owned asset in
order to change their behaviour such as taking greater care of and improving the security of
their property and to change their economic position by giving these households a collateral
asset in financial markets Hence RTB was viewed as a mechanism for improving and
upgrading the economic position of households in neighbourhoods that had been previously
dominated by public housing
The analysis reveals that immediate reductions in crime resulted from the RTB policy
These are very unlikely to be attributable to in-migration as the rules of the RTB scheme
effectively barred resale of the RTB-purchased property for a fixed period after purchase We
show that crime rates were reduced immediately after the introduction of the policy and not
once the restraint on resale was no longer binding The analysis also shows that after
purchasing their properties from the local council incumbent ex-tenants started to gentrify their
properties by installing double locks on doors and windows by installing burglar alarms and
by purchasing insurance for their home contents Locality-specific estimates show that
incumbent tenants who bought under the RTB scheme experienced greater crime reduction in
counties in which the RTB scheme was associated with greater home improvement On the
5
other hand they did not become more likely to participate in a neighbourhood watch scheme
suggesting that the RTB policy did not generate detectable changes in social capital The
changing behaviour of incumbent ex-tenants resulting from RTB purchases did not result in
increased victimisation of neighbouring householders nor in a substitution of offenders away
from burglary towards other crimes Results indicate that the RTB policy led to significant
reductions in burglaries and robberies while theft and handling of stolen goods offences as
well as other violent crime offences remained unchanged
The paper next moves on to study the long-run persistence of the impact of the RTB
policy on crime To estimate the long-run crime effects of the RTB policy extended crime data
from 2003 to 2017 are used Instrumental variable regressions are used to quantify the effects
of public housing sales from 1980 to 1992 on the change in the crime rate from 2003 to 2017
Public housing sales are instrumented using variation in the initial public housing stock which
is a valid instrumental variable once the initial level of local crime and contemporaneous
community characteristics are controlled for In line with the short-run estimates long-run
estimates show that localities where the RTB policy triggered larger increases in
homeownership also experienced faster reductions in crime throughout the later period
Additional tests reveal that by 2017 these localities also experienced slower increases
in house prices In the standard definition gentrification arises as middle-class salary earners
displace lower income or unwaged households as a result of rising house prices In the case of
tenure changes induced by RTB sales the long time horizon of this research is required to
identify displacement since it takes time before RTB purchasers who are ex-tenants move on
sell or rent out their properties allowing other households to move into the neighbourhood
However the reduced growth in house prices documented here in areas of high RTB sales is
inconsistent with the standard gentrification story and suggests that the supply-side shock of
low-quality properties entering the housing market induced by the RTB policy outweighed any
displacement of original tenants There is also a political response as by 2017 Conservative
votes increased more rapidly in localities most affected by the RTB scheme This further points
towards RTB resulting in changing attitudes and behaviour of local communities
The rest of the paper is structured as follows Section 2 outlines the relevant literature
and describes the RTB policy In doing so it seeks to emphasise the scale of public housing in
the UK by 1980 (in comparison to say the United States) and to explain why the spatial
distribution of public housing does not simply map into low income areas at the start of the
RTB policy Data sources are described in Section 3 and the empirical analysis is presented in
6
Section 4 Finally section 5 provides a concluding discussion including an important word of
caution in assessing the overall merits of the RTB policy
2 Housing and Crime
i Previous literature
A large spatial crime literature shows that crime rates especially crimes against property are
higher in areas with high concentrations of public housing even when controlling for other
salient characteristics of the resident population This has been a major driver of policy in the
United States towards the replacement of inner city public housing projects by rent subsidies
and by shifting tenants to mixed-tenure low housing density urban neighbourhoods (see for
example Schill 1993 Olsen 2003 and Kling Ludwig and Katz 2005) A similar association
between crime and public housing has been observed in the UK (Murie 1997) More broadly
studies show that increased local homeownership rates are associated with a range of spillover
effects on the locality such as lower crime rates greater civic involvement and improved child
development (see for example DiPasquale and Glaeser 1999 and Haurin Dietz and
Weinberg 2003)
A well-known difficulty in the large literature on housing tenure type household
composition and crime is the range of feedback effects which suggest a number of channels
exist by which crime affects the composition of neighbourhoods and vice versa Cullen and
Levitt (1999) is one of a number of studies that suggest that higher rates of crime especially in
inner cities led to changes in neighbourhood composition by social class and economic status
Much of this literature on the lsquoflight to the suburbsrsquo took place against the backdrop of rising
crime in inner cities in the United States in the 1990s It has been more challenging to show
that falling crime in both earlier and later periods has been the primary driver of the so-called
gentrification of inner city areas (contrast the findings of McDonald 1986 with Ellen Horn
and Reed 2017)
In addition there is robust evidence that higher crime is associated with lower property
values (see Gibbons 2004 for an illustration using data for London) and this feedback effect
will induce spatial equilibria of neighbourhood composition when account is taken of not just
crime rates but other neighbourhood (dis)amenities transport costs and so on For example
Owens Mioduszewski and Bates (2019) show that civil gang injunctions in Southern
California a common type of place-based crime control policy in the area led to approximately
a 3 decline of residential propertiesrsquo values from 2002 to 2015 reflecting individual
7
willingness-to-pay for the civil liberties affected by the injunction6 Morales-Mosquera (2019)
finds that police station openings generate localized crime reductions and housing value
increases in three major cities in Colombia
A large literature has addressed the basic identification problem of assessing
neighbourhood effects on crime by exploiting the variation in residential locations generated
by the Moving To Opportunity (MTO) experiment in the United States Starting in 1994 the
MTO experiment assigned housing vouchers via random lottery to thousands of public housing
residents with children in five cities in the United States to relocate to less-distressed areas
Exposure to violence and crime victimization in distressed areas were in fact key reasons for
low-income families to participate in the MTO experiment Katz Kling and Liebman (2001)
show that the MTO experiment improved childrenrsquos behaviour adult mental health and
perceived safety in treatment group families in Boston while also reducing exposure to
violence and crime victimization Similar findings emerge in Baltimore in the study of Ludwig
Duncan and Hirschfield (2001) who find that the MTO experiment led to a large reduction in
juvenile arrests for violent crimes and to some increase in property-crime arrests
Kling Ludwig and Katz (2005) document important gender differences in the impact
of the MTO experiment on crime While both property and violent crime decreased among
young women young men experienced a decrease in violent crime but also an increase in
property crime a few years after relocating to the new neighbourhood7 Ludwig and Kling
(2007) show the importance of racial segregation among other neighbourhood characteristics
in predicting youth violence while Kling Liebman and Katz (2007) document the beneficial
impact of the MTO experiment on the education risky behaviour and physical health of young
women As the opposite effects are found for young men their findings further suggest that
young men and women respond differently to similar new neighbourhood circumstances
Using more recent data Sanbonmatsu et al (2011) conclude that the MTO initiative
enhanced safety in treatment group families while Ludwig et al (2013) find gender differences
in the impact of the MTO experiment on risky behaviour and health of juveniles to persist 10-
15 years after the start of the experiment while finding no evidence of persistent reductions in
youth violence rates However Sciandra et al (2013) show little evidence of crime reductions
6 Grogger (2002) and Ridgeway Grogger Moyer and MacDonald (2018) are two earlier studies of the effects of gang injunctions on crime 7 The comparative advantage of juveniles relocated from disadvantaged backgrounds in exploiting the available property-crime opportunities in their new neighbourhoods and the different ways in which male and female juveniles respond to similar new neighbourhood circumstances help the authors rationalize these findings
8
in the long run as neighbourhood conditionsrsquo effects of MTO dissipate reflecting that crime is
more affected by contemporaneous neighbourhood circumstances than by past neighbourhood
circumstances8 To understand why low-income families remain segregated into high-poverty
areas Bergman et al (2020) randomly allocate housing vouchers to 430 recipient families with
a child in the Seattle and King County areas concluding that barriers in the housing search
process are a critical source of residential segregation by income
Our findings on homeownership also relate to Engelhardt et al (2010) who analyse an
experiment in Oklahoma that subsidised saving for down payments for homeownership among
a group of low-income individuals using Individual Development Accounts (IDA) with
randomly assigned treatment status In their setting the treatment is the offer of matching
funding to the IDA since only a fraction of those who were treated chose to take up the offer
and to undertake a purchase and of course these may not be a random group among the treated
They find only weak evidence that homeowners who benefited from the policy spent more
money on lsquocommunity-facingrsquo activities such as external improvements to their house or
involvement in civic events in the 30 months after the take-up of homeownership status
Recent studies have sought to estimate the effects of homeownership and gentrification
on crime focusing on neighbourhood composition effects of policy changes Aliprantis and
Hartley (2015) and Sandler (2017) examine the effect on local crime rates in Chicago when
20000 units of concentrated high-rise public housing were demolished over the period 1999
to 2011 Both studies albeit using slightly different methodologies track relocated individuals
to other neighbourhoods and they conclude that these demolitions led to a net reduction in
crime rates ndash primarily violent (gang-related) crime but also theft robbery and use of guns
Chyn (2018) shows the lasting beneficial effects of housing demolitions in Chicago on the
schooling professional and criminal trajectories of displaced individuals Autor Palmer and
Pathak (2019) examine the impact of the deregulation of rents in Cambridge Massachusetts
on local crime rates They hypothesize that rent deregulation raised property values and caused
a differential mix of households to locate across local neighbourhoods thereby
disproportionately reducing the rate of property crime in neighbourhoods that had previously
been subject to rent control They find a significant reduction in crime overall which was then
8 The MTO experiment of course affected also other dimensions of familiesrsquo and childrenrsquos lives Most notably it generated moderate improvements in school quality (Fryer and Katz 2013) as well as educational and economic benefits for young children including for young boys (Chetty Hendren and Katz 2016) Substantial exposure effects of neighbourhoods are also presented in Damm and Dustmann (2014) Bernasco de Graaf Rouwendal and Steenbeek (2017) Altonji and Mansfield (2018) Chetty and Hendren (2018a) Chetty and Hendren (2018b) Rotger and Galster (2019) and Aliprantis and Richter (forthcoming)
9
capitalised into higher property values9 In a related study Diamond and McQuade (2019)
document the crime-reducing effect of the Low Income Housing Tax Credit
Most of the studies that have examined the effects of gentrification on crime exploit
policy changes such as the lifting of rent controls and removal of public housing that led low-
income neighbourhoods to increasingly become middle-income neighbourhoods through
outward migration of low-income households and inward migration of higher-income
households Studies that have examined the impact on crime rates of moving tenants out of
public housing into the private sector in the United States and experiments that gave households
incentives to purchase properties are typically based on highly localised data and results are
obtained from relatively short time periods after implementation of the policy10
The main contribution of this study by contrast is to estimate the effect on local crime
rates of increasing homeownership of indigenous communities and to examine the extent to
which this induced behavioural change in these communities This is a novel means which has
not been documented to date and which complements the existing literature by which
homeownership and housing policy may contribute to reduce crime The RTB policy
constitutes an ideal policy experiment to study this and it is therefore exploited here using
large-scale data over multiple decades
ii Public Housing in England and Wales
The stock of public housing in England and Wales grew rapidly throughout the
twentieth century over the period from the end of World War I in 1918 until the start of the
Right-to-Buy policy in 1980 By 1980 public housing in England and Wales was more
extensive more heterogeneous and more spatially dispersed than in the United States11 These
spatial outcomes arose from the decisions to rebuild outside as well as within inner city areas
in turn stemming from the partially random distribution of war destruction and from the
differential application of planning restrictions across the UK12
9 A recent paper on the UK (Alonso Andrews and Jorda Gil 2019) suggests that crime rates were reduced by expenditures from the Urban Renewal Fund although these expenditures did not directly involve changes in housing tenure their idea is closely related to the lsquoneighbourhood externalitiesrsquo argument 10 The reviewed literature examining the MTO experiment constitutes an exception 11 For examples of the heterogeneous nature of public housing across towns see Table 1 in Disney and Luo (2017) 12 For evidence on the continued important role of planning restrictions on private housing supply in England see Hilber and Vermeulen (2014)
10
Figure 1 illustrates housing tenure shares by tenure types in England and Wales
between 1918 and 2011 As illustrated in the Figure in 1918 more than three-quarters of
residential housing in England and Wales was privately rented with public housing accounting
for only 1 of the housing stock As a result of a public sector building program and the
development of the mortgage market both private homeownership and public renting
(primarily from local public authorities) rose steadily until 1980 by which time private renting
had shrunk to a little over one tenth of housing tenure While the increase in homeownership
prior to 1980 is mostly explained by the development of a formal mortgage market in the
deepening retail financial sector two main factors explain the increase in public housing prior
to 1980
First municipal government investment programs developed after the World War I
Much of the stock of privately-owned housing which was rented out was in very poor
conditions post-1918 Replacement of the housing stock was hindered by high re-building costs
coupled with borrowing constraints for many small landlords (Disney and Luo 2017) Under
the Housing and Town Planning Act 1919 much of the responsibility for replacement housing
and slum clearance was taken over by local authorities However replacement public housing
was not simply built in inner-city areas where slum clearance had taken place but also in so-
called suburban lsquogardenrsquo estates and even lsquogarden townsrsquo located on greenfield sites Some of
these sites were developed as large-scale public housing projects often with low-density low-
rise properties others in mixed estates with a mixture of public and private housing Later in
the interwar period as economic conditions improved local authorities reverted to replacing
inner-city slums with local high-rise buildings in the same neighbourhood while private
developers tended to build in suburbs and rural areas13 However planning (zoning) restrictions
which tend to be much tighter in the UK than in the United States limited the growth of private
housing in some areas
Second a further impetus to public housebuilding occurred after 1945 Between 1939
and 1945 around four million homes in the UK were destroyed or seriously damaged by
bombing Although bombing campaigns were initially targeted at military targets during 1939-
45 they gradually evolved into area bombing strategies focusing on cities Until near the end
of the World War II bombing (by all sides) was notoriously inaccurate lacking precision
instruments for target identification Target visibility relied on key geographical features such
13 For further discussion see httpsfetuweacukconwebhouse_agescouncil_housingprinthtm and Jones and Murie (2006)
11
as coasts and large rivers and towns and cities in such localities were bombed heavily Other
areas remained relatively unscathed because of weather conditions distance counter-jamming
measures lsquofakersquo fires lit to divert bombers to relatively uninhabited areas and so on14 This
scattering of war destruction implies that there was a random element to where replacement
housing was required once the hostilities had ended As a result of war damage many areas
saw the rapid construction of publicly-owned housing estates to replace damaged and destroyed
homes This link at the local level between bombing and public housebuilding is illustrated in
Figure A1 in Appendix A which uses official Bomb Census data from
httpbombsightorgdatasources to show that the location of bombings across boroughs in
London during the World War II is a significant predictor of where publicly-owned housing
estates were built in the post-war period in London
The somewhat random nature of bombing is illustrated by the fact that whilst areas that
were targeted such as the London Docks already contained high-density low income housing
bombs also fell heavily in the more affluent boroughs of south and south east London which
thereby constructed more public housing after 1945 than equally affluent suburbs to the north
of the capital Other areas where major rebuilding took place were also mixed-income
communities Nevertheless after the post-war reconstruction period that lasted well into the
1950s new public properties tended to be built to replace slums in low-income
neighbourhoods often as high-rise developments with private housebuilding being the
dominant feature of more affluent areas By 1980 close to one-third of the residential housing
stock in England and Wales was public housing
For the analysis that follows in particular to understand the identification strategy that
is taken it is very important to understand how a household accessed a public house and how
the length of tenure within public housing was determined Policies varied between local
authorities but priority for access to public housing would initially be given to local residents
who required rehousing as a result of slum clearance or war destruction Thereafter most local
authorities operated a queuing system by which eligibility depended on evidence that the
person or household would otherwise be homeless on family size and on means of household
income support if any Local residents were prioritised The extent of rationing (waiting time)
for public housing if any in a given area would depend on the supply of public housing that
had been constructed relative to demand Incoming applicants from outside the local authority
14 There is a vast literature on this An early volume that revealed efforts to thwart the accuracy of the German bombing campaign is Jones (1978)
12
area would typically be at the back of the queue In turn residents already within public housing
could apply to move from one public property to another ndash typically by requesting lsquoupgradingrsquo
as a nicer property became available ndash for example a house with a yard or garden rather than
an apartment Tenure within any given property would therefore depend on the availability and
heterogeneity of the public housing stock within an area
iii The ldquoRight to Buyrdquo Policy
Shortly after Margaret Thatcherrsquos election as UK Prime Minister the Housing Act 1980
introduced a statutory Right to Buy (RTB) for public tenants with at least 3 yearsrsquo tenure
duration in their council house ndash lsquostatutoryrsquo in the sense that the policy had to be implemented
by all local councils (previously a few Conservative councils had allowed their tenants to buy
their public property generally at market price) The RTB policy allowed tenants to buy their
properties at substantial discounts to market value ranging from 33 with three yearsrsquo
residence to a maximum of 50 after 20 yearsrsquo residence Local councils were also obliged to
make mortgages available to would-be purchasers although this feature became less pertinent
as capital markets were liberalised during the 1980s The discount on the sale price would be
repayable if the property was resold within five years of an RTB purchase although a
purchased property could be rented out
There were additional constraints in the 1980 legislation particularly in relation to the
sale of publicly-owned apartments but these too were relaxed in the mid-1980s Purchase of
public housing under RTB also became more attractive with later efforts to raise heavily-
subsidised rents on public tenancies towards lsquomarketrsquo levels15 Figure 2 indicates the pattern of
sales under the RTB policy in England (the other UK nations had similar patterns ndash indeed the
large stock of public houses in Scotland was sold even more rapidly leading to a blanket ban
on further sales by the Scottish government some decades later) The two peaks in sales in the
1980s are associated with the introduction of the RTB policy and its liberalisation in the mid-
1980s thereafter with the better-quality tenants (and public housing) having moved into the
private sector the rate of sales declines
The Thatcher era ended in 1992 and the incoming Labour government in 1997 did not
attempt to reverse the policy completely but did tighten eligibility conditions limit access to
publicly-provided mortgages and impose caps on the maximum discounts in some areas where
15 The economic incentives implied by these various policies are explored at some length in Disney and Luo (2017) but not considered in detail here
13
sales had diminished the public housing stock quickly (since local authorities still had a
statutory responsibility to house homeless families) On the other hand the government also
introduced a similar but less generous version of RTB known as lsquoRight to Acquirersquo which
allowed tenants in some cases to purchase public housing (typically managed by lsquoarms lengthrsquo
housing associations and charities rather than directly by local public authorities) This led to
a brief upsurge in sale volumes as illustrated in Figure 2 although sales continued in any event
as public tenants acquired sufficient yearsrsquo residency in their property to be eligible for the
RTB scheme
Not surprisingly RTB purchases were selective both by household type and by quality
of property For example in Derby a prosperous town in mid-England which has traditionally
specialised in high-end manufacturing since at least the 1920s over 80 of the large stock of
public properties in 1980 were in the form of detached semi-detached or terraced housing in
suburbs and less than 20 in the form of (mostly) high-rise apartments in the inner city By
1991 27 of Derbyrsquos stock of public housing had been sold off with apartments now
constituting nearly 30 of the residual stock
In contrast in Hackney an inner London borough in 1980 around 80 of the public
housing stock was in apartments mostly in high-rise estates By 1991 most of the non-
apartment stock in Hackney had been sold off but the overall stock of public housing had
increased because the local council had constructed or purchased further apartments RTB
purchasers themselves were typically older had higher incomes and they were less likely to
be unemployed (Gregg Machin and Manning 2004) Hence sales of public houses were
evidently non-random and related to local crime rates resulting in a well-known endogeneity
issue in the regression analysis that is addressed empirically in Section 4
3 Data
Our empirical analysis combines multiple data sources at annual frequency Housing data are
provided by the Chartered Institute of Public Finance and Accounting (CIPFA) The data are
provided at the Local Authority (LA) level for the 314 LAs in England and Wales in 198016
The data include details of the composition of the residential housing stock (owned privately
rented and public housing) and the number of sales under the Right-to-Buy (RTB) scheme in
each year LAs had a statutory requirement to report RTB sales to CIPFA and provide details
16 The number of LAs changes over time due to some mergers and due to boundary redrawing There were 314 LAs in England and Wales in 1980 at the onset of the RTB policy
14
of the revenue flow received from the sales Data on average length of tenure duration in public
housing by locality in 1980 are derived from the UK General Household Survey (GHS)
Two sources of crime data complement the housing data The short-run analysis which
covers the period 1975 to 1992 uses administrative crime records collected by the police and
published annually by the UK Home Office in Criminal Statistics This period spans five years
prior to the introduction of the RTB policy in 1980 through to the end of the period of
Thatcher-led Conservative governments in 1992 These data are provided at the Police Force
Area (PFA) geography a geographic unit that sits above and nests LAs17 With the sole
exception of Londonrsquos financial district commonly known as ldquothe City of Londonrdquo and which
constitutes an independent PFA data are used for all 42 PFAs that exist in England and
Wales18
The long-run analysis which covers the period 2003 to 2017 draws upon
administrative crime records at the LA level recorded by the police and published online by
the UK Office for National Statistics (ONS) The long-run analysis starts in 2003 because there
was a very substantial change in reporting rules in the late 1990s and early 2000s in the UK
that had different effects across PFAs and crime types Thus it is not possible to use police
recorded crime data before and after 2002 in the same analysis The City of London PFA is
also excluded from the long-run analysis For both the short-run and long-run analyses the
measures of crime used in the empirical analysis are the numbers of recorded offences of
different crime categories per population Thus the data capture incidents of crime recorded
and classified by all UK local police forces The data contain offence rates for five crime
categories property crime defined as the sum of burglary and theft and handling of stolen
goods offences and violent crime defined as the sum of violence against the person sexual
offences and robbery offences
The LA-level housing data were combined with the crime data to create two data sets
for the analysis For the short-run analysis running from 1975 to 1992 the LA-level crime data
were aggregated at the PFA level using the ONS Open Geography database and then joined to
the PFA-level crime data The construction of the short-run panel is not affected by changes in
LA geographical boundaries as in all cases these occur within PFA units Hence a balanced
17 For example London LAs sit within the Metropolitan Police PFA 18 The City of London constitutes an additional PFA that is independent from the rest of London However this PFA is excluded from this analysis because most property in the area is non-residential hardly anybody lives there and consequently few RTB sales took place there
15
panel of 42 PFAs spanning 18 years was obtained with the PFA-year being the unit of analysis
Data from the GHS on tenure were matched to PFA from regional data subdivided into lsquoruralrsquo
lsquourbanrsquo and lsquomixed urban-ruralrsquo areas
For the long-run analysis (2003 to 2017) which uses a long-difference model
observations of the change in crime measured at the LA level for the period 2003-2017 were
joined with observations of total RTB sales also at the LA level for the period 1980-1992 Not
all observations could be joined due to changes in LA geographical boundaries that preclude a
one-to-one mapping between LAs in the earlier and later period This analysis is therefore
based on 293 observations that could be joined between the earlier and latter periods
These data sources were complemented with administrative records of local area
conditions In the short run analysis data from the New Earnings Survey (NES) and the
Department for Employment were used to calculate local area conditions from 1975 to 1992 in
each PFA In the long run analysis local area conditions at the LA level from the Annual
Population Survey (APS) complement the housing and crime data19
i Summary Statistics
Summary data for the composition of the housing stock in 1980 just prior to the RTB
policy start are provided in the first five rows of Table 1 On average 272 of all residential
properties in a PFA were publicly-owned equating to approximately 14000 individual
properties per LA More than 1 of all residential properties were sold under the RTB scheme
by 1981 ie in the first year of the policy20 A key criterion for eligibility to the RTB scheme
and for the size of the discount on the market value of public properties was the length of tenure
duration in public housing of incumbent tenants Table 1 shows that on average incumbent
tenants in 1980 had spent 11 years in their public properties with some areas featuring much
larger average years of tenure duration than others The distribution of the public housing rate
as well as of public housing sales and tenure duration in 1980 are heterogeneous across PFAs
The data show a quite high standard deviation of public housing stock as a proportion of the
residential stock (the standard deviation shown in Table 1 is 86) as well as some outlier
LAs ndash in 10 of LAs public housing accounted for more than one third of the residential
housing stock
19 Additional details of the data used in the empirical analysis and instructions for data access are provided in the Appendix 20 Our data are for England and Wales The higher proportion of the public housing stock at the start of RTB for the UK arises from the initial high levels of public houses in Scotland and Northern Ireland
16
Figure A2 Panel A in Appendix A illustrates the distribution of public housing across
LAs in 1980 (expressed as a percentage of the residential housing stock) Panel B illustrates
the distribution of public housing in absolute terms and Panel C shows the distribution of
residential housing in absolute terms Similarly Figure A3 Panel A in Appendix A illustrates
the distribution of public housing sales across LAs in the 1980s-90s (expressed as a percentage
of the residential housing stock in 1980) Panel B illustrates the distribution of public housing
sales in the 1980s-90s in absolute terms and Panel C shows the distribution of public housing
sales across LAs in the 1980s-90s (expressed as a percentage of the public housing stock in
1980) All distributions in Figures A2 and A3 have a long right tail further illustrating the
uneven distribution of the public housing stock public housing sales the total residential stock
and the ratios of these across LAs in 1980
The remaining rows of Table 1 provide summary data for crime rates and other
covariates in 1980 Crime rates are measured as cases per individuals Thus Table 1 shows that
45 criminal offences per 100 individuals were recorded on average in a PFA in 1980 Total
crime is defined as the sum of property crime and violent crime and these measures of crime
are the key outcomes of interest here21 Property Crime defined as the sum of burglary and
theft and handling of stolen goodsrsquo offences is overwhelmingly the most common category of
crime in 1980 Only the most serious types of violent offences such as homicide aggravated
assault sexual offences and robberies were recorded and published by the Home Office since
the 1970s in England and Wales Minor violent offences only started to be recorded in the UK
in the early 2000s Thus violent crime is defined here as the sum of serious violence against
the person sexual offences and robbery
Table 1 also shows four additional variables which are used as covariates in regression
models the local log real hourly wages at the 25th and 50th percentiles of the distribution the
local log unemployment rate and the local share of 15-24 years olds in the population in the
PFA Since potential offenders are likely to earn low wages and have low levels of labour
market attachment (Machin and Meghir 2004) the 25th percentile of log wages and log
unemployment are likely to be relevant features of the labour market in the determination of
criminal activity while the 50th percentile of log wages is also included to depict the
distribution of wages Finally Table 1 also suggests that approximately 16 of the overall
population is aged 15 to 24 Since the likelihood to commit crime is observed almost
21 The analysis does not include drugs offences as no data on drugs offences in England and Wales was collected and published by the UK Home Office for the period of this study
17
universally to be highest in the late teens and then decrease later in life (Quetelet 1831 and
Landersoslash Nielsen and Simonsen 2016) the fraction of individuals aged 15 to 24 in the
population is also likely to be a relevant determinant of the local criminal activity
4 Empirical Analysis
i Public housing and crime in the initial conditions
The analysis of the relationship between density of public housing and crime rates prior to the
introduction of the Right-to-Buy (RTB) policy is a natural starting point to the empirical
approach Figure 3 illustrates the relationship between the public housing rate (the percentage
share of public housing in the residential housing stock in the PFA) and the crime rate for the
42 PFAs included in the analysis in 1980 A clear positive association appears between the
concentrations of public housing and crime across PFAs in England and Wales with the size
of the dots on the scatter plot illustrating the PFArsquos population size in 1980 The positive
relationship between the public housing rate and the crime rate in Figure 3 is statistically
significant at all conventional levels Using the same data an OLS regression of the following
form was also estimated
119862119862119894119894 = α + β1119867119867119894119894 + β2119935119935119894119894 + ϵ119894119894 (1)
where 119862119862119894119894 is the crime rate in PFA 119894119894 119867119867119894119894 is the public housing stock as a proportion of the
residential housing stock 119935119935119894119894 is a vector of PFA level variables and ϵ119894119894 is the error term Equation
(1) was estimated for total crime as well as separately for property crime and violent crime
Estimates of Equation (1) are shown in Table 2 The Table shows estimates of crime as
a function of the public housing stock (expressed as a proportion of the residential stock)
Columns (2) (4) and (6) additionally control for the log real hourly wages at the 25th and 50th
percentiles of the distribution within the PFA the log unemployment rate in the PFA and the
share of 15-24 year olds in the population in the PFA Public housing is positively and precisely
correlated with all crime outcomes The coefficient on total crime in column (2) of 0064
implies that a 01 unit increase in the size of the public housing stock measured as a proportion
of the residential stock in the PFA in 1980 (approximately a one standard deviation increase)
is associated with an increase in the crime rate of 00064 units equating to approximately half
of one standard deviation increase in crime The positive correlation between public housing
and criminality is not affected by the inclusion of local area variables in Equation (1)
ii Identification issues
18
The primary object of this study is to quantify the causal impact of homeownership on
crime rates In our empirical setting the Right-to-Buy (RTB) policy can be interpreted as a
relaxation of a supply constraint on available property for homeownership by allowing public
housing tenants to purchase their homes at a subsidy Of course this policy does not directly
generate a pure natural experiment in observed RTB sales for at least two reasons First there
may be important time-varying omitted factors that drive both the decision by a tenant to
purchase the house and the local crime rate Second RTB sales are a result of demand for
public housing purchases together with the local supply of housing for sale With demand being
determined at least in part by local crime rates OLS estimates of the relationship between
crime rate and public housing sales will suffer from endogeneity bias It is very likely that the
decision by the tenant to purchase the house may itself be partly determined by the level and
dynamics of local crime Indeed unsurprisingly a negative relationship appears between crime
rates and public housing sales in 1980 in Figure A4 in Appendix A further suggesting that
RTB sales were not orthogonal to crime rates at the onset of the RTB policy
iii Short-run estimates
a Empirical strategy
Our empirical strategy exploits two approaches to estimating the effect of sales of
public housing on crime rates that isolate supply-side variation in exposure to the RTB policy
This variation arises from differences across localities in the potential exposure to RTB sales
The analysis of the short-run impact of public housing sales on crime defines a series of
difference-in-differences specifications whereby the years of tenure duration in public housing
of incumbent tenants in 1980 are used to proxy the Intention-To-Treat (ITT) intensity of the
RTB treatment at the PFA level The national level policy albeit introduced uniformly across
localities in 1980 was specified in such a way that eligibility to the RTB scheme and the size
of the discounts varied across localities depending on the average number of years spent in
public properties by the incumbent tenants prior to the reform
In particular the Housing Act of 1980 introduced a statutory right to buy for public
tenants with at least three yearsrsquo tenure duration in their public house Moreover discounts on
the sale price relative to the market value of the property linearly increased with public housing
tenure duration ranging from 33 percent for public housing tenants with three yearsrsquo residence
through to a maximum of 50 percent after twenty yearsrsquo residence Thus the discounts to
purchase a public property generated by RTB were directly related with the years of tenure
19
duration in public housing when the RTB scheme was introduced and years of tenure duration
in public housing in 1980 constitutes a predetermined source of differential exposure to the
RTB scheme that could not be gamed in 1980
In Columns (7) and (8) in Table 2 equation (1) is re-estimated and the fraction of public
housing in the PFA the log real hourly wages at the 25th and 50th percentiles of the distribution
within the PFA the log unemployment rate in the PFA and the share of 15-24 year olds in the
population in the PFA are used to predict log average years of tenure duration in public housing
in the PFA in 1980 As Table 2 shows none of these variables predicts public housing tenure
duration in 1980 suggesting that its distribution across regions and thus RTB eligibility in 1980
is orthogonal to local area circumstances and the average socio-economic status of individuals
Combined with the fact that RTB came into force shortly after the 1979 election of the new
Thatcher Government and people in the 1970s could not freely move across public properties
(especially between local authorities) but rather had to apply and join a potentially long queue
prior to being able to move in and out of public properties this makes the distribution of RTB
eligibility at the onset of the policy quasi-random
Eligibility to the RTB scheme and in turn intensity of adoption varied across regions
according to the composition of the local housing stock which was determined by historical
factors Public housing sales under the RTB policy began in most LAs in October 1980 (the
1980 Housing Act was passed on 8 August with most LAs starting to process applications for
public housing purchases soon thereafter) Figure 2 shows that the RTB policy resulted in an
initial peak in public housing sales from October 1980 to 1982 after which RTB sales
continued at a slower pace The initial eligibility to the RTB scheme was mainly responsible
for this and it is therefore exploited empirically in the econometric analysis
Since the discount on the sale price would be repayable if a property was resold within
five years of an RTB purchase and the RTB scheme was extended to flats in 1986 the short-
run analysis is conducted separately on the first five years of the RTB scheme ie up until
1985 and on the entire Thatcher era ie up until 1992 When the analysis is restricted to the
first five years of the RTB scheme years of tenure duration in public housing of incumbent
tenants in 1980 are also used as an instrumental variable (IV) for the actual sales of public
housing under the RTB scheme in the first year of the RTB scheme The same IV approach is
not used for later years because starting from 1986 the possibility that properties bought under
the RTB scheme were resold in the private market cannot be ruled out ex ante
20
Figure 4 illustrates a strong positive correlation between the log average years of tenure
duration in public housing in the PFA in 1980 (on the x-axis) and the log percentage of the
residential stock in the PFA which was sold-off in the first year of the RTB scheme ie by
1981 (on the y-axis) These initial sales of the residential stock in the first year of the RTB
scheme are also shown in Figure 5 to be positively correlated with the percentage sold-off
between 1980 and 1992 (on the y-axis) Therefore while RTB public housing sales by 1992
may be the endogenous result of the evolution of crime post 1980 and thereby result in a well-
known problem of reverse causation in our estimates the public housing tenure duration in
1980 constitute an ITT proxy that strongly predicts the actual intensity of the RTB scheme at
the PFA level
For this analysis data on crime rates public housing tenure duration and local area are
used from 1975 to 1992 The estimating difference-in-differences specification can be
expressed as follows
119862119862119894119894119905119905 = αi+αt + 1205731205731 lowast 11987711987711987711987711987711987711989411989480 + 1205731205732 lowast 119875119875119875119875119875119875119875119875119905119905 + 1205731205733 lowast 11987711987711987711987711987711987711989411989480 lowast 119875119875119875119875119875119875119875119875119905119905 + 1205731205734119935119935119946119946119946119946 + 120598120598119894119894 (2)
where 119862119862119894119894119905119905 is the crime rate in PFA i in each year t from 1975 to 1992 αi is a set of PFA fixed
effects and αt is a set of year fixed effects 11987711987711987711987711987711987711989411989480 is log average years of tenure duration in
public housing ie a measure of RTB eligibility in 1980 defined both as a continuous variable
and as a binary variable indicating if average years of public housing tenure duration in PFA i
were greater than or equal to the median value of average years of public housing tenure
duration at the national level in 1980 Post is a dummy variable that takes up value 1 starting
from 1980
The main estimand of interest is 1205731205733 the coefficient associated with the interaction
between 11987711987711987711987711987711987711989411989480 and Post which measures the impact of the initial RTB eligibility-induced
shock to homeownership on crime A negative coefficient associated with 1205731205733 would imply that
PFAs that experienced greater RTB eligibility in 1980 experienced lower relative crime rates
by 1992 due to the RTB scheme This parameter is directly of interest to a policy maker wishing
to modify homeownership rights for the general population as tenure duration in public
housing was an explicit predetermined policy criterion in the Housing Act of 1980 that could
not be gamed in the short run and that determined eligibility to the RTB scheme
The causal interpretation of 1205731205733 crucially relies on the absence of differential pre-
treatment trends between PFAs exposed to different degrees of RTB eligibility in 1980 Insofar
as RTB eligibility in 1980 does not predict crime trends prior to the RTB policy then 1205731205733 can
21
be interpreted as the ITT causal impact of the RTB policy on crime The potential presence of
differential pre-treatment crime trends between PFAs that experienced different degrees of
RTB eligibility is tested and results are presented below Finally 119935119935119946119946 is a vector of local area
controls measured in 1980 and interacted with the Post variable which includes the fraction of
public housing in the PFA the log real hourly wages at the 25th and 50th percentiles of the
distribution within the PFA the log unemployment rate in the PFA and the share of 15-24 year
olds in the population in the PFA while 120598120598119894119894 is the error term Due to the small number of clusters
(42 PFAs) in the analysis p-values were derived for inference from Wild Cluster Bootstrap
estimation with standard errors clustered at the PFA level (see Cameron Gelbach and Miller
2008)
b Short run results
Table 3 presents unconditional difference-in-differences estimates based upon the
dichotomous treatment version of Equation (2) (calculated absent any of the labour market
controls or fixed effects stated in the equation) Panel A shows results for the 1975-85 period
when property resales should have been extremely rare since the discount on the sale price
would be repayable and Panel B shows results for the 1975-92 period In the calculations
PFAs are split into two groups by the magnitude of 11987711987711987711987711987711987711989411989480 in which the above-or-equal-to-
median group is described as the lsquoITT treatmentrsquo group and the below median group is
described as the lsquoITT controlrsquo group Columns 1 and 2 state the pre-1980 average crime rate in
the PFA the post-1980 average crime rate in the PFA and the within-PFA post-pre difference
Column 3 shows the pre-1980 and post-1980 differences between the ITT treatment and ITT
control PFAs Column 4 shows the unconditional difference-in-differences estimate and
column (5) shows the unconditional difference-in-differences estimate deflated by the mean
level of crime in the ITT control group prior to 1980 in percent terms (the unconditional percent
effect) The unconditional difference-in-differences coefficient estimate is negative and
precisely defined in both Panels A and B On average PFAs that experienced RTB eligibility
greater or equal to the national median in 1980 experienced overall crime rates that were 85
lower from 1980 to 1985 and roughly 11 lower from 1980 to 1992
Figure 6 plots the raw data underlying these statistically significant difference-in-
differences estimates The Figure shows average crime rates (weighted by population at the
PFA level) for every year from 1975 to 1992 separately for ITT treatment and ITT control
PFAs The visual inspection of Figure 6 reveals that while crime rates appear on similar trends
prior to 1980 in ITT treatment and ITT control PFAs the gap widened after 1980 with ITT
22
control PFAs experiencing a greater increase in crime rates starting from the early 1980s
Compared with the 1970s a wider gap in crime rates is also observed in the early 1990s when
the short run analysis terminates These unconditional estimates and those in Table 3 suggest
that sales of public housing under the RTB scheme may have helped tackle the nationwide
rising trend in criminality experienced in England and Wales in the 1980s
Table 4 subjects these results to a set of more robust econometric specifications
Columns (1)-(3) show ITT results for the 1975-85 period columns (4) and (5) show IV results
for the 1975-85 period and Columns (6)-(9) show ITT results for the 1975-92 period All
estimated specifications include PFA fixed effects and year fixed effects and the models in
Columns (2)-(5) and (7)-(9) additionally include the interaction between the Post variable in
equation (2) and local area variables measured in 1980 (ie fraction of public housing log of
the unemployment rate log of real hourly earnings at the 25th and 50th percentiles of the
distribution and the fraction of 15-24 year olds in the population) Columns (1) to (8) report
the ITT and IV estimates of 1205731205733 the coefficient associated with the interaction between 11987711987711987711987711987711987711989411989480
and Post in equation (2) whereas the model in Column (9) shows the results separately for the
first eight years of the RTB policy 1980-87 and for the subsequent years that followed the
1987 UK General Elections when Margaret Thatcher was re-elected as UK Prime Minister
1987-92 In all specifications standard errors were clustered at the PFA level and Wild Cluster
Bootstrap techniques were used for inference due to the small number of clusters
Column (1) shows results based upon the dichotomous treatment version of 11987711987711987711987711987711987711989411989480 in
Equation (2) indicating that ITT treatment group PFAs experienced a 10 percent reduction in
crime by 1985 Column (2) shows results based upon the continuous treatment version of
11987711987711987711987711987711987711989411989480 and when the interactions between local area circumstances measured in 1980 and the
Post variable are also added to the estimated specification Column (2) also shows negative
and statistically significant estimates suggesting that the conclusion from Table 3 that RTB
eligibility led to a reduction in crime in the 1980s and early 1990s is robust to equation
specification In particular estimates in Column (2) uncover an elasticity of crime with respect
to RTB eligibility of approximately -019 implying that a 10 percent increase in eligibility to
the RTB scheme reduced crime by around 19 percent within the first five years of the scheme
The causal interpretation of these estimates crucially relies on the absence of
differential pre-treatment crime trends between PFAs that were exposed to different degrees of
RTB eligibility in 1980 Column (3) shows event-study estimates where the log average years
23
of tenure duration in public housing in 1980 was interacted with three pre-reform years Two
key facts emerge from Column (3) First Column (3) shows there to be no differential pre-
treatment trends between PFAs that received different exposures to the RTB scheme In other
words RTB eligibility in 1980 does not predict crime trends across PFAs prior to 1980 This
implies that any post-1980 deviation from the existing trend that is predicted by the eligibility
to the RTB scheme in 1980 can be interpreted as the ITT impact of the RTB scheme on crime
Second estimates in Column (3) show a reduction in crime rates among PFAs that experienced
greater RTB eligibility in 1980 uncovering an elasticity of crime with respect to RTB
eligibility of approximately -028
Columns (4) and (5) show the IV estimates for the period 1975-85 and they retrieve
similar slightly larger negative elasticities In both columns the actual public housing sales
under the RTB scheme in the first year of the policy ie in 1980-81 are instrumented using
the log average years of tenure duration of incumbent tenants in public housing in 1980 Both
columns show negative and statistically significant estimates with Column (5) also showing
there to be no differential pre-treatment trends between PFAs that received different exposures
to the RTB scheme Similarly to the ITT estimates in Column (3) IV estimates in columns (4)
and (5) uncover an elasticity of crime with respect to RTB sales of approximately -028 to -
042 implying that a 10 percent increase in the RTB public housing sales reduced crime by
around 3 to 4 percent by 1985
In the remaining Columns (6)-(9) the analysis is extended up until 1992 the year when
the Thatcher era ended but very similar conclusions emerge Column (6) shows results based
upon the dichotomous treatment version of 11987711987711987711987711987711987711989411989480 in Equation (2) and it indicates that ITT
treatment group PFAs experienced a 128 percent reduction in crime by 1992 Columns (7) and
(8) show results based upon the continuous treatment version of 11987711987711987711987711987711987711989411989480 and when the
interactions between local area circumstances measured in 1980 and the Post variable are also
added to the estimated specification Columns (7) and (8) also show negative and statistically
significant estimates uncovering an elasticity of crime with respect to RTB eligibility of
roughly -028 to -036 implying that a 10 percent increase in eligibility to the RTB scheme
reduced crime by around 28 to 36 percent by 1992 When broken down between the years
prior to 1987 and later years Column (9) shows that a sizeable and statistically significant
crime-reducing effect of RTB eligibility appears in both the 1980s and early 1990s with little
variation appearing in the estimated crime-reducing effects of RTB across time and model
specifications
24
Throughout these estimates the magnitude of the crime reduction caused by the RTB
scheme by 1992 appears very similar to the magnitude observed by 1985 In the early years of
the RTB scheme no one who purchased a property under the RTB scheme could have possibly
resold it while continuing to benefit from the large discounts offered by the Thatcher-led
government under the RTB scheme as explained above Thus crime reductions from 1980-
85 as well as 1980-87 are very unlikely to result from the practice of reselling properties
previously bought under the RTB scheme to incomers that are more affluent If the ldquomigration-
basedrdquo gentrification of certain areas of the country was the underlying mechanism driving
these crime reductions significance in the estimates should not appear until the late 1980s
when the first properties bought under the RTB scheme in 1980 could be resold without having
to renounce the RTB discounts However this is not what is found here A crime reduction
appears in the early years of the RTB scheme a result that is rather consistent with behavioural
changes within the local communities that were more exposed to the provisions of the scheme
Estimates for property crime in Table 5 tell a similar story while no detectable effects
of RTB eligibility and RTB sales appear for violent crime in Table 6 Both Tables are organised
in the same way as Table 4 In both Tables all estimated specifications include PFA fixed
effects and year fixed effects with the models in Columns (2)-(5) and Columns (7)-(9)
additionally including the interactions between the Post variable in equation (2) and local area
variables measured in 1980 (ie fraction of public housing log of the unemployment rate log
of real hourly earnings at the 25th and 50th percentiles of the distribution and the fraction of
15-24 year olds in the population) In all specifications standard errors were clustered at the
PFA level and Wild Cluster Bootstrap techniques were used again for inference due to the
small number of clusters
Regardless of whether estimates are derived from the 1975-85 period or the 1975-92
period and regardless of whether ITT or IV estimates are considered results in Table 5 indicate
that the RTB scheme had a negative and significant impact on property crime uncovering an
elasticity of property crime with respect to the RTB scheme of approximately -03 to -04
implying that a 10 percent increase in eligibility to the RTB public housing sales reduces
property crime by around 3 to 4 percent Also in Table 5 Columns (3) (5) (8) and (9) show
there to be no differential pre-treatment trends between PFAs that received different exposures
to the RTB scheme as none of the estimated pre-treatment coefficients appears statistically
significant Columns (1) to (5) show that a RTB-induced property crime reduction was already
visible by 1985 and Column (9) also shows that a sizeable and statistically significant property
25
crime-reducing effect of RTB eligibility appears both in the 1980s and early 1990s consistent
with the notion that RTB eligibility led to behavioural changes within the local communities
rather than gentrification induced by in-migration
Table 6 studies the effect of RTB eligibility on violent crime and no significance
appears in the estimates Also in this case ITT and IV estimates from the 1975-85 period reach
the same conclusion as ITT estimates from the 1975-92 period Estimates Columns (3) (5) (8)
and (9) show there to be no differential pre-treatment trends between PFAs that received
different exposures to the RTB scheme suggesting that RTB eligibility in 1980 does not predict
violent crime trends either across PFAs prior to 1980 and further supporting the causal
interpretation of the estimates presented in Tables 4 and 5 and discussed in this section
c Political Colour Labour Markets Local Amenities and Police Deployment
Why did greater eligibility to the RTB scheme lead to a detectable reduction in crime
The mechanisms underlying the findings in Tables 3-6 and Figure 6 were investigated through
a variety of statistical tests First one may worry that this analysis is spuriously picking up
some other PFA-specific characteristics such as the political affiliation of the local
administration To test this data on the political ldquocomplexionrdquo of the PFA in the local elections
in 1977 the latest local elections prior to the election of Margaret Thatcher as UK Prime
Minister in 1979 were used Although RTB sales were only used in the IV estimates and not
in the ITT reduced-form estimates of equation (2) presented in Tables 4-6 one may worry that
the de facto supply-side availability of public housing for RTB sales might have differed by
local political control If for example pro-Thatcher Conservative-controlled LAs were more
willing to fulfil their statutory responsibility to accelerate sales through faster processing (or
potentially be more likely to advertise and encourage the possibility locally) then this omitted
confound might weaken the predictive power of public housing tenure duration and co-
determine RTB sales and crime However a scatter plot in Figure A5 in Appendix A suggests
no correlation between the conservative vote share within the PFA and RTB sales from 1980-
92 as a percentage of the residential stock in 1980 Estimates of the impact of eligibility to the
RTB scheme on crime were also produced when a set of interactions between the Conservative
vote share within the PFA in the 1977 local elections and year fixed effects were added to the
econometric specification22 Results are unchanged with the inclusion of this additional
variable which suggests that our results are not caused by Labour controlled LAs opposing
22 The Conservative vote share is the share of Conservative votes in all votes cast in the parliamentary constituencies nested within the PFA
26
this policy for political reasons while facing greater local crime rates This holds true regardless
of whether local area variables are included in the analysis
One additional concern may be that the reduction in crime rates observed in areas with
greater RTB eligibility in 1980 may reflect some underlying trends in local labour markets If
for example incumbent tenants spent more years in public housing prior to 1980 in areas that
faced more favourable labour market prospects thus facing greater discounts under the RTB
scheme and these same areas then experienced reduced criminality thanks to the improved
labour market circumstances then the reduction in crime observed in Tables 3-6 and Figure 6
would be erroneously attributed to the RTB scheme Models to test for the effects of RTB
eligibility on local labour market conditions were therefore estimated and results are displayed
in Table 7 Whether the unemployment rate the 25th percentile real hourly earnings or the 50th
percentile real hourly earnings are modelled as dependent variable no evidence appears that
eligibility to the RTB scheme in 1980 predicted the evolution of local labour market conditions
in the 1980s and early 1990s These results mitigate the concern that our estimates might be
picking up the effect of other local area circumstances that interacted with public housing sales
over time in the 1980s
Eligibility to the RTB scheme in 1980 does not even seem to predict the local fraction
of 15-24 year olds in the population in the 1980s and early 1990s a relevant finding that further
suggests that migration and a compositional change in the local population do not seem to be
the key mechanisms at play here If a ldquomigration-basedrdquo gentrification was behind the main
results of this paper RTB eligibility would predict the composition of the local population in
the 1980s and 1990s If for example all RTB purchasers had rented out their properties to
students right after purchasing them (and this was the true driver of the crime reduction in
Tables 4 and 5) then RTB eligibility should be a positive predictor of the fraction of 15-24
year olds in the population However this is not what is found here
One further concern may be that initial RTB eligibility positively correlates with the
quality of local amenities across regions in England and Wales The initial uptake of the RTB
scheme may have been greater in areas with ldquobetter-qualityrdquo public housing Similarly one
may worry that in 1980 only the ldquowell-offrdquo public tenants were able to exploit the RTB scheme
and purchase their houses while ldquothe very poorrdquo were left behind Both these scenarios would
imply that in the short run analysis initial RTB sales may be picking up other relevant
socioeconomic components of communities If initial RTB sales were concentrated among
27
better-off areas or individuals the crime-reducing effect that is observed may not be due to the
sales of public housing but rather due to the fact that we are not comparing like-with-like
To test for the possibility that RTB sales grew faster in areas with greater-quality public
housing the main model was re-estimated and the treatment variable replaced with the value
of RTB sales in the first year of the RTB scheme in place of the eligibility to the RTB scheme
in 1980 The result of this exercise is shown in column (5) of Table 7 When crime is regressed
on the average (log) value of RTB transactions in the first year of the RTB scheme the
estimated coefficient appears small in magnitude as well as in percent terms and very
statistically insignificant Thus unlike RTB eligibility the value of RTB sales does not predict
the evolution of crime This conclusion is robust to the set of controls added to the estimating
equation (fixed effects only or fixed effects and local area variables) In sum the initial
eligibility to RTB sales not their average value predicts the reduction in crime since the 1980s
Finally one may worry that the RTB scheme may have coincided with differential
policing strategies across regions and that this may have resulted in differential crime detection
rates across regions If for example fewer police officers were deployed in areas with greater
RTB sales in 1980 our findings may reflect the lower crime detection rates of the police in
these areas rather than a genuine reduction in crime Availability of data on the number of
officers employed in each PFA since 1975 allowed us to estimate the impact of RTB eligibility
on police deployment This is a further test of whether indeed the RTB scheme made some
areas of the country safer or whether it coincided with a decrease in police deployment To
examine this idea the dependent variable in the difference-in-differences specification was
replaced with the log number of police officers deployed by the PFA Results are displayed in
column (6) of Table 7 and the coefficient of interest is economically small and not statistically
significant suggesting that the greater exposure to the RTB scheme of some PFAs did not
coincide with differential policing strategies In turn this mitigates the concern that differential
policing strategies and crime detection rates across regions may have coincided with the RTB
scheme and further suggests that our main results reveal the genuine reduction in criminality
generated by the RTB scheme
d Homeownership and Behavioural Change
Did the RTB policy induce indigenous local communities to refurbish their properties
One possibility is that home upgrading by purchasers under the RTB scheme explains the
observed reduction in crime (absent any clear migration labour market or amenity differential
28
between areas that were exposed to differing degrees to the RTB policy) The British Crime
Survey (BCS) 1988 contains a rich set of variables concerning homeownership and crime23
Based on the information contained in the BCS 1988 it was possible to define a treatment
group of incumbent tenants who had previously rented from the council then subsequently
purchased the property in which they currently reside and a control group of council rental
tenants who stated that they currently intend to buy the public property in which they reside
within two years This provides a natural comparison group against which to estimate the
effects of purchase on behavioural change to build at least strongly suggestive evidence for the
effects of the policy Table A1 in the Appendix shows these treatment group individuals and
control group individuals to be observably indistinguishable in terms of age gender ethnicity
income number of rooms in the household household type (eg flat or house) and past
experiences of burglary victimization For each of these individual and household
characteristics Table A1 presents a balancing test that retrieves an insignificant estimate thus
showing the suitability of the comparison group
Table 8 shows a comparison of home improvement expenditure insurance and social
behaviour between these two groups of observably similar individuals Panel A shows
unconditional OLS estimates thus providing a simple comparison of the means between these
two groups OLS estimates in Panel B were derived controlling for the set of variables for
which balancing was tested in Appendix Table A1 ie gender ethnicity a quadratic of age
past experiences of burglary victimization in the property of residence type of property (eg
flat or house) number of rooms in the property household income band and county fixed
effects Thus while self-selection into the treatment group is a possibility controlling for this
large set of observables and restricting the treatment and control groups to incumbent
individuals that only seem to differ in their timing of willingness to purchase their property
from the council within two years should mitigate the concern that self-selection is driving our
results here To be consistent with all other results at PFA level standard errors were clustered
at the county level the closest geography to a PFA that was available in these data As
respondents are drawn from 52 counties Wild Cluster Bootstrap p-values were estimated again
as in all the analysis discussed above
The results in Table 8 show that incumbent tenants who bought from the council were
significantly more likely to install double locks to outside doors to install locks in windows
23 The same detail of information is not available from any other BCS survey from 1982 to 1992 when the short run analysis ends
29
and have the contents of their home insured against theft The same individuals were also
significantly more likely to install burglar alarms a relatively rare security device in England
and Wales in 1988 Finally these individuals were not more likely to join a neighbourhood
watch scheme a community-based crime prevention measure in which neighbours help each
other in a form of informal guardianship The comparison group here is always council tenants
who intended to buy the public property in which they resided in 1988 within two years
Consistent with the finding in Appendix Table A1 that observable characteristics are equally
distributed between treatment group individuals and control group individuals the comparison
of Panel A and Panel B shows that these conclusions are unchanged whether the set of
observable controls described above is included in the estimating equation or not
Additional analysis using the BCS data corroborates our main findings for the effects
of the RTB policy on crime Table A2 in the Appendix uses the BCS data to compare crime
victimization rates among treated versus control group individuals The Table shows that in
1988 treatment group homeowners reported between 20 and 25 less cases of crime
victimisation since the beginning of 1987 than control group council tenants Columns (1) and
(3) show that this holds true regardless of whether county fixed effects are controlled for
Column (5) of the Table also shows results when county fixed effects are replaced by the share
of treatment group homeowners in the county24 The coefficient associated with
homeownership under the RTB scheme remains negative and statistically significant In
contrast the share of treatment group homeowners in the county itself does not predict crime
victimisation Thus while reiterating that the crime reductions in Tables 3-6 and Figure 6 are
indeed driven by RTB sales these results also show that RTB sales did not lead to increased
crime victimisation of neighbouring occupiers of public housing
Figure 7 shows county-specific estimates of the correlation between RTB sales and
crime victimisation plotted against county-specific estimates of the correlation between RTB
sales and home improvement A linear function fitting the distribution of county-specific
estimates is also shown This appears negative and statistically significant showing that on
average incumbent tenants who bought under the RTB scheme experienced greater crime
reduction in counties in which the RTB scheme was associated with greater home
improvement
24 For each respondent this share was calculated at the county level leaving out the respondent herselfhimself from the calculation
30
The low-income homeownership experiment in Oklahoma investigated by Engelhardt
et al (2010) showed little or no significant evidence of home improvements of this sort
subsequent to purchase but that study covered a relatively short time interval post-purchase
and take-up of the subsidy was relatively low In contrast the results in Table 8 for doorsrsquo and
windowsrsquo locks and burglar alarms are consistent with the notion that homeownership led
people to refurbish their properties Homeownership may have given greater access to loans
and financial markets in general and the result for theft insurance plausibly reflects this These
results help rationalise the reduction in property crime Controlling for past experiences of
burglary victimisation also mitigates the concern that RTB purchasers may have experienced
greater crime victimisation in the past and that this may drive the results in Table 8 In contrast
since homeowners were no more likely to join a neighbourhood watch scheme no evidence
appears here that the RTB induced greater investment in social capital in local communities
where RTB unfolded more intensively
Table A2 in the Appendix suggested that no crime displacement occurred from public
houses sold under the RTB scheme to neighbouring public housing not yet sold under the RTB
scheme However one may also worry that the property crime reduction in Table 5 is entirely
driven by reductions in burglary with potential thieves shifting albeit to a lesser extent to
other thefts in the street Table 9 shows the results of our analyses in Tables 4-6 broken down
by crime categories Panel A shows results for the 1975-85 period and Panel B shows results
for the 1975-92 period Results are displayed separately for the crime categories that constitute
our measure of property crime namely burglary and theft and handling of stolen goods as well
as for the crime categories that constitute our measure of violent crime namely violence against
the person sexual offences and robbery
Breaking down property crime into burglary and theft and handling of stolen goods
reveals that no evidence of such ldquodisplacementrdquo of crime appears The reduction in property
crime is driven by a reduction in burglaries although a reduction in theft and handling of stolen
goods appears in the 1975-85 period ie in Panel A The reduction in theft and handling of
stolen goods does not appear statistically significant by 1992 but certainly no increase in this
crime category appears Moreover and similarly the breakdown of the results for violent crime
by crime category shows no evidence of crime displacement across categories as violence
against the person and sexual offences remain unchanged Interestingly both by 1985 and by
1992 a significant negative effect of the RTB scheme is found on robberies which are
31
categorised as violent crimes here because they involve a violent act but they are also often
economically motivated criminal offences
iv Long-Run Estimates
a Empirical strategy
But what of the long-run consequences of homeownership on crime This section
presents estimates of the long-run effects of homeownership induced by the Right-to-Buy
(RTB) policy on local crime rates To do so an instrumental variable (IV) long-differenced
model specification is used which exploits variation in the size of the public housing stock in
1980 across localities As argued above exposure to the policy was bounded by the size of the
public housing stock in 1980 Localities with less public housing would not experience large
increases in the homeownership rate due to the more limited supply As discussed in Section
2 variation in the size of the public housing stock across localities arose due to historical events
around the period of the two World Wars events which are unrelated to recent dynamics of
crime In formal terms the set of estimating equations can be expressed as follows
1198621198621198941198942017 minus 1198621198621198941198942003 = 119886119886 + 1205731205731 lowast 11986711986712048412048492 + 1205731205732 lowast 11986211986211989411989480 + 1205731205733 lowast 119883119883119894119894 + 120598120598119894119894 (3)
11986711986711989411989492 = 119886119886 + 1205731205731 lowast 11986711986711989411989480 + 120598120598119894119894 (4)
where 1198621198621198941198942017 minus 1198621198621198941198942003 is the change in the crime rate in locality i from 2003 to 2017 and
11986711986711989411989492 is the endogenous change in the size of the public housing stock from 1980 to 1992
expressed as a proportion of the residential stock in 1980 11986711986711989411989492 is therefore instrumented with
11986711986711989411989480 the 1980 level of the public housing stock 11986211986211989411989480 is the crime rate in locality i in 1980 119883119883119894119894
is a vector of contemporaneous local area variables (ie the local log real hourly wages at the
25th and 50th percentiles of the distribution the local log unemployment rate and the local share
of 15-24 years olds in the population) and 120598120598119894119894 is the error term As crime data is available from
2003 at the Local Authority (LA) level this model can be estimated at the LA level
The identifying assumption in the model described in Equations (3) and (4) is that
conditional on the level of crime in 1980 and the set of contemporaneous local area variables
captured in the vector 119883119883119894119894 the size of the public housing stock in 1980 in the LA is exogenous
to the dynamics of crime within the LA in the 2000s The exclusion restriction is that
conditional on the level of crime in 1980 and the set of contemporaneous local area variables
in the vector 119883119883119894119894 the size of the public housing stock in 1980 affects the dynamics of crime in
the 2000s only through public housing sales over the subsequent period
32
b Results
Summary data for the dependent variable in Equation 3 and the set of local area
variables in the vector 119883119883119894119894 are shown in Table 10 The crime rate fell over the period in more
than 90 of LAs The 25th percentile log real hourly wage fell too over the period while the
share of 15-24 year olds in the population remained unchanged and the log unemployment rate
rose (at a national level the unemployment rate rose from 5 in March 2003 to 76 by March
2013 during the period following the financial crisis)
The instrumental variable regression requires a strong first-stage relationship between
the public housing stock in 1980 and subsequent RTB sales over the period 1980-92 Figure
A6 in Appendix A illustrates that there is a strong correlation between the size of the public
housing stock in the LA in 1980 and subsequent sales under the RTB policy The scatterplot in
the Figure shows a strong positive relationship The coefficient (standard error) on the
instrument in the first-stage regression is 0242 (0017) with a F-statistic from the regression
of 19555
Estimates of Equation 3 are shown in Table 11 Estimates are grouped by the three
measures of crime examined above the overall crime rate in columns (1)-(3) property crime
rate in columns (4)-(6) and violent crime rate in columns (7)-(9) The leftmost specification for
each outcome includes only the independent variable of interest 11986711986711989411989492 instrumented by 11986711986711989411989480
For each outcome the coefficient on 11986711986711989411989492 is negative and precisely defined The middle
column of each sub-panel adds local area variables to the model with the rightmost column of
each sub-panel also adding a control for the crime rate in 1980 The coefficient on 11986711986711989411989492 remains
negative and precisely defined in each specification
The coefficient estimates imply that LAs experiencing larger increases in
homeownership experienced more rapid crime reductions The coefficient value of 0244 in
column (3) of Table 11 implies that a five percentage point higher increase in the
homeownership rate due to RTB sales caused an approximately fifty percent faster decline in
crime rate over the period 2003-2017 an effect approximately equal to a one standard deviation
higher speed of reduction in crime Among the covariates in all of the regressions the controls
for the level of crime in 1980 return negative and precisely defined coefficients These imply
a degree of convergence in LA level crime rates LAs with higher crime rates in 1980
experienced a faster decline in crime in the early 2000s conditional on the other covariates in
the regression
33
c Additional Long-Run Estimates
Did the RTB scheme leave any detectable mark on house prices and political
preferences of indigenous communities In this final sub-section the long-run effects of
increases in the homeownership rate brought about by RTB sales on house prices and on voting
behaviour are examined The increase in the homeownership rate via RTB sales increased the
potential housing supply to the private resale market Hence all else being equal RTB sales
would be expected to decrease house prices over time On the other hand the RTB scheme
may have also potentially increased the demand for housing in the private resale market
Moreover in the presence of outward migration of low-income households and inward
migration of higher-income households RTB sales may have had a positive impact on house
prices over time
To explore the impact of RTB sales on house prices in column (1) of Table 12 the
dependent variable was replaced with the change in the log of the average house price in the
LA over the period 2003 to 2014 House price data is obtained from the Land Registry house
price index The set of control variables is the same as in the models shown in Column (2) of
Table 11 The coefficient on RTB sales is negative and precisely defined and it implies that a
five percentage point increase in the homeownership rate due to RTB sales decreased house
prices over the period by approximately 65 This is an economically modest effect in the
context of an approximate doubling of house prices on average in LAs over the sample period
However this result highlights the general equilibrium effects of RTB sales on the housing
market
Second the effects of RTB sales on voting behaviour in LA elections were also
estimated To do so LA-level data on vote shares in the local election were matched to the
housing and crime data used so far and the changes in the Conservative vote share within the
LA over the period 1995 ndash 2015 were constructed and modelled as the dependent variable in
the regression The sample size in these estimates is smaller owing to the fact that the timing
of LA election cycles varies across LAs In Table 12 the coefficient on the RTB sales variable
is positive and precisely defined Hence these estimates suggest that the RTB policy was
effective in increasing the Conservative vote share in localities that saw larger increases in the
homeownership rate under the policy This result echoes the conclusion in Di Tella Galiani
and Schargrodsky (2007) that show that lucky squatters who received legal titles in Buenos
Aires in the 1990s report beliefs closer to those that favour the workings of a free market
34
5 Conclusion
This paper studies local crime reduction connected to the increase in homeownership rates
induced by the UK Governmentrsquos Right To Buy (RTB) scheme since 1980 One of the key
goals of the RTB scheme was as it were to lsquogentrifyrsquo households endogenously Specifically
it aimed to ease access to an owned property for (broadly) working class families and in doing
so to alter their behaviour and induce them to take greater care of their property as well as to
alter their economic position by giving them a collateral asset in financial markets The RTB
scheme offered a means of upgrading the economic position of households in neighbourhoods
previously dominated by public housing
The RTB scheme led to a reduction in crime Estimates from the Thatcher era uncover
an elasticity of crime with respect to eligibility to sales of public housing of roughly -03
implying that a 10 percent increase in eligibility to public housing sales reduced crime by
around 3 percent The RTB scheme led to a reduction in both property crime and robberies
and both short run and longer run evidence of crime reduction is presented However rather
than being driven by changes in the composition of households through inward and outward
migration the key mechanisms underlying the reduction in crime rates appear to be the
behavioural changes that the RTB scheme induced within the local community The findings
suggest that new renters-come-homeowners as a result of RTB altered their behaviour in
response to the incentives arising from acquisition of housing wealth They made their
properties safer and gained greater access to the insurance markets
While no evidence is found of compositional changes in the local population of
different regions of the country signs of this behavioural change appear from the early years
of the policy when no resales of properties bought under the RTB scheme could have taken
place while continuing to benefit from the discounts offered under this scheme In line with
this conclusion and contrary to what a migration-based model of gentrification would predict
house prices decreased in the long run and Conservative votes increased in areas most affected
by the RTB scheme These results therefore vindicate the Thatcher rationale for the policy
More broadly they suggest that increasing homeownership reduces local crime as public
housing tenants become owners of their own homes separately from the process of
gentrification whereby low-income neighbourhoods become middle-income neighbourhoods
through outward migration of low-income households and inward migration of higher-income
households These results complement the existing literature and inform policy by showing
how granting homeownership to indigenous communities can also act to reduce crime
35
Before concluding some words of caution are necessary First although the results
conform to the Thatcher rationale for the policy they certainly do not vindicate it overall to
show that would require a more general welfare analysis Indeed an analysis of this sort
presented in Disney and Guo (2017) suggests that the RTB policy generated complex inter-
and intra-generational welfare effects and that welfare-improving adjustments to the policy
should have been considered The welfare implications of the broad shift from direct provision
of public housing to cash transfers for purchase of housing services in the UK implied by RTB
and other policies akin to the US also requires further analysis Nonetheless the change in
behaviour and beliefs in indigenous communities documented here shows a novel means not
fully documented to date that complements the existing literature based on different research
designs and settings by which homeownership and housing policy may contribute to reduce
criminality Thus housing provision and subsidized homeownership have scope to act as
potentially important features of the sizable crime drops observed in the United States and
several other Western economies since the 1990s
36
References
Aliprantis D and D Hartley (2015) Blowing it up and knocking it down the local and city-
wide effects of demolishing high concentration public housing on crime Journal of Urban
Economics 88 67-81
Aliprantis D and F G-C Richter (forthcoming) Evidence of Neighborhood Effects from
Moving to Opportunity LATEs of Neighborhood Quality Review of Economics and
Statistics Forthcoming
Alonso J R Andrews and V Jorda Gil (2019) Do neighbourhood renewal programs reduce
crime rates Evidence from England Journal of Urban Economics 110 March 51-69
Altonji J G and R K Mansfield (2018) Estimating Group Effects Using Averages of
Observables to Control for Sorting on Unobservables School and Neighborhood Effects
American Economic Review 108 (10) 2902-46
Autor D C Palmer and P Pathak (2019) Ending rent control reduced crime in Cambridge
American Economic Association papers and Proceedings 109 381-384
Bell B J Blundell and S Machin (2018) The changing geography of intergenerational
mobility CEP Discussion Paper No 1591 Centre for Economic Performance London School
of Economics and Political Science London UK
Bergman P R Chetty S DeLuca N Hendren L F Katz and C Palmer (2020) Creating
Moves to Opportunity Experimental Evidence on Barriers to Neighborhood Choice Working
paper
Bernasco W T de Graaf J Rouwendal and W Steenbeek (2017) Social interactions and
crime revisited an investigation using individual offender data in Dutch neighborhoods The
Review of Economics and Statistics 99 622ndash636
Blanden J and S Machin (2017) Home Ownership and Social Mobility CEP Discussion
Paper No 1466 Centre for Economic Performance London School of Economics and Political
Science London UK
Cameron A C J G Gelbach and D L Miller (2008) Bootstrap-based improvements for
inference with clustered errors Review of Economics and Statistics 90(3)414ndash27
37
Chetty R and N Hendren (2018a) The Impacts of Neighborhoods on Intergenerational
Mobility I Childhood Exposure Effects Quarterly Journal of Economics 133 (2018a) 1107ndash
1162
Chetty R and N Hendren (2018b) The Impacts of Neighborhoods on Intergenerational
Mobility II County-Level Estimates Quarterly Journal of Economics 133 (2018b) 1163ndash
1228
Chetty R N Hendren and L F Katz (2016) The Effects of Exposure to Better
Neighborhoods on Children New Evidence from the Moving to Opportunity Experiment
American Economic Review 106 (4) 855-902
Chyn E (2018) Moved to opportunity the long-run effects of public housing demolition on
children American Economic Review 108 (10) 3028-56
Cullen J and S Levitt (1999) Crime urban flight and the consequences for cities Review of
Economics and Statistics 81 2 159-169
Damm A and C Dustmann (2014) Does growing up in a high crime neighborhood affect
youth criminal behavior American Economic Review 104 1806ndash1832
Di Pasquale D and E Glaeser (1999) Incentives and social capital are homeowners better
citizens Journal of Urban Economics 45 354-384
Di Tella R S Galiani and E Schargrodsky (2007) The formation of beliefs evidence from
the allocation of land titles to squatters The Quarterly Journal of Economics 122(1) 209-241
Diamond R and T McQuade (2019) Who wants affordable housing in their backyard An
equilibrium analysis of low-income property development Journal of Political Economy 127
no 3 (June 2019) 1063-1117
Disney R and G Luo (2017) The Right to Buy public housing in Britain a welfare analysis
Journal of Housing Economics 35 51-68
Ellen I K Horn and D Reed (2017) Has falling crime invited gentrification US Census
Bureau Center for Economic Studies Paper No CES-WP-17-27 March Washington DC
Engelhardt G M Eriksen W Gale and G Mills (2010) What are the social benefits of home
ownership Experimental evidence for low income households Journal of Urban Economics
67 249-258
38
Fryer R G Jr and L F Katz (2013) Achieving Escape Velocity Neighborhood and School
Interventions to Reduce Persistent Inequality American Economic Review 103 (3) 232ndash37
Gibbons S (2004) The costs of urban property crime The Economic Journal 113 F441-462
Gregg P S Machin and A Manning (2004) Mobility and joblessness In Card D Blundell
R and Freeman R (eds) Seeking a premier economy the economic effects of British economic
reform 1980-2000 371-410 NBER Chicago Chicago University Press
Grogger J (2002) The effects of civil gang injunctions on reported violent crime evidence
from Los Angeles County The Journal of Law amp Economics 45(1) 69-90
doi101086338348
Haurin D R Dietz and B Weinberg (2003) The impact of neighbourhood homeownership
rates a review of the theoretical and empirical literature Journal of Housing Research 13
119-151
Hausman N T Ramot-Nyska and N Zussman (2020) Homeownership Labor Supply and
Neighborhood Quality Working paper 2020
Hilber C and W Vermuelen (2014) The impact of supply constraints on house prices in
England The Economic Journal 126 March 358-405
Jones C and A Murie (2006) The Right to Buy analysis and evaluation of a housing policy
Blackwell Oxford
Jones RV (1978) Most Secret War London Hamish Hamilton
Katz L J R Kling and J B Liebman (2001) Moving to opportunity in Boston early results
of a randomized mobility experiment Quarterly Journal of Economics 116 607ndash654
Kling J R J B Liebman and L F Katz (2007) Experimental Analysis of Neighborhood
Effects Econometrica 75 (1) 83ndash119
Kling J R J Ludwig and L F Katz (2005) Neighborhood Effects on Crime for Female and
Male Youth Evidence from a Randomized Housing Voucher Experiment Quarterly Journal
of Economics 120 87ndash130
Landersoslash R HS Nielsen and M Simonsen (2016) School starting age and the crime-age
profile The Economic Journal 127 1096ndash1118
39
Ludwig J G J Duncan L A Gennetian L F Katz R C Kessler J R Kling and L
Sanbonmatsu (2013) Long-Term Neighborhood Effects on Low Income Families Evidence
from Moving to Opportunity American Economic Review 103 (3) 226ndash31
Ludwig J G J Duncan and P Hirschfield (2001) Urban poverty and juvenile crime
evidence from a randomized experiment Quarterly Journal of Economics 116 655ndash679
Ludwig J and J R Kling (2007) Is Crime Contagious The Journal of Law and Economics
50(3) 491ndash518
McDonald S (1986) Does gentrification affect crime rates Crime and Justice 8 163-201
Machin S and C Meghir (2004) Crime and economic incentives Journal of Human
Resources 39(4) 958-79
Morales-Mosquera M (2019) The economic value of crime control evidence from a large
investment on police infrastructure in Colombia Unpublished draft Harris School of Public
Policy at the University of Chicago
Murie A (1997) Linking housing changes to crime Social Policy and Administration 31 5
22-36
Office of National Statistics (2013) A century of home ownership in England and Wales
London
Olsen E (2003) Housing programs for low-income households In Moffitt R (ed) Means-
tested transfer programs in the United States 365-442 Chicago Chicago University Press
Owens E M Mioduszewski and C Bates (2019) How valuable are civil liberties Evidence
from gang injunctions crime and housing prices in Southern California Unpublished draft
Department of Criminology Law and Society and Department of Economics University of
California Irvine
Quetelet A (1831) [1984] Research on the propensity for crime at different ages translated
and introduced by Sawyer F Sylvester Cincinnati Anderson
Ridgeway G J Grogger R A Moyer and J M MacDonald (2018) Effect of gang
injunctions on crime a study of Los Angeles from 1988ndash2014 Journal of Quantitative
Criminology httpsdoi101007s10940-018-9396-7
40
Rotger G P and G C Galster (2019) Neighborhood peer effects on youth crime natural
experimental evidence Journal of Economic Geography Volume 19 Issue 3 May 2019 Pages
655ndash676 httpsdoiorg101093jeglby053
Sanbonmatsu L J Ludwig L Katz L Gennetian G Duncan R Kessler E Adam T
McDade and S Lindau (2011) Impacts of the Moving to Opportunity for Fair Housing
Demonstration Program after 10 to 15 Years Washington (DC) US Department of Housing
and Urban Development Office of Policy Development and Research November published
at httpwwwhuduserorgportalpublicationspdfMTOFHD_fullreport_v2pdf
Sandler D (2017) Externalities of public housing the effect of public housing demolition on
local crime Regional Science and Urban Economics 62 January 24-35
Schill M (1993) Distressed public housing where do we go from here University of Chicago
Law Review 60 2 497-554
Sciandra M L Sanbonmatsu G J Duncan L A Gennetian L F Katz R C Kessler J R
Kling and J Ludwig (2013) Long-Term Effects of the Moving to Opportunity Residential
Mobility Experiment on Crime and Delinquency Journal of Experimental Criminology 9 (4)
451ndash89
Sodini P S Van Nieuwerburgh R Vestman and U Von Lilienfeld-Toal (2017) Identifying
the Benefits from Home Ownership A Swedish Experiment Working paper
Van Dijk J and B Vollaard (2012) Self-Limiting crime waves in J Van Dijk A Tseloni
and G Farrell (eds) The International Crime Drop 2012 Palgrave MacMillan New York
Source Reproduced from Disney and Luo (2017) Chart 1 calculated from Office for National Statistics (2013)
0
10
20
30
40
50
60
70
80
90
100
1918 1939 1953 1961 1971 1981 1991 2001 2011
Figure 1 Housing Tenure Shares by Tenure Type England and Wales 1918-2011
Owning Private renting Social renting
42
Source Department of Communities and Local Government Housing Statistics Table 678
0
20 000
40 000
60 000
80 000
100 000
120 000
140 000
160 000
180 000
1980
-81
1983
-84
1986
-87
1989
-90
1992
-93
1995
-96
1998
-99
2001
-02
2004
-05
2007
-08
2010
-11
2013
-14
Publ
ic H
ousi
ng
Figure 2 Right to-Buy and Other Sales of Public Housing in England 1980-81 to 2013-14
Council house sales (mostly RTB) Sales of other social housing
43
Figure 3 Correlation Between Crime and Public Housing in 1980 Police Force Area (PFA)
Coeff (se) = 0001 (0000)
0
002
004
006
008
01
Crim
e in
198
0
10 20 30 40 50 Public Housing in 1980
Police Force Area Linear Fit
Crime vs Public Housing in 1980
Notes Figure shows for each Police Force Area (PFA) the crime rate in 1980 plotted against the fraction of public housing as a percent of the total residential stock in 1980 Crime is defined as total yearly counts of property and violent crime offences per population at the PFA level Property crime defined as total yearly counts of burglary and theft or handling of stolen goods offences per population at the PFA level Violent crime defined as total yearly counts of robbery violent and sexual offences per population at the PFA level A linear function fitting the correlation between the PFA-specific fraction of public housing and the crime rate weighted by PFA-specific population size in 1980 is also shown
44
Figure 4 Correlation Between Right-To-Buy (RTB) Public Housing Sales by 1981 and Tenure Duration in Public Housing in 1980
Coeff (se) = 0969 (0270)
0
1
-05
05
Log
Publ
ic H
ousi
ng S
ales
in 1
980-
81
2 22 24 26 28 3Log Public Housing Tenure in 1980
Police Force Area Linear Fit
Public Housing Sales in 1980-81 vs Tenure in 1980
Notes Figure shows for each Police Force Area (PFA) the log sales of public housing under the Right-To-Buy (RTB) scheme by 1981 plotted against PFA-specific log average years of tenure duration in public housing in 1980 A linear function fitting the distribution of PFA-specific log sales and log tenure duration weighted by PFA-specific population size in 1980 is also shown For each PFA in the analysis the horizontal axis shows the log value of average years of tenure duration in public housing in 1980 whereas the vertical axis shows the log count of sales of public housing under the RTB scheme by 1981 as a percent of the total residential stock in 1980
45
Figure 5 Correlation Between Right-To-Buy (RTB) Public Housing Sales in 1980-92 and RTB Public Housing Sales by 1981
Coeff (se) = 0513 (0090)
15
2
25
3
Log
Publ
ic H
ousi
ng S
ales
in 1
980-
92
0 1-05 05Log Public Housing Sales in 1980-81
Police Force Area Linear Fit
Public Housing Sales in 1980-92 vs 1980-81
Notes Figure shows for each Police Force Area (PFA) the log sales of public housing under the Right-To-Buy (RTB) scheme by 1992 plotted against PFA-specific log sales of public housing under the RTB scheme by 1981 A linear function fitting the distribution of PFA-specific log sales weighted by PFA-specific population size in 1980 is also shown For each PFA in the analysis the horizontal axis shows the log count of sales of public housing under the RTB scheme by 1981 as a percent of the total residential stock in 1980 whereas the vertical axis shows the log count of sales of public housing under the RTB scheme by 1992 as a percent of the total residential stock in 1980
46
Figure 6 Crime Rates in Intention-To-Treat (ITT) Treatment Police Force Areas (PFAs) and in ITT Control PFAs 1975-1992
002
004
006
008
01
Wei
ghte
d A
vera
ge a
nd 9
5 C
I
1975 1980 1987 1992Year
ITT Treatment PFAs (Housing Tenure in 1980 gt= p50)ITT Control PFAs (Housing Tenure in 1980 lt p50)
Crime Rates in ITT Treatment vs ITT Control PFAs
Notes Figure shows crime rates separately for ITT Treatment PFAs (Housing Tenure duration in 1980 gt= p50) and ITT Control PFAs (Housing Tenure duration in 1980 lt p50) Crime defined as total yearly counts of property and violent crime offences per population at the PFA level Property crime defined as total yearly counts of burglary and theft or handling of stolen goods offences per population at the PFA level Violent crime defined as total yearly counts of robbery violent and sexual offences per population at the PFA level Reported dots are averages weighted by population at the PFA level and capped bars are 95 confidence intervals
47
Figure 7 County-Specific Estimates of Correlation between Right-To-Buy (RTB) Public Housing Sales and Crime Victimisation against County-Specific Estimates of Correlation between RTB Public Housing Sales and Home Improvement 1988
Coeff (se) = -0518 (0271)
-2
-1
0
1
2
RTB
and
Crim
e Vi
ctim
isat
ion
-1 0 1-05 05RTB and Home Improvement
County-specific Effect Linear Fit
RTB and Crime Victimisation vs RTB and Home Improvement
Notes The figure shows county-specific estimates of the correlation between Right-To-Buy Scheme (RTB) public housing sales and crime victimisation plotted against county-specific estimates of the correlation between RTB public housing sales and home improvement A linear function fitting the distribution of county-specific estimates is also shown For each county in the analysis the horizontal axis shows the estimate of the correlation between RTB public housing sales and home improvement whereas the vertical axis shows county-specific estimates of the correlation between RTB public housing sales and crime victimisation Treatment group defined as homeowners who rented from the council the property in which they currently reside prior to buying it Control group defined as council tenants who currently intend to buy the public property in which they reside within two years
48
Table 1 Summary Data for 1980 Police Force Authorities (PFA)
Percentiles Mean Standard
Deviation Min Max p25 p50 p75 p90
Housing Stock Public Housing Stock ( Residential Stock) 27202 8574 14568 43798 21865 22966 34096 41869 Public Housing Sales by 1981 ( Residential Stock) 1231 0410 0735 2516 0910 1248 1417 1680 Public Housing Years of Tenure 11052 1875 8274 17936 9977 11302 11721 12843 Public Housing Units 191721 177523 27612 563046 71116 98794 246040 563046 Residential Stock Units 725288 738428 128410 2462295 301632 427384 639665 2462295 Crime Variables All Crime Rate 0045 0016 0020 0069 0031 0038 0060 0069 Property Crime Rate 0042 0015 0019 0065 0030 0035 0057 0065 Violent Crime Rate 0003 0001 0001 0006 0002 0003 0003 0004 Covariates Log Unemployment Rate -2885 0357 -3730 -2120 -3219 -2882 -2688 -2435 Log 25th Percentile Real Hourly Earnings 1345 0070 1228 1497 1305 1327 1360 1497 Log 50th Percentile Real Hourly Earnings 1613 0069 1488 1751 1565 1606 1635 1751 Fraction 15-24 Year Olds in Population 0157 0008 0138 0173 0152 0158 0162 0165 Observations 42
Notes Crime variables are measured as crime rates at the Police Force Area (PFA) level Crime defined as total yearly counts of property and violent crime offences per population at the PFA level Property crime defined as total yearly counts of burglary and theft or handling of stolen goods offences per population at the PFA level Violent crime defined as total yearly counts of robbery violent and sexual offences per population at the PFA level Local area variables are the log of the unemployment rate the 25th percentile log real hourly wage and the share of 15-24 year olds in the population each measured at the PFA geography
49
Table 2 Crime Rate Public Housing Stock and Tenure Duration in 1980 OLS Estimates Police Force Area (PFA)
All Crime
Property Crime
Violent Crime
Log Housing Tenure Duration
(1) (2) (3) (4) (5) (6) (7) (8) Public Housing (Prop Res Stock) 0087
(0028) 0064
(0017) 0082
(0026) 0059
(0017) 0005
(0001) 0004
(0001) 0082
(0317) -0023 (0447)
Log Unemployment Rate 0016 (0005)
0015 (0005)
0001 (0000)
0015 (0104)
Log 25th Percentile Real Hourly Earnings 0398 (0080)
0378 (0076)
0020 (0006)
-2358 (1425)
Log 50th Percentile Real Hourly Earnings -0252 (0078)
-0238 (0074)
-0014 (0007)
1400 (1440)
Fraction 15-24 Year Olds in Population 0574 (0219)
0546 (0206)
0028 (0016)
-2914 (2764)
Observations 42 42 42 42 42 42 42 42
Notes Table reports estimates from Ordinary Least Squares regression models Dependent variables are crime rates Crime defined as total yearly counts of property and violent crime offences per population at the Police Force Area (PFA) level Property crime defined as total yearly counts of burglary and theft or handling of stolen goods offences per population at the PFA level Violent crime defined as total yearly counts of robbery violent and sexual offences per population at the PFA level Data units are 42 PFAs in 1980 Standard errors shown in parenthesis indicates significance at 1 indicates significance at 5 indicates significance at 10
50
Table 3 Difference-in-Differences Before and After the Right-To-Buy Scheme
Intention-To-Treat (ITT)
Treatment PFAs (Log Public Housing Tenure Duration in 1980
gt= p50)
Intention-To-Treat (ITT)
Control PFAs (Log Public Housing Tenure Duration in 1980
lt p50)
Difference ((1) - (2))
Unconditional
DiD
Unconditional DiD Effect ((4) Pre (2))
(1) (2) (3) (4) (5) Panel A All Crime 1975-85 Pre- 0034 0047 -0013 Post- 0043 0060 -0017 Post ndash Pre 0009 0013 -0004
(p = 0085) -85
Number of Police Force Areas 21 21 Number of Observations 231 231 Panel B All Crime 1975-92 Pre- 0035 0047 -0012 Post- 0053 0070 -0017 Post ndash Pre 0018 0023 -0005
(p = 0072) -106
Number of Police Force Areas 21 21 Number of Observations 378 378
Notes Post-period defined as starting from 1980 the date of adoption of the Right to Buy (RTB) Policy in England and Wales Panel A shows results for the 1975-85 period and Panel B shows results for the 1975-92 period Crime defined as total yearly counts of property and violent crime offences per population at the Police Force Area (PFA) level Property crime defined as total yearly counts of burglary and theft or handling of stolen goods offences per population at the PFA level Violent crime defined as total yearly counts of robbery violent and sexual offences per population at the PFA level Averages weighted by population at the PFA level Standard errors were clustered at the PFA level and p-values from Wild Cluster Bootstrap are reported in parentheses Effect calculated as estimated coefficient divided by mean of dependent variable prior to 1980 in the ITT control group PFAs (Public Housing Tenure duration in 1980 lt p50)
Table 4 Estimates of Impact of Right-To-Buy Scheme on Crime
ITT 1975-85 IV 1975-85 ITT 1975-92 (1) (2) (3) (4) (5) (6) (7) (8) (9)
(Log RTB Sales in 1980-81) x Post -0013 (p = 0012)
-0020 (p = 0026)
(Log Tenure gt= p50) x Post -0005 (p = 0085)
-0006 (p = 0073)
Log Tenure x Post -0009 (p = 0055)
-0013 (p = 0087)
-0013 (p = 0038)
-0017 (p = 0049)
Log Tenure x 1988-92 -0018 (p = 0047)
Log Tenure x 1980-87 -0017 (p = 0090)
Log Tenure x 1979 -0009 (p = 0183)
-0009 (p = 0183)
-0009 (p = 0189)
-0009 (p = 0189)
Log Tenure x 1978 -0007 (p = 0514)
-0007 (p = 0541)
-0007 (p = 0525)
-0007 (p = 0525)
Log Tenure x 1977 -0005 (p = 0611)
-0005 (p = 0623)
-0005 (p = 0628)
-0005 (p = 0628)
Effect -10638 -0191 -0277 -0277 -0425 -12766 -0277 -0362 Effect x 1988-92 -0383 Effect x 1980-87 -0362
Log Unemployment Rate in 1980 x Post No Yes Yes Yes Yes No Yes Yes Yes Log 25th Percentile Earnings in 1980 x Post No Yes Yes Yes Yes No Yes Yes Yes Log 50th Percentile Earnings in 1980 x Post No Yes Yes Yes Yes No Yes Yes Yes Fraction 15-24 Years Old in 1980 x Post No Yes Yes Yes Yes No Yes Yes Yes Fraction of Public Housing in 1980 x Post No Yes Yes Yes Yes No Yes Yes Yes PFA Fixed Effects Yes Yes Yes Yes Yes Yes Yes Yes Yes Year Fixed Effects Yes Yes Yes Yes Yes Yes Yes Yes Yes
First Stage Coefficient on ITT 0647 (p = 0015)
0647 (p = 0019)
Sample Size 462 462 462 462 462 756 756 756 756 Number of PFAs 42 42 42 42 42 42 42 42 42
Notes Post-period defined as starting from 1980 the date of adoption of the Right to Buy (RTB) Policy in England and Wales Columns (1)-(5) show ITT and IV results for the 1975-85 period and Columns (6)-(9) show ITT results for the 1975-92 period Tenure duration in public housing measured in years and calculated in 1980 Sales of public housing calculated in 1980-81 Crime defined as total yearly counts of property and violent crime offences per population at the Police Force Area (PFA) level Property crime defined as total yearly counts of burglary and theft or handling of stolen goods offences per population at the PFA level Violent crime defined as total yearly counts of robbery violent and sexual offences per population at the PFA level Regressions weighted by population at the PFA level Standard errors were clustered at the PFA level and p-values from Wild Cluster Bootstrap are reported in parentheses Effect calculated as estimated coefficient divided by pre-1980 mean of dependent variable in ITT control group (Public Housing Sales by 1981 lt p50) indicates significance at 1 indicates significance at 5 indicates significance at 10
Table 5 Estimates of Impact of Right-To-Buy Scheme on Property Crime
ITT 1975-85 IV 1975-85 ITT 1975-92 (1) (2) (3) (4) (5) (6) (7) (8) (9)
(Log RTB Sales in 1980-81) x Post -0013 (p = 0012)
-0018 (p = 0021)
(Log Tenure gt= p50) x Post -0004 (p = 0089)
-0005 (p = 0102)
Log Tenure x Post -0008 (p = 0052)
-0012 (p = 0085)
-0012 (p = 0038)
-0016 (p = 0052)
Log Tenure x 1988-92 -0015 (p = 0095)
Log Tenure x 1980-87 -0017 (p = 0099)
Log Tenure x 1979 -0008 (p = 0168)
-0008 (p = 0173)
-0008 (p = 0177)
-0008 (p = 0177)
Log Tenure x 1978 -0006 (p = 0518)
-0006 (p = 0546)
-0006 (p = 0535)
-0006 (p = 0535)
Log Tenure x 1977 -0004 (p = 0609)
-0004 (p = 0619)
-0004 (p = 0624)
-0004 (p = 0623)
Effect -9091 -0182 -0273 -0295 -0409 -11364 -0273 -0364 Effect x 1988-92 -0341 Effect x 1980-87 -0386
Log Unemployment Rate in 1980 x Post No Yes Yes Yes Yes No Yes Yes Yes Log 25th Percentile Earnings in 1980 x Post No Yes Yes Yes Yes No Yes Yes Yes Log 50th Percentile Earnings in 1980 x Post No Yes Yes Yes Yes No Yes Yes Yes Fraction 15-24 Years Old in 1980 x Post No Yes Yes Yes Yes No Yes Yes Yes Fraction of Public Housing in 1980 x Post No Yes Yes Yes Yes No Yes Yes Yes PFA Fixed Effects Yes Yes Yes Yes Yes Yes Yes Yes Yes Year Fixed Effects Yes Yes Yes Yes Yes Yes Yes Yes Yes
First Stage Coefficient on ITT 0647 (p = 0015)
0647 (p = 0019)
Sample Size 462 462 462 462 462 756 756 756 756 Number of PFAs 42 42 42 42 42 42 42 42 42
Notes Post-period defined as starting from 1980 the date of adoption of the Right to Buy (RTB) Policy in England and Wales Columns (1)-(5) show ITT and IV results for the 1975-85 period and Columns (6)-(9) show ITT results for the 1975-92 period Tenure duration in public housing measured in years and calculated in 1980 Sales of public housing calculated in 1980-81 Property crime defined as total yearly counts of burglary and theft or handling of stolen goods offences per population at the Police Force Area (PFA) level Regressions weighted by population at the PFA level Standard errors were clustered at the PFA level and p-values from Wild Cluster Bootstrap are reported in parentheses Effect calculated as estimated coefficient divided by pre-1980 mean of dependent variable in ITT control group (Public Housing Sales by 1981 lt p50) indicates significance at 1 indicates significance at 5 indicates significance at 10
53
Table 6 Estimates of Impact of Right-To-Buy Scheme on Violent Crime
ITT 1975-85 IV 1975-85 ITT 1975-92 (1) (2) (3) (4) (5) (6) (7) (8) (9)
(Log RTB Sales in 1980-81) x Post -0001 (p = 0166)
-0001 (p = 0104)
(Log Tenure gt= p50) x Post -0000 (p = 0186)
-0001 (p = 0124)
Log Tenure x Post -0000 (p = 0228)
-0001 (p = 0202)
-0001 (p = 0204)
-0001 (p = 0212)
Log Tenure x 1988-92 -0003 (p = 0383)
Log Tenure x 1980-87 -0000 (p = 0697)
Log Tenure x 1979 -0001 (p = 0480)
-0001 (p = 0493)
-0001 (p = 0480)
-0001 (p = 0481)
Log Tenure x 1978 -0001 (p = 0472)
-0001 (p = 0480)
-0001 (p = 0474)
-0001 (p = 0475)
Log Tenure x 1977 -0000 (p = 0653)
-0000 (p = 0611)
-0000 (p = 0654)
-0000 (p = 0655)
Effect -0 -0 -0333 -0333 -0333 -33333 -0333 -0333 Effect x 1988-92 -1 Effect x 1980-87 -0
Log Unemployment Rate in 1980 x Post No Yes Yes Yes Yes No Yes Yes Yes Log 25th Percentile Earnings in 1980 x Post No Yes Yes Yes Yes No Yes Yes Yes Log 50th Percentile Earnings in 1980 x Post No Yes Yes Yes Yes No Yes Yes Yes Fraction 15-24 Years Old in 1980 x Post No Yes Yes Yes Yes No Yes Yes Yes Fraction of Public Housing in 1980 x Post No Yes Yes Yes Yes No Yes Yes Yes PFA Fixed Effects Yes Yes Yes Yes Yes Yes Yes Yes Yes Year Fixed Effects Yes Yes Yes Yes Yes Yes Yes Yes Yes
First Stage Coefficient on ITT 0647 (p = 0015)
0647 (p = 0019)
Sample Size 462 462 462 462 462 756 756 756 756 Number of PFAs 42 42 42 42 42 42 42 42 42
Notes Post-period defined as starting from 1980 the date of adoption of the Right to Buy (RTB) Policy in England and Wales Columns (1)-(5) show ITT and IV results for the 1975-85 period and Columns (6)-(9) show ITT results for the 1975-92 period Tenure duration in public housing measured in years and calculated in 1980 Sales of public housing calculated in 1980-81 Violent crime defined as total yearly counts of robbery violent and sexual offences per population at the Police Force Area (PFA) level Regressions weighted by population at the PFA level Standard errors were clustered at the PFA level and p-values from Wild Cluster Bootstrap are reported in parentheses Effect calculated as estimated coefficient divided by pre-1980 mean of dependent variable in ITT control group (Public Housing Sales by 1981 lt p50) indicates significance at 1 indicates significance at 5 indicates significance at 10
54
Table 7 Estimates of Impact of Right-To-Buy (RTB) Public Housing Tenure Duration on Local Area Outcomes and (Log) Value of RTB Public Housing Sales on Crime 1975 ndash 1992
Log
Unemployment Rate
Log 25th Percentile Real
Hourly Earnings
Log 50th Percentile Real
Hourly Earnings
Fraction 15-24 Years Old in Population
Total Crime Log Count of Police Officers
(1) (2) (3) (4) (5) (6) Log Tenure x Post -0168
(p = 0313) -0079
(p = 0269) -0076
(p = 0346) 0002
(p = 0746) -0024
(p = 0594) Log Value Sales x Post 0002
(p = 0280)
Effect 0014 0043 Log Unemployment Rate in 1980 x Post No Yes Yes Yes Yes Yes Log 25th Percentile Earnings in 1980 x Post Yes No No Yes Yes Yes Log 50th Percentile Earnings in 1980 x Post Yes No No Yes Yes Yes Fraction 15-24 Years Old in 1980 x Post Yes Yes Yes No Yes Yes Fraction of Public Housing in 1980 x Post Yes Yes Yes Yes Yes Yes PFA Fixed Effects Yes Yes Yes Yes Yes Yes Year Fixed Effects Yes Yes Yes Yes Yes Yes Sample Size 756 756 756 756 756 756 Number of PFAs 42 42 42 42 42 42
Notes Post-period defined as starting from 1980 the date of adoption of the Right to Buy (RTB) Policy in England and Wales Tenure duration in public housing measured in years and calculated in 1980 Value of sales of public housing calculated by 1981 Local area outcomes measured at the PFA level Crime defined as total yearly counts of property and violent crime offences per population at the Police Force Area (PFA) level Property crime defined as total yearly counts of burglary and theft or handling of stolen goods offences per population at the PFA level Violent crime defined as total yearly counts of robbery violent and sexual offences per population at the PFA level Regressions weighted by population at the PFA level Standard errors were clustered at the PFA level and p-values from Wild Cluster Bootstrap are reported in parentheses Effect calculated as estimated coefficient divided by pre-1980 mean of dependent variable in ITT control group (Public Housing Tenure duration in 1980 lt p50) except in columns (1) (2) and (5) where the dependent variable is measured in log values
55
Table 8 Correlation between Right-To-Buy Public Housing Sales and Home Improvement Insurance and Social Behaviour 1988
Installed Double Locks on Outside
Doors
Installed Locks on Windows
Theft Insurance of Home Contents
Installed Burglar Alarm
Neighbourhood Watch Scheme
(1) (2) (3) (4) (5) Panel A RTB Scheme 0217
(p = 0000) 0193
(p = 0000) 0251
(p = 0000) 0043
(p = 0037) 0005
(p = 0828) Effect 606 1304 384 2263 81 Panel B RTB Scheme 0232
(p = 0000) 0168
(p = 0003) 0239
(p = 0000) 0048
(p = 0046) 0018
(p = 0505) Effect 648 1135 365 2526 29 Gender Yes Yes Yes Yes Yes Ethnicity Yes Yes Yes Yes Yes Log Age (quadratic) Yes Yes Yes Yes Yes Past Burglary Victimization Yes Yes Yes Yes Yes Household Type Yes Yes Yes Yes Yes Household Rooms Yes Yes Yes Yes Yes Household Income Yes Yes Yes Yes Yes County Fixed Effects Yes Yes Yes Yes Yes Mean Dep Var Control Group 0358 0148 0654 0019 0062 Sample Size 520 520 520 520 520 Number of Counties 52 52 52 52 52
Notes Treatment group defined as homeowners who rented from the council the property in which they currently reside prior to buying it Control group defined as council tenants who currently intend to buy the public property in which they reside within two years Standard errors were clustered at the county level and p-values from Wild Cluster Bootstrap are reported in parentheses Effect calculated as estimated coefficient divided by mean of dependent variable in the control group (council tenants who intend to buy the public property in which they reside within two years) reported here Panel A reports unconditional OLS estimates and Panel B reports conditional OLS estimates where controls for gender ethnicity age burglary victimization household type household rooms household income employment status and county fixed effects were included in the estimating equation indicates significance at 1 indicates significance at 5 indicates significance at 10
56
Table 9 ITT Estimates of Impact of Right-To-Buy Scheme on Crime Separately by Crime Category
Property Crime Violent Crime Burglary Theft and
Handling of Stolen Goods
Violence Against the Person
Sexual Offences
Robbery
(1) (2) (3) (4) (5)
Panel A Crime Category 1975 ndash 1985
Log Tenure x Post -0004 (p = 0083)
-0004 (p = 0070)
-00002 (p = 0531)
0000 (p = 0894)
-00003 (p = 0082)
Effect -0309 -0132 -0104 0021 -87392 Log Unemployment Rate in 1980 x Post Yes Yes Yes Yes Yes Log 25th Percentile Earnings in 1980 x Post Yes Yes Yes Yes Yes Log 50th Percentile Earnings in 1980 x Post Yes Yes Yes Yes Yes Fraction 15-24 Years Old in 1980 x Post Yes Yes Yes Yes Yes Fraction of Public Housing in 1980 x Post Yes Yes Yes Yes Yes PFA Fixed Effects Yes Yes Yes Yes Yes Year Fixed Effects Yes Yes Yes Yes Yes
Sample Size 462 462 462 462 462 Number of PFAs 42 42 42 42 42
Panel B Crime Category 1975 ndash 1992
Log Tenure x Post -0006 (p = 0016)
-0006 (p = 0130)
-00004 (p = 0447)
0000 (p = 0987)
-00004 (p = 0090)
Effect -0489 -0191 -0191 0002 -127
Log Unemployment Rate in 1980 x Post Yes Yes Yes Yes Yes Log 25th Percentile Earnings in 1980 x Post Yes Yes Yes Yes Yes Log 50th Percentile Earnings in 1980 x Post Yes Yes Yes Yes Yes Fraction 15-24 Years Old in 1980 x Post Yes Yes Yes Yes Yes Fraction of Public Housing in 1980 x Post Yes Yes Yes Yes Yes PFA Fixed Effects Yes Yes Yes Yes Yes Year Fixed Effects Yes Yes Yes Yes Yes
Sample Size 756 756 756 756 756 Number of PFAs 42 42 42 42 42
Notes Post-period defined as starting from 1980 the date of adoption of the Right to Buy (RTB) Policy in England and Wales Panel A shows results for the 1975-85 period and Panel B shows results for the 1975-92 period Tenure duration in public housing measured in years and calculated in 1980 Yearly counts of crime were measured at the Police Force Area (PFA) level for all crime categories Regressions weighted by population at the PFA level Standard errors were clustered at the PFA level and p-values from Wild Cluster Bootstrap are reported in parentheses Effect calculated as estimated coefficient divided by pre-1980 mean of dependent variable in ITT control group (Public Housing Tenure duration in 1980 lt p50) indicates significance at 1 indicates significance at 5 indicates significance at 10
57
Table 10 Summary Data for Long-Difference Analysis
Percentiles Mean Standard Deviation Min Max p25 p50 p75 p90 Housing Variables 1Public House Sales 1980-1992 3718 3429 151 33386 1843 2643 4223 7857 2Public House Stock 1980 15032 16757 2180 148394 6358 8912 18018 32832 12 29 13 0 116 22 27 35 42 Crime Variables All Crime Rate -0020 0011 -0075 0002 -0026 -0019 -0013 -0008 Property Crime Rate -0015 0009 -0064 0001 -0019 -0013 -0009 -0006 Violent Crime Rate -0005 0004 -0018 0001 -0007 -0005 -0003 -0001 Covariates Log Unemployment Rate 0466 0462 -0816 1901 0183 0476 0768 1004 Log 25th Percentile Real Hourly Earnings -0084 0058 -0278 0139 -0117 -0080 -0047 -0018 Log 50th Percentile Real Hourly Earnings -0080 0064 -0288 0096 -0114 -0083 -0036 -0002 Fraction of 15-24 Year Olds in Population -0000 0009 -0035 0034 -0004 0001 0004 0009 Observations 293
Notes Crime variables are measured as crime rates at the Local Authority (LA) level Crime defined as total yearly counts of property and violent crime offences per population at the LA level Property crime defined as total yearly counts of burglary and theft or handling of stolen goods offences per population at the LA level Violent crime defined as total yearly counts of robbery violent and sexual offences per population at the LA level Local area variables are the log of the unemployment rate the 25th percentile log real hourly wage and the share of 15-24 year olds in the population each measured at the LA geography
58
Table 11 IV Estimates of Impact of Change in Public Housing Stock 1980-1992 on Change in Crime Rate 2003-2017
Δ All Crime Rate
Δ Property Crime Rate
Δ Violent Crime Rate
(1) (2) (3) (4) (5) (6) (7) (8) (9) RTB Sales 1980-1992 1980 Residential Stock
-0339 (0053)
-0310 (0050)
-0245 (0042)
-0236 (0038)
-0218 (0037)
-0179 (0032)
-0103 (0017)
-0092 (0016)
-0073 (0014)
Changes in Covariates Log Unemployment Rate 0003
(0002) 0002
(0002) 0002
(0002) 0001
(0002) 0001
(0001) 0001
(0001) Log 25th Percentile Earnings -0048
(0023) -0055 (0020)
-0034 (0017)
-0039 (0016)
-0014 (0008)
-0013 (0006)
Log 50th Percentile Earnings 0009 (0022)
0011 (0018)
0009 (0016)
0001 (0001)
-0001 (0007)
-0001 (0001)
Fraction 15-24 Year Olds 0428 (0104)
0250 (0095)
0278 (0077)
0169 (0074)
0149 (0034)
0119 (0029)
Crime Rate in 1980 All Crime Rate in 1980 -0319
(0053)
Property Crime Rate in 1980 -0203 (0043)
Violent Crime Rate in 1980 -1718 (0287)
Observations 293 293 293 293 293 293 293 293 293
Notes Table reports Instrumental Variable estimates Crime defined as total yearly counts of property and violent crime offences per population at the LA level Property crime defined as total yearly counts of burglary and theft or handling of stolen goods offences per population at the LA level Violent crime defined as total yearly counts of robbery violent and sexual offences per population at the LA level Dependent variable is the change in the Local Authority (LA) crime rate between 2003 and 2017 for each crime type denoted by column headings Independent variables are i) total Right-to-Buy sales within the LA for the period 1980 to 1992 (divided by 1980 residential stock) ii) changes in the log unemployment rate in the 25th percentile log real hourly wage and in the share of 15-24 year olds in the population each measured at the LA level iii) crime rates in 1980 for each crime type denoted by column headings measured at the Police Force Area (PFA) level The instrument for i) is the stock of public housing in the local authority in 1980 (divided by 1980 residential stock) indicates significance at 1 indicates significance at 5 indicates significance at 10
59
Table 12 IV Estimates of Impact of Change in Public Housing Stock 1980-1992 on Changes in (Log) Average House Price and Conservative Vote Share
Δ (Log) Average
House Price
Δ Con Vote Share
in LA
(1) (2) RTB Sales 1980-1992 1980 Residential Stock -1327
(0475) 1757
(0352) Changes in Covariates Log Unemployment Rate -0070
(0021) -0014 (0017)
Log 25th Percentile Earnings -0740 (0213)
0379 (0177)
Log 50th Percentile Earnings -0069 (0198)
-0111 (0158)
Fraction 15-24 Year Olds -8575 (1005)
-1188 (0891)
Observations 290 235
Notes Table reports Instrumental Variable estimates In Column (1) the dependent variable is the change in the log of the average house price in the Local Authority (LA) between 2003 and 2017 In Column (2) the dependent variable is the change in the Conservative vote share in Local Authority elections between 19956 and 201415 Independent variables are i) total Right-to-Buy sales within the LA for the period 1980 to 1992 (divided by 1980 residential stock) ii) changes in the log unemployment rate in the 25th percentile log real hourly wage and in the share of 15-24 year olds in the population each measured at the LA level The instrument for i) is the stock of public housing in the local authority in 1980 (divided by 1980 residential stock) indicates significance at 1 indicates significance at 5 indicates significance at 10
APPENDIX ndash ONLINE ONLY
A Data Sources
a Public Housing Stock and Residential Stock in 1980
Public housing stock records for 1980 are sourced from the Chartered Institute of Public Finance and Accountancy (CIPFA) Rate Collection Statistics 1980-81 Actuals SIS ref 4282 This publication is based on data returned by authorities from DoE forms VO7140 The data covers 33 London Boroughs 34 Metropolitan District Councils 286 English Non-Metropolitan District Councils and 37 Welsh District Councils which we refer to in the main paper as Local Authorities The data cover 973 of total rateable hereditaments The number of residential properties in the Local Authority is stated at Column 2 lsquoDomesticrsquo with the number of public house properties in the Local Authority stated at Column 22 lsquoCouncil Dwellingsrsquo These data were extracted from hard copy held by UK libraries
b Right-to-Buy Public Housing Sales
Data on the number of public housing properties sold each year through the Right-to-Buy scheme by each Local Authority for the period 1980 - 2001 are sourced from the CIPFA Housing Revenue Account (HRA) The HRA records expenditure and income on running a councilrsquos own housing stock and closely related services or facilities which are provided primarily for the benefit of the councilrsquos own tenants Under the Housing Act 1985 Local Authorities are obliged to report revenues from public house sales via their HRA These data are accessed under license from CIPFA For further details see httpswwwcipfaorgpolicy-and-guidancepublications (link last accessed on 28 March 2020) We use these data in our main analysis For Figures 1 and 2 we also source data on sales under the Right-to-Buy scheme after 2001 These data are provided by the Department for Communities and Local Government Table 685 For further details see httpswwwgovukgovernmentstatistical-data-setslive-tables-on-social-housing-sales (link last accessed on 28 March 2020)
c Crime Area-level crime data compiled by the Home Office and published annually in Criminal Statistics for the period between 1975 and 1992 were sourced from the archives of the LSE Library where both hard and soft copies of the data can be accessed Yearly crime records of all Local Police Forces in England and Wales were available at the Police Force Area (PFA) level and with the sole exception of the City of London they were used in this analysis Area-level crime data compiled by the Office for National Statistics (ONS) and published annually on the ONS website for the period between 2003 and 2017 were available at the Local Authority (LA) level Due to the redrawing of LA boundaries over time it was not possible to include all LAs in the analysis Our analysis for the period between 2003 and 2017 therefore includes 293 LAs These data can be freely accessed here httpswwwonsgovukpeoplepopulationandcommunitycrimeandjusticedatasetsrecordedcrimedataatcommunitysafetypartnershiplocalauthoritylevelcurrent (link last accessed on 28 March 2020)
d Local Area Circumstances and Housing Tenure Local area circumstances were measured using the New Earnings Survey (NES) provided by the Department for Employment for the period 1975-1992 and using the version of the Annual Population Survey (APS) that is publicly available on the Nomis website for the period 2003-2017 Access to data on local unemployment rates during the period 1975-1992 was obtained from the Department of Employment Permission to access the NES data must
61
be obtained via the UK Data Service and are downloadable at the following link httpsbetaukdataserviceacukdatacataloguestudiesSearch=new20earnings20surveyampRows=10ampSort=1ampDateFrom=440ampDateTo=2020ampPage=1 (link last accessed on 28 March 2020) The Nomis website can be freely accessed here httpswwwnomiswebcouk (link last accessed on 28 March 2020) Local area population data compiled by the Home Office and published annually in Criminal Statistics for the period between 1975 and 1992 were sourced from the archives of the LSE Library where both hard and soft copies of the data can be accessed Area-level population data compiled by the Office for National Statistics (ONS) and published annually on the ONS website for the period between 2003 and 2017 were available at the Local Authority (LA) level These data can be freely accessed here httpswwwonsgovukpeoplepopulationandcommunitypopulationandmigrationpopulationestimatesdatasetspopulationestimatesforukenglandandwalesscotlandandnorthernireland (link last accessed on 28 March 2020) Data on local housing tenure duration were obtained from the 1980 General Household Survey which can be accessed via the UK Data Service and are downloadable at this link (last accessed on 09 July 2020) httpsbetaukdataserviceacukdatacatalogueseriesseriesid=200019
e Home Improvement Insurance and Social Behaviour (Table 8 Appendix Tables A1 and A2) Individual level data on homeownership expenditure individual and property characteristics income employment status and locality of residence used in Table 8 were obtained from the British Crime Survey (BCS) 1988 Access to the BCS 1988 data must be obtained via the UK Data Service and are downloadable at the following link httpsbetaukdataserviceacukdatacataloguestudiesstudyid=2706amptype=Data20catalogue (link last accessed on 28 March 2020)
f Election Results Data on the Conservative vote share in Local Elections for the period 19956 to 201415 are sourced from the British Local Elections Database maintained by the University of Plymouth UK The Conservative vote share is calculated as the proportion of all votes cast in the election for Conservative candidates Ware L Rallings C Thrasher M (2006) British Local Election Database 1889-2003 [data collection] UK Data Service SN 5319 httpdoiorg105255UKDA-SN-5319-1 (link last accessed on 28 March 2020)
g House Prices
House price data is obtained from the UK Land Registry House Price Index (HPI) the UKrsquos official house price index The HPI uses house sales data from HM Land Registry Registers of Scotland and Land and Property Services Northern Ireland and is calculated and maintained by the Office for National Statistics Local Authority house price index values were extracted from the HPI Full File For further details see httpslandregistrydatagovukappdocukhpi (link last accessed on 28 March 2020)
Figure A1 Correlation between Public House building in 1945-64 and Bombs per Dwelling dropped during World War II by Borough in London
Coeff (se) = 2915 (1337)
0
005
01
015
02
Frac
tion
Pub
lic H
ousi
ng in
194
5-64
0 0005 001 0015 002 0025Bombs per Dwelling
Borough Linear Fit
LondonPublic Housing vs Bombs per Dwelling during World War II
Notes The figure shows for each Borough in London the public houses built from 1945-64 as a fraction of the residential stock plotted against the average number of bombs per dwelling A linear function fitting the correlation between the Borough-specific average number of bombs per dwelling and the public housing built from 1945-64 as a fraction of the residential stock is also shown in the figure
63
Figure A2 Residential Housing Stock in 1980 by Local Authority (LA)
a) Public Housing Stock ( Residential Stock)
b) Public Housing Stock (N) c) Residential Stock (N)
Notes Data from 344 Local Authority (LA) Districts in 1980 Panel a shows public housing stock in 1980 within the LA (shown in Panel b) divided by the total residential housing stock in 1980 within the LA (shown in Panel c)
64
Figure A3 Right-to-Buy Public Housing Sales 1980-1992 by Local Authority (LA)
a) Right-to-Buy Public Housing Sales ( 1980 Residential Stock)
b) Right-to-Buy Public Housing Sales (N) c) Right-to-Buy Public Housing Sales ( 1980 Public
Housing Stock)
Notes Data from 344 Local Authority (LA) Districts Panel A shows total RTB public housing sales in the period 1980-1992 as a percentage of the 1980 residential stock in the LA Panel B shows a count of total RTB public housing sales over the period 1980-1992 in the LA Panel C shows total RTB public housing sales in the period 1980-1992 as a percentage of the 1980 public housing stock in the LA
65
Figure A4 Correlation between Crime in 1980 and Right-To-Buy Public Housing Sales by 1981
Coeff (se) = -0021 (0007)
002
004
006
008
Crim
e in
198
0
0 1-05 05Log Public Housing Sales in 1980-81
Police Force Area Linear Fit
Crime in 1980 vs Public Housing Sales in 1980-81
Notes Figure shows for each Police Force Area (PFA) the crime rate in 1980 plotted against the log sales of public housing under the Right-To-Buy (RTB) scheme by 1981 Crime is defined as total yearly counts of property and violent crime offences per population at the PFA level Property crime defined as total yearly counts of burglary and theft or handling of stolen goods offences per population at the PFA level Violent crime defined as total yearly counts of robbery violent and sexual offences per population at the PFA level A linear function fitting the distribution of PFA-specific crime and RTB sales weighted by PFA-specific population size in 1980 is also shown For each PFA in the analysis the horizontal axis shows the log count of sales of public housing under the RTB scheme by 1981 as a percent of the total residential stock in 1980 whereas the vertical axis shows the crime rate in 1980
66
Figure A5 Correlation between Right-To-Buy Public Housing Sales in 1980-92 and Conservative Share in 1977 Local Elections
Coeff (se) = -0000 (0007)
15
2
25
3
Log
Publ
ic H
ousi
ng S
ales
in 1
980-
92
20 30 40 50Conservative Share in 1977 Local Elections
Police Force Area Linear Fit
Public Housing Sales in 1980-92 vs Conservative Share
Notes Figure shows for each Police Force Area (PFA) the sales of public housing under the Right-To-Buy (RTB) scheme by 1992 plotted against the share of conservative votes in the local elections of 1977 A linear function fitting the distribution of PFA-specific sales and conservative votes weighted by PFA-specific population size in 1980 is also shown For each PFA in the analysis the horizontal axis shows the share of conservative votes in the local elections of 1977 whereas the vertical axis shows the log count of sales of public housing under the RTB scheme by 1992 as a percent of the total residential stock in 1980
67
Figure A6 Right-to-Buy Public Housing Sales in 1980-92 and Public Housing Stock in 1980
Coeff (se) = 0180 (0018)
0
01
02
03
RTB
Pub
lic H
ousi
ng S
ales
in 1
980-
92
02 04 06 0801 03 05 07Public Housing in 1980
Local Authority Linear Fit
Public Housing Sales in 1980-92 vs Public Housing in 1980
Notes Figure shows scatter plot of public housing in 1980 (as a proportion of the Local Authority resident stock) on the x-axis and subsequent Right-to-Buy public housing sales between 1980 and 1992 (as a proportion of the Local Authority residential stock) on the y-axis Binned scatterplot of 344 observations
68
Table A1 Correlation between Right-To-Buy Public Housing Sales and Characteristics of Individuals and Households 1988
(Log) Age
Male White British
Income Group
No Rooms Housing Type
Past Burglary Victimization
(1) (2) (3) (4) (5) (6) (7) RTB Scheme 0055
(p = 0230) 0015
(p = 0713) 0018
(p = 0366) -0031
(p = 0489) 0017
(p = 0802) -0078
(p = 0105) 0005
(p = 0886) County Fixed Effects Yes Yes Yes Yes Yes Yes Yes Effect 55 3 19 -34 04 -69 38 Mean Dep Var Control Group 3614 05 0938 0920 4715 1123 0130 Sample Size 520 520 520 520 520 520 520 Number of Counties 52 52 52 52 52 52 52
Notes Treatment group defined as homeowners who rented from the council the property in which they currently reside prior to buying it Control group defined as council tenants who currently intend to buy the public property in which they reside within two years Standard errors were clustered at the county level and p-values from Wild Cluster Bootstrap are reported in parentheses Effect calculated as estimated coefficient divided by mean of dependent variable in the control group (council tenants who intend to buy the public property in which they reside within two years) reported here indicates significance at 1 indicates significance at 5 indicates significance at 10
69
Table A2 Correlation between Right-To-Buy Public Housing Sales and Crime Victimisation 1988
Crime Victimisation (1) (2) (3) (4) (5) (6) Effect Effect Effect RTB Scheme -0202
(p = 0002) -249 -0171
(p = 0059) -211 -0193
(p = 0005) -238
RTB Share -0013 (p = 0430)
-16
County Fixed Effects No Yes No Mean Dep Var Control Group 0810 0810 0810 Sample Size 1058 1058 1058 Number of Counties 53 53 53
Notes Treatment group defined as homeowners who rented from the council the property in which they currently reside prior to buying it Control group defined as council tenants who currently intend to buy the public property in which they reside within two years For each respondent RTB Share calculated as share of other treatment group respondents at the county level (leaving out the respondent herselfhimself) Standard errors were clustered at the county level and p-values from Wild Cluster Bootstrap are reported in parentheses Effect calculated as estimated coefficient divided by mean of dependent variable in the control group (council tenants who intend to buy the public property in which they reside within two years) reported here indicates significance at 1 indicates significance at 5 indicates significance at 10
Recent Issues All CFS Working Papers are available at wwwifk-cfsde
No Authors Title
650 Atsushi Inoue and Lutz Kilian Joint Bayesian Inference about Impulse Responses in VAR Models
649 Lutz Kilian Understanding the Estimation of Oil Demand and Oil Supply Elasticities
648 Lutz Kilian Nikos Nomikos and Xiaoqing Zhou
A Quantitative Model of the Oil Tanker Market in the Arabian Gulf
647 Lutz Kilian and Xiaoqing Zhou Does Drawing Down the US Strategic Petroleum Reserve Help Stabilize Oil Prices
646 Lutz Kilian and Xiaoqing Zhou Oil Prices Exchange Rates and Interest Rates
645 Lutz Kilian and Xiaoqing Zhou Oil Prices Gasoline Prices and Inflation Expectations A New Model and New Facts
644 Olivia S Mitchell Building Better Retirement Systems in the Wake of the Global Pandemic
643 Volker Bruumlhl Mehr Nachhaltigkeit im deutschen Leitindex DAX - Reformvorschlaumlge im Lichte des Wirecard-Skandals
642 Refet S Guumlrkaynak A Hakan Kara Burccedilin Kısacıkoğlu and Sang Seok Lee
Monetary Policy Surprises and Exchange Rate Behavior
641 Sergey Kovbasyuk and Marco Pagano Advertising Arbitrage
640 Sylwia Hubar Christos Koulovatianos and Jian Li
The Role of Labor-Income Risk in Household Risk-Taking
- September 2020
- Abstract
-

3
in crime in the United States and other Western economies in the 1990s and early 2000s (see
Van Dijk and Vollaard 2012)
The RTB experiment provides a unique opportunity both to assess the effectiveness of
selling public housing to grant homeownership rights to families in public housing and to
measure the causal impact of sales of public housing on crime outcomes From the perspective
of a policy maker designing a policy that would alter homeownership rights for the general
population the parameters estimated here are directly of interest4 As such this study
complements the literature that has examined neighbourhood effects on crime by exploiting
the variation in residential locations induced by the Moving To Opportunity (MTO) experiment
in the United States and by other housing policy initiatives in Western economies5
The study of the causal impact of homeownership on crime exploits the unfolding of
the RTB policy and it is investigated separately in the short-run and in the long-run To estimate
the short-run impact of the RTB policy on crime difference-in-differences specifications
exploit the differential intention-to-treat (ITT) effect of the RTB policy across localities RTB
was introduced as a national policy but the intensity of treatment across localities varied with
the predetermined length of tenure duration of incumbent tenants in public housing We explain
how these differences in average tenures across localities arose in the later part of Section 2
Tenure duration determined access to the policy with a minimum tenure duration requirement
of three years together with larger purchase price discounts for those with longer tenures
Variations in the length of tenure duration in public housing at the start of the RTB policy are
shown to be unrelated with other local area socio-economic circumstances such as
unemployment wages fraction of juveniles and fraction of public housing they arise from
historical locality-specific factors and this variation is a key part of the research design
Estimates reveal sizeable negative short-run effects of increased incidence of RTB sales
of public housing on crime The crime reduction appears sizeable since the early 1980s and it
remains visible in the late 1980s and early 1990s until the end of the Thatcher era These short-
run estimates uncover an elasticity of crime with respect to RTB incidence of roughly -03 so
4 Homeownership is likely to have important implications also for intergenerational mobility a link that until recently has been little analysed (see Blanden and Machin 2017 and Bell Blundell and Machin 2018) 5 See eg Katz Kling and Liebman (2001) Ludwig Duncan and Hirschfield (2001) Kling Ludwig and Katz (2005) Ludwig and Kling (2007) Kling Liebman and Katz (2007) Sanbonmatsu Ludwig Katz Gennetian Duncan Kessler Adam McDade and Lindau (2011) Ludwig Duncan Gennetian Katz Kessler Kling and Sanbonmatsu (2013) Sciandra Sanbonmatsu Duncan Gennetian Katz Kessler Kling and Ludwig (2013) Damm and Dustmann (2014) Bernasco de Graaf Rouwendal and Steenbeek (2017) and Rotger and Galster (2019)
4
that a 10 percent increase in incidence of RTB public housing sales reduces crime by around 3
percent This conclusion is robust to a battery of additional tests including variations in the
specification of the econometric model We explain in later sections how we deal with the
obvious issue of feedback insofar as local crime rates may affect the willingness of public
tenants to exercise their right to purchase their public house through the RTB policy
The paper examines other potential mechanisms that could underlie the finding that
RTB purchases reduce crime rates These hypothesised channels include varying local area
circumstances local household compositional changes arising from the RTB policy and the
potential role of feet-dragging practices in certain localities arising from the political affiliation
of the local authorities responsible for administering the policy at the local level The findings
suggest that none of these factors explains the crime reduction generated by the RTB policy
The market value of the RTB sales at the onset of the scheme does not predict the evolution of
crime either suggesting that the crime reduction attributed to the RTB scheme is genuine and
it is not the spurious result of better amenities in areas with more RTB sales
By contrast the findings are strongly indicative of the likelihood that local communities
were induced to change their behaviour and attitudes towards criminal activity Indeed as
suggested in the quote by Margaret Thatcher cited previously this was one of the aims of the
RTB policy That is to give (generally) working class households access to an owned asset in
order to change their behaviour such as taking greater care of and improving the security of
their property and to change their economic position by giving these households a collateral
asset in financial markets Hence RTB was viewed as a mechanism for improving and
upgrading the economic position of households in neighbourhoods that had been previously
dominated by public housing
The analysis reveals that immediate reductions in crime resulted from the RTB policy
These are very unlikely to be attributable to in-migration as the rules of the RTB scheme
effectively barred resale of the RTB-purchased property for a fixed period after purchase We
show that crime rates were reduced immediately after the introduction of the policy and not
once the restraint on resale was no longer binding The analysis also shows that after
purchasing their properties from the local council incumbent ex-tenants started to gentrify their
properties by installing double locks on doors and windows by installing burglar alarms and
by purchasing insurance for their home contents Locality-specific estimates show that
incumbent tenants who bought under the RTB scheme experienced greater crime reduction in
counties in which the RTB scheme was associated with greater home improvement On the
5
other hand they did not become more likely to participate in a neighbourhood watch scheme
suggesting that the RTB policy did not generate detectable changes in social capital The
changing behaviour of incumbent ex-tenants resulting from RTB purchases did not result in
increased victimisation of neighbouring householders nor in a substitution of offenders away
from burglary towards other crimes Results indicate that the RTB policy led to significant
reductions in burglaries and robberies while theft and handling of stolen goods offences as
well as other violent crime offences remained unchanged
The paper next moves on to study the long-run persistence of the impact of the RTB
policy on crime To estimate the long-run crime effects of the RTB policy extended crime data
from 2003 to 2017 are used Instrumental variable regressions are used to quantify the effects
of public housing sales from 1980 to 1992 on the change in the crime rate from 2003 to 2017
Public housing sales are instrumented using variation in the initial public housing stock which
is a valid instrumental variable once the initial level of local crime and contemporaneous
community characteristics are controlled for In line with the short-run estimates long-run
estimates show that localities where the RTB policy triggered larger increases in
homeownership also experienced faster reductions in crime throughout the later period
Additional tests reveal that by 2017 these localities also experienced slower increases
in house prices In the standard definition gentrification arises as middle-class salary earners
displace lower income or unwaged households as a result of rising house prices In the case of
tenure changes induced by RTB sales the long time horizon of this research is required to
identify displacement since it takes time before RTB purchasers who are ex-tenants move on
sell or rent out their properties allowing other households to move into the neighbourhood
However the reduced growth in house prices documented here in areas of high RTB sales is
inconsistent with the standard gentrification story and suggests that the supply-side shock of
low-quality properties entering the housing market induced by the RTB policy outweighed any
displacement of original tenants There is also a political response as by 2017 Conservative
votes increased more rapidly in localities most affected by the RTB scheme This further points
towards RTB resulting in changing attitudes and behaviour of local communities
The rest of the paper is structured as follows Section 2 outlines the relevant literature
and describes the RTB policy In doing so it seeks to emphasise the scale of public housing in
the UK by 1980 (in comparison to say the United States) and to explain why the spatial
distribution of public housing does not simply map into low income areas at the start of the
RTB policy Data sources are described in Section 3 and the empirical analysis is presented in
6
Section 4 Finally section 5 provides a concluding discussion including an important word of
caution in assessing the overall merits of the RTB policy
2 Housing and Crime
i Previous literature
A large spatial crime literature shows that crime rates especially crimes against property are
higher in areas with high concentrations of public housing even when controlling for other
salient characteristics of the resident population This has been a major driver of policy in the
United States towards the replacement of inner city public housing projects by rent subsidies
and by shifting tenants to mixed-tenure low housing density urban neighbourhoods (see for
example Schill 1993 Olsen 2003 and Kling Ludwig and Katz 2005) A similar association
between crime and public housing has been observed in the UK (Murie 1997) More broadly
studies show that increased local homeownership rates are associated with a range of spillover
effects on the locality such as lower crime rates greater civic involvement and improved child
development (see for example DiPasquale and Glaeser 1999 and Haurin Dietz and
Weinberg 2003)
A well-known difficulty in the large literature on housing tenure type household
composition and crime is the range of feedback effects which suggest a number of channels
exist by which crime affects the composition of neighbourhoods and vice versa Cullen and
Levitt (1999) is one of a number of studies that suggest that higher rates of crime especially in
inner cities led to changes in neighbourhood composition by social class and economic status
Much of this literature on the lsquoflight to the suburbsrsquo took place against the backdrop of rising
crime in inner cities in the United States in the 1990s It has been more challenging to show
that falling crime in both earlier and later periods has been the primary driver of the so-called
gentrification of inner city areas (contrast the findings of McDonald 1986 with Ellen Horn
and Reed 2017)
In addition there is robust evidence that higher crime is associated with lower property
values (see Gibbons 2004 for an illustration using data for London) and this feedback effect
will induce spatial equilibria of neighbourhood composition when account is taken of not just
crime rates but other neighbourhood (dis)amenities transport costs and so on For example
Owens Mioduszewski and Bates (2019) show that civil gang injunctions in Southern
California a common type of place-based crime control policy in the area led to approximately
a 3 decline of residential propertiesrsquo values from 2002 to 2015 reflecting individual
7
willingness-to-pay for the civil liberties affected by the injunction6 Morales-Mosquera (2019)
finds that police station openings generate localized crime reductions and housing value
increases in three major cities in Colombia
A large literature has addressed the basic identification problem of assessing
neighbourhood effects on crime by exploiting the variation in residential locations generated
by the Moving To Opportunity (MTO) experiment in the United States Starting in 1994 the
MTO experiment assigned housing vouchers via random lottery to thousands of public housing
residents with children in five cities in the United States to relocate to less-distressed areas
Exposure to violence and crime victimization in distressed areas were in fact key reasons for
low-income families to participate in the MTO experiment Katz Kling and Liebman (2001)
show that the MTO experiment improved childrenrsquos behaviour adult mental health and
perceived safety in treatment group families in Boston while also reducing exposure to
violence and crime victimization Similar findings emerge in Baltimore in the study of Ludwig
Duncan and Hirschfield (2001) who find that the MTO experiment led to a large reduction in
juvenile arrests for violent crimes and to some increase in property-crime arrests
Kling Ludwig and Katz (2005) document important gender differences in the impact
of the MTO experiment on crime While both property and violent crime decreased among
young women young men experienced a decrease in violent crime but also an increase in
property crime a few years after relocating to the new neighbourhood7 Ludwig and Kling
(2007) show the importance of racial segregation among other neighbourhood characteristics
in predicting youth violence while Kling Liebman and Katz (2007) document the beneficial
impact of the MTO experiment on the education risky behaviour and physical health of young
women As the opposite effects are found for young men their findings further suggest that
young men and women respond differently to similar new neighbourhood circumstances
Using more recent data Sanbonmatsu et al (2011) conclude that the MTO initiative
enhanced safety in treatment group families while Ludwig et al (2013) find gender differences
in the impact of the MTO experiment on risky behaviour and health of juveniles to persist 10-
15 years after the start of the experiment while finding no evidence of persistent reductions in
youth violence rates However Sciandra et al (2013) show little evidence of crime reductions
6 Grogger (2002) and Ridgeway Grogger Moyer and MacDonald (2018) are two earlier studies of the effects of gang injunctions on crime 7 The comparative advantage of juveniles relocated from disadvantaged backgrounds in exploiting the available property-crime opportunities in their new neighbourhoods and the different ways in which male and female juveniles respond to similar new neighbourhood circumstances help the authors rationalize these findings
8
in the long run as neighbourhood conditionsrsquo effects of MTO dissipate reflecting that crime is
more affected by contemporaneous neighbourhood circumstances than by past neighbourhood
circumstances8 To understand why low-income families remain segregated into high-poverty
areas Bergman et al (2020) randomly allocate housing vouchers to 430 recipient families with
a child in the Seattle and King County areas concluding that barriers in the housing search
process are a critical source of residential segregation by income
Our findings on homeownership also relate to Engelhardt et al (2010) who analyse an
experiment in Oklahoma that subsidised saving for down payments for homeownership among
a group of low-income individuals using Individual Development Accounts (IDA) with
randomly assigned treatment status In their setting the treatment is the offer of matching
funding to the IDA since only a fraction of those who were treated chose to take up the offer
and to undertake a purchase and of course these may not be a random group among the treated
They find only weak evidence that homeowners who benefited from the policy spent more
money on lsquocommunity-facingrsquo activities such as external improvements to their house or
involvement in civic events in the 30 months after the take-up of homeownership status
Recent studies have sought to estimate the effects of homeownership and gentrification
on crime focusing on neighbourhood composition effects of policy changes Aliprantis and
Hartley (2015) and Sandler (2017) examine the effect on local crime rates in Chicago when
20000 units of concentrated high-rise public housing were demolished over the period 1999
to 2011 Both studies albeit using slightly different methodologies track relocated individuals
to other neighbourhoods and they conclude that these demolitions led to a net reduction in
crime rates ndash primarily violent (gang-related) crime but also theft robbery and use of guns
Chyn (2018) shows the lasting beneficial effects of housing demolitions in Chicago on the
schooling professional and criminal trajectories of displaced individuals Autor Palmer and
Pathak (2019) examine the impact of the deregulation of rents in Cambridge Massachusetts
on local crime rates They hypothesize that rent deregulation raised property values and caused
a differential mix of households to locate across local neighbourhoods thereby
disproportionately reducing the rate of property crime in neighbourhoods that had previously
been subject to rent control They find a significant reduction in crime overall which was then
8 The MTO experiment of course affected also other dimensions of familiesrsquo and childrenrsquos lives Most notably it generated moderate improvements in school quality (Fryer and Katz 2013) as well as educational and economic benefits for young children including for young boys (Chetty Hendren and Katz 2016) Substantial exposure effects of neighbourhoods are also presented in Damm and Dustmann (2014) Bernasco de Graaf Rouwendal and Steenbeek (2017) Altonji and Mansfield (2018) Chetty and Hendren (2018a) Chetty and Hendren (2018b) Rotger and Galster (2019) and Aliprantis and Richter (forthcoming)
9
capitalised into higher property values9 In a related study Diamond and McQuade (2019)
document the crime-reducing effect of the Low Income Housing Tax Credit
Most of the studies that have examined the effects of gentrification on crime exploit
policy changes such as the lifting of rent controls and removal of public housing that led low-
income neighbourhoods to increasingly become middle-income neighbourhoods through
outward migration of low-income households and inward migration of higher-income
households Studies that have examined the impact on crime rates of moving tenants out of
public housing into the private sector in the United States and experiments that gave households
incentives to purchase properties are typically based on highly localised data and results are
obtained from relatively short time periods after implementation of the policy10
The main contribution of this study by contrast is to estimate the effect on local crime
rates of increasing homeownership of indigenous communities and to examine the extent to
which this induced behavioural change in these communities This is a novel means which has
not been documented to date and which complements the existing literature by which
homeownership and housing policy may contribute to reduce crime The RTB policy
constitutes an ideal policy experiment to study this and it is therefore exploited here using
large-scale data over multiple decades
ii Public Housing in England and Wales
The stock of public housing in England and Wales grew rapidly throughout the
twentieth century over the period from the end of World War I in 1918 until the start of the
Right-to-Buy policy in 1980 By 1980 public housing in England and Wales was more
extensive more heterogeneous and more spatially dispersed than in the United States11 These
spatial outcomes arose from the decisions to rebuild outside as well as within inner city areas
in turn stemming from the partially random distribution of war destruction and from the
differential application of planning restrictions across the UK12
9 A recent paper on the UK (Alonso Andrews and Jorda Gil 2019) suggests that crime rates were reduced by expenditures from the Urban Renewal Fund although these expenditures did not directly involve changes in housing tenure their idea is closely related to the lsquoneighbourhood externalitiesrsquo argument 10 The reviewed literature examining the MTO experiment constitutes an exception 11 For examples of the heterogeneous nature of public housing across towns see Table 1 in Disney and Luo (2017) 12 For evidence on the continued important role of planning restrictions on private housing supply in England see Hilber and Vermeulen (2014)
10
Figure 1 illustrates housing tenure shares by tenure types in England and Wales
between 1918 and 2011 As illustrated in the Figure in 1918 more than three-quarters of
residential housing in England and Wales was privately rented with public housing accounting
for only 1 of the housing stock As a result of a public sector building program and the
development of the mortgage market both private homeownership and public renting
(primarily from local public authorities) rose steadily until 1980 by which time private renting
had shrunk to a little over one tenth of housing tenure While the increase in homeownership
prior to 1980 is mostly explained by the development of a formal mortgage market in the
deepening retail financial sector two main factors explain the increase in public housing prior
to 1980
First municipal government investment programs developed after the World War I
Much of the stock of privately-owned housing which was rented out was in very poor
conditions post-1918 Replacement of the housing stock was hindered by high re-building costs
coupled with borrowing constraints for many small landlords (Disney and Luo 2017) Under
the Housing and Town Planning Act 1919 much of the responsibility for replacement housing
and slum clearance was taken over by local authorities However replacement public housing
was not simply built in inner-city areas where slum clearance had taken place but also in so-
called suburban lsquogardenrsquo estates and even lsquogarden townsrsquo located on greenfield sites Some of
these sites were developed as large-scale public housing projects often with low-density low-
rise properties others in mixed estates with a mixture of public and private housing Later in
the interwar period as economic conditions improved local authorities reverted to replacing
inner-city slums with local high-rise buildings in the same neighbourhood while private
developers tended to build in suburbs and rural areas13 However planning (zoning) restrictions
which tend to be much tighter in the UK than in the United States limited the growth of private
housing in some areas
Second a further impetus to public housebuilding occurred after 1945 Between 1939
and 1945 around four million homes in the UK were destroyed or seriously damaged by
bombing Although bombing campaigns were initially targeted at military targets during 1939-
45 they gradually evolved into area bombing strategies focusing on cities Until near the end
of the World War II bombing (by all sides) was notoriously inaccurate lacking precision
instruments for target identification Target visibility relied on key geographical features such
13 For further discussion see httpsfetuweacukconwebhouse_agescouncil_housingprinthtm and Jones and Murie (2006)
11
as coasts and large rivers and towns and cities in such localities were bombed heavily Other
areas remained relatively unscathed because of weather conditions distance counter-jamming
measures lsquofakersquo fires lit to divert bombers to relatively uninhabited areas and so on14 This
scattering of war destruction implies that there was a random element to where replacement
housing was required once the hostilities had ended As a result of war damage many areas
saw the rapid construction of publicly-owned housing estates to replace damaged and destroyed
homes This link at the local level between bombing and public housebuilding is illustrated in
Figure A1 in Appendix A which uses official Bomb Census data from
httpbombsightorgdatasources to show that the location of bombings across boroughs in
London during the World War II is a significant predictor of where publicly-owned housing
estates were built in the post-war period in London
The somewhat random nature of bombing is illustrated by the fact that whilst areas that
were targeted such as the London Docks already contained high-density low income housing
bombs also fell heavily in the more affluent boroughs of south and south east London which
thereby constructed more public housing after 1945 than equally affluent suburbs to the north
of the capital Other areas where major rebuilding took place were also mixed-income
communities Nevertheless after the post-war reconstruction period that lasted well into the
1950s new public properties tended to be built to replace slums in low-income
neighbourhoods often as high-rise developments with private housebuilding being the
dominant feature of more affluent areas By 1980 close to one-third of the residential housing
stock in England and Wales was public housing
For the analysis that follows in particular to understand the identification strategy that
is taken it is very important to understand how a household accessed a public house and how
the length of tenure within public housing was determined Policies varied between local
authorities but priority for access to public housing would initially be given to local residents
who required rehousing as a result of slum clearance or war destruction Thereafter most local
authorities operated a queuing system by which eligibility depended on evidence that the
person or household would otherwise be homeless on family size and on means of household
income support if any Local residents were prioritised The extent of rationing (waiting time)
for public housing if any in a given area would depend on the supply of public housing that
had been constructed relative to demand Incoming applicants from outside the local authority
14 There is a vast literature on this An early volume that revealed efforts to thwart the accuracy of the German bombing campaign is Jones (1978)
12
area would typically be at the back of the queue In turn residents already within public housing
could apply to move from one public property to another ndash typically by requesting lsquoupgradingrsquo
as a nicer property became available ndash for example a house with a yard or garden rather than
an apartment Tenure within any given property would therefore depend on the availability and
heterogeneity of the public housing stock within an area
iii The ldquoRight to Buyrdquo Policy
Shortly after Margaret Thatcherrsquos election as UK Prime Minister the Housing Act 1980
introduced a statutory Right to Buy (RTB) for public tenants with at least 3 yearsrsquo tenure
duration in their council house ndash lsquostatutoryrsquo in the sense that the policy had to be implemented
by all local councils (previously a few Conservative councils had allowed their tenants to buy
their public property generally at market price) The RTB policy allowed tenants to buy their
properties at substantial discounts to market value ranging from 33 with three yearsrsquo
residence to a maximum of 50 after 20 yearsrsquo residence Local councils were also obliged to
make mortgages available to would-be purchasers although this feature became less pertinent
as capital markets were liberalised during the 1980s The discount on the sale price would be
repayable if the property was resold within five years of an RTB purchase although a
purchased property could be rented out
There were additional constraints in the 1980 legislation particularly in relation to the
sale of publicly-owned apartments but these too were relaxed in the mid-1980s Purchase of
public housing under RTB also became more attractive with later efforts to raise heavily-
subsidised rents on public tenancies towards lsquomarketrsquo levels15 Figure 2 indicates the pattern of
sales under the RTB policy in England (the other UK nations had similar patterns ndash indeed the
large stock of public houses in Scotland was sold even more rapidly leading to a blanket ban
on further sales by the Scottish government some decades later) The two peaks in sales in the
1980s are associated with the introduction of the RTB policy and its liberalisation in the mid-
1980s thereafter with the better-quality tenants (and public housing) having moved into the
private sector the rate of sales declines
The Thatcher era ended in 1992 and the incoming Labour government in 1997 did not
attempt to reverse the policy completely but did tighten eligibility conditions limit access to
publicly-provided mortgages and impose caps on the maximum discounts in some areas where
15 The economic incentives implied by these various policies are explored at some length in Disney and Luo (2017) but not considered in detail here
13
sales had diminished the public housing stock quickly (since local authorities still had a
statutory responsibility to house homeless families) On the other hand the government also
introduced a similar but less generous version of RTB known as lsquoRight to Acquirersquo which
allowed tenants in some cases to purchase public housing (typically managed by lsquoarms lengthrsquo
housing associations and charities rather than directly by local public authorities) This led to
a brief upsurge in sale volumes as illustrated in Figure 2 although sales continued in any event
as public tenants acquired sufficient yearsrsquo residency in their property to be eligible for the
RTB scheme
Not surprisingly RTB purchases were selective both by household type and by quality
of property For example in Derby a prosperous town in mid-England which has traditionally
specialised in high-end manufacturing since at least the 1920s over 80 of the large stock of
public properties in 1980 were in the form of detached semi-detached or terraced housing in
suburbs and less than 20 in the form of (mostly) high-rise apartments in the inner city By
1991 27 of Derbyrsquos stock of public housing had been sold off with apartments now
constituting nearly 30 of the residual stock
In contrast in Hackney an inner London borough in 1980 around 80 of the public
housing stock was in apartments mostly in high-rise estates By 1991 most of the non-
apartment stock in Hackney had been sold off but the overall stock of public housing had
increased because the local council had constructed or purchased further apartments RTB
purchasers themselves were typically older had higher incomes and they were less likely to
be unemployed (Gregg Machin and Manning 2004) Hence sales of public houses were
evidently non-random and related to local crime rates resulting in a well-known endogeneity
issue in the regression analysis that is addressed empirically in Section 4
3 Data
Our empirical analysis combines multiple data sources at annual frequency Housing data are
provided by the Chartered Institute of Public Finance and Accounting (CIPFA) The data are
provided at the Local Authority (LA) level for the 314 LAs in England and Wales in 198016
The data include details of the composition of the residential housing stock (owned privately
rented and public housing) and the number of sales under the Right-to-Buy (RTB) scheme in
each year LAs had a statutory requirement to report RTB sales to CIPFA and provide details
16 The number of LAs changes over time due to some mergers and due to boundary redrawing There were 314 LAs in England and Wales in 1980 at the onset of the RTB policy
14
of the revenue flow received from the sales Data on average length of tenure duration in public
housing by locality in 1980 are derived from the UK General Household Survey (GHS)
Two sources of crime data complement the housing data The short-run analysis which
covers the period 1975 to 1992 uses administrative crime records collected by the police and
published annually by the UK Home Office in Criminal Statistics This period spans five years
prior to the introduction of the RTB policy in 1980 through to the end of the period of
Thatcher-led Conservative governments in 1992 These data are provided at the Police Force
Area (PFA) geography a geographic unit that sits above and nests LAs17 With the sole
exception of Londonrsquos financial district commonly known as ldquothe City of Londonrdquo and which
constitutes an independent PFA data are used for all 42 PFAs that exist in England and
Wales18
The long-run analysis which covers the period 2003 to 2017 draws upon
administrative crime records at the LA level recorded by the police and published online by
the UK Office for National Statistics (ONS) The long-run analysis starts in 2003 because there
was a very substantial change in reporting rules in the late 1990s and early 2000s in the UK
that had different effects across PFAs and crime types Thus it is not possible to use police
recorded crime data before and after 2002 in the same analysis The City of London PFA is
also excluded from the long-run analysis For both the short-run and long-run analyses the
measures of crime used in the empirical analysis are the numbers of recorded offences of
different crime categories per population Thus the data capture incidents of crime recorded
and classified by all UK local police forces The data contain offence rates for five crime
categories property crime defined as the sum of burglary and theft and handling of stolen
goods offences and violent crime defined as the sum of violence against the person sexual
offences and robbery offences
The LA-level housing data were combined with the crime data to create two data sets
for the analysis For the short-run analysis running from 1975 to 1992 the LA-level crime data
were aggregated at the PFA level using the ONS Open Geography database and then joined to
the PFA-level crime data The construction of the short-run panel is not affected by changes in
LA geographical boundaries as in all cases these occur within PFA units Hence a balanced
17 For example London LAs sit within the Metropolitan Police PFA 18 The City of London constitutes an additional PFA that is independent from the rest of London However this PFA is excluded from this analysis because most property in the area is non-residential hardly anybody lives there and consequently few RTB sales took place there
15
panel of 42 PFAs spanning 18 years was obtained with the PFA-year being the unit of analysis
Data from the GHS on tenure were matched to PFA from regional data subdivided into lsquoruralrsquo
lsquourbanrsquo and lsquomixed urban-ruralrsquo areas
For the long-run analysis (2003 to 2017) which uses a long-difference model
observations of the change in crime measured at the LA level for the period 2003-2017 were
joined with observations of total RTB sales also at the LA level for the period 1980-1992 Not
all observations could be joined due to changes in LA geographical boundaries that preclude a
one-to-one mapping between LAs in the earlier and later period This analysis is therefore
based on 293 observations that could be joined between the earlier and latter periods
These data sources were complemented with administrative records of local area
conditions In the short run analysis data from the New Earnings Survey (NES) and the
Department for Employment were used to calculate local area conditions from 1975 to 1992 in
each PFA In the long run analysis local area conditions at the LA level from the Annual
Population Survey (APS) complement the housing and crime data19
i Summary Statistics
Summary data for the composition of the housing stock in 1980 just prior to the RTB
policy start are provided in the first five rows of Table 1 On average 272 of all residential
properties in a PFA were publicly-owned equating to approximately 14000 individual
properties per LA More than 1 of all residential properties were sold under the RTB scheme
by 1981 ie in the first year of the policy20 A key criterion for eligibility to the RTB scheme
and for the size of the discount on the market value of public properties was the length of tenure
duration in public housing of incumbent tenants Table 1 shows that on average incumbent
tenants in 1980 had spent 11 years in their public properties with some areas featuring much
larger average years of tenure duration than others The distribution of the public housing rate
as well as of public housing sales and tenure duration in 1980 are heterogeneous across PFAs
The data show a quite high standard deviation of public housing stock as a proportion of the
residential stock (the standard deviation shown in Table 1 is 86) as well as some outlier
LAs ndash in 10 of LAs public housing accounted for more than one third of the residential
housing stock
19 Additional details of the data used in the empirical analysis and instructions for data access are provided in the Appendix 20 Our data are for England and Wales The higher proportion of the public housing stock at the start of RTB for the UK arises from the initial high levels of public houses in Scotland and Northern Ireland
16
Figure A2 Panel A in Appendix A illustrates the distribution of public housing across
LAs in 1980 (expressed as a percentage of the residential housing stock) Panel B illustrates
the distribution of public housing in absolute terms and Panel C shows the distribution of
residential housing in absolute terms Similarly Figure A3 Panel A in Appendix A illustrates
the distribution of public housing sales across LAs in the 1980s-90s (expressed as a percentage
of the residential housing stock in 1980) Panel B illustrates the distribution of public housing
sales in the 1980s-90s in absolute terms and Panel C shows the distribution of public housing
sales across LAs in the 1980s-90s (expressed as a percentage of the public housing stock in
1980) All distributions in Figures A2 and A3 have a long right tail further illustrating the
uneven distribution of the public housing stock public housing sales the total residential stock
and the ratios of these across LAs in 1980
The remaining rows of Table 1 provide summary data for crime rates and other
covariates in 1980 Crime rates are measured as cases per individuals Thus Table 1 shows that
45 criminal offences per 100 individuals were recorded on average in a PFA in 1980 Total
crime is defined as the sum of property crime and violent crime and these measures of crime
are the key outcomes of interest here21 Property Crime defined as the sum of burglary and
theft and handling of stolen goodsrsquo offences is overwhelmingly the most common category of
crime in 1980 Only the most serious types of violent offences such as homicide aggravated
assault sexual offences and robberies were recorded and published by the Home Office since
the 1970s in England and Wales Minor violent offences only started to be recorded in the UK
in the early 2000s Thus violent crime is defined here as the sum of serious violence against
the person sexual offences and robbery
Table 1 also shows four additional variables which are used as covariates in regression
models the local log real hourly wages at the 25th and 50th percentiles of the distribution the
local log unemployment rate and the local share of 15-24 years olds in the population in the
PFA Since potential offenders are likely to earn low wages and have low levels of labour
market attachment (Machin and Meghir 2004) the 25th percentile of log wages and log
unemployment are likely to be relevant features of the labour market in the determination of
criminal activity while the 50th percentile of log wages is also included to depict the
distribution of wages Finally Table 1 also suggests that approximately 16 of the overall
population is aged 15 to 24 Since the likelihood to commit crime is observed almost
21 The analysis does not include drugs offences as no data on drugs offences in England and Wales was collected and published by the UK Home Office for the period of this study
17
universally to be highest in the late teens and then decrease later in life (Quetelet 1831 and
Landersoslash Nielsen and Simonsen 2016) the fraction of individuals aged 15 to 24 in the
population is also likely to be a relevant determinant of the local criminal activity
4 Empirical Analysis
i Public housing and crime in the initial conditions
The analysis of the relationship between density of public housing and crime rates prior to the
introduction of the Right-to-Buy (RTB) policy is a natural starting point to the empirical
approach Figure 3 illustrates the relationship between the public housing rate (the percentage
share of public housing in the residential housing stock in the PFA) and the crime rate for the
42 PFAs included in the analysis in 1980 A clear positive association appears between the
concentrations of public housing and crime across PFAs in England and Wales with the size
of the dots on the scatter plot illustrating the PFArsquos population size in 1980 The positive
relationship between the public housing rate and the crime rate in Figure 3 is statistically
significant at all conventional levels Using the same data an OLS regression of the following
form was also estimated
119862119862119894119894 = α + β1119867119867119894119894 + β2119935119935119894119894 + ϵ119894119894 (1)
where 119862119862119894119894 is the crime rate in PFA 119894119894 119867119867119894119894 is the public housing stock as a proportion of the
residential housing stock 119935119935119894119894 is a vector of PFA level variables and ϵ119894119894 is the error term Equation
(1) was estimated for total crime as well as separately for property crime and violent crime
Estimates of Equation (1) are shown in Table 2 The Table shows estimates of crime as
a function of the public housing stock (expressed as a proportion of the residential stock)
Columns (2) (4) and (6) additionally control for the log real hourly wages at the 25th and 50th
percentiles of the distribution within the PFA the log unemployment rate in the PFA and the
share of 15-24 year olds in the population in the PFA Public housing is positively and precisely
correlated with all crime outcomes The coefficient on total crime in column (2) of 0064
implies that a 01 unit increase in the size of the public housing stock measured as a proportion
of the residential stock in the PFA in 1980 (approximately a one standard deviation increase)
is associated with an increase in the crime rate of 00064 units equating to approximately half
of one standard deviation increase in crime The positive correlation between public housing
and criminality is not affected by the inclusion of local area variables in Equation (1)
ii Identification issues
18
The primary object of this study is to quantify the causal impact of homeownership on
crime rates In our empirical setting the Right-to-Buy (RTB) policy can be interpreted as a
relaxation of a supply constraint on available property for homeownership by allowing public
housing tenants to purchase their homes at a subsidy Of course this policy does not directly
generate a pure natural experiment in observed RTB sales for at least two reasons First there
may be important time-varying omitted factors that drive both the decision by a tenant to
purchase the house and the local crime rate Second RTB sales are a result of demand for
public housing purchases together with the local supply of housing for sale With demand being
determined at least in part by local crime rates OLS estimates of the relationship between
crime rate and public housing sales will suffer from endogeneity bias It is very likely that the
decision by the tenant to purchase the house may itself be partly determined by the level and
dynamics of local crime Indeed unsurprisingly a negative relationship appears between crime
rates and public housing sales in 1980 in Figure A4 in Appendix A further suggesting that
RTB sales were not orthogonal to crime rates at the onset of the RTB policy
iii Short-run estimates
a Empirical strategy
Our empirical strategy exploits two approaches to estimating the effect of sales of
public housing on crime rates that isolate supply-side variation in exposure to the RTB policy
This variation arises from differences across localities in the potential exposure to RTB sales
The analysis of the short-run impact of public housing sales on crime defines a series of
difference-in-differences specifications whereby the years of tenure duration in public housing
of incumbent tenants in 1980 are used to proxy the Intention-To-Treat (ITT) intensity of the
RTB treatment at the PFA level The national level policy albeit introduced uniformly across
localities in 1980 was specified in such a way that eligibility to the RTB scheme and the size
of the discounts varied across localities depending on the average number of years spent in
public properties by the incumbent tenants prior to the reform
In particular the Housing Act of 1980 introduced a statutory right to buy for public
tenants with at least three yearsrsquo tenure duration in their public house Moreover discounts on
the sale price relative to the market value of the property linearly increased with public housing
tenure duration ranging from 33 percent for public housing tenants with three yearsrsquo residence
through to a maximum of 50 percent after twenty yearsrsquo residence Thus the discounts to
purchase a public property generated by RTB were directly related with the years of tenure
19
duration in public housing when the RTB scheme was introduced and years of tenure duration
in public housing in 1980 constitutes a predetermined source of differential exposure to the
RTB scheme that could not be gamed in 1980
In Columns (7) and (8) in Table 2 equation (1) is re-estimated and the fraction of public
housing in the PFA the log real hourly wages at the 25th and 50th percentiles of the distribution
within the PFA the log unemployment rate in the PFA and the share of 15-24 year olds in the
population in the PFA are used to predict log average years of tenure duration in public housing
in the PFA in 1980 As Table 2 shows none of these variables predicts public housing tenure
duration in 1980 suggesting that its distribution across regions and thus RTB eligibility in 1980
is orthogonal to local area circumstances and the average socio-economic status of individuals
Combined with the fact that RTB came into force shortly after the 1979 election of the new
Thatcher Government and people in the 1970s could not freely move across public properties
(especially between local authorities) but rather had to apply and join a potentially long queue
prior to being able to move in and out of public properties this makes the distribution of RTB
eligibility at the onset of the policy quasi-random
Eligibility to the RTB scheme and in turn intensity of adoption varied across regions
according to the composition of the local housing stock which was determined by historical
factors Public housing sales under the RTB policy began in most LAs in October 1980 (the
1980 Housing Act was passed on 8 August with most LAs starting to process applications for
public housing purchases soon thereafter) Figure 2 shows that the RTB policy resulted in an
initial peak in public housing sales from October 1980 to 1982 after which RTB sales
continued at a slower pace The initial eligibility to the RTB scheme was mainly responsible
for this and it is therefore exploited empirically in the econometric analysis
Since the discount on the sale price would be repayable if a property was resold within
five years of an RTB purchase and the RTB scheme was extended to flats in 1986 the short-
run analysis is conducted separately on the first five years of the RTB scheme ie up until
1985 and on the entire Thatcher era ie up until 1992 When the analysis is restricted to the
first five years of the RTB scheme years of tenure duration in public housing of incumbent
tenants in 1980 are also used as an instrumental variable (IV) for the actual sales of public
housing under the RTB scheme in the first year of the RTB scheme The same IV approach is
not used for later years because starting from 1986 the possibility that properties bought under
the RTB scheme were resold in the private market cannot be ruled out ex ante
20
Figure 4 illustrates a strong positive correlation between the log average years of tenure
duration in public housing in the PFA in 1980 (on the x-axis) and the log percentage of the
residential stock in the PFA which was sold-off in the first year of the RTB scheme ie by
1981 (on the y-axis) These initial sales of the residential stock in the first year of the RTB
scheme are also shown in Figure 5 to be positively correlated with the percentage sold-off
between 1980 and 1992 (on the y-axis) Therefore while RTB public housing sales by 1992
may be the endogenous result of the evolution of crime post 1980 and thereby result in a well-
known problem of reverse causation in our estimates the public housing tenure duration in
1980 constitute an ITT proxy that strongly predicts the actual intensity of the RTB scheme at
the PFA level
For this analysis data on crime rates public housing tenure duration and local area are
used from 1975 to 1992 The estimating difference-in-differences specification can be
expressed as follows
119862119862119894119894119905119905 = αi+αt + 1205731205731 lowast 11987711987711987711987711987711987711989411989480 + 1205731205732 lowast 119875119875119875119875119875119875119875119875119905119905 + 1205731205733 lowast 11987711987711987711987711987711987711989411989480 lowast 119875119875119875119875119875119875119875119875119905119905 + 1205731205734119935119935119946119946119946119946 + 120598120598119894119894 (2)
where 119862119862119894119894119905119905 is the crime rate in PFA i in each year t from 1975 to 1992 αi is a set of PFA fixed
effects and αt is a set of year fixed effects 11987711987711987711987711987711987711989411989480 is log average years of tenure duration in
public housing ie a measure of RTB eligibility in 1980 defined both as a continuous variable
and as a binary variable indicating if average years of public housing tenure duration in PFA i
were greater than or equal to the median value of average years of public housing tenure
duration at the national level in 1980 Post is a dummy variable that takes up value 1 starting
from 1980
The main estimand of interest is 1205731205733 the coefficient associated with the interaction
between 11987711987711987711987711987711987711989411989480 and Post which measures the impact of the initial RTB eligibility-induced
shock to homeownership on crime A negative coefficient associated with 1205731205733 would imply that
PFAs that experienced greater RTB eligibility in 1980 experienced lower relative crime rates
by 1992 due to the RTB scheme This parameter is directly of interest to a policy maker wishing
to modify homeownership rights for the general population as tenure duration in public
housing was an explicit predetermined policy criterion in the Housing Act of 1980 that could
not be gamed in the short run and that determined eligibility to the RTB scheme
The causal interpretation of 1205731205733 crucially relies on the absence of differential pre-
treatment trends between PFAs exposed to different degrees of RTB eligibility in 1980 Insofar
as RTB eligibility in 1980 does not predict crime trends prior to the RTB policy then 1205731205733 can
21
be interpreted as the ITT causal impact of the RTB policy on crime The potential presence of
differential pre-treatment crime trends between PFAs that experienced different degrees of
RTB eligibility is tested and results are presented below Finally 119935119935119946119946 is a vector of local area
controls measured in 1980 and interacted with the Post variable which includes the fraction of
public housing in the PFA the log real hourly wages at the 25th and 50th percentiles of the
distribution within the PFA the log unemployment rate in the PFA and the share of 15-24 year
olds in the population in the PFA while 120598120598119894119894 is the error term Due to the small number of clusters
(42 PFAs) in the analysis p-values were derived for inference from Wild Cluster Bootstrap
estimation with standard errors clustered at the PFA level (see Cameron Gelbach and Miller
2008)
b Short run results
Table 3 presents unconditional difference-in-differences estimates based upon the
dichotomous treatment version of Equation (2) (calculated absent any of the labour market
controls or fixed effects stated in the equation) Panel A shows results for the 1975-85 period
when property resales should have been extremely rare since the discount on the sale price
would be repayable and Panel B shows results for the 1975-92 period In the calculations
PFAs are split into two groups by the magnitude of 11987711987711987711987711987711987711989411989480 in which the above-or-equal-to-
median group is described as the lsquoITT treatmentrsquo group and the below median group is
described as the lsquoITT controlrsquo group Columns 1 and 2 state the pre-1980 average crime rate in
the PFA the post-1980 average crime rate in the PFA and the within-PFA post-pre difference
Column 3 shows the pre-1980 and post-1980 differences between the ITT treatment and ITT
control PFAs Column 4 shows the unconditional difference-in-differences estimate and
column (5) shows the unconditional difference-in-differences estimate deflated by the mean
level of crime in the ITT control group prior to 1980 in percent terms (the unconditional percent
effect) The unconditional difference-in-differences coefficient estimate is negative and
precisely defined in both Panels A and B On average PFAs that experienced RTB eligibility
greater or equal to the national median in 1980 experienced overall crime rates that were 85
lower from 1980 to 1985 and roughly 11 lower from 1980 to 1992
Figure 6 plots the raw data underlying these statistically significant difference-in-
differences estimates The Figure shows average crime rates (weighted by population at the
PFA level) for every year from 1975 to 1992 separately for ITT treatment and ITT control
PFAs The visual inspection of Figure 6 reveals that while crime rates appear on similar trends
prior to 1980 in ITT treatment and ITT control PFAs the gap widened after 1980 with ITT
22
control PFAs experiencing a greater increase in crime rates starting from the early 1980s
Compared with the 1970s a wider gap in crime rates is also observed in the early 1990s when
the short run analysis terminates These unconditional estimates and those in Table 3 suggest
that sales of public housing under the RTB scheme may have helped tackle the nationwide
rising trend in criminality experienced in England and Wales in the 1980s
Table 4 subjects these results to a set of more robust econometric specifications
Columns (1)-(3) show ITT results for the 1975-85 period columns (4) and (5) show IV results
for the 1975-85 period and Columns (6)-(9) show ITT results for the 1975-92 period All
estimated specifications include PFA fixed effects and year fixed effects and the models in
Columns (2)-(5) and (7)-(9) additionally include the interaction between the Post variable in
equation (2) and local area variables measured in 1980 (ie fraction of public housing log of
the unemployment rate log of real hourly earnings at the 25th and 50th percentiles of the
distribution and the fraction of 15-24 year olds in the population) Columns (1) to (8) report
the ITT and IV estimates of 1205731205733 the coefficient associated with the interaction between 11987711987711987711987711987711987711989411989480
and Post in equation (2) whereas the model in Column (9) shows the results separately for the
first eight years of the RTB policy 1980-87 and for the subsequent years that followed the
1987 UK General Elections when Margaret Thatcher was re-elected as UK Prime Minister
1987-92 In all specifications standard errors were clustered at the PFA level and Wild Cluster
Bootstrap techniques were used for inference due to the small number of clusters
Column (1) shows results based upon the dichotomous treatment version of 11987711987711987711987711987711987711989411989480 in
Equation (2) indicating that ITT treatment group PFAs experienced a 10 percent reduction in
crime by 1985 Column (2) shows results based upon the continuous treatment version of
11987711987711987711987711987711987711989411989480 and when the interactions between local area circumstances measured in 1980 and the
Post variable are also added to the estimated specification Column (2) also shows negative
and statistically significant estimates suggesting that the conclusion from Table 3 that RTB
eligibility led to a reduction in crime in the 1980s and early 1990s is robust to equation
specification In particular estimates in Column (2) uncover an elasticity of crime with respect
to RTB eligibility of approximately -019 implying that a 10 percent increase in eligibility to
the RTB scheme reduced crime by around 19 percent within the first five years of the scheme
The causal interpretation of these estimates crucially relies on the absence of
differential pre-treatment crime trends between PFAs that were exposed to different degrees of
RTB eligibility in 1980 Column (3) shows event-study estimates where the log average years
23
of tenure duration in public housing in 1980 was interacted with three pre-reform years Two
key facts emerge from Column (3) First Column (3) shows there to be no differential pre-
treatment trends between PFAs that received different exposures to the RTB scheme In other
words RTB eligibility in 1980 does not predict crime trends across PFAs prior to 1980 This
implies that any post-1980 deviation from the existing trend that is predicted by the eligibility
to the RTB scheme in 1980 can be interpreted as the ITT impact of the RTB scheme on crime
Second estimates in Column (3) show a reduction in crime rates among PFAs that experienced
greater RTB eligibility in 1980 uncovering an elasticity of crime with respect to RTB
eligibility of approximately -028
Columns (4) and (5) show the IV estimates for the period 1975-85 and they retrieve
similar slightly larger negative elasticities In both columns the actual public housing sales
under the RTB scheme in the first year of the policy ie in 1980-81 are instrumented using
the log average years of tenure duration of incumbent tenants in public housing in 1980 Both
columns show negative and statistically significant estimates with Column (5) also showing
there to be no differential pre-treatment trends between PFAs that received different exposures
to the RTB scheme Similarly to the ITT estimates in Column (3) IV estimates in columns (4)
and (5) uncover an elasticity of crime with respect to RTB sales of approximately -028 to -
042 implying that a 10 percent increase in the RTB public housing sales reduced crime by
around 3 to 4 percent by 1985
In the remaining Columns (6)-(9) the analysis is extended up until 1992 the year when
the Thatcher era ended but very similar conclusions emerge Column (6) shows results based
upon the dichotomous treatment version of 11987711987711987711987711987711987711989411989480 in Equation (2) and it indicates that ITT
treatment group PFAs experienced a 128 percent reduction in crime by 1992 Columns (7) and
(8) show results based upon the continuous treatment version of 11987711987711987711987711987711987711989411989480 and when the
interactions between local area circumstances measured in 1980 and the Post variable are also
added to the estimated specification Columns (7) and (8) also show negative and statistically
significant estimates uncovering an elasticity of crime with respect to RTB eligibility of
roughly -028 to -036 implying that a 10 percent increase in eligibility to the RTB scheme
reduced crime by around 28 to 36 percent by 1992 When broken down between the years
prior to 1987 and later years Column (9) shows that a sizeable and statistically significant
crime-reducing effect of RTB eligibility appears in both the 1980s and early 1990s with little
variation appearing in the estimated crime-reducing effects of RTB across time and model
specifications
24
Throughout these estimates the magnitude of the crime reduction caused by the RTB
scheme by 1992 appears very similar to the magnitude observed by 1985 In the early years of
the RTB scheme no one who purchased a property under the RTB scheme could have possibly
resold it while continuing to benefit from the large discounts offered by the Thatcher-led
government under the RTB scheme as explained above Thus crime reductions from 1980-
85 as well as 1980-87 are very unlikely to result from the practice of reselling properties
previously bought under the RTB scheme to incomers that are more affluent If the ldquomigration-
basedrdquo gentrification of certain areas of the country was the underlying mechanism driving
these crime reductions significance in the estimates should not appear until the late 1980s
when the first properties bought under the RTB scheme in 1980 could be resold without having
to renounce the RTB discounts However this is not what is found here A crime reduction
appears in the early years of the RTB scheme a result that is rather consistent with behavioural
changes within the local communities that were more exposed to the provisions of the scheme
Estimates for property crime in Table 5 tell a similar story while no detectable effects
of RTB eligibility and RTB sales appear for violent crime in Table 6 Both Tables are organised
in the same way as Table 4 In both Tables all estimated specifications include PFA fixed
effects and year fixed effects with the models in Columns (2)-(5) and Columns (7)-(9)
additionally including the interactions between the Post variable in equation (2) and local area
variables measured in 1980 (ie fraction of public housing log of the unemployment rate log
of real hourly earnings at the 25th and 50th percentiles of the distribution and the fraction of
15-24 year olds in the population) In all specifications standard errors were clustered at the
PFA level and Wild Cluster Bootstrap techniques were used again for inference due to the
small number of clusters
Regardless of whether estimates are derived from the 1975-85 period or the 1975-92
period and regardless of whether ITT or IV estimates are considered results in Table 5 indicate
that the RTB scheme had a negative and significant impact on property crime uncovering an
elasticity of property crime with respect to the RTB scheme of approximately -03 to -04
implying that a 10 percent increase in eligibility to the RTB public housing sales reduces
property crime by around 3 to 4 percent Also in Table 5 Columns (3) (5) (8) and (9) show
there to be no differential pre-treatment trends between PFAs that received different exposures
to the RTB scheme as none of the estimated pre-treatment coefficients appears statistically
significant Columns (1) to (5) show that a RTB-induced property crime reduction was already
visible by 1985 and Column (9) also shows that a sizeable and statistically significant property
25
crime-reducing effect of RTB eligibility appears both in the 1980s and early 1990s consistent
with the notion that RTB eligibility led to behavioural changes within the local communities
rather than gentrification induced by in-migration
Table 6 studies the effect of RTB eligibility on violent crime and no significance
appears in the estimates Also in this case ITT and IV estimates from the 1975-85 period reach
the same conclusion as ITT estimates from the 1975-92 period Estimates Columns (3) (5) (8)
and (9) show there to be no differential pre-treatment trends between PFAs that received
different exposures to the RTB scheme suggesting that RTB eligibility in 1980 does not predict
violent crime trends either across PFAs prior to 1980 and further supporting the causal
interpretation of the estimates presented in Tables 4 and 5 and discussed in this section
c Political Colour Labour Markets Local Amenities and Police Deployment
Why did greater eligibility to the RTB scheme lead to a detectable reduction in crime
The mechanisms underlying the findings in Tables 3-6 and Figure 6 were investigated through
a variety of statistical tests First one may worry that this analysis is spuriously picking up
some other PFA-specific characteristics such as the political affiliation of the local
administration To test this data on the political ldquocomplexionrdquo of the PFA in the local elections
in 1977 the latest local elections prior to the election of Margaret Thatcher as UK Prime
Minister in 1979 were used Although RTB sales were only used in the IV estimates and not
in the ITT reduced-form estimates of equation (2) presented in Tables 4-6 one may worry that
the de facto supply-side availability of public housing for RTB sales might have differed by
local political control If for example pro-Thatcher Conservative-controlled LAs were more
willing to fulfil their statutory responsibility to accelerate sales through faster processing (or
potentially be more likely to advertise and encourage the possibility locally) then this omitted
confound might weaken the predictive power of public housing tenure duration and co-
determine RTB sales and crime However a scatter plot in Figure A5 in Appendix A suggests
no correlation between the conservative vote share within the PFA and RTB sales from 1980-
92 as a percentage of the residential stock in 1980 Estimates of the impact of eligibility to the
RTB scheme on crime were also produced when a set of interactions between the Conservative
vote share within the PFA in the 1977 local elections and year fixed effects were added to the
econometric specification22 Results are unchanged with the inclusion of this additional
variable which suggests that our results are not caused by Labour controlled LAs opposing
22 The Conservative vote share is the share of Conservative votes in all votes cast in the parliamentary constituencies nested within the PFA
26
this policy for political reasons while facing greater local crime rates This holds true regardless
of whether local area variables are included in the analysis
One additional concern may be that the reduction in crime rates observed in areas with
greater RTB eligibility in 1980 may reflect some underlying trends in local labour markets If
for example incumbent tenants spent more years in public housing prior to 1980 in areas that
faced more favourable labour market prospects thus facing greater discounts under the RTB
scheme and these same areas then experienced reduced criminality thanks to the improved
labour market circumstances then the reduction in crime observed in Tables 3-6 and Figure 6
would be erroneously attributed to the RTB scheme Models to test for the effects of RTB
eligibility on local labour market conditions were therefore estimated and results are displayed
in Table 7 Whether the unemployment rate the 25th percentile real hourly earnings or the 50th
percentile real hourly earnings are modelled as dependent variable no evidence appears that
eligibility to the RTB scheme in 1980 predicted the evolution of local labour market conditions
in the 1980s and early 1990s These results mitigate the concern that our estimates might be
picking up the effect of other local area circumstances that interacted with public housing sales
over time in the 1980s
Eligibility to the RTB scheme in 1980 does not even seem to predict the local fraction
of 15-24 year olds in the population in the 1980s and early 1990s a relevant finding that further
suggests that migration and a compositional change in the local population do not seem to be
the key mechanisms at play here If a ldquomigration-basedrdquo gentrification was behind the main
results of this paper RTB eligibility would predict the composition of the local population in
the 1980s and 1990s If for example all RTB purchasers had rented out their properties to
students right after purchasing them (and this was the true driver of the crime reduction in
Tables 4 and 5) then RTB eligibility should be a positive predictor of the fraction of 15-24
year olds in the population However this is not what is found here
One further concern may be that initial RTB eligibility positively correlates with the
quality of local amenities across regions in England and Wales The initial uptake of the RTB
scheme may have been greater in areas with ldquobetter-qualityrdquo public housing Similarly one
may worry that in 1980 only the ldquowell-offrdquo public tenants were able to exploit the RTB scheme
and purchase their houses while ldquothe very poorrdquo were left behind Both these scenarios would
imply that in the short run analysis initial RTB sales may be picking up other relevant
socioeconomic components of communities If initial RTB sales were concentrated among
27
better-off areas or individuals the crime-reducing effect that is observed may not be due to the
sales of public housing but rather due to the fact that we are not comparing like-with-like
To test for the possibility that RTB sales grew faster in areas with greater-quality public
housing the main model was re-estimated and the treatment variable replaced with the value
of RTB sales in the first year of the RTB scheme in place of the eligibility to the RTB scheme
in 1980 The result of this exercise is shown in column (5) of Table 7 When crime is regressed
on the average (log) value of RTB transactions in the first year of the RTB scheme the
estimated coefficient appears small in magnitude as well as in percent terms and very
statistically insignificant Thus unlike RTB eligibility the value of RTB sales does not predict
the evolution of crime This conclusion is robust to the set of controls added to the estimating
equation (fixed effects only or fixed effects and local area variables) In sum the initial
eligibility to RTB sales not their average value predicts the reduction in crime since the 1980s
Finally one may worry that the RTB scheme may have coincided with differential
policing strategies across regions and that this may have resulted in differential crime detection
rates across regions If for example fewer police officers were deployed in areas with greater
RTB sales in 1980 our findings may reflect the lower crime detection rates of the police in
these areas rather than a genuine reduction in crime Availability of data on the number of
officers employed in each PFA since 1975 allowed us to estimate the impact of RTB eligibility
on police deployment This is a further test of whether indeed the RTB scheme made some
areas of the country safer or whether it coincided with a decrease in police deployment To
examine this idea the dependent variable in the difference-in-differences specification was
replaced with the log number of police officers deployed by the PFA Results are displayed in
column (6) of Table 7 and the coefficient of interest is economically small and not statistically
significant suggesting that the greater exposure to the RTB scheme of some PFAs did not
coincide with differential policing strategies In turn this mitigates the concern that differential
policing strategies and crime detection rates across regions may have coincided with the RTB
scheme and further suggests that our main results reveal the genuine reduction in criminality
generated by the RTB scheme
d Homeownership and Behavioural Change
Did the RTB policy induce indigenous local communities to refurbish their properties
One possibility is that home upgrading by purchasers under the RTB scheme explains the
observed reduction in crime (absent any clear migration labour market or amenity differential
28
between areas that were exposed to differing degrees to the RTB policy) The British Crime
Survey (BCS) 1988 contains a rich set of variables concerning homeownership and crime23
Based on the information contained in the BCS 1988 it was possible to define a treatment
group of incumbent tenants who had previously rented from the council then subsequently
purchased the property in which they currently reside and a control group of council rental
tenants who stated that they currently intend to buy the public property in which they reside
within two years This provides a natural comparison group against which to estimate the
effects of purchase on behavioural change to build at least strongly suggestive evidence for the
effects of the policy Table A1 in the Appendix shows these treatment group individuals and
control group individuals to be observably indistinguishable in terms of age gender ethnicity
income number of rooms in the household household type (eg flat or house) and past
experiences of burglary victimization For each of these individual and household
characteristics Table A1 presents a balancing test that retrieves an insignificant estimate thus
showing the suitability of the comparison group
Table 8 shows a comparison of home improvement expenditure insurance and social
behaviour between these two groups of observably similar individuals Panel A shows
unconditional OLS estimates thus providing a simple comparison of the means between these
two groups OLS estimates in Panel B were derived controlling for the set of variables for
which balancing was tested in Appendix Table A1 ie gender ethnicity a quadratic of age
past experiences of burglary victimization in the property of residence type of property (eg
flat or house) number of rooms in the property household income band and county fixed
effects Thus while self-selection into the treatment group is a possibility controlling for this
large set of observables and restricting the treatment and control groups to incumbent
individuals that only seem to differ in their timing of willingness to purchase their property
from the council within two years should mitigate the concern that self-selection is driving our
results here To be consistent with all other results at PFA level standard errors were clustered
at the county level the closest geography to a PFA that was available in these data As
respondents are drawn from 52 counties Wild Cluster Bootstrap p-values were estimated again
as in all the analysis discussed above
The results in Table 8 show that incumbent tenants who bought from the council were
significantly more likely to install double locks to outside doors to install locks in windows
23 The same detail of information is not available from any other BCS survey from 1982 to 1992 when the short run analysis ends
29
and have the contents of their home insured against theft The same individuals were also
significantly more likely to install burglar alarms a relatively rare security device in England
and Wales in 1988 Finally these individuals were not more likely to join a neighbourhood
watch scheme a community-based crime prevention measure in which neighbours help each
other in a form of informal guardianship The comparison group here is always council tenants
who intended to buy the public property in which they resided in 1988 within two years
Consistent with the finding in Appendix Table A1 that observable characteristics are equally
distributed between treatment group individuals and control group individuals the comparison
of Panel A and Panel B shows that these conclusions are unchanged whether the set of
observable controls described above is included in the estimating equation or not
Additional analysis using the BCS data corroborates our main findings for the effects
of the RTB policy on crime Table A2 in the Appendix uses the BCS data to compare crime
victimization rates among treated versus control group individuals The Table shows that in
1988 treatment group homeowners reported between 20 and 25 less cases of crime
victimisation since the beginning of 1987 than control group council tenants Columns (1) and
(3) show that this holds true regardless of whether county fixed effects are controlled for
Column (5) of the Table also shows results when county fixed effects are replaced by the share
of treatment group homeowners in the county24 The coefficient associated with
homeownership under the RTB scheme remains negative and statistically significant In
contrast the share of treatment group homeowners in the county itself does not predict crime
victimisation Thus while reiterating that the crime reductions in Tables 3-6 and Figure 6 are
indeed driven by RTB sales these results also show that RTB sales did not lead to increased
crime victimisation of neighbouring occupiers of public housing
Figure 7 shows county-specific estimates of the correlation between RTB sales and
crime victimisation plotted against county-specific estimates of the correlation between RTB
sales and home improvement A linear function fitting the distribution of county-specific
estimates is also shown This appears negative and statistically significant showing that on
average incumbent tenants who bought under the RTB scheme experienced greater crime
reduction in counties in which the RTB scheme was associated with greater home
improvement
24 For each respondent this share was calculated at the county level leaving out the respondent herselfhimself from the calculation
30
The low-income homeownership experiment in Oklahoma investigated by Engelhardt
et al (2010) showed little or no significant evidence of home improvements of this sort
subsequent to purchase but that study covered a relatively short time interval post-purchase
and take-up of the subsidy was relatively low In contrast the results in Table 8 for doorsrsquo and
windowsrsquo locks and burglar alarms are consistent with the notion that homeownership led
people to refurbish their properties Homeownership may have given greater access to loans
and financial markets in general and the result for theft insurance plausibly reflects this These
results help rationalise the reduction in property crime Controlling for past experiences of
burglary victimisation also mitigates the concern that RTB purchasers may have experienced
greater crime victimisation in the past and that this may drive the results in Table 8 In contrast
since homeowners were no more likely to join a neighbourhood watch scheme no evidence
appears here that the RTB induced greater investment in social capital in local communities
where RTB unfolded more intensively
Table A2 in the Appendix suggested that no crime displacement occurred from public
houses sold under the RTB scheme to neighbouring public housing not yet sold under the RTB
scheme However one may also worry that the property crime reduction in Table 5 is entirely
driven by reductions in burglary with potential thieves shifting albeit to a lesser extent to
other thefts in the street Table 9 shows the results of our analyses in Tables 4-6 broken down
by crime categories Panel A shows results for the 1975-85 period and Panel B shows results
for the 1975-92 period Results are displayed separately for the crime categories that constitute
our measure of property crime namely burglary and theft and handling of stolen goods as well
as for the crime categories that constitute our measure of violent crime namely violence against
the person sexual offences and robbery
Breaking down property crime into burglary and theft and handling of stolen goods
reveals that no evidence of such ldquodisplacementrdquo of crime appears The reduction in property
crime is driven by a reduction in burglaries although a reduction in theft and handling of stolen
goods appears in the 1975-85 period ie in Panel A The reduction in theft and handling of
stolen goods does not appear statistically significant by 1992 but certainly no increase in this
crime category appears Moreover and similarly the breakdown of the results for violent crime
by crime category shows no evidence of crime displacement across categories as violence
against the person and sexual offences remain unchanged Interestingly both by 1985 and by
1992 a significant negative effect of the RTB scheme is found on robberies which are
31
categorised as violent crimes here because they involve a violent act but they are also often
economically motivated criminal offences
iv Long-Run Estimates
a Empirical strategy
But what of the long-run consequences of homeownership on crime This section
presents estimates of the long-run effects of homeownership induced by the Right-to-Buy
(RTB) policy on local crime rates To do so an instrumental variable (IV) long-differenced
model specification is used which exploits variation in the size of the public housing stock in
1980 across localities As argued above exposure to the policy was bounded by the size of the
public housing stock in 1980 Localities with less public housing would not experience large
increases in the homeownership rate due to the more limited supply As discussed in Section
2 variation in the size of the public housing stock across localities arose due to historical events
around the period of the two World Wars events which are unrelated to recent dynamics of
crime In formal terms the set of estimating equations can be expressed as follows
1198621198621198941198942017 minus 1198621198621198941198942003 = 119886119886 + 1205731205731 lowast 11986711986712048412048492 + 1205731205732 lowast 11986211986211989411989480 + 1205731205733 lowast 119883119883119894119894 + 120598120598119894119894 (3)
11986711986711989411989492 = 119886119886 + 1205731205731 lowast 11986711986711989411989480 + 120598120598119894119894 (4)
where 1198621198621198941198942017 minus 1198621198621198941198942003 is the change in the crime rate in locality i from 2003 to 2017 and
11986711986711989411989492 is the endogenous change in the size of the public housing stock from 1980 to 1992
expressed as a proportion of the residential stock in 1980 11986711986711989411989492 is therefore instrumented with
11986711986711989411989480 the 1980 level of the public housing stock 11986211986211989411989480 is the crime rate in locality i in 1980 119883119883119894119894
is a vector of contemporaneous local area variables (ie the local log real hourly wages at the
25th and 50th percentiles of the distribution the local log unemployment rate and the local share
of 15-24 years olds in the population) and 120598120598119894119894 is the error term As crime data is available from
2003 at the Local Authority (LA) level this model can be estimated at the LA level
The identifying assumption in the model described in Equations (3) and (4) is that
conditional on the level of crime in 1980 and the set of contemporaneous local area variables
captured in the vector 119883119883119894119894 the size of the public housing stock in 1980 in the LA is exogenous
to the dynamics of crime within the LA in the 2000s The exclusion restriction is that
conditional on the level of crime in 1980 and the set of contemporaneous local area variables
in the vector 119883119883119894119894 the size of the public housing stock in 1980 affects the dynamics of crime in
the 2000s only through public housing sales over the subsequent period
32
b Results
Summary data for the dependent variable in Equation 3 and the set of local area
variables in the vector 119883119883119894119894 are shown in Table 10 The crime rate fell over the period in more
than 90 of LAs The 25th percentile log real hourly wage fell too over the period while the
share of 15-24 year olds in the population remained unchanged and the log unemployment rate
rose (at a national level the unemployment rate rose from 5 in March 2003 to 76 by March
2013 during the period following the financial crisis)
The instrumental variable regression requires a strong first-stage relationship between
the public housing stock in 1980 and subsequent RTB sales over the period 1980-92 Figure
A6 in Appendix A illustrates that there is a strong correlation between the size of the public
housing stock in the LA in 1980 and subsequent sales under the RTB policy The scatterplot in
the Figure shows a strong positive relationship The coefficient (standard error) on the
instrument in the first-stage regression is 0242 (0017) with a F-statistic from the regression
of 19555
Estimates of Equation 3 are shown in Table 11 Estimates are grouped by the three
measures of crime examined above the overall crime rate in columns (1)-(3) property crime
rate in columns (4)-(6) and violent crime rate in columns (7)-(9) The leftmost specification for
each outcome includes only the independent variable of interest 11986711986711989411989492 instrumented by 11986711986711989411989480
For each outcome the coefficient on 11986711986711989411989492 is negative and precisely defined The middle
column of each sub-panel adds local area variables to the model with the rightmost column of
each sub-panel also adding a control for the crime rate in 1980 The coefficient on 11986711986711989411989492 remains
negative and precisely defined in each specification
The coefficient estimates imply that LAs experiencing larger increases in
homeownership experienced more rapid crime reductions The coefficient value of 0244 in
column (3) of Table 11 implies that a five percentage point higher increase in the
homeownership rate due to RTB sales caused an approximately fifty percent faster decline in
crime rate over the period 2003-2017 an effect approximately equal to a one standard deviation
higher speed of reduction in crime Among the covariates in all of the regressions the controls
for the level of crime in 1980 return negative and precisely defined coefficients These imply
a degree of convergence in LA level crime rates LAs with higher crime rates in 1980
experienced a faster decline in crime in the early 2000s conditional on the other covariates in
the regression
33
c Additional Long-Run Estimates
Did the RTB scheme leave any detectable mark on house prices and political
preferences of indigenous communities In this final sub-section the long-run effects of
increases in the homeownership rate brought about by RTB sales on house prices and on voting
behaviour are examined The increase in the homeownership rate via RTB sales increased the
potential housing supply to the private resale market Hence all else being equal RTB sales
would be expected to decrease house prices over time On the other hand the RTB scheme
may have also potentially increased the demand for housing in the private resale market
Moreover in the presence of outward migration of low-income households and inward
migration of higher-income households RTB sales may have had a positive impact on house
prices over time
To explore the impact of RTB sales on house prices in column (1) of Table 12 the
dependent variable was replaced with the change in the log of the average house price in the
LA over the period 2003 to 2014 House price data is obtained from the Land Registry house
price index The set of control variables is the same as in the models shown in Column (2) of
Table 11 The coefficient on RTB sales is negative and precisely defined and it implies that a
five percentage point increase in the homeownership rate due to RTB sales decreased house
prices over the period by approximately 65 This is an economically modest effect in the
context of an approximate doubling of house prices on average in LAs over the sample period
However this result highlights the general equilibrium effects of RTB sales on the housing
market
Second the effects of RTB sales on voting behaviour in LA elections were also
estimated To do so LA-level data on vote shares in the local election were matched to the
housing and crime data used so far and the changes in the Conservative vote share within the
LA over the period 1995 ndash 2015 were constructed and modelled as the dependent variable in
the regression The sample size in these estimates is smaller owing to the fact that the timing
of LA election cycles varies across LAs In Table 12 the coefficient on the RTB sales variable
is positive and precisely defined Hence these estimates suggest that the RTB policy was
effective in increasing the Conservative vote share in localities that saw larger increases in the
homeownership rate under the policy This result echoes the conclusion in Di Tella Galiani
and Schargrodsky (2007) that show that lucky squatters who received legal titles in Buenos
Aires in the 1990s report beliefs closer to those that favour the workings of a free market
34
5 Conclusion
This paper studies local crime reduction connected to the increase in homeownership rates
induced by the UK Governmentrsquos Right To Buy (RTB) scheme since 1980 One of the key
goals of the RTB scheme was as it were to lsquogentrifyrsquo households endogenously Specifically
it aimed to ease access to an owned property for (broadly) working class families and in doing
so to alter their behaviour and induce them to take greater care of their property as well as to
alter their economic position by giving them a collateral asset in financial markets The RTB
scheme offered a means of upgrading the economic position of households in neighbourhoods
previously dominated by public housing
The RTB scheme led to a reduction in crime Estimates from the Thatcher era uncover
an elasticity of crime with respect to eligibility to sales of public housing of roughly -03
implying that a 10 percent increase in eligibility to public housing sales reduced crime by
around 3 percent The RTB scheme led to a reduction in both property crime and robberies
and both short run and longer run evidence of crime reduction is presented However rather
than being driven by changes in the composition of households through inward and outward
migration the key mechanisms underlying the reduction in crime rates appear to be the
behavioural changes that the RTB scheme induced within the local community The findings
suggest that new renters-come-homeowners as a result of RTB altered their behaviour in
response to the incentives arising from acquisition of housing wealth They made their
properties safer and gained greater access to the insurance markets
While no evidence is found of compositional changes in the local population of
different regions of the country signs of this behavioural change appear from the early years
of the policy when no resales of properties bought under the RTB scheme could have taken
place while continuing to benefit from the discounts offered under this scheme In line with
this conclusion and contrary to what a migration-based model of gentrification would predict
house prices decreased in the long run and Conservative votes increased in areas most affected
by the RTB scheme These results therefore vindicate the Thatcher rationale for the policy
More broadly they suggest that increasing homeownership reduces local crime as public
housing tenants become owners of their own homes separately from the process of
gentrification whereby low-income neighbourhoods become middle-income neighbourhoods
through outward migration of low-income households and inward migration of higher-income
households These results complement the existing literature and inform policy by showing
how granting homeownership to indigenous communities can also act to reduce crime
35
Before concluding some words of caution are necessary First although the results
conform to the Thatcher rationale for the policy they certainly do not vindicate it overall to
show that would require a more general welfare analysis Indeed an analysis of this sort
presented in Disney and Guo (2017) suggests that the RTB policy generated complex inter-
and intra-generational welfare effects and that welfare-improving adjustments to the policy
should have been considered The welfare implications of the broad shift from direct provision
of public housing to cash transfers for purchase of housing services in the UK implied by RTB
and other policies akin to the US also requires further analysis Nonetheless the change in
behaviour and beliefs in indigenous communities documented here shows a novel means not
fully documented to date that complements the existing literature based on different research
designs and settings by which homeownership and housing policy may contribute to reduce
criminality Thus housing provision and subsidized homeownership have scope to act as
potentially important features of the sizable crime drops observed in the United States and
several other Western economies since the 1990s
36
References
Aliprantis D and D Hartley (2015) Blowing it up and knocking it down the local and city-
wide effects of demolishing high concentration public housing on crime Journal of Urban
Economics 88 67-81
Aliprantis D and F G-C Richter (forthcoming) Evidence of Neighborhood Effects from
Moving to Opportunity LATEs of Neighborhood Quality Review of Economics and
Statistics Forthcoming
Alonso J R Andrews and V Jorda Gil (2019) Do neighbourhood renewal programs reduce
crime rates Evidence from England Journal of Urban Economics 110 March 51-69
Altonji J G and R K Mansfield (2018) Estimating Group Effects Using Averages of
Observables to Control for Sorting on Unobservables School and Neighborhood Effects
American Economic Review 108 (10) 2902-46
Autor D C Palmer and P Pathak (2019) Ending rent control reduced crime in Cambridge
American Economic Association papers and Proceedings 109 381-384
Bell B J Blundell and S Machin (2018) The changing geography of intergenerational
mobility CEP Discussion Paper No 1591 Centre for Economic Performance London School
of Economics and Political Science London UK
Bergman P R Chetty S DeLuca N Hendren L F Katz and C Palmer (2020) Creating
Moves to Opportunity Experimental Evidence on Barriers to Neighborhood Choice Working
paper
Bernasco W T de Graaf J Rouwendal and W Steenbeek (2017) Social interactions and
crime revisited an investigation using individual offender data in Dutch neighborhoods The
Review of Economics and Statistics 99 622ndash636
Blanden J and S Machin (2017) Home Ownership and Social Mobility CEP Discussion
Paper No 1466 Centre for Economic Performance London School of Economics and Political
Science London UK
Cameron A C J G Gelbach and D L Miller (2008) Bootstrap-based improvements for
inference with clustered errors Review of Economics and Statistics 90(3)414ndash27
37
Chetty R and N Hendren (2018a) The Impacts of Neighborhoods on Intergenerational
Mobility I Childhood Exposure Effects Quarterly Journal of Economics 133 (2018a) 1107ndash
1162
Chetty R and N Hendren (2018b) The Impacts of Neighborhoods on Intergenerational
Mobility II County-Level Estimates Quarterly Journal of Economics 133 (2018b) 1163ndash
1228
Chetty R N Hendren and L F Katz (2016) The Effects of Exposure to Better
Neighborhoods on Children New Evidence from the Moving to Opportunity Experiment
American Economic Review 106 (4) 855-902
Chyn E (2018) Moved to opportunity the long-run effects of public housing demolition on
children American Economic Review 108 (10) 3028-56
Cullen J and S Levitt (1999) Crime urban flight and the consequences for cities Review of
Economics and Statistics 81 2 159-169
Damm A and C Dustmann (2014) Does growing up in a high crime neighborhood affect
youth criminal behavior American Economic Review 104 1806ndash1832
Di Pasquale D and E Glaeser (1999) Incentives and social capital are homeowners better
citizens Journal of Urban Economics 45 354-384
Di Tella R S Galiani and E Schargrodsky (2007) The formation of beliefs evidence from
the allocation of land titles to squatters The Quarterly Journal of Economics 122(1) 209-241
Diamond R and T McQuade (2019) Who wants affordable housing in their backyard An
equilibrium analysis of low-income property development Journal of Political Economy 127
no 3 (June 2019) 1063-1117
Disney R and G Luo (2017) The Right to Buy public housing in Britain a welfare analysis
Journal of Housing Economics 35 51-68
Ellen I K Horn and D Reed (2017) Has falling crime invited gentrification US Census
Bureau Center for Economic Studies Paper No CES-WP-17-27 March Washington DC
Engelhardt G M Eriksen W Gale and G Mills (2010) What are the social benefits of home
ownership Experimental evidence for low income households Journal of Urban Economics
67 249-258
38
Fryer R G Jr and L F Katz (2013) Achieving Escape Velocity Neighborhood and School
Interventions to Reduce Persistent Inequality American Economic Review 103 (3) 232ndash37
Gibbons S (2004) The costs of urban property crime The Economic Journal 113 F441-462
Gregg P S Machin and A Manning (2004) Mobility and joblessness In Card D Blundell
R and Freeman R (eds) Seeking a premier economy the economic effects of British economic
reform 1980-2000 371-410 NBER Chicago Chicago University Press
Grogger J (2002) The effects of civil gang injunctions on reported violent crime evidence
from Los Angeles County The Journal of Law amp Economics 45(1) 69-90
doi101086338348
Haurin D R Dietz and B Weinberg (2003) The impact of neighbourhood homeownership
rates a review of the theoretical and empirical literature Journal of Housing Research 13
119-151
Hausman N T Ramot-Nyska and N Zussman (2020) Homeownership Labor Supply and
Neighborhood Quality Working paper 2020
Hilber C and W Vermuelen (2014) The impact of supply constraints on house prices in
England The Economic Journal 126 March 358-405
Jones C and A Murie (2006) The Right to Buy analysis and evaluation of a housing policy
Blackwell Oxford
Jones RV (1978) Most Secret War London Hamish Hamilton
Katz L J R Kling and J B Liebman (2001) Moving to opportunity in Boston early results
of a randomized mobility experiment Quarterly Journal of Economics 116 607ndash654
Kling J R J B Liebman and L F Katz (2007) Experimental Analysis of Neighborhood
Effects Econometrica 75 (1) 83ndash119
Kling J R J Ludwig and L F Katz (2005) Neighborhood Effects on Crime for Female and
Male Youth Evidence from a Randomized Housing Voucher Experiment Quarterly Journal
of Economics 120 87ndash130
Landersoslash R HS Nielsen and M Simonsen (2016) School starting age and the crime-age
profile The Economic Journal 127 1096ndash1118
39
Ludwig J G J Duncan L A Gennetian L F Katz R C Kessler J R Kling and L
Sanbonmatsu (2013) Long-Term Neighborhood Effects on Low Income Families Evidence
from Moving to Opportunity American Economic Review 103 (3) 226ndash31
Ludwig J G J Duncan and P Hirschfield (2001) Urban poverty and juvenile crime
evidence from a randomized experiment Quarterly Journal of Economics 116 655ndash679
Ludwig J and J R Kling (2007) Is Crime Contagious The Journal of Law and Economics
50(3) 491ndash518
McDonald S (1986) Does gentrification affect crime rates Crime and Justice 8 163-201
Machin S and C Meghir (2004) Crime and economic incentives Journal of Human
Resources 39(4) 958-79
Morales-Mosquera M (2019) The economic value of crime control evidence from a large
investment on police infrastructure in Colombia Unpublished draft Harris School of Public
Policy at the University of Chicago
Murie A (1997) Linking housing changes to crime Social Policy and Administration 31 5
22-36
Office of National Statistics (2013) A century of home ownership in England and Wales
London
Olsen E (2003) Housing programs for low-income households In Moffitt R (ed) Means-
tested transfer programs in the United States 365-442 Chicago Chicago University Press
Owens E M Mioduszewski and C Bates (2019) How valuable are civil liberties Evidence
from gang injunctions crime and housing prices in Southern California Unpublished draft
Department of Criminology Law and Society and Department of Economics University of
California Irvine
Quetelet A (1831) [1984] Research on the propensity for crime at different ages translated
and introduced by Sawyer F Sylvester Cincinnati Anderson
Ridgeway G J Grogger R A Moyer and J M MacDonald (2018) Effect of gang
injunctions on crime a study of Los Angeles from 1988ndash2014 Journal of Quantitative
Criminology httpsdoi101007s10940-018-9396-7
40
Rotger G P and G C Galster (2019) Neighborhood peer effects on youth crime natural
experimental evidence Journal of Economic Geography Volume 19 Issue 3 May 2019 Pages
655ndash676 httpsdoiorg101093jeglby053
Sanbonmatsu L J Ludwig L Katz L Gennetian G Duncan R Kessler E Adam T
McDade and S Lindau (2011) Impacts of the Moving to Opportunity for Fair Housing
Demonstration Program after 10 to 15 Years Washington (DC) US Department of Housing
and Urban Development Office of Policy Development and Research November published
at httpwwwhuduserorgportalpublicationspdfMTOFHD_fullreport_v2pdf
Sandler D (2017) Externalities of public housing the effect of public housing demolition on
local crime Regional Science and Urban Economics 62 January 24-35
Schill M (1993) Distressed public housing where do we go from here University of Chicago
Law Review 60 2 497-554
Sciandra M L Sanbonmatsu G J Duncan L A Gennetian L F Katz R C Kessler J R
Kling and J Ludwig (2013) Long-Term Effects of the Moving to Opportunity Residential
Mobility Experiment on Crime and Delinquency Journal of Experimental Criminology 9 (4)
451ndash89
Sodini P S Van Nieuwerburgh R Vestman and U Von Lilienfeld-Toal (2017) Identifying
the Benefits from Home Ownership A Swedish Experiment Working paper
Van Dijk J and B Vollaard (2012) Self-Limiting crime waves in J Van Dijk A Tseloni
and G Farrell (eds) The International Crime Drop 2012 Palgrave MacMillan New York
Source Reproduced from Disney and Luo (2017) Chart 1 calculated from Office for National Statistics (2013)
0
10
20
30
40
50
60
70
80
90
100
1918 1939 1953 1961 1971 1981 1991 2001 2011
Figure 1 Housing Tenure Shares by Tenure Type England and Wales 1918-2011
Owning Private renting Social renting
42
Source Department of Communities and Local Government Housing Statistics Table 678
0
20 000
40 000
60 000
80 000
100 000
120 000
140 000
160 000
180 000
1980
-81
1983
-84
1986
-87
1989
-90
1992
-93
1995
-96
1998
-99
2001
-02
2004
-05
2007
-08
2010
-11
2013
-14
Publ
ic H
ousi
ng
Figure 2 Right to-Buy and Other Sales of Public Housing in England 1980-81 to 2013-14
Council house sales (mostly RTB) Sales of other social housing
43
Figure 3 Correlation Between Crime and Public Housing in 1980 Police Force Area (PFA)
Coeff (se) = 0001 (0000)
0
002
004
006
008
01
Crim
e in
198
0
10 20 30 40 50 Public Housing in 1980
Police Force Area Linear Fit
Crime vs Public Housing in 1980
Notes Figure shows for each Police Force Area (PFA) the crime rate in 1980 plotted against the fraction of public housing as a percent of the total residential stock in 1980 Crime is defined as total yearly counts of property and violent crime offences per population at the PFA level Property crime defined as total yearly counts of burglary and theft or handling of stolen goods offences per population at the PFA level Violent crime defined as total yearly counts of robbery violent and sexual offences per population at the PFA level A linear function fitting the correlation between the PFA-specific fraction of public housing and the crime rate weighted by PFA-specific population size in 1980 is also shown
44
Figure 4 Correlation Between Right-To-Buy (RTB) Public Housing Sales by 1981 and Tenure Duration in Public Housing in 1980
Coeff (se) = 0969 (0270)
0
1
-05
05
Log
Publ
ic H
ousi
ng S
ales
in 1
980-
81
2 22 24 26 28 3Log Public Housing Tenure in 1980
Police Force Area Linear Fit
Public Housing Sales in 1980-81 vs Tenure in 1980
Notes Figure shows for each Police Force Area (PFA) the log sales of public housing under the Right-To-Buy (RTB) scheme by 1981 plotted against PFA-specific log average years of tenure duration in public housing in 1980 A linear function fitting the distribution of PFA-specific log sales and log tenure duration weighted by PFA-specific population size in 1980 is also shown For each PFA in the analysis the horizontal axis shows the log value of average years of tenure duration in public housing in 1980 whereas the vertical axis shows the log count of sales of public housing under the RTB scheme by 1981 as a percent of the total residential stock in 1980
45
Figure 5 Correlation Between Right-To-Buy (RTB) Public Housing Sales in 1980-92 and RTB Public Housing Sales by 1981
Coeff (se) = 0513 (0090)
15
2
25
3
Log
Publ
ic H
ousi
ng S
ales
in 1
980-
92
0 1-05 05Log Public Housing Sales in 1980-81
Police Force Area Linear Fit
Public Housing Sales in 1980-92 vs 1980-81
Notes Figure shows for each Police Force Area (PFA) the log sales of public housing under the Right-To-Buy (RTB) scheme by 1992 plotted against PFA-specific log sales of public housing under the RTB scheme by 1981 A linear function fitting the distribution of PFA-specific log sales weighted by PFA-specific population size in 1980 is also shown For each PFA in the analysis the horizontal axis shows the log count of sales of public housing under the RTB scheme by 1981 as a percent of the total residential stock in 1980 whereas the vertical axis shows the log count of sales of public housing under the RTB scheme by 1992 as a percent of the total residential stock in 1980
46
Figure 6 Crime Rates in Intention-To-Treat (ITT) Treatment Police Force Areas (PFAs) and in ITT Control PFAs 1975-1992
002
004
006
008
01
Wei
ghte
d A
vera
ge a
nd 9
5 C
I
1975 1980 1987 1992Year
ITT Treatment PFAs (Housing Tenure in 1980 gt= p50)ITT Control PFAs (Housing Tenure in 1980 lt p50)
Crime Rates in ITT Treatment vs ITT Control PFAs
Notes Figure shows crime rates separately for ITT Treatment PFAs (Housing Tenure duration in 1980 gt= p50) and ITT Control PFAs (Housing Tenure duration in 1980 lt p50) Crime defined as total yearly counts of property and violent crime offences per population at the PFA level Property crime defined as total yearly counts of burglary and theft or handling of stolen goods offences per population at the PFA level Violent crime defined as total yearly counts of robbery violent and sexual offences per population at the PFA level Reported dots are averages weighted by population at the PFA level and capped bars are 95 confidence intervals
47
Figure 7 County-Specific Estimates of Correlation between Right-To-Buy (RTB) Public Housing Sales and Crime Victimisation against County-Specific Estimates of Correlation between RTB Public Housing Sales and Home Improvement 1988
Coeff (se) = -0518 (0271)
-2
-1
0
1
2
RTB
and
Crim
e Vi
ctim
isat
ion
-1 0 1-05 05RTB and Home Improvement
County-specific Effect Linear Fit
RTB and Crime Victimisation vs RTB and Home Improvement
Notes The figure shows county-specific estimates of the correlation between Right-To-Buy Scheme (RTB) public housing sales and crime victimisation plotted against county-specific estimates of the correlation between RTB public housing sales and home improvement A linear function fitting the distribution of county-specific estimates is also shown For each county in the analysis the horizontal axis shows the estimate of the correlation between RTB public housing sales and home improvement whereas the vertical axis shows county-specific estimates of the correlation between RTB public housing sales and crime victimisation Treatment group defined as homeowners who rented from the council the property in which they currently reside prior to buying it Control group defined as council tenants who currently intend to buy the public property in which they reside within two years
48
Table 1 Summary Data for 1980 Police Force Authorities (PFA)
Percentiles Mean Standard
Deviation Min Max p25 p50 p75 p90
Housing Stock Public Housing Stock ( Residential Stock) 27202 8574 14568 43798 21865 22966 34096 41869 Public Housing Sales by 1981 ( Residential Stock) 1231 0410 0735 2516 0910 1248 1417 1680 Public Housing Years of Tenure 11052 1875 8274 17936 9977 11302 11721 12843 Public Housing Units 191721 177523 27612 563046 71116 98794 246040 563046 Residential Stock Units 725288 738428 128410 2462295 301632 427384 639665 2462295 Crime Variables All Crime Rate 0045 0016 0020 0069 0031 0038 0060 0069 Property Crime Rate 0042 0015 0019 0065 0030 0035 0057 0065 Violent Crime Rate 0003 0001 0001 0006 0002 0003 0003 0004 Covariates Log Unemployment Rate -2885 0357 -3730 -2120 -3219 -2882 -2688 -2435 Log 25th Percentile Real Hourly Earnings 1345 0070 1228 1497 1305 1327 1360 1497 Log 50th Percentile Real Hourly Earnings 1613 0069 1488 1751 1565 1606 1635 1751 Fraction 15-24 Year Olds in Population 0157 0008 0138 0173 0152 0158 0162 0165 Observations 42
Notes Crime variables are measured as crime rates at the Police Force Area (PFA) level Crime defined as total yearly counts of property and violent crime offences per population at the PFA level Property crime defined as total yearly counts of burglary and theft or handling of stolen goods offences per population at the PFA level Violent crime defined as total yearly counts of robbery violent and sexual offences per population at the PFA level Local area variables are the log of the unemployment rate the 25th percentile log real hourly wage and the share of 15-24 year olds in the population each measured at the PFA geography
49
Table 2 Crime Rate Public Housing Stock and Tenure Duration in 1980 OLS Estimates Police Force Area (PFA)
All Crime
Property Crime
Violent Crime
Log Housing Tenure Duration
(1) (2) (3) (4) (5) (6) (7) (8) Public Housing (Prop Res Stock) 0087
(0028) 0064
(0017) 0082
(0026) 0059
(0017) 0005
(0001) 0004
(0001) 0082
(0317) -0023 (0447)
Log Unemployment Rate 0016 (0005)
0015 (0005)
0001 (0000)
0015 (0104)
Log 25th Percentile Real Hourly Earnings 0398 (0080)
0378 (0076)
0020 (0006)
-2358 (1425)
Log 50th Percentile Real Hourly Earnings -0252 (0078)
-0238 (0074)
-0014 (0007)
1400 (1440)
Fraction 15-24 Year Olds in Population 0574 (0219)
0546 (0206)
0028 (0016)
-2914 (2764)
Observations 42 42 42 42 42 42 42 42
Notes Table reports estimates from Ordinary Least Squares regression models Dependent variables are crime rates Crime defined as total yearly counts of property and violent crime offences per population at the Police Force Area (PFA) level Property crime defined as total yearly counts of burglary and theft or handling of stolen goods offences per population at the PFA level Violent crime defined as total yearly counts of robbery violent and sexual offences per population at the PFA level Data units are 42 PFAs in 1980 Standard errors shown in parenthesis indicates significance at 1 indicates significance at 5 indicates significance at 10
50
Table 3 Difference-in-Differences Before and After the Right-To-Buy Scheme
Intention-To-Treat (ITT)
Treatment PFAs (Log Public Housing Tenure Duration in 1980
gt= p50)
Intention-To-Treat (ITT)
Control PFAs (Log Public Housing Tenure Duration in 1980
lt p50)
Difference ((1) - (2))
Unconditional
DiD
Unconditional DiD Effect ((4) Pre (2))
(1) (2) (3) (4) (5) Panel A All Crime 1975-85 Pre- 0034 0047 -0013 Post- 0043 0060 -0017 Post ndash Pre 0009 0013 -0004
(p = 0085) -85
Number of Police Force Areas 21 21 Number of Observations 231 231 Panel B All Crime 1975-92 Pre- 0035 0047 -0012 Post- 0053 0070 -0017 Post ndash Pre 0018 0023 -0005
(p = 0072) -106
Number of Police Force Areas 21 21 Number of Observations 378 378
Notes Post-period defined as starting from 1980 the date of adoption of the Right to Buy (RTB) Policy in England and Wales Panel A shows results for the 1975-85 period and Panel B shows results for the 1975-92 period Crime defined as total yearly counts of property and violent crime offences per population at the Police Force Area (PFA) level Property crime defined as total yearly counts of burglary and theft or handling of stolen goods offences per population at the PFA level Violent crime defined as total yearly counts of robbery violent and sexual offences per population at the PFA level Averages weighted by population at the PFA level Standard errors were clustered at the PFA level and p-values from Wild Cluster Bootstrap are reported in parentheses Effect calculated as estimated coefficient divided by mean of dependent variable prior to 1980 in the ITT control group PFAs (Public Housing Tenure duration in 1980 lt p50)
Table 4 Estimates of Impact of Right-To-Buy Scheme on Crime
ITT 1975-85 IV 1975-85 ITT 1975-92 (1) (2) (3) (4) (5) (6) (7) (8) (9)
(Log RTB Sales in 1980-81) x Post -0013 (p = 0012)
-0020 (p = 0026)
(Log Tenure gt= p50) x Post -0005 (p = 0085)
-0006 (p = 0073)
Log Tenure x Post -0009 (p = 0055)
-0013 (p = 0087)
-0013 (p = 0038)
-0017 (p = 0049)
Log Tenure x 1988-92 -0018 (p = 0047)
Log Tenure x 1980-87 -0017 (p = 0090)
Log Tenure x 1979 -0009 (p = 0183)
-0009 (p = 0183)
-0009 (p = 0189)
-0009 (p = 0189)
Log Tenure x 1978 -0007 (p = 0514)
-0007 (p = 0541)
-0007 (p = 0525)
-0007 (p = 0525)
Log Tenure x 1977 -0005 (p = 0611)
-0005 (p = 0623)
-0005 (p = 0628)
-0005 (p = 0628)
Effect -10638 -0191 -0277 -0277 -0425 -12766 -0277 -0362 Effect x 1988-92 -0383 Effect x 1980-87 -0362
Log Unemployment Rate in 1980 x Post No Yes Yes Yes Yes No Yes Yes Yes Log 25th Percentile Earnings in 1980 x Post No Yes Yes Yes Yes No Yes Yes Yes Log 50th Percentile Earnings in 1980 x Post No Yes Yes Yes Yes No Yes Yes Yes Fraction 15-24 Years Old in 1980 x Post No Yes Yes Yes Yes No Yes Yes Yes Fraction of Public Housing in 1980 x Post No Yes Yes Yes Yes No Yes Yes Yes PFA Fixed Effects Yes Yes Yes Yes Yes Yes Yes Yes Yes Year Fixed Effects Yes Yes Yes Yes Yes Yes Yes Yes Yes
First Stage Coefficient on ITT 0647 (p = 0015)
0647 (p = 0019)
Sample Size 462 462 462 462 462 756 756 756 756 Number of PFAs 42 42 42 42 42 42 42 42 42
Notes Post-period defined as starting from 1980 the date of adoption of the Right to Buy (RTB) Policy in England and Wales Columns (1)-(5) show ITT and IV results for the 1975-85 period and Columns (6)-(9) show ITT results for the 1975-92 period Tenure duration in public housing measured in years and calculated in 1980 Sales of public housing calculated in 1980-81 Crime defined as total yearly counts of property and violent crime offences per population at the Police Force Area (PFA) level Property crime defined as total yearly counts of burglary and theft or handling of stolen goods offences per population at the PFA level Violent crime defined as total yearly counts of robbery violent and sexual offences per population at the PFA level Regressions weighted by population at the PFA level Standard errors were clustered at the PFA level and p-values from Wild Cluster Bootstrap are reported in parentheses Effect calculated as estimated coefficient divided by pre-1980 mean of dependent variable in ITT control group (Public Housing Sales by 1981 lt p50) indicates significance at 1 indicates significance at 5 indicates significance at 10
Table 5 Estimates of Impact of Right-To-Buy Scheme on Property Crime
ITT 1975-85 IV 1975-85 ITT 1975-92 (1) (2) (3) (4) (5) (6) (7) (8) (9)
(Log RTB Sales in 1980-81) x Post -0013 (p = 0012)
-0018 (p = 0021)
(Log Tenure gt= p50) x Post -0004 (p = 0089)
-0005 (p = 0102)
Log Tenure x Post -0008 (p = 0052)
-0012 (p = 0085)
-0012 (p = 0038)
-0016 (p = 0052)
Log Tenure x 1988-92 -0015 (p = 0095)
Log Tenure x 1980-87 -0017 (p = 0099)
Log Tenure x 1979 -0008 (p = 0168)
-0008 (p = 0173)
-0008 (p = 0177)
-0008 (p = 0177)
Log Tenure x 1978 -0006 (p = 0518)
-0006 (p = 0546)
-0006 (p = 0535)
-0006 (p = 0535)
Log Tenure x 1977 -0004 (p = 0609)
-0004 (p = 0619)
-0004 (p = 0624)
-0004 (p = 0623)
Effect -9091 -0182 -0273 -0295 -0409 -11364 -0273 -0364 Effect x 1988-92 -0341 Effect x 1980-87 -0386
Log Unemployment Rate in 1980 x Post No Yes Yes Yes Yes No Yes Yes Yes Log 25th Percentile Earnings in 1980 x Post No Yes Yes Yes Yes No Yes Yes Yes Log 50th Percentile Earnings in 1980 x Post No Yes Yes Yes Yes No Yes Yes Yes Fraction 15-24 Years Old in 1980 x Post No Yes Yes Yes Yes No Yes Yes Yes Fraction of Public Housing in 1980 x Post No Yes Yes Yes Yes No Yes Yes Yes PFA Fixed Effects Yes Yes Yes Yes Yes Yes Yes Yes Yes Year Fixed Effects Yes Yes Yes Yes Yes Yes Yes Yes Yes
First Stage Coefficient on ITT 0647 (p = 0015)
0647 (p = 0019)
Sample Size 462 462 462 462 462 756 756 756 756 Number of PFAs 42 42 42 42 42 42 42 42 42
Notes Post-period defined as starting from 1980 the date of adoption of the Right to Buy (RTB) Policy in England and Wales Columns (1)-(5) show ITT and IV results for the 1975-85 period and Columns (6)-(9) show ITT results for the 1975-92 period Tenure duration in public housing measured in years and calculated in 1980 Sales of public housing calculated in 1980-81 Property crime defined as total yearly counts of burglary and theft or handling of stolen goods offences per population at the Police Force Area (PFA) level Regressions weighted by population at the PFA level Standard errors were clustered at the PFA level and p-values from Wild Cluster Bootstrap are reported in parentheses Effect calculated as estimated coefficient divided by pre-1980 mean of dependent variable in ITT control group (Public Housing Sales by 1981 lt p50) indicates significance at 1 indicates significance at 5 indicates significance at 10
53
Table 6 Estimates of Impact of Right-To-Buy Scheme on Violent Crime
ITT 1975-85 IV 1975-85 ITT 1975-92 (1) (2) (3) (4) (5) (6) (7) (8) (9)
(Log RTB Sales in 1980-81) x Post -0001 (p = 0166)
-0001 (p = 0104)
(Log Tenure gt= p50) x Post -0000 (p = 0186)
-0001 (p = 0124)
Log Tenure x Post -0000 (p = 0228)
-0001 (p = 0202)
-0001 (p = 0204)
-0001 (p = 0212)
Log Tenure x 1988-92 -0003 (p = 0383)
Log Tenure x 1980-87 -0000 (p = 0697)
Log Tenure x 1979 -0001 (p = 0480)
-0001 (p = 0493)
-0001 (p = 0480)
-0001 (p = 0481)
Log Tenure x 1978 -0001 (p = 0472)
-0001 (p = 0480)
-0001 (p = 0474)
-0001 (p = 0475)
Log Tenure x 1977 -0000 (p = 0653)
-0000 (p = 0611)
-0000 (p = 0654)
-0000 (p = 0655)
Effect -0 -0 -0333 -0333 -0333 -33333 -0333 -0333 Effect x 1988-92 -1 Effect x 1980-87 -0
Log Unemployment Rate in 1980 x Post No Yes Yes Yes Yes No Yes Yes Yes Log 25th Percentile Earnings in 1980 x Post No Yes Yes Yes Yes No Yes Yes Yes Log 50th Percentile Earnings in 1980 x Post No Yes Yes Yes Yes No Yes Yes Yes Fraction 15-24 Years Old in 1980 x Post No Yes Yes Yes Yes No Yes Yes Yes Fraction of Public Housing in 1980 x Post No Yes Yes Yes Yes No Yes Yes Yes PFA Fixed Effects Yes Yes Yes Yes Yes Yes Yes Yes Yes Year Fixed Effects Yes Yes Yes Yes Yes Yes Yes Yes Yes
First Stage Coefficient on ITT 0647 (p = 0015)
0647 (p = 0019)
Sample Size 462 462 462 462 462 756 756 756 756 Number of PFAs 42 42 42 42 42 42 42 42 42
Notes Post-period defined as starting from 1980 the date of adoption of the Right to Buy (RTB) Policy in England and Wales Columns (1)-(5) show ITT and IV results for the 1975-85 period and Columns (6)-(9) show ITT results for the 1975-92 period Tenure duration in public housing measured in years and calculated in 1980 Sales of public housing calculated in 1980-81 Violent crime defined as total yearly counts of robbery violent and sexual offences per population at the Police Force Area (PFA) level Regressions weighted by population at the PFA level Standard errors were clustered at the PFA level and p-values from Wild Cluster Bootstrap are reported in parentheses Effect calculated as estimated coefficient divided by pre-1980 mean of dependent variable in ITT control group (Public Housing Sales by 1981 lt p50) indicates significance at 1 indicates significance at 5 indicates significance at 10
54
Table 7 Estimates of Impact of Right-To-Buy (RTB) Public Housing Tenure Duration on Local Area Outcomes and (Log) Value of RTB Public Housing Sales on Crime 1975 ndash 1992
Log
Unemployment Rate
Log 25th Percentile Real
Hourly Earnings
Log 50th Percentile Real
Hourly Earnings
Fraction 15-24 Years Old in Population
Total Crime Log Count of Police Officers
(1) (2) (3) (4) (5) (6) Log Tenure x Post -0168
(p = 0313) -0079
(p = 0269) -0076
(p = 0346) 0002
(p = 0746) -0024
(p = 0594) Log Value Sales x Post 0002
(p = 0280)
Effect 0014 0043 Log Unemployment Rate in 1980 x Post No Yes Yes Yes Yes Yes Log 25th Percentile Earnings in 1980 x Post Yes No No Yes Yes Yes Log 50th Percentile Earnings in 1980 x Post Yes No No Yes Yes Yes Fraction 15-24 Years Old in 1980 x Post Yes Yes Yes No Yes Yes Fraction of Public Housing in 1980 x Post Yes Yes Yes Yes Yes Yes PFA Fixed Effects Yes Yes Yes Yes Yes Yes Year Fixed Effects Yes Yes Yes Yes Yes Yes Sample Size 756 756 756 756 756 756 Number of PFAs 42 42 42 42 42 42
Notes Post-period defined as starting from 1980 the date of adoption of the Right to Buy (RTB) Policy in England and Wales Tenure duration in public housing measured in years and calculated in 1980 Value of sales of public housing calculated by 1981 Local area outcomes measured at the PFA level Crime defined as total yearly counts of property and violent crime offences per population at the Police Force Area (PFA) level Property crime defined as total yearly counts of burglary and theft or handling of stolen goods offences per population at the PFA level Violent crime defined as total yearly counts of robbery violent and sexual offences per population at the PFA level Regressions weighted by population at the PFA level Standard errors were clustered at the PFA level and p-values from Wild Cluster Bootstrap are reported in parentheses Effect calculated as estimated coefficient divided by pre-1980 mean of dependent variable in ITT control group (Public Housing Tenure duration in 1980 lt p50) except in columns (1) (2) and (5) where the dependent variable is measured in log values
55
Table 8 Correlation between Right-To-Buy Public Housing Sales and Home Improvement Insurance and Social Behaviour 1988
Installed Double Locks on Outside
Doors
Installed Locks on Windows
Theft Insurance of Home Contents
Installed Burglar Alarm
Neighbourhood Watch Scheme
(1) (2) (3) (4) (5) Panel A RTB Scheme 0217
(p = 0000) 0193
(p = 0000) 0251
(p = 0000) 0043
(p = 0037) 0005
(p = 0828) Effect 606 1304 384 2263 81 Panel B RTB Scheme 0232
(p = 0000) 0168
(p = 0003) 0239
(p = 0000) 0048
(p = 0046) 0018
(p = 0505) Effect 648 1135 365 2526 29 Gender Yes Yes Yes Yes Yes Ethnicity Yes Yes Yes Yes Yes Log Age (quadratic) Yes Yes Yes Yes Yes Past Burglary Victimization Yes Yes Yes Yes Yes Household Type Yes Yes Yes Yes Yes Household Rooms Yes Yes Yes Yes Yes Household Income Yes Yes Yes Yes Yes County Fixed Effects Yes Yes Yes Yes Yes Mean Dep Var Control Group 0358 0148 0654 0019 0062 Sample Size 520 520 520 520 520 Number of Counties 52 52 52 52 52
Notes Treatment group defined as homeowners who rented from the council the property in which they currently reside prior to buying it Control group defined as council tenants who currently intend to buy the public property in which they reside within two years Standard errors were clustered at the county level and p-values from Wild Cluster Bootstrap are reported in parentheses Effect calculated as estimated coefficient divided by mean of dependent variable in the control group (council tenants who intend to buy the public property in which they reside within two years) reported here Panel A reports unconditional OLS estimates and Panel B reports conditional OLS estimates where controls for gender ethnicity age burglary victimization household type household rooms household income employment status and county fixed effects were included in the estimating equation indicates significance at 1 indicates significance at 5 indicates significance at 10
56
Table 9 ITT Estimates of Impact of Right-To-Buy Scheme on Crime Separately by Crime Category
Property Crime Violent Crime Burglary Theft and
Handling of Stolen Goods
Violence Against the Person
Sexual Offences
Robbery
(1) (2) (3) (4) (5)
Panel A Crime Category 1975 ndash 1985
Log Tenure x Post -0004 (p = 0083)
-0004 (p = 0070)
-00002 (p = 0531)
0000 (p = 0894)
-00003 (p = 0082)
Effect -0309 -0132 -0104 0021 -87392 Log Unemployment Rate in 1980 x Post Yes Yes Yes Yes Yes Log 25th Percentile Earnings in 1980 x Post Yes Yes Yes Yes Yes Log 50th Percentile Earnings in 1980 x Post Yes Yes Yes Yes Yes Fraction 15-24 Years Old in 1980 x Post Yes Yes Yes Yes Yes Fraction of Public Housing in 1980 x Post Yes Yes Yes Yes Yes PFA Fixed Effects Yes Yes Yes Yes Yes Year Fixed Effects Yes Yes Yes Yes Yes
Sample Size 462 462 462 462 462 Number of PFAs 42 42 42 42 42
Panel B Crime Category 1975 ndash 1992
Log Tenure x Post -0006 (p = 0016)
-0006 (p = 0130)
-00004 (p = 0447)
0000 (p = 0987)
-00004 (p = 0090)
Effect -0489 -0191 -0191 0002 -127
Log Unemployment Rate in 1980 x Post Yes Yes Yes Yes Yes Log 25th Percentile Earnings in 1980 x Post Yes Yes Yes Yes Yes Log 50th Percentile Earnings in 1980 x Post Yes Yes Yes Yes Yes Fraction 15-24 Years Old in 1980 x Post Yes Yes Yes Yes Yes Fraction of Public Housing in 1980 x Post Yes Yes Yes Yes Yes PFA Fixed Effects Yes Yes Yes Yes Yes Year Fixed Effects Yes Yes Yes Yes Yes
Sample Size 756 756 756 756 756 Number of PFAs 42 42 42 42 42
Notes Post-period defined as starting from 1980 the date of adoption of the Right to Buy (RTB) Policy in England and Wales Panel A shows results for the 1975-85 period and Panel B shows results for the 1975-92 period Tenure duration in public housing measured in years and calculated in 1980 Yearly counts of crime were measured at the Police Force Area (PFA) level for all crime categories Regressions weighted by population at the PFA level Standard errors were clustered at the PFA level and p-values from Wild Cluster Bootstrap are reported in parentheses Effect calculated as estimated coefficient divided by pre-1980 mean of dependent variable in ITT control group (Public Housing Tenure duration in 1980 lt p50) indicates significance at 1 indicates significance at 5 indicates significance at 10
57
Table 10 Summary Data for Long-Difference Analysis
Percentiles Mean Standard Deviation Min Max p25 p50 p75 p90 Housing Variables 1Public House Sales 1980-1992 3718 3429 151 33386 1843 2643 4223 7857 2Public House Stock 1980 15032 16757 2180 148394 6358 8912 18018 32832 12 29 13 0 116 22 27 35 42 Crime Variables All Crime Rate -0020 0011 -0075 0002 -0026 -0019 -0013 -0008 Property Crime Rate -0015 0009 -0064 0001 -0019 -0013 -0009 -0006 Violent Crime Rate -0005 0004 -0018 0001 -0007 -0005 -0003 -0001 Covariates Log Unemployment Rate 0466 0462 -0816 1901 0183 0476 0768 1004 Log 25th Percentile Real Hourly Earnings -0084 0058 -0278 0139 -0117 -0080 -0047 -0018 Log 50th Percentile Real Hourly Earnings -0080 0064 -0288 0096 -0114 -0083 -0036 -0002 Fraction of 15-24 Year Olds in Population -0000 0009 -0035 0034 -0004 0001 0004 0009 Observations 293
Notes Crime variables are measured as crime rates at the Local Authority (LA) level Crime defined as total yearly counts of property and violent crime offences per population at the LA level Property crime defined as total yearly counts of burglary and theft or handling of stolen goods offences per population at the LA level Violent crime defined as total yearly counts of robbery violent and sexual offences per population at the LA level Local area variables are the log of the unemployment rate the 25th percentile log real hourly wage and the share of 15-24 year olds in the population each measured at the LA geography
58
Table 11 IV Estimates of Impact of Change in Public Housing Stock 1980-1992 on Change in Crime Rate 2003-2017
Δ All Crime Rate
Δ Property Crime Rate
Δ Violent Crime Rate
(1) (2) (3) (4) (5) (6) (7) (8) (9) RTB Sales 1980-1992 1980 Residential Stock
-0339 (0053)
-0310 (0050)
-0245 (0042)
-0236 (0038)
-0218 (0037)
-0179 (0032)
-0103 (0017)
-0092 (0016)
-0073 (0014)
Changes in Covariates Log Unemployment Rate 0003
(0002) 0002
(0002) 0002
(0002) 0001
(0002) 0001
(0001) 0001
(0001) Log 25th Percentile Earnings -0048
(0023) -0055 (0020)
-0034 (0017)
-0039 (0016)
-0014 (0008)
-0013 (0006)
Log 50th Percentile Earnings 0009 (0022)
0011 (0018)
0009 (0016)
0001 (0001)
-0001 (0007)
-0001 (0001)
Fraction 15-24 Year Olds 0428 (0104)
0250 (0095)
0278 (0077)
0169 (0074)
0149 (0034)
0119 (0029)
Crime Rate in 1980 All Crime Rate in 1980 -0319
(0053)
Property Crime Rate in 1980 -0203 (0043)
Violent Crime Rate in 1980 -1718 (0287)
Observations 293 293 293 293 293 293 293 293 293
Notes Table reports Instrumental Variable estimates Crime defined as total yearly counts of property and violent crime offences per population at the LA level Property crime defined as total yearly counts of burglary and theft or handling of stolen goods offences per population at the LA level Violent crime defined as total yearly counts of robbery violent and sexual offences per population at the LA level Dependent variable is the change in the Local Authority (LA) crime rate between 2003 and 2017 for each crime type denoted by column headings Independent variables are i) total Right-to-Buy sales within the LA for the period 1980 to 1992 (divided by 1980 residential stock) ii) changes in the log unemployment rate in the 25th percentile log real hourly wage and in the share of 15-24 year olds in the population each measured at the LA level iii) crime rates in 1980 for each crime type denoted by column headings measured at the Police Force Area (PFA) level The instrument for i) is the stock of public housing in the local authority in 1980 (divided by 1980 residential stock) indicates significance at 1 indicates significance at 5 indicates significance at 10
59
Table 12 IV Estimates of Impact of Change in Public Housing Stock 1980-1992 on Changes in (Log) Average House Price and Conservative Vote Share
Δ (Log) Average
House Price
Δ Con Vote Share
in LA
(1) (2) RTB Sales 1980-1992 1980 Residential Stock -1327
(0475) 1757
(0352) Changes in Covariates Log Unemployment Rate -0070
(0021) -0014 (0017)
Log 25th Percentile Earnings -0740 (0213)
0379 (0177)
Log 50th Percentile Earnings -0069 (0198)
-0111 (0158)
Fraction 15-24 Year Olds -8575 (1005)
-1188 (0891)
Observations 290 235
Notes Table reports Instrumental Variable estimates In Column (1) the dependent variable is the change in the log of the average house price in the Local Authority (LA) between 2003 and 2017 In Column (2) the dependent variable is the change in the Conservative vote share in Local Authority elections between 19956 and 201415 Independent variables are i) total Right-to-Buy sales within the LA for the period 1980 to 1992 (divided by 1980 residential stock) ii) changes in the log unemployment rate in the 25th percentile log real hourly wage and in the share of 15-24 year olds in the population each measured at the LA level The instrument for i) is the stock of public housing in the local authority in 1980 (divided by 1980 residential stock) indicates significance at 1 indicates significance at 5 indicates significance at 10
APPENDIX ndash ONLINE ONLY
A Data Sources
a Public Housing Stock and Residential Stock in 1980
Public housing stock records for 1980 are sourced from the Chartered Institute of Public Finance and Accountancy (CIPFA) Rate Collection Statistics 1980-81 Actuals SIS ref 4282 This publication is based on data returned by authorities from DoE forms VO7140 The data covers 33 London Boroughs 34 Metropolitan District Councils 286 English Non-Metropolitan District Councils and 37 Welsh District Councils which we refer to in the main paper as Local Authorities The data cover 973 of total rateable hereditaments The number of residential properties in the Local Authority is stated at Column 2 lsquoDomesticrsquo with the number of public house properties in the Local Authority stated at Column 22 lsquoCouncil Dwellingsrsquo These data were extracted from hard copy held by UK libraries
b Right-to-Buy Public Housing Sales
Data on the number of public housing properties sold each year through the Right-to-Buy scheme by each Local Authority for the period 1980 - 2001 are sourced from the CIPFA Housing Revenue Account (HRA) The HRA records expenditure and income on running a councilrsquos own housing stock and closely related services or facilities which are provided primarily for the benefit of the councilrsquos own tenants Under the Housing Act 1985 Local Authorities are obliged to report revenues from public house sales via their HRA These data are accessed under license from CIPFA For further details see httpswwwcipfaorgpolicy-and-guidancepublications (link last accessed on 28 March 2020) We use these data in our main analysis For Figures 1 and 2 we also source data on sales under the Right-to-Buy scheme after 2001 These data are provided by the Department for Communities and Local Government Table 685 For further details see httpswwwgovukgovernmentstatistical-data-setslive-tables-on-social-housing-sales (link last accessed on 28 March 2020)
c Crime Area-level crime data compiled by the Home Office and published annually in Criminal Statistics for the period between 1975 and 1992 were sourced from the archives of the LSE Library where both hard and soft copies of the data can be accessed Yearly crime records of all Local Police Forces in England and Wales were available at the Police Force Area (PFA) level and with the sole exception of the City of London they were used in this analysis Area-level crime data compiled by the Office for National Statistics (ONS) and published annually on the ONS website for the period between 2003 and 2017 were available at the Local Authority (LA) level Due to the redrawing of LA boundaries over time it was not possible to include all LAs in the analysis Our analysis for the period between 2003 and 2017 therefore includes 293 LAs These data can be freely accessed here httpswwwonsgovukpeoplepopulationandcommunitycrimeandjusticedatasetsrecordedcrimedataatcommunitysafetypartnershiplocalauthoritylevelcurrent (link last accessed on 28 March 2020)
d Local Area Circumstances and Housing Tenure Local area circumstances were measured using the New Earnings Survey (NES) provided by the Department for Employment for the period 1975-1992 and using the version of the Annual Population Survey (APS) that is publicly available on the Nomis website for the period 2003-2017 Access to data on local unemployment rates during the period 1975-1992 was obtained from the Department of Employment Permission to access the NES data must
61
be obtained via the UK Data Service and are downloadable at the following link httpsbetaukdataserviceacukdatacataloguestudiesSearch=new20earnings20surveyampRows=10ampSort=1ampDateFrom=440ampDateTo=2020ampPage=1 (link last accessed on 28 March 2020) The Nomis website can be freely accessed here httpswwwnomiswebcouk (link last accessed on 28 March 2020) Local area population data compiled by the Home Office and published annually in Criminal Statistics for the period between 1975 and 1992 were sourced from the archives of the LSE Library where both hard and soft copies of the data can be accessed Area-level population data compiled by the Office for National Statistics (ONS) and published annually on the ONS website for the period between 2003 and 2017 were available at the Local Authority (LA) level These data can be freely accessed here httpswwwonsgovukpeoplepopulationandcommunitypopulationandmigrationpopulationestimatesdatasetspopulationestimatesforukenglandandwalesscotlandandnorthernireland (link last accessed on 28 March 2020) Data on local housing tenure duration were obtained from the 1980 General Household Survey which can be accessed via the UK Data Service and are downloadable at this link (last accessed on 09 July 2020) httpsbetaukdataserviceacukdatacatalogueseriesseriesid=200019
e Home Improvement Insurance and Social Behaviour (Table 8 Appendix Tables A1 and A2) Individual level data on homeownership expenditure individual and property characteristics income employment status and locality of residence used in Table 8 were obtained from the British Crime Survey (BCS) 1988 Access to the BCS 1988 data must be obtained via the UK Data Service and are downloadable at the following link httpsbetaukdataserviceacukdatacataloguestudiesstudyid=2706amptype=Data20catalogue (link last accessed on 28 March 2020)
f Election Results Data on the Conservative vote share in Local Elections for the period 19956 to 201415 are sourced from the British Local Elections Database maintained by the University of Plymouth UK The Conservative vote share is calculated as the proportion of all votes cast in the election for Conservative candidates Ware L Rallings C Thrasher M (2006) British Local Election Database 1889-2003 [data collection] UK Data Service SN 5319 httpdoiorg105255UKDA-SN-5319-1 (link last accessed on 28 March 2020)
g House Prices
House price data is obtained from the UK Land Registry House Price Index (HPI) the UKrsquos official house price index The HPI uses house sales data from HM Land Registry Registers of Scotland and Land and Property Services Northern Ireland and is calculated and maintained by the Office for National Statistics Local Authority house price index values were extracted from the HPI Full File For further details see httpslandregistrydatagovukappdocukhpi (link last accessed on 28 March 2020)
Figure A1 Correlation between Public House building in 1945-64 and Bombs per Dwelling dropped during World War II by Borough in London
Coeff (se) = 2915 (1337)
0
005
01
015
02
Frac
tion
Pub
lic H
ousi
ng in
194
5-64
0 0005 001 0015 002 0025Bombs per Dwelling
Borough Linear Fit
LondonPublic Housing vs Bombs per Dwelling during World War II
Notes The figure shows for each Borough in London the public houses built from 1945-64 as a fraction of the residential stock plotted against the average number of bombs per dwelling A linear function fitting the correlation between the Borough-specific average number of bombs per dwelling and the public housing built from 1945-64 as a fraction of the residential stock is also shown in the figure
63
Figure A2 Residential Housing Stock in 1980 by Local Authority (LA)
a) Public Housing Stock ( Residential Stock)
b) Public Housing Stock (N) c) Residential Stock (N)
Notes Data from 344 Local Authority (LA) Districts in 1980 Panel a shows public housing stock in 1980 within the LA (shown in Panel b) divided by the total residential housing stock in 1980 within the LA (shown in Panel c)
64
Figure A3 Right-to-Buy Public Housing Sales 1980-1992 by Local Authority (LA)
a) Right-to-Buy Public Housing Sales ( 1980 Residential Stock)
b) Right-to-Buy Public Housing Sales (N) c) Right-to-Buy Public Housing Sales ( 1980 Public
Housing Stock)
Notes Data from 344 Local Authority (LA) Districts Panel A shows total RTB public housing sales in the period 1980-1992 as a percentage of the 1980 residential stock in the LA Panel B shows a count of total RTB public housing sales over the period 1980-1992 in the LA Panel C shows total RTB public housing sales in the period 1980-1992 as a percentage of the 1980 public housing stock in the LA
65
Figure A4 Correlation between Crime in 1980 and Right-To-Buy Public Housing Sales by 1981
Coeff (se) = -0021 (0007)
002
004
006
008
Crim
e in
198
0
0 1-05 05Log Public Housing Sales in 1980-81
Police Force Area Linear Fit
Crime in 1980 vs Public Housing Sales in 1980-81
Notes Figure shows for each Police Force Area (PFA) the crime rate in 1980 plotted against the log sales of public housing under the Right-To-Buy (RTB) scheme by 1981 Crime is defined as total yearly counts of property and violent crime offences per population at the PFA level Property crime defined as total yearly counts of burglary and theft or handling of stolen goods offences per population at the PFA level Violent crime defined as total yearly counts of robbery violent and sexual offences per population at the PFA level A linear function fitting the distribution of PFA-specific crime and RTB sales weighted by PFA-specific population size in 1980 is also shown For each PFA in the analysis the horizontal axis shows the log count of sales of public housing under the RTB scheme by 1981 as a percent of the total residential stock in 1980 whereas the vertical axis shows the crime rate in 1980
66
Figure A5 Correlation between Right-To-Buy Public Housing Sales in 1980-92 and Conservative Share in 1977 Local Elections
Coeff (se) = -0000 (0007)
15
2
25
3
Log
Publ
ic H
ousi
ng S
ales
in 1
980-
92
20 30 40 50Conservative Share in 1977 Local Elections
Police Force Area Linear Fit
Public Housing Sales in 1980-92 vs Conservative Share
Notes Figure shows for each Police Force Area (PFA) the sales of public housing under the Right-To-Buy (RTB) scheme by 1992 plotted against the share of conservative votes in the local elections of 1977 A linear function fitting the distribution of PFA-specific sales and conservative votes weighted by PFA-specific population size in 1980 is also shown For each PFA in the analysis the horizontal axis shows the share of conservative votes in the local elections of 1977 whereas the vertical axis shows the log count of sales of public housing under the RTB scheme by 1992 as a percent of the total residential stock in 1980
67
Figure A6 Right-to-Buy Public Housing Sales in 1980-92 and Public Housing Stock in 1980
Coeff (se) = 0180 (0018)
0
01
02
03
RTB
Pub
lic H
ousi
ng S
ales
in 1
980-
92
02 04 06 0801 03 05 07Public Housing in 1980
Local Authority Linear Fit
Public Housing Sales in 1980-92 vs Public Housing in 1980
Notes Figure shows scatter plot of public housing in 1980 (as a proportion of the Local Authority resident stock) on the x-axis and subsequent Right-to-Buy public housing sales between 1980 and 1992 (as a proportion of the Local Authority residential stock) on the y-axis Binned scatterplot of 344 observations
68
Table A1 Correlation between Right-To-Buy Public Housing Sales and Characteristics of Individuals and Households 1988
(Log) Age
Male White British
Income Group
No Rooms Housing Type
Past Burglary Victimization
(1) (2) (3) (4) (5) (6) (7) RTB Scheme 0055
(p = 0230) 0015
(p = 0713) 0018
(p = 0366) -0031
(p = 0489) 0017
(p = 0802) -0078
(p = 0105) 0005
(p = 0886) County Fixed Effects Yes Yes Yes Yes Yes Yes Yes Effect 55 3 19 -34 04 -69 38 Mean Dep Var Control Group 3614 05 0938 0920 4715 1123 0130 Sample Size 520 520 520 520 520 520 520 Number of Counties 52 52 52 52 52 52 52
Notes Treatment group defined as homeowners who rented from the council the property in which they currently reside prior to buying it Control group defined as council tenants who currently intend to buy the public property in which they reside within two years Standard errors were clustered at the county level and p-values from Wild Cluster Bootstrap are reported in parentheses Effect calculated as estimated coefficient divided by mean of dependent variable in the control group (council tenants who intend to buy the public property in which they reside within two years) reported here indicates significance at 1 indicates significance at 5 indicates significance at 10
69
Table A2 Correlation between Right-To-Buy Public Housing Sales and Crime Victimisation 1988
Crime Victimisation (1) (2) (3) (4) (5) (6) Effect Effect Effect RTB Scheme -0202
(p = 0002) -249 -0171
(p = 0059) -211 -0193
(p = 0005) -238
RTB Share -0013 (p = 0430)
-16
County Fixed Effects No Yes No Mean Dep Var Control Group 0810 0810 0810 Sample Size 1058 1058 1058 Number of Counties 53 53 53
Notes Treatment group defined as homeowners who rented from the council the property in which they currently reside prior to buying it Control group defined as council tenants who currently intend to buy the public property in which they reside within two years For each respondent RTB Share calculated as share of other treatment group respondents at the county level (leaving out the respondent herselfhimself) Standard errors were clustered at the county level and p-values from Wild Cluster Bootstrap are reported in parentheses Effect calculated as estimated coefficient divided by mean of dependent variable in the control group (council tenants who intend to buy the public property in which they reside within two years) reported here indicates significance at 1 indicates significance at 5 indicates significance at 10
Recent Issues All CFS Working Papers are available at wwwifk-cfsde
No Authors Title
650 Atsushi Inoue and Lutz Kilian Joint Bayesian Inference about Impulse Responses in VAR Models
649 Lutz Kilian Understanding the Estimation of Oil Demand and Oil Supply Elasticities
648 Lutz Kilian Nikos Nomikos and Xiaoqing Zhou
A Quantitative Model of the Oil Tanker Market in the Arabian Gulf
647 Lutz Kilian and Xiaoqing Zhou Does Drawing Down the US Strategic Petroleum Reserve Help Stabilize Oil Prices
646 Lutz Kilian and Xiaoqing Zhou Oil Prices Exchange Rates and Interest Rates
645 Lutz Kilian and Xiaoqing Zhou Oil Prices Gasoline Prices and Inflation Expectations A New Model and New Facts
644 Olivia S Mitchell Building Better Retirement Systems in the Wake of the Global Pandemic
643 Volker Bruumlhl Mehr Nachhaltigkeit im deutschen Leitindex DAX - Reformvorschlaumlge im Lichte des Wirecard-Skandals
642 Refet S Guumlrkaynak A Hakan Kara Burccedilin Kısacıkoğlu and Sang Seok Lee
Monetary Policy Surprises and Exchange Rate Behavior
641 Sergey Kovbasyuk and Marco Pagano Advertising Arbitrage
640 Sylwia Hubar Christos Koulovatianos and Jian Li
The Role of Labor-Income Risk in Household Risk-Taking
- September 2020
- Abstract
-