Centralized Fault Locating System - ats.com.vnats.com.vn/Content/Upload/Downloads/Centralized Fault...
72
Address Suite# 604, 8 Tran Hung Dao St. Hanoi, Vietnam Phone +84-24-38251072 E-mail [email protected] Website www.ats.com.vn Applied Technical Systems Company Ltd. 1 Centralized Fault Locating System
Transcript of Centralized Fault Locating System - ats.com.vnats.com.vn/Content/Upload/Downloads/Centralized Fault...

Address Suite# 604, 8 Tran Hung Dao St. Hanoi, Vietnam Phone [email protected] www.ats.com.vn
Applied Technical Systems Company Ltd.
1
Centralized Fault Locating System

1 Content
Content
Content ....................................................................................................................................... 1
Table of Figures ........................................................................................................................... 3
1. System Overview ................................................................................................................. 6
2. Hardware ............................................................................................................................ 8
2.1 SEL-411L ................................................................................................................................. 8
2.2 SEL-3355 ................................................................................................................................ 9
3. Data acquisition ................................................................................................................. 10
4. CIM-Based System Database .............................................................................................. 11
4.1 Database Specification ........................................................................................................ 11
4.2 CIM Database Management Tool ....................................................................................... 12
4.3 The Configuration Data for Fault locating .......................................................................... 16
5. Applications ....................................................................................................................... 17
5.1 Human-Machine-Interface for monitor system status ..................................................... 17
5.2 Distance to Fault Calculating and Viewing ......................................................................... 19
5.2.1 Travelling wave method .............................................................................................. 19
5.2.2 Impedance method ...................................................................................................... 21
5.2.3 Saved Calculation Results ............................................................................................ 23
5.2.4 Fault location presentation ......................................................................................... 24
5.3 Wide Area Monitoring System ........................................................................................... 27
5.3.1 Advantages .................................................................................................................. 28
5.3.2 Applications .................................................................................................................. 28
5.3.3 Main display blocks and alerts .................................................................................... 29
5.3.4 SmartWAMS Screens ................................................................................................... 30
5.4 Online calculation of line parameters ................................................................................ 36
5.4.1 Transmission Line Parameters and their Applications ............................................... 36
5.4.2 Methods of Determining Line Parameters ................................................................. 36
5.4.3 Online calculation with PMU ....................................................................................... 36
5.5 Fault Record Collection and After-Fault Analysis .............................................................. 39
5.6 Web-based Presentation and e-Notification ..................................................................... 44
5.6.1 Web-based Presentation Displays .............................................................................. 44
5.6.2 e-Notification ............................................................................................................... 45
6. Jobs-done .......................................................................................................................... 46
6.1 Centralized Fault Locating Systems for Central and Southern of Vietnam ...................... 46

2 Content
6.2 Fault Recorder system in SCADA/DMS of EVNCPC ............................................................ 48
6.3 Line parameters calculation ............................................................................................... 51
6.4 Propagation velocity calculation Ttravel during line energization ....................................... 52
6.4.1 TWFL Settings for 500kV line CBO-PLK (Central to Southern of Vietnam) ................ 53
6.4.2 Energized Line 500kV CBO-PLK and Analyze TWs ...................................................... 54
6.4.3 Conclusion .................................................................................................................... 59
6.5 Fault locating on Centralized Fault Locating System, results and assessments............... 59
6.5.1 Fault locating on 500kV Line CBO-PLK2 (Central to Southern of Vietnam) .............. 59
6.5.2 Fault locating on Other lines ....................................................................................... 66
6.6 Lessons learned ................................................................................................................... 71

3 Table of Figures
Table of Figures
Figure 1: Lines are going through jungle, forest, and mountainous terrains .................................... 6
Figure 2: 500kV Tower was down in a seveve tropical typhoon ........................................................ 6
Figure 3: A Tree touching 500kV line, causing a black out throughout half of Vietnam .................. 6
Figure 4: Main features and Data Flow ............................................................................................... 7
Figure 5: SEL411L for Line Protection and TW Distance to Fault Location ....................................... 8
Figure 6: Simple design makes SEL3355 the best of industrial-grade server computer. ............... 10
Figure 7: Main functions of AFL ......................................................................................................... 11
Figure 8. Visually displays electrical grid pattern on map (vector geo-database) .......................... 13
Figure 9. Visually displays electrical grid pattern on map (raster geo-database) ........................... 13
Figure 10. Facilitates adding and editing objects.............................................................................. 14
Figure 11. CIM-based asset management ......................................................................................... 14
Figure 12. Multiple-view user interface (Substation, SubcontrolArea level, Geo-Reference SL)... 15
Figure 13. Real-time data view from SCADA ..................................................................................... 15
Figure 14. CIM-based Topology coloring ........................................................................................... 16
Figure 15. Overall status of Centralized Fault Locating System ....................................................... 17
Figure 16. Bay feeder status of substation........................................................................................ 17
Figure 17. SEL-411L status ................................................................................................................. 18
Figure 18. Sequence of Event monitoring ......................................................................................... 18
Figure 19. Communication system monitoring................................................................................. 19
Figure 20. Lattice diagram for A-type method .................................................................................. 19
Figure 21. A-type method Result ....................................................................................................... 20
Figure 22. Lattice diagram for D-type method ................................................................................. 21
Figure 23. D-type method Result ....................................................................................................... 21
Figure 24. Circuit representation of line fault ................................................................................... 22
Figure 25. Operator’s Fault Location Dashboard .............................................................................. 24
Figure 26. Control bar of AFL ............................................................................................................. 24
Figure 27. List of fault by stations or lines......................................................................................... 25
Figure 28. GIS view of fault ................................................................................................................ 25
Figure 29. Summary view of specified event .................................................................................... 25
Figure 30. Integration with SEL SynchroWAVe Event to display of travelling wave time tags ....... 26
Figure 31. Realtime and history alarms ............................................................................................. 26
Figure 32. Overall Architecture and Data Flow of SmartWAMS ...................................................... 27
Figure 33. Diagram of Data Exchange on SmartWAMS ................................................................... 28
Figure 34. System Warning Color Rules ............................................................................................ 30
Figure 35. Dashboard Screen ............................................................................................................. 31
Figure 36. Voltage screen ................................................................................................................... 32

4 Table of Figures
Figure 37. Frequency screen .............................................................................................................. 32
Figure 38. Power Flow screen ............................................................................................................ 33
Figure 39. Voltage Sensitivity Screen ................................................................................................ 34
Figure 40. Angle Sensitivity Screen .................................................................................................... 35
Figure 41. Alarm Screen ..................................................................................................................... 35
Figure 42. PI equivalent model of the transmission line .................................................................. 37
Figure 43: Control center Fault Recorder and Fault Report Analysis architect............................... 39
Figure 44: Fault database synchronism ............................................................................................. 40
Figure 45. Data structure ................................................................................................................... 41
Figure 46. Configuration tool ............................................................................................................. 41
Figure 47. Editor to create, edit and delete Station ......................................................................... 42
Figure 48. Editor to config relay ........................................................................................................ 42
Figure 49. Fault Analysis ..................................................................................................................... 43
Figure 50. GIS visualization of fault location on web ........................................................................ 44
Figure 51. Detail of specified event ................................................................................................... 45
Figure 52. Display of waveform viewer ............................................................................................. 45
Figure 53. E-mail notification ............................................................................................................. 45
Figure 54: Hardware connection structure ....................................................................................... 46
Figure 55. Factory acceptance test at ATS’s Hanoi factory .............................................................. 47
Figure 56. Travelling wave testing system ........................................................................................ 47
Figure 57. Travelling wave HMI ......................................................................................................... 48
Figure 58. Overview of control center at EVNCPC ............................................................................ 48
Figure 59. Manage all events by tree structure ................................................................................ 49
Figure 60. Manage Sequence of Events ............................................................................................ 49
Figure 61. Summary of fault events................................................................................................... 50
Figure 62. Manage relay communication.......................................................................................... 50
Figure 63. Analyze a specific fault event ........................................................................................... 51
Figure 64. Online calculating of line parameters for 500kV MTH-OMO ......................................... 52
Figure 65. Type A time calculation .................................................................................................... 53
Figure 66. Single line diagram of 500kV line CBO-PLK ...................................................................... 53
Figure 67. Phase C initial wave peak during line energization ......................................................... 55
Figure 68. Traveling Waves During Line Energization ...................................................................... 55
Figure 69. Phase C initial wave peak and reflection from open breaker at remote terminal ........ 56
Figure 70. Phase B initial Wave Peak During Line Energization ....................................................... 56
Figure 71. Traveling Waves During Line Energinzation .................................................................... 57
Figure 72. Phase B initial Wave Peak and Reflection From Open Breaker at Remote Terminal .... 57
Figure 73. Phase C initial Wave Peak During Line Energization ....................................................... 58

5 Table of Figures
Figure 74. Traveling Waves During Line Energinzation .................................................................... 58
Figure 75. Phase B initial Wave Peak and Reflection From Open Breaker at Remote Terminal ... 59
Figure 76.TWs capture at the CBO Terminal for the B phase to ground fault ................................ 60
Figure 77. Damaged Corona at tower 4504, 215.28 km from CBO ................................................. 60
Figure 78. TWs capture at the CBO and PLK2 terminals for the B phase to ground fault .............. 61
Figure 79. Damaged Corona at tower 608, 9.45 km from PLK 2 ..................................................... 61
Figure 80. TWs captured at CBO and PLK2 terminals for the B phase to ground fault .................. 62
Figure 81. Centralized System shown the fault location at tower 5012-5011 on GIS .................... 62
Figure 82. Damaged Corona at tower 5012, 165.58 km from CBO ................................................. 63
Figure 83. TWs captured at CBO and PLK 2 terminals for the A phase to ground fault ................. 63
Figure 84. Centralized System shown the fault location at tower 5007-5008 on GIS .................... 64
Figure 85. Damaged Corona at tower 5008, 1673 km from CBO .................................................... 64
Figure 86. TWs captured at CBO and PLK 2 terminals for the A phase to ground fault ................. 65
Figure 87. Centralized System shown the fault location at tower 3005-3006 on GIS .................... 65
Figure 88. Damaged Corona at tower 3005, 269.52 km from CBO ................................................. 66
Figure 97. TWs captured at SMA and BaoLoc terminals for the A phase to ground fault .............. 67
Figure 98. Centralized System shown the fault location at tower 569-570 on GIS ........................ 67
Figure 99. Foam flies up the tower 563, 28.28 km from SMA ......................................................... 68
Figure 100. Manual estimated fault location from BLO terminal .................................................... 69
Figure 101. Centralized System shown the Z-based fault location at tower 324-325 on GIS ........ 69
Figure 102. Damaged composite insulator at tower 324, 4.9 km from BLO ................................... 69

6 1. System Overview
1. System Overview
Viet Nam Electricity (EVN) is the only state-owned Utility responsible for Generation, Transmision, and Distribution to End-Users. National Power Transmission Corporation (EVN-NPT) belongs to EVN and is responsible for Transmission Grid operation. Viet Nam Transmission Grid consists of 500kV and 220kV Lines and Substations, including:
- 7183 km of 500kV Lines (2015) - 15079 km of 220kV Lines (2015)
Transmissions over’ head lines with hundreds of kilometer going through mountains and forests of rugged terrains are very complicated for operation management and line patrol.
Vietnam is located in an area with very complex weather of floods, thunderstorms and tropical typhoon, which causes the huge possibility for transmission line incidents.
Electric power systems have grown rapidly over the years. This has resulted in a large increase of the number of lines in operation and their total length. These lines experience faults which are caused by storms, lightning, floods, insulation breakdown and, short circuits caused by birds and other external objects. In most cases, electrical faults manifest in
mechanical damage, which must be repaired before returning the line to service. The restoration can be expedited if the location of the fault is either known or can be estimated with reasonable accuracy. Fault locating system help identify those locations for early repairs to prevent recurrence, consequent major damages and restore services quickly.
Figure 1: Lines are going through jungle,
forest, and mountainous terrains
Figure 2: 500kV Tower was down in a seveve
tropical typhoon
Figure 3: A Tree touching 500kV line, causing a
black out throughout half of Vietnam

7 1. System Overview
AFL (Automatic Fault Location) is a TW-based and Impedance-based distance to fault locating Software Package developed by Applied Technical Systems Company Ltd (ATS). The main features and data flows are described in Figure 4 below. AFL is developed with standard-based features so it is a hardware-vendor independent software that will protect the utility investment and lower total cost of ownership in life cycle of the project.
Figure 4: Main features and Data Flow
The TW and Disturbance Impedance files recorded by SEL411L (SEL-USA) or other manufactures are sent from DAU Devices to the Data Acquisition Server through private WAN. AFL calculation engine, getting TW and Impedance records of both ends and line parameters stored in the system database to execute the appropriate algorithms to calculate the distance to fault location. Operators are able to set up the fault location calculation in automatic or manual mode.
The system sizing fully meets the demanding specification of clients:
• Number of substations: ≥ 500 substations • Number of lines: ≥2000 lines • Number of stored records of travelling wave and disturbance event: ≥2,000,000 records

8 2. Hardware
2. Hardware
2.1 SEL-411L
Figure 5: SEL411L for Line Protection and TW Distance to Fault Location
The SEL-411L provides complete protection and control of any transmission line, and combine subcycle line protection with traveling-wave fault locating. Any transmission line (short, long, or series-compensated) can be well-protected with the SEL-411L. The key features of SEL-411L are:
• Line Current Differential, Distance, and Directional Overcurrent Protection Apply subcycle single- or three-pole current differential protection for up to four terminal lines, even with two breakers per terminal, using the SEL-411L. Five zones of phase and ground distance elements as well as directional overcurrent elements provide subcycle operation and superior security. One line protection relay that uses a combination of differential, distance, and overcurrent elements can meet specific application needs while reducing protection system costs.
• Bay Control, Reclosing, and Breaker Failure Detection Apply complete bay control, reclosing, and breaker failure protection for two breakers. Monitor circuit breaker performance, including the average and last tripping time, motor run time, and contact-interrupting duty.
• Comprehensive Monitoring Implement advanced 87L channel monitoring functions to validate 87L channel health and enhance trip security.
• Synchrophasors The SEL-411L provides real-time system state measurement with time-synchronized voltages and currents in the IEEE C37.118 standard format. Record streaming synchrophasor data from SEL-411L relays with system-wide disturbance recording. Use wide-area remote synchrophasor data to control the power system

9 2. Hardware
• High-Accuracy Traveling-Wave Fault Locating Accurately pinpoint faults with time-synchronized traveling-wave fault location. Traveling-wave fault locating provides greater accuracy and lets you send your line crew to the nearest tower or span to quickly address the problem. With the GPS clocks and communications channel, the relay automatically calculates the fault location. Without a communications channel, the relay still measures and records the traveling-wave event. Using the traveling-wave event data, you can calculate an accurate fault location by hand or with SEL-5601-2 synchroWAVe® Event Software. Traveling-wave fault locating is the best method for series-compensated and parallel transmission line configurations. You will get precise results regardless of the line configuration or fault impedance.
• Advanced Automation and Communication Integrating four-shot recloser and relay logic to automate operations. Serial or Ethernet communications improve station integration. Variety of available protocols, including: Mirrored Bits communications DNP3 LAN/WAN Modbus® Simple Network Time Protocol (SNTP) Parallel Redundancy Protocol (PRP) IEEE 1588 Precision Time Protocol Version 2 (PTPv2) IEC 61850 Edition 2
ATS has used the SEL-411L with the ability to collect TW and DFR data to calculate the distance to the fault point using both the TW and Impedence method.
2.2 SEL-3355
The server that collects, stores and calculates fault location at the Center is SEL-3355. This industrial-grade computer without any moving parts is designed specifically for use in hazard environments that requires higher reliability. SEL3355 is designed, manufactured and tested according to high quality management procedures of SEL Inc. (USA) and is warranted for 10 years. ATS has experienced using SEL3355 in SAS, SCADA/DMS and Operation Control Center (OCC) projects where the entire system from lower-level stations to higher-level control centers included servers for DMS and GIS applications, also utilizing SEL3355.

10 3. Data acquisition
Figure 6: Simple design makes SEL3355 the best of industrial-grade server computer.
3. Data acquisition
TWFL will be triggered and recorded TW and Impedance Files whenever there is a in-zone fault in the protected OHL. The recorded files will be automaticly transfered to the Registered Centralized System for processing.
The application continuously watches a source folder, and if any new COMTRADE (IEEE C37.111) format files added to the folder or subfolder it will be detected and processed by Fault Location System. The traveling wave COMTRADE file will be processed with the travelling wave method, and the impedance COMTRADE file will be processed with the impedance method.
Figure below describes main functions of AFL
Power Supplies
Main Board
Solid-State Drives
Memory

11 4. CIM-Based System Database
Figure 7: Main functions of AFL
4. CIM-Based System Database
4.1 Database Specification
ATS SmartCIM Database is a comprehensive CIM-based database for Power System Operation and Management. Unified Modeling Language (UML) and Object-Oriented model are used to define and simulate power system data.
Basic components
• Object defines the entire set of power system components and their properties
• Object Class classifies objects and properties in the system
• Relationships links objects or object classes to indicates relationship amongst their attributes
Data structure: The database is structured in table form with approximately 2,000 data tables and thousands of relationships, classified into three main data packages.
• IEC-61970 package: manages power system data according to physical structure
• IEC-61968 package: manages asset-, payment- and customer-related data
• IEC-62325 package: manages power market-related data

12 4. CIM-Based System Database
4.2 CIM Database Management Tool
ATS-SmartCIM is a module in iCMS software system. With electrical data objects designed according to CIM standard (Common Information Model - IEC 61968, IEC 61970), combined with Geodatabase supporting various vector and raster formats, ATS-SmartCIM can provide users with various functional benefits in operation, management and maintenance of electrical systems. Key features of SmartCIM are:
a) Visually displays electrical grid pattern on map
This feature allows users a visualized perspective of the power grid system. Users can find information about any element of the system.
Elements are divided into layers following their voltage levels and color-coded.
The search function helps users to locate any object on map.

13 4. CIM-Based System Database
Figure 8. Visually displays electrical grid pattern on map (vector geo-database)
Figure 9. Visually displays electrical grid pattern on map (raster geo-database)
b) Assists with design procedure
This feature allows users to easily add and update any objects. Operators can easily add and/or update new objects such as transformers, meters, lines, etc. to the map for additional information.
The feature also supports simulating opened or closed status of any switching object while still assisting operators to correctly and safely control the actual system.

14 4. CIM-Based System Database
Figure 10. Facilitates adding and editing objects
c) Provides CIM-based asset management (Common Information Model)
Asset data of all objects in electrical systems (power poles, transformers, power lines, meters, breaker, etc.) are described in detail according to CIM model. This feature provide the most complete information to the management system.
Figure 11. CIM-based asset management
d) Supports multiple-view user interface
This feature provides to users both views of the electrical network: schematic (single line) and geographic diagrams. It also provides views of all substations and access to all technical data of every network element.

15 4. CIM-Based System Database
Figure 12. Multiple-view user interface (Substation, SubcontrolArea level, Geo-Reference SL)
e) Displays real-time operation data
The module can connect to SCADA real-time database (supported DDE, OPC), allowing users to monitor actual operating parameters such as device status, analog measurements, meter parameters, etc. on the diagram.
Figure 13. Real-time data view from SCADA
f) Manages electrical grid topology using CIM standards
Almost all electrical elements in power grid are connected together to form the grid structure. These connections are created via the connectivity nodes on a single-line diagram (Connectivity Node - described in CIM standard). The program can simulate all connections, which allows users to manage electricity supply range following switching condition of devices. It also allows for clear display of information on incident area on geographic map. With the grid diagram on the map, users can define the scope of the impact of the incident.
The network elements shall be colored-coded with a set of user-predefined colors according to their electrical status as follows:

16 4. CIM-Based System Database
• Overload conditions
• Energization/de-energization status
• Earthing status
• Feeder-tracing mode, where the entire feeder shall be colored with the same uniform representation
Figure 14. CIM-based Topology coloring
g) Manages technical reports
Statistical reports of operating parameters, incidents, statistics device, shall be as timely and fully provided as per user requirements and configurable.
4.3 The Configuration Data for Fault locating
The Configuration Data is a CIM-based power system database, which includes:
• TW Fault location device and location: name of the device, GPS location, the station where the TWFL device is installed, the line that the device monitors.
• Fault location channel definitions: the channel index number for each sample in the record
• Line parameters: name of the line, GPS location, the length of the line route, nominal calculated impedance of the line (R1, R0, X1, X0, B1, B0)

17 5. Applications
5. Applications
5.1 Human-Machine-Interface for monitor system status
HMI of Centralized System provides the ability to manage from overall system status to detail status of SEL-411L at each bay feeder. It can also monitor communication status and record sequence of event occur on the system.
Figure 15. Overall status of Centralized Fault Locating System
Figure 16. Bay feeder status of substation
18 5. Applications
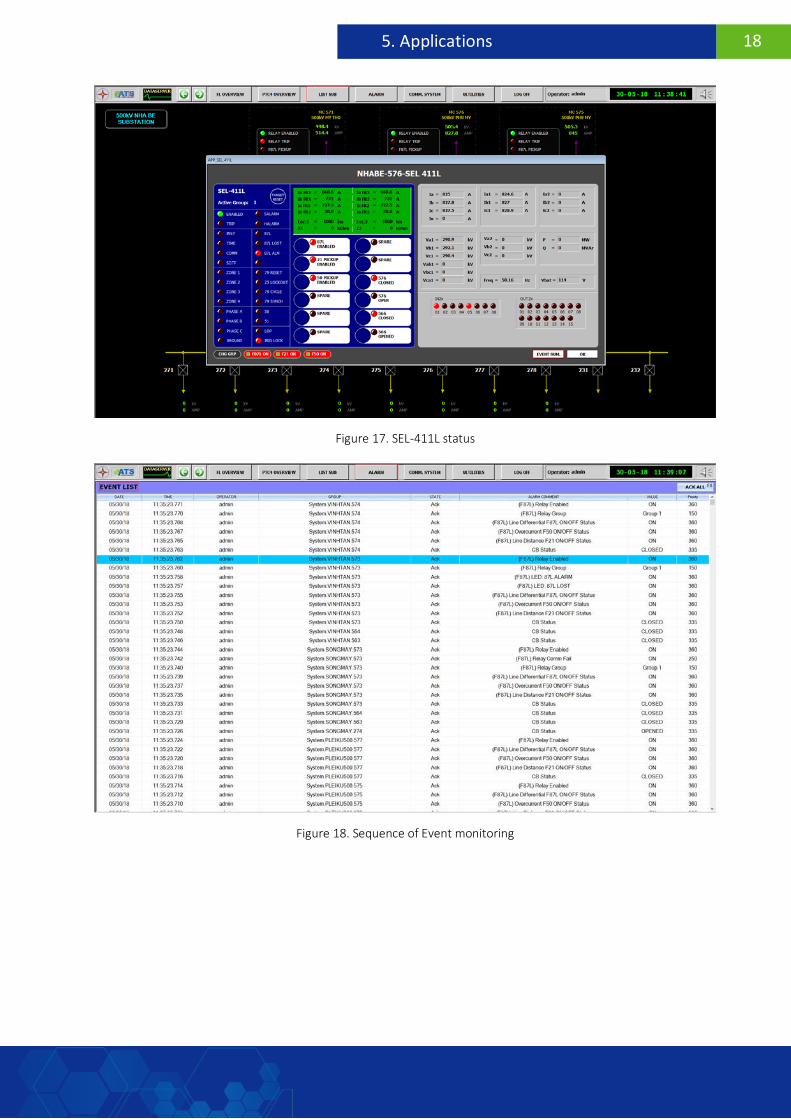
Figure 17. SEL-411L status
Figure 18. Sequence of Event monitoring

19 5. Applications
Figure 19. Communication system monitoring
5.2 Distance to Fault Calculating and Viewing
5.2.1 Travelling wave method
5.2.1.1 A-type method
A-type locators perform measurements on one side of the line. The distance to the fault location is calculated by measuring the time between the moments when the first wave, generated at the fault location, reaches the locator, and the second moment when the wave reflected from the fault location reaches the locator. The electromagnetic wave is entirely reflected from the fault location if the occurring fault angle has a resistance less than the wave impedance of the line.
Figure 20. Lattice diagram for A-type method

20 5. Applications
The distance to the fault location from station A results from the following dependence:
𝐷𝐷 =𝑡𝑡2−𝑡𝑡1
2 × 𝑣𝑣
where:
D – distance to fault location [m]
t1 – time at which the first wave generated at fault location reaches station A [s]
t2 – time at which the wave reflected from fault location reaches station A [s]
v – wave propagation velocity [m/s].
Figure 21. A-type method Result
5.2.1.2 D-type method
D-type locators perform measurements on both sides of the line. Waves generated at a fault location run towards stations A and B, and reach them within several microseconds. For a correct determination of the fault location, a D-type locator requires the use of two devices synchronized with each other in time (e.g. by means of precise GPS clock), installed at the two ends of the line. The locator determines the moment when the wave reaches stations A and station B, which is used to calculate the distance from fault location.

21 5. Applications
Figure 22. Lattice diagram for D-type method
The distance to the fault location from station A results from the following dependence:
𝐷𝐷 = 𝐿𝐿 + (𝑡𝑡𝐴𝐴 − 𝑡𝑡𝐵𝐵) × 𝑣𝑣
2 (3)
where:
tA – time at which the first wave generated at fault location reaches station A [s]
tB – time at which the first wave generated at fault location reaches station B [s]
L – line length [m].
Figure 23. D-type method Result
5.2.2 Impedance method
5.2.2.1 Single-end method

22 5. Applications
Figure 24. Circuit representation of line fault
Single-end fault location algorithms usually use variables from the sending end. Sending end voltage can be defined as:
VS = IS(mZL) + IfRf (1)
Where, m: distance to fault location, Rf : fault resistance, If: fault current, ZL : line impedance, VS and IS : voltage and current at the sending end bus respectively.
5.2.2.1.1 Simple Reactance Method
This method compares the measured line impedance (ZL ) and calculated impedance (VS /IS) to find the fault location. Accuracy of this method depends on the angle of IS being equal to the angle of If .
If the fault resistance is ignored, the simple form of the distance to the fault can be obtained as given in Equation:
m = Im(VS/IS) / Im(ZL) (2)
5.2.2.1.2 Takagi Method
The Takagi method requires additionally pre-fault current values. This method improves simple reactance method by reducing the effect of load flow and minimizing the effect of fault resistance. Superposition current (Isup) can be described as follows:
Isup = I - Ipre = If/d (3)
Where, I: fault current and Ipre: pre-fault current.
If the source and line have the same impedance, d becomes a real number. Accuracy of this method depends on this assumption.
Through Eq. (3) and Eq. (1):
VS = IS(mZL) + IsupdRf (4)
VSr = mRLISr - mXLISi + IsuprdRf (5)
VSi = mXLISr + mRLISi + IsupidRf (6)
By multiplying Eq. (5) with Isupi and Eq. (6) with Isupr and subtract Eq. (6) from Eq. (5):

23 5. Applications
m = a/(b-c) (7)
Where:
a = VSr Isupi - VSi Isupr (8)
b = R(ISr Isupi - ISiIsupr) (9)
c = X(ISrIsupr + ISiIsupi) (10)
5.2.2.1.3 Modified Takagi Method
Modified Takagi method replaces superposition current with zero sequence current of sending end.
This method is limited with ground faults since zero sequence current exists for ground faults. Then, the fault distance is calculated as follows:
m = Im(3VSI0*e-jT) / Im(3ZLISI0*e-jT) (11)
Where, I0: zero sequence current and T: angle between I0 and If.
5.2.2.2 Double-end method
Double-end fault location algorithms calculate fault location from the impedance seen from both ends of the line. Because of their accuracy in detecting fault location, these algorithms are usually better than one-end fault location algorithms. Double-end fault location algorithms take Vf as a reference point.
Vf can be defines as:
Vf = VS - ISmZL (12)
Vf = VR - IR(1-m)ZL (13)
Fault location can be calculated with Eq. (12) and Eq. (13):
m = (VS - VR + ZLIR) / (ZL * (IS + IR)) (14)
5.2.3 Saved Calculation Results
The calculation results of Fault Location are stored in System Centralized Database for presentation and notification functions.
- Fault parameters are included: • type of fault, • inception time, • duration time, • fault current, • distance to fault location (in km or mile, or in percentage of the total line length, or in
the span between towers of the faulted line) - Other Signal processing results:
• Travelling wave method: approximation signal, detail signal
24 5. Applications
• Impedance method: sine wave signal.
5.2.4 Fault location presentation
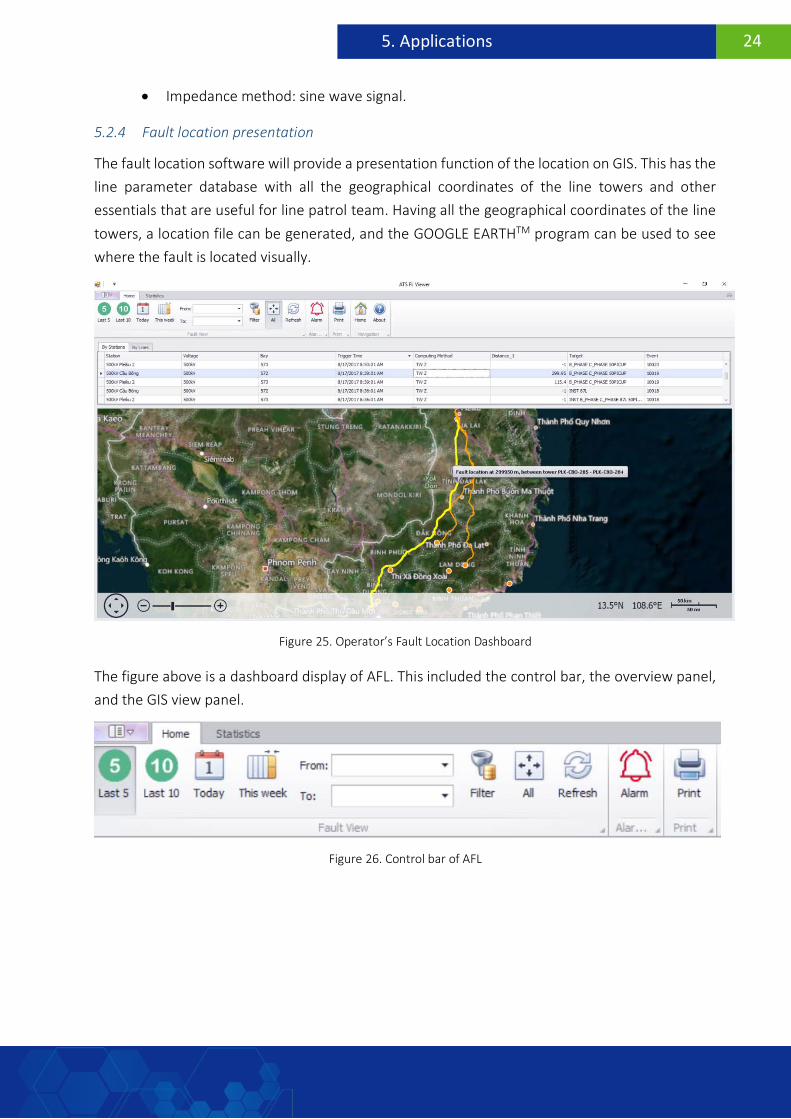
The fault location software will provide a presentation function of the location on GIS. This has the line parameter database with all the geographical coordinates of the line towers and other essentials that are useful for line patrol team. Having all the geographical coordinates of the line towers, a location file can be generated, and the GOOGLE EARTHTM program can be used to see where the fault is located visually.
Figure 25. Operator’s Fault Location Dashboard
The figure above is a dashboard display of AFL. This included the control bar, the overview panel, and the GIS view panel.
Figure 26. Control bar of AFL

25 5. Applications
Figure 27. List of fault by stations or lines
Figure 28. GIS view of fault
Users can view the fault record index by clicking on a substation or line element in the GIS view, or select the fault in the list of records over the specified time range is display in the overview panel.
Figure 29. Summary view of specified event

26 5. Applications
The system also integrate with SEL SynchroWAVe Event for the operator can analyze travelling wave time tags and waveforms, fault impedance, and determine the distance to fault.
Figure 30. Integration with SEL SynchroWAVe Event to display of travelling wave time tags
Users can view the realtime alarms (new and/or unconfirmed events) and history alarms (old and/or confirmed events):
Figure 31. Realtime and history alarms

27 5. Applications
5.3 Wide Area Monitoring System
SmartWAMS (Smart Wide Area Monitoring System) is a software module for gathering, processing and displaying synchrophasor data based on Phasor Measurement Unit (PMU). Most digital relays now incorporate phasor function as a PMU, such as in SEL relays (SEL-411L, SEL-421, SEL-451, etc.) with sample rate up to 60 samples/second. This module allows for wide monitoring of power system with high reliability and fast data up- date time.
SmartWAMS is designed to comply with world standards (eg. IEEE, IEC). The system can be used independently with SCADA/EMS system and simultaneously supports SCADA/EMS systems for real-time/on-line monitoring and operation as well as calculation and post-operation analysis of power system.
Figure 32. Overall Architecture and Data Flow of SmartWAMS
SmartWAMS will aggregate all data from different sources, then processes and displays them according to the user's purpose:
♦ Process: processes all of time-synchronizes phasor data measured from PMU before displaying. Processes include: linear state estimation (LSE), power flow calculations, phase angle difference, voltage and phase angles sensitivity calculation, etc.
♦ Human - Machine Interface (HMI): includes main functions for display and control on-screen such as Graphic, Diagram, Trend, Alarm, Logs, Configure, Import/Export.
28 5. Applications
Figure 33. Diagram of Data Exchange on SmartWAMS
5.3.1 Advantages
♦ Connection & collection of SynchroPhasor Data in real time with a sampling cycle of up to 25 samples per second
♦ Process and display of the Wide Area Data of power system such as: f, U, δ, P, Q, etc.
♦ Big data archived and stored in multiple databases such as ATS SmartHIS, PI, SQL, Oracle, etc.
♦ Interact with application systems such as SCADA/EMS, PSS/E software, DigSILENT, etc.
♦ Support standard connection protocols such as: IEEE C37.118, IEEE 1344-1995, Gateway Stream, SEL Fast Messaging, etc.
♦ Support standard communication protocols such as TCP (IPv4 and IPv6), UDP (IPv4 and IPv6), Serial
5.3.2 Applications
5.3.2.1 Real time applications
♦ Enhance system situational awareness by displaying and alerting with real-time data of the system operation status:
• Frequency (f) and rate of change of frequency (df/dt);
• Voltage & current (Magnitude & Angle);
• Angle difference (); • Power flow (MW, MVA);
• Voltage & angle sensitivities (dV/dP, d/dP)
♦ Increase observability, speed and improve accuracy of state estimation (SE). The SE model can use PMU data or by combining PMU and SCADA data.
♦ Calculate stability margin (steady state & voltage stabilities, etc.) and alert:
• Load capacity of the grid based on phase angle difference;

29 5. Applications
• Frequency stability based on frequency observation in different areas;
• System stability based on rate of change of the parameters (voltage, frequency);
• Voltage stability based on sensitivities (dV/dP);
• Angle stability based on sensitivities (dδ/dP)
♦ Provide data for optimal power flow calculation (OPF), volt- age and reactive power regulation
♦ Calculate power transmission limit and capacity of transmission lines with third-party softwares such as PSS/E, Dig- SILENT, QuickStab, etc.
♦ Detect and localize events occurred on the grid which may have significant impact on operation of power system
♦ Early detection of power fluctuations on power system.
5.3.2.2 Off-line applications
Off-line applications are based on Historian Information System (HIS) database and able to:
♦ Analyze incident/event occurring on power system in conjunction with the existing SCADA/EMS
♦ Provide parameters to simulate power system condition before, during, and after the incident on third-party simulation programs such as PSS/E, DigSILENT, etc.
♦ Adjust the parameters of power system (transmission lines, transformers)
♦ Review and re-evaluate the power, voltage, current and phase angle (P/Q/U/I/delta) of power system after wide-area faults
♦ Help to create sequence of event (SOE) for analyzing wide area problems; locate and identify fault events on grid
♦ Evaluate demand response and construct load model based on SynchoPhasor data stored in the HIS system of SmartWAMS
♦ Provide monitoring and reporting of information via Web technology to multiple users. The modules may include: Monitoring, Reporting, e-Notification, e-Alarm.
♦ HIS provides operational data to evaluate and correct dynamic models of generator sets, as well as data for evaluation of post-operation
5.3.3 Main display blocks and alerts
Main display blocks of SmartWAMS are classified into four main groups:
♦ Display group of frequency (f) and rate of change frequency (df/dt); ♦ Display group of voltage magnitude (U), voltage angle (δ) and voltage angel difference (∆δ); ♦ Display group of voltage & angle sensitivities (dV/dP, dδ/dP); ♦ Display group of power flow (MW, MVA).

30 5. Applications
User can observe the state of power system in various ways (in numerical or graphical form). These groups will be arranged according to the appropriate interface for users during usage.
With each state parameter in each display block, there are associated warning levels (corresponding to the prescribed limits) so that operators can easily recognizes the status of power system.
There are three major status levels:
♦ Level 1: Normal status (Green) ♦ Level 2: Near-Critical status (Yellow) ♦ Level 3: Danger status (Red)
Figure 34. System Warning Color Rules
5.3.4 SmartWAMS Screens
SmartWAMS includes following Tabs on screen:
♦ Dashboard: Main monitoring screen ♦ Voltage: Monitor parameters related to voltage ♦ Frequency: Monitor parameters related to frequency ♦ Power Flow: Monitor parameters related to power flow
♦ Sensitivity: Monitor parameters related to sensitivity ♦ Other related tabs: Including Alarm, Logs, Configure, Help, etc.
5.3.4.1 Dashboard
On Dashboard screen, operators can observe:
♦ The performance of the entire electrical system through grid diagram, with two ways of display:
• According to geographical map (Principle Diagram)
• According to single-line diagram (Single Diagram)
♦ Trend and frequency values of system at required observation nodes
♦ All warnings for each parameter of power system:
• (F): Warning on frequency • (AD): Warnings of phase angle difference between two nodes
• (VM): Warnings of voltage magnitude • (P): Warnings of active power (MW) • (Q): Warnings of reactive power (MVAr)

31 5. Applications
• (VS): Warnings of voltage sensitivity (dV/dP, dV/dQ)
• (AS): (AS): Warnings of angle sensitivity (dδ/dP) ♦ Detailed graphs of each operating parameter on power system at each observation
nodes.
Each diagram allows for simultaneous monitoring of important operating parameters on power system such as frequency, voltage, power flow, phase angle difference, voltage sensitivity and phase angle, etc. Users also can perform operations such as Zoom, Pan, stop the graph right at the time of observation or view past data.
Figure 35. Dashboard Screen
5.3.4.2 Voltage
On Voltage screen, operators can observe (Figure 36):
♦ Operating parameters of the entire power system through the grid diagram, same as on Dashboard screen;
♦ Graphs of voltage magnitude and phase angle at one or more observation nodes;
♦ Graphs of voltage phase angle difference between the observation nodes;
♦ Voltage warning levels for magnitude, phase angle and phase angle difference according to specified color.
The selection of viewpoints will be through the Check Option section right on the application. The operation on the Voltage screen is the same as on the Dashboard screen.

32 5. Applications
Figure 36. Voltage screen
5.3.4.3 Frequency
On Frequency screen, operators can observe (Figure 37):
♦ Operating parameters of the entire power system through the grid diagram, same as on Dashboard screen;
♦ Graph of frequency (f), rate of change frequency (df/dt) at one or more observation nodes;
♦ Frequency warning levels according to specified color.
The selection of viewpoints will be through the Check Option section right on the application. The operation on the Frequency screen is the same as on the Dashboard screen.
Figure 37. Frequency screen

33 5. Applications
5.3.4.4 Power Flow
On Power Flow screen, operators can observe (Figure 38):
♦ Operating parameters of the entire power system through grid diagram, similarly to Dashboard screen;
♦ Graph of active power (MW) and reactive power (MVAr) on the observation transmission lines;
♦ Power Flow warning levels according to specified color.
The selection of observation lines will be through the Check Option section right on the application. The operation on the Power Flow screen is the same as on Dashboard screen.
Figure 38. Power Flow screen
5.3.4.5 Voltage Sensitivity
On Voltage Sensitivity screen, operators can observe (Figure 39):
♦ Operating parameters of the entire power system through grid diagram, same as on Dashboard screen;
♦ Rate of change voltage according to power flow (P, Q) on the transmission line through the P-V and Q-V characteristics;
♦ Voltage stability limits at the nodes
♦ When nearby transmission lines or elements are faulty; ♦ Voltage stability warning levels according to specified color.
The selection of observation lines will be through the Check Option section right on the application. The operation on the Voltage Sensitivity screen is the same as on Dashboard screen.

34 5. Applications
Figure 39. Voltage Sensitivity Screen
5.3.4.6 Angle Sensitivity
On Angle Sensitivity screen, operators can observe (Figure 40):
♦ Operating parameters of the entire power system through grid diagram, same as on Dashboard screen;
♦ Rate of change in voltage angle according to power flow according to P-δ characteristics;
♦ Static stability limit and static stability reserve ♦ When nearby transmission lines or elements are faulty; ♦ Voltage angle stability warning levels according to specified color.
The selection of observation lines will be through the Check Option section right on the application. The operation on the Angle Sensitivity screen is the same as on Dashboard screen.

35 5. Applications
Figure 40. Angle Sensitivity Screen
5.3.4.7 Alarm
On Alarm screen, operators can observe (Figure 41):
♦ List of warnings of each operational parameter at the observation node and transmission line;
♦ Present and historical state of system; ♦ Selectable warnings on demand
Figure 41. Alarm Screen
36 5. Applications
5.4 Online calculation of line parameters
5.4.1 Transmission Line Parameters and their Applications
The electrical performance of a transmission line is governed by four fundamental parameters. These parameters are resistance, inductance, capacitance, and conductance. The resistance and inductance parameters form the series impedance of the line. The capacitance and conductance parameters form the shunt admittance. The conductance parameter accounts for leakage current in transmission tower insulators. Under normal operating conditions, leakage current is minimal. For this reason, the conductance parameter is usually ignored
Accurate transmission line impedance parameters are of great importance in power system operations for all types of system simulations, such as transient stability, state estimation etc., and are used as the basis for protective relay settings, impedance-based fault location, dynamic line rating.
5.4.2 Methods of Determining Line Parameters
Existing methods to determine the line parameters can be categorized as follows:
o Parameter calculations using line constants programs: Line parameters are estimated by engineers based on the tower geometries, conductor dimensions, estimates of actual line length, conductor sag, and other factors. These calculated parameters are based on assumptions and approximations
o Parameter measurements using signal injection equipment: Signal injection is an option that utilities have to measure line parameters. it requires a line outage and an adequate power source
With the development of the PMU technology, synchronized phasors offer the possibility of allowing accurate estimation of transmission line parameters. Accurate knowledge of transmission line impedance parameters helps to:
o Improve accuracy in relay settings.
o Improve post-event fault location and thus lead to a quicker restoration of the systems.
o Improve transmission-line modeling for system simulations, such as state estimation calculations.
5.4.3 Online calculation with PMU
With PMUs at each end of a transmission line, calculate the impedance of a line continuously over time:
𝑍𝑍𝜋𝜋 = 𝑉𝑉𝑃𝑃𝑃𝑃2 − 𝑉𝑉𝑄𝑄𝑃𝑃2
𝐼𝐼𝑃𝑃𝑃𝑃𝑉𝑉𝑄𝑄𝑃𝑃 + 𝐼𝐼𝑄𝑄𝑃𝑃𝑉𝑉𝑃𝑃𝑃𝑃 (1)
𝑌𝑌𝜋𝜋 = 2(𝐼𝐼𝑃𝑃𝑃𝑃 − 𝐼𝐼𝑄𝑄𝑃𝑃)𝑉𝑉𝑄𝑄𝑃𝑃 + 𝑉𝑉𝑃𝑃𝑃𝑃
(2)

37 5. Applications
This method has the following advantages:
o Lines remain energized
o Covers all system/weather conditions
o Removes any offline calculation assumptions
Figure 42. PI equivalent model of the transmission line
5.4.3.1 Single Measurement Method
The single measurement method is proposed is the simplest of PMU based methods. As the name states, only one set of PMU measurements is required for its implementation. This method applies KVL and KCL to the nominal PI model for transmission lines. The following equations are produced:
𝑉𝑉𝑃𝑃𝑃𝑃 − 𝑉𝑉𝑄𝑄𝑃𝑃 = 𝑍𝑍𝜋𝜋 𝐼𝐼𝑃𝑃𝑃𝑃 − 𝑌𝑌𝜋𝜋2 𝑈𝑈𝑃𝑃𝑃𝑃 (3)
𝐼𝐼𝑃𝑃𝑃𝑃 − 𝐼𝐼𝑄𝑄𝑃𝑃 =𝑌𝑌𝜋𝜋2𝑈𝑈𝑃𝑃𝑃𝑃 + 𝑈𝑈𝑄𝑄𝑃𝑃 (4)
Line parameters are calculated by equations:
𝑍𝑍𝜋𝜋 = 𝑈𝑈𝑃𝑃𝑃𝑃2 − 𝑈𝑈𝑄𝑄𝑃𝑃2
𝐼𝐼𝑃𝑃𝑃𝑃𝑈𝑈𝑄𝑄𝑃𝑃 + 𝐼𝐼𝑄𝑄𝑃𝑃𝑈𝑈𝑃𝑃𝑃𝑃 (5)
𝑌𝑌𝜋𝜋 = 2(𝐼𝐼𝑃𝑃𝑃𝑃 − 𝐼𝐼𝑄𝑄𝑃𝑃)𝑈𝑈𝑃𝑃𝑃𝑃 + 𝑈𝑈𝑄𝑄𝑃𝑃
(6)
5.4.3.2 Multiple Measurement Method
Equation (3) is rearranged to solve for 𝐼𝐼𝑃𝑃𝑃𝑃 .This result is substituted into equation (4) and solved for 𝐼𝐼𝑄𝑄𝑃𝑃 . The following equations are produced:

38 5. Applications
𝐼𝐼𝑃𝑃𝑃𝑃 =1𝑍𝑍𝜋𝜋
(𝑈𝑈𝑃𝑃𝑃𝑃 − 𝑈𝑈𝑄𝑄𝑃𝑃) +𝑌𝑌𝜋𝜋2 𝑈𝑈𝑃𝑃𝑃𝑃 (7)
𝐼𝐼𝑄𝑄𝑃𝑃 =1𝑍𝑍𝜋𝜋
(𝑈𝑈𝑃𝑃𝑃𝑃 − 𝑈𝑈𝑄𝑄𝑃𝑃)−𝑌𝑌𝜋𝜋2 𝑈𝑈𝑄𝑄𝑃𝑃 (8)
These equations can be written in matrix format and arranged in such a manner to set up a least squares problem. When multiple measurements are available, the two unknown parameters can be estimated as that which minimizes the sum of squared differences between the data values and their corresponding modeled values.
With N sets PMU data, the matrix form is list below:
R = H*Q (9)
Where:
𝑅𝑅 = 𝐼𝐼𝑃𝑃𝑃𝑃1 𝐼𝐼𝑄𝑄𝑃𝑃1 … 𝐼𝐼𝑃𝑃𝑃𝑃𝑁𝑁 𝐼𝐼𝑄𝑄𝑃𝑃𝑁𝑁 𝑇𝑇
; 𝐻𝐻 =
⎣⎢⎢⎢⎢⎡𝑈𝑈𝑃𝑃𝑃𝑃
1 − 𝑈𝑈𝑄𝑄𝑃𝑃1 𝑈𝑈𝑃𝑃𝑃𝑃1
𝑈𝑈𝑃𝑃𝑃𝑃1 − 𝑈𝑈𝑄𝑄𝑃𝑃1 𝑈𝑈𝑄𝑄𝑃𝑃1… …
𝑈𝑈𝑃𝑃𝑃𝑃𝑁𝑁 − 𝑈𝑈𝑄𝑄𝑃𝑃𝑁𝑁 𝑈𝑈𝑃𝑃𝑃𝑃𝑁𝑁
𝑈𝑈𝑃𝑃𝑃𝑃𝑁𝑁 − 𝑈𝑈𝑄𝑄𝑃𝑃𝑁𝑁 𝑈𝑈𝑄𝑄𝑃𝑃𝑁𝑁 ⎦⎥⎥⎥⎥⎤
; 𝑄𝑄 =
1𝑍𝑍𝜋𝜋
𝑌𝑌𝜋𝜋2
The estimated value:
𝑄𝑄 = (𝐻𝐻𝑇𝑇 ∗ 𝐻𝐻)−1 ∗ 𝐻𝐻𝑇𝑇 ∗ 𝑅𝑅 (10)
With the above equations, the PI model parameters of overhead transmission line can be estimated.

39 5. Applications
5.5 Fault Record Collection and After-Fault Analysis
Figure 43: Control center Fault Recorder and Fault Report Analysis architect
Control center fault database is designed to synchronize with fault database at all substations. As soon as the lastest fault event is collected to substation fault database, it will be instantly transmited to control center fault database, operator can view and analysis as at the substation.
The main features:
• Fully meets all requirements to facilitate the analysis of disturbances on the power system or generation, transmission and distribution assets
• Provides High-Accuracy Time-Stamping
• Provides Oscillography and Event Reporting
• Automatically collects, archives and visualizes for fault records, disturbance records of protection relays, fault recorders.
• Automatically collects, archives and displays of Sequence of Events -SOEs of protection relays, BCUs.
• System accurately time-stamps the SOE, FR, and DDR data, which can then be easily time-synchronized by the user.
• Provides system-wide detail records and analysis tools such as: searching and filtering for data analysis
• Manage more than a thousand IEDs in hierarchy
• Covers Distributed collection system and Centralized Data Management

40 5. Applications
• Compliant with International standard including IEC, NERC, IEEE
• Supports Fault record, Disturbance record protocols including: IEC61850-8-1 File Services, FTP, Telnet, proprietary protocol, etc.
• Supports latest version of COMTRADE file format
• Supports IEDs from various manufacturers: SEL, Alstom, GE, Siemens, IngeTeam, Nari, Toshiba
Figure 44: Fault database synchronism
Fault Recorder system will analyzes, extractes and filters data stored in fault records, and displayed graphically to facilitate fault analysis .
Various data can be displayed, including :
• Simultaneous display of several fault records.
• Summary of fault records
• Wave-form data or vector data of analog channels, digital output signals and can be added
• Data of several analog channels, vector channels or digital outputs may be displayed at the same view
• Time stamp is unique in all displays
• Time cursor can be assigned at essential moment (relay trip, fault clearance or any user-selected one)
The program organizes data in tree structure. In which, the root node is stations, inside the station node is children nodes as shown in Figure 45.

41 5. Applications
Figure 45. Data structure
1) Configurator tool
Figure 46. Configuration tool
Configurator tool have following components:
• Program main menu
• SOEs data grids
• Event data grids
• Data Editor tool
The configuration tool helps user to create/modify/delete Station, Yard, Bay and Relay easily.

42 5. Applications
Figure 47. Editor to create, edit and delete Station
Figure 48. Editor to config relay

43 5. Applications
2) Data viewer tools
The program provides:
• Navigation functions
• Data Filtering
• Search/Find function
• Data display tool
Figure 49. Fault Analysis
3) Summary report
The program provides:
• Provide relay setting operation times for each phase
• Provide calculated operation times for each phase
• Provide last calculated operation times for each phase

44 5. Applications
5.6 Web-based Presentation and e-Notification
5.6.1 Web-based Presentation Displays
The fault location software will also provide web-based presentation function of the location on map. It will allow user to view the geographical coordinates of fault location and other essentials information visually from web browser.
Figure 50. GIS visualization of fault location on web
The fault event can be viewed in the detail panel by selecting a corresponding record

45 5. Applications
Figure 51. Detail of specified event
Users can view the waveform of the record by clicking on the record in the detail panel. The waveform viewer provides tools to allow the operator to analyze travelling wave time tags and waveforms, fault impedance, and determine the distance to fault.
Figure 52. Display of waveform viewer
5.6.2 e-Notification
AFL automatically performs fault reports and sends them to registered emails for notification.
Figure 53. E-mail notification
46 6. Jobs-done
6. Jobs-done
6.1 Centralized Fault Locating Systems for Central and Southern of Vietnam
ATS has won the bidding package to provide 2 Centralized Fault Locating Systems to calculate fault location on the 500kV and 220kV transmission lines for the fastest recovery of power supply. The accuracy of identifying fault location will also help to save costs and personnel in line patrol when the fault occurs.
The project includes the design, provision, installation and commission of 104 fault locators and 2 centers for collection, storage and calculation of fault locations for Central and Southern power system of Vietnam.
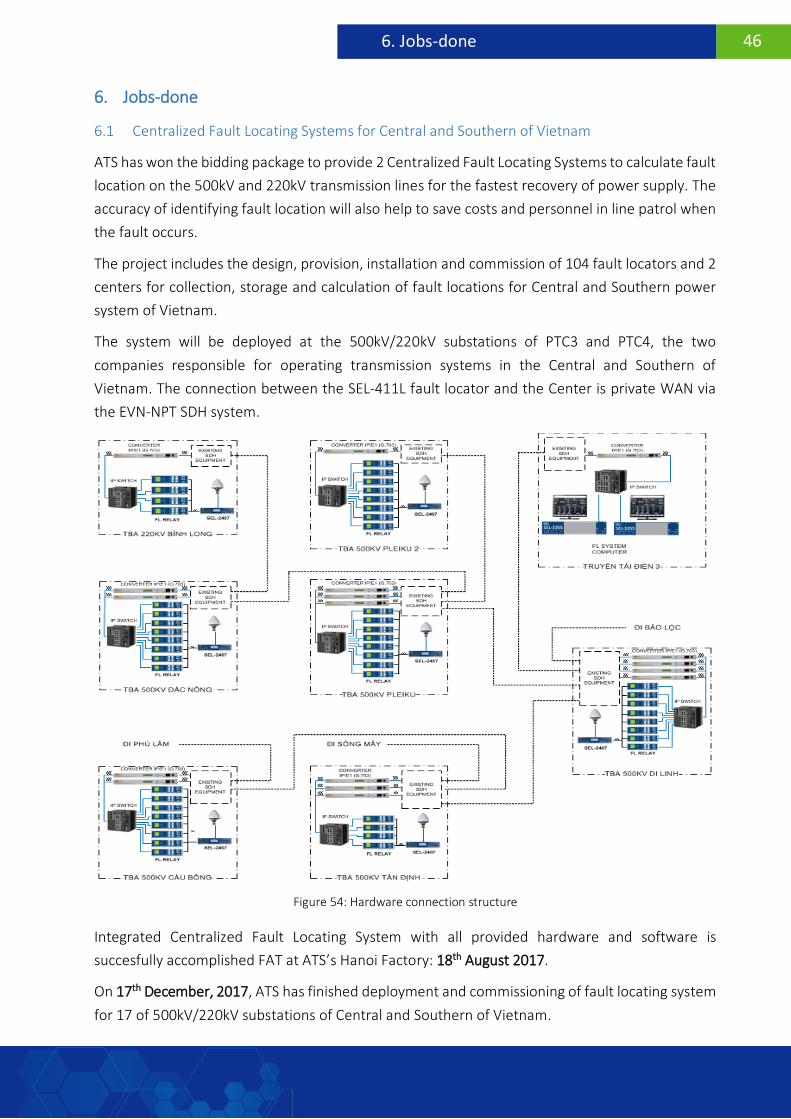
The system will be deployed at the 500kV/220kV substations of PTC3 and PTC4, the two companies responsible for operating transmission systems in the Central and Southern of Vietnam. The connection between the SEL-411L fault locator and the Center is private WAN via the EVN-NPT SDH system.
Figure 54: Hardware connection structure
Integrated Centralized Fault Locating System with all provided hardware and software is succesfully accomplished FAT at ATS’s Hanoi Factory: 18th August 2017.
On 17th December, 2017, ATS has finished deployment and commissioning of fault locating system for 17 of 500kV/220kV substations of Central and Southern of Vietnam.

47 6. Jobs-done
Figure 55. Factory acceptance test at ATS’s Hanoi factory
Figure 56. Travelling wave testing system
48 6. Jobs-done
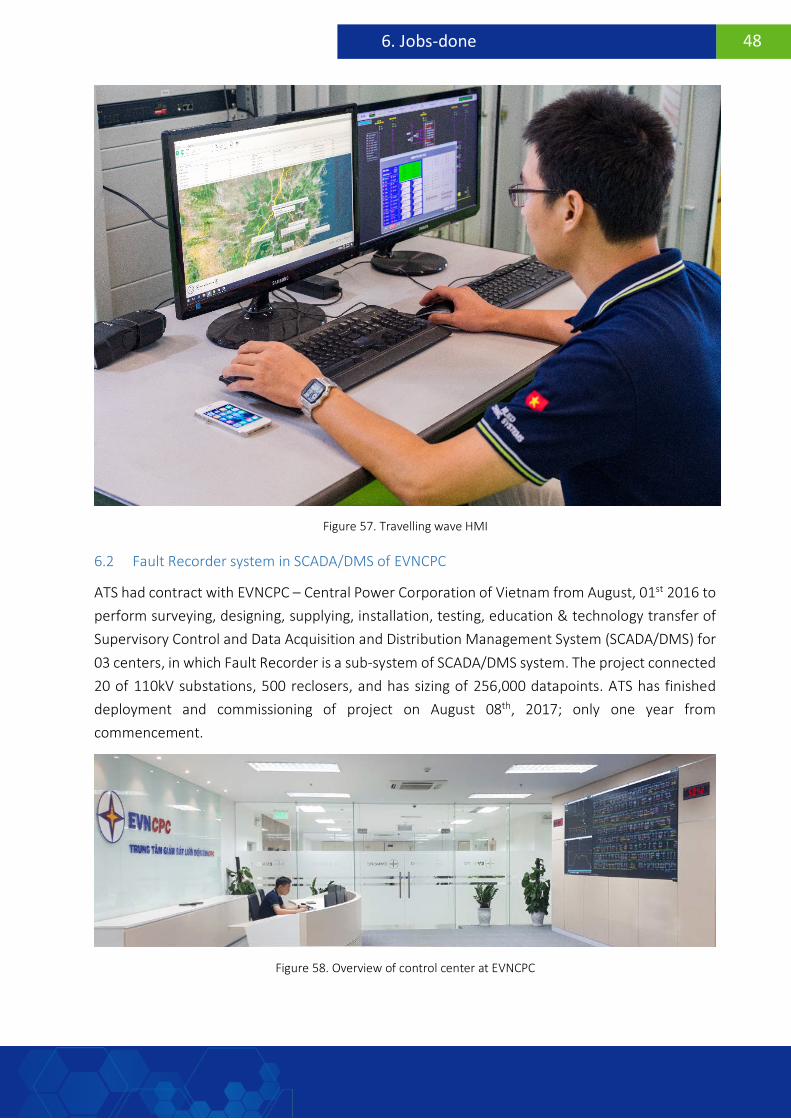
Figure 57. Travelling wave HMI
6.2 Fault Recorder system in SCADA/DMS of EVNCPC
ATS had contract with EVNCPC – Central Power Corporation of Vietnam from August, 01st 2016 to perform surveying, designing, supplying, installation, testing, education & technology transfer of Supervisory Control and Data Acquisition and Distribution Management System (SCADA/DMS) for 03 centers, in which Fault Recorder is a sub-system of SCADA/DMS system. The project connected 20 of 110kV substations, 500 reclosers, and has sizing of 256,000 datapoints. ATS has finished deployment and commissioning of project on August 08th, 2017; only one year from commencement.
Figure 58. Overview of control center at EVNCPC

49 6. Jobs-done
The figures below show the way of Fault Recorder system manages events occur on EVNCPC’s grid.
Figure 59. Manage all events by tree structure
Figure 60. Manage Sequence of Events

50 6. Jobs-done
Figure 61. Summary of fault events
Figure 62. Manage relay communication

51 6. Jobs-done
Figure 63. Analyze a specific fault event
6.3 Line parameters calculation
By using phasor data, we calculated the positive sequences of 500kV MTH-OMO (Southern of Vietnam) dated Jan 07th 2018:
R
X

52 6. Jobs-done
Figure 64. Online calculating of line parameters for 500kV MTH-OMO
The results are:
Table 1. Result of line parameter calculation
𝑹𝑹𝟏𝟏 (Ω) 𝑿𝑿𝟏𝟏 (Ω) 𝑩𝑩𝟏𝟏 (S)
Manufacturer Data 2.256 22.344 0.000318
PMU based results
Min
Max
Average
1.7237
2.0190
1.8973
21.8369
22.1845
21.9909
0.000356
0.000360
0.000358
6.4 Propagation velocity calculation Ttravel during line energization
The propagation velocity of a transmission line is determined by the line’s characteristic impedance, 1/√LC. The default value for LPVEL is a good starting point, but any error impacts fault location accuracy, especially on long transmission lines. If the length of the line is known, this value can be experimentally determined.
The best method for determining the propagation velocity of a line is closing a breaker onto the de-energized line and generating a TW report of the operation.
Using A-Type method
The line length of 500kV PLK – CBO (Central to Southern of Vietnam) is 437.5 km
Energized line can measure the time TTravel = t2-t1
B

53 6. Jobs-done
Figure 65. Type A time calculation
- Close CB from 500kV CBO
- Get Event files TW waveform to measure t1, t2
The setting for line propagation velocity can be simply determined by formula:
LPVEL= (2*LL/TTravel time)*1/c
Where:
Travel time (TTravel): T2 - T1
T1 = time of initial wavefront.
T2 = time of wave reflected from far terminal.
TWLL = line length 437.5 km
c = speed of light (299,792.458 kilometers per second based on setting LLUNIT).
If TW event reports are available from multiple line energizations, average the resultant values of line propagation velocity before entering them as a relay setting.
6.4.1 TWFL Settings for 500kV line CBO-PLK (Central to Southern of Vietnam)
6.4.1.1 Single Line Diagram 500kV CBO – PLK
SEL 411L SEL 411L
4xACSR330
CBO PLK
2x437.5 km
4xACSR330
Figure 66. Single line diagram of 500kV line CBO-PLK
500kV Cầu Bông 500kV Pleiku
t1 t2

54 6. Jobs-done
6.4.1.2 SEL 2401 Settings
IRIG B000
Time: Local
UTC: +7
6.4.1.3 SEL 411L Settings
To capture a TW event on breaker close, include the dropout of the open phase detector Relay Word bits in the ER event report logic equation in the relay settings at the terminal used to energize the line, as follows:
ER = ………….. OR F_TRIG LOPHA OR F_TRIG LOPHB OR F_TRIG LOPHC
Setting ETWFL
Setting Event Record
Check for:
Time source HiRIG
TSOK = 1
6.4.2 Energized Line 500kV CBO-PLK and Analyze TWs
Events record (TWs) is get from SEL 411L CBO station
Event #1: Trigger when closing CB 500kV CBO station date 22/07/2015 time 07:04

55 6. Jobs-done
Figure 67. Phase C initial wave peak during line energization
Figure 68. Traveling Waves During Line Energization
Phase C close is largest peak
Phase C Close
Phase B Close
Phase A Close
Reflection from phase C close

56 6. Jobs-done
Figure 69. Phase C initial wave peak and reflection from open breaker at remote terminal
Time of Traveling wave:
Ttravel = 0.002958699 s
Event #2: Trigger when closing CB 500kV CBO station date 24/07/2015 time 07:03
Figure 70. Phase B initial Wave Peak During Line Energization
0,002958699 s
Phase B close is largest peak

57 6. Jobs-done
Figure 71. Traveling Waves During Line Energinzation
Figure 72. Phase B initial Wave Peak and Reflection From Open Breaker at Remote Terminal
Time of Traveling wave:
Ttravel = 0.002954915 s
Event #3: Trigger when closing CB 500kV CBO station date 29/07/2015 time 07:04
Phase B Close
Phase A Close
Phase C Close
Reflection from phase B close
0.002954915 s

58 6. Jobs-done
Figure 73. Phase C initial Wave Peak During Line Energization
Figure 74. Traveling Waves During Line Energinzation
Phase C close is largest peak
Phase A Close
Phase B Close
Phase C Close

59 6. Jobs-done
Figure 75. Phase B initial Wave Peak and Reflection From Open Breaker at Remote Terminal
Time of Traveling wave:
Ttravel = 0.002958755 s
6.4.3 Conclusion
03 times of energized line make Equal time Ttravel = 0.0029574563 -> LPVEL=0.986890592
As result, we can set LPVEL into SEL-411L Setting at 02 end of the Line:
LPVEL= 0.9869
6.5 Fault locating on Centralized Fault Locating System, results and assessments
6.5.1 Fault locating on 500kV Line CBO-PLK2 (Central to Southern of Vietnam)
In 2016, EVN changed the line length of CBO-PLK2 from 437.5 km to 415.35 km
Setting in SEL 411L:
LPVEL = 0.98821
TWLL = 415.35 km
6.5.1.1 Event #1: B-Phase to Ground Fault, 2016
The fault occurred on 20 April, 2016. Figure 76 shows the TWs captured at the CBO Terminal for the B phase to ground fault. The TW cannot capture at PLK 2 because of GPS unlock. Based on SynchroWave Event software, we estimated fault location was 215.451 km from CBO terminal.
0.002958755 s

60 6. Jobs-done
Figure 76.TWs capture at the CBO Terminal for the B phase to ground fault
The patrol team found the fault at Tower 470 (4504) with 215.28 km from CBO.
Figure 77. Damaged Corona at tower 4504, 215.28 km from CBO
6.5.1.2 Event #2: B-Phase to Ground Fault, 2017
The fault occurred on 12th September, 2017. Figure 78 shows the TWs captured at the CBO and PLK 2 Terminals for the B phase to ground fault. SEL-411L automatically found fault location at 406.05 km from CBO and 9.3 km from PLK 2.
Lightning Strike found on the Corona ring

61 6. Jobs-done
Figure 78. TWs capture at the CBO and PLK2 terminals for the B phase to ground fault
The patrol team found the fault at tower 608, 9.45 km from PLK 2.
Figure 79. Damaged Corona at tower 608, 9.45 km from PLK 2
6.5.1.3 Event #3: B-Phase to Ground Fault
On 17th December, 2017, ATS has been deployed fault locating system for 17 of 500kV/220kV substations of Central and Southern of Vietnam, two companies are responsible for operating
Lightning Strike found on the Corona ring

62 6. Jobs-done
transmission systems in the Central and Southern of Vietnam including the 500kV line CBO – PLK 2. Integrated Centralized Fault Locating System with all provided hardware and software is succesfully accomplished.
The fault occurred on 03th March, 2018. Figure 80 shows the TWs captured at the CBO and PLK 2 terminals for the B phase to ground fault. SEL-411L automatically found fault location at 165.74 km from CBO and 249.61 km from PLK 2.
Figure 80. TWs captured at CBO and PLK2 terminals for the B phase to ground fault
At the same time, the Centralized System shown the fault location at tower 5012-5011 on GIS, as Figure 81.
Figure 81. Centralized System shown the fault location at tower 5012-5011 on GIS

63 6. Jobs-done
The patrol team found the fault at tower 5012, 165.58 km from CBO.
Figure 82. Damaged Corona at tower 5012, 165.58 km from CBO
6.5.1.4 Event #4: A-Phase to Ground Fault
The fault occurred on 08th May, 2018. Figure 83 shows the TWs captured at the CBO and PLK 2 terminals for the B phase to ground fault. SEL-411L automatically found fault location at 167.28 km from CBO and 248.07 km from PLK 2.
Figure 83. TWs captured at CBO and PLK 2 terminals for the A phase to ground fault
At the same time, the Centralized System shown the fault location at tower 5007-5008 on GIS, as Figure 84.
Lightning Strike found on the Corona ring

64 6. Jobs-done
Figure 84. Centralized System shown the fault location at tower 5007-5008 on GIS
The patrol team found the fault at tower 5008, 167.3 km from CBO.
Figure 85. Damaged Corona at tower 5008, 1673 km from CBO
Lightning Strike found on the Corona ring
65 6. Jobs-done
6.5.1.5 Event #5: A-Phase to Ground Fault
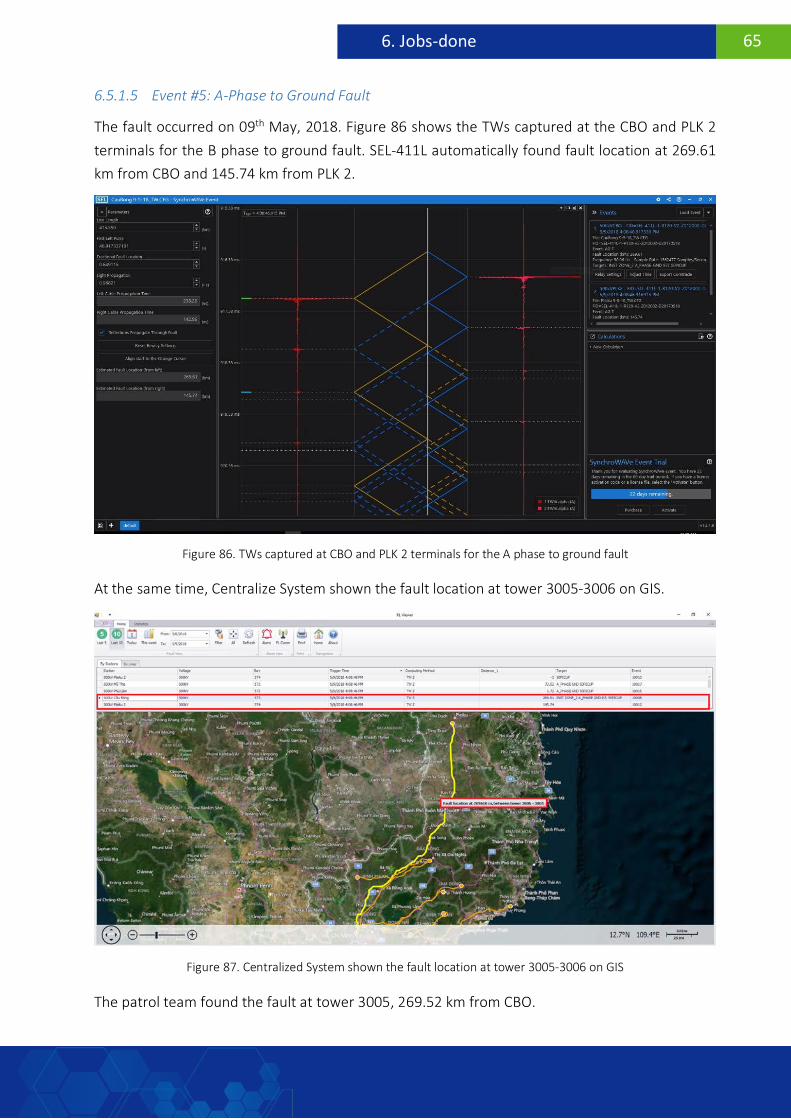
The fault occurred on 09th May, 2018. Figure 86 shows the TWs captured at the CBO and PLK 2 terminals for the B phase to ground fault. SEL-411L automatically found fault location at 269.61 km from CBO and 145.74 km from PLK 2.
Figure 86. TWs captured at CBO and PLK 2 terminals for the A phase to ground fault
At the same time, Centralize System shown the fault location at tower 3005-3006 on GIS.
Figure 87. Centralized System shown the fault location at tower 3005-3006 on GIS
The patrol team found the fault at tower 3005, 269.52 km from CBO.

66 6. Jobs-done
Figure 88. Damaged Corona at tower 3005, 269.52 km from CBO
6.5.1.6 Summary of Results
Table 2 provides the fault location reported by the SEL-411L based on TW measurements and the actual fault location reported by Line patrol team (Central and Southern of Vietnam). The deviation between TW-based estimated distance and line patrol team reported distance depend on the non-uniformity of the line sag due to changing of terrain elevation and difference in tower structures. The line patrol team is working on estimating of the accurate line length including line sag.
Table 2. Summary of fault locations and deviation
Event Fault Phase
TW location System center and Towers Reported
Line patrol teams reported location and Tower
Deviation Note
1 B 215.45 km 215.28 km (4504) 0.17 km Manual
2 B 9.30 km 9.45 km (608) -0.15 km Auto
3 B 165.74 km (5011-5012) 165.58 km (5012) 0.16 km Auto
4 A 167.28 km (5007-5008) 167.3 km (5008) -0.02 km Auto
5 A 269.61 km (3005-3006) 269.52 km (3005) 0.09 km Auto
6.5.2 Fault locating on Other lines
6.5.2.1 Fault locating on 220kV Line SMA – BLC (Southern of Vietnam)
Setting in SEL-411L:
Lightning Strike found on the Corona ring
67 6. Jobs-done
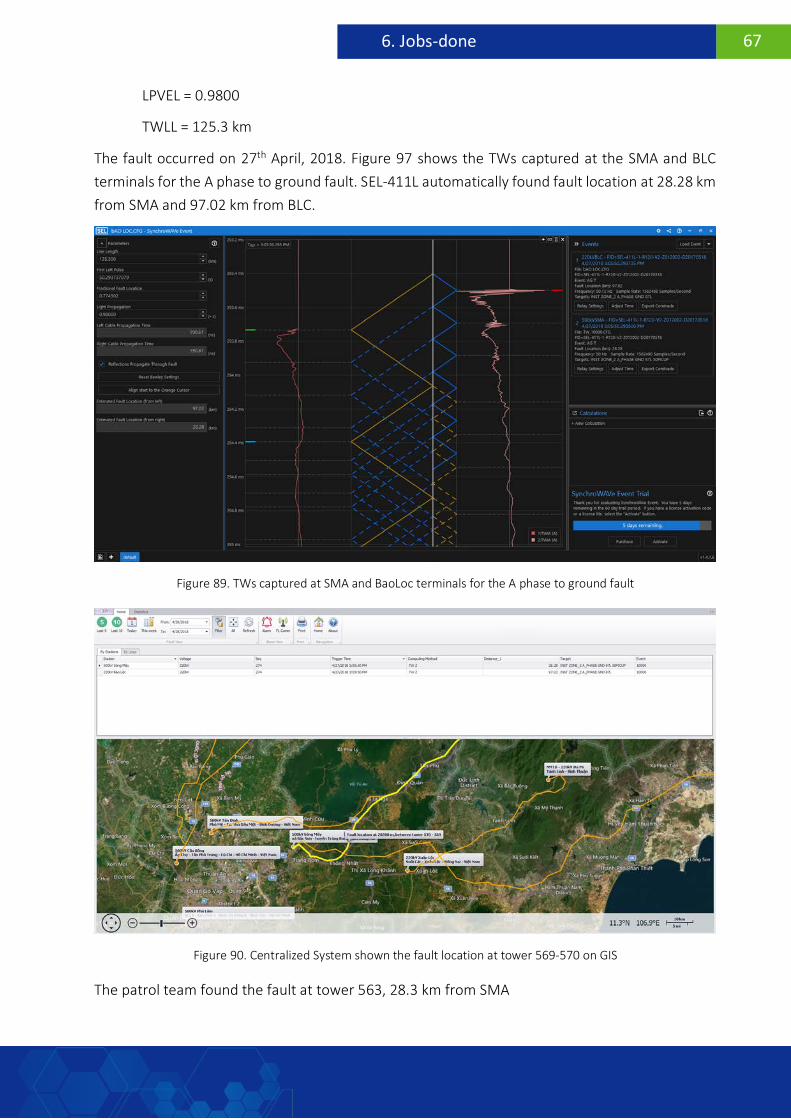
LPVEL = 0.9800
TWLL = 125.3 km
The fault occurred on 27th April, 2018. Figure 97 shows the TWs captured at the SMA and BLC terminals for the A phase to ground fault. SEL-411L automatically found fault location at 28.28 km from SMA and 97.02 km from BLC.
Figure 89. TWs captured at SMA and BaoLoc terminals for the A phase to ground fault
Figure 90. Centralized System shown the fault location at tower 569-570 on GIS
The patrol team found the fault at tower 563, 28.3 km from SMA

68 6. Jobs-done
Figure 91. Foam flies up the tower 563, 28.28 km from SMA
6.5.2.2 Fault locating on 220kV Line BLO – DNO (Southern of Vietnam)
Setting in SEL 411L:
LPVEL = 0.98000
TWLL = 133.00 km
The fault occurred on 22th May, 2018. Figure 86 shows the TWs captured at the BLO terminals for the B phase to ground fault.
In April, 2018 EVN had split the line into two segments, so the line has only one SEL-411L for Fault locator from BLO. We had to using SynchroWave Event software, manual Type A method to estimate fault location. The result was 4.835 km from BLO terminal as Figure 100.
Foam flies up the tower

69 6. Jobs-done
Figure 92. Manual estimated fault location from BLO terminal
Figure 93. Centralized System shown the Z-based fault location at tower 324-325 on GIS
The patrol team found the fault at tower 324, 4.90 km from BLO
Figure 94. Damaged composite insulator at tower 324, 4.9 km from BLO
6.5.2.3 Summary of Results
Table 3 provides the fault location reported by the SEL-411L based on TW measurements and the actual fault location reported by Line patrol team (Central and Southern of Vietnam). The
Lightning Strike found

70 6. Jobs-done
management of line parameters have many difference from real distance to tower makes inaccurate reported tower. The deviation between TW-based estimated distance and line patrol team reported distance depend on the non-uniformity of the line sag due to changing of terrain elevation and difference in tower structures. The line patrol team is working on estimating of the accurate line length including line sag.
Table 3. Summary of fault locations and deviation
Event Fault Phase
TW location System center and Towers Reported
Line patrol teams reported location and Tower
Deviation Note
1 A 28.28 km (569-570) 28.3 km (563) -0.02 km Auto
2 B 4.835 km TW (manual)
4.21 km (324-325) Z-based ME
4.9 km (324) -0.065 km Manual

71 6. Jobs-done
6.6 Lessons learned
- The deviation between TW-based estimated distance and line patrol team reported distance depend on the non-uniformity of the line sag due to changing of terrain elevation and difference in tower structures, thermal expansion, LPVEL factor. Solution: Calibrate the line length, LPVEL when energize the no-load line or fault events occur to reduce deviation.
- The management data of line parameters may have difference from actual distance to tower make the Centralize System located accurate distance but inaccurate tower. Solution: The operation management team needs to adjust the line length parameters, distance between towers, including line sag.
- Fault event at voltage zero-crossing or with higher fault resistance make SEL-411L cannot have time stamp to locate. Solution: Manual analysis TW fault event, Z-based multi end location