
Central Minnesota Regional Freight Profile
27
Central Minnesota Regional Freight Profile Working DRAFT May 2010 Minnesota Department of Transportation
Transcript of Central Minnesota Regional Freight Profile

Central Minnesota
Regional Freight Profile Working DRAFT
May 2010
Minnesota Department of Transportation

The purpose of the Central Regional Freight Profile is to document freight movement trends in the area.
This report will analyze the major freight‐dependent business sectors and examine the impact that they
have on the regional freight transportation system. This analysis will examine the demands placed on
the freight transportation modes of truck, rail, air, water, and pipelines. The profile will also identify the
key import and export markets in Central Minnesota generating significant freight traffic, and take into
account traffic projections into year 2030 to anticipate future demands.
This analysis primarily uses IHS‐Global Insight’s 2007 TRANSEARCH Insight database and the Surface
Transportation Board’s 2007 Rail Waybill Sample. These datasets provide county‐level data for freight
moves originating and terminating within Minnesota, and BEA‐level information for those moves
originating or terminating beyond state borders. This information provides a quantitative description of
the movement of goods between regional origins and destinations by mode. The TRANSEARCH Insight
database also provides database traffic projections for years 2020 and 2030. These forecasts predict
goods movements between regions, and are not general economic projections. They take into account
industry, regional and national economic trends to estimate commodity‐level trade flows. This
information can help identify transportation improvements, freight planning objectives and other
strategies that will benefit the economic competitiveness of the region.
Directional Flows According to data analysis, Central Minnesota moved 31 million tons of freight valued at $16 billion in
2007. Figures 1 and 2 indicate that 60 percent of the freight tonnage and 28 percent of freight value
resulted from freight terminating in the region from origins outside the region. 21 percent of the
tonnage and 71 percent of the value originated in the region with destinations outside of the region. 20
percent of the tonnage and 1 percent of the value were local freight movements that both originated
and terminated in the region.
By 2030, the weight of freight moving into, out of and within Central Minnesota is projected to grow by
41 percent to over 43 million tons. A significant portion of this increase is expected to come from
originating freight shipments, although terminating and local freight shipments are also expected to
experience increased weights. The value of freight moving into, out of and within the region is projected
to grow by 92 percent to approximately $31 billion by 2030, resulting mainly from originating shipments.
Freight shipments moving to Central Minnesota have many different origins. Figure 3 lists the top 10
origins of freight moving to the region by tonnage. Most freight tonnage terminating in Central
Minnesota originates in the Powder River Basin regions of Casper, Wyoming and Billings, Montana.
These are primarily rail coal shipments destined for the power plant in Becker, Minnesota. Additional
origins of freight moving to the district include the Twin Cities Metro Area, other Minnesota locations,
and other locations in the Upper Midwest such as Wausau, Wisconsin, Des Moines, Iowa and Bismarck,
North Dakota. Figure 4 lists the top 10 origins of freight moving to the region by value. Again, the Twin

Cities is the largest origin, with the Los Angeles, New York, and Seattle areas and the Upper Midwest
also representing significant import value.
Figure 5 lists the top 10 destinations of freight tonnage originating in Central Minnesota. The Twin Cities
Metro Area receives the most amount of freight tonnage from Central Minnesota, with other areas in
Minnesota and the Midwest also receiving notable tonnage. Figure 6 lists the to 10 freight destinations
by value. The Twin Cities Metro Area is the largest destination by value, with Los Angeles, New York,
Washington, DC and Philadelphia also receiving notable freight value from Central Minnesota.
Figure 1: Central Minnesota Directional Flows by Tonnage
Source: TRANSEARCH
Inbound59.8%
Outbound20.5%
Local19.7%
Inbound
Outbound
Local

Figure 2: Central Minnesota Directional Freight Flows by Value
Source: TRANSEARCH
Figure 3: Regional Import Markets by Tonnage
Source: TRANSEARCH
Inbound28.2%
Outbound70.6%
Local1.1%
Inbound
Outbound
Local
0
2
4
6
8
10
12
Millions
2007
2020
2030

Figure 4: Regional Import Markets by Value
Source: TRANSEARCH
Figure 5: Regional Export Markets by Tonnage
Source: TRANSEARCH
$0
$200
$400
$600
$800
$1,000
$1,200
$1,400
$1,600Millions
2007
2020
2030
0
500
1,000
1,500
2,000
2,500
3,000
3,500
Thou
sand
s
2007
2020
2030
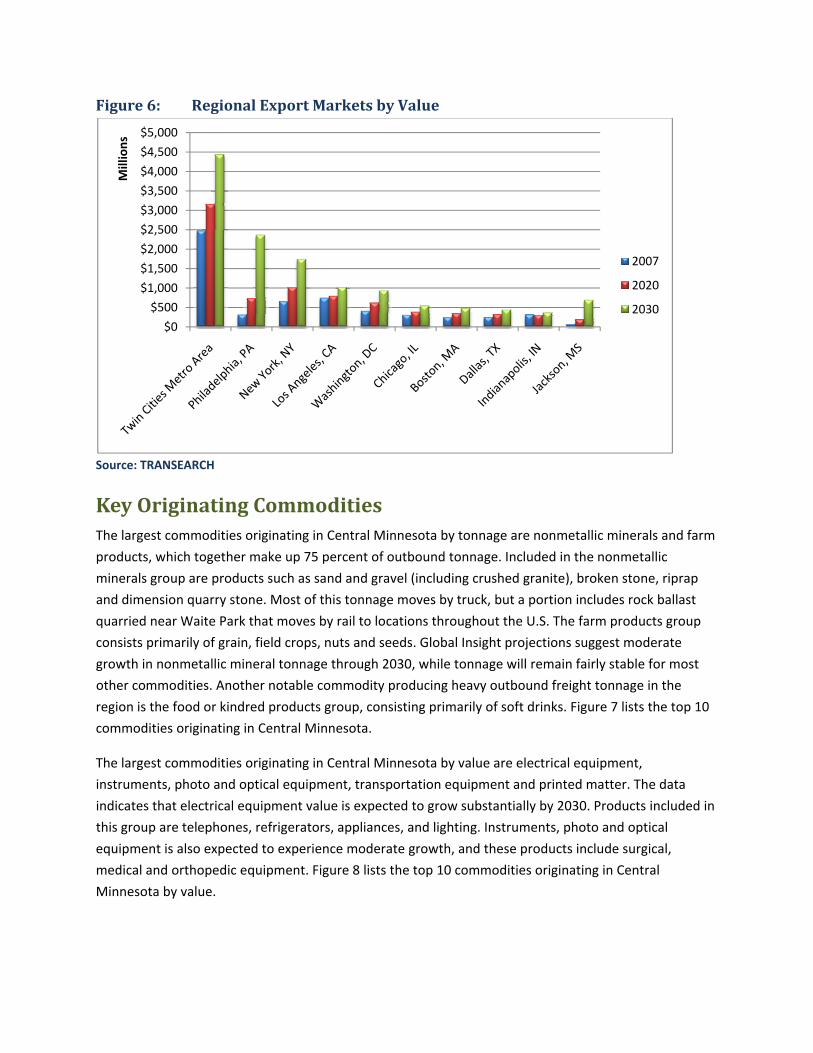
Figure 6: Regional Export Markets by Value
Source: TRANSEARCH
Key Originating Commodities The largest commodities originating in Central Minnesota by tonnage are nonmetallic minerals and farm
products, which together make up 75 percent of outbound tonnage. Included in the nonmetallic
minerals group are products such as sand and gravel (including crushed granite), broken stone, riprap
and dimension quarry stone. Most of this tonnage moves by truck, but a portion includes rock ballast
quarried near Waite Park that moves by rail to locations throughout the U.S. The farm products group
consists primarily of grain, field crops, nuts and seeds. Global Insight projections suggest moderate
growth in nonmetallic mineral tonnage through 2030, while tonnage will remain fairly stable for most
other commodities. Another notable commodity producing heavy outbound freight tonnage in the
region is the food or kindred products group, consisting primarily of soft drinks. Figure 7 lists the top 10
commodities originating in Central Minnesota.
The largest commodities originating in Central Minnesota by value are electrical equipment,
instruments, photo and optical equipment, transportation equipment and printed matter. The data
indicates that electrical equipment value is expected to grow substantially by 2030. Products included in
this group are telephones, refrigerators, appliances, and lighting. Instruments, photo and optical
equipment is also expected to experience moderate growth, and these products include surgical,
medical and orthopedic equipment. Figure 8 lists the top 10 commodities originating in Central
Minnesota by value.
$0
$500
$1,000
$1,500
$2,000
$2,500
$3,000
$3,500
$4,000
$4,500
$5,000Millions
2007
2020
2030
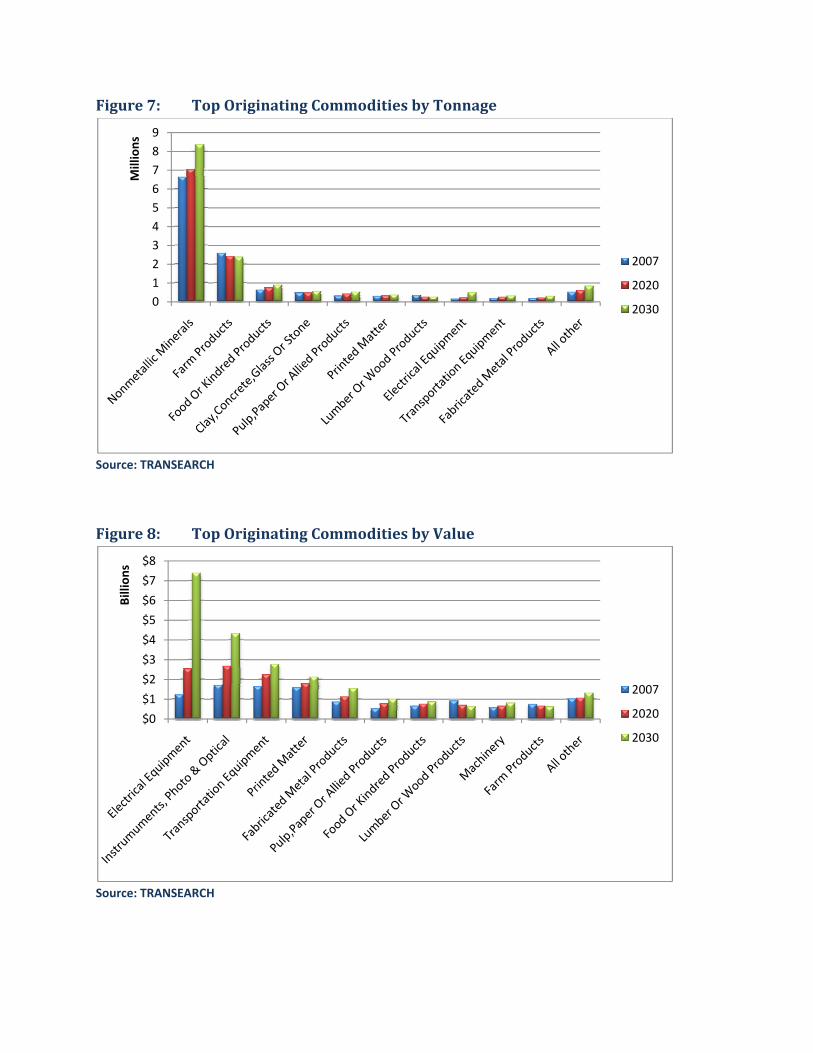
Figure 7: Top Originating Commodities by Tonnage
Source: TRANSEARCH
Figure 8: Top Originating Commodities by Value
Source: TRANSEARCH
0123456789
Millions
2007
2020
2030
$0
$1
$2
$3
$4
$5
$6
$7
$8
Billion
s
2007
2020
2030

Key Terminating Commodities The largest commodity terminating in Central Minnesota by tonnage is coal. These are mostly rail
movements from the Power River Basin in Wyoming and Montana destined for the coal‐fired power
plant in Becker, MN. The nonmetallic minerals commodity group also generates significant tonnage.
Products included in this commodity group included rip rap, sand and gravel. Much of this nonmetallic
mineral terminating tonnage results from local truck movements that both originates and terminates
within Central Minnesota. Figure 9 lists the top 10 terminating commodities by tonnage.
The largest commodities terminating in Central Minnesota by value are petroleum or coal products,
transportation equipment, and food or kindred products. The petroleum or coal products commodity
group consists primarily of petroleum refining products. The transportation equipment group consists of
parts for buses, boats and trailers. The food or kindred products group consists mainly of soybean oil
and cheese. Figure 10 lists the top 10 commodities terminating in Central Minnesota by value.
Figure 9: Top Terminating Commodities by Tonnage
Source: TRANSEARCH
02468
101214161820
Millions
2007
2020
2030

Figure 10: Top Terminating Commodities by Value
Source: TRANSEARCH
Modal Split Trucking has the largest share of total originating and terminating tonnage in Central Minnesota. Trucks
handled 60 percent of freight tonnage and 90 percent of freight value in the region in 2007. Rail also
handled a significant amount of freight, with air and other modes handling much smaller tonnage and
value. Waterways carried no freight in Central Minnesota because there are no waterway terminals in
the region. Figure 11 shows the 2007 modal split of inbound, outbound and local freight tonnage in
Central Minnesota, and Figure 12 shows this modal split by value.
Trucking has a larger share of total freight tonnage in Central Minnesota than it does statewide. Rail’s
tonnage share in the region is comparable to that of Minnesota as a whole. Table 1 compares the 2007
modal split of freight tonnage and value in the region to that of the Minnesota. There are several freight
rail lines and highways in Central Minnesota that have significant volumes of though freight which this
analysis does not capture. Data limitations prevent this analysis from including through freight
movements at the regional level. This limitation results in underreporting of modal freight tonnage and
value.
$0
$200
$400
$600
$800
$1,000
$1,200Millions
2007
2020
2030

Table 1: Regional Mode Comparison (2007)
Tonnage Value
Central MN Minnesota Central MN Minnesota
Truck 60.3% 49.3% 89.6% 79.6%
Rail 39.6% 38.2% 10.4% 19.3%
Water 0.0% 5.9% 0.0% 0.5%
Air <0.1% <0.1% <0.1% 0.5%
Other 0.1% 6.6% 0.1% <0.1%
Source: TRANSEARCH
Figure 11: Central Minnesota Freight Modes by Tonnage
Source: TRANSEARCH
Air<0.1%
Other0.1%
Rail39.6%
Truck60.3%
Air
Other
Rail
Truck

Figure 12: Central Minnesota Freight Modes by Value
Source: TRANSEARCH
Air<0.1%
Other0.1%
Rail10.4%
Truck89.6%
Air
Other
Rail
Truck
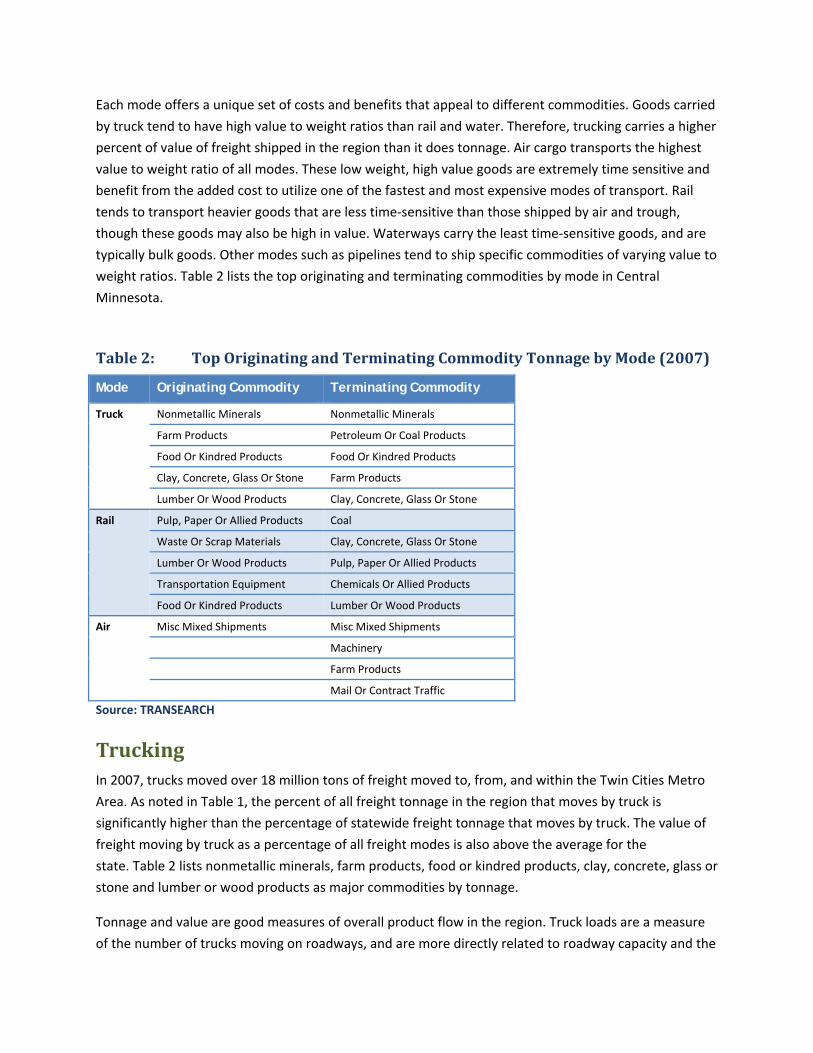
Each mode offers a unique set of costs and benefits that appeal to different commodities. Goods carried
by truck tend to have high value to weight ratios than rail and water. Therefore, trucking carries a higher
percent of value of freight shipped in the region than it does tonnage. Air cargo transports the highest
value to weight ratio of all modes. These low weight, high value goods are extremely time sensitive and
benefit from the added cost to utilize one of the fastest and most expensive modes of transport. Rail
tends to transport heavier goods that are less time‐sensitive than those shipped by air and trough,
though these goods may also be high in value. Waterways carry the least time‐sensitive goods, and are
typically bulk goods. Other modes such as pipelines tend to ship specific commodities of varying value to
weight ratios. Table 2 lists the top originating and terminating commodities by mode in Central
Minnesota.
Table 2: Top Originating and Terminating Commodity Tonnage by Mode (2007)
Mode Originating Commodity Terminating Commodity
Truck
Nonmetallic Minerals Nonmetallic Minerals
Farm Products Petroleum Or Coal Products
Food Or Kindred Products Food Or Kindred Products
Clay, Concrete, Glass Or Stone Farm Products
Lumber Or Wood Products Clay, Concrete, Glass Or Stone
Rail
Pulp, Paper Or Allied Products Coal
Waste Or Scrap Materials Clay, Concrete, Glass Or Stone
Lumber Or Wood Products Pulp, Paper Or Allied Products
Transportation Equipment Chemicals Or Allied Products
Food Or Kindred Products Lumber Or Wood Products
Air Misc Mixed Shipments Misc Mixed Shipments
Machinery
Farm Products
Mail Or Contract Traffic
Source: TRANSEARCH
Trucking In 2007, trucks moved over 18 million tons of freight moved to, from, and within the Twin Cities Metro
Area. As noted in Table 1, the percent of all freight tonnage in the region that moves by truck is
significantly higher than the percentage of statewide freight tonnage that moves by truck. The value of
freight moving by truck as a percentage of all freight modes is also above the average for the
state. Table 2 lists nonmetallic minerals, farm products, food or kindred products, clay, concrete, glass or
stone and lumber or wood products as major commodities by tonnage.
Tonnage and value are good measures of overall product flow in the region. Truck loads are a measure
of the number of trucks moving on roadways, and are more directly related to roadway capacity and the
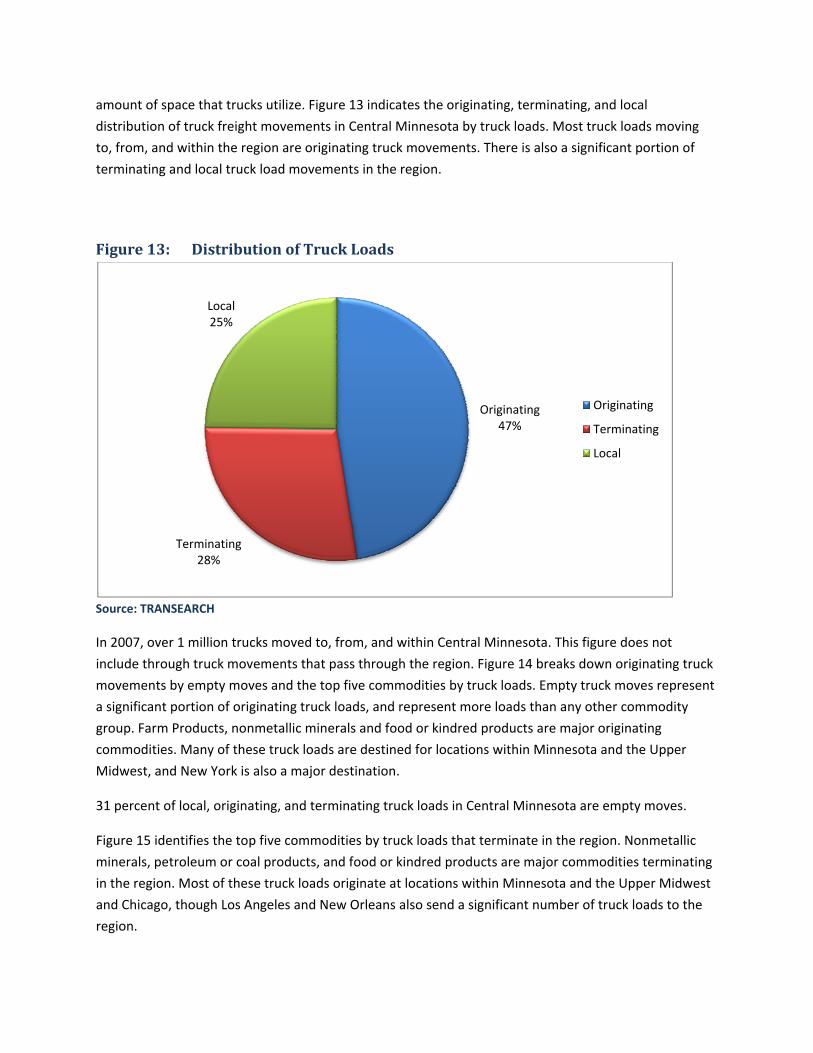
amount of space that trucks utilize. Figure 13 indicates the originating, terminating, and local
distribution of truck freight movements in Central Minnesota by truck loads. Most truck loads moving
to, from, and within the region are originating truck movements. There is also a significant portion of
terminating and local truck load movements in the region.
Figure 13: Distribution of Truck Loads
Source: TRANSEARCH
In 2007, over 1 million trucks moved to, from, and within Central Minnesota. This figure does not
include through truck movements that pass through the region. Figure 14 breaks down originating truck
movements by empty moves and the top five commodities by truck loads. Empty truck moves represent
a significant portion of originating truck loads, and represent more loads than any other commodity
group. Farm Products, nonmetallic minerals and food or kindred products are major originating
commodities. Many of these truck loads are destined for locations within Minnesota and the Upper
Midwest, and New York is also a major destination.
31 percent of local, originating, and terminating truck loads in Central Minnesota are empty moves.
Figure 15 identifies the top five commodities by truck loads that terminate in the region. Nonmetallic
minerals, petroleum or coal products, and food or kindred products are major commodities terminating
in the region. Most of these truck loads originate at locations within Minnesota and the Upper Midwest
and Chicago, though Los Angeles and New Orleans also send a significant number of truck loads to the
region.
Originating47%
Terminating28%
Local25%
Originating
Terminating
Local

Figure 16 identifies the top five local truck commodities by truck loads. Nonmetallic minerals, farm
products, clay, concrete, galss or stone, food or kindred products, printed matter and petroleum or coal
products are major commodities moving locally within the region.
Figure 14: Top Originating Truck Load Generating Commodities
Source: TRANSEARCH
0
50
100
150
200
250
Thou
sand
s of Truck Loa
ds
2007
2020
2030
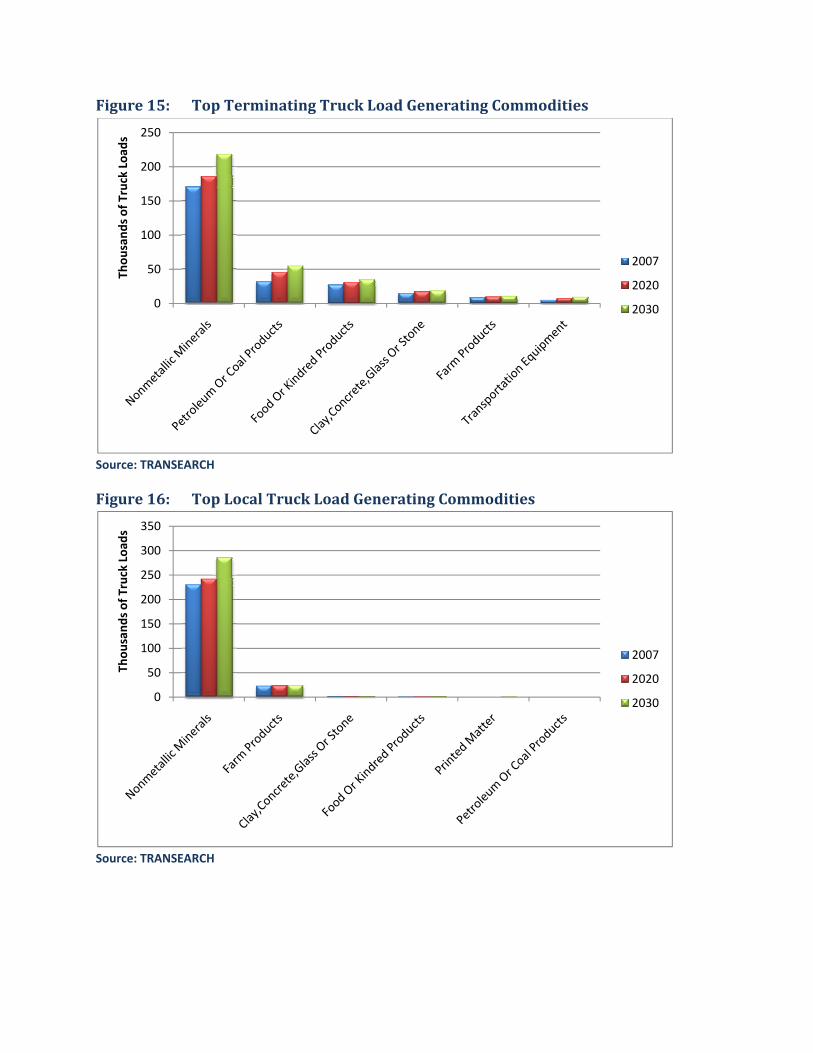
Figure 15: Top Terminating Truck Load Generating Commodities
Source: TRANSEARCH
Figure 16: Top Local Truck Load Generating Commodities
Source: TRANSEARCH
0
50
100
150
200
250Th
ousand
s of Truck Loa
ds
2007
2020
2030
0
50
100
150
200
250
300
350
Thou
sand
s of Truck Loa
ds
2007
2020
2030

Truck Traffic Trends Figure 17 displays the volume of truck traffic moving on Minnesota’s highways in 2008. This information
is collected by the Minnesota Department of Transportation and indicates the average number of heavy
commercial vehicles traveling on highway segments per day in the year 2008. The most significant
corridors in Central Minnesota are the Interstate 94 corridor, the US 10 Corridor, and the US 169
Corridor. Interstate 94 between Clearwater and the Twin Cities carries the most amount of truck traffic
in the region, and Interstate 94 from Clearwater to the west and US 10 between St. Cloud and Clear Lake
also receiving high truck volumes. The US 71, MN 371 and MN 23 corridors are additional routes with
significant amounts of truck traffic..

Figure 17: Truck Counts (2008 Annual Average Daily Trucks)

Figure 18: 2007 Annual Truck Tonnage

Figure 19: Projected Truck Freight Tonnage Growth, 2007 – 2030

Rail Freight Text
Figure 20: 2007 Rail Freight Distribution
Source: TRANSEARCH
Figure 21: Top Originating Rail Carload Commodities
Originating3%
Terminating97%
Local0%
Originating
Terminating
Local
050
100150200250300350400450
Thou
sand
s of Ton
s
2007
2020
2030

Figure 22: Top Terminating Rail Carload Commodities
Source: TRANSEARCH
0
50
100
150
200
250
300Th
ousand
s of Ton
s
2007
2020
2030
0
5
10
15
20
Coal
Millions of T
ons
2007
2020
2030

Figure 23: Rail Freight Tonnage, 2007

Figure 24: Projected Rail Tonnage Growth, 2007 – 2030
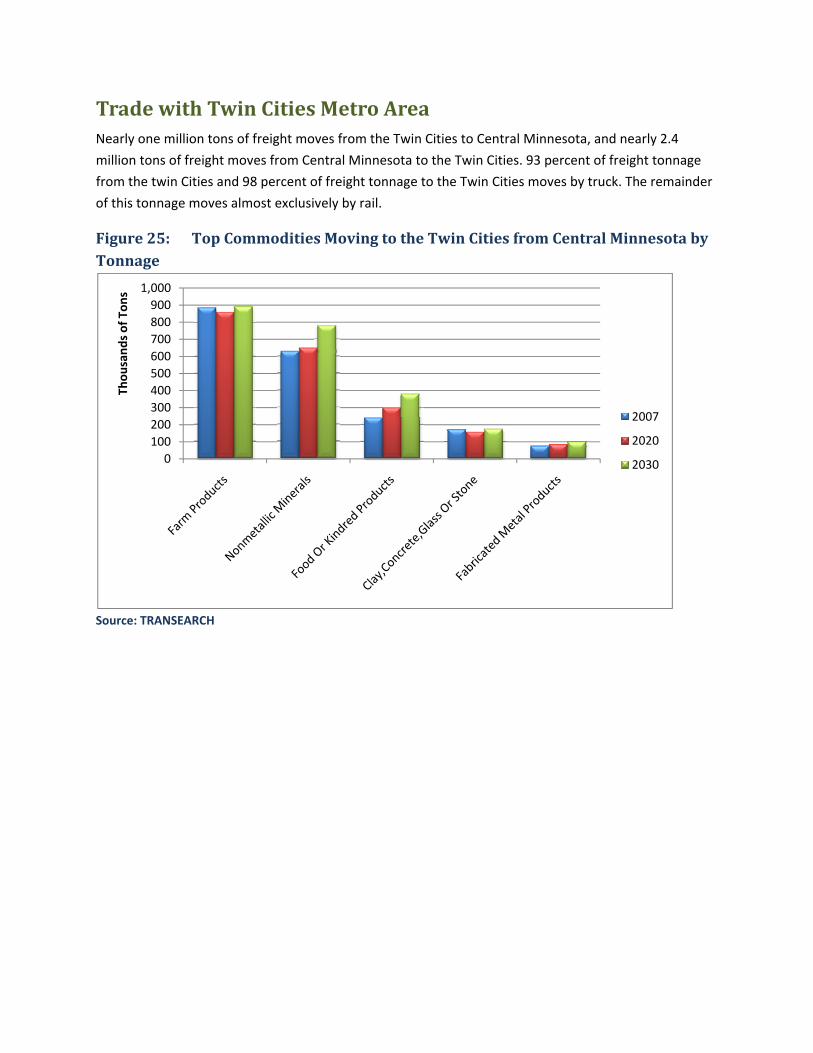
Trade with Twin Cities Metro Area Nearly one million tons of freight moves from the Twin Cities to Central Minnesota, and nearly 2.4
million tons of freight moves from Central Minnesota to the Twin Cities. 93 percent of freight tonnage
from the twin Cities and 98 percent of freight tonnage to the Twin Cities moves by truck. The remainder
of this tonnage moves almost exclusively by rail.
Figure 25: Top Commodities Moving to the Twin Cities from Central Minnesota by Tonnage
Source: TRANSEARCH
0100200300400500600700800900
1,000
Thou
sand
s of Ton
s
2007
2020
2030

Figure 26: Top Commodities Moving to the Twin Cities from Central Minnesota by Value
Source: TRANSEARCH
Figure 27: Top Commodities moving from the Twin Cities to Central Minnesota by Tonnage
Source: TRANSEARCH
$0
$200
$400
$600
$800
$1,000
$1,200
Electrical Equipment
Printed Matter Instrum, Photo Equipment, Optical Eq
Fabricated Metal
Products
Transportation Equipment
Millions
2007
2020
2030
0
200
400
600
800
1,000
1,200
Thou
sand
s of Ton
s
2007
2020
2030

Figure 28: Top Commodities Moving from the Twin Cities to Central Minnesota by Value
Source: TRANSEARCH
Figure 29: Truck Loads Moving to the Twin Cities from Central Minnesota
Source: TRANSEARCH
$0
$100
$200
$300
$400
$500
$600
$700
$800
Petroleum Or Coal Products
Printed Matter Fabricated Metal Products
Food Or Kindred Products
Chemicals Or Allied Products
Millions
2007
2020
2030
0
10,000
20,000
30,000
40,000
50,000
60,000
70,000
2007
2020
2030

Figure 30: Truck Loads Moving from the Twin Cities to Central Minnesota
Source: TRANSEARCH
05,000
10,00015,00020,00025,00030,00035,00040,00045,000
2007
2020
2030


![Company Profile TJE Freight Solutions (PTY) LTD[1]](https://static.fdocuments.in/doc/165x107/58f1846c1a28ab77108b4609/company-profile-tje-freight-solutions-pty-ltd1.jpg)


