CENTRAL EUROPEAN MEDIA ENTERPRISES...
51
Index UNITED STATES SECURITIES AND EXCHANGE COMMISSION Washington, D.C. 20549 FORM 10-Q x QUARTERLY REPORT PURSUANT TO SECTION 13 OR 15(d) OF THE SECURITIES EXCHANGE ACT OF 1934 For the quarterly period ended March 31, 2017 o TRANSITION REPORT PURSUANT TO SECTION 13 OR 15(d) OF THE SECURITIES EXCHANGE ACT OF 1934 For the transition period from __________ to __________ Commission File Number: 0-24796 CENTRAL EUROPEAN MEDIA ENTERPRISES LTD. (Exact name of registrant as specified in its charter) BERMUDA 98-0438382 (State or other jurisdiction of incorporation or organization) (IRS Employer Identification No.) O'Hara House, 3 Bermudiana Road, Hamilton, Bermuda HM 08 (Address of principal executive offices) (Zip Code) Registrant's telephone number, including area code: (441) 296-1431 Indicate by check mark whether registrant: (1) has filed all reports required to be filed by Section 13 or 15 (d) of the Securities Exchange Act of 1934 during the preceding 12 months (or for each shorter period that the registrant was required to file such reports), and (2) has been subject to such filing requirements for the past 90 days. Yes T No £ Indicate by check mark whether the registrant has submitted electronically and posted on its corporate Web site, if any, every Interactive Data File required to be submitted and posted pursuant to Rule 405 of Regulation S-T during the preceding 12 months (or for such shorter period that the registrant was required to submit and post such files). Yes T No £ Indicate by check mark whether the registrant is a large accelerated filer, an accelerated filer, a non-accelerated filer or a smaller reporting company. See definition of “accelerated filer”, “large accelerated filer” or “smaller reporting company” in Rule 12b-2 of the Exchange Act. Large accelerated filer £ Accelerated filer T Non-accelerated filer £ Smaller reporting company £ Emerging growth company £ If an emerging growth company, indicate by check mark if the registrant has elected not to use the extended transition period for complying with any new or revised financial accounting standards provided pursuant to Section 13(a) of the Exchange Act. £ Indicate by check mark whether the registrant is a shell company (as defined by Rule 12b-2 of the Exchange Act) Yes £ No T Indicate the number of shares outstanding of each of the issuer's classes of common stock, as of the latest practicable date. Class Outstanding as of April 21, 2017 Class A Common Stock, par value $0.08 144,421,232
Transcript of CENTRAL EUROPEAN MEDIA ENTERPRISES...

Index
UNITED STATESSECURITIES AND EXCHANGE COMMISSION
Washington, D.C. 20549
FORM 10-Qx QUARTERLY REPORT PURSUANT TO SECTION 13 OR 15(d) OF THE SECURITIES EXCHANGE ACT OF 1934
For the quarterly period ended March 31, 2017
o TRANSITION REPORT PURSUANT TO SECTION 13 OR 15(d) OF THE SECURITIES EXCHANGE ACT OF 1934
For the transition period from __________ to __________
Commission File Number: 0-24796
CENTRAL EUROPEAN MEDIA ENTERPRISES LTD.(Exact name of registrant as specified in its charter)
BERMUDA 98-0438382(State or other jurisdiction of incorporation or organization) (IRS Employer Identification No.)
O'Hara House, 3 Bermudiana Road, Hamilton, Bermuda HM 08
(Address of principal executive offices) (Zip Code)
Registrant's telephone number, including area code: (441) 296-1431
Indicate by check mark whether registrant: (1) has filed all reports required to be filed by Section 13 or 15 (d) of the Securities Exchange Act of 1934 during the preceding 12 months (or foreach shorter period that the registrant was required to file such reports), and (2) has been subject to such filing requirements for the past 90 days. Yes T No £
Indicate by check mark whether the registrant has submitted electronically and posted on its corporate Web site, if any, every Interactive Data File required to be submitted and posted pursuantto Rule 405 of Regulation S-T during the preceding 12 months (or for such shorter period that the registrant was required to submit and post such files). Yes T No £
Indicate by check mark whether the registrant is a large accelerated filer, an accelerated filer, a non-accelerated filer or a smaller reporting company. See definition of “accelerated filer”, “largeaccelerated filer” or “smaller reporting company” in Rule 12b-2 of the Exchange Act.
Large accelerated filer £ Accelerated filer T Non-accelerated filer £ Smaller reporting company £ Emerging growth company £
If an emerging growth company, indicate by check mark if the registrant has elected not to use the extended transition period for complying with any new or revised financial accountingstandards provided pursuant to Section 13(a) of the Exchange Act. £
Indicate by check mark whether the registrant is a shell company (as defined by Rule 12b-2 of the Exchange Act) Yes £ No T
Indicate the number of shares outstanding of each of the issuer's classes of common stock, as of the latest practicable date.
Class Outstanding as of April 21, 2017Class A Common Stock, par value $0.08 144,421,232

Index
CENTRAL EUROPEAN MEDIA ENTERPRISES LTD.
FORM 10-Q
For the quarterly period ended March 31, 2017
Page
Part I Financial Information Item 1. Financial Statements 1 Condensed Consolidated Balance Sheets as at March 31, 2017 and December 31, 2016 1 Condensed Consolidated Statements of Operations and Comprehensive Income / Loss for the Three Months Ended March 31, 2017 and 2016 2 Condensed Consolidated Statement of Equity for the Three Months Ended March 31, 2017 3 Condensed Consolidated Statements of Cash Flows for the Three Months Ended March 31, 2017 and 2016 4 Notes to the Condensed Consolidated Financial Statements 5 Item 2. Management's Discussion and Analysis of Financial Condition and Results of Operations 22 Item 3. Quantitative and Qualitative Disclosures About Market Risk 36 Item 4. Controls and Procedures 37
Part II Other Information Item 1. Legal Proceedings 37 Item 1A. Risk Factors 37 Item 6. Exhibits 43Signatures 44Exhibit Index 45

Index
PART I. FINANCIAL INFORMATION
Item 1. Financial Statements
CENTRAL EUROPEAN MEDIA ENTERPRISES LTD.CONDENSED CONSOLIDATED BALANCE SHEETS
(US$ 000’s, except share data)(Unaudited)
March 31, 2017 December 31, 2016
ASSETS
Current assets
Cash and cash equivalents $ 90,959 $ 43,459
Accounts receivable, net (Note 6) 149,145 178,339
Program rights, net (Note 5) 87,145 86,151
Other current assets (Note 7) 30,725 32,471
Total current assets 357,974 340,420
Non-current assets
Property, plant and equipment, net (Note 8) 108,977 109,089
Program rights, net (Note 5) 184,363 179,356
Goodwill (Note 3) 610,282 602,069
Other intangible assets, net (Note 3) 138,114 138,340
Other non-current assets (Note 7) 20,570 21,443
Total non-current assets 1,062,306 1,050,297
Total assets $ 1,420,280 $ 1,390,717
LIABILITIES AND EQUITY
Current liabilities
Accounts payable and accrued liabilities (Note 9) $ 163,699 $ 160,981
Current portion of long-term debt and other financing arrangements (Note 4) 1,576 1,494
Other current liabilities (Note 10) 29,145 9,089
Total current liabilities 194,420 171,564
Non-current liabilities
Long-term debt and other financing arrangements (Note 4) 1,016,728 1,002,028
Other non-current liabilities (Note 10) 67,612 68,758
Total non-current liabilities 1,084,340 1,070,786
Commitments and contingencies (Note 19)
TEMPORARY EQUITY
200,000 shares of Series B Convertible Redeemable Preferred Stock of $0.08 each (December 31, 2016 - 200,000) (Note 12) 257,256 254,899
EQUITY
CME Ltd. shareholders’ equity (Note 13):
One share of Series A Convertible Preferred Stock of $0.08 each (December 31, 2016 – one) — —
144,181,567 shares of Class A Common Stock of $0.08 each (December 31, 2016 – 143,449,913) 11,534 11,476
Nil shares of Class B Common Stock of $0.08 each (December 31, 2016 – nil) — —
Additional paid-in capital 1,908,926 1,910,244
Accumulated deficit (1,796,601) (1,785,536)
Accumulated other comprehensive loss (240,566) (243,988)
Total CME Ltd. shareholders’ deficit (116,707) (107,804)
Noncontrolling interests 971 1,272
Total deficit (115,736) (106,532)
Total liabilities and equity $ 1,420,280 $ 1,390,717
The accompanying notes are an integral part of these condensed consolidated financial statements.
1
Index
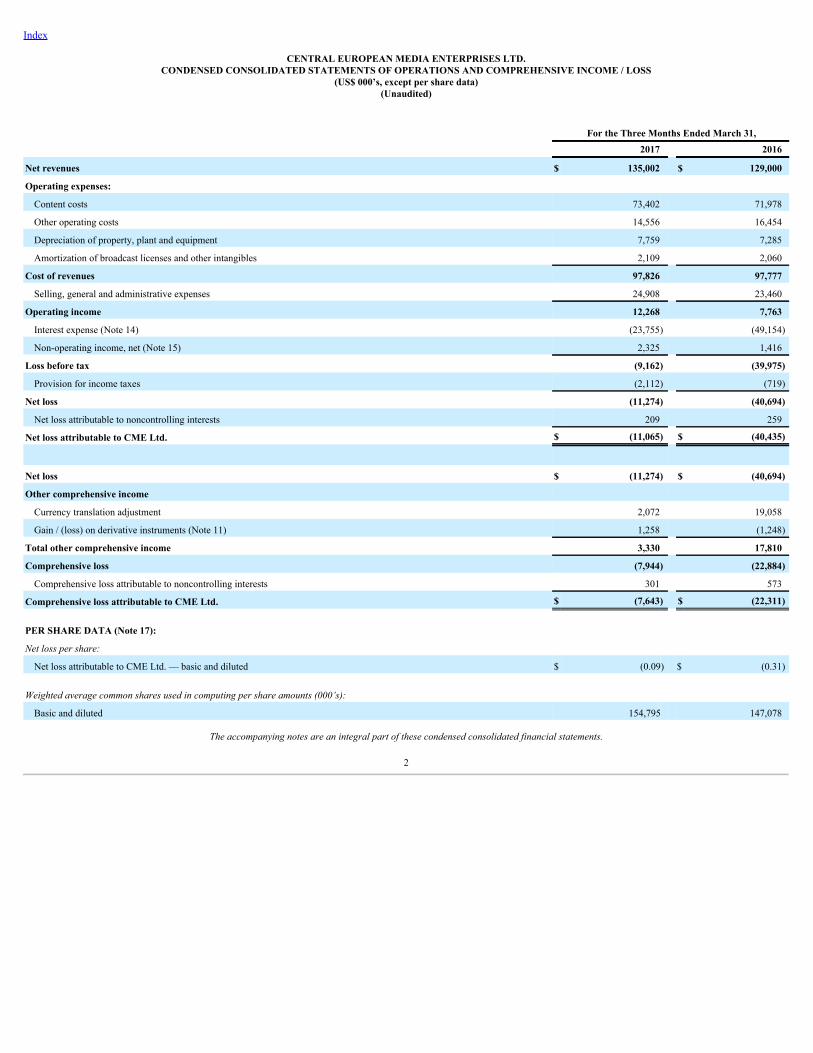
CENTRAL EUROPEAN MEDIA ENTERPRISES LTD.CONDENSED CONSOLIDATED STATEMENTS OF OPERATIONS AND COMPREHENSIVE INCOME / LOSS
(US$ 000’s, except per share data)(Unaudited)
For the Three Months Ended March 31,
2017 2016
Net revenues $ 135,002 $ 129,000
Operating expenses:
Content costs 73,402 71,978
Other operating costs 14,556 16,454
Depreciation of property, plant and equipment 7,759 7,285
Amortization of broadcast licenses and other intangibles 2,109 2,060
Cost of revenues 97,826 97,777
Selling, general and administrative expenses 24,908 23,460
Operating income 12,268 7,763
Interest expense (Note 14) (23,755) (49,154)
Non-operating income, net (Note 15) 2,325 1,416
Loss before tax (9,162) (39,975)
Provision for income taxes (2,112) (719)
Net loss (11,274) (40,694)
Net loss attributable to noncontrolling interests 209 259
Net loss attributable to CME Ltd. $ (11,065) $ (40,435)
Net loss $ (11,274) $ (40,694)
Other comprehensive income
Currency translation adjustment 2,072 19,058
Gain / (loss) on derivative instruments (Note 11) 1,258 (1,248)
Total other comprehensive income 3,330 17,810
Comprehensive loss (7,944) (22,884)
Comprehensive loss attributable to noncontrolling interests 301 573
Comprehensive loss attributable to CME Ltd. $ (7,643) $ (22,311)
PER SHARE DATA (Note 17):
Net loss per share:
Net loss attributable to CME Ltd. — basic and diluted $ (0.09) $ (0.31) Weighted average common shares used in computing per share amounts (000’s):
Basic and diluted 154,795 147,078
The accompanying notes are an integral part of these condensed consolidated financial statements.
2

Index
CENTRAL EUROPEAN MEDIA ENTERPRISES LTD.CONDENSED CONSOLIDATED STATEMENT OF EQUITY
(US$ 000’s, except share data)(Unaudited)
CME Ltd.
Series A Convertible
Preferred Stock Class A
Common Stock Class B
Common Stock
Number of
shares Par value Number of shares Par value
Number ofshares Par value
AdditionalPaid-InCapital
AccumulatedDeficit
AccumulatedOther
ComprehensiveLoss
NoncontrollingInterest Total Deficit
BALANCEDecember 31, 2016 1 $ — 143,449,913 $ 11,476 — $ — $ 1,910,244 $ (1,785,536) $ (243,988) $ 1,272 $ (106,532)
Stock-based compensation — — — — — — 796 — — — 796Exercise of warrants (Note13) — — 301,308 24 — — 277 — — — 301Share issuance, stock-basedcompensation — — 430,346 34 — — (34) — — — —Preferred dividend paid inkind — — — — — — (2,357) — — — (2,357)
Net loss — — — — — — — (11,065) — (209) (11,274)Gain on derivativeinstruments — — — — — — — — 1,258 — 1,258Currency translationadjustment — — — — — — — — 2,164 (92) 2,072BALANCEMarch 31, 2017 1 $ — 144,181,567 $ 11,534 — $ — $ 1,908,926 $ (1,796,601) $ (240,566) $ 971 $ (115,736)
The accompanying notes are an integral part of these condensed consolidated financial statements.
3
Index
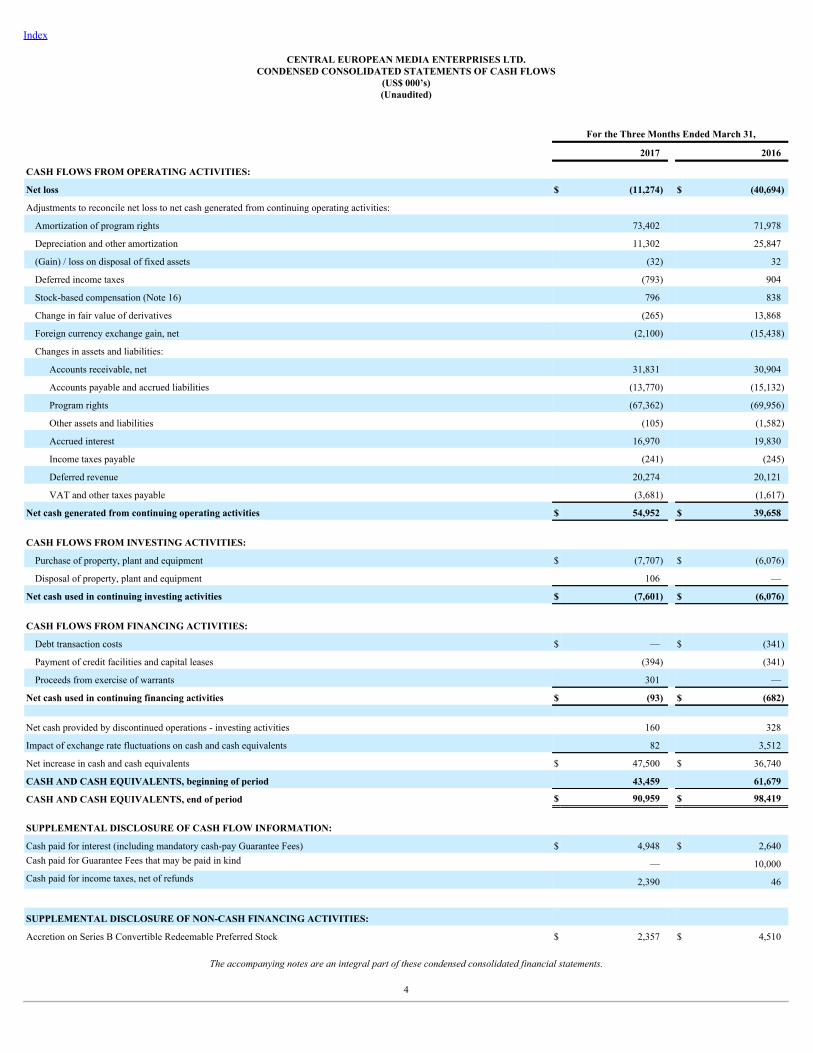
CENTRAL EUROPEAN MEDIA ENTERPRISES LTD.CONDENSED CONSOLIDATED STATEMENTS OF CASH FLOWS
(US$ 000’s)(Unaudited)
For the Three Months Ended March 31,
2017 2016
CASH FLOWS FROM OPERATING ACTIVITIES:
Net loss $ (11,274) $ (40,694)
Adjustments to reconcile net loss to net cash generated from continuing operating activities:
Amortization of program rights 73,402 71,978
Depreciation and other amortization 11,302 25,847
(Gain) / loss on disposal of fixed assets (32) 32
Deferred income taxes (793) 904
Stock-based compensation (Note 16) 796 838
Change in fair value of derivatives (265) 13,868
Foreign currency exchange gain, net (2,100) (15,438)
Changes in assets and liabilities:
Accounts receivable, net 31,831 30,904
Accounts payable and accrued liabilities (13,770) (15,132)
Program rights (67,362) (69,956)
Other assets and liabilities (105) (1,582)
Accrued interest 16,970 19,830
Income taxes payable (241) (245)
Deferred revenue 20,274 20,121
VAT and other taxes payable (3,681) (1,617)
Net cash generated from continuing operating activities $ 54,952 $ 39,658
CASH FLOWS FROM INVESTING ACTIVITIES:
Purchase of property, plant and equipment $ (7,707) $ (6,076)
Disposal of property, plant and equipment 106 —
Net cash used in continuing investing activities $ (7,601) $ (6,076)
CASH FLOWS FROM FINANCING ACTIVITIES:
Debt transaction costs $ — $ (341)
Payment of credit facilities and capital leases (394) (341)
Proceeds from exercise of warrants 301 —
Net cash used in continuing financing activities $ (93) $ (682)
Net cash provided by discontinued operations - investing activities 160 328
Impact of exchange rate fluctuations on cash and cash equivalents 82 3,512
Net increase in cash and cash equivalents $ 47,500 $ 36,740
CASH AND CASH EQUIVALENTS, beginning of period 43,459 61,679
CASH AND CASH EQUIVALENTS, end of period $ 90,959 $ 98,419
SUPPLEMENTAL DISCLOSURE OF CASH FLOW INFORMATION:
Cash paid for interest (including mandatory cash-pay Guarantee Fees) $ 4,948 $ 2,640Cash paid for Guarantee Fees that may be paid in kind — 10,000Cash paid for income taxes, net of refunds 2,390 46
SUPPLEMENTAL DISCLOSURE OF NON-CASH FINANCING ACTIVITIES:
Accretion on Series B Convertible Redeemable Preferred Stock $ 2,357 $ 4,510
The accompanying notes are an integral part of these condensed consolidated financial statements.
4

Index
CENTRAL EUROPEAN MEDIA ENTERPRISES LTD.NOTES TO CONDENSED CONSOLIDATED FINANCIAL STATEMENTS(Tabular amounts in US$ 000’s, except share and per share data)(Unaudited)
1. ORGANIZATION AND BUSINESS
Central European Media Enterprises Ltd., a Bermuda company limited by shares, is a media and entertainment company operating in Central and Eastern Europe. Our assets are held through aseries of Dutch and Curaçao holding companies. We manage our business on a geographical basis, with six operating segments; Bulgaria, Croatia, the Czech Republic, Romania, the SlovakRepublic and Slovenia, which are also our reportable segments and our main operating countries. See Note 18, "Segment Data" for financial information by segment.
We are the market-leading broadcasters in each of our operating counties with a combined portfolio of 36 television channels. Each of our broadcast operations develops and produces contentfor their television channels. We generate advertising revenues in our country operations primarily through entering into agreements with advertisers, advertising agencies and sponsors to placeadvertising on the television channels that we operate. We generate additional revenues by collecting fees from cable and direct-to-home (“DTH”) and IPTV operators for carriage of ourchannels. Unless otherwise indicated, we own 100% of our broadcast operating and license companies in each country.
Bulgaria
We operate one general entertainment channel, BTV, and five other channels, BTV CINEMA, BTV COMEDY, RING, BTV ACTION and BTV LADY. We own 94.0% of CME Bulgaria B.V.("CME Bulgaria"), the subsidiary that owns our Bulgaria operations.
Croatia
We operate one general entertainment channel, NOVA TV (Croatia), and three other channels, DOMA (Croatia), NOVA WORLD and MINI TV.
Czech Republic
We operate one general entertainment channel, TV NOVA (Czech Republic), and seven other channels, NOVA CINEMA, NOVA SPORT 1, NOVA SPORT 2, NOVA ACTION, NOVA 2 ,NOVA GOLD and NOVA INTERNATIONAL, a general entertainment channel broadcasting in the Slovak Republic.
Romania
We operate one general entertainment channel, PRO TV, and eight other channels, ACASA, ACASA GOLD, PRO CINEMA, SPORT.RO, MTV ROMANIA, PRO TV INTERNATIONAL,PRO TV CHISINAU, a general entertainment channel broadcasting in Moldova, and ACASA IN MOLDOVA.
Slovak Republic
We operate one general entertainment channel, TV MARKIZA, and three other channels, DOMA (Slovak Republic), DAJTO, and MARKIZA INTERNATIONAL, a general entertainmentchannel broadcasting in the Czech Republic.
Slovenia
We operate two general entertainment channels, POP TV and KANAL A, and three other channels, KINO, BRIO, and OTO.
2. BASIS OF PRESENTATION
The terms the “Company”, “we”, “us”, and “our” are used in this Form 10-Q to refer collectively to the parent company, Central European Media Enterprises Ltd. (“CME Ltd.”), and thesubsidiaries through which we operate. Unless otherwise noted, all statistical and financial information presented in this report has been converted into U.S. dollars using period-end exchangerates. All references to “US$”, “USD” or “dollars” are to U.S. dollars; all references to “BGN” are to Bulgarian leva; all references to “HRK” are to Croatian kuna; all references to “CZK” areto Czech koruna; all references to “RON” are to the New Romanian lei; and all references to “Euro” or “EUR” are to the European Union Euro.
Interim Financial Statements
The accompanying unaudited condensed consolidated financial statements have been prepared in accordance with the instructions to Quarterly Report on Form 10-Q and do not include all of theinformation and note disclosures required by generally accepted accounting principles in the United States of America (“US GAAP”). Amounts as of December 31, 2016 included in theunaudited condensed consolidated financial statements have been derived from audited consolidated financial statements as of that date. The accompanying unaudited condensed consolidatedfinancial statements should be read in conjunction with our Annual Report on Form 10-K for the year ended December 31, 2016 filed with the Securities and Exchange Commission ("SEC") onFebruary 9, 2017 . Our significant accounting policies have not changed since December 31, 2016 , except as noted below.
In the opinion of management, the accompanying unaudited condensed consolidated financial statements reflect all adjustments, consisting only of normal recurring items, necessary for theirfair presentation in conformity with US GAAP for complete financial statements. The results of operations for interim periods are not necessarily indicative of the results to be expected for a fullyear.
Use of Estimates
The preparation of financial statements in conformity with US GAAP requires management to make estimates and assumptions that affect the reported amounts of assets and liabilities anddisclosure of contingent assets and liabilities at the date of the financial statements and the reported amounts of revenues and expenses during the reporting periods. Actual results could differfrom those estimates and assumptions.
Basis of Consolidation
The unaudited condensed consolidated financial statements include the accounts of CME Ltd. and our subsidiaries, after the elimination of intercompany accounts and transactions. Entities inwhich we hold less than a majority voting interest but over which we have the ability to exercise significant influence are accounted for using the equity method. Other investments areaccounted for using the cost method.
5
Index
CENTRAL EUROPEAN MEDIA ENTERPRISES LTD.NOTES TO CONDENSED CONSOLIDATED FINANCIAL STATEMENTS(Tabular amounts in US$ 000’s, except share and per share data)(Unaudited)
Seasonality
We experience seasonality, with advertising sales tending to be lowest during the third quarter of each calendar year due to the summer holiday period (typically July and August), and highestduring the fourth quarter of each calendar year due to the holiday season.
Recent Accounting Pronouncements
Accounting Pronouncements Adopted
On January 1, 2017 we adopted guidance issued by the Financial Accounting Standards Board (the “FASB”) which is intended to improve the accounting for the income tax consequences ofintercompany transfers of assets other than inventory. The guidance requires an entity to recognize the income tax consequences of such transfers in the period in which the transfer occurs,rather than defer recognition of current and deferred income taxes for the transfer until the asset is sold to a third party. The early adoption of this guidance did not have a material impact on ourcondensed consolidated financial statements.
Recent Accounting Pronouncements Issued
In May 2014, the FASB issued guidance which is intended to improve the comparability of revenue recognition practices across entities, industries, jurisdictions, and capital markets. Theguidance supersedes existing revenue recognition guidance and requires an entity to recognize revenue to depict the transfer of promised goods or services to customers in an amount thatreflects the consideration to which the entity expects to be entitled in exchange for those goods or services. The guidance is effective for our fiscal year beginning January 1, 2018. While we arestill in the process of evaluating the impact of the adoption of this guidance on our condensed consolidated financial statements, we currently do not expect the impact of this new guidance to bematerial.
In February 2016, the FASB issued guidance to increase transparency and comparability among organizations by recognizing leasing assets and liabilities on the balance sheet and requiringadditional disclosures about an entity's leasing arrangements. The guidance requires that a lessee recognize a liability to make lease payments and a right-of-use asset, with an availableexception for leases shorter than twelve months. The guidance is effective for our fiscal year beginning January 1, 2019. We are currently in the process of evaluating the impact of the adoptionof this guidance on our condensed consolidated financial statements.
In August 2016, the FASB issued guidance which is intended to reduce the existing diversity in practice related to specific cash flow issues. As applicable to us, the guidance requires that cashflows at the settlement of zero-coupon debt instruments or debt instruments with coupon interest rates that are insignificant in relation to the effective interest rate of the borrowing be bifurcatedbetween cash outflows for operating activities for the portion attributable to accrued interest, and cash outflows for financing activities for the portion attributable to the principal. The guidancerequires a retrospective transition method and is effective for our fiscal year beginning January 1, 2018, with early adoption permitted. We expect to adopt this guidance as of January 1, 2018.Upon adoption, our net cash flows generated from / used in continuing operating activities will decrease by US$ 110.7 million for the year ended December 31, 2016 with a correspondingincrease in net cash used in / provided by continuing financing activities.
In January 2017, the FASB issued guidance which is intended to simplify goodwill impairment testing by eliminating Step 2, and instead recognize an impairment charge for the amount bywhich the carrying amount of the reporting unit exceeds the fair value of the reporting unit. The guidance also eliminates the requirement to perform a qualitative analysis for reporting unitswith a negative carrying value. The guidance is effective for annual and interim impairment tests after January 1, 2020, with early adoption permitted for interim and annual impairment testsperformed from January 1, 2017. We are currently in the process of determining when we will adopt the guidance.
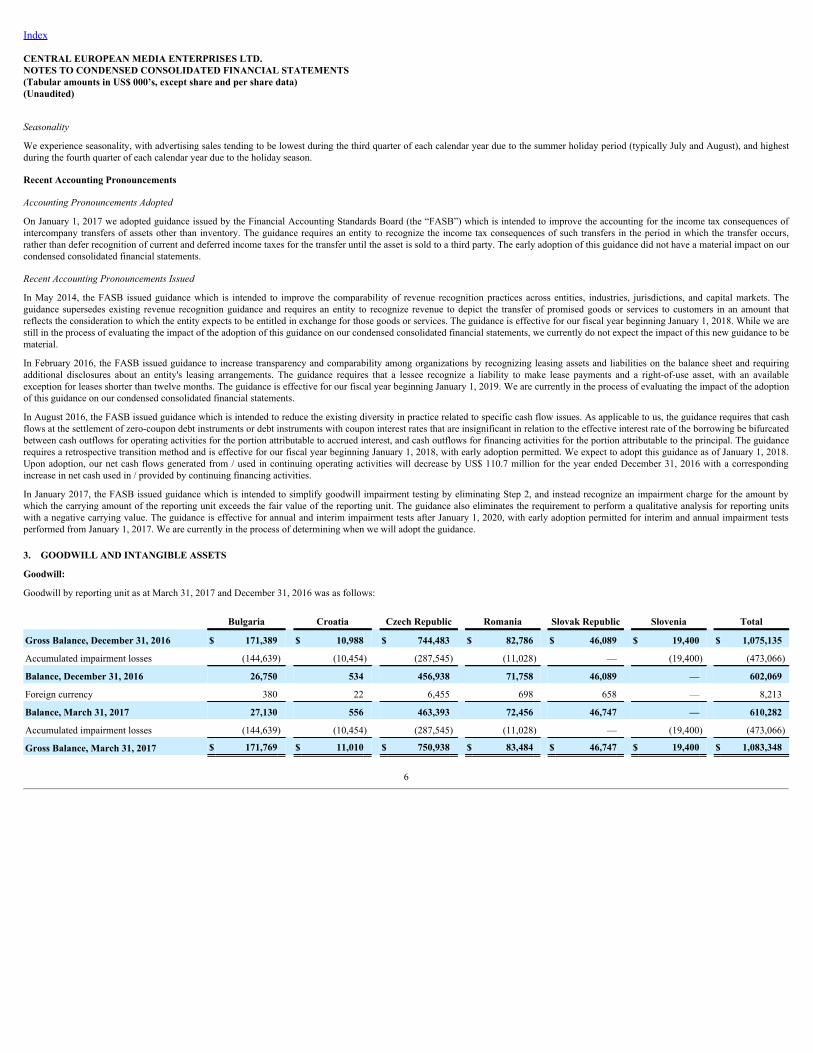
3. GOODWILL AND INTANGIBLE ASSETS
Goodwill:
Goodwill by reporting unit as at March 31, 2017 and December 31, 2016 was as follows:
Bulgaria Croatia Czech Republic Romania Slovak Republic Slovenia Total
Gross Balance, December 31, 2016 $ 171,389 $ 10,988 $ 744,483 $ 82,786 $ 46,089 $ 19,400 $ 1,075,135
Accumulated impairment losses (144,639) (10,454) (287,545) (11,028) — (19,400) (473,066)
Balance, December 31, 2016 26,750 534 456,938 71,758 46,089 — 602,069
Foreign currency 380 22 6,455 698 658 — 8,213
Balance, March 31, 2017 27,130 556 463,393 72,456 46,747 — 610,282
Accumulated impairment losses (144,639) (10,454) (287,545) (11,028) — (19,400) (473,066)
Gross Balance, March 31, 2017 $ 171,769 $ 11,010 $ 750,938 $ 83,484 $ 46,747 $ 19,400 $ 1,083,348
6

Index
CENTRAL EUROPEAN MEDIA ENTERPRISES LTD.NOTES TO CONDENSED CONSOLIDATED FINANCIAL STATEMENTS(Tabular amounts in US$ 000’s, except share and per share data)(Unaudited)
Other intangible assets:
Changes in the net book value of our other intangible assets as at March 31, 2017 and December 31, 2016 is summarized as follows:
March 31, 2017 December 31, 2016
Gross AccumulatedAmortization Net Gross
AccumulatedAmortization Net
Indefinite-lived:
Trademarks $ 81,396 $ — $ 81,396 $ 80,324 $ — $ 80,324
Amortized:
Broadcast licenses 188,313 (133,905) 54,408 185,686 (130,325) 55,361
Trademarks 598 (598) — 591 (591) —
Customer relationships 52,015 (49,895) 2,120 51,338 (48,997) 2,341
Other 1,544 (1,354) 190 1,522 (1,208) 314
Total $ 323,866 $ (185,752) $ 138,114 $ 319,461 $ (181,121) $ 138,340
Broadcast licenses consist of our TV NOVA license in the Czech Republic, which is amortized on a straight-line basis through the expiration date of the license in 2025. Our customerrelationships are deemed to have an economic useful life of, and are amortized on a straight-line basis over, five years to fifteen years .
4. LONG-TERM DEBT AND OTHER FINANCING ARRANGEMENTS
Summary
March 31, 2017 December 31, 2016
Long-term debt $ 1,013,944 $ 999,209
Other credit facilities and capital leases 4,360 4,313
Total long-term debt and other financing arrangements 1,018,304 1,003,522
Less: current maturities (1,576) (1,494)
Total non-current long-term debt and other financing arrangements $ 1,016,728 $ 1,002,028
Financing Transactions
In March 2017, we reduced our average borrowing costs across all of our long-term debt by 150 basis points. Pursuant to an amendment to the Reimbursement Agreement (as defined below)with Time Warner inc. ("Time Warner"), as guarantor of our obligations under the Euro Term Loans, the grid pricing structure on the all-in rate that initially applied only to the 2021 Euro TermLoan (as defined below) was extended to the 2018 Euro Term Loan (as defined below) and the 2019 Euro Term Loan (as defined below), with a reduction in the pricing under the grid for eachof the Euro Term Loans resulting in an all-in rate ranging from 8.5% if our net leverage is greater than or equal to seven times to 5.0% if our net leverage is less than five times. As with the2021 Euro Term Loan, we are now required to pay the first 5.0% of the all-in rate (including the base rate and the rate paid pursuant to customary hedging arrangements) on the 2018 Euro TermLoan and the 2019 Euro Term Loan in cash and the remainder may be paid in cash or in kind, at our option. In addition, we can achieve a further 50 basis point reduction in the all-in rate if wereduce our long-term debt to less than EUR 815.0 million , subject to certain adjustments in respect of specified debt repayments, on or prior to September 30, 2018. As a result of thisamendment to the Reimbursement Agreement, our cost of borrowing across all of our long-term debt will automatically decrease upon the achievement of certain net leverage ratios. For details,see the table below under the heading "Reimbursement Agreement and Guarantee Fees".
Overview
Total long-term debt and credit facilities comprised the following at March 31, 2017 :
Principal Amount ofLiability Component Debt Issuance Costs (1) Net Carrying Amount
2018 Euro Term Loan $ 268,130 $ (555) $ 267,575
2019 Euro Term Loan 251,597 (437) 251,160
2021 Euro Term Loan 501,194 (5,985) 495,209
2021 Revolving Credit Facility — — —
Total long-term debt and credit facilities $ 1,020,921 $ (6,977) $ 1,013,944(1) Debt issuance costs related to the 2018 Euro Term Loan, 2019 Euro Term Loan and 2021 Euro Term Loan are being amortized on a straight-line basis, which approximates the effective
interest method, over the life of the respective instruments. Debt issuance costs related to the 2021 Revolving Credit Facility are classified as non-current assets in our condensedconsolidated balance sheet and are being amortized on a straight-line basis over the life of the 2021 Revolving Credit Facility.
7

Index
CENTRAL EUROPEAN MEDIA ENTERPRISES LTD.NOTES TO CONDENSED CONSOLIDATED FINANCIAL STATEMENTS(Tabular amounts in US$ 000’s, except share and per share data)(Unaudited)
Long-term Debt
Our long-term debt comprised the following at March 31, 2017 and December 31, 2016 :
Carrying Amount Fair Value
March 31, 2017 December 31, 2016 March 31, 2017 December 31, 2016
2018 Euro Term Loan $ 267,575 $ 263,734 $ 250,805 $ 233,297
2019 Euro Term Loan 251,160 247,594 224,034 203,314
2021 Euro Term Loan 495,209 487,881 416,617 369,738
$ 1,013,944 $ 999,209 $ 891,456 $ 806,349
2018 Euro Term Loan
As at March 31, 2017 , the principal amount of our floating rate senior unsecured term credit facility (as amended, the "2018 Euro Term Loan") outstanding was EUR 250.8 million(approximately US$ 268.1 million ). The 2018 Euro Term Loan bears interest at three-month EURIBOR (fixed pursuant to customary hedging arrangements (see Note 11, "FinancialInstruments and Fair Value Measurements" )) plus a margin of between 1.1% and 1.9% depending on the credit rating of Time Warner. The all-in borrowing rate including the Guarantee Feeranges from 8.5% to 5.0% per annum based on our net leverage (see the table below under the heading "Reimbursement Agreement and Guarantee Fees"). As at March 31, 2017 , the all-inborrowing rate on amounts outstanding under the 2018 Euro Term Loan was 7.25% (the components of which are shown in the table below under the heading "Interest Rate Summary").
Interest on the 2018 Euro Term Loan is payable quarterly in arrears on each March 12, June 12, September 12 and December 12. The 2018 Euro Term Loan matures on November 1, 2018 andmay be prepaid at our option, in whole or in part, without premium or penalty, upon the occurrence of certain events, including if our net leverage (as defined in the Reimbursement Agreement)decreases to below five times for two consecutive quarters, or at any time from November 1, 2017. The 2018 Euro Term Loan is a senior unsecured obligation of CME Ltd., and isunconditionally guaranteed by our 100% owned subsidiary CME Media Enterprises B.V. ("CME BV") and by Time Warner and certain of its subsidiaries.
The fair values of the 2018 Euro Term Loan as at March 31, 2017 and December 31, 2016 were determined based on comparable instruments that trade in active markets, plus an applicablespread. This measurement of estimated fair value uses Level 2 inputs as described in Note 11, "Financial Instruments and Fair Value Measurements" . Certain derivative instruments, includingcontingent event of default and change of control put options, have been identified as being embedded in the 2018 Euro Term Loan. The embedded derivatives are considered clearly and closelyrelated to the 2018 Euro Term Loan, and as such are not required to be accounted for separately.
2019 Euro Term Loan
As at March 31, 2017 , the principal amount of our floating rate senior unsecured term credit facility (the "2019 Euro Term Loan") outstanding was EUR 235.3 million (approximately US$251.6 million ). The 2019 Euro Term Loan bears interest at three-month EURIBOR (fixed pursuant to customary hedging arrangements (see Note 11, "Financial Instruments and Fair ValueMeasurements" )) plus a margin of between 1.1% and 1.9% depending on the credit rating of Time Warner. The all-in borrowing rate including the Guarantee Fee ranges from 8.5% to 5.0% perannum based on our net leverage (see the table below under the heading "Reimbursement Agreement and Guarantee Fees"). As at March 31, 2017 , the all-in borrowing rate on amountsoutstanding under the 2019 Euro Term Loan was 7.25% (the components of which are shown in the table below under the heading "Interest Rate Summary").
Interest on the 2019 Euro Term Loan is payable quarterly in arrears on each February 13, May 13, August 13 and November 13. The 2019 Euro Term Loan matures on November 1, 2019 andmay currently be prepaid at our option, in whole or in part, without premium or penalty. The 2019 Euro Term Loan is a senior unsecured obligation of CME Ltd., and is unconditionallyguaranteed by CME BV and by Time Warner and certain of its subsidiaries.
The fair values of the 2019 Euro Term Loan as at March 31, 2017 and December 31, 2016 were determined based on comparable instruments that trade in active markets, plus an applicablespread. This measurement of estimated fair value uses Level 2 inputs as described in Note 11, "Financial Instruments and Fair Value Measurements" . Certain derivative instruments, includingcontingent event of default and change of control put options, have been identified as being embedded in the 2019 Euro Term Loan. The embedded derivatives are considered clearly and closelyrelated to the 2019 Euro Term Loan, and as such are not required to be accounted for separately.
2021 Euro Term Loan
As at March 31, 2017 , the principal amount of our floating rate senior unsecured term credit facility (the "2021 Euro Term Loan") outstanding was EUR 468.8 million (approximately US$501.2 million ). The 2021 Euro Term Loan bears interest at three-month EURIBOR (fixed pursuant to customary hedging arrangements (see Note 11, "Financial Instruments and Fair ValueMeasurements" )) plus a margin of between 1.1% and 1.9% depending on the credit rating of Time Warner. The all-in borrowing rate including the Guarantee Fee ranges from 8.5% to 5.0% perannum based on our net leverage (see the table below under the heading "Reimbursement Agreement and Guarantee Fees"). As at March 31, 2017 , the all-in borrowing rate on amountsoutstanding under the 2021 Euro Term Loan was 7.25% (the components of which are shown in the table below under the heading "Interest Rate Summary").
Interest on the 2021 Euro Term Loan is payable quarterly in arrears on each April 7, July 7, October 7 and January 7. The 2021 Euro Term Loan matures on February 19, 2021 and may beprepaid at our option, in whole or in part, without premium or penalty, upon the earlier of the occurrence of certain events, including if our net leverage (as defined in the ReimbursementAgreement) decreases to below five times for two consecutive quarters, or at any time from February 19, 2020. The 2021 Euro Term Loan is a senior unsecured obligation of CME BV, and isunconditionally guaranteed by CME Ltd. and by Time Warner and certain of its subsidiaries.
8

Index
CENTRAL EUROPEAN MEDIA ENTERPRISES LTD.NOTES TO CONDENSED CONSOLIDATED FINANCIAL STATEMENTS(Tabular amounts in US$ 000’s, except share and per share data)(Unaudited)
The fair values of the 2021 Euro Term Loan as at March 31, 2017 and December 31, 2016 were determined based on comparable instruments that trade in active markets, plus an applicablespread. This measurement of estimated fair value uses Level 2 inputs as described in Note 11, "Financial Instruments and Fair Value Measurements" . Certain derivative instruments, includingcontingent event of default and change of control put options, have been identified as being embedded in the 2021 Euro Term Loan. The embedded derivatives are considered clearly and closelyrelated to the 2021 Euro Term Loan, and as such are not required to be accounted for separately.
Reimbursement Agreement and Guarantee Fees
In connection with Time Warner’s guarantees of the 2018 Euro Term Loan, 2019 Euro Term Loan and 2021 Euro Term Loan (collectively, the “Euro Term Loans”), we entered into areimbursement agreement (as amended, the “Reimbursement Agreement") with Time Warner which provides for the payment of guarantee fees (collectively, the "Guarantee Fees") to TimeWarner as consideration for those guarantees, and that we will reimburse Time Warner for any amounts paid by them under any guarantee or through any loan purchase right exercised by TimeWarner. The loan purchase right allows Time Warner to purchase any amount outstanding under the Euro Term Loans from the lenders following an event of default under the Euro Term Loansor the Reimbursement Agreement. The Reimbursement Agreement is jointly and severally guaranteed by both our 100% owned subsidiary Central European Media Enterprises N.V.("CME NV") and CME BV and is secured by a pledge over 100% of the outstanding shares of each of CME NV and CME BV. The covenants and events of default under the ReimbursementAgreement are substantially the same as under the 2021 Revolving Credit Facility (described below).
We pay Guarantee Fees to Time Warner based on the amounts outstanding on the Euro Term Loans calculated on a per annum basis and on our consolidated net leverage (as defined in theReimbursement Agreement) as shown in the table below:
Consolidated Net Leverage Cash Rate (1) PIK Fee Rate Total Rate
≥ 7.0x 5.00% 3.50% 8.50%
< 7.0x - 6.0x 5.00% 2.25% 7.25%
< 6.0x - 5.0x 5.00% 1.00% 6.00%
< 5.0x 5.00% —% 5.00%(1) Includes cash paid for interest for the Euro Term Loans and the related customary hedging arrangements.
Our consolidated net leverage as at March 31, 2017 and December 31, 2016 was 6.3x and 6.9x , respectively. For the three months ended March 31, 2017 and 2016 , we recognized US$ 16.4million and US$ 9.1 million , respectively, of Guarantee Fees as interest expense in our condensed consolidated statements of operations and comprehensive income / loss.
The Guarantee Fees relating to the 2018 Euro Term Loan and the 2019 Euro Term Loan are payable semi-annually in arrears on each May 1 and November 1, in cash or in kind (by adding suchsemi-annual Guarantee Fees to any such amount then outstanding). The Guarantee Fees relating to the 2021 Euro Term Loan are payable semi-annually in arrears on each June 1 and December1. The first 5.0% of the all-in rate for each facility (including the base rate and the rate paid pursuant to the hedging arrangements) must be paid in cash and the remainder is payable at ourelection in cash or in kind.
The Guarantee Fees paid in kind are presented as a component of other non-current liabilities (see Note 10, "Other Liabilities" ) and bear interest per annum at their respective Guarantee Feerate (as set forth in the table below). Guarantee Fees paid in cash are included in cash flows from operating activities in our condensed consolidated statements of cash flows.
9

Index
CENTRAL EUROPEAN MEDIA ENTERPRISES LTD.NOTES TO CONDENSED CONSOLIDATED FINANCIAL STATEMENTS(Tabular amounts in US$ 000’s, except share and per share data)(Unaudited)
Interest Rate Summary
Base Rate
Rate Fixed Pursuantto Interest Rate
Hedges Guarantee Fee Rate All-in Borrowing
Rate
2018 Euro Term Loan 1.50% 0.21% (1) 5.54% 7.25%
2019 Euro Term Loan 1.50% 0.31% 5.44% 7.25%
2021 Euro Term Loan 1.50% 0.28% 5.47% 7.25%
2021 Revolving Credit Facility (2) 9.15% (3) —% —% 9.15%(1) Effective until November 1, 2017. From November 1, 2017 through maturity on November 1, 2018, the rate fixed pursuant to interest rate hedges will decrease to 0.14% , with a
corresponding increase in the guarantee fee rate, such that the all-in borrowing rate remains 7.25% if our net leverage ratio remains unchanged.(2) As at March 31, 2017 , the aggregate principal amount available under the 2021 Revolving Credit Facility was undrawn.(3) Based on the three month LIBOR of 1.15% as at March 31, 2017 .
2021 Revolving Credit Facility
We had no balance outstanding under the US$ 115.0 million revolving credit facility (the “2021 Revolving Credit Facility”), all of which was available to be drawn, as at March 31, 2017 . Theaggregate principal amount available decreases to US$ 50.0 million with effect from January 1, 2018.
The 2021 Revolving Credit Facility bears interest at a rate per annum based on, at our option, an alternative base rate plus 7.0% or an amount equal to the greater of (i) an adjusted LIBO rateand (ii) 1.0% , plus, in each case, 8.0% , with the first 5.0% payable in cash and the remainder payable at our election in cash or in kind by adding such accrued interest to the applicableprincipal amount outstanding under the 2021 Revolving Credit Facility. The interest rate on the 2021 Revolving Credit Facility is determined on the basis of our net leverage ratio (as defined inthe Reimbursement Agreement) and ranges from LIBOR (subject to a floor of 1.0% ) plus 9.0% (if our net leverage is greater than or equal to seven times) to 7.0% per annum (if our netleverage ratio is less than five times). The maturity date of the 2021 Revolving Credit Facility is February 19, 2021. When drawn, the 2021 Revolving Credit Facility permits prepayment at ouroption in whole or in part without penalty.
The 2021 Revolving Credit Facility is jointly and severally guaranteed by CME NV and CME BV and is secured by a pledge over 100% of the outstanding shares of each of CME NV andCME BV. The 2021 Revolving Credit Facility agreement contains limitations on our ability to incur indebtedness, incur guarantees, grant liens, pay dividends or make other distributions, enterinto certain affiliate transactions, consolidate, merge or effect a corporate reconstruction, make certain investments acquisitions and loans, and conduct certain asset sales. The agreement alsocontains maintenance covenants in respect of interest cover, cash flow cover and total leverage ratios, and has covenants in respect of incurring indebtedness, the provision of guarantees, makinginvestments and disposals, granting security and certain events of defaults.
Other Credit Facilities and Capital Lease Obligations
Other credit facilities and capital lease obligations comprised the following at March 31, 2017 and December 31, 2016 :
March 31, 2017 December 31, 2016
Credit facilities (1) – (3) $ — $ —
Capital leases 4,360 4,313
Total credit facilities and capital leases 4,360 4,313
Less: current maturities (1,576) (1,494)
Total non-current credit facilities and capital leases $ 2,784 $ 2,819
(1) We have a cash pooling arrangement with Bank Mendes Gans (“BMG”), a subsidiary of ING Bank N.V. (“ING”), which enables us to receive credit across the group in respect of cashbalances deposited with BMG. Cash deposited by our subsidiaries with BMG is pledged as security against the drawings of other subsidiaries up to the amount deposited.
As at March 31, 2017 , we had deposits of US$ 28.7 million in and no drawings on the BMG cash pool. Interest is earned on deposits at the relevant money market rate. As atDecember 31, 2016 , we had deposits of US$ 16.4 million in and no drawings on the BMG cash pool.
(2) As at March 31, 2017 and December 31, 2016 , there were no drawings outstanding under a CZK 675.0 million (approximately US$ 26.7 million ) factoring framework agreement withFactoring České spořitelny, a.s. Under this facility, up to CZK 675.0 million (approximately US$ 26.7 million ) of receivables from certain customers in the Czech Republic may befactored on a recourse or non-recourse basis. The facility has a factoring fee of 0.3% of any factored receivable and bears interest at one-month PRIBOR plus 2.5% per annum for theperiod that receivables are factored and outstanding.
(3) As at March 31, 2017 and December 31, 2016 , there were RON 156.3 million (approximately US$ 36.7 million ) and RON 105.7 million (approximately US$ 24.6 million ), respectively,of receivables factored under a factoring framework agreement with Global Funds IFN S.A. Under this facility, receivables from certain customers in Romania may be factored on a non-recourse basis. The facility has a factoring fee of 4.0% of any factored receivable and bears interest at 6.0% per annum from the date the receivables are factored to the due date of thefactored receivable.
10

Index
CENTRAL EUROPEAN MEDIA ENTERPRISES LTD.NOTES TO CONDENSED CONSOLIDATED FINANCIAL STATEMENTS(Tabular amounts in US$ 000’s, except share and per share data)(Unaudited)
Total Group
At March 31, 2017 , the maturity of our long-term debt and credit facilities, excluding any future elections to pay interest in kind, was as follows:
2017 $ —2018 268,1302019 251,5972020 —2021 501,1942022 and thereafter —Total long-term debt and credit facilities 1,020,921Debt issuance costs (6,977)Carrying amount of long-term debt and credit facilities $ 1,013,944
Capital Lease Commitments
We lease certain of our office and broadcast facilities as well as machinery and equipment under various leasing arrangements. The future minimum lease payments, by year and in theaggregate, under capital leases with initial or remaining non-cancellable lease terms in excess of one year, consisted of the following at March 31, 2017 :
2017 $ 1,2742018 1,4372019 1,1142020 6362021 312022 and thereafter —Total undiscounted payments 4,492
Less: amount representing interest (132)Present value of net minimum lease payments $ 4,360
5. PROGRAM RIGHTS
Program rights comprised the following at March 31, 2017 and December 31, 2016 :
March 31, 2017 December 31, 2016
Program rights:
Acquired program rights, net of amortization $ 186,727 $ 183,303
Less: current portion of acquired program rights (87,145) (86,151)
Total non-current acquired program rights 99,582 97,152
Produced program rights – Feature Films:
Released, net of amortization 1,014 1,039
Produced program rights – Television Programs:
Released, net of amortization 56,865 54,149
Completed and not released 3,576 2,593
In production 22,404 23,712
Development and pre-production 922 711
Total produced program rights 84,781 82,204
Total non-current acquired program rights and produced program rights $ 184,363 $ 179,356
11

Index
CENTRAL EUROPEAN MEDIA ENTERPRISES LTD.NOTES TO CONDENSED CONSOLIDATED FINANCIAL STATEMENTS(Tabular amounts in US$ 000’s, except share and per share data)(Unaudited)
6. ACCOUNTS RECEIVABLE
Accounts receivable comprised the following at March 31, 2017 and December 31, 2016 :
March 31, 2017 December 31, 2016
Unrelated customers $ 157,728 $ 187,937
Less: allowance for bad debts and credit notes (8,583) (9,598)
Total accounts receivable $ 149,145 $ 178,339
7. OTHER ASSETS
Other current and non-current assets comprised the following at March 31, 2017 and December 31, 2016 :
March 31, 2017 December 31, 2016
Current:
Prepaid acquired programming $ 18,436 $ 22,511
Other prepaid expenses 6,905 5,270
VAT recoverable 1,655 713
Income taxes recoverable 209 206
Other 3,520 3,771
Total other current assets $ 30,725 $ 32,471
March 31, 2017 December 31, 2016
Non-current:
Capitalized debt costs $ 14,310 $ 15,018
Deferred tax 5,101 4,570
Other 1,159 1,855
Total other non-current assets $ 20,570 $ 21,443
Capitalized debt costs are being amortized over the term of the 2021 Revolving Credit Facility using the straight-line method.
8. PROPERTY, PLANT AND EQUIPMENT
Property, plant and equipment comprised the following at March 31, 2017 and December 31, 2016 :
March 31, 2017 December 31, 2016
Land and buildings $ 92,469 $ 90,988
Machinery, fixtures and equipment 210,198 202,110
Other equipment 34,566 33,752
Software licenses 57,160 55,542
Construction in progress 4,988 5,316
Total cost 399,381 387,708
Less: accumulated depreciation (290,404) (278,619)
Total net book value $ 108,977 $ 109,089
Assets held under capital leases (included in the above)
Land and buildings $ 3,737 $ 3,684
Machinery, fixtures and equipment 6,712 6,338
Total cost 10,449 10,022
Less: accumulated depreciation (4,802) (4,316)
Total net book value $ 5,647 $ 5,706
12

Index
CENTRAL EUROPEAN MEDIA ENTERPRISES LTD.NOTES TO CONDENSED CONSOLIDATED FINANCIAL STATEMENTS(Tabular amounts in US$ 000’s, except share and per share data)(Unaudited)
The movement in the net book value of property, plant and equipment during the three months ended March 31, 2017 and 2016 was comprised of:
For the Three Months Ended March 31,
2017 2016
Opening balance $ 109,089 $ 108,522
Additions 6,123 5,536
Disposals (74) (50)
Depreciation (7,759) (7,285)
Foreign currency movements 1,598 5,025
Ending balance $ 108,977 $ 111,748
9. ACCOUNTS PAYABLE AND ACCRUED LIABILITIES
Accounts payable and accrued liabilities comprised the following at March 31, 2017 and December 31, 2016 :
March 31, 2017 December 31, 2016
Accounts payable and accrued expenses $ 53,568 $ 59,522
Related party accounts payable 173 192
Programming liabilities 29,939 29,249
Related party programming liabilities 18,522 18,959
Duties and other taxes payable 10,879 13,446
Accrued staff costs 14,513 20,565
Accrued interest payable 2,860 2,941
Related party accrued interest payable (including Guarantee Fees) 26,499 9,588
Income taxes payable 5,346 5,514
Other accrued liabilities 1,400 1,005
Total accounts payable and accrued liabilities $ 163,699 $ 160,981
10. OTHER LIABILITIES
Other current and non-current liabilities comprised the following at March 31, 2017 and December 31, 2016 :
March 31, 2017 December 31, 2016
Current:
Deferred revenue $ 25,798 $ 5,333
Legal provision 2,817 2,680
Other 530 1,076
Total other current liabilities $ 29,145 $ 9,089
March 31, 2017 December 31, 2016
Non-current:
Deferred tax $ 20,278 $ 20,335
Related party Commitment Fee payable (1) 9,905 9,905
Related party Guarantee Fee payable (Note 4) 34,492 34,492
Other 2,937 4,026
Total other non-current liabilities $ 67,612 $ 68,758(1) Represents the commitment fee (the "Commitment Fee") payable to Time Warner, including accrued interest, in respect of its obligation under a commitment letter dated November
14, 2014 between Time Warner and us whereby Time Warner agreed to provide or assist with arranging a loan facility to repay our 5.0% senior convertible notes at maturity in November2015. The Commitment Fee is payable by November 1, 2019, the maturity date of the 2019 Euro Term Loan, or earlier if the repayment of the 2019 Euro Term Loan is accelerated. TheCommitment Fee bears interest at 8.5% per annum and such interest is payable in arrears on each May 1 and November 1, and may be paid in cash or in kind, at our election.
13

Index
CENTRAL EUROPEAN MEDIA ENTERPRISES LTD.NOTES TO CONDENSED CONSOLIDATED FINANCIAL STATEMENTS(Tabular amounts in US$ 000’s, except share and per share data)(Unaudited)
11. FINANCIAL INSTRUMENTS AND FAIR VALUE MEASUREMENTS
ASC 820, “Fair Value Measurements and Disclosure”, establishes a hierarchy that prioritizes the inputs to those valuation techniques used to measure fair value. The hierarchy gives the highestpriority to unadjusted quoted prices in active markets for identical assets or liabilities (Level 1 measurements) and the lowest priority to unobservable inputs (Level 3 measurements). The threelevels of the fair value hierarchy are:
Basis of Fair Value MeasurementLevel 1 Unadjusted quoted prices in active markets that are accessible at the measurement date for identical, unrestricted instruments.Level 2 Quoted prices in markets that are not considered to be active or financial instruments for which all significant inputs are observable, either directly or indirectly.Level 3 Prices or valuations that require inputs that are both significant to the fair value measurement and unobservable.
A financial instrument’s level within the fair value hierarchy is based on the lowest level of any input that is significant to the fair value measurement.
We evaluate the position of each financial instrument measured at fair value in the hierarchy individually based on the valuation methodology we apply. The carrying amount of financialinstruments, including cash and cash equivalents, accounts receivable, and accounts payable and accrued liabilities, approximate their fair value due to the short-term nature of these items. Thefair value of our long-term debt is included in Note 4, "Long-term Debt and Other Financing Arrangements" .
Hedge Accounting Activities
Cash Flow Hedges of Interest Rate Risk
We are party to interest rate swap agreements to mitigate our exposure to interest rate fluctuations on the outstanding principal amount of our Euro Term Loans. These interest rate swaps,designated as cash flow hedges, provide us with variable-rate cash receipts in exchange for fixed-rate payments over the lives of the agreements, with no exchange of the underlying notionalamount. These instruments are carried at fair value on our condensed consolidated balance sheets as other current and other non-current liabilities based on their maturity, and the effectiveportion of the changes in the fair value is recorded in accumulated other comprehensive income / loss and subsequently reclassified to interest expense when the hedged item affects earnings.The ineffective portion of changes in the fair value is recognized immediately in the change in fair value of derivatives in our condensed consolidated statements of operations andcomprehensive income / loss. For the three months ended March 31, 2017 and 2016 , we did not recognize any charges related to hedge ineffectiveness.
Information relating to financial instruments is as follows:
Trade Date Number ofContracts Description
Aggregate NotionalAmount Maturity Date Objective
Fair Value as atMarch 31, 2017
April 5, 2016 5 Interest rate swap € 468,800 February 21, 2021 Interest rate hedge underlying 2021 Euro
Term Loan $ (893,887)
April 5, 2016 4 Interest rate swap € 250,800 November 1, 2018
Interest rate hedge underlying 2018 EuroTerm Loan, forward starting on
November 1, 2017 $ (282,719)
November 10, 2015 3 Interest rate swap € 235,335 November 1, 2019 Interest rate hedge underlying 2019 Euro
Term Loan $ (1,409,599)
November 14, 2014 2 Interest rate swap € 250,800 November 1, 2017 Interest rate hedge underlying 2018 Euro
Term Loan $ (336,167)
We value the interest rate swap agreements using a valuation model which calculates the fair value on the basis of the net present value of the estimated future cash flows. The most significantinput used in the valuation model is the expected EURIBOR-based yield curve. These instruments were allocated to Level 2 of the fair value hierarchy because the critical inputs to this model,including current interest rates, relevant yield curves and the known contractual terms of the instruments, were readily observable.
Accumulated Other Comprehensive LossBALANCE December 31, 2016 $ (4,451)Unrealized gain on interest rate swaps 573Reclassified to interest expense 685BALANCE March 31, 2017 $ (3,193)
Non-Hedge Accounting Activities
The change in fair value of derivatives not designated as hedging instruments comprised the following for the three months ended March 31, 2017 and 2016 :
For the Three Months Ended March 31,
2017 2016Currency swaps $ 368 $ (14,050)
14
Index
CENTRAL EUROPEAN MEDIA ENTERPRISES LTD.NOTES TO CONDENSED CONSOLIDATED FINANCIAL STATEMENTS(Tabular amounts in US$ 000’s, except share and per share data)(Unaudited)
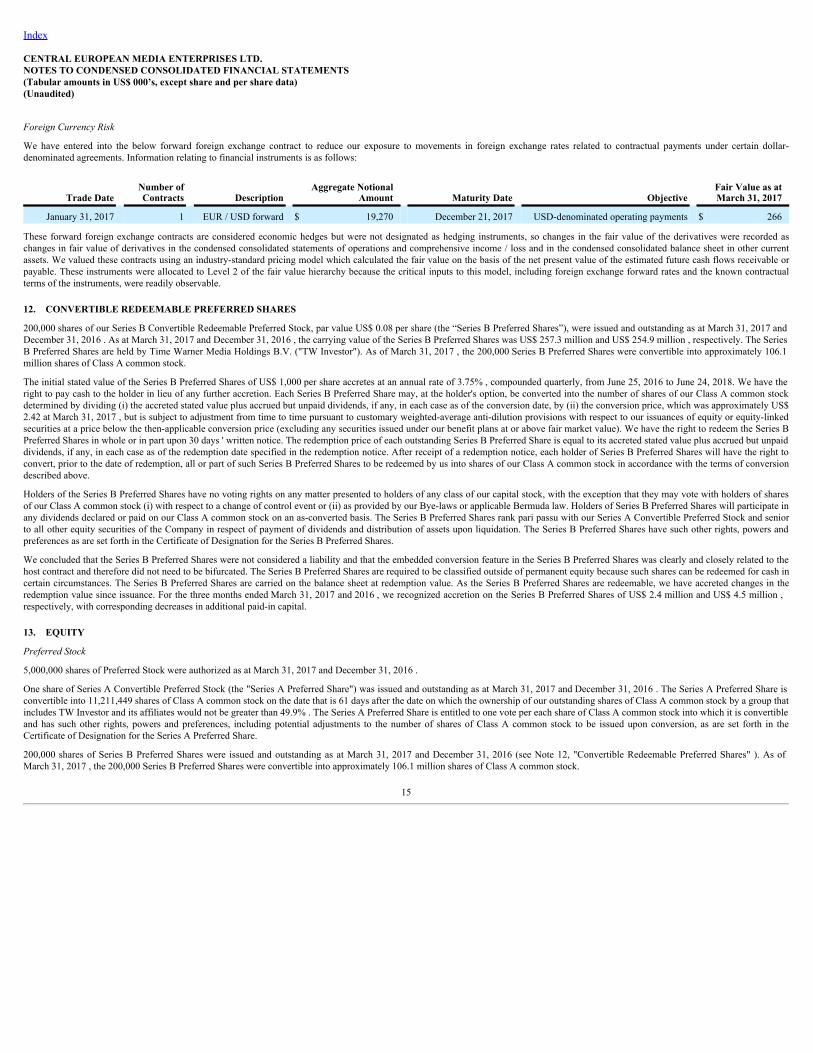
Foreign Currency Risk
We have entered into the below forward foreign exchange contract to reduce our exposure to movements in foreign exchange rates related to contractual payments under certain dollar-denominated agreements. Information relating to financial instruments is as follows:
Trade Date Number ofContracts Description
Aggregate NotionalAmount Maturity Date Objective
Fair Value as atMarch 31, 2017
January 31, 2017 1 EUR / USD forward $ 19,270 December 21, 2017 USD-denominated operating payments $ 266
These forward foreign exchange contracts are considered economic hedges but were not designated as hedging instruments, so changes in the fair value of the derivatives were recorded aschanges in fair value of derivatives in the condensed consolidated statements of operations and comprehensive income / loss and in the condensed consolidated balance sheet in other currentassets. We valued these contracts using an industry-standard pricing model which calculated the fair value on the basis of the net present value of the estimated future cash flows receivable orpayable. These instruments were allocated to Level 2 of the fair value hierarchy because the critical inputs to this model, including foreign exchange forward rates and the known contractualterms of the instruments, were readily observable.
12. CONVERTIBLE REDEEMABLE PREFERRED SHARES
200,000 shares of our Series B Convertible Redeemable Preferred Stock, par value US$ 0.08 per share (the “Series B Preferred Shares”), were issued and outstanding as at March 31, 2017 andDecember 31, 2016 . As at March 31, 2017 and December 31, 2016 , the carrying value of the Series B Preferred Shares was US$ 257.3 million and US$ 254.9 million , respectively. The SeriesB Preferred Shares are held by Time Warner Media Holdings B.V. ("TW Investor"). As of March 31, 2017 , the 200,000 Series B Preferred Shares were convertible into approximately 106.1million shares of Class A common stock.
The initial stated value of the Series B Preferred Shares of US$ 1,000 per share accretes at an annual rate of 3.75% , compounded quarterly, from June 25, 2016 to June 24, 2018. We have theright to pay cash to the holder in lieu of any further accretion. Each Series B Preferred Share may, at the holder's option, be converted into the number of shares of our Class A common stockdetermined by dividing (i) the accreted stated value plus accrued but unpaid dividends, if any, in each case as of the conversion date, by (ii) the conversion price, which was approximately US$2.42 at March 31, 2017 , but is subject to adjustment from time to time pursuant to customary weighted-average anti-dilution provisions with respect to our issuances of equity or equity-linkedsecurities at a price below the then-applicable conversion price (excluding any securities issued under our benefit plans at or above fair market value). We have the right to redeem the Series BPreferred Shares in whole or in part upon 30 days ' written notice. The redemption price of each outstanding Series B Preferred Share is equal to its accreted stated value plus accrued but unpaiddividends, if any, in each case as of the redemption date specified in the redemption notice. After receipt of a redemption notice, each holder of Series B Preferred Shares will have the right toconvert, prior to the date of redemption, all or part of such Series B Preferred Shares to be redeemed by us into shares of our Class A common stock in accordance with the terms of conversiondescribed above.
Holders of the Series B Preferred Shares have no voting rights on any matter presented to holders of any class of our capital stock, with the exception that they may vote with holders of sharesof our Class A common stock (i) with respect to a change of control event or (ii) as provided by our Bye-laws or applicable Bermuda law. Holders of Series B Preferred Shares will participate inany dividends declared or paid on our Class A common stock on an as-converted basis. The Series B Preferred Shares rank pari passu with our Series A Convertible Preferred Stock and seniorto all other equity securities of the Company in respect of payment of dividends and distribution of assets upon liquidation. The Series B Preferred Shares have such other rights, powers andpreferences as are set forth in the Certificate of Designation for the Series B Preferred Shares.
We concluded that the Series B Preferred Shares were not considered a liability and that the embedded conversion feature in the Series B Preferred Shares was clearly and closely related to thehost contract and therefore did not need to be bifurcated. The Series B Preferred Shares are required to be classified outside of permanent equity because such shares can be redeemed for cash incertain circumstances. The Series B Preferred Shares are carried on the balance sheet at redemption value. As the Series B Preferred Shares are redeemable, we have accreted changes in theredemption value since issuance. For the three months ended March 31, 2017 and 2016 , we recognized accretion on the Series B Preferred Shares of US$ 2.4 million and US$ 4.5 million ,respectively, with corresponding decreases in additional paid-in capital.
13. EQUITY
Preferred Stock
5,000,000 shares of Preferred Stock were authorized as at March 31, 2017 and December 31, 2016 .
One share of Series A Convertible Preferred Stock (the "Series A Preferred Share") was issued and outstanding as at March 31, 2017 and December 31, 2016 . The Series A Preferred Share isconvertible into 11,211,449 shares of Class A common stock on the date that is 61 days after the date on which the ownership of our outstanding shares of Class A common stock by a group thatincludes TW Investor and its affiliates would not be greater than 49.9% . The Series A Preferred Share is entitled to one vote per each share of Class A common stock into which it is convertibleand has such other rights, powers and preferences, including potential adjustments to the number of shares of Class A common stock to be issued upon conversion, as are set forth in theCertificate of Designation for the Series A Preferred Share.
200,000 shares of Series B Preferred Shares were issued and outstanding as at March 31, 2017 and December 31, 2016 (see Note 12, "Convertible Redeemable Preferred Shares" ). As ofMarch 31, 2017 , the 200,000 Series B Preferred Shares were convertible into approximately 106.1 million shares of Class A common stock.
15

Index
CENTRAL EUROPEAN MEDIA ENTERPRISES LTD.NOTES TO CONDENSED CONSOLIDATED FINANCIAL STATEMENTS(Tabular amounts in US$ 000’s, except share and per share data)(Unaudited)
Class A and Class B Common Stock
440,000,000 shares of Class A common stock and 15,000,000 shares of Class B common stock were authorized as at March 31, 2017 and December 31, 2016 . The rights of the holders of ClassA common stock and Class B common stock are identical except for voting rights. The shares of Class A common stock are entitled to one vote per share and the shares of Class B commonstock are entitled to ten votes per share. Shares of Class B common stock are convertible into shares of Class A common stock on a one -for- one basis for no additional consideration. Holdersof each class of shares are entitled to receive dividends and upon liquidation or dissolution are entitled to receive all assets available for distribution to holders of our common stock. Under ourBye-laws, the holders of each class have no preemptive or other subscription rights and there are no redemption or sinking fund provisions with respect to such shares.
There were 144.2 million and 143.4 million shares of Class A common stock outstanding at March 31, 2017 and December 31, 2016 , respectively, and no shares of Class B common stockoutstanding at March 31, 2017 or December 31, 2016 .
As at March 31, 2017 , TW Investor owns 42.6% of the outstanding shares of Class A common stock and has a 46.7% voting interest in the Company due to its ownership of the Series APreferred Share.
Warrants
On May 2, 2014, we issued 114,000,000 warrants in connection with a rights offering. Each warrant may be exercised until May 2, 2018 and entitles the holder thereof to receive one share ofour Class A common stock at an exercise price of US$ 1.00 per share in cash. During the three months ended March 31, 2017 , 301,308 warrants were exercised resulting in net proceeds to us ofapproximately US$ 0.3 million . As at March 31, 2017 , 106,701,737 warrants remained outstanding. Time Warner and TW Investor collectively hold 100,926,996 of these warrants. Thewarrants are classified in additional paid-in capital, a component of equity, and are not subject to subsequent revaluation.
14. INTEREST EXPENSE
Interest expense comprised the following for the three months ended March 31, 2017 and 2016 :
For the Three Months Ended March 31,
2017 2016
Interest on long-term debt and other financing arrangements $ 22,321 $ 32,652
Amortization of capitalized debt issuance costs 1,434 3,899
Amortization of debt issuance discount — 12,603
Total interest expense $ 23,755 $ 49,154
We paid cash interest (including mandatory cash-pay Guarantee Fees) of US$ 4.9 million and US$ 2.6 million during the three months ended March 31, 2017 and 2016 , respectively. Inaddition, we paid US$ 10.0 million of accrued Guarantee Fees during the three months ended March 31, 2016 , for which we had the option to pay in kind.
15. OTHER NON-OPERATING INCOME / EXPENSE
Other non-operating income / expense comprised the following for the three months ended March 31, 2017 and 2016 :
For the Three Months Ended March 31,
2017 2016
Interest income $ 79 $ 108Foreign currency exchange gain, net 1,681 15,422Change in fair value of derivatives (Note 11) 368 (14,050)Other income / (expense), net 197 (64)Total other non-operating income $ 2,325 $ 1,416
16. STOCK-BASED COMPENSATION
Under our 2015 Stock Incentive Plan (the "2015 Plan"), 6,000,000 shares of Class A common stock are authorized for grants of stock options, restricted stock units ("RSU"), restricted stock andstock appreciation rights to employees and non-employee directors. In addition, any shares available under our Amended and Restated Stock Incentive Plan (which expired on June 1, 2015),including in respect of any awards that expire, terminate or are forfeited, will be available for awards under the 2015 Plan. Under the 2015 Plan, awards are made to employees and directors atthe discretion of the Compensation Committee. Any awards previously issued under the Amended and Restated Stock Incentive Plan will continue to be governed by the terms of that plan.
For the three months ended March 31, 2017 and 2016 , we recognized charges for stock-based compensation of US$ 0.8 million and US$ 0.8 million , respectively, presented as a component ofselling, general and administrative expenses in our condensed consolidated statements of operations and comprehensive income / loss.
16
Index
CENTRAL EUROPEAN MEDIA ENTERPRISES LTD.NOTES TO CONDENSED CONSOLIDATED FINANCIAL STATEMENTS(Tabular amounts in US$ 000’s, except share and per share data)(Unaudited)
Stock Options
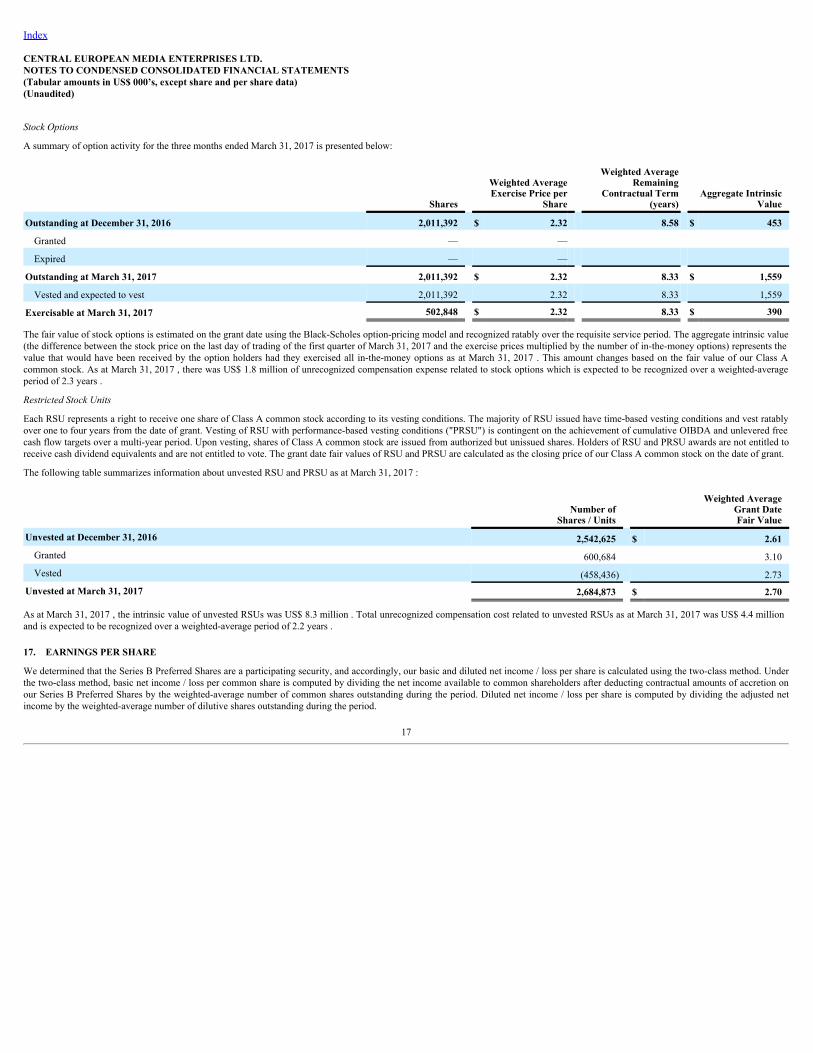
A summary of option activity for the three months ended March 31, 2017 is presented below:
Shares
Weighted AverageExercise Price per
Share
Weighted AverageRemaining
Contractual Term(years)
Aggregate IntrinsicValue
Outstanding at December 31, 2016 2,011,392 $ 2.32 8.58 $ 453
Granted — —
Expired — —
Outstanding at March 31, 2017 2,011,392 $ 2.32 8.33 $ 1,559
Vested and expected to vest 2,011,392 2.32 8.33 1,559
Exercisable at March 31, 2017 502,848 $ 2.32 8.33 $ 390
The fair value of stock options is estimated on the grant date using the Black-Scholes option-pricing model and recognized ratably over the requisite service period. The aggregate intrinsic value(the difference between the stock price on the last day of trading of the first quarter of March 31, 2017 and the exercise prices multiplied by the number of in-the-money options) represents thevalue that would have been received by the option holders had they exercised all in-the-money options as at March 31, 2017 . This amount changes based on the fair value of our Class Acommon stock. As at March 31, 2017 , there was US$ 1.8 million of unrecognized compensation expense related to stock options which is expected to be recognized over a weighted-averageperiod of 2.3 years .
Restricted Stock Units
Each RSU represents a right to receive one share of Class A common stock according to its vesting conditions. The majority of RSU issued have time-based vesting conditions and vest ratablyover one to four years from the date of grant. Vesting of RSU with performance-based vesting conditions ("PRSU") is contingent on the achievement of cumulative OIBDA and unlevered freecash flow targets over a multi-year period. Upon vesting, shares of Class A common stock are issued from authorized but unissued shares. Holders of RSU and PRSU awards are not entitled toreceive cash dividend equivalents and are not entitled to vote. The grant date fair values of RSU and PRSU are calculated as the closing price of our Class A common stock on the date of grant.
The following table summarizes information about unvested RSU and PRSU as at March 31, 2017 :
Number of
Shares / Units
Weighted AverageGrant DateFair Value
Unvested at December 31, 2016 2,542,625 $ 2.61Granted 600,684 3.10Vested (458,436) 2.73
Unvested at March 31, 2017 2,684,873 $ 2.70
As at March 31, 2017 , the intrinsic value of unvested RSUs was US$ 8.3 million . Total unrecognized compensation cost related to unvested RSUs as at March 31, 2017 was US$ 4.4 millionand is expected to be recognized over a weighted-average period of 2.2 years .
17. EARNINGS PER SHARE
We determined that the Series B Preferred Shares are a participating security, and accordingly, our basic and diluted net income / loss per share is calculated using the two-class method. Underthe two-class method, basic net income / loss per common share is computed by dividing the net income available to common shareholders after deducting contractual amounts of accretion onour Series B Preferred Shares by the weighted-average number of common shares outstanding during the period. Diluted net income / loss per share is computed by dividing the adjusted netincome by the weighted-average number of dilutive shares outstanding during the period.
17

Index
CENTRAL EUROPEAN MEDIA ENTERPRISES LTD.NOTES TO CONDENSED CONSOLIDATED FINANCIAL STATEMENTS(Tabular amounts in US$ 000’s, except share and per share data)(Unaudited)
The components of basic and diluted earnings per share are as follows:
For the Three Months Ended March 31,
2017 2016
Net loss $ (11,274) $ (40,694)
Net loss attributable to noncontrolling interests 209 259
Less: preferred share accretion paid in kind (Note 12) (2,357) (4,510)
Net loss attributable to CME Ltd. available to common shareholders — basic $ (13,422) $ (44,945)
Effect of dilutive securities
Preferred share accretion paid in kind — —
Net loss attributable to CME Ltd. available to common shareholders — diluted $ (13,422) $ (44,945)
Weighted average outstanding shares of common stock — basic (1) 154,795 147,078
Dilutive effect of employee stock options and RSUs — —
Weighted average outstanding shares of common stock — diluted 154,795 147,078
Net loss per share:
Net loss attributable to CME Ltd. — basic and diluted (0.09) (0.31)(1) For the purpose of computing basic earnings per share, the 11,211,449 shares of Class A common stock underlying the Series A Preferred Share are included in the weighted average
outstanding shares of common stock - basic, because the holder of the Series A Preferred Share is entitled to receive any dividends payable when dividends are declared by the Board ofDirectors with respect to any shares of common stock.
At March 31, 2017 , 108,844,869 ( March 31, 2016 : 3,122,121 ) warrants, stock options, RSUs and shares underlying the Series B Preferred Shares were antidilutive to income from continuingoperations and excluded from the calculation of earnings per share. These instruments may become dilutive in the future. As set forth in the Certificate of Designation for the Series B PreferredShares, the holders of our Series B Preferred Shares are not contractually obligated to share in our losses.
18. SEGMENT DATA
We manage our business on a geographical basis, with six operating segments: Bulgaria, Croatia, the Czech Republic, Romania, the Slovak Republic and Slovenia, which are also our reportablesegments and our main operating countries. These segments reflect how CME Ltd.’s operating performance is evaluated by our chief operating decision makers, who we have identified as ourco-Chief Executive Officers; how operations are managed by segment managers; and the structure of our internal financial reporting.
Our segments generate revenues primarily from the sale of advertising and sponsorship on our channels. This is supplemented by revenues from cable and satellite television service providers tocarry our channels on their platforms and from revenues through the sale of distribution rights to third parties. Intersegment revenues and profits have been eliminated in consolidation.
We evaluate our consolidated results and the performance of our segments based on net revenues and OIBDA (as defined below). We believe OIBDA is useful to investors because it provides ameaningful representation of our performance as it excludes certain items that either do not impact our cash flows or the operating results of our operations. OIBDA is also used as a componentin determining management bonuses.
OIBDA includes amortization and impairment of program rights and is calculated as operating income / loss before depreciation, amortization of intangible assets, impairments of assets andcertain unusual or infrequent items that are not considered by our chief operating decision makers when evaluating our performance. Stock-based compensation and certain other items are notallocated to our segments for purposes of evaluating their performance and therefore are not included in their respective OIBDA.
18

Index
CENTRAL EUROPEAN MEDIA ENTERPRISES LTD.NOTES TO CONDENSED CONSOLIDATED FINANCIAL STATEMENTS(Tabular amounts in US$ 000’s, except share and per share data)(Unaudited)
Below are tables showing our net revenues, OIBDA, total assets, capital expenditures and long-lived assets for our continuing operations by segment for the three months ended March 31, 2017and 2016 for condensed consolidated statements of operations and comprehensive income / loss data and condensed consolidated statements of cash flow data; and as at March 31, 2017 andDecember 31, 2016 for condensed consolidated balance sheet data.
Net revenues: For the Three Months Ended March 31,
2017 2016
Bulgaria $ 15,305 $ 15,859
Croatia 11,068 11,645
Czech Republic 39,474 38,608
Romania 38,944 32,370
Slovak Republic 18,340 19,062
Slovenia 12,217 11,653
Intersegment revenues (1) (346) (197)
Total net revenues $ 135,002 $ 129,000(1) Reflects revenues earned from the sale of content to our other segments. All other revenues are third party revenues.
OIBDA and reconciliation of OIBDA to condensed consolidated statements of operations and comprehensive income / loss:For the Three Months Ended March 31,
2017 2016
Bulgaria $ 1,357 $ 1,069
Croatia 1,086 1,401
Czech Republic 10,959 10,074
Romania 14,686 9,462
Slovak Republic 873 2,393
Slovenia 3 (708)
Elimination 2 (6)
Total operating segments 28,966 23,685
Corporate (6,830) (6,577)
Total OIBDA 22,136 17,108
Depreciation of property, plant and equipment (7,759) (7,285)
Amortization of broadcast licenses and other intangibles (2,109) (2,060)
Operating income 12,268 7,763
Interest expense (Note 14) (23,755) (49,154)
Non-operating income, net (Note 15) 2,325 1,416
Loss before tax $ (9,162) $ (39,975)
Total assets (1) : March 31, 2017 December 31, 2016
Bulgaria $ 134,424 $ 130,873
Croatia 51,771 49,135
Czech Republic 718,841 700,190
Romania 279,157 266,132
Slovak Republic 131,790 131,220
Slovenia 71,784 72,381
Total operating segments 1,387,767 1,349,931
Corporate 32,513 40,786
Total assets $ 1,420,280 $ 1,390,717(1) Segment assets exclude any intercompany balances.
19

Index
CENTRAL EUROPEAN MEDIA ENTERPRISES LTD.NOTES TO CONDENSED CONSOLIDATED FINANCIAL STATEMENTS(Tabular amounts in US$ 000’s, except share and per share data)(Unaudited)
Capital expenditures: For the Three Months Ended March 31,
2017 2016
Bulgaria $ 133 $ 182
Croatia 555 277
Czech Republic 3,198 1,551
Romania 1,709 1,729
Slovak Republic 465 533
Slovenia 1,071 1,260
Total operating segments 7,131 5,532
Corporate 576 544
Total capital expenditures $ 7,707 $ 6,076
Long-lived assets (1) : March 31, 2017 December 31, 2016
Bulgaria $ 6,152 $ 6,280
Croatia 5,825 5,832
Czech Republic 39,056 39,529
Romania 24,111 22,796
Slovak Republic 15,230 15,326
Slovenia 13,819 14,177
Total operating segments 104,193 103,940
Corporate 4,784 5,149
Total long-lived assets $ 108,977 $ 109,089(1) Reflects property, plant and equipment.
Consolidated revenue by type: For the Three Months Ended March 31,
2017 2016
Television advertising $ 108,514 $ 104,171
Carriage fees and subscriptions 21,383 19,209
Other 5,105 5,620
Total net revenues $ 135,002 $ 129,000
19. COMMITMENTS AND CONTINGENCIES
Commitments
a) Programming Rights Agreements and Other Commitments
At March 31, 2017 , we had total commitments of US$ 121.6 million ( December 31, 2016 : US$ 128.2 million ) in respect of future programming, including contracts signed with licenseperiods starting after the balance sheet date. In addition, we have digital transmission obligations, future minimum operating lease payments for non-cancellable operating leases with remainingterms in excess of one year and other commitments as follows:
Programming purchase
obligations Other
commitments Operating
leases Capital
expenditures
2017 $ 37,213 $ 15,976 $ 2,403 $ 945
2018 36,029 5,372 2,122 —
2019 21,105 10,869 949 —
2020 14,613 375 488 —
2021 8,443 335 333 —
2022 and thereafter 4,182 382 1,453 —
Total $ 121,585 $ 33,309 $ 7,748 $ 945
20

Index
CENTRAL EUROPEAN MEDIA ENTERPRISES LTD.NOTES TO CONDENSED CONSOLIDATED FINANCIAL STATEMENTS(Tabular amounts in US$ 000’s, except share and per share data)(Unaudited)
Contingencies
a) Litigation
We are from time to time party to legal proceedings, arbitrations and regulatory proceedings arising in the normal course of our business operations, including the proceeding described below.We evaluate, on a quarterly basis, developments in such matters and provide accruals for such matters, as appropriate. In making such decisions, we consider the degree of probability of anunfavorable outcome and our ability to make a reasonable estimate of the amount of a loss. An unfavorable outcome in any such proceedings, if material, could have an adverse effect on ourbusiness or consolidated financial statements.
In the fourth quarter of 2016, our Slovak subsidiary MARKIZA-SLOVAKIA, spol. s.r.o. (“Markiza”) was notified of claims that were filed in June 2016 in a court of first instance in Bratislava,the Slovak Republic to collect amounts allegedly owing under four promissory notes. These four promissory notes were purportedly issued in June 2000 by Pavol Rusko in his personal capacityand were purportedly guaranteed by Markiza under the signature of Mr. Rusko, who was an executive director of Markiza at that time as well as one of its shareholders. The notes purport to beissued in favor of Marian Kocner, a controversial Slovak businessman, and to a former associate of Mr. Kocner, and were supposedly assigned several times, ultimately to Sprava a inkasozmeniek, s.r.o., a company owned by Mr. Kocner that is the plaintiff in these proceedings. The four notes purport to be in the aggregate amount of approximately EUR 69.0 million . A court offirst instance in Bratislava has suspended proceedings in respect of one of the promissory notes (in the amount of approximately EUR 26.0 million ) because the plaintiff failed to pay court fees.Two of the remaining notes allegedly matured in 2015 and the third in 2016. Despite a random case assignment system in Slovakia, the three cases dealing with the other notes have all beenassigned to the same judge. We do not believe that any of the promissory notes are authentic and are vigorously defending the claims. We are currently unable to estimate for what amount, ifany, we may be liable if the plaintiff is ultimately successful in pursuing their claims.
b) Other
On April 7, 2017, the largest private company and advertiser in Croatia, Agrokor d.d. ("Agrokor"), entered government administration facing significant liquidity issues. Agrokor has sinceobtained short-term financing and is in the process of obtaining additional long-term liquidity while the Croatian government-appointed administrator determines Agrokor's restructuring plans.As at March 31, 2017, we had receivables related to Agrokor and its group companies totaling US$ 4.3 million . We are currently unable to estimate the timing or impact such restructuring mayhave on our receivables from Agrokor and have not provided for any potential loss as a result of any potential restructuring plans.
20. RELATED PARTY TRANSACTIONS
We consider our related parties to be our officers, directors and shareholders who have direct control and/or influence over the Company as well as other parties that can significantly influencemanagement. We have identified transactions with individuals or entities associated with Time Warner, which is represented on our Board of Directors and holds a 46.7% voting interest inCME Ltd. as at March 31, 2017 , as material related party transactions.
Time Warner
For the Three Months Ended March 31,
2017 2016
Cost of revenues $ 5,737 $ 6,696
Interest expense 18,254 41,505
March 31, 2017 December 31, 2016
Programming liabilities $ 18,522 $ 18,959
Other accounts payable and accrued liabilities 173 192
Accrued interest payable (1) 26,499 9,588
Other non-current liabilities (2) 44,397 44,397(1) Amount represents accrued Guarantee Fees for which we have not yet paid in cash or made an election to pay in kind. See Note 4, "Long-term Debt and Other Financing Arrangements" .(2) Amount represents the Commitment Fee, as well as the Guarantee Fees for which we have made an election to pay in kind. See Note 4, "Long-term Debt and Other Financing
Arrangements" .
21

Index
Item 2. Management's Discussion and Analysis of Financial Condition and Results of Operations
The following defined terms are used in this Quarterly Report on Form 10-Q:
• the term " 2017 PIK Notes " refers to our 15.0% senior secured notes due 2017, redeemed in April 2016;• the term " 2017 Term Loan " refers to our 15.0% term loan facility due 2017, dated as of February 28, 2014, as amended and restated on November 14, 2014, repaid in April 2016;• the term " 2018 Euro Term Loan " refers to CME Ltd.'s floating rate senior unsecured term credit facility due 2018, guaranteed by CME BV and Time Warner, dated as of November
14, 2014 and amended on March 9, 2015 and February 19, 2016;• the term " 2019 Euro Term Loan " refers to CME Ltd.'s floating rate senior unsecured term credit facility due 2019, guaranteed by CME BV and Time Warner, dated as of September
30, 2015 and amended on February 19, 2016;• the term " 2021 Euro Term Loan " refers to CME BV's floating rate senior unsecured term credit facility due 2021, guaranteed by Time Warner and CME Ltd., dated as of February
19, 2016;• the term " Euro Term Loans " refers collectively to the 2018 Euro Term Loan, 2019 Euro Term Loan and 2021 Euro Term Loan;• the term " 2021 Revolving Credit Facility " refers to our amended and restated revolving credit facility dated as of February 28, 2014, as amended and restated as of November 14,
2014 and further amended and restated on February 19, 2016;• the term " Guarantee Fees " refers to amounts accrued and payable to Time Warner as consideration for Time Warner's guarantees of the Euro Term Loans;• the term " Reimbursement Agreement " refers to an agreement with Time Warner which provides that we will reimburse Time Warner for any amounts paid by them under any
guarantee or through any loan purchase right exercised by Time Warner, dated as of November 14, 2014, amended and restated on February 19, 2016 and amended on March 2, 2017;• the term " CME BV " refers to CME Media Enterprises B.V., our 100% owned subsidiary;• the term " CME NV " refers to Central European Media Enterprises N.V., our 100% owned subsidiary;• the term " Time Warner " refers to Time Warner Inc.; and• the term " TW Investor " refers to Time Warner Media Holdings B.V.
The exchange rates used in this report are as at March 31, 2017 , unless otherwise indicated.
Please note that we may announce information using SEC filings, press releases, public conference calls, webcasts and posts to the "Investors" section of our website, www.cme.net . We intendto continue to use these channels to communicate important information about CME Ltd. and our operations. We encourage investors, the media, our customers and others interested in theCompany to review the information we post at www.cme.net .
I. Forward-looking Statements
This report contains forward-looking statements within the meaning of Section 27A of the Securities Act of 1933 and Section 22E of the Securities Exchange Act of 1934 (the "Exchange Act"),including those relating to our capital needs, business strategy, expectations and intentions. Statements that use the terms “believe”, “anticipate”, “trend”, “expect”, “plan”, “estimate”,“forecast”, “should”,“intend” and similar expressions of a future or forward-looking nature identify forward-looking statements for purposes of the U.S. federal securities laws or otherwise.In particular, information appearing under the sections entitled "Business," "Risk Factors" and "Management's Discussion and Analysis of Financial Condition and Results of Operations"includes forward looking-statements. For these statements and all other forward-looking statements, we claim the protection of the safe harbor for forward-looking statements contained in thePrivate Securities Litigation Reform Act of 1995.
Forward-looking statements are inherently subject to risks and uncertainties, many of which cannot be predicted with accuracy or are otherwise beyond our control and some of which mightnot even be anticipated. Forward-looking statements reflect our current views with respect to future events and because our business is subject to such risks and uncertainties, actual results,our strategic plan, our financial position, results of operations and cash flows could differ materially from those described in or contemplated by the forward-looking statements contained inthis report.
Important factors that contribute to such risks include, but are not limited to, those factors set forth under "Risk Factors” as well as the following: the effect of global economic uncertainty andEurozone instability in our markets and the extent, timing and duration of any recovery; levels of television advertising spending and the rate of development of the advertising markets in thecountries in which we operate; the extent to which our liquidity constraints and debt service obligations restrict our business; our exposure to additional tax liabilities as well as liabilitiesresulting from regulatory or legal proceedings initiated against us; our ability to refinance our existing indebtedness; our success in continuing our initiatives to diversify and enhance ourrevenue streams; our ability to make cost-effective investments in our television businesses, including investments in programming; our ability to develop and acquire necessary programmingand attract audiences; and changes in the political and regulatory environments where we operate and in the application of relevant laws and regulations. The foregoing review of importantfactors should not be construed as exhaustive and should be read in conjunction with other cautionary statements that are included in this report. All forward-looking statements speak only asof the date of this report. We undertake no obligation to publicly update or review any forward-looking statements, whether as a result of new information, future developments or otherwise,except as required by law.
22

Index
II. Overview
Central European Media Enterprises Ltd. ("CME Ltd.") is a media and entertainment company operating mainly in six countries in Central and Eastern Europe. We manage our business on ageographical basis, with six operating segments: Bulgaria, Croatia, the Czech Republic, Romania, the Slovak Republic and Slovenia, which are also our reportable segments. These operatingsegments reflect how CME Ltd.’s operating performance is evaluated by our chief operating decision makers, who we have identified as our co-Chief Executive Officers, how our operations aremanaged by segment managers, and the structure of our internal financial reporting.
Non-GAAP Financial Measures
In this report we refer to several non-GAAP financial measures, including OIBDA, OIBDA margin, free cash flow and unlevered free cash flow. We believe that each of these metrics is usefulto investors for the reasons outlined below. Non-GAAP financial measures may not be comparable to similar measures reported by other companies. Non-GAAP financial measures should beevaluated in conjunction with, and are not a substitute for, US GAAP financial measures.
We evaluate our consolidated results and the performance of our segments based on net revenues and OIBDA. We believe OIBDA is useful to investors because it provides a meaningfulrepresentation of our performance, as it excludes certain items that do not impact either our cash flows or the operating results of our operations. OIBDA and unlevered free cash flow are alsoused as components in determining management bonuses.
OIBDA includes amortization and impairment of program rights and is calculated as operating income / loss before depreciation, amortization of intangible assets and impairments of assets andcertain unusual or infrequent items that are not considered by our co-CEOs when evaluating our performance. Stock-based compensation and certain other items are not allocated to oursegments for purposes of evaluating their performance and therefore are not included in their respective OIBDA. Our key performance measure of the efficiency of our consolidated operationsand our segments is OIBDA margin. We define OIBDA margin as the ratio of OIBDA to net revenues.
Following recent refinancing transactions, the amount of interest and related Guarantee Fees on our outstanding indebtedness that must be paid in cash has increased. In addition to thisobligation to pay more interest and related Guarantee Fees in cash, we expect to use cash generated by the business to pay Guarantee Fees that are payable in kind. These cash payments are allreflected in free cash flow; accordingly we believe unlevered free cash flow, defined as free cash flow before cash payments for interest and Guarantee Fees, best illustrates the cash generatedby our operations when comparing periods. We define free cash flow as net cash generated from continuing operating activities less purchases of property, plant and equipment, net of disposalsof property, plant and equipment and excluding the cash impact of certain unusual or infrequent items that are not included in costs charged in arriving at OIBDA because they are notconsidered by our co-CEOs when evaluating performance.
For additional information regarding our business segments, including a reconciliation of OIBDA to US GAAP financial measures, see Item 1, Note 18, "Segment Data" . For a reconciliation offree cash flow and unlevered free cash flow to a US GAAP financial measure, see "Free Cash Flow and Unlevered Free Cash Flow" below.
While our reporting currency is the dollar, our consolidated revenues and costs are divided across a range of European currencies and CME Ltd.’s functional currency is the Euro. Given thesignificant movement of the currencies in the markets in which we operate against the dollar, we believe that it is useful to provide percentage movements based on actual percentagemovements (“% Act”), which includes the effect of foreign exchange, as well as like-for-like percentage movements (“% Lfl”). The like-for-like percentage movement references reflect theimpact of applying the current period average exchange rates to the prior period revenues and costs. Since the difference between like-for-like and actual percentage movements is solely theimpact of movements in foreign exchange rates, our discussion in the following analysis is focused on constant currency percentage movements in order to highlight those factors influencingoperational performance. The incremental impact of foreign exchange rates is presented in the tables preceding such analysis. Unless otherwise stated, all percentage increases or decreases inthe following analysis refer to year-on-year percentage changes between the three months ended March 31, 2017 and 2016 .
Executive Summary
In the first three months of 2017, we improved the competitive positioning of our channel portfolios in nearly all countries and the overall profitability of our operations increased. We alsocompleted a transaction that significantly reduces our debt service obligations, reflecting the continued improvement in the financial results of our operations and underscoring our commitmentto reducing leverage in the business.
The following table provides a summary of our consolidated results for the three months ended March 31, 2017 and 2016:
For the Three Months Ended March 31, (US$ 000's)
Movement
2017 2016 % Act % Lfl
Net revenues $ 135,002 $ 129,000 4.7% 8.1%
Operating income 12,268 7,763 58.0% 68.1%
Operating margin 9.1% 6.0% 3.1 p.p. 3.3 p.p.
OIBDA $ 22,136 $ 17,108 29.4% 35.2%
OIBDA margin 16.4% 13.3% 3.1 p.p. 3.3 p.p.
Our consolidated net revenues improved in the three months ended March 31, 2017 compared to the corresponding period in 2016 due to growth in both television advertising revenues andcarriage fees and subscription revenues. Television advertising spending in the markets of the countries in which we operate grew 9% overall at constant rates in the first three months of 2017compared to 2016. Our television advertising revenues grew 4% at actual rates and 8% at constant rates during the period due to significant year-on-year growth of demand in Romania, as wellas higher levels of spending in the Czech Republic, Bulgaria and Slovenia. Carriage fees and subscription revenues increased 11% at actual rates and 15% at constant rates in the three monthsended March 31, 2017 compared to the corresponding period in 2016 because our channels in the Slovak Republic and Slovenia have been distributed exclusively on cable, satellite and Internetprotocol television ("IPTV") platforms since January of this year, and the number of subscribers to those platforms grew across all countries.
23

Index
Costs charged in arriving at OIBDA increased 1% at actual rates and 4% at constant rates in the three months ended March 31, 2017 compared to the corresponding period in 2016 . Contentcosts increased 5% at constant rates as we made targeted investments in our programming line-up when additional ratings could be monetized and to support the transition in the way ourchannels are distributed in the Slovak Republic and Slovenia. A portion of this additional expense was offset by savings from transmission costs, which contributed to a decrease of 9% in otheroperating costs at constant rates during the quarter.
Since the growth in revenue outpaced the increase in costs, our OIBDA margin in the three months ended March 31, 2017 increased to 16% from 13% in the same period in 2016. This dynamicalso drove an increase in operating income, with a similar improvement in the operating margin. We expect revenues to grow at a faster pace than costs in 2017 and for the next few years,leading to continued OIBDA margin expansion year on year although trends quarter to quarter may vary.
We successfully rolled out our spring schedule, which contributed to an increase in prime time and all day audience shares in five out of six countries during the first quarter of 2017 comparedto the same period in 2016. As local content continues to attract larger audiences, our focus remains on improving our existing titles and developing new and more attractive formats to providemore variety in our program offering in the most profitable manner. As a reflection of this strategy, we introduced additional local content on one of the niche channels in the Czech Republicduring the quarter while rebranding them under the umbrella of our flagship brand, NOVA.
During the quarter, we completed a transaction with Time Warner to reduce, with effect as of March 1, 2017, the Guarantee Fees payable to Time Warner as credit guarantor of our currentlyoutstanding Euro Term Loans. As a result of the transaction:
• Our weighted average borrowing cost immediately decreased 150 basis points to 7.25%.
◦ Immediately reduced the cost of borrowing on the 2018 Euro Term Loan and the 2019 Euro Term Loan each by 125 basis points.
◦ Immediately reduced the cost of borrowing on the 2021 Euro Term Loan by 175 basis points.
• The all-in rate now applicable to all currently outstanding senior term credit facilities automatically improves when we achieve specified decreases in our net leverage ratio and canfall as low as 5.0%.
• Our cost of borrowing will decrease 50 basis points if the total of outstanding senior term credit facilities is reduced below €815 million by September 30, 2018, subject to certainadjustments for specified debt repayments.
• There is a minimum level of cash-pay interest and related Guarantee Fees totaling 5% applicable to all Euro Term Loans.
• We expect at least US$ 30 million of savings from debt service obligations by the end of next year, accelerating our deleveraging strategy, which continue to include plans tosubstantially repay our nearest debt maturity in 2018.
• There were no changes to our existing debt prepayment rights and no changes to the 2021 Revolving Credit Facility.
Free Cash Flow and Unlevered Free Cash Flow
For the Three Months Ended March 31, (US$ 000's)
2017 2016 Movement
Net cash generated from continuing operating activities $ 54,952 $ 39,658 38.6 %
Capital expenditures, net (7,601) (6,076) (25.1)%
Free cash flow 47,351 33,582 41.0 %
Cash paid for interest (including mandatory cash-pay Guarantee Fees) 4,948 2,640 87.4 %
Cash paid for Guarantee Fees that may be paid in kind — 10,000 (100.0)%
Unlevered free cash flow $ 52,299 $ 46,222 13.1 %
(US$ 000's) March 31, 2017 December 31, 2016 Movement
Cash and cash equivalents $ 90,959 $ 43,459 109.3%
Our unlevered free cash flow increased during the first three months of 2017 compared to the same period in 2016 reflecting higher cash collections from revenue growth in the fourth quarter of2016 and lower cash spending on programming. This was partially offset by higher cash paid for income taxes and capital expenditures. A voluntary US$ 10.0 million repayment of accruedGuarantee Fees previously paid in kind in the first quarter of 2016 also reduced free cash flow compared to the first quarter of 2017. This benefit was partially offset by an increase in cash paidfor interest as we were required to pay interest related to the 2021 Euro Term Loan in cash in the first quarter of 2017, while the debt service obligation related to the corresponding debtinstrument outstanding in the first quarter of 2016 was not payable during the period last year.
Following the March 2017 transaction, we are now required to pay a portion of the Guarantee Fees related to all of the Euro Term Loans in cash. However, the total amount of cash paid forinterest and Guarantee Fees is expected to decrease significantly in 2017 due to the lower all-in rate following the repricing transaction completed in March, and non-repeating payments thatwere made in 2016 when we elected to repay accrued Guarantee Fees related to the 2018 Euro Term Loan that were previously paid in kind as well as accrued interest on the 2017 PIK Notesand 2017 Term Loan redeemed in April 2016. As a result, we expect free cash flow to increase significantly in 2017 compared to 2016, and starting in November 2017 we anticipate using allexcess cash to begin making repayments of the principal outstanding on the 2018 Euro Term Loan.
24
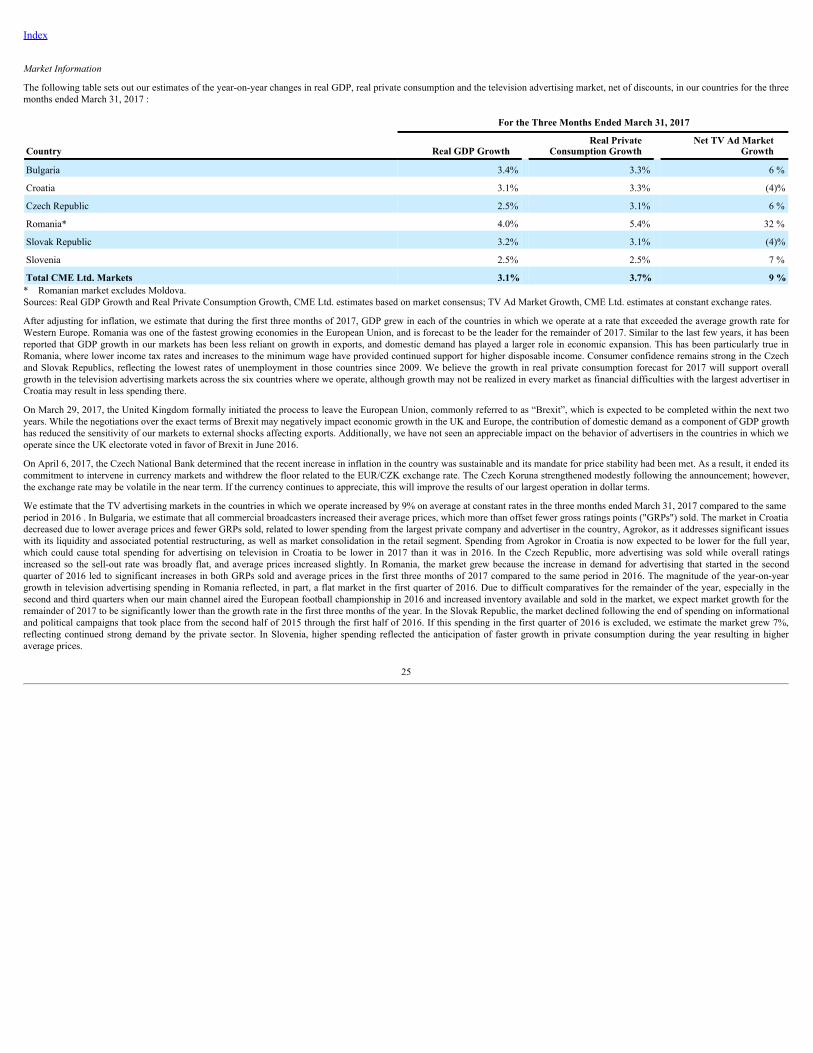
Index
Market Information
The following table sets out our estimates of the year-on-year changes in real GDP, real private consumption and the television advertising market, net of discounts, in our countries for the threemonths ended March 31, 2017 :
For the Three Months Ended March 31, 2017
Country Real GDP Growth Real Private
Consumption Growth Net TV Ad Market
Growth
Bulgaria 3.4% 3.3% 6 %
Croatia 3.1% 3.3% (4)%
Czech Republic 2.5% 3.1% 6 %
Romania* 4.0% 5.4% 32 %
Slovak Republic 3.2% 3.1% (4)%
Slovenia 2.5% 2.5% 7 %
Total CME Ltd. Markets 3.1% 3.7% 9 %* Romanian market excludes Moldova.Sources: Real GDP Growth and Real Private Consumption Growth, CME Ltd. estimates based on market consensus; TV Ad Market Growth, CME Ltd. estimates at constant exchange rates.
After adjusting for inflation, we estimate that during the first three months of 2017, GDP grew in each of the countries in which we operate at a rate that exceeded the average growth rate forWestern Europe. Romania was one of the fastest growing economies in the European Union, and is forecast to be the leader for the remainder of 2017. Similar to the last few years, it has beenreported that GDP growth in our markets has been less reliant on growth in exports, and domestic demand has played a larger role in economic expansion. This has been particularly true inRomania, where lower income tax rates and increases to the minimum wage have provided continued support for higher disposable income. Consumer confidence remains strong in the Czechand Slovak Republics, reflecting the lowest rates of unemployment in those countries since 2009. We believe the growth in real private consumption forecast for 2017 will support overallgrowth in the television advertising markets across the six countries where we operate, although growth may not be realized in every market as financial difficulties with the largest advertiser inCroatia may result in less spending there.
On March 29, 2017, the United Kingdom formally initiated the process to leave the European Union, commonly referred to as “Brexit”, which is expected to be completed within the next twoyears. While the negotiations over the exact terms of Brexit may negatively impact economic growth in the UK and Europe, the contribution of domestic demand as a component of GDP growthhas reduced the sensitivity of our markets to external shocks affecting exports. Additionally, we have not seen an appreciable impact on the behavior of advertisers in the countries in which weoperate since the UK electorate voted in favor of Brexit in June 2016.
On April 6, 2017, the Czech National Bank determined that the recent increase in inflation in the country was sustainable and its mandate for price stability had been met. As a result, it ended itscommitment to intervene in currency markets and withdrew the floor related to the EUR/CZK exchange rate. The Czech Koruna strengthened modestly following the announcement; however,the exchange rate may be volatile in the near term. If the currency continues to appreciate, this will improve the results of our largest operation in dollar terms.
We estimate that the TV advertising markets in the countries in which we operate increased by 9% on average at constant rates in the three months ended March 31, 2017 compared to the sameperiod in 2016 . In Bulgaria, we estimate that all commercial broadcasters increased their average prices, which more than offset fewer gross ratings points ("GRPs") sold. The market in Croatiadecreased due to lower average prices and fewer GRPs sold, related to lower spending from the largest private company and advertiser in the country, Agrokor, as it addresses significant issueswith its liquidity and associated potential restructuring, as well as market consolidation in the retail segment. Spending from Agrokor in Croatia is now expected to be lower for the full year,which could cause total spending for advertising on television in Croatia to be lower in 2017 than it was in 2016. In the Czech Republic, more advertising was sold while overall ratingsincreased so the sell-out rate was broadly flat, and average prices increased slightly. In Romania, the market grew because the increase in demand for advertising that started in the secondquarter of 2016 led to significant increases in both GRPs sold and average prices in the first three months of 2017 compared to the same period in 2016. The magnitude of the year-on-yeargrowth in television advertising spending in Romania reflected, in part, a flat market in the first quarter of 2016. Due to difficult comparatives for the remainder of the year, especially in thesecond and third quarters when our main channel aired the European football championship in 2016 and increased inventory available and sold in the market, we expect market growth for theremainder of 2017 to be significantly lower than the growth rate in the first three months of the year. In the Slovak Republic, the market declined following the end of spending on informationaland political campaigns that took place from the second half of 2015 through the first half of 2016. If this spending in the first quarter of 2016 is excluded, we estimate the market grew 7%,reflecting continued strong demand by the private sector. In Slovenia, higher spending reflected the anticipation of faster growth in private consumption during the year resulting in higheraverage prices.
25

Index
Segment Performance
Our total Net Revenues and OIBDA by segment were as follows:
NET REVENUES
For the Three Months Ended March 31, (US$ 000's)
Movement
2017 2016 % Act % Lfl
Bulgaria $ 15,305 $ 15,859 (3.5)% (0.4)%
Croatia 11,068 11,645 (5.0)% (3.3)%
Czech Republic 39,474 38,608 2.2 % 5.5 %
Romania 38,944 32,370 20.3 % 25.1 %
Slovak Republic 18,340 19,062 (3.8)% (0.7)%
Slovenia 12,217 11,653 4.8 % 8.3 %
Intersegment revenues (346) (197) NM (1) NM (1)
Total net revenues $ 135,002 $ 129,000 4.7 % 8.1 %(1) Number is not meaningful.
OIBDA
For the Three Months Ended March 31, (US$ 000's)
Movement
2017 2016 % Act % Lfl
Bulgaria $ 1,357 $ 1,069 26.9 % 31.6 %
Croatia 1,086 1,401 (22.5)% (21.1)%
Czech Republic 10,959 10,074 8.8 % 12.7 %
Romania 14,686 9,462 55.2 % 62.0 %
Slovak Republic 873 2,393 (63.5)% (62.1)%
Slovenia 3 (708) NM (1) NM (1)
Eliminations 2 (6) NM (1) NM (1)
Total operating segments 28,966 23,685 22.3 % 27.0 %
Corporate (6,830) (6,577) (3.8)% (6.1)%
Consolidated OIBDA $ 22,136 $ 17,108 29.4 % 35.2 %(1) Number is not meaningful.
26

Index
Bulgaria
For the Three Months Ended March 31, (US$ 000's)
Movement
2017 2016 % Act % Lfl
Television advertising $ 9,769 $ 9,964 (2.0)% 1.3 %
Carriage fees and subscriptions 4,673 4,571 2.2 % 5.4 %
Other 863 1,324 (34.8)% (32.8)%
Net revenues 15,305 15,859 (3.5)% (0.4)%
Costs charged in arriving at OIBDA 13,948 14,790 (5.7)% (2.7)%
OIBDA $ 1,357 $ 1,069 26.9 % 31.6 %
OIBDA margin 8.9% 6.7% 2.2 p.p. 2.2 p.p.
The television advertising market in Bulgaria increased an estimated 6% at constant rates in the three months ended March 31, 2017 compared to the same period in 2016.
Our television advertising revenues increased at constant rates in the first quarter of 2017 compared to the same period in 2016 due to higher prices in our sales policy for the year, which morethan offset a reduction in the volume of GRPs sold. Carriage fees and subscription revenues increased due to an increase in the number of reported subscribers.
On a constant currency basis, costs charged in arriving at OIBDA decreased in the first quarter of 2017 compared to the same period of 2016, as content costs declined 2% primarily due tosavings in foreign fiction since we aired more cost effective titles because our line-up of local content increased ratings during the period and improved both all day and prime time audienceshare.
Croatia
For the Three Months Ended March 31, (US$ 000's)
Movement
2017 2016 % Act % Lfl
Television advertising $ 9,554 $ 10,072 (5.1)% (3.5)%
Carriage fees and subscriptions 824 624 32.1 % 34.2 %
Other 690 949 (27.3)% (25.9)%
Net revenues 11,068 11,645 (5.0)% (3.3)%
Costs charged in arriving at OIBDA 9,982 10,244 (2.6)% (0.8)%
OIBDA $ 1,086 $ 1,401 (22.5)% (21.1)%
OIBDA margin 9.8% 12.0% (2.2) p.p. (2.2) p.p.
The television advertising market in Croatia declined an estimated 4% at constant rates in the three months ended March 31, 2017 compared to the same period in 2016.
Our television advertising revenues decreased at constant rates during the three months ended March 31, 2017 compared to 2016 due to lower average prices and fewer GRPs sold, related tolower spending from the largest private company and advertiser in the country, Agrokor, as it addresses significant issues with its liquidity and associated potential restructuring, as well asmarket consolidation in the retail segment.
Costs charged in arriving at OIBDA decreased on a constant currency basis in the first quarter of 2017 due to savings in foreign programming as well as a later start to certain local programmingin the spring season compared to 2016.
27

Index
Czech Republic
For the Three Months Ended March 31, (US$ 000's)
Movement
2017 2016 % Act % Lfl
Television advertising $ 35,107 $ 34,790 0.9 % 4.1%
Carriage fees and subscriptions 2,639 2,527 4.4 % 7.6%
Other 1,728 1,291 33.8 % 38.1%
Net revenues 39,474 38,608 2.2 % 5.5%
Costs charged in arriving at OIBDA 28,515 28,534 (0.1)% 2.9%
OIBDA $ 10,959 $ 10,074 8.8 % 12.7%
OIBDA margin 27.8% 26.1% 1.7 p.p. 1.8 p.p.
The television advertising market in the Czech Republic increased an estimated 6% at constant rates in the three months ended March 31, 2017 compared to the same period in 2016.
Television advertising revenues increased at constant rates in the first three months of 2017 compared to the same period in 2016 because lower ratings from our closest competition increaseddemand for available inventory and we sold more GRPs at slightly higher average prices reflecting the seasonality coefficient adjustment made to our sales policy. Carriage fees and subscriptionrevenues increased on a constant currency basis due to an agreement for high definition versions of our channels that became effective subsequent to the first quarter of 2016.
Costs charged in arriving at OIBDA increased on a constant currency basis in the first quarter primarily due to a 3% increase in content costs, as the mix of programming shifted to reality andentertainment formats. This was partially offset by a decrease in costs for foreign content and local fiction. During the quarter, we rebranded our niche channels in the Czech Republic to alignthem under the umbrella of our flagship brand, NOVA, which also resulted in higher costs due to the introduction of additional local content on one of these channels as well as additionalmarketing activities around this change.
Romania
For the Three Months Ended March 31, (US$ 000's)
Movement
2017 2016 % Act % Lfl
Television advertising $ 28,124 $ 21,696 29.6% 35.0%
Carriage fees and subscriptions 10,063 9,986 0.8% 4.6%
Other 757 688 10.0% 14.4%
Net revenues 38,944 32,370 20.3% 25.1%
Costs charged in arriving at OIBDA 24,258 22,908 5.9% 10.0%
OIBDA $ 14,686 $ 9,462 55.2% 62.0%
OIBDA margin 37.7% 29.2% 8.5 p.p. 8.6 p.p.
The television advertising market in Romania increased an estimated 32% at constant rates in the three months ended March 31, 2017 compared to the same period in 2016.
Our television advertising revenues increased in the first quarter of 2017 compared to the same period in 2016 because the increase in demand for advertising that started in the second quarter of2016 led to significant increases in both the volume of GRPs sold and average prices in the first three months of this year. The magnitude of the year-on-year growth in television advertisingspending in Romania reflected, in part, a flat market in the first quarter of 2016. Due to difficult comparatives for the remainder of the year, especially in the second and third quarters when ourmain channel aired the European football championship in 2016 and increased inventory available and sold, we expect revenue growth for the remainder of 2017 to be significantly lower thanthe growth rate in the first three months of the year. Carriage fees and subscription revenues grew on a constant currency basis during the quarter due to an increase in the number of subscribers.
Costs charged in arriving at OIBDA increased at constant rates during the first quarter primarily due to a 12% increase in content costs, as we invested more in local productions of popularentertainment formats, which contributed to record ratings for our main channel in the month of March. There was also an increase in advertising expense due to an earlier start of marketingactivities around our spring schedule. These expenses were partially offset by lower transmission costs.
28

Index
Slovak Republic
For the Three Months Ended March 31, (US$ 000's)
Movement
2017 2016 % Act % Lfl
Television advertising $ 16,053 $ 17,845 (10.0)% (7.1)%
Carriage fees and subscriptions 1,511 317 NM (1) NM (1)
Other 776 900 (13.8)% (11.1)%
Net revenues 18,340 19,062 (3.8)% (0.7)%
Costs charged in arriving at OIBDA 17,467 16,669 4.8 % 8.1 %
OIBDA $ 873 $ 2,393 (63.5)% (62.1)%
OIBDA margin 4.8% 12.6% (7.8) p.p. (7.7) p.p.(1) Number is not meaningful.
The television advertising market in the Slovak Republic decreased an estimated 4% at constant rates in the three months ended March 31, 2017 compared to the same period in 2016.
Our television advertising revenues decreased on a constant currency basis during the first quarter of 2017 compared to the same period in 2016 following the end of spending on informationaland political campaigns that took place from the second half of 2015 through the first half of 2016. If this spending in the first quarter of 2016 is excluded, our television advertising revenuesincreased 1%, which was slower than the market because our channels have been distributed exclusively on cable, satellite and IPTV platforms in the country since January of this year.However, this change in the way our channels are distributed resulted in a significant increase in carriage fees and subscriptions revenue and a cost reduction from significantly lowertransmission costs. During the remainder of 2017 we anticipate reduced pressure on our ratings and additional carriage fees and subscriptions revenue relative to the first quarter of 2017 asadditional households transition to cable, satellite and IPTV platforms and we agree new distribution contracts with the remaining smaller operators.
On a constant currency basis, costs charged in arriving at OIBDA increased during the first quarter primarily due to a 19% increase in content costs as we made targeted adjustments in theprogramming line-up during the change in the way our channels are distributed. There were also additional expenses related to increased marketing activities during this transition.
Slovenia
For the Three Months Ended March 31, (US$ 000's)
Movement
2017 2016 % Act % Lfl
Television advertising $ 9,907 $ 9,804 1.1 % 4.4 %
Carriage fees and subscriptions 1,673 1,184 41.3 % 45.7 %
Other 637 665 (4.2)% (1.1)%
Net revenues 12,217 11,653 4.8 % 8.3 %
Costs charged in arriving at OIBDA 12,214 12,361 (1.2)% 2.1 %
OIBDA $ 3 $ (708) NM (1) NM (1)
OIBDA margin 0.0% (6.1)% 6.1 p.p. 6.1 p.p.(1) Number is not meaningful.
The television advertising market in Slovenia increased an estimated 7% at constant rates in the three months ended March 31, 2017 compared to the same period in 2016.
Our television advertising revenues increased at constant rates during the quarter reflecting price inflation from strong demand, which more than offset a decline in the volume of GRPs sold.Carriage fees and subscription revenues increased significantly due to new agreements with cable, satellite and IPTV operators because our channels in the country have been distributedexclusively on those platforms since January of this year. During the remainder of 2017 we anticipate additional carriage fees and subscription revenues relative to the first quarter of 2017 dueto growth in subscribers and new contracts with certain platform operators that become effective in the second quarter.
On a constant currency basis, costs charged in arriving at OIBDA increased during the quarter primarily due to an increase in content costs from more popular foreign titles aired during thechange in the way our channels are distributed, as well as other costs associated with this transition. This was partially offset by lower costs for entertainment programming.
29

Index
III. Analysis of the Results of Operations and Financial Position
For the Three Months Ended March 31, (US$ 000's)
Movement
2017 2016 % Act % Lfl
Revenue:
Television advertising $ 108,514 $ 104,171 4.2 % 7.6 %
Carriage fees and subscriptions 21,383 19,209 11.3 % 15.1 %
Other revenue 5,105 5,620 (9.2)% (6.4)%
Net Revenues 135,002 129,000 4.7 % 8.1 %
Operating expenses:
Content costs 73,402 71,978 2.0 % 5.3 %
Other operating costs 14,556 16,454 (11.5)% (9.0)%
Depreciation of property, plant and equipment 7,759 7,285 6.5 % 9.7 %
Amortization of broadcast licenses and other intangibles 2,109 2,060 2.4 % 5.5 %
Cost of revenues 97,826 97,777 0.1 % 3.2 %
Selling, general and administrative expenses 24,908 23,460 6.2 % 9.0 %
Operating income $ 12,268 $ 7,763 58.0 % 68.1 %
Revenue:
Television advertising revenues: We estimate television advertising spending in our markets grew on average by 9% at constant rates in the three months ended March 31, 2017 as compared tothe same period in 2016, positively impacting our television advertising revenues. See "Overview - Segment Performance" above for additional information on television advertising revenuesfor each of our operating countries.
Carriage fees and subscriptions: Carriage fees and subscriptions revenue increased during the three months ended March 31, 2017 , as compared to the same period in 2016 , primarily in theSlovak Republic and Slovenia as our channels in those countries are exclusively available on cable, satellite and IPTV platforms from January 2017. See "Overview - Segment Performance"above for additional information on carriage fees and subscription revenues for each of our operating countries.
Other revenues: Other revenues include primarily internet advertising revenues and revenues generated through the licensing of our own productions. Other revenues decreased in the threemonths ended March 31, 2017 compared to the same period in 2016 due to lower performance of our theatrical distribution business in Bulgaria.
Operating Expenses:
Content costs: Content costs (including production costs and amortization and impairment of program rights) increased during the three months ended March 31, 2017 compared to the sameperiod in 2016 . The increase is primarily due to more hours of local productions in our broadcast schedules in the first quarter of 2017 than in the first quarter of 2016, particularly in the CzechRepublic and Romania.
Other operating costs: Other operating costs (excluding content costs, depreciation of property, plant and equipment, amortization of broadcast licenses and other intangibles as well as selling,general and administrative expenses) decreased during the three months ended March 31, 2017 compared to the same period in 2016 , primarily due to cost savings in Slovakia following ourdecision not to renew our contract for the terrestrial distribution of our channels there.
Depreciation of property, plant and equipment: Total depreciation of property, plant and equipment increased during the three months ended March 31, 2017 compared to the same period in2016 primarily due to depreciation on production and technical equipment placed in service.
Amortization of broadcast licenses and other intangibles: Total amortization of broadcast licenses and other intangibles increased during the three months ended March 31, 2017 compared tothe same period in 2016 . The increase is due to higher amortization expense for certain of our trademarks in the Czech Republic.
Selling, general and administrative expenses: Selling, general and administrative expenses increased during the three months ended March 31, 2017 compared to the same period in 2016primarily due to increased staff-related costs associated with the replacement of our segment management team in Bulgaria.
Selling, general and administrative expenses for three months ended March 31, 2017 and 2016 also includes charges in respect of non-cash stock-based compensation (see Item 1, Note 16,"Stock-based Compensation" ). The charge for stock-based compensation expense in 2017 was consistent with the charge in 2016.
Operating income : The increase in operating income during the three months ended March 31, 2017 compared to 2016 resulted from increases from television advertising and carriage feerevenues, which outpaced the increase in cost of revenues. Our operating margin, which is determined as operating income / loss divided by net revenues, was 9% for the three months endedMarch 31, 2017 compared to 6% for the three months ended March 31, 2016 .
30

Index
Other income / expense:
For the Three Months Ended March 31, (US$ 000's)
2017 2016 % Act
Interest expense $ (23,755) $ (49,154) 51.7 %
Non-operating income / (expense):
Interest income 79 108 (26.9)%
Foreign currency exchange gain, net 1,681 15,422 (89.1)%
Change in fair value of derivatives 368 (14,050) NM (1)
Other income / (expense), net 197 (64) NM (1)
Provision for income taxes (2,112) (719) (193.7)%
Net loss attributable to noncontrolling interests 209 259 (19.3)%
Other comprehensive income
Currency translation adjustment, net 2,072 19,058 (89.1)%
Gain / (loss) on derivative instruments 1,258 (1,248) NM (1)
(1) Number is not meaningful.
Interest expense: Interest expense during the three months ended March 31, 2017 decreased compared to the three months ended March 31, 2016 primarily due to lower amortization of debtdiscount and issuance costs following the extinguishment of the 2017 PIK Notes and 2017 Term Loan in April 2016 and due to a lower effective interest rate on the replacement facility. Wealso realized interest expense savings as a result of the transaction entered into with Time Warner during the first quarter of 2017. See Item 1, Note 4, "Long-term Debt and Other FinancingArrangements" .
Interest income: Interest income primarily reflects earnings on cash balances.
Foreign currency exchange gain, net : We are exposed to fluctuations in foreign exchange rates on the revaluation of monetary assets and liabilities denominated in currencies other than thelocal functional currency of the relevant subsidiary. This includes third party receivables and payables, as well as certain of our intercompany loans which are not considered of a long-terminvestment nature. Our subsidiaries generally receive funding via loans that are denominated in currencies other than the dollar, and any change in the relevant exchange rate will require us torecognize a transaction gain or loss on revaluation. Certain of our intercompany loans are classified as long-term in nature, and therefore gains or losses on revaluation are not recorded throughthe statement of operations and comprehensive income / loss. See the discussion under "Currency translation adjustment, net" below.
During the three months ended March 31, 2017 , we recognized a net gain of US$ 1.7 million comprised of transaction gains of US$ 0.7 million relating to the revaluation of intercompanyloans, transaction gains of approximately US$ 0.1 million on our long-term debt and other financing arrangements and transaction gains of US$ 0.9 million relating to the revaluation ofmonetary assets and liabilities denominated in currencies other than the local functional currency of the relevant subsidiary.
During the three months ended March 31, 2016 , we recognized a net gain of US$ 15.4 million comprised of transaction gains of US$ 38.1 million relating to the revaluation of intercompanyloans, transaction losses of approximately US$ 24.3 million on our long-term debt and other financing arrangements and transaction gains of US$ 1.6 million relating to the revaluation ofmonetary assets and liabilities denominated in currencies other than the local functional currency of the relevant subsidiary.
Change in fair value of derivatives: During the three months ended March 31, 2017 , we recognized gains as a result of the change in the fair value of our USD/EUR foreign currency forwardcontracts entered into on January 31, 2017. During the three months ended March 31, 2016 , we recognized losses as a result of the change in the fair value of certain USD/EUR foreigncurrency forward contracts which matured in 2016. See Item 1, Note 11, "Financial Instruments and Fair Value Measurements" .
Other income / (expense), net : Our other income / expense, net during the three months ended March 31, 2017 and 2016 was not material.
Provision for income taxes : The provision for income taxes for the three months ended March 31, 2017 reflects losses on which no tax benefit has been received and an income tax charge onprofits in Romania. The provision for income taxes for the three months ended March 31, 2016 reflects losses on which no tax benefit has been received and a deferred tax charge on profits inRomania.
Our subsidiaries are subject to income taxes at statutory rates ranging from 10.0% in Bulgaria to 21.0% in the Slovak Republic.
Net loss attributable to noncontrolling interests: The results attributable to noncontrolling interests for the three months ended March 31, 2017 and 2016 primarily relates to thenoncontrolling interest share of our Bulgaria operations.
Currency translation adjustment, net: The underlying equity value of our investments (which are denominated in the functional currency of the relevant entity) are converted into dollars ateach balance sheet date, with any change in value of the underlying assets and liabilities being recorded as a currency translation adjustment to the balance sheet rather than net income / loss.
In the three months ended March 31, 2017 , we recognized other comprehensive income of US$ 2.1 million compared to other comprehensive income of US$ 19.1 million during the threemonths ended March 31, 2016 . Included in these amounts are foreign exchange gains and losses on the retranslation of certain of our intercompany loans which are considered to be of a long-term investment nature, and as such, are included in accumulated other comprehensive income / loss, a component of shareholders' equity. For the three months ended March 31, 2017 and 2016, we recognized gains of US$ 0.8 million and US$ 9.5 million , respectively, in accumulated other comprehensive income / loss.
31
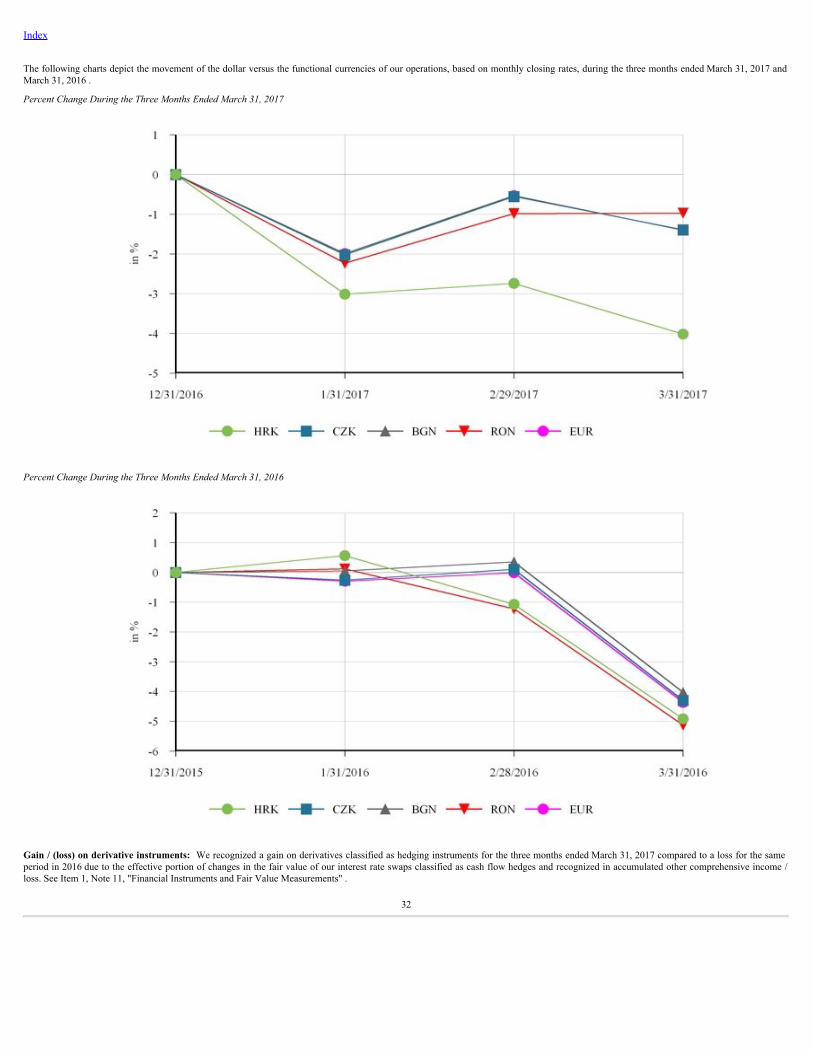
Index
The following charts depict the movement of the dollar versus the functional currencies of our operations, based on monthly closing rates, during the three months ended March 31, 2017 andMarch 31, 2016 .
Percent Change During the Three Months Ended March 31, 2017
Percent Change During the Three Months Ended March 31, 2016
Gain / (loss) on derivative instruments: We recognized a gain on derivatives classified as hedging instruments for the three months ended March 31, 2017 compared to a loss for the sameperiod in 2016 due to the effective portion of changes in the fair value of our interest rate swaps classified as cash flow hedges and recognized in accumulated other comprehensive income /loss. See Item 1, Note 11, "Financial Instruments and Fair Value Measurements" .
32

Index
Condensed consolidated balance sheets as at March 31, 2017 and December 31, 2016 :
Condensed Consolidated Balance Sheet (US$ 000’s)
March 31, 2017 December 31, 2016 % Act
Current assets $ 357,974 $ 340,420 5.2 %
Non-current assets 1,062,306 1,050,297 1.1 %
Current liabilities 194,420 171,564 13.3 %
Non-current liabilities 1,084,340 1,070,786 1.3 %
Temporary equity 257,256 254,899 0.9 %
CME Ltd. shareholders’ deficit (116,707) (107,804) (8.3)%
Noncontrolling interests in consolidated subsidiaries 971 1,272 (23.7)%
Note: The analysis below is intended to highlight the key factors that led to the movements from December 31, 2016 , excluding the impact of foreign currency translation.
Current assets: Current assets at March 31, 2017 increased compared to December 31, 2016 primarily due to higher cash balances from the collection of receivables which was partly offset bylower receivables from the trailing quarter revenues due to seasonality.
Non-current assets: Excluding the effects of foreign currency translation, non-current assets at March 31, 2017 decreased compared to December 31, 2016 primarily due to depreciation onproperty, plant and equipment as well as amortization of intangible assets and debt issuance costs associated with our 2021 Revolving Credit Facility.
Current liabilities: Current liabilities at March 31, 2017 increased compared to December 31, 2016 . The increase is primarily due customer advances on their 2017 advertising campaigns andaccrued Guarantee Fees which are not yet payable, whether in cash or in kind.
Non-current liabilities: Excluding the effects of foreign currency translation, non-current liabilities at March 31, 2017 decreased slightly compared to December 31, 2016 , primarily due togains on the change in fair value of derivatives that are accounted for as hedging instruments for our 2019 Euro Term Loan and 2021 Euro Term Loan.
Temporary equity: Temporary equity at March 31, 2017 increased compared to December 31, 2016 , due to the accretion on the Series B Preferred Shares.
CME Ltd. shareholders’ deficit : CME Ltd. shareholders’ deficit increased compared to December 31, 2016 . This primarily reflects the net loss attributable to CME Ltd., a decrease inaccumulated other comprehensive loss due to currency translation adjustments during the three months ended March 31, 2017 and accretion of the preferred dividend paid in kind on our SeriesB Preferred Shares.
Noncontrolling interests in consolidated subsidiaries: Noncontrolling interests in consolidated subsidiaries at March 31, 2017 decreased compared to December 31, 2016 , due to the net lossattributable to the noncontrolling interest in Bulgaria.
IV. Liquidity and Capital Resources
IV (a) Summary of Cash Flows
Cash and cash equivalents increased by US$ 47.5 million during the three months ended March 31, 2017 . The change in cash and cash equivalents for the periods presented below issummarized as follows:
For the Three Months Ended March 31, (US$ 000's)
2017 2016
Net cash generated from continuing operating activities $ 54,952 $ 39,658
Net cash used in continuing investing activities (7,601) (6,076)
Net cash used in continuing financing activities (93) (682)
Net cash provided by discontinued operations 160 328
Impact of exchange rate fluctuations on cash and cash equivalents 82 3,512
Net increase in cash and cash equivalents $ 47,500 $ 36,740
Operating Activities
Cash generated from continuing operations during the three months ended March 31, 2017 was US$ 55.0 million compared to US$ 39.7 million for the three months ended March 31, 2016 . Theincrease compared to the prior period reflects lower payments in 2017 for accrued Guarantee Fees as we had elected to repay US$ 10.0 million of accrued Guarantee Fees in 2016 which werepreviously paid in kind. The increase also reflects higher cash collections from revenue growth in the fourth quarter of 2016 (compared to the same period in 2015) and lower spending onprogramming, which are partly offset by higher cash paid for interest and for taxes in 2017. We paid cash interest (including mandatory cash-pay Guarantee Fees) of US$ 4.9 million during thethree months ended March 31, 2017 compared to US$ 2.6 million during the three months ended March 31, 2016 .
Investing Activities
Our net cash used in continuing investing activities of US$ 7.6 million and US$ 6.1 million for the three months ended March 31, 2017 and 2016 , respectively, related to capital expenditures.
33
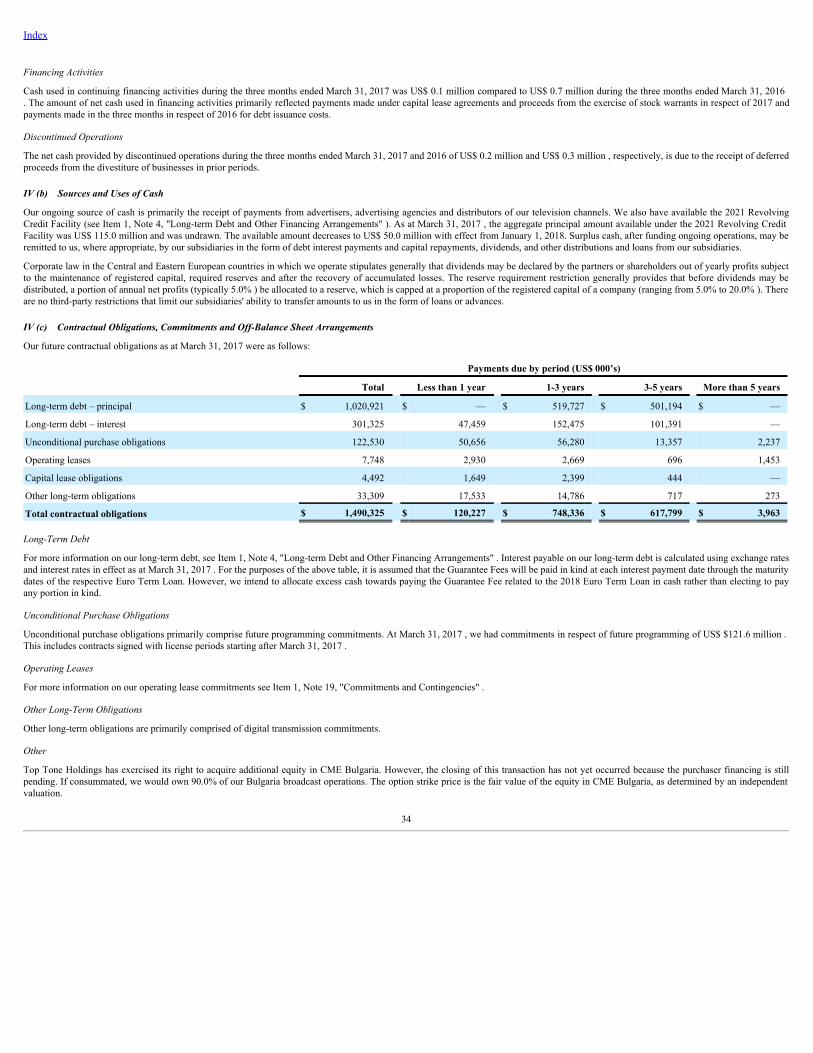
Index
Financing Activities
Cash used in continuing financing activities during the three months ended March 31, 2017 was US$ 0.1 million compared to US$ 0.7 million during the three months ended March 31, 2016. The amount of net cash used in financing activities primarily reflected payments made under capital lease agreements and proceeds from the exercise of stock warrants in respect of 2017 andpayments made in the three months in respect of 2016 for debt issuance costs.
Discontinued Operations
The net cash provided by discontinued operations during the three months ended March 31, 2017 and 2016 of US$ 0.2 million and US$ 0.3 million , respectively, is due to the receipt of deferredproceeds from the divestiture of businesses in prior periods.
IV (b) Sources and Uses of Cash
Our ongoing source of cash is primarily the receipt of payments from advertisers, advertising agencies and distributors of our television channels. We also have available the 2021 RevolvingCredit Facility (see Item 1, Note 4, "Long-term Debt and Other Financing Arrangements" ). As at March 31, 2017 , the aggregate principal amount available under the 2021 Revolving CreditFacility was US$ 115.0 million and was undrawn. The available amount decreases to US$ 50.0 million with effect from January 1, 2018. Surplus cash, after funding ongoing operations, may beremitted to us, where appropriate, by our subsidiaries in the form of debt interest payments and capital repayments, dividends, and other distributions and loans from our subsidiaries.
Corporate law in the Central and Eastern European countries in which we operate stipulates generally that dividends may be declared by the partners or shareholders out of yearly profits subjectto the maintenance of registered capital, required reserves and after the recovery of accumulated losses. The reserve requirement restriction generally provides that before dividends may bedistributed, a portion of annual net profits (typically 5.0% ) be allocated to a reserve, which is capped at a proportion of the registered capital of a company (ranging from 5.0% to 20.0% ). Thereare no third-party restrictions that limit our subsidiaries' ability to transfer amounts to us in the form of loans or advances.
IV (c) Contractual Obligations, Commitments and Off-Balance Sheet Arrangements
Our future contractual obligations as at March 31, 2017 were as follows:
Payments due by period (US$ 000’s)
Total Less than 1 year 1-3 years 3-5 years More than 5 years
Long-term debt – principal $ 1,020,921 $ — $ 519,727 $ 501,194 $ —
Long-term debt – interest 301,325 47,459 152,475 101,391 —
Unconditional purchase obligations 122,530 50,656 56,280 13,357 2,237
Operating leases 7,748 2,930 2,669 696 1,453
Capital lease obligations 4,492 1,649 2,399 444 —
Other long-term obligations 33,309 17,533 14,786 717 273
Total contractual obligations $ 1,490,325 $ 120,227 $ 748,336 $ 617,799 $ 3,963
Long-Term Debt
For more information on our long-term debt, see Item 1, Note 4, "Long-term Debt and Other Financing Arrangements" . Interest payable on our long-term debt is calculated using exchange ratesand interest rates in effect as at March 31, 2017 . For the purposes of the above table, it is assumed that the Guarantee Fees will be paid in kind at each interest payment date through the maturitydates of the respective Euro Term Loan. However, we intend to allocate excess cash towards paying the Guarantee Fee related to the 2018 Euro Term Loan in cash rather than electing to payany portion in kind.
Unconditional Purchase Obligations
Unconditional purchase obligations primarily comprise future programming commitments. At March 31, 2017 , we had commitments in respect of future programming of US$ $121.6 million .This includes contracts signed with license periods starting after March 31, 2017 .
Operating Leases
For more information on our operating lease commitments see Item 1, Note 19, "Commitments and Contingencies" .
Other Long-Term Obligations
Other long-term obligations are primarily comprised of digital transmission commitments.
Other
Top Tone Holdings has exercised its right to acquire additional equity in CME Bulgaria. However, the closing of this transaction has not yet occurred because the purchaser financing is stillpending. If consummated, we would own 90.0% of our Bulgaria broadcast operations. The option strike price is the fair value of the equity in CME Bulgaria, as determined by an independentvaluation.
34

Index
IV (d) Cash Outlook
Because cash flows from operating activities were negative from 2012 to 2014, we relied on equity and debt financings to ensure adequate funding for our operations. While cash flows fromoperating activities were positive in 2015 and 2016, our election to pay certain interest and Guarantee Fees in kind increased our leverage. The financing transactions concluded in 2016 and2017 significantly lowered our cost of borrowing.
Following the repricing transaction in March 2017, we are now required to pay a portion of the Guarantee Fees related to all of the Euro Term Loans in cash. However, the total amount of cashpaid for interest and Guarantee Fees is expected to decrease significantly in 2017 due to the lower all-in rate following this repricing transaction, and non-repeating payments that were made in2016 when we elected to repay accrued Guarantee Fees related to the 2018 Euro Term Loan that were previously paid in kind as well as accrued interest on the 2017 PIK Notes and 2017 TermLoan redeemed in April 2016.
Furthermore, we have repaid previously accrued Guarantee Fees related to the 2018 Euro Term Loan and intend to continue to make payments of such Guarantee Fees in cash when due, ratherthan electing to pay in kind. However, we expect improvements in cash flows before interest and Guarantee Fees to offset these increases, and therefore expect free cash flow to increase in 2017compared to 2016.
Beginning in November 2017, we anticipate using excess cash, including expected proceeds from the exercise of warrants, to begin making repayments of the principal outstanding on the 2018Euro Term Loan with the intention of substantially repaying that loan when it matures in November 2018. We believe we have adequate cash resources to continue operating as a going concern.
Credit ratings and future debt issuances
Our corporate credit is rated B2 by Moody's Investors Service and B+ by Standard & Poor's, both with stable outlook. Ratings agencies have indicated that retention of these ratings is dependenton maintaining an adequate liquidity profile. If we fail to meet this liquidity parameter, it is likely that the rating agencies will downgrade us. The availability of additional liquidity is dependentupon our continued operating performance, improved financial performance and credit ratings. We are currently able to raise only a limited amount of additional debt (other than refinancingindebtedness) or under the agreement governing the 2021 Revolving Credit Facility and the Reimbursement Agreement.
Credit risk of financial counterparties
We have entered into a number of significant contracts with financial counterparties as follows:
Interest Rate Swaps
We are party to interest rate swap agreements to mitigate our exposure to interest rate fluctuations on our Euro Term Loans. These interest rate swaps, designated as cash flow hedges, providethe Company with variable-rate cash receipts in exchange for fixed-rate payments over the lives of the agreements, with no exchange of the underlying notional amount.
Foreign Exchange Forwards
We are exposed to movements in the USD to EUR exchange rates related to contractual payments under dollar-denominated agreements. To reduce this exposure, from time to time we enterinto pay-Euro receive-dollar forward foreign exchange contracts. As at March 31, 2017 , we had outstanding one forward foreign exchange contract with an aggregate notional amount ofapproximately US$ 19.3 million related to contractual operating payments.
Cash Deposits
We deposit cash in the global money markets with a range of bank counterparties and review the counterparties we choose weekly. The maximum period of deposit is three months but we havemore recently held amounts on deposit for shorter periods, from overnight to one month. The credit rating of a bank is a critical factor in determining the size of cash deposits and we will onlydeposit cash with banks of an investment rating of A or A3 or higher. In addition we also closely monitor the credit default swap spreads and other market information for each of the banks withwhich we consider depositing or have deposited funds.
IV (e) Off-Balance Sheet Arrangements
None.
V. Critical Accounting Policies and Estimates
Our accounting policies that have a material effect on our financial condition and results of operations are more fully described in Part II, Item 8 of our Annual Report on Form 10-K for the yearended December 31, 2016 filed with the Securities and Exchange Commission ("SEC") on February 9, 2017 . The preparation of these financial statements requires us to make judgments inselecting appropriate assumptions for calculating financial estimates, which inherently contain some degree of uncertainty. We base our estimates on historical experience and on various otherassumptions that we believe to be reasonable. Using these estimates we make judgments about the carrying values of assets and liabilities and the reported amounts of revenues and expensesthat are not readily apparent from other sources. Actual results may differ from these estimates under different assumptions or conditions.
We believe our critical accounting policies are as follows: program rights, goodwill and intangible assets, impairment or disposal of long-lived assets, revenue recognition, income taxes, foreignexchange, determination of the fair value of financial instruments, contingencies and discontinued operations. These critical accounting policies affect our more significant judgments andestimates used in the preparation of our condensed consolidated financial statements. See Item 1, Note 2, "Basis of Presentation" for a discussion of accounting standards adopted in the period,and recently issued accounting standards not yet adopted.
35

Index
Item 3. Quantitative and Qualitative Disclosures about Market Risk
We engage in activities that expose us to various market risks, including the effect of changes in foreign currency exchange rates and interest rates. We do not engage in speculative transactions,nor do we hold or issue financial instruments for trading purposes. The table below sets forth our market risk sensitive instruments as at the following dates:
March 31, 2017 :
Expected Maturity Dates 2017 2018 2019 2020 2021 Thereafter
Long-term Debt (000's):
Variable rate (EUR) — 250,800 235,335 — 468,800 —
Average interest rate (1) — 1.50% 1.50% — 1.50% —
Interest Rate Swaps (000's):
Variable to fixed (EUR) 250,800 250,800 (2) 235,335 — 468,800 —
Average pay rate 0.21% 0.14% 0.31% — 0.28% —
Average receive rate —% —% —% — —% —(1) As discussed in Item 1, Note 4, "Long-term Debt and Other Financing Arrangements" , as consideration for Time Warner's guarantee of the Euro Term Loans, we pay Guarantee Fees to
Time Warner based on the amounts outstanding on the Euro Term Loans, each calculated such that the all-in borrowing rate on each of the Euro Term Loans is currently 7.25% per annum.(2) The interest rate swaps maturing in 2018 are forward starting to coincide with the maturity date of the interest rate swaps maturing in 2017. See Item 1, Note 11, "Financial Instruments and
Fair Value Measurements" .
December 31, 2016 :
Expected Maturity Dates 2017 2018 2019 2020 2021 Thereafter
Long-term Debt (000's):
Variable rate (EUR) — 250,800 235,335 — 468,800 —
Average interest rate (1) — 1.50% 1.50% — 1.50% —
Interest Rate Swaps (000's):
Variable to fixed (EUR) 250,800 250,800 (2) 235,335 — 468,800 —
Average pay rate 0.21% 0.14% 0.31% — 0.28% —
Average receive rate —% —% —% — —% —(1) We pay Guarantee Fees to Time Warner based on the amounts outstanding on the Euro Term Loans, each calculated such that the all-in borrowing rate on each the 2018 Euro Term Loan
and the 2019 Euro Term Loan was 8.5% per annum and the all-in borrowing rate on the 2021 Euro Term Loan was 9.0% per annum.(2) The interest rate swaps maturing in 2018 are forward starting to coincide with the maturity date of the interest rate swaps maturing in 2017. See Item 1, Note 11, "Financial Instruments and
Fair Value Measurements" .
Foreign Currency Exchange Risk Management
We conduct business in a number of currencies other than our functional currencies. As a result, we are subject to foreign currency exchange rate risk due to the effects that foreign exchangerate movements of these currencies have on our costs and on the cash flows we receive from our subsidiaries. In limited instances, including the transactions noted below, we enter into forwardforeign exchange contracts to minimize foreign currency exchange rate risk.
On January 31, 2017, we entered into forward foreign exchange contracts to reduce our exposure to movements in the USD to EUR exchange rates related to contractual payments under dollar-denominated agreements to be made during 2017. At March 31, 2017 , one forward foreign exchange contract with an aggregate notional amount of approximately US$ 19.3 million wasoutstanding.
Interest Rate Risk Management
The Euro Term Loans each bear interest at a variable rate based on EURIBOR plus an applicable margin. We are party to a number of interest rate swap agreements intended to reduce ourexposure to interest rate movements (see Item 1, Note 11, "Financial Instruments and Fair Value Measurements" ).
36

Index
Item 4. Controls and Procedures
We have established disclosure controls and procedures designed to ensure that information required to be disclosed in our Quarterly Report on Form 10-Q is recorded, processed, summarizedand reported within the specified time periods and is designed to ensure that information required to be disclosed is accumulated and communicated to management, including the co-PrincipalExecutive Officers and the Principal Financial Officer, to allow timely decisions regarding required disclosure.
Our co-Principal Executive Officers and our Principal Financial Officer evaluated the effectiveness of the design and operation of our disclosure controls and procedures as of March 31, 2017and concluded that our disclosure controls and procedures were effective as of that date. There has been no change in our internal control over financial reporting during the three months endedMarch 31, 2017 that has materially affected, or is reasonably likely to materially affect, our internal control over financial reporting.
PART II. OTHER INFORMATION
Item 1. Legal Proceedings
General
We are from time to time party to legal proceedings, arbitrations and regulatory proceedings arising in the normal course of our business operations, including the proceeding described below.We evaluate, on a quarterly basis, developments in such matters and provide accruals for such matters, as appropriate. In making such decisions, we consider the degree of probability of anunfavorable outcome and our ability to make a reasonable estimate of the amount of a loss. An unfavorable outcome in any such proceedings, if material, could have an adverse effect on ourbusiness or consolidated financial statements.
In the fourth quarter of 2016, our Slovak subsidiary MARKIZA-SLOVAKIA, spol. s.r.o. (“Markiza”) was notified of claims that were filed in June 2016 in a court of first instance in Bratislava,the Slovak Republic to collect amounts allegedly owing under four promissory notes. These four promissory notes were purportedly issued in June 2000 by Pavol Rusko in his personal capacityand were purportedly guaranteed by Markiza under the signature of Mr. Rusko, who was an executive director of Markiza at that time as well as one of its shareholders. The notes purport to beissued in favor of Marian Kocner, a controversial Slovak businessman, and to a former associate of Mr. Kocner, and were supposedly assigned several times, ultimately to Sprava a inkasozmeniek, s.r.o., a company owned by Mr. Kocner that is the plaintiff in these proceedings. The four notes purport to be in the aggregate amount of approximately EUR 69 million. A court offirst instance in Bratislava has suspended proceedings in respect of one of the promissory notes (in the amount of approximately EUR 26 million) because the plaintiff failed to pay court fees.Two of the remaining notes allegedly matured in 2015 and the third in 2016. Despite a random case assignment system in the Slovak Republic, the three cases dealing with the other notes haveall been assigned to the same judge. We do not believe that any of the promissory notes are authentic and are vigorously defending the claims.
Item 1A. Risk Factors
This report and the following discussion of risk factors contain forward-looking statements as discussed in Part 1, Item 2, "Management's Discussion and Analysis of Financial Condition andResults of Operations". Our actual results may differ materially from those anticipated in these forward-looking statements as a result of certain factors, including the risks and uncertaintiesdescribed below and elsewhere in this report. These risks and uncertainties are not the only ones we may face. Additional risks and uncertainties of which we are not aware, or that we currentlydeem immaterial, may also become important factors that affect our financial condition, results of operations and cash flows.
Risks Relating to Our Financial Position
Global or regional economic conditions adversely affected our financial position and results of operations. We cannot predict if the recovery in our operating countries will continue or howlong it may last. A failure to achieve lasting recoveries would adversely affect our results of operations.
The results of our operations depend heavily on advertising revenue, and demand for advertising is affected by general economic conditions in the region and globally. The global financial crisisin 2009 and the sustained recessionary period that followed had a prolonged adverse impact on consumer and business spending, access to credit, liquidity, investment spending, asset values andemployment rates. These adverse economic conditions had a material negative impact on advertising spending in our markets and on our advertising revenues. Since 2014, our markets haveexperienced overall growth in real GDP (as adjusted for inflation) and advertising spending; however we cannot predict if the recovery that has begun will continue or how long it will last. Inaddition, although we believe the advertising spend per capita of the countries in which we operate and advertising intensity (the ratio of total ad spend per capita to nominal GDP per capita)will converge with developed markets in Europe, such convergence may not occur in the time frame we expect, or at all.
Recessions or periods of low or negative growth in the future may cause a deterioration of general economic conditions in one or more of our markets, which would have an adverse economicimpact on our advertising revenues. Other factors that may affect general economic conditions in our markets include defaults by sovereigns or systemically important companies, austerityprograms, natural disasters, acts of terrorism, civil or military conflicts or general political instability and responses to it, any of which may also reduce advertising spending. For example,significant liquidity issues facing the largest private company and advertiser in Croatia, Agrokor d.d., contributed to the decline of the advertising market in Croatia for the quarter and couldreduce Croatia’s economic growth for the year as well as television advertising spending in 2017. Furthermore, we may not be able to recover all receivables owed to us from Agrokor in theevent it is restructured. Any of these developments would have a significant negative effect on our financial position, results of operations and cash flows.
Concerns regarding the Eurozone and the impact on the region of the United Kingdom’s exit from the European Union (“EU”) may adversely affect our financial position and results ofoperations.
Continued economic softness in the Eurozone, including a slowdown in the growth of consumer prices, prompted the European Central Bank to embark upon quantitative easing in 2015.Economic events related to the sovereign debt crisis in several EU countries have also highlighted issues relating to the strength of the banking sector in Europe and the Euro. Although the EUhas created external funding and stability mechanisms to provide liquidity and financial assistance to Eurozone member states and financial institutions, there can be no assurance that the marketdisruptions in Europe related to sovereign debt and the banking sector or otherwise, including the increased cost of funding for certain governments and financial institutions, will not continueand there can be no assurance that funding and stability packages utilized previously will be available or, if provided, will be sufficient to stabilize affected economies or institutions.
37

Index
On March 29, 2017, the United Kingdom formally initiated the process to leave the EU, commonly referred to as "Brexit", which is expected to be completed within the next two years. It isexpected that economic conditions in the EU will be impacted by Brexit. While the overall economic impact of Brexit on the EU and the Euro is difficult to estimate at present, decisions toconserve cash and reduce spending by consumers and businesses in the United Kingdom would have a negative impact on economic growth rates in the United Kingdom and, to a lesser extent,in the EU, in particular those countries that are significant exporters to the United Kingdom. There is also significant uncertainty regarding the terms on which the United Kingdom will leave theEU, and it is expected that a more protracted process to set those terms would have a more prolonged economic impact. In addition, there is concern that other countries may seek to leave theEU following the Brexit decision, increasing uncertainty in the region, which may have a further negative impact on investment and economic growth rates. Furthermore, the departure of theUnited Kingdom from the EU may affect the budgetary contributions and allocations among the EU member states in the medium term, including the countries in which we operate, which arenet recipients of EU funding. Economic uncertainty caused by Brexit or other instability in the EU could cause significant volatility in EU markets and reduce economic growth rates in thecountries in which we operate, which would negatively impact our business.
Our operating results will be adversely affected if we cannot generate strong advertising sales.
We generate the majority of our revenues from the sale of advertising airtime on our television channels. The reduction in advertising spending in our markets following the onset of the globalfinancial crisis at the beginning of 2009 and the sustained recessionary period that followed had a negative effect on television advertising spending and prices. While we have attempted tocombat this fall in prices by implementing new pricing strategies, the success of these strategies has varied from market to market and continues to be challenged by pressure from advertisersand discounting by competitors. In addition to advertising pricing, other factors that may affect our advertising sales include general economic conditions (described above), competition fromother broadcasters and operators of other distribution platforms, changes in programming strategy, changes in distribution strategy, our channels’ technical reach, technological developmentsrelating to media and broadcasting, seasonal trends in the advertising market, changing audience preferences and in how and when people view content and the accompanying advertising,increased competition for the leisure time of audiences and shifts in population and other demographics. Our advertising revenues also depend on our ability to maintain audience ratings and togenerate GRPs. This requires us to have a distribution strategy that reaches a significant audience as well as to maintain investments in programming at a sufficient level to continue to attractaudiences. Changes in the distribution of our channels, such as our decision to cease broadcasting on DTT in the Slovak Republic and Slovenia, may reduce the number of people who can viewour channels, which may negatively impact our audience share and GRPs generated. Furthermore, significant or sustained reductions in investments in programming or other operating costs inresponse to reduced advertising revenues had and, if continued or repeated, may have an adverse impact on our television viewing levels. Reductions in advertising spending in our markets andresistance to price increases as well as competition for ratings from broadcasters seeking to attract similar audiences have had and may continue to have an adverse impact on our ability tomaintain our advertising sales. A failure to maintain and increase advertising sales could have a material adverse effect on our financial position, results of operations and cash flows.
Our liquidity constraints and debt service obligations may restrict our ability to fund our operations.
We have significant debt service obligations under the Euro Term Loans as well as the 2021 Revolving Credit Facility (when drawn). Furthermore, we are paying Guarantee Fees to TimeWarner as consideration for its guarantees of the Euro Term Loans (collectively, the "TW Guarantees"). Although a portion of the Guarantee Fee in respect of each of the Euro Term Loans canbe non-cash pay at our option, accruing such fees will further increase the amounts to be repaid at the maturity of these facilities. Accordingly, the payment of Guarantee Fees in kind willincrease our already significant leverage. As a result of our debt service obligations and covenants contained in the related loan agreements, we are restricted under the ReimbursementAgreement and the 2021 Revolving Credit Facility (when drawn) in the manner in which our business is conducted, including but not limited to our ability to obtain additional debt financing torefinance existing indebtedness or to fund future working capital, capital expenditures, business opportunities or other corporate requirements. We may have a proportionally higher level of debtthan our competitors, which may put us at a competitive disadvantage by limiting our flexibility in planning for, or reacting to, changes in our business, economic conditions or our industry. Foradditional information regarding the Reimbursement Agreement and the TW Guarantees, see Part I, Item I, Note 4, "Long-term Debt and Other Financing Arrangements" .
We may be unable to refinance our existing indebtedness and may not be able to obtain favorable refinancing terms.
We have a substantial amount of indebtedness. Under the Reimbursement Agreement and the 2021 Revolving Credit Facility (when drawn), we can incur only limited amounts of additionalindebtedness, other than indebtedness incurred to refinance existing indebtedness. In addition, pursuant to the Reimbursement Agreement, the all-in rates on each of the Euro Term Loansincrease to a maximum of 10.0% (or 3.5% above the then-current all-in rate, if lower), on the date that is 180 days following a change of control of CME Ltd. (as defined therein); and pursuantto the 2021 Revolving Credit Facility, all commitments terminate following a change of control (as defined therein) and the interest rate on amounts outstanding increases to 13% on the datethat is 180 days following such change of control. We intend to repay the 2018 Euro Term Loan at maturity with cash flows from operations and the expected proceeds from warrant exercises.In the event the warrants are not exercised in full or cash flows from operations do not meet our forecasts, we would be required to refinance the 2018 Euro Term Loan in whole or in part.Pursuant to the Reimbursement Agreement, all commitments under the 2021 Revolving Credit Facility terminate on the refinancing of any Euro Term Loan. We face the risk that we will not beable to renew, repay or refinance our indebtedness when due, or that the terms of any renewal or refinancing will not be on better terms than those of such indebtedness being refinanced. In theevent we are not able to refinance our indebtedness, we might be forced to dispose of assets on disadvantageous terms or reduce or suspend operations, any of which would materially andadversely affect our financial condition, results of operations and cash flows.
We may be subject to changes in tax rates and exposure to additional tax liabilities.
We are subject to taxes in a number of foreign jurisdictions, including in respect of our operations as well as capital transactions undertaken by us. We are subject to regular review and audit bytax authorities, and in the ordinary course of our business there are transactions and calculations where the ultimate tax determination is unknown. Significant judgment is required indetermining our provision for taxes. The final determination of our tax liabilities resulting from tax audits, related proceedings or otherwise could be materially different from our tax provisions.Economic and political pressures to increase receipts in various jurisdictions may make taxation and tax rates subject to significant change and the satisfactory resolution of any tax disputesmore difficult. The occurrence of any of these events could have a material adverse effect on our financial position, results of operations and cash flows.
A default by us in connection with our obligations under our outstanding indebtedness could result in our inability to continue to conduct our business.
Pursuant to the terms of the agreements governing the Reimbursement Agreement and the 2021 Revolving Credit Facility, we pledged all of the shares of CME NV and of CME BV, whichtogether own substantially all of the interests in our operating subsidiaries, in favor of Time Warner as security for this indebtedness. If we or these subsidiaries were to default under the termsof any of the relevant agreements, Time Warner would have the ability to sell all or a portion of the assets pledged to it in order to pay amounts outstanding under such debt instruments. Thiscould result in our inability to conduct our business.
38

Index
Fluctuations in exchange rates may continue to adversely affect our results of operations.
Our reporting currency is the dollar and CME Ltd.'s functional currency is the Euro. Our consolidated revenues and costs are divided across a range of European currencies. The strengthening ofthe dollar had a negative impact on reported revenues in 2016 when translated from the functional currencies of our operations. Continued strengthening of the dollar would have a negativeimpact on our reported revenues. Furthermore, fluctuations in exchange rates may negatively impact programming costs. While local programming is generally purchased in local currencies, asignificant portion of our content costs relates to foreign programming purchased pursuant to dollar-denominated agreements. If the dollar appreciates against the functional currencies of ouroperating segments, the cost of acquiring such content would be adversely affected, which could have a material adverse effect on our results of operations and cash flows.
Our strategies to enhance our carriage fees and diversify our revenues may not be successful.
We are focused on creating additional revenue streams from our broadcast operations as well as increasing revenues generated from broadcast advertising, which is how we generate most of ourrevenues. Our main efforts with respect to this strategy are on increasing carriage fees from cable, satellite and IPTV operators for carriage of our channels as well as continuing to seekimprovements in advertising pricing. Agreements with operators generally have a term of one or more years, at which time agreements must be renewed. There can be no assurance that we willbe successful in renewing carriage fee agreements on similar or better terms. During negotiations to implement our carriage fees strategy in prior years, some cable and satellite operatorssuspended the broadcast of our channels, which negatively affected the reach and audience shares of those operations and, as a result, advertising revenues. There is a risk that operators mayrefuse to carry our channels while carriage fee negotiations are ongoing, which would temporarily reduce the reach of those channels and may result in clients withdrawing advertising from ourchannels. The occurrence of any of these events may have an adverse impact on our financial position, results of operations and cash flows. If we are ineffective in negotiations with carriers orin achieving further carriage fee increases, our profitability will continue to be dependent primarily on television advertising revenues, which increases the importance placed on our ability toimprove advertising pricing and generate advertising revenues. In addition to carriage fees, we are also working to build-out our offerings of advertising video-on-demand products and otheropportunities for advertising online. There can be no assurances that our revenue diversification initiatives will ultimately be successful, and if unsuccessful, this may have an adverse impact onour financial position, results of operations and cash flows.
A downgrading of our ratings may adversely affect our ability to raise additional financing.
Moody’s Investors Service rates our corporate credit as B2 with a stable outlook. Standard & Poor’s rates our corporate credit B+ with a stable outlook. Our ratings show each agency's opinionof our financial strength, operating performance and ability to meet our debt obligations as they become due. These ratings take into account the particular emphasis the ratings agencies place onmetrics such as leverage ratio and cash flow, which they use as measurements of a company's liquidity and financial strength. They also reflect an emphasis placed by the ratings agencies on atrack record of strong financial support from Time Warner. We may be subject to downgrades if our operating performance deteriorates or we fail to maintain adequate levels of liquidity. Inaddition, our ratings may be downgraded if the agencies form a view that material support from Time Warner is not as strong, or the strategic importance of CME Ltd. to Time Warner is not assignificant as it has been in the past. In the event our corporate credit ratings are lowered by the rating agencies, it will be more difficult for us to refinance our existing indebtedness or raise newindebtedness that may be permitted under the Reimbursement Agreement and the 2021 Revolving Credit Facility (when drawn), and we will have to pay higher interest rates, which would havean adverse effect on our financial position, results of operations and cash flows.
If our goodwill, other intangible assets and long-lived assets become impaired, we may be required to record significant charges to earnings.
We review our long-lived assets for impairment when events or changes in circumstances indicate the carrying amount may not be recoverable. Goodwill and indefinite-lived intangible assetsare required to be assessed for impairment at least annually. Factors that may be considered a change in circumstances indicating that the carrying amount of our goodwill, indefinite-livedintangible assets or long-lived assets may not be recoverable include slower growth rates in our markets, reduced expected future cash flows, increased country risk premium as a result ofpolitical uncertainty and a decline in stock price and market capitalization. We consider available current information when calculating our impairment charge. If there are indicators ofimpairment, our long-term cash flow forecasts for our operations deteriorate or discount rates increase, we may be required to recognize additional impairment charges in later periods. See PartI, Item I, Note 3, "Goodwill and Intangible Assets" for the carrying amounts of goodwill in each of our reporting units.
Risks Relating to Our Operations
Content may become more expensive to produce or acquire or we may not be able to develop or acquire content that is attractive to our audiences.
Television programming is one of the most significant components of our operating costs. The ability of our programming to generate advertising revenues depends substantially on our abilityto develop, produce or acquire programming that matches audience tastes and attracts high audience shares, which is difficult to predict. The commercial success of a program depends onseveral tangible and intangible factors, including the impact of competing programs, the availability of alternate forms of entertainment and leisure time activities, our ability to anticipate andadapt to changes in consumer tastes and behavior, and general economic conditions. While we have been successful in reducing content costs compared to prior periods, the cost of acquiringcontent attractive to our viewers, such as feature films and popular television series and formats, may increase in the future. Our expenditures in respect of locally produced programming mayalso increase due to competition for talent and other resources, changes in audience tastes in our markets or from the implementation of any new laws and regulations mandating the broadcast ofa greater number of locally produced programs. In addition, we typically acquire syndicated programming rights under multi-year commitments before knowing how such programming willperform in our markets. In the event any such programming does not attract adequate audience share, it may be necessary to increase our expenditures by investing in additional programming,subject to the availability of adequate financial resources, as well as to write down the value of any underperforming programming. Any material increase in content costs could have a materialadverse effect on our financial condition, results of operations or cash flows.
39

Index
Our operations are vulnerable to significant changes in viewing habits and technology that could adversely affect us.
The television broadcasting industry is affected by rapid innovations in technology. The implementation of these new technologies and the introduction of non-traditional content distributionsystems have increased competition for audiences and advertisers. Platforms such as direct-to-home cable and satellite distribution systems, the Internet, subscription and advertising video-on-demand, user-generated content sites and the availability of content on portable digital devices have changed consumer behavior by increasing the number of entertainment choices available toaudiences and the methods for the distribution, storage and consumption of content. This development has fragmented television audiences in more developed markets and could adversely affectour ability to retain audience share and attract advertisers as such technologies penetrate our markets. As we adapt to changing viewing patterns, it may be necessary to expend substantialfinancial and managerial resources to ensure necessary access to new technologies or distribution systems. Such initiatives may not develop into profitable business models. Furthermore,technologies that enable viewers to choose when, how, where and what content to watch, as well as to fast-forward or skip advertisements, may cause changes in consumer behavior that couldhave a negative impact on our advertising revenues. In addition, compression techniques and other technological developments allow for an increase in the number of channels that may bebroadcast in our markets and expanded programming offerings that may be offered to highly targeted audiences. Reductions in the cost of launching new channels could lower entry barriers andencourage the development of increasingly targeted niche programming on various distribution platforms. This could increase the competitive demand for popular programming, resulting in anincrease in content costs as we compete for audiences and advertising revenues. A failure to successfully adapt to changes in our industry as a result of technological advances may have anadverse effect on our financial position, results of operations and cash flows.
Our operating results are dependent on the importance of television as an advertising medium.
We generate most of our revenues from the sale of our advertising airtime on television channels in our markets. Television competes with various other media, such as print, radio, the internetand outdoor advertising, for advertising spending. In all of the countries in which we operate, television constitutes the single largest component of all advertising spending. There can be noassurances that the television advertising market will maintain its current position among advertising media in our markets. Furthermore, there can be no assurances that changes in theregulatory environment or improvements in technology will not favor other advertising media or other television broadcasters. Increases in competition among advertising media arising fromthe development of new forms of advertising media and distribution could result in a decline in the appeal of television as an advertising medium generally or of our channels specifically. Adecline in television advertising spending as a component of total advertising spending in any period or in specific markets would have an adverse effect on our financial position, results ofoperations and cash flows.
We are subject to legal compliance risks and the risk of legal or regulatory proceedings being initiated against us.
We are required to comply with a wide variety of laws and other regulatory obligations in the jurisdictions in which we operate and compliance by our businesses is subject to scrutiny byregulators and other government authorities in these jurisdictions. Compliance with foreign as well as applicable U.S. laws and regulations related to our businesses, such as broadcasting contentand advertising regulations, competition regulations, tax laws, employment laws, data protection requirements, and anti-corruption laws, increases the costs and risks of doing business in thesejurisdictions. We believe we have implemented appropriate risk management and compliance policies and procedures that are designed to ensure our employees, contractors and agents complywith these laws and regulations; however, a violation of such laws and regulations or the Company’s policies and procedures could occur. A failure or alleged failure to comply with applicablelaws and regulations, whether inadvertent or otherwise, may result in legal or regulatory proceedings being initiated against us.
We have become aware of provisions in the tax regulations of one of our markets that shift the liability for taxes on gains resulting from certain capital transactions from the seller to the buyer.This provision may have been applicable to an acquisition made by us, although we do not believe we have any liability connected to this transaction. In addition, the prosecuting authorities inRomania requested information in respect of an investigation into certain transactions entered into by Pro TV in 2014 primarily with certain related parties. We believe that the transactionsunder review are fully supported and are cooperating with the authorities in responding to the information request. In Slovenia, the competition authorities have launched an investigation intowhether our Slovenian subsidiary is dominant and abused its dominant position when concluding carriage fee agreements with platform operators. The investigation is in an early stage and therehas been no determination that a breach of competition law has occurred. If these or other contingencies result in legal or regulatory proceedings being initiated against us, or if developmentsoccur in respect of our compliance with existing laws or regulations, or there are changes in the interpretation or application of such laws or regulations, we may incur substantial costs, berequired to change our business practices, our reputation may be damaged or we may be exposed to unanticipated civil or criminal liability, including fines and other penalties that may besubstantial. This could have a material adverse effect on our business, financial position, results of operations and cash flows.
Piracy of our content may decrease revenues we can earn from our content and adversely impact our business and profitability.
Piracy of our content poses significant challenges in our markets. Technological developments, including digital copying, file compressing, the use of international proxies and the growingpenetration of high bandwidth internet connections, have made it easier to create, transmit and distribute high quality unauthorized copies of content in unprotected digital formats. Furthermore,there are a growing number of video streaming sites, increasing the risk of online transmission of our content without consent. The proliferation of such sites broadcasting content pirated fromus could result in a reduction of revenues that we receive from the legitimate distribution of our content, including through video-on-demand and other services. Protection of our intellectualproperty is in large part dependent on the manner in which applicable intellectual property laws in the countries in which we operate are construed and enforced. We seek to limit the threat ofcontent piracy. However, detecting and policing the unauthorized use of our intellectual property is often difficult and remedies may be limited under applicable law. Steps we take may notprevent the infringement by third parties. There can be no assurance that our efforts to enforce our rights and protect our intellectual property will be successful in preventing piracy, whichlimits our ability to generate revenues from our content.
40

Index
Our operations are in developing markets where there are additional risks related to political and economic uncertainty, biased treatment and compliance with evolving legal and regulatorysystems.
Our revenue-generating operations are located in Central and Eastern Europe and we may be significantly affected by risks that may be different to those posed by investments in moredeveloped markets. These risks include, but are not limited to, social and political instability, inconsistent regulatory or judicial practice, and increased taxes and other costs. The economic andpolitical systems, legal and tax regimes, regulatory practices, standards of corporate governance and business practices of countries in this region continue to develop. Policies and practices maybe subject to significant adjustments, including following changes in political leadership. This may result in social or political instability or disruptions and the potential for political influence onthe media as well as inconsistent application of tax and legal regulations, arbitrary treatment before regulatory or judicial authorities and other general business risks. Other potential risksinherent in markets with evolving economic and political environments include exchange controls, higher taxes, tariffs and other levies as well as longer payment cycles. The relative level ofdevelopment of our markets and the influence of local politics also present a potential for biased treatment of us before regulators or courts in the event of disputes. If such a dispute occurs,those regulators or courts might favor local interests over our interests. Ultimately, this could have a material adverse impact on our business, financial position, results of operations and cashflows.
We rely on network and information systems and other technology that may be subject to disruption or misuse, which could harm our business or our reputation.
We make extensive use of network and information systems and other technologies, including those related to our internal network management as well as our broadcasting operations. Thesesystems are central to many of our business activities. Network and information systems-related events, such as computer hackings, computer viruses, worms or other destructive or disruptivesoftware, process breakdowns, malicious activities or other security breaches could result in a disruption or degradation of our services, the loss of information or the improper disclosure ofpersonal data. The occurrence of any of these events could negatively impact our business by requiring us to expend resources to remedy such a security breach or by harming our reputation. Inaddition, improper disclosure of personal data could subject us to liability under laws that protect personal data in the countries in which we operate. The development and maintenance ofsystems to prevent these events from occurring requires ongoing monitoring and updating as efforts to overcome security measures become more sophisticated. As technologies evolve, we willneed to expend additional resources to protect our technology and information systems, which could have an adverse impact on our results of operations.
Our broadcasting licenses may not be renewed and may be subject to revocation.
We require broadcasting and, in some cases, other operating licenses as well as other authorizations from national regulatory authorities in our markets in order to conduct our broadcastingbusiness. While our broadcasting licenses for our operations in Slovenia and the Slovak Republic are valid for indefinite time periods, our other broadcasting licenses expire at various timesthrough 2028. While we expect that our material licenses and authorizations will be renewed or extended as required to continue to operate our business, we cannot guarantee that this will occuror that they will not be subject to revocation, particularly in markets where there is relatively greater political risk as a result of less developed political and legal institutions. The failure tocomply in all material respects with the terms of broadcasting licenses or other authorizations or with applications filed in respect thereto may result in such licenses or other authorizations notbeing renewed or otherwise being terminated. Furthermore, no assurances can be given that renewals or extensions of existing licenses will be issued on the same terms as existing licenses orthat further restrictions or conditions will not be imposed in the future. Any non-renewal or termination of any other broadcasting or operating licenses or other authorizations or materialmodification of the terms of any renewed licenses may have a material adverse effect on our financial position, results of operations and cash flows.
Our success depends on attracting and retaining key personnel.
Our success depends partly upon the efforts and abilities of our key personnel and our ability to attract and retain key personnel. Our management teams have significant experience in the mediaindustry and have made important contributions to our growth and success. Although we have been successful in attracting and retaining such people in the past, competition for highly skilledindividuals is intense. There can be no assurance that we will continue to be successful in attracting and retaining such individuals in the future. The loss of the services of any of theseindividuals could have an adverse effect on our businesses, results of operations and cash flows.
Risks Relating to Enforcement Rights
We are a Bermuda company and enforcement of civil liabilities and judgments may be difficult.
We are a Bermuda company. Substantially all of our assets and all of our operations are located, and all of our revenues are derived, outside the United States. In addition, several of ourdirectors and officers are non-residents of the United States, and all or a substantial portion of the assets of such persons are or may be located outside the United States. As a result, investorsmay be unable to effect service of process within the United States upon such persons, or to enforce against them judgments obtained in the United States courts, including judgments predicatedupon the civil liability provisions of the United States federal and state securities laws. There is uncertainty as to whether the courts of Bermuda and the countries in which we operate wouldenforce (a) judgments of United States courts obtained against us or such persons predicated upon the civil liability provisions of the United States federal and state securities laws or (b) inoriginal actions brought in such countries, liabilities against us or such persons predicated upon the United States federal and state securities laws.
Our Bye-laws restrict shareholders from bringing legal action against our officers and directors.
Our Bye-laws contain a broad waiver by our shareholders of any claim or right of action in Bermuda, both individually and on our behalf, against any of our officers or directors. The waiverapplies to any action taken or concurred in by an officer or director, or the failure of an officer or director to take any action, in the performance of his or her duties, except with respect to anymatter involving any fraud or dishonesty on the part of the officer or director. This waiver limits the right of shareholders to assert claims against our officers and directors unless the act orfailure to act involves fraud or dishonesty.
41

Index
Risks Relating to our Common Stock
Our share price may be adversely affected by sales of unregistered shares or future issuances of our shares.
Time Warner is the largest holder of shares of our Class A common stock, holding 61,407,775 unregistered shares of Class A common stock, one share of Series A preferred stock, 200,000shares of Series B preferred stock and warrants to acquire 100,926,996 shares of our Class A common stock (the "TW Warrants"). The share of Series A preferred stock is convertible into11,211,449 shares of Class A common stock and the shares of Series B preferred stock are convertible into shares of Class A common stock at the option of Time Warner (subject to certainexceptions). As of March 31, 2017 , the 200,000 shares of Series B preferred stock were convertible into approximately 106.1 million shares of Class A common stock. The TW Warrants areexercisable for shares of Class A common stock until May 2, 2018 at an exercise price of US$ 1.00 per share. Time Warner has registration rights with respect to all its shares of Class Acommon stock now held or hereafter acquired. Furthermore, there are additional unregistered shares of our Class A common stock outstanding that we may be obligated to register and shares ofClass A common stock underlying other warrants that may enter into trading. For additional information on the Series A preferred stock, Series B preferred stock and TW Warrants, see Part I,Item I, Note 12, "Convertible Redeemable Preferred Shares" and Note 13, "Equity" . In October 2016, Time Warner announced it has entered into a definitive merger agreement with AT&T Inc.under which AT&T Inc. will acquire Time Warner. The merger is subject to approval by Time Warner shareholders and approval by a number of regulatory authorities, including the U.S.Department of Justice. Following a successful completion of such merger, AT&T Inc. will become the beneficial owner of equity securities currently beneficially owned by Time Warner andthe successor to rights related to such securities granted to Time Warner.
We cannot predict what effect, if any, the entry into trading of previously issued unregistered shares of Class A common stock will have on the market price of our shares. We may also issueadditional shares of Class A common stock or securities convertible into our equity in the future. If more shares of our Class A common stock (or securities convertible into or exchangeable forshares of our Class A common stock) are issued to Time Warner, the economic interests of current shareholders may be diluted and the price of our shares may be adversely affected.
The interests of Time Warner may conflict with the interests of other investors.
Time Warner is able to exercise voting power in us with respect to 46.7% of our outstanding shares of Class A common stock. As such, Time Warner is in a position to exercise significantinfluence over the outcome of corporate actions requiring shareholder approval, such as the election of directors or certain transactions. Following the issuance of the TW Warrants, theaggregate economic interest of Time Warner in us is approximately 76.0% (without giving effect to the accretion of the Series B preferred stock after March 31, 2017 ). Furthermore, TimeWarner has the right to appoint one less than the number required to constitute a majority of our board of directors, provided that Time Warner continues to own not less than 40% of the votingpower of the Company.
We are also party to an amended investor rights agreement with Time Warner and the other parties thereto under which, among other things, Time Warner was granted a contractual preemptiveright (subject to certain exclusions) with respect to issuances of the Company’s equity securities, which permits it to maintain its pro rata economic interest as well as a right to top any offer thatwould result in a change of control of the Company. Under Bermuda law, there is no takeover code or similar legislation requiring an acquirer of a certain percentage of our Class A commonstock to tender for the remaining publically held shares. In addition to being our largest shareholder, Time Warner is our largest secured creditor, as it guarantees 100% of our outstanding seniorindebtedness and is the lender under the 2021 Revolving Credit Facility. The 2021 Revolving Credit Facility and the Reimbursement Agreement contain maintenance covenants in respect ofinterest cover, cash flow cover and total leverage ratios and includes covenants in respect of the incurrence of indebtedness (including refinancing indebtedness), the provision of guarantees,acquisitions and disposal and granting security. As such, Time Warner may be in a position to determine whether to permit transactions, waive defaults or accelerate such indebtedness or takeother steps in its capacity as a secured creditor in a manner that might not be consistent with the interests of the holders of our Class A common stock. Furthermore, in certain circumstances, theinterests of Time Warner as our largest shareholder could be in conflict with the interests of minority shareholders.
The price of our Class A common stock has been volatile.
The market price of shares of our Class A common stock may be influenced by many factors, some of which are beyond our control, including but not limited to those described above under“Risks Relating to Our Operations” as well as the following: general economic and business trends, variations in quarterly operating results, license renewals, regulatory developments in ouroperating countries and the European Union, the condition of the media industry in our operating countries, the volume of trading in shares of our Class A common stock, future issuances ofshares of our Class A common stock and investors’ and securities analysts’ perception of us and other companies that investors or securities analysts deem comparable in the televisionbroadcasting industry. In addition, stock markets in general have experienced extreme price and volume fluctuations that have often been unrelated to and disproportionate to the operatingperformance of broadcasting companies. These broad market and industry factors may materially reduce the market price of shares of our Class A common stock, regardless of our operatingperformance.
Our business could be negatively impacted as a result of shareholder activism.
On January 17, 2017, TCS Capital Management, LLC ("TCS Capital"), a beneficial owner of more than 12% of our shares, filed an amendment to its Schedule 13D disclosing its opinion thatthe Company should hire an investment bank to run a process to sell the Company as well as replace current members of the Company's Board of Directors with new directors recommended byTCS Capital. In recent years, shareholder activists, such as TCS Capital, have become involved in numerous public companies. Shareholder activists frequently propose to involve themselves inthe governance, strategic direction and operations of the Company. Such proposals may disrupt our business and divert the attention of our management and employees, and any perceiveduncertainties as to our future direction resulting from such a situation could result in the loss of potential business opportunities, be exploited by our competitors, cause concern to our current orpotential customers, and make it more difficult to attract and retain qualified personnel and business partners, all of which could adversely affect our business. In addition, actions of activistshareholders may cause significant fluctuations in our stock price based on temporary or speculative market perceptions or other factors that do not necessarily reflect the underlyingfundamentals and prospects of our business.
42
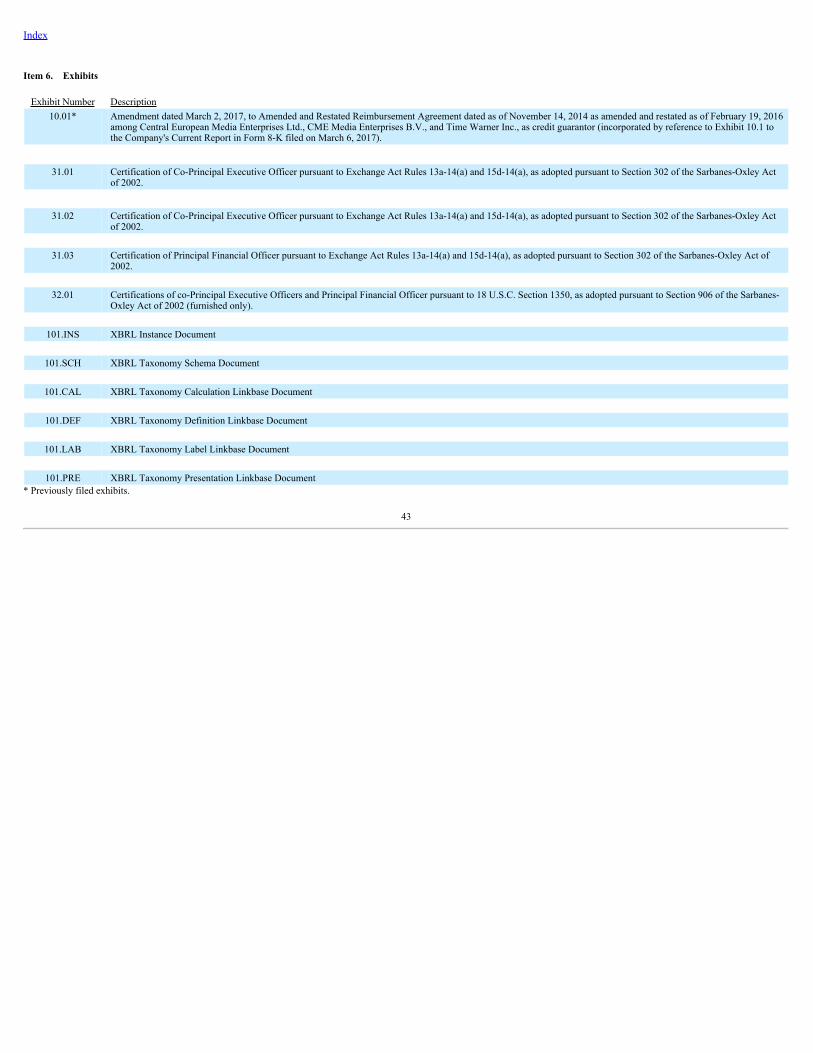
Index
Item 6. Exhibits
Exhibit Number Description10.01*
Amendment dated March 2, 2017, to Amended and Restated Reimbursement Agreement dated as of November 14, 2014 as amended and restated as of February 19, 2016among Central European Media Enterprises Ltd., CME Media Enterprises B.V., and Time Warner Inc., as credit guarantor (incorporated by reference to Exhibit 10.1 tothe Company's Current Report in Form 8-K filed on March 6, 2017).
31.01
Certification of Co-Principal Executive Officer pursuant to Exchange Act Rules 13a-14(a) and 15d-14(a), as adopted pursuant to Section 302 of the Sarbanes-Oxley Actof 2002.
31.02 Certification of Co-Principal Executive Officer pursuant to Exchange Act Rules 13a-14(a) and 15d-14(a), as adopted pursuant to Section 302 of the Sarbanes-Oxley Act
of 2002.
31.03 Certification of Principal Financial Officer pursuant to Exchange Act Rules 13a-14(a) and 15d-14(a), as adopted pursuant to Section 302 of the Sarbanes-Oxley Act of2002.
32.01 Certifications of co-Principal Executive Officers and Principal Financial Officer pursuant to 18 U.S.C. Section 1350, as adopted pursuant to Section 906 of the Sarbanes-
Oxley Act of 2002 (furnished only).
101.INS XBRL Instance Document
101.SCH XBRL Taxonomy Schema Document
101.CAL XBRL Taxonomy Calculation Linkbase Document
101.DEF XBRL Taxonomy Definition Linkbase Document
101.LAB XBRL Taxonomy Label Linkbase Document
101.PRE XBRL Taxonomy Presentation Linkbase Document* Previously filed exhibits.
43

Index
SIGNATURES
Pursuant to the requirements of Section 13 or 15(d) of the Securities Exchange Act of 1934, the Registrant has duly caused this report to be signed on its behalf by the undersigned, thereuntoduly authorized.
Central European Media Enterprises Ltd.Date: April 26, 2017 /s/ David Sturgeon
David SturgeonExecutive Vice President and Chief Financial OfficerPrincipal Financial Officer and Principal Accounting Officer
44
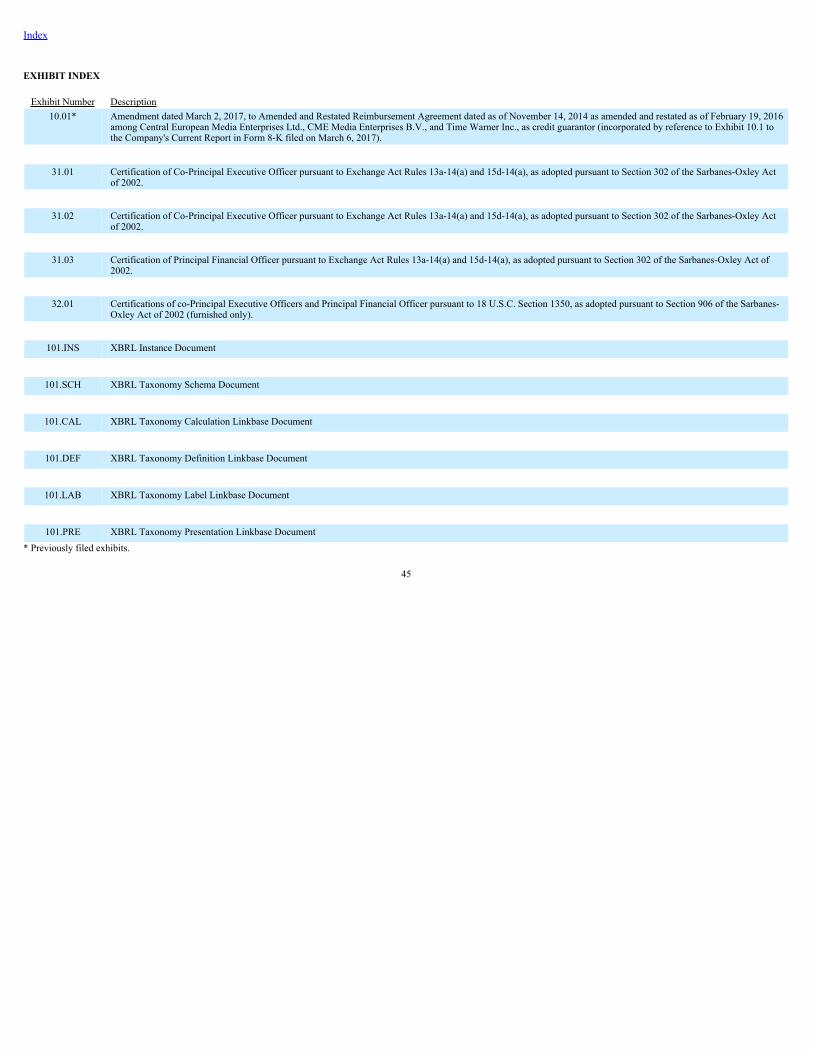
Index
EXHIBIT INDEX
Exhibit Number Description10.01*
Amendment dated March 2, 2017, to Amended and Restated Reimbursement Agreement dated as of November 14, 2014 as amended and restated as of February 19, 2016among Central European Media Enterprises Ltd., CME Media Enterprises B.V., and Time Warner Inc., as credit guarantor (incorporated by reference to Exhibit 10.1 tothe Company's Current Report in Form 8-K filed on March 6, 2017).
31.01
Certification of Co-Principal Executive Officer pursuant to Exchange Act Rules 13a-14(a) and 15d-14(a), as adopted pursuant to Section 302 of the Sarbanes-Oxley Actof 2002.
31.02
Certification of Co-Principal Executive Officer pursuant to Exchange Act Rules 13a-14(a) and 15d-14(a), as adopted pursuant to Section 302 of the Sarbanes-Oxley Actof 2002.
31.03
Certification of Principal Financial Officer pursuant to Exchange Act Rules 13a-14(a) and 15d-14(a), as adopted pursuant to Section 302 of the Sarbanes-Oxley Act of2002.
32.01
Certifications of co-Principal Executive Officers and Principal Financial Officer pursuant to 18 U.S.C. Section 1350, as adopted pursuant to Section 906 of the Sarbanes-Oxley Act of 2002 (furnished only).
101.INS XBRL Instance Document
101.SCH XBRL Taxonomy Schema Document
101.CAL XBRL Taxonomy Calculation Linkbase Document
101.DEF XBRL Taxonomy Definition Linkbase Document
101.LAB XBRL Taxonomy Label Linkbase Document
101.PRE XBRL Taxonomy Presentation Linkbase Document
* Previously filed exhibits.
45

Exhibit 31.01
CERTIFICATION OF CO-PRINCIPAL EXECUTIVE OFFICER
I, Michael Del Nin, certify that: 1. I have reviewed this quarterly report on Form 10-Q of Central European Media Enterprises Ltd.;
2. Based on my knowledge, this report does not contain any untrue statement of a material fact or omit to state a material fact necessary to make the statements made, in light of thecircumstances under which such statements were made, not misleading with respect to the period covered by this report;
3. Based on my knowledge, the financial statements, and other financial information included in this report, fairly present in all material respects the financial condition, results of operationsand cash flows of the registrant as of, and for, the periods presented in this report;
4. The registrant's other certifying officer(s) and I are responsible for establishing and maintaining disclosure controls and procedures (as defined in Exchange Act Rules 13a-15(e) and 15d-15(e)) and internal control over financial reporting (as defined in Exchange Act Rules 13a-15(f) and 15d-15(f)) for the registrant and have:
(a) Designed such disclosure controls and procedures, or caused such disclosure controls and procedures to be designed under our supervision, to ensure that material information relatingto the registrant, including its consolidated subsidiaries, is made known to us by others within those entities, particularly during the period in which this report is being prepared;
(b) Designed such internal control over financial reporting, or caused such internal control over financial reporting to be designed under our supervision, to provide reasonable assuranceregarding the reliability of financial reporting and the preparation of financial statements for external purposes in accordance with generally accepted accounting principles;
(c) Evaluated the effectiveness of the registrant's disclosure controls and procedures and presented in this report our conclusions about the effectiveness of the disclosure controls andprocedures, as of the end of the period covered by this report based on such evaluation; and
(d) Disclosed in this report any changes in the registrant's internal control over financial reporting that occurred during the registrant's most recent fiscal quarter (the registrant's fourthfiscal quarter in the case of an annual report), that has materially affected, or is reasonably likely to materially affect, the registrant's internal control over financial reporting; and
5. The registrant's other certifying officer(s) and I have disclosed, based on our most recent evaluation of internal control over financial reporting, to the registrant's auditors and the auditcommittee of the registrant's board of directors (or persons performing the equivalent functions):
(a) All significant deficiencies and material weaknesses in the design or operation of internal control over financial reporting which are reasonably likely to adversely affect theregistrant's ability to record, process, summarize and report financial information; and
(b) Any fraud, whether or not material, that involves management or other employees who have a significant role in the registrant's internal control over financial reporting.
/s/ Michael Del Nin Michael Del Nin co-Chief Executive Officer (co-Principal Executive Officer) April 26, 2017

Exhibit 31.02
CERTIFICATION OF CO-PRINCIPAL EXECUTIVE OFFICER
I, Christoph Mainusch, certify that: 1. I have reviewed this quarterly report on Form 10-Q of Central European Media Enterprises Ltd.;
2. Based on my knowledge, this report does not contain any untrue statement of a material fact or omit to state a material fact necessary to make the statements made, in light of thecircumstances under which such statements were made, not misleading with respect to the period covered by this report;
3. Based on my knowledge, the financial statements, and other financial information included in this report, fairly present in all material respects the financial condition, results of operationsand cash flows of the registrant as of, and for, the periods presented in this report;
4. The registrant's other certifying officer(s) and I are responsible for establishing and maintaining disclosure controls and procedures (as defined in Exchange Act Rules 13a-15(e) and 15d-15(e)) and internal control over financial reporting (as defined in Exchange Act Rules 13a-15(f) and 15d-15(f)) for the registrant and have:
(a) Designed such disclosure controls and procedures, or caused such disclosure controls and procedures to be designed under our supervision, to ensure that material information relatingto the registrant, including its consolidated subsidiaries, is made known to us by others within those entities, particularly during the period in which this report is being prepared;
(b) Designed such internal control over financial reporting, or caused such internal control over financial reporting to be designed under our supervision, to provide reasonable assuranceregarding the reliability of financial reporting and the preparation of financial statements for external purposes in accordance with generally accepted accounting principles;
(c) Evaluated the effectiveness of the registrant's disclosure controls and procedures and presented in this report our conclusions about the effectiveness of the disclosure controls andprocedures, as of the end of the period covered by this report based on such evaluation; and
(d) Disclosed in this report any changes in the registrant's internal control over financial reporting that occurred during the registrant's most recent fiscal quarter (the registrant's fourthfiscal quarter in the case of an annual report), that has materially affected, or is reasonably likely to materially affect, the registrant's internal control over financial reporting; and
5. The registrant's other certifying officer(s) and I have disclosed, based on our most recent evaluation of internal control over financial reporting, to the registrant's auditors and the auditcommittee of the registrant's board of directors (or persons performing the equivalent functions):
(a) All significant deficiencies and material weaknesses in the design or operation of internal control over financial reporting which are reasonably likely to adversely affect theregistrant's ability to record, process, summarize and report financial information; and
(b) Any fraud, whether or not material, that involves management or other employees who have a significant role in the registrant's internal control over financial reporting.
/s/ Christoph Mainusch Christoph Mainusch co-Chief Executive Officer (co-Principal Executive Officer) April 26, 2017

Exhibit 31.03
CERTIFICATION OF PRINCIPAL FINANCIAL OFFICER
I, David Sturgeon, certify that: 1. I have reviewed this quarterly report on Form 10-Q of Central European Media Enterprises Ltd.;
2. Based on my knowledge, this report does not contain any untrue statement of a material fact or omit to state a material fact necessary to make the statements made, in light of thecircumstances under which such statements were made, not misleading with respect to the period covered by this report;
3. Based on my knowledge, the financial statements, and other financial information included in this report, fairly present in all material respects the financial condition, results of operationsand cash flows of the registrant as of, and for, the periods presented in this report;
4. The registrant's other certifying officer(s) and I are responsible for establishing and maintaining disclosure controls and procedures (as defined in Exchange Act Rules 13a-15(e) and 15d-15(e)) and internal control over financial reporting (as defined in Exchange Act Rules 13a-15(f) and 15d-15(f)) for the registrant and have:
(a) Designed such disclosure controls and procedures, or caused such disclosure controls and procedures to be designed under our supervision, to ensure that material information relatingto the registrant, including its consolidated subsidiaries, is made known to us by others within those entities, particularly during the period in which this report is being prepared;
(b) Designed such internal control over financial reporting, or caused such internal control over financial reporting to be designed under our supervision, to provide reasonable assuranceregarding the reliability of financial reporting and the preparation of financial statements for external purposes in accordance with generally accepted accounting principles;
(c) Evaluated the effectiveness of the registrant's disclosure controls and procedures and presented in this report our conclusions about the effectiveness of the disclosure controls andprocedures, as of the end of the period covered by this report based on such evaluation; and
(d) Disclosed in this report any changes in the registrant's internal control over financial reporting that occurred during the registrant's most recent fiscal quarter (the registrant's fourthfiscal quarter in the case of an annual report), that has materially affected, or is reasonably likely to materially affect, the registrant's internal control over financial reporting; and
5. The registrant's other certifying officer(s) and I have disclosed, based on our most recent evaluation of internal control over financial reporting, to the registrant's auditors and the auditcommittee of the registrant's board of directors (or persons performing the equivalent functions):
(a) All significant deficiencies and material weaknesses in the design or operation of internal control over financial reporting which are reasonably likely to adversely affect theregistrant's ability to record, process, summarize and report financial information; and
(b) Any fraud, whether or not material, that involves management or other employees who have a significant role in the registrant's internal control over financial reporting.
/s/ David Sturgeon David Sturgeon Chief Financial Officer (Principal Financial Officer) April 26, 2017
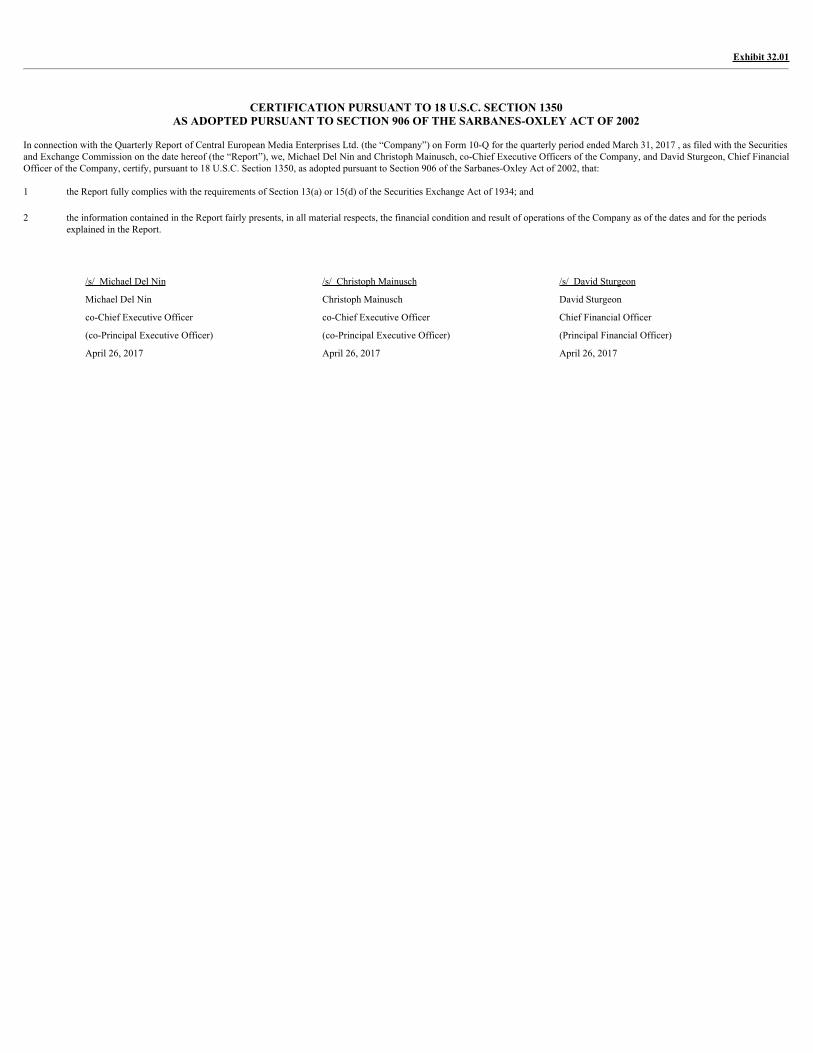
Exhibit 32.01
CERTIFICATION PURSUANT TO 18 U.S.C. SECTION 1350
AS ADOPTED PURSUANT TO SECTION 906 OF THE SARBANES-OXLEY ACT OF 2002
In connection with the Quarterly Report of Central European Media Enterprises Ltd. (the “Company”) on Form 10-Q for the quarterly period ended March 31, 2017 , as filed with the Securitiesand Exchange Commission on the date hereof (the “Report”), we, Michael Del Nin and Christoph Mainusch, co-Chief Executive Officers of the Company, and David Sturgeon, Chief FinancialOfficer of the Company, certify, pursuant to 18 U.S.C. Section 1350, as adopted pursuant to Section 906 of the Sarbanes-Oxley Act of 2002, that:
1 the Report fully complies with the requirements of Section 13(a) or 15(d) of the Securities Exchange Act of 1934; and
2 the information contained in the Report fairly presents, in all material respects, the financial condition and result of operations of the Company as of the dates and for the periodsexplained in the Report.
/s/ Michael Del Nin /s/ Christoph Mainusch /s/ David Sturgeon
Michael Del Nin Christoph Mainusch David Sturgeon
co-Chief Executive Officer co-Chief Executive Officer Chief Financial Officer
(co-Principal Executive Officer) (co-Principal Executive Officer) (Principal Financial Officer)
April 26, 2017 April 26, 2017 April 26, 2017