![CONFIDENTIAL GlaxoSmithKline group of companies 201283 · the Clinical Study Report for Protocol [GlaxoSmithKline Document Number 2014N211002_00]and Protocol amendment [GlaxoSmithKline](https://static.fdocuments.in/doc/165x107/5f667658e5c63f1eec01e090/confidential-glaxosmithkline-group-of-companies-201283-the-clinical-study-report.jpg)
2009 Annual Report -...
165
2009 Annual Report
Transcript of 2009 Annual Report -...
2009 Annual Report
n Frederic M. Poses*Chief Executive OfficerAscend Performance Materialschemicals, resins and fibers
n Dr. Pierre R. BrondeauPresident & Chief Executive OfficerFMC Corporationchemicals
n Dr. Ram CharanAdvisor to Executives andCorporate Boards
n n Dr. Juergen W. GromerRetired PresidentTyco Electronics Ltd.
n Robert M. HernandezChairmanRTI International Metals, Inc.metal products and components
n Thomas J. LynchChief Executive OfficerTyco Electronics Ltd.
n Daniel J. PhelanChief of StaffGlaxoSmithKline plcpharmaceuticals, vaccines and consumer products
n n Lawrence S. SmithRetired Executive Vice President& Co-CFOComcast Corporationbroadband cable
n Paula A. SneedChair & Chief Executive OfficerPhelps Prescott Group, LLCstrategy and management consulting
n David P. SteinerChief Executive OfficerWaste Management, Inc.waste management services
n John C. Van ScoterChief Executive Officer (eff. 2/1/2010)eSolar, Inc.solar thermal power technology
* Non-Executive Chairman of the TycoElectronics Ltd. Board of Directors
(effective 1/15/2010, unless otherwise noted)
n n Thomas J. LynchChief Executive Officer
n n Mario CalastriSenior Vice PresidentTreasurer
n n Alan C. ClarkePresidentNetwork Solutions
n n Terrence R. CurtinExecutive Vice PresidentChief Financial Officer
n n Cuong V. DoSenior Vice PresidentCorporate Strategy & BusinessDevelopment
n n Joseph B. DonahuePresidentGlobal Automotive Division
n n Charles P. DoughertyPresidentCommunications & Solutions
n n Gordon HwangSenior Vice PresidentChina
n n Jane A. LeipoldSenior Vice PresidentGlobal Human Resources
n n Minoru OkamotoSenior Advisor to the CEO
n n Robert J. OttSenior Vice PresidentCorporate Controller
n n Jeff ReaPresident Specialty Products Group
n n Eric J. ReschSenior Vice PresidentChief Tax Officer
n n Michael RobinsonSenior Vice PresidentOperations
n n Robert A. ScottExecutive Vice PresidentGeneral Counsel
n n Robert N. ShaddockSenior Vice President Chief Technology Officer
n n Joan E. WainwrightSenior Vice PresidentMarketing & Communications
(effective 1/15/2010)
TYCO ELECTRONICS LTD.ANNUAL REPORT
TABLE OF CONTENTS
Page
Annual Report Overview*
Business . . . . . . . . . . . . . . . . . . . . . . . . . . . . . . . . . . . . . . . . . . . . . . . . . . . . . . . . . . . . . . . . . 1Market for Registrant’s Common Equity, Related Stockholder Matters and Issuer Purchases of
Equity Securities . . . . . . . . . . . . . . . . . . . . . . . . . . . . . . . . . . . . . . . . . . . . . . . . . . . . . . . . . 12Selected Financial Data . . . . . . . . . . . . . . . . . . . . . . . . . . . . . . . . . . . . . . . . . . . . . . . . . . . . . 14Management’s Discussion and Analysis of Financial Condition and Results of Operations . . . . . . 16Quantitative and Qualitative Disclosures About Market Risk . . . . . . . . . . . . . . . . . . . . . . . . . . 52Changes in and Disagreements with Accountants on Accounting and Financial Disclosures . . . . . 53Controls and Procedures . . . . . . . . . . . . . . . . . . . . . . . . . . . . . . . . . . . . . . . . . . . . . . . . . . . . . 53Consolidated and Combined Financial Statements . . . . . . . . . . . . . . . . . . . . . . . . . . . . . . . . . . 55Statutory Financial Statements . . . . . . . . . . . . . . . . . . . . . . . . . . . . . . . . . . . . . . . . . . . . . . . . 143
* Tyco Electronics Ltd.’s 2009 Annual Report includes the 2009 Annual Report Overview.
i
SPECIAL NOTE ABOUT FORWARD-LOOKING STATEMENTS
We have made forward-looking statements in this Annual Report, including in the sections entitled‘‘Business,’’ ‘‘Management’s Discussion and Analysis of Financial Condition and Results ofOperations,’’ and ‘‘Quantitative and Qualitative Disclosures about Market Risk,’’ that are based on ourmanagement’s beliefs and assumptions and on information currently available to our management.Forward-looking statements include, among others, the information concerning our possible or assumedfuture results of operations, business strategies, financing plans, competitive position, potential growthopportunities, potential operating performance improvements, the effects of competition, and theeffects of future legislation or regulations. Forward-looking statements include all statements that arenot historical facts and can be identified by the use of forward-looking terminology such as the words‘‘believe,’’ ‘‘expect,’’ ‘‘plan,’’ ‘‘intend,’’ ‘‘anticipate,’’ ‘‘estimate,’’ ‘‘predict,’’ ‘‘potential,’’ ‘‘continue,’’‘‘may,’’ ‘‘should,’’ or the negative of these terms or similar expressions.
Forward-looking statements involve risks, uncertainties, and assumptions. Actual results may differmaterially from those expressed in these forward-looking statements. You should not put unduereliance on any forward-looking statements. We do not have any intention or obligation to updateforward-looking statements after we file this report except as required by law.
The risk factors identified in the Annual Report and those discussed in our Annual Report onForm 10-K for the fiscal year ended September 25, 2009 filed with the United States Securities andExchange Commission could cause our results to differ materially from those expressed in forward-looking statements. There may be other risks and uncertainties that we are unable to predict at thistime or that we currently do not expect to have a material adverse effect on our business.
ii
BUSINESS
Overview
Tyco Electronics Ltd. (‘‘we,’’ ‘‘Tyco Electronics,’’ or the ‘‘Company’’) is a leading global provider ofengineered electronic components, network solutions, specialty products, and underseatelecommunication systems. We design, manufacture, and market products for customers in a broadarray of industries including automotive; data communication systems and consumer electronics;telecommunications; aerospace, defense, and marine; medical; energy; and lighting. Our products areproduced in nearly 100 manufacturing sites in approximately 25 countries. With approximately 7,000engineers and worldwide manufacturing, sales, and customer service capabilities, Tyco Electronics’commitment is our customers’ advantage.
Tyco Electronics Ltd. was incorporated in Bermuda in fiscal 2000 as a wholly-owned subsidiary ofTyco International Ltd. (‘‘Tyco International’’). For the period following its incorporation, TycoElectronics Ltd. did not engage in any significant business activities and held minimal assets. EffectiveJune 29, 2007, Tyco International distributed all of its shares of Tyco Electronics to its commonshareholders (referred to in this report as the ‘‘separation’’). Tyco Electronics Ltd. became anindependent, publicly traded company owning the former electronics businesses of TycoInternational Ltd. In connection with the separation, the equity interests in the entities that hold all ofthe assets and liabilities of Tyco International’s electronics businesses were transferred to TycoElectronics.
Our business was formed principally through a series of acquisitions, from fiscal 1999 throughfiscal 2002, of established electronics companies and divisions, including the acquisition of AMPIncorporated and Raychem Corporation in fiscal 1999 and the Electromechanical Components Divisionof Siemens and OEM Division of Thomas & Betts in fiscal 2000. These companies each have morethan 50 years of history in engineering and innovation excellence. We operated as a segment of TycoInternational prior to our separation.
Effective June 25, 2009, we discontinued our existence as a Bermuda company as provided inSection 132G of The Companies Act of 1981 of Bermuda, as amended (the ‘‘Bermuda CompaniesAct’’), and, in accordance with article 161 of the Swiss Federal Code on International Private Law,continued our existence as a Swiss corporation under articles 620 et seq. of the Swiss Code ofObligations. The rights of holders of our shares are now governed by Swiss law, our Swiss articles ofassociation, and our Swiss organizational regulations.
We operate through four reporting segments: Electronic Components, Network Solutions, SpecialtyProducts, and Undersea Telecommunications. In May 2009, we sold our Wireless Systems businesswhich has been reclassified as discontinued operations. Prior to reclassification to held for sale anddiscontinued operations, this business was reported as our former Wireless Systems segment. Also,effective January 1, 2009, we established the Specialty Products Group from our existing businesses.The results of this new organization are reported as a separate reporting segment. This new segment iscomprised of the Aerospace, Defense, and Marine; Touch Systems; Medical; and Circuit Protectionbusinesses which were formerly reported in the Electronic Components segment. Prior period segmentinformation has been revised to conform to the current segment reporting structure in all periodspresented. See Notes 1 and 24 to the Consolidated and Combined Financial Statements for additionalinformation regarding our segments.
1
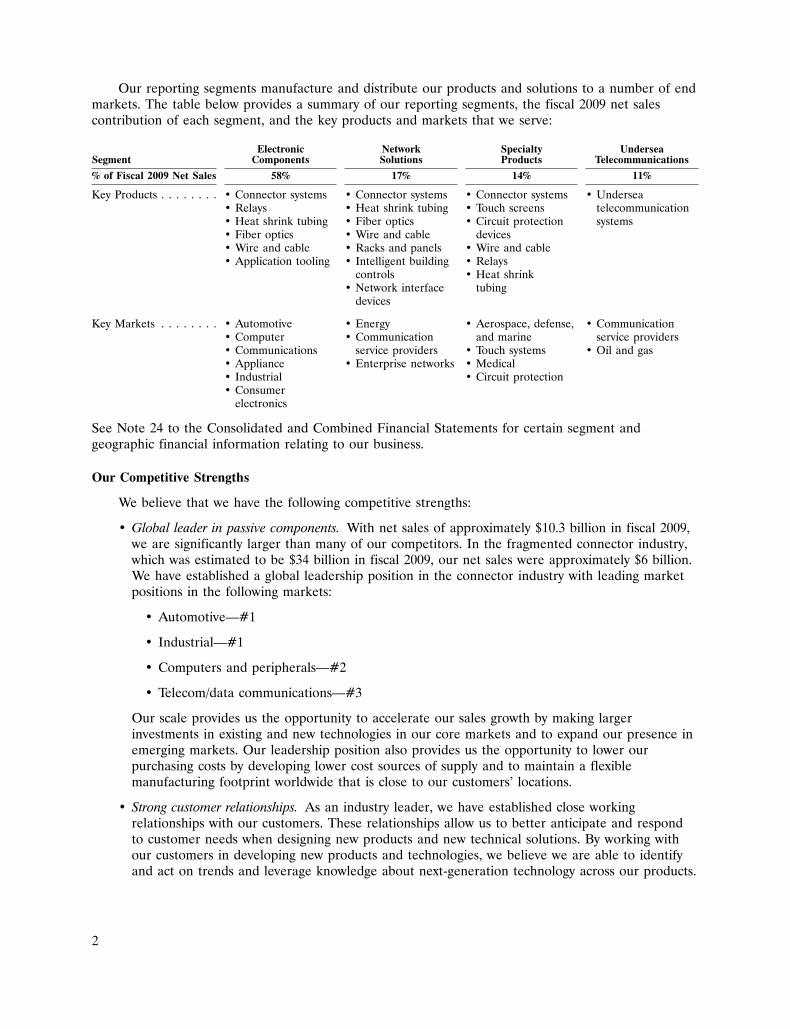
Our reporting segments manufacture and distribute our products and solutions to a number of endmarkets. The table below provides a summary of our reporting segments, the fiscal 2009 net salescontribution of each segment, and the key products and markets that we serve:
Electronic Network Specialty UnderseaSegment Components Solutions Products Telecommunications
% of Fiscal 2009 Net Sales 58% 17% 14% 11%
Key Products . . . . . . . . • Connector systems • Connector systems • Connector systems • Undersea• Relays • Heat shrink tubing • Touch screens telecommunication• Heat shrink tubing • Fiber optics • Circuit protection systems• Fiber optics • Wire and cable devices• Wire and cable • Racks and panels • Wire and cable• Application tooling • Intelligent building • Relays
controls • Heat shrink• Network interface tubing
devices
Key Markets . . . . . . . . • Automotive • Energy • Aerospace, defense, • Communication• Computer • Communication and marine service providers• Communications service providers • Touch systems • Oil and gas• Appliance • Enterprise networks • Medical• Industrial • Circuit protection• Consumer
electronics
See Note 24 to the Consolidated and Combined Financial Statements for certain segment andgeographic financial information relating to our business.
Our Competitive Strengths
We believe that we have the following competitive strengths:
• Global leader in passive components. With net sales of approximately $10.3 billion in fiscal 2009,we are significantly larger than many of our competitors. In the fragmented connector industry,which was estimated to be $34 billion in fiscal 2009, our net sales were approximately $6 billion.We have established a global leadership position in the connector industry with leading marketpositions in the following markets:
• Automotive—#1
• Industrial—#1
• Computers and peripherals—#2
• Telecom/data communications—#3
Our scale provides us the opportunity to accelerate our sales growth by making largerinvestments in existing and new technologies in our core markets and to expand our presence inemerging markets. Our leadership position also provides us the opportunity to lower ourpurchasing costs by developing lower cost sources of supply and to maintain a flexiblemanufacturing footprint worldwide that is close to our customers’ locations.
• Strong customer relationships. As an industry leader, we have established close workingrelationships with our customers. These relationships allow us to better anticipate and respondto customer needs when designing new products and new technical solutions. By working withour customers in developing new products and technologies, we believe we are able to identifyand act on trends and leverage knowledge about next-generation technology across our products.
2
In addition, we operate a broad Global Account Management program through which wemaintain close working relationships with the key customers in the end markets that we serve.
• Process and product technology leadership. We employ approximately 7,000 engineers dedicated toproduct research, development, and engineering. Our investment of over $530 million in productand process engineering and development together with our capital spending of over$300 million in fiscal 2009, enable us to consistently provide innovative, high-quality productswith efficient manufacturing methods.
• Diverse product mix and customer base. We manufacture and sell a broad portfolio of products tocustomers in various industries. Our customers include many of the leaders in their respectiveindustries, and our relationships with them typically date back many years. We believe that thisdiversified customer base provides us an opportunity to leverage our skills and experience acrossmarkets and reduces our exposure to particular end markets, thereby reducing the variability ofour financial performance. Additionally, we believe that the diversity of our customer basereduces the level of cyclicality in our results and distinguishes us from our competitors.
• Balanced geographic sales mix. We have an established manufacturing presence in approximately25 countries and our sales are global. Our global coverage positions us near our customers’locations and allows us to assist them in consolidating their supply base and lowering theirproduction costs. We believe our balanced sales distribution lowers our exposure to anyparticular geography and improves our financial profile. In addition, our strategy is to continueto increase the percentage of production from lower-cost countries.
• Strong and experienced management team. We believe we have a management team that has theexperience necessary to effectively execute our strategy and advance our product and technologyleadership. Our Chief Executive Officer and segment leaders average more than 20 years ofexperience of which most is in the electronics industry. They are supported by an experiencedand talented management team that is dedicated to maintaining and expanding our position as aglobal leader in the industry.
Our Strategy
Our goal is to be the world leader in providing custom-engineered electronic components andsolutions for an increasingly connected world. We believe that in achieving this goal we will increasenet sales and profitability across our segments in the markets that we serve. Our business strategy isbased upon the following priorities:
• Leverage our market leadership position to increase our market share. We are a global leader inmany of the markets that we serve. For example, within our Electronic Components segment, weare the leading global supplier of connectors and connector systems to the automotive andindustrial markets. We believe that these and other markets are critical to our success and thatwe must continue to strengthen our leadership position in these markets. We plan to capitalizeon the expected long-term growth in these markets by leveraging our significant scale in theindustry, the breadth of our product portfolio, our established relationships and leadingspecification positions with our customers, and our extensive worldwide distribution channels.
• Achieve market leadership in attractive and under-penetrated industries. We plan to accelerategrowth in end-user markets in which we do not have the number one market share but which webelieve have attractive growth and profitability characteristics. These markets include: thealternate energy and lighting markets with respect to our Electronic Components segment; theenergy, communication service providers, and enterprise networks markets with respect to ourNetwork Solutions segment; and the aerospace, defense, and marine, touch systems, and medicalmarkets with respect to our Specialty Products segment. We believe that we can further leverage
3
our customer service and our new product and technology capabilities in order to achieve aleading position in these markets.
• Extend our leadership in key emerging markets. We seek to improve our market leadershipposition in emerging geographic regions, including China, Eastern Europe, and India, which weexpect will experience higher growth rates than those of more developed regions in the world. Infiscal 2009, we generated $1.4 billion of net sales in China, $0.7 billion of net sales in EasternEurope, and $0.2 billion of net sales in each of India and Brazil. We believe that expansion inthese regions will enable us to grow faster than the overall global market.
• Supplement organic growth with strategic acquisitions. We will evaluate and selectively pursuestrategic acquisitions that strengthen our market position, enhance our existing product offering,enable us to enter attractive markets, expand our technological capabilities, and provide synergyopportunities.
• Improve operating margins. We intend to continue to increase our productivity and reduce ourmanufacturing costs. We plan to achieve this by developing best in class manufacturing,enhancing our purchasing strategy through design initiatives and sourcing of materials fromsuppliers in lower-cost regions, simplifying our distribution network, and further implementingbest practice continuous improvement programs. We also plan to continue to simplify our globalmanufacturing footprint, both by migrating facilities from higher-cost to lower-cost countries andby consolidating within countries. With respect to our manufacturing rationalization plan, weexpect to incur restructuring charges of approximately $350 million through 2011 related tocurrent as well as future restructuring actions. These initiatives are designed to help us maintainour competitiveness in the industry.
• Accelerate new product development through research and development excellence. We seek tocontinue to increase the percentage of our annual net sales from new products. In fiscal 2009,we derived approximately 31% of our net sales from new products launched within the previousthree years. In order to accomplish this goal, we intend to focus our research, development, andengineering investment on next generation technologies and highly engineered products andplatforms, and leverage innovation across our segments.
Our Products
Our net sales by reporting segment as a percentage of our total net sales was as follows:
Fiscal
2009 2008 2007
Electronic Components . . . . . . . . . . . . . . . . . . . . . . . . . . . . . 58% 65% 68%Network Solutions . . . . . . . . . . . . . . . . . . . . . . . . . . . . . . . . . 17 15 15Specialty Products . . . . . . . . . . . . . . . . . . . . . . . . . . . . . . . . . 14 12 13Undersea Telecommunications . . . . . . . . . . . . . . . . . . . . . . . . 11 8 4
Total . . . . . . . . . . . . . . . . . . . . . . . . . . . . . . . . . . . . . . . . . . . 100% 100% 100%
Electronic Components
Our Electronic Components segment is one of the world’s largest suppliers of passive electroniccomponents, which includes connectors and interconnect systems, relays, switches, sensors, and wire andcable. The products sold by the Electronic Components segment are sold primarily to originalequipment manufacturers and their contract manufacturers in the automotive, computer,
4
communications, industrial, appliance, and consumer electronics markets. The following are the primaryproduct families sold by the segment:
• Connector Systems and Components. We offer an extensive range of electrical and electronicinterconnection products. These connectors include a wide variety of pin and socket, terminal,USB, coaxial, I/O, fiber optic, and power connectors, as well as sophisticated interconnectionproducts used in complex telecommunications and computer equipment.
• Relays. Our relay products can be used in a wide range of applications in the automotive,telecommunications, and industrial industries, including electric sunroofs, anti-lock brakingsystems, and fuel injection coils for the automotive industry and signal and power relaytechnologies for the telecommunications industry.
• Heat Shrink Tubing. We offer hundreds of reliable, cost-effective products to seal, connect,insulate, protect, hold, and bundle high-performance electrical harnesses. We also providecustomized harnessing design, prototype, and build services.
• Fiber Optics. We manufacture fiber optic connectors, cable assemblies, adapters, and accessories.We provide highly engineered products that connect, configure, and control light.
• Wire and Cable. We provide highly engineered cable and wire products to the data transmission,telecommunications, and industrial markets. We offer a broad range of cable, including UTP andPVC ribbon cables, SCSI, and IEEE 1394 computer cables.
• Application Tooling. We offer a broad portfolio of hand tools, semi-automatic bench machines,and fully-automatic machine systems for processing terminal products.
In addition to the above product families which represent approximately 90% of the ElectronicComponents segment net sales, we also offer identification products, antennas, magnetics, sensors, andswitches.
Network Solutions
Our Network Solutions segment is one of the world’s largest suppliers of infrastructurecomponents and systems for telecommunications and energy markets. These components includeconnectors, above- and below-ground enclosures, heat shrink tubing, cable accessories, surge arrestors,fiber optic cabling, copper cabling, and racks for copper and fiber networks. This segment also provideselectronic systems for test access and intelligent cross-connect applications as well as integrated cablingsolutions for cabling and building management. The products are grouped into the following productfamilies:
• Connector Systems and Components. We offer an extensive range of low, medium, andhigh-voltage connectors and splices, cable assemblies, sealing systems, terminals, fittings, lugs andclamps, transmission line fittings, splice closures, grounding hardware, and wall and floor outletsfor voice and data connection to local area networks.
• Heat Shrink Tubing. We offer heat shrink tubing, heat-shrinkable splice closures, wrap-aroundsleeves, and molded parts designed to better protect both high- and low-voltage circuits againstharsh aerial, buried, and above-ground environments.
• Fiber Optics. We provide fiber optic connectors, splices, fiber optic splice closures, fibermanagement systems, high density cable assemblies, couplers and splitters, and complete cablingsystems. These products find use in both local-area and wide-area networks, and emerging‘‘Last-Mile’’ Fiber-to-the-Home installations.
5
• Wire and Cable. We provide wire and cable for indoor and outdoor use in office, factory floor,school, and residential voice, data, and video networks, including copper and fiber opticdistribution cables, shielded and unshielded twisted-pair cables, armored cable, and patch cords.
• Racks and Panels. We provide racks and panels that are used to integrate, organize, and managefiber and copper cables and splices, thereby simplifying installation, maintenance, and upgradesfor both exchange/head end and customer premise environments.
In addition to the above product families which represent in excess of 90% of the total NetworkSolutions segment net sales, the segment also sells insulators, surge arrestors, power measurementproducts, CATV accessories, network interface devices, raceway systems, and duct accessories.
Specialty Products
Our Specialty Products segment is a leader in providing highly-engineered custom solutions,components, and connectors for electronic systems, subsystems, and devices in the aerospace, defense,and marine; touch systems; medical; and circuit protection markets. The following are the primaryproduct families sold by the segment:
• Connector Systems and Components. We offer connector products including a wide variety of pinand socket, terminal, USB, coaxial, I/O, fiber optic, and power connectors, as well assophisticated interconnection products used in complex aerospace and defense and medicalequipment.
• Touch Screens. We develop, manufacture, and market a complete line of touch products fortransactional kiosks, point-of-sale terminals, machine and process control, and automated tellermachines. We offer component touch systems for original equipment manufacturers and a broadline of standard and custom LCD touch monitors and computers.
• Circuit Protection Devices. We offer a range of circuit protection devices, which limit the flow ofhigh current during fault conditions and automatically reset after the fault is cleared and powerto the circuit is restored. We also offer surface-mount chip fuses, thyristor surge protectors,multi layer varistors, gas discharge tubes for overvoltage protection, and electrostatic discharge(ESD) protection devices.
• Wire and Cable. We provide highly engineered cable and wire products to the aerospace andmedical markets. We offer a broad range of cable, including NASA-spec cable, and other cablessuitable for use in the aerospace industry. We provide custom-engineered medical devicesolutions within the diagnostic instrument, surgical device, non-invasive therapeutic andinterventional catheter areas of the medical market.
• Relays. Our relay products can be used in a wide range of high-performance applications for theaerospace industry.
• Heat Shrink Tubing. We offer hundreds of reliable, cost-effective products to seal, connect,insulate, protect, hold, and bundle high-performance electrical harnesses. We also providecustomized harnessing design, prototype, and build services.
In addition to the above product families which represent in excess of 90% of the total SpecialtyProducts segment net sales, the segment also sells identification products, sensors, fiber optics,antennas, and application tooling.
6
Undersea Telecommunications
Our Undersea Telecommunications segment designs, builds, maintains, and tests undersea fiberoptic networks for both the telecommunications and oil and gas markets.
Markets
We sell our products to manufacturers and distributors in a number of major markets. Theapproximate percentage of our total net sales by market in fiscal 2009 was as follows:
Markets Percentage
Automotive . . . . . . . . . . . . . . . . . . . . . . . . . . . . . . . . . . . . . . . . . . . . . . 27%Telecommunications . . . . . . . . . . . . . . . . . . . . . . . . . . . . . . . . . . . . . . . . 27Energy . . . . . . . . . . . . . . . . . . . . . . . . . . . . . . . . . . . . . . . . . . . . . . . . . 8Aerospace, Defense, and Marine . . . . . . . . . . . . . . . . . . . . . . . . . . . . . . 6Computer . . . . . . . . . . . . . . . . . . . . . . . . . . . . . . . . . . . . . . . . . . . . . . . 6Industrial . . . . . . . . . . . . . . . . . . . . . . . . . . . . . . . . . . . . . . . . . . . . . . . 5Appliance . . . . . . . . . . . . . . . . . . . . . . . . . . . . . . . . . . . . . . . . . . . . . . . 4Enterprise Networks . . . . . . . . . . . . . . . . . . . . . . . . . . . . . . . . . . . . . . . 4Service Providers . . . . . . . . . . . . . . . . . . . . . . . . . . . . . . . . . . . . . . . . . . 4Medical . . . . . . . . . . . . . . . . . . . . . . . . . . . . . . . . . . . . . . . . . . . . . . . . 2Other . . . . . . . . . . . . . . . . . . . . . . . . . . . . . . . . . . . . . . . . . . . . . . . . . . 7
Total . . . . . . . . . . . . . . . . . . . . . . . . . . . . . . . . . . . . . . . . . . . . . . . . . . . 100%
Automotive. The automotive industry uses our products in motor management systems, bodyelectronic applications, safety systems, chassis systems, security systems, driver information, passengerentertainment, and comfort and convenience applications. Electronic components regulate criticalvehicle functions, from fuel intake to braking, as well as information, entertainment, and climatecontrol systems.
Telecommunications. Our products are used in telecommunications products, such as datanetworking equipment, switches, routers, wire line infrastructure equipment, wireless infrastructureequipment, wireless base stations, mobile phones, and undersea fiber optic telecommunication systems.
Energy. The energy industry uses our products in power generation equipment and powertransmission equipment. The industry has been investing heavily to improve, upgrade, and restoreexisting equipment and systems. In addition, this industry addresses the needs of emerging countriesthat are building out and upgrading their energy infrastructure.
Aerospace, Defense, and Marine. Our products are used in military and commercial aircraft,missile systems, satellites, space programs, radar systems, and offshore oil and gas applications.
Computer. Our products are used in computer products, such as servers and storage equipment,workstations, notebook computers, desktop computers, and business and retail equipment.
Industrial. Our products are used in factory automation and process control systems, photovoltaicsystems, industrial motors and generators, and general industrial machinery and equipment.
Appliance. Our products are used in many household appliances, including refrigerators, washers,dryers, dishwashers, and microwaves.
7
Enterprise Networks. We provide structured cabling systems and cable management products forcommercial buildings and office campuses, products that enable high-bandwidth voice and datacommunications throughout facilities ranging from data centers to office buildings to hotel and resortcomplexes.
Service Providers. Our products are used by communication service providers to facilitate thehigh-speed delivery of services from central offices to customer premises. This industry services theneeds of emerging countries that are building out their communications infrastructure as well ascountries upgrading networks to support high-speed internet connectivity and delivery of high-definitiontelevision.
Medical. Our products are used in medical equipment for imaging, surgical, and monitoringapplications, ranging from general surgical to ultrasound to ‘‘smart’’ vital sign monitoring equipment.
Other. Our products are used in numerous products, including instrumentation and measurementequipment, commercial and building equipment, building network and cabling systems, and railwayequipment. This category also includes products sold through third-party distributors.
Customers
Our customers include automobile, telecommunication, computer, industrial, aerospace, andconsumer products manufacturers that operate both globally and locally. Our customers also includecontract manufacturers and third-party distributors. We serve over 150,000 customer locations in over150 countries, and we maintain a strong local presence in each of the geographic areas in which weoperate.
Our net sales by geographic area as a percentage of our total net sales were as follows:
Fiscal
2009 2008 2007
Americas(1) . . . . . . . . . . . . . . . . . . . . . . . . . . . . . . . . . . . . . . . . 37% 34% 33%Europe/Middle East/Africa . . . . . . . . . . . . . . . . . . . . . . . . . . . . . 34 38 38Asia-Pacific . . . . . . . . . . . . . . . . . . . . . . . . . . . . . . . . . . . . . . . . 29 28 29
Total . . . . . . . . . . . . . . . . . . . . . . . . . . . . . . . . . . . . . . . . . . . . . 100% 100% 100%
(1) The Americas includes our Undersea Telecommunications segment.
See Note 24 to the Consolidated and Combined Financial Statements for additional informationregarding geographic areas.
We collaborate closely with our customers so that their product needs are met. There is no singlecustomer that accounted for more than 10% of our net sales in fiscal 2009, 2008, or 2007. Ourapproach to our customers is driven by our dedication to further developing our product families andensuring that we are globally positioned to best provide our customers with sales and engineeringsupport. We believe that as electronic component technologies continue to proliferate, our broadproduct portfolio and engineering capability give us a potential competitive advantage when addressingthe needs of our global customers.
Raw Materials
We use a wide variety of raw materials in the manufacture of our products. The principal rawmaterials that we use include plastic resins for molding, precious metals such as gold and silver forplating, and other metals such as copper, aluminum, brass, and steel for manufacturing cable, contacts,
8
and other parts that are used for cable and component bodies and inserts. Many of these raw materialsare produced in a limited number of regions around the world or are only available from a limitednumber of suppliers. The prices of these materials are driven by global supply and demand dynamics.
Working Capital
We consistently maintain an adequate level of working capital to support our business needs.There are no unusual industry practices or requirements relating to working capital items.
Research and Development
We are engaged in both internal and external research and development in an effort to introducenew products, to enhance the effectiveness, ease of use, safety, and reliability of our existing products,and to expand the applications for which the uses of our products are appropriate. We continuallyevaluate developing technologies in areas where we may have technological or marketing expertise forpossible investment or acquisition.
Our research and development expense for fiscal 2009, 2008, and 2007 was as follows:
Fiscal
2009 2008 2007
(in millions)
Electronic Components . . . . . . . . . . . . . . . . . . . . . . . . . . . . . $291 $325 $293Network Solutions . . . . . . . . . . . . . . . . . . . . . . . . . . . . . . . . . 54 60 54Specialty Products . . . . . . . . . . . . . . . . . . . . . . . . . . . . . . . . . 62 68 56Undersea Telecommunications . . . . . . . . . . . . . . . . . . . . . . . . 32 29 25
Total . . . . . . . . . . . . . . . . . . . . . . . . . . . . . . . . . . . . . . . . . . . $439 $482 $428
Our research, development, and engineering efforts are supported by approximately 7,000engineers. These engineers work closely with our customers to develop application specific, highlyengineered products and systems to satisfy the customers’ needs. Our new products, including productextensions, introduced during the previous three years comprised approximately 31% of our net salesfor fiscal 2009.
Sales, Marketing, and Distribution
We sell our products into more than 150 countries, and we sell primarily through direct sellingefforts. We also sell some of our products indirectly via third-party distributors. In fiscal 2009, ourdirect sales represented 83% of net sales, with the remainder of net sales provided by sales to third-party distributors and independent manufacturer representatives.
We maintain distribution centers around the world. Products are generally delivered to thesedistribution centers by our manufacturing facilities and then subsequently delivered to the customer. Insome instances, product is delivered directly from our manufacturing facility to the customer. Wecontract with a wide range of transport providers to deliver our products via road, rail, sea, and air.
Seasonality and Backlog
Customer orders typically fluctuate from quarter to quarter based upon business conditions andbecause unfilled orders may be canceled prior to shipment of goods. We experience a slight seasonalpattern to our business. The third fiscal quarter is typically the strongest quarter of our fiscal year,while the first fiscal quarter is negatively affected by winter holidays and the fourth fiscal quarter is
9
negatively affected by European holidays. The second fiscal quarter may also be affected by adversewinter weather conditions in certain of our end markets.
Backlog by reportable segment at fiscal year end 2009 and 2008 was as follows:
Fiscal
2009 2008
(in millions)
Electronics Components . . . . . . . . . . . . . . . . . . . . . . . . . . . . . . . . $1,265 $1,291Network Solutions . . . . . . . . . . . . . . . . . . . . . . . . . . . . . . . . . . . . 290 339Specialty Products . . . . . . . . . . . . . . . . . . . . . . . . . . . . . . . . . . . . 334 364Undersea Telecommunications . . . . . . . . . . . . . . . . . . . . . . . . . . . 920 1,128
Total . . . . . . . . . . . . . . . . . . . . . . . . . . . . . . . . . . . . . . . . . . . . . . $2,809 $3,122
We expect that the majority of our backlog at September 25, 2009 will be filled during fiscal 2010.
Competition
The industries in which we operate are highly competitive, and we compete with thousands ofcompanies that range from large multinational corporations to local manufacturers. Competition isgenerally on the basis of breadth of product offering, product innovation, price, quality, delivery, andservice. Our markets have generally been growing but with downward pressure on prices.
• Electronic Components. This segment competes against numerous companies, including Molex,Amphenol, FCI, JST, and Omron.
• Network Solutions. This segment’s major competitors include Corning, Commscope, and 3M.
• Specialty Products. This segment competes against numerous companies, including Molex,Amphenol, Deutsch, Radiall, 3M, Touch International, Littelfuse, Bel Fuse, and Lemo.
• Undersea Telecommunications. This segment primarily competes against Alcatel-Lucent.
Intellectual Property
Patents and other proprietary rights are important to our business. We also rely upon trade secrets,manufacturing know-how, continuing technological innovations, and licensing opportunities to maintainand improve our competitive position. We review third-party proprietary rights, including patents andpatent applications, as available, in an effort to develop an effective intellectual property strategy, avoidinfringement of third-party proprietary rights, identify licensing opportunities, and monitor theintellectual property claims of others.
We own a large portfolio of patents that principally relate to electrical and electronic products. Wealso own a portfolio of trademarks and are a licensee of various patents and trademarks. Patents forindividual products extend for varying periods according to the date of patent filing or grant and thelegal term of patents in the various countries where patent protection is obtained. Trademark rightsmay potentially extend for longer periods of time and are dependent upon national laws and use of thetrademarks.
While we consider our patents and trademarks to be valued assets, we do not believe that ourcompetitive position is dependent on patent or trademark protection or that our operations aredependent upon any single patent or group of related patents.
10
Employees
As of September 25, 2009, we employed approximately 78,000 people worldwide, of whom 20,000were in the Americas region, 23,000 were in the Europe/Middle East/Africa region, and 35,000 were inthe Asia-Pacific region. Of our total employees, approximately 46,000 were employed in manufacturingand 18,000 were represented by collective bargaining agreements. Approximately 60% of our employeeswere based in lower-cost countries, primarily China. We believe that our relations with our employeesare satisfactory.
Government Regulation and Supervision
The import and export of products are subject to regulation by the United States and othercountries. A small portion of our products, including defense-related products, may requiregovernmental import and export licenses, whose issuance may be influenced by geopolitical and otherevents. We have a trade compliance organization and other systems in place to apply for licenses andotherwise comply with such regulations. Any failure to maintain compliance with domestic and foreigntrade regulation could limit our ability to import and export raw materials and finished goods into orfrom the relevant jurisdiction.
Environmental
We are committed to complying with all applicable environmental, health, and safety laws and tothe protection of our employees and the environment. We maintain a global environmental, health, andsafety program that includes appropriate policies and standards, staff dedicated to environmental,health, and safety issues, periodic compliance auditing, training, and other measures. We have aprogram for compliance with the European Union (‘‘EU’’) Restriction on Hazardous Substances andWaste Electrical and Electronics Equipment Directives, the China RoHS law, and similar laws.
We have projects underway at a number of current and former manufacturing facilities toinvestigate and remediate environmental contamination resulting from past operations. Based upon ourexperience, current information and applicable laws, we believe that it is probable that we will incurremedial costs in the range of approximately $13 million to $26 million. As of September 25, 2009, webelieve that the best estimate within this range is approximately $16 million.
Available Information
All periodic and current reports, registration filings, and other filings that we are required to filewith the Securities and Exchange Commission (‘‘SEC’’), including Annual Reports on Form 10-K,Quarterly Reports on Form 10-Q, Current Reports on Form 8-K, and amendments to those reportsfiled or furnished pursuant to Section 13(a) or 15(d) of the Securities Exchange Act of 1934(‘‘Exchange Act’’) are available free of charge through our internet website at www.tycoelectronics.com.Such documents are available as soon as reasonably practicable after electronic filing or furnishing ofthe material with the SEC.
The public may also read and copy any document that we file, including this Annual Report, at theSEC’s Public Reference Room at 100 F Street, N.E., Washington, DC 20549. Investors may obtaininformation on the operation of the Public Reference Room by calling the SEC at 1-800-SEC-0330. Inaddition, the SEC maintains an internet site at www.sec.gov that contains reports, proxy and informationstatements, and other information regarding issuers that file electronically with the SEC, from whichinvestors can electronically access our SEC filings.
11
MARKET FOR REGISTRANT’S COMMON EQUITY, RELATED STOCKHOLDER MATTERSAND ISSUER PURCHASES OF EQUITY SECURITIES
Market Information
Tyco Electronics’ common shares are listed and traded on the New York Stock Exchange(‘‘NYSE’’) under the symbol ‘‘TEL,’’ and began trading on the NYSE on a ‘‘when-issued’’ basis onJune 14, 2007 prior to Tyco Electronics’ spin-off from Tyco International on June 29, 2007. Thefollowing table sets forth the high and low closing sales prices of Tyco Electronics’ common shares asreported by the NYSE for the quarterly periods during the fiscal years ended September 25, 2009 andSeptember 26, 2008.
Market Price Range
Fiscal Year Ended September 25, 2009 High Low
First Quarter . . . . . . . . . . . . . . . . . . . . . . . . . . . . . . . . . . . . . . . . . . . . . . . . . . $27.66 $12.97Second Quarter . . . . . . . . . . . . . . . . . . . . . . . . . . . . . . . . . . . . . . . . . . . . . . . . 17.55 7.44Third Quarter . . . . . . . . . . . . . . . . . . . . . . . . . . . . . . . . . . . . . . . . . . . . . . . . . . 20.39 10.54Fourth Quarter . . . . . . . . . . . . . . . . . . . . . . . . . . . . . . . . . . . . . . . . . . . . . . . . . 23.94 16.68
Fiscal Year Ended September 26, 2008
First Quarter . . . . . . . . . . . . . . . . . . . . . . . . . . . . . . . . . . . . . . . . . . . . . . . . . . $37.97 $31.36Second Quarter . . . . . . . . . . . . . . . . . . . . . . . . . . . . . . . . . . . . . . . . . . . . . . . . 37.13 31.18Third Quarter . . . . . . . . . . . . . . . . . . . . . . . . . . . . . . . . . . . . . . . . . . . . . . . . . . 40.12 34.04Fourth Quarter . . . . . . . . . . . . . . . . . . . . . . . . . . . . . . . . . . . . . . . . . . . . . . . . . 37.40 26.90
The number of registered holders of Tyco Electronics’ common shares at November 16, 2009 was35,741.
Dividends
The following table sets forth (in U.S. Dollars) the dividends paid on Tyco Electronics’ commonshares during the quarterly periods presented below.
Dividend perFiscal Year Ended September 25, 2009 Common Share
First Quarter . . . . . . . . . . . . . . . . . . . . . . . . . . . . . . . . . . . . . . . . . . . . . . . . . . . . . . . $0.16Second Quarter . . . . . . . . . . . . . . . . . . . . . . . . . . . . . . . . . . . . . . . . . . . . . . . . . . . . . 0.16Third Quarter . . . . . . . . . . . . . . . . . . . . . . . . . . . . . . . . . . . . . . . . . . . . . . . . . . . . . . 0.16Fourth Quarter(1) . . . . . . . . . . . . . . . . . . . . . . . . . . . . . . . . . . . . . . . . . . . . . . . . . . . . 0.16
Fiscal Year Ended September 26, 2008
First Quarter . . . . . . . . . . . . . . . . . . . . . . . . . . . . . . . . . . . . . . . . . . . . . . . . . . . . . . . 0.14Second Quarter . . . . . . . . . . . . . . . . . . . . . . . . . . . . . . . . . . . . . . . . . . . . . . . . . . . . . 0.14Third Quarter . . . . . . . . . . . . . . . . . . . . . . . . . . . . . . . . . . . . . . . . . . . . . . . . . . . . . . 0.14Fourth Quarter . . . . . . . . . . . . . . . . . . . . . . . . . . . . . . . . . . . . . . . . . . . . . . . . . . . . . . 0.14
(1) Paid in the form of a reduction of registered share capital. The reduction was declared in Swiss Francs (‘‘CHF’’) atCHF 0.17 and paid in U.S. Dollars based on a U.S. Dollar/Swiss Franc exchange rate shortly before declared.
Future dividends on our common shares or reductions of registered share capital for distribution toshareholders, if any, must be approved by our shareholders. In exercising their discretion to recommendto the shareholders that such dividends or distributions be approved, our board of directors willconsider our results of operations, cash requirements and surplus, financial condition, statutoryrequirements of applicable law, contractual restrictions, and other factors that they may deem relevant.
12
3DEC200921141188
We may from time to time enter into financing agreements that contain financial covenants andrestrictions, some of which may limit our ability to pay dividends or to distribute capital reductions.
Performance Graph
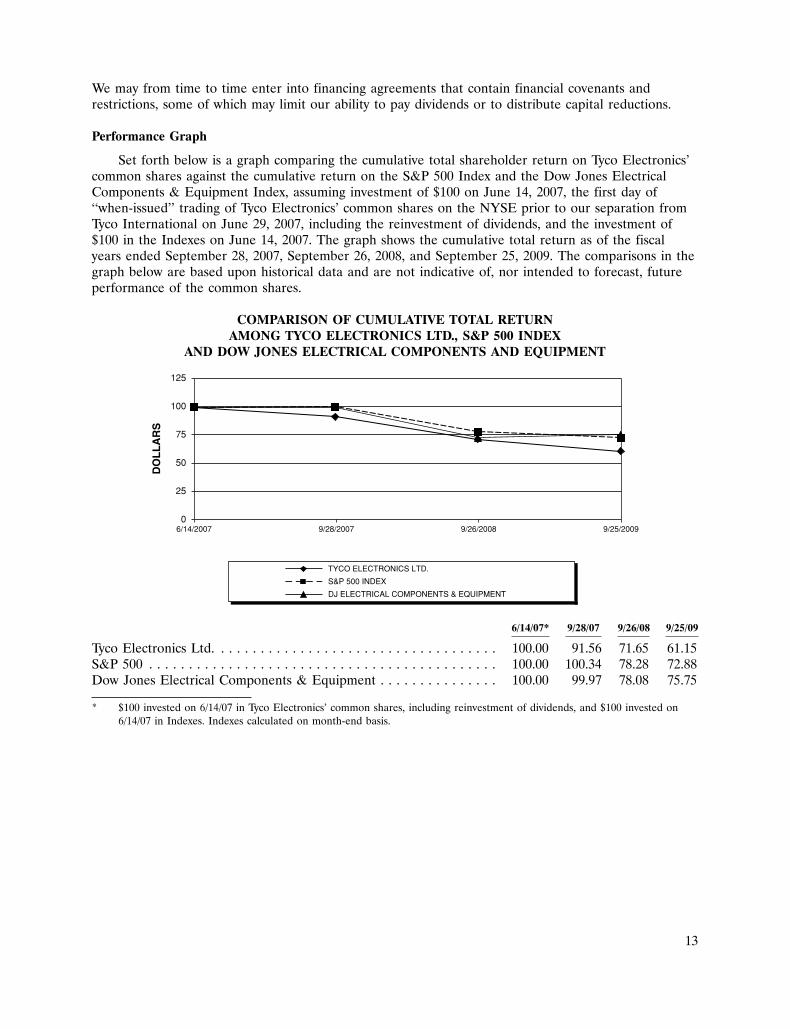
Set forth below is a graph comparing the cumulative total shareholder return on Tyco Electronics’common shares against the cumulative return on the S&P 500 Index and the Dow Jones ElectricalComponents & Equipment Index, assuming investment of $100 on June 14, 2007, the first day of‘‘when-issued’’ trading of Tyco Electronics’ common shares on the NYSE prior to our separation fromTyco International on June 29, 2007, including the reinvestment of dividends, and the investment of$100 in the Indexes on June 14, 2007. The graph shows the cumulative total return as of the fiscalyears ended September 28, 2007, September 26, 2008, and September 25, 2009. The comparisons in thegraph below are based upon historical data and are not indicative of, nor intended to forecast, futureperformance of the common shares.
COMPARISON OF CUMULATIVE TOTAL RETURNAMONG TYCO ELECTRONICS LTD., S&P 500 INDEX
AND DOW JONES ELECTRICAL COMPONENTS AND EQUIPMENT
0
25
50
75
100
125
6/14/2007 9/28/2007 9/26/2008 9/25/2009
DO
LL
AR
S
TYCO ELECTRONICS LTD.
S&P 500 INDEX
DJ ELECTRICAL COMPONENTS & EQUIPMENT
6/14/07* 9/28/07 9/26/08 9/25/09
Tyco Electronics Ltd. . . . . . . . . . . . . . . . . . . . . . . . . . . . . . . . . . . . 100.00 91.56 71.65 61.15S&P 500 . . . . . . . . . . . . . . . . . . . . . . . . . . . . . . . . . . . . . . . . . . . . 100.00 100.34 78.28 72.88Dow Jones Electrical Components & Equipment . . . . . . . . . . . . . . . 100.00 99.97 78.08 75.75
* $100 invested on 6/14/07 in Tyco Electronics’ common shares, including reinvestment of dividends, and $100 invested on6/14/07 in Indexes. Indexes calculated on month-end basis.
13
Issuer Purchases of Equity Securities
The following table presents information about our purchases of our common shares during thefiscal quarter ended September 25, 2009:
MaximumTotal Number of Approximate
Shares Purchased Dollar Valueas Part of of Shares that May
Total Number Average Price Publicly Announced Yet Be Purchasedof Shares Paid Per Plans or Under the Plans
Period Purchased(1) Share(1) Programs(2) or Programs(2)
June 27—July 24, 2009 . . . . . . . . . . . . 27,762 $— — $606,379,371July 25—August 28, 2009 . . . . . . . . . . 3,161 — — 606,379,371August 29—September 25, 2009 . . . . . . 4,418 — — 606,379,371
Total . . . . . . . . . . . . . . . . . . . . . . . . . 35,341 $— — $606,379,371
(1) This column includes the following transactions which occurred during the fiscal quarter ended September 25, 2009:
(i) the acquisition of 35,341 common shares from individuals in order to satisfy tax withholding requirements inconnection with the vesting of restricted shares issued under equity compensation plans.
(2) Our $2.0 billion share repurchase program authorizes us to purchase a portion of our outstanding common shares fromtime to time through open market or private transactions, depending on business and market conditions. The sharerepurchase program does not have an expiration date.
SELECTED FINANCIAL DATA
The following table presents selected consolidated and combined financial and other operatingdata for Tyco Electronics. The consolidated and combined statement of operations data for fiscal 2009,2008, and 2007 and the consolidated balance sheet data as of September 25, 2009 and September 26,2008 are derived from our audited consolidated and combined financial statements included elsewherein this Annual Report. The combined statement of operations data for fiscal 2006 and 2005 and theconsolidated and combined balance sheet data as of September 28, 2007, September 29, 2006 andSeptember 30, 2005 are derived from our audited consolidated and combined financial statements notincluded elsewhere in this Annual Report.
The data presented below should be read in conjunction with our Consolidated and CombinedFinancial Statements and accompanying notes and ‘‘Management’s Discussion and Analysis of FinancialCondition and Results of Operations’’ included elsewhere in this Annual Report. Our consolidated andcombined financial information may not be indicative of our future performance and does notnecessarily reflect what our financial position and results of operations would have been had weoperated as an independent, publicly-traded company prior to June 29, 2007.
14
As of or for Fiscal
2009(1) 2008(2)(6) 2007(3)(6) 2006(4)(6) 2005(5)(6)
(in millions, except per share data)Statement of Operations DataNet sales . . . . . . . . . . . . . . . . . . . . . . . . . . . . . . . $10,256 $14,373 $12,574 $11,431 $10,543Gross income . . . . . . . . . . . . . . . . . . . . . . . . . . . . 2,536 4,173 3,719 3,556 3,322Pre-Separation litigation charges, net . . . . . . . . . . . 144 22 887 — —Separation costs . . . . . . . . . . . . . . . . . . . . . . . . . . — — 44 — —Restructuring and other charges (credits), net . . . . . 375 219 92 7 (312)Impairment of goodwill . . . . . . . . . . . . . . . . . . . . . 3,547 103 — — —Operating income (loss) . . . . . . . . . . . . . . . . . . . . (3,474) 1,663 655 1,679 1,890Income (loss) from continuing operations . . . . . . . . (3,100) 1,527 (214) 1,402 949Income (loss) from discontinued operations, net of
income taxes . . . . . . . . . . . . . . . . . . . . . . . . . . . (156) 255 (340) (201) 184Cumulative effect of accounting change, net of
income taxes . . . . . . . . . . . . . . . . . . . . . . . . . . . — — — (8) 11Net income (loss) . . . . . . . . . . . . . . . . . . . . . . . . . $ (3,256) $ 1,782 $ (554) $ 1,193 $ 1,144Per Share Data(7)
Basic earnings (loss) per share:Income (loss) from continuing operations . . . . . . $ (6.75) $ 3.16 $ (0.43) $ 2.82 $ 1.91Net income (loss) . . . . . . . . . . . . . . . . . . . . . . . (7.09) 3.69 (1.11) 2.40 2.30
Diluted earnings (loss) per share:Income (loss) from continuing operations . . . . . . $ (6.75) $ 3.14 $ (0.43) $ 2.82 $ 1.91Net income (loss) . . . . . . . . . . . . . . . . . . . . . . . (7.09) 3.67 (1.11) 2.40 2.30
Cash dividends declared and distributions approvedper common share . . . . . . . . . . . . . . . . . . . . . . $ 0.64 $ 0.58 $ 0.14 $ — $ —
Balance Sheet DataTotal current assets . . . . . . . . . . . . . . . . . . . . . . . . $ 5,579 $ 7,635 $10,545 $ 7,245 $ 6,902Total assets . . . . . . . . . . . . . . . . . . . . . . . . . . . . . 16,220 21,600 23,688 19,091 18,473Total current liabilities . . . . . . . . . . . . . . . . . . . . . 2,615 3,387 6,218 3,181 3,204Long-term debt and obligations under capital leases . . 2,316 3,161 3,373 3,371 3,816Total equity . . . . . . . . . . . . . . . . . . . . . . . . . . . . . 7,016 11,073 11,377 11,160 9,842Working capital(8) . . . . . . . . . . . . . . . . . . . . . . . . . 2,964 4,248 4,327 4,064 3,698Other Operating DataCapital expenditures . . . . . . . . . . . . . . . . . . . . . . . $ 328 $ 610 $ 863 $ 506 $ 451
(1) Fiscal 2009 loss from continuing operations includes net pre-Separation litigation charges of $144 million, net restructuringand other charges of $375 million, impairment of goodwill of $3,547 million, a gain on retirement of debt of $22 million,other expense of $68 million pursuant to the Tax Sharing Agreement with Tyco International and Covidien, and an incometax benefit of $49 million attributable to adjustments to prior year tax returns. (See Notes 15, 4, 8, 11, 19, and 18 to theConsolidated and Combined Financial Statements.) Fiscal 2009 net loss includes $156 million of loss, net of income taxes,from discontinued operations. (See Note 5 to the Consolidated and Combined Financial Statements.)
(2) Fiscal 2008 income from continuing operations includes net pre-Separation litigation charges of $22 million, netrestructuring and other charges of $219 million, impairment of goodwill of $103 million, other income of $567 millionpursuant to the Tax Sharing Agreement with Tyco International and Covidien, and an income tax benefit of $33 millionrelated to the analysis and reconciliation of tax accounts. (See Notes 15, 4, 8, 19, and 18 to the Consolidated and CombinedFinancial Statements.) Fiscal 2008 net income includes $255 million of income, net of income taxes, from discontinuedoperations. (See Note 5 to the Consolidated and Combined Financial Statements.)
(3) Fiscal 2007 loss from continuing operations includes net pre-Separation litigation charges of $887 million, separation costsof $44 million, net restructuring and other charges of $92 million, and allocated loss on retirement of debt of $232 million.(See Notes 15, 3, 4, and 11 to the Consolidated and Combined Financial Statements.) Fiscal 2007 net loss includes$340 million of loss, net of income taxes, from discontinued operations. (See Note 5 to the Consolidated and CombinedFinancial Statements.)
(4) Fiscal 2006 net income includes a $201 million loss, net of income taxes, from discontinued operations as well as an$8 million loss, net of income taxes, related to the cumulative effect of accounting change recorded in conjunction with theadoption of ASC 410-20 (Asset Retirement and Environmental Obligations: Asset Retirement Obligations).
15
(5) Fiscal 2005 income from continuing operations includes a $301 million gain on the divestiture of the Tyco Global Networkas well as a $365 million loss on retirement of debt. Fiscal 2005 net income includes $184 million of income, net of incometaxes, from discontinued operations and an $11 million gain, net of income taxes, related to the cumulative effect ofaccounting change recorded in conjunction with the change in measurement date for pension and postretirement benefitplans.
(6) The Wireless Systems business met the held for sale and discontinued operations criteria in fiscal 2009. As such, we havereclassified amounts previously reported to reflect this business as discontinued operations in all periods presented. Foradditional information regarding discontinued operations, see ‘‘Management’s Discussion and Analysis of FinancialCondition and Results of Operations—Discontinued Operations’’ and Note 5 to the Consolidated and Combined FinancialStatements. In addition, in fiscal 2009, we reclassified certain expenses on the Consolidated and Combined Statements ofOperations. The reclassifications had no impact on previously reported operating income (loss), net income (loss), orearnings (loss) per share. All periods presented have been reclassified to conform to the current presentation. See Note 1to the Consolidated and Combined Financial Statements for additional information regarding the reclassifications.
(7) For all periods prior to our separation from Tyco International, basic and diluted earnings (loss) per share were calculatedutilizing the basic shares outstanding at June 29, 2007, the date of separation.
(8) Working capital is defined as current assets minus current liabilities.
MANAGEMENT’S DISCUSSION AND ANALYSIS OF FINANCIAL CONDITIONAND RESULTS OF OPERATIONS
The following discussion and analysis of our financial condition and results of operations should beread in conjunction with our Consolidated and Combined Financial Statements and the accompanyingnotes included elsewhere in this Annual Report. The following discussion may contain forward-lookingstatements that reflect our plans, estimates, and beliefs. Our actual results could differ materially fromthose discussed in these forward-looking statements. Factors that could cause or contribute to thesedifferences include those factors discussed below and elsewhere in this Annual Report, particularly in‘‘Risk Factors’’ and ‘‘Forward-Looking Information.’’
Change of Domicile
Effective June 25, 2009, Tyco Electronics Ltd. (‘‘Tyco Electronics’’ or the ‘‘Company’’), which maybe referred to as ‘‘we,’’ ‘‘us,’’ or ‘‘our’’) discontinued its existence as a Bermuda company as providedin the Bermuda Companies Act, and, in accordance with article 161 of the Swiss Federal Code onInternational Private Law, continued its existence as a Swiss corporation under articles 620 et seq. ofthe Swiss Code of Obligations. The rights of holders of our shares are now governed by Swiss law, ourSwiss articles of association, and our Swiss organizational regulations.
The Separation
Effective June 29, 2007, we became the parent company of the former electronics businesses ofTyco International Ltd. (‘‘Tyco International’’). On June 29, 2007, Tyco International distributed all ofits shares of Tyco Electronics, as well as its shares of its former healthcare businesses (‘‘Covidien’’), toits common shareholders (the ‘‘Separation’’).
Overview
The Consolidated and Combined Financial Statements reflect the consolidated operations of TycoElectronics Ltd. and its subsidiaries as an independent, publicly-traded entity subsequent to theSeparation and a combined reporting entity comprising the assets and liabilities used in managing andoperating the electronics businesses of Tyco International, including Tyco Electronics Ltd., for theperiod prior to the Separation.
16
Our Consolidated and Combined Financial Statements have been prepared in United StatesDollars, in accordance with accounting principles generally accepted in the United States of America(‘‘GAAP’’). The Consolidated and Combined Financial Statements for the period prior to theSeparation may not be indicative of our future performance and do not necessarily reflect what ourconsolidated and combined results of operations, financial position, and cash flows would have beenhad we operated as an independent, publicly-traded company prior to June 29, 2007. Certain generalcorporate overhead, net class action settlement costs, net interest expense, and other expenses for theperiod prior to the Separation were allocated to us by Tyco International. Management believes suchallocations were reasonable; however, they may not be indicative of our actual results had we beenoperating as an independent, publicly-traded company for the period prior to the Separation. SeeNote 17 to the Consolidated and Combined Financial Statements for further information regardingallocations.
We are a leading global provider of engineered electronic components, network solutions, specialtyproducts, and undersea telecommunication systems. We design, manufacture, and market approximately450,000 different products for customers in a broad array of industries including automotive; datacommunication systems and consumer electronics; telecommunications; aerospace, defense, and marine;medical; energy; and lighting. We believe the end markets that we sell into are balanced with the totalend market demand for our products.
We operate through four reporting segments: Electronic Components, Network Solutions, SpecialtyProducts, and Undersea Telecommunications. In May 2009, we sold our Wireless Systems businesswhich has been reclassified as discontinued operations. Prior to reclassification to held for sale anddiscontinued operations, this business was reported as our former Wireless Systems segment. Also,effective January 1, 2009, we established the Specialty Products Group from our existing businesses.The results of this new organization are reported as a separate reporting segment. This new segment iscomprised of the Aerospace, Defense, and Marine; Touch Systems; Medical; and Circuit Protectionbusinesses which were formerly reported in the Electronic Components segment. Prior period segmentinformation has been revised to conform to the current segment reporting structure in all periodspresented. See Notes 1 and 24 to the Consolidated and Combined Financial Statements for additionalinformation regarding our segments.
We service our customers primarily through our direct sales force that serves customers in over 150countries. The sales force is supported by approximately 7,000 engineers, as well as globally deployedmanufacturing sites. Through our sales force and engineering resources, we are able to collaborate withour customers throughout the world to provide highly engineered products and solutions to meet theirneeds.
Our strategic objective is to increase our revenue and profitability across all of our segments in themarkets we serve. This strategy is dependent upon the following strategic priorities:
• leverage our market leadership position to increase our market share;
• achieve market leadership in attractive and under-penetrated industries;
• extend our leadership in key emerging markets;
• supplement organic growth with strategic acquisitions;
• improve operating margins; and
• accelerate new product development through research and development excellence.
17
Key business factors that influenced our results of operations for the periods discussed in thisManagement’s Discussion and Analysis of Financial Condition and Results of Operations include:
• Raw material price increases. We purchased approximately 125 million pounds of copper and125,000 troy ounces of gold in fiscal 2009. During the periods shown, gold prices, as well as theprices of certain other raw materials, have been volatile and current year prices have increasedfrom prior year levels. Copper prices remain high relative to historic levels but have declinedover the past year. The following table sets forth the average prices incurred related to copperand gold during the periods presented:
Fiscal
Measure 2009 2008 2007
Copper . . . . . . . . . . . . . . . . . . . . . . . . . . . . . . . . Lb. $2.75 $3.40 $3.20Gold . . . . . . . . . . . . . . . . . . . . . . . . . . . . . . . . . . Troy oz. $ 878 $ 870 $ 653
In fiscal 2010, we expect to purchase approximately 125 million pounds of copper and 150,000troy ounces of gold.
• Foreign exchange. Approximately 50% of our net sales are invoiced in currencies other than theU.S. Dollar. Our results of operations are influenced by changes in foreign currency exchangerates. Increases or decreases in the value of the U.S. Dollar, compared to other currencies, willdirectly affect our reported results as we translate those currencies into U.S. Dollars at the endof each fiscal period. The percentage of net sales in fiscal 2009 by major currencies invoiced wasas follows:
U.S. Dollar . . . . . . . . . . . . . . . . . . . . . . . . . . . . . . . . . . . . . . . . . . . . . . . . . . 50%Euro . . . . . . . . . . . . . . . . . . . . . . . . . . . . . . . . . . . . . . . . . . . . . . . . . . . . . . 28Japanese Yen . . . . . . . . . . . . . . . . . . . . . . . . . . . . . . . . . . . . . . . . . . . . . . . . 7Chinese Renminbi . . . . . . . . . . . . . . . . . . . . . . . . . . . . . . . . . . . . . . . . . . . . . 4Brazilian Real . . . . . . . . . . . . . . . . . . . . . . . . . . . . . . . . . . . . . . . . . . . . . . . . 2British Pound Sterling . . . . . . . . . . . . . . . . . . . . . . . . . . . . . . . . . . . . . . . . . . 2Korean Won . . . . . . . . . . . . . . . . . . . . . . . . . . . . . . . . . . . . . . . . . . . . . . . . . 2All others . . . . . . . . . . . . . . . . . . . . . . . . . . . . . . . . . . . . . . . . . . . . . . . . . . . 5
Total . . . . . . . . . . . . . . . . . . . . . . . . . . . . . . . . . . . . . . . . . . . . . . . . . . . . . . 100%
Economic Conditions
Our business and operating results have been and will continue to be affected by worldwideeconomic conditions. Our sales are dependent on certain end markets that are impacted by consumeras well as industrial and infrastructure spending, and our operating results can be adversely affected byreduced demand in those markets. As a result of economic trends, we experienced a 28.6% decrease innet sales in fiscal 2009 as compared to fiscal 2008. We expect net sales in the first quarter of fiscal 2010to be $2.7 billion to $2.8 billion, a flat to 4% increase from fourth quarter fiscal 2009 levels, as a resultof continued improvements in consumer end markets, partially offset by a decline in net sales in ourUndersea Telecommunications segment.
We are monitoring the current environment and its potential effects on our customers and on theend markets we serve. Additionally, we continue to closely manage our costs in order to respond tochanging conditions. We are also managing our capital resources and monitoring capital availability toensure that we have sufficient resources to fund our future capital needs. (See further discussion in‘‘Liquidity and Capital Resources.’’)
18
We test goodwill allocated to reporting units for impairment annually during the fiscal fourthquarter, or more frequently if events occur or circumstances exist that indicate that a reporting unit’scarrying value may exceed its fair value. We completed our annual goodwill impairment test in thefourth quarter of fiscal 2009 and determined that no impairment existed.
As a result of declines in sales and profitability of the Automotive and Communications andIndustrial Solutions reporting units of the Electronic Components segment and the Circuit Protectionreporting unit of the Specialty Products segment during the second quarter of fiscal 2009, wedetermined that an indicator of impairment had occurred and goodwill impairment testing of thesereporting units was required. Significant judgment is involved in determining if an indicator ofimpairment has occurred. In making this assessment, we rely on a number of factors including, amongothers, operating results, business plans, economic projections, and anticipated future cash flows. Thereare inherent uncertainties related to these factors and management’s judgment in applying each to theanalysis of the recoverability of goodwill.
The testing for goodwill impairment is a two step process. In performing step I of impairmenttesting, we determined the fair value of the Automotive, Communications and Industrial Solutions, andCircuit Protection reporting units based on a discounted cash flows analysis incorporating our estimateof future operating performance. The results of the step I goodwill impairment tests indicated that thebook value of each of the reporting units exceeded its fair value. The failure of the step I goodwillimpairment tests triggered step II goodwill impairment tests in which we determined the implied fairvalue of the reporting units’ goodwill by comparing the reporting units’ fair value determined in step Ito the fair value of the reporting units’ net assets, including unrecognized intangible assets. The step IIgoodwill impairment tests resulted in a full impairment charge of $2,088 million for the Automotivereporting unit and partial impairment charges of $1,347 million and $112 million for theCommunications and Industrial Solutions and Circuit Protection reporting units, respectively, in thesecond quarter of fiscal 2009.
Discontinued Operations
During fiscal 2009, we entered into a definitive agreement to sell our Wireless Systems business. InMay 2009, we completed the sale for $664 million in net cash proceeds and recognized a pre-tax gainof $59 million on this transaction. The divestiture of the Wireless Systems business substantiallycompletes the streamlining of our portfolio that we began two years ago.
In September 2008, we completed the sale of the Radio Frequency Components and Subsystembusiness for net cash proceeds of $427 million and recorded a $184 million pre-tax gain on the sale. InSeptember 2008, we also completed the sale of the Automotive Radar Sensors business for net cashproceeds of $42 million and recorded a $31 million pre-tax gain on the sale. In fiscal 2009, we recordedan additional pre-tax gain on sale of $4 million in connection with the finalization of working capitaladjustments relating to the sale of the Radio Frequency Components and Subsystem and AutomotiveRadar Sensors businesses. Also during fiscal 2009, we received additional cash proceeds related toworking capital of $29 million in connection with the fiscal 2008 sale of the Radio FrequencyComponents and Subsystem and Automotive Radar Sensors businesses. The Consolidated BalanceSheet reflected the $29 million in prepaid expenses and other current assets at September 26, 2008.
The divestiture of our Power Systems business was authorized during fiscal 2007. As a result, weassessed Power Systems’ assets for impairment and determined that the book value of the PowerSystems business exceeded its estimated fair value. We recorded a $585 million pre-tax impairmentcharge in fiscal 2007 in income (loss) from discontinued operations, net of income taxes on theConsolidated and Combined Statement of Operations. In fiscal 2008, we completed the sale of thePower Systems business for $102 million in net cash proceeds and recorded a $51 million pre-tax gainon the sale.
19
In fiscal 2007, we completed the sale of the Printed Circuit Group business for $227 million in netcash proceeds and recorded a $45 million pre-tax gain on the sale.
The Wireless Systems, Radio Frequency Components and Subsystem, Automotive Radar Sensors,Power Systems, and Printed Circuit Group businesses have been included in discontinued operations in allperiods presented on our Consolidated and Combined Financial Statements. Prior to reclassification to heldfor sale and discontinued operations, the Wireless Systems, Radio Frequency Components and Subsystem,and Automotive Radar Sensors businesses were components of the former Wireless Systems segment. Boththe Power Systems and Printed Circuit Group businesses were components of the Other segment, whichwas subsequently renamed the Undersea Telecommunications segment. See Note 5 to the Consolidated andCombined Financial Statements for additional information regarding discontinued operations.
Other Divestitures
During fiscal 2009, we completed the sale of the Battery Systems business, which was part of theElectronic Components segment, for net cash proceeds of $14 million after working capitaladjustments. The divestiture resulted in a $7 million pre-tax loss on sale which is reflected inrestructuring and other charges, net on the Consolidated and Combined Statement of Operations. Wehave presented the loss on sale and the operations of the Battery Systems business in continuingoperations due to immateriality. See Note 4 to the Consolidated and Combined Financial Statementsfor additional information regarding the divestiture of the Battery Systems business.
Subsequent to fiscal year end 2009, we signed an agreement with a third party to sell the Dulmisonconnectors and fittings product line within our energy business for $16 million in cash, subject to finalworking capital adjustments. We expect the sale to be completed in the first quarter of fiscal 2010. Apre-tax impairment charge of $12 million was recorded in fiscal 2009 to write the carrying value of theassets and liabilities down to fair value. The charge is reflected in restructuring and other charges, net onthe Consolidated and Combined Statement of Operations. The product line, which was part of ourNetwork Solutions segment, generated sales of $53 million in fiscal 2009. See Note 4 to the Consolidatedand Combined Financial Statements for additional information regarding the impairment charge.
Manufacturing Simplification and Cost Actions due to Current Economic Environment
We plan to continue to simplify our global manufacturing footprint, by migrating facilities fromhigher-cost to lower-cost countries, consolidating within countries, and transferring product lines tolower-cost countries. These initiatives are designed to help us maintain our competitiveness in theindustry, improve our operating leverage, and position us for profitability growth in the years ahead.
We have closed a number of manufacturing facilities since we began our simplification program in2007. As of fiscal year end 2009, we had fewer than 100 manufacturing sites as compared to over 130at the end of fiscal 2006.
As a result of the current economic environment, we have accelerated workforce reductionsthrough the elimination of temporary workers, attrition, and reductions in force. In fiscal 2009, wereduced our headcount by 17%, or approximately 16,000 positions.
In connection with our manufacturing simplification plan and in response to the current economicenvironment, we expect to incur restructuring charges of approximately $350 million from fiscal 2010through 2011. In fiscal 2009, cash spending related to restructuring was approximately $260 million, andwe anticipate spending approximately $300 million in fiscal 2010. Cost savings related to these actionswere $200 million in fiscal 2009. Thereafter, annualized savings are expected to be $300 million,consisting of $200 million of manufacturing cost reductions and $100 million of savings in selling,general, and administrative expenses.
20

Non-GAAP Financial Measures
Organic net sales growth, which is included in the discussion below, is a non-GAAP financialmeasure. The difference between reported net sales growth (the most comparable GAAP measure) andorganic net sales growth (the non-GAAP measure) consists of the impact from foreign currencyexchange rates, acquisitions, and divestitures. Organic net sales growth is a useful measure of theunderlying results and trends in our business. It excludes items that are not completely undermanagement’s control, such as the impact of changes in foreign currency exchange rates, and items thatdo not reflect the underlying growth of the company, such as acquisition and divestiture activity.
We believe organic net sales growth provides useful information to investors because it reflects theunderlying growth from the ongoing activities of our business. Furthermore, it provides investors with aview of our operations from management’s perspective. We use organic net sales growth to monitorand evaluate performance, as it is an important measure of the underlying results of our operations.Management uses organic net sales growth together with GAAP measures such as net sales growth andoperating income in its decision making processes related to the operations of our reporting segmentsand our overall company. We believe that investors benefit from having access to the same financialmeasures that management uses in evaluating operations. The discussion and analysis of organic netsales growth in Results of Operations below utilizes organic net sales growth as management doesinternally. Because organic net sales growth calculations may vary among other companies, organic netsales growth amounts presented below may not be comparable with similarly titled measures of othercompanies. Organic net sales growth is a non-GAAP financial measure that is not meant to beconsidered in isolation or as a substitute for GAAP measures. The primary limitation of this measure isthat it excludes items that have an impact on our net sales. This limitation is best addressed byevaluating organic net sales growth in combination with our GAAP net sales. The tables presented inResults of Operations below provide reconciliations of organic net sales growth to net sales growthcalculated under GAAP.
21
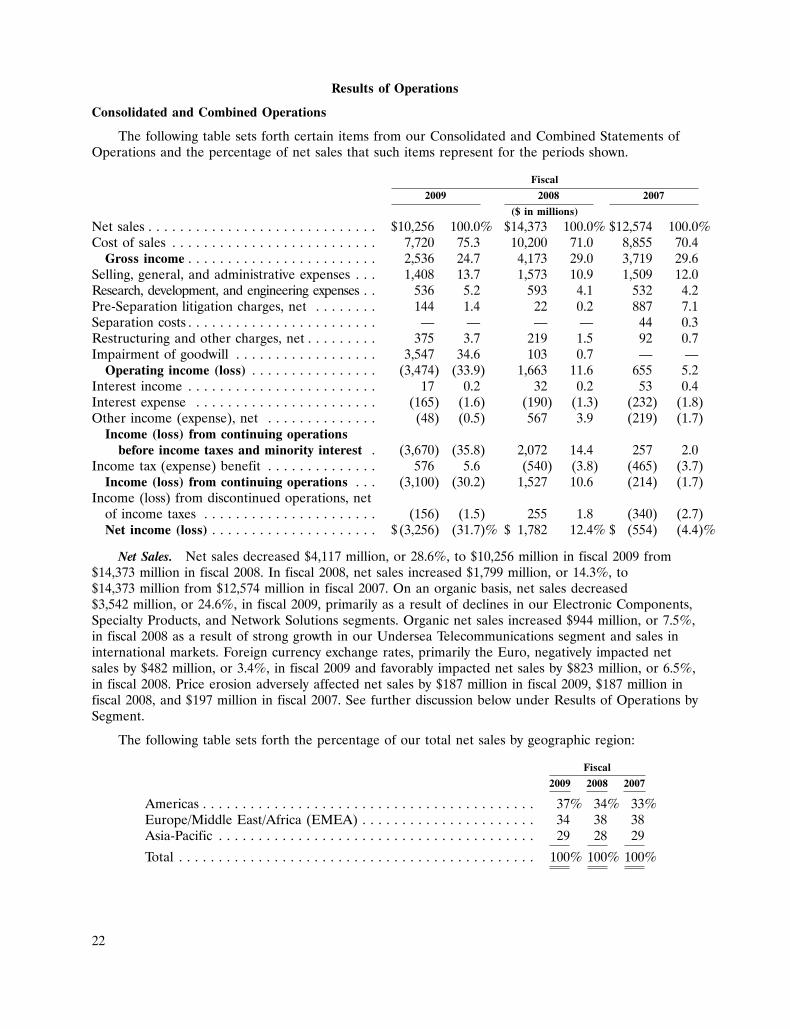
Results of Operations
Consolidated and Combined Operations
The following table sets forth certain items from our Consolidated and Combined Statements ofOperations and the percentage of net sales that such items represent for the periods shown.
Fiscal
2009 2008 2007
($ in millions)
Net sales . . . . . . . . . . . . . . . . . . . . . . . . . . . . . $10,256 100.0% $14,373 100.0% $12,574 100.0%Cost of sales . . . . . . . . . . . . . . . . . . . . . . . . . . 7,720 75.3 10,200 71.0 8,855 70.4
Gross income . . . . . . . . . . . . . . . . . . . . . . . . 2,536 24.7 4,173 29.0 3,719 29.6Selling, general, and administrative expenses . . . 1,408 13.7 1,573 10.9 1,509 12.0Research, development, and engineering expenses . . 536 5.2 593 4.1 532 4.2Pre-Separation litigation charges, net . . . . . . . . 144 1.4 22 0.2 887 7.1Separation costs . . . . . . . . . . . . . . . . . . . . . . . . — — — — 44 0.3Restructuring and other charges, net . . . . . . . . . 375 3.7 219 1.5 92 0.7Impairment of goodwill . . . . . . . . . . . . . . . . . . 3,547 34.6 103 0.7 — —
Operating income (loss) . . . . . . . . . . . . . . . . (3,474) (33.9) 1,663 11.6 655 5.2Interest income . . . . . . . . . . . . . . . . . . . . . . . . 17 0.2 32 0.2 53 0.4Interest expense . . . . . . . . . . . . . . . . . . . . . . . (165) (1.6) (190) (1.3) (232) (1.8)Other income (expense), net . . . . . . . . . . . . . . (48) (0.5) 567 3.9 (219) (1.7)
Income (loss) from continuing operationsbefore income taxes and minority interest . (3,670) (35.8) 2,072 14.4 257 2.0
Income tax (expense) benefit . . . . . . . . . . . . . . 576 5.6 (540) (3.8) (465) (3.7)Income (loss) from continuing operations . . . (3,100) (30.2) 1,527 10.6 (214) (1.7)
Income (loss) from discontinued operations, netof income taxes . . . . . . . . . . . . . . . . . . . . . . (156) (1.5) 255 1.8 (340) (2.7)Net income (loss) . . . . . . . . . . . . . . . . . . . . . $ (3,256) (31.7)% $ 1,782 12.4% $ (554) (4.4)%
Net Sales. Net sales decreased $4,117 million, or 28.6%, to $10,256 million in fiscal 2009 from$14,373 million in fiscal 2008. In fiscal 2008, net sales increased $1,799 million, or 14.3%, to$14,373 million from $12,574 million in fiscal 2007. On an organic basis, net sales decreased$3,542 million, or 24.6%, in fiscal 2009, primarily as a result of declines in our Electronic Components,Specialty Products, and Network Solutions segments. Organic net sales increased $944 million, or 7.5%,in fiscal 2008 as a result of strong growth in our Undersea Telecommunications segment and sales ininternational markets. Foreign currency exchange rates, primarily the Euro, negatively impacted netsales by $482 million, or 3.4%, in fiscal 2009 and favorably impacted net sales by $823 million, or 6.5%,in fiscal 2008. Price erosion adversely affected net sales by $187 million in fiscal 2009, $187 million infiscal 2008, and $197 million in fiscal 2007. See further discussion below under Results of Operations bySegment.
The following table sets forth the percentage of our total net sales by geographic region:
Fiscal
2009 2008 2007
Americas . . . . . . . . . . . . . . . . . . . . . . . . . . . . . . . . . . . . . . . . . . 37% 34% 33%Europe/Middle East/Africa (EMEA) . . . . . . . . . . . . . . . . . . . . . . 34 38 38Asia-Pacific . . . . . . . . . . . . . . . . . . . . . . . . . . . . . . . . . . . . . . . . 29 28 29
Total . . . . . . . . . . . . . . . . . . . . . . . . . . . . . . . . . . . . . . . . . . . . . 100% 100% 100%
22
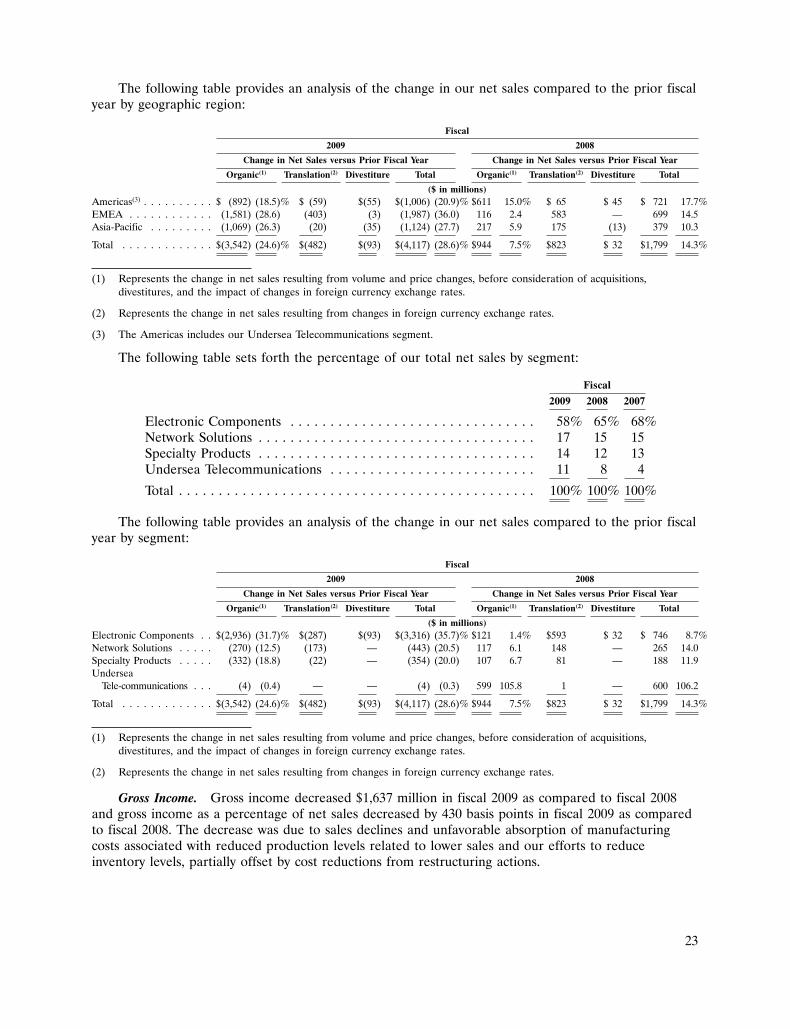
The following table provides an analysis of the change in our net sales compared to the prior fiscalyear by geographic region:
Fiscal
2009 2008
Change in Net Sales versus Prior Fiscal Year Change in Net Sales versus Prior Fiscal Year
Organic(1) Translation(2) Divestiture Total Organic(1) Translation(2) Divestiture Total
($ in millions)Americas(3) . . . . . . . . . . $ (892) (18.5)% $ (59) $(55) $(1,006) (20.9)% $611 15.0% $ 65 $ 45 $ 721 17.7%EMEA . . . . . . . . . . . . (1,581) (28.6) (403) (3) (1,987) (36.0) 116 2.4 583 — 699 14.5Asia-Pacific . . . . . . . . . (1,069) (26.3) (20) (35) (1,124) (27.7) 217 5.9 175 (13) 379 10.3
Total . . . . . . . . . . . . . $(3,542) (24.6)% $(482) $(93) $(4,117) (28.6)% $944 7.5% $823 $ 32 $1,799 14.3%
(1) Represents the change in net sales resulting from volume and price changes, before consideration of acquisitions,divestitures, and the impact of changes in foreign currency exchange rates.
(2) Represents the change in net sales resulting from changes in foreign currency exchange rates.
(3) The Americas includes our Undersea Telecommunications segment.
The following table sets forth the percentage of our total net sales by segment:
Fiscal
2009 2008 2007
Electronic Components . . . . . . . . . . . . . . . . . . . . . . . . . . . . . . . 58% 65% 68%Network Solutions . . . . . . . . . . . . . . . . . . . . . . . . . . . . . . . . . . . 17 15 15Specialty Products . . . . . . . . . . . . . . . . . . . . . . . . . . . . . . . . . . . 14 12 13Undersea Telecommunications . . . . . . . . . . . . . . . . . . . . . . . . . . 11 8 4
Total . . . . . . . . . . . . . . . . . . . . . . . . . . . . . . . . . . . . . . . . . . . . . 100% 100% 100%
The following table provides an analysis of the change in our net sales compared to the prior fiscalyear by segment:
Fiscal
2009 2008
Change in Net Sales versus Prior Fiscal Year Change in Net Sales versus Prior Fiscal Year
Organic(1) Translation(2) Divestiture Total Organic(1) Translation(2) Divestiture Total
($ in millions)Electronic Components . . $(2,936) (31.7)% $(287) $(93) $(3,316) (35.7)% $121 1.4% $593 $ 32 $ 746 8.7%Network Solutions . . . . . (270) (12.5) (173) — (443) (20.5) 117 6.1 148 — 265 14.0Specialty Products . . . . . (332) (18.8) (22) — (354) (20.0) 107 6.7 81 — 188 11.9Undersea
Tele-communications . . . (4) (0.4) — — (4) (0.3) 599 105.8 1 — 600 106.2
Total . . . . . . . . . . . . . $(3,542) (24.6)% $(482) $(93) $(4,117) (28.6)% $944 7.5% $823 $ 32 $1,799 14.3%
(1) Represents the change in net sales resulting from volume and price changes, before consideration of acquisitions,divestitures, and the impact of changes in foreign currency exchange rates.
(2) Represents the change in net sales resulting from changes in foreign currency exchange rates.
Gross Income. Gross income decreased $1,637 million in fiscal 2009 as compared to fiscal 2008and gross income as a percentage of net sales decreased by 430 basis points in fiscal 2009 as comparedto fiscal 2008. The decrease was due to sales declines and unfavorable absorption of manufacturingcosts associated with reduced production levels related to lower sales and our efforts to reduceinventory levels, partially offset by cost reductions from restructuring actions.
23
In fiscal 2008, gross income increased $454 million over fiscal 2007; however, gross income as apercentage of net sales decreased by 60 basis points. We were negatively impacted by lower volumegrowth in certain consumer related end markets in our Electronic Components segment and significantgrowth in our Undersea Telecommunications segment which has a margin below our Company average.
Selling, General, and Administrative Expenses. Selling, general, and administrative expenses as apercentage of net sales increased to 13.7% in fiscal 2009 as compared to 10.9% in fiscal 2008. In fiscal2009, results included a net loss of approximately $50 million primarily associated with economichedges of certain anticipated future transactions and resulting primarily from the devaluation of certaineastern European currencies. In fiscal 2008, selling, general, and administrative expenses included a$36 million gain on the sale of real estate related to our Electronic Components segment. Excludingthese items, selling, general, and administrative expenses decreased in fiscal 2009 from fiscal 2008, butincreased as a percentage of sales due to decreases in sales volume.
Selling, general, and administrative expenses as a percentage of net sales were 10.9% and 12.0% infiscal 2008 and 2007, respectively. As discussed above, in fiscal 2008, selling, general, and administrativeexpenses included a $36 million gain on the sale of real estate. Excluding this gain, selling, general, andadministrative expenses were lower as a percentage of sales in fiscal 2008 due to sales volume leverageof our overhead structure. In 2007, selling, general, and administrative expenses included allocatedoverhead expenses from Tyco International of $152 million. Also, we incurred costs of $41 million infiscal 2007 related to building separate company functions. A portion of these costs were duplicative infiscal 2007 as we were also allocated costs related to these functions from Tyco International until theSeparation date.
Research, Development, and Engineering Expenses. Research, development, and engineeringexpenses as a percentage of net sales increased to 5.2% in fiscal 2009 from 4.1% in fiscal 2008 and4.2% in fiscal 2007. The increase as a percentage of net sales in fiscal 2009 was due to decreases insales volume as well as our continued focus on future technologies within all four of our operatingsegments.
Pre-Separation Litigation Charges, Net. In fiscal 2009, we recorded charges of $144 million relatedto pre-Separation securities litigation. During the first six months of fiscal 2009, we, Tyco International,and Covidien entered into definitive agreements to settle actions captioned Hess v. TycoInternational Ltd., et al. and Sciallo v. Tyco International Ltd., et al. and opt-out cases brought by theCommonwealth of Massachusetts Pension Reserves Investment Management Board, Franklin MutualAdvisers, LLC and related plaintiffs, and the Public Employees’ Retirement Association of Colorado.Pursuant to the sharing formula in the Separation and Distribution Agreement, we recorded charges of$28 million for which no tax benefit was available. Additionally, in the second quarter of fiscal 2009, werecorded reserves totaling $375 million representing the best estimate of probable loss for theremaining securities litigation claims subject to the Separation and Distribution Agreement, includingremaining opt-out cases and cases arising under ERISA. As a result, we recorded a pre-tax charge inthe first six months of fiscal 2009 of $116 million for our share of the reserves. Upon final settlementof the ERISA cases in the fourth quarter of fiscal 2009, we recorded a $25 million tax benefit. Therewere no tax benefits attributable for the other cases.
During the third and fourth quarters of fiscal 2009, we, Tyco International, and Covidien, settledthe remaining opt-out cases for $201 million and eight consolidated class actions brought under ERISAagainst Tyco International and certain of our current and former employees, officers and directors for atotal of $70 million. Pursuant to the sharing formula, our share of the settlement amounts was$85 million. As we had previously established reserves for these opt-out cases and consolidated actionsduring the second quarter of fiscal 2009, the settlements did not impact our Consolidated andCombined Statement of Operations.
24

In fiscal 2008, we recorded a net charge of $22 million related to pre-Separation securitieslitigation. A charge of $11 million, for which no tax benefit was available, was recorded in connectionwith Tyco International’s settlement of previously disclosed securities litigation captioned Ballard v. TycoInternational Ltd., et al. for $36 million. Also, in connection with Tyco International’s settlement ofsecurities litigation with the State of New Jersey for $73 million, we recorded a charge of $23 million,for which no tax benefit was available. These charges represent our share of the settlement costs inaccordance with the sharing percentages included in the Separation and Distribution Agreement. Also,we recorded income of $12 million in fiscal 2008 related to Tyco International’s recovery of certaincosts from insurers.
In fiscal 2007, we were allocated a charge from Tyco International of $922 million for the classaction settlement, for which no tax benefit was available. In addition, in fiscal 2007, we were allocated$35 million of income relating to Tyco International’s expected recovery of certain costs from insurers.
See ‘‘Part I. Item 3. Legal Proceedings’’ and Note 15 to the Consolidated and Combined FinancialStatements for additional information regarding the class action settlement and the settlement ofpre-Separation securities litigation.
Separation Costs. In connection with the Separation, we incurred costs of $44 million in fiscal2007, primarily related to employee costs, including non-cash compensation expense of $11 millionrelated to the modification of share option awards at Separation and $12 million related to theacceleration of restricted share award vesting as a result of Separation. See Note 23 to theConsolidated and Combined Financial Statements for further information on the conversion of TycoInternational share option awards into Tyco Electronics share option awards.
Restructuring and Other Charges, Net. Net restructuring and other charges were $375 million infiscal 2009 as compared to $219 million in fiscal 2008. Total charges, including amounts reflected in costof sales, increased $145 million to $373 million in fiscal 2009 from $228 million in fiscal 2008. Increasesresulted primarily from new actions initiated in fiscal 2009 to reduce costs in response to marketconditions and primarily related to headcount reductions and manufacturing site closures in theElectronic Components, Network Solutions, and Specialty Products segments. Fiscal 2009 chargesincluded a long-lived asset impairment in our Network Solutions segment of $14 million primarilyrelated to the divestiture of the Dulmison connectors and fittings product line within our energybusiness. As discussed above, subsequent to fiscal year end 2009, we signed an agreement with a thirdparty to sell this product line. Fiscal 2008 charges included long-lived asset impairments in ourElectronic Components segment of $34 million, consisting of $22 million related to the divestiture ofour Battery Systems business and $12 million related to certain dedicated manufacturing lines servingthe North American automotive market.
In fiscal 2008, net restructuring and other charges were $219 million as compared to $92 million infiscal 2007. Total charges, including amounts reflected in cost of sales, were $228 million and$97 million in fiscal 2008 and 2007, respectively. As discussed above, fiscal 2008 charges includedlong-lived asset impairments of $34 million. Additional increases in fiscal 2008 over fiscal 2007 resultedfrom our strategic priority to simplify our manufacturing footprint. During fiscal 2008 and 2007, weinitiated restructuring actions primarily relating to the migration of product lines to lower-cost countriesand the exit of certain manufacturing operations in the Electronic Components and Network Solutionssegments. Restructuring charges recorded in both fiscal 2008 and 2007 primarily related to employeeseverance and benefits.
See Note 4 to the Consolidated and Combined Financial Statements for additional informationregarding net restructuring and other charges.
Impairment of Goodwill. During fiscal 2009, we recorded a goodwill impairment charge of$3,435 million in our Electronic Components segment, of which $2,088 million and $1,347 million
25
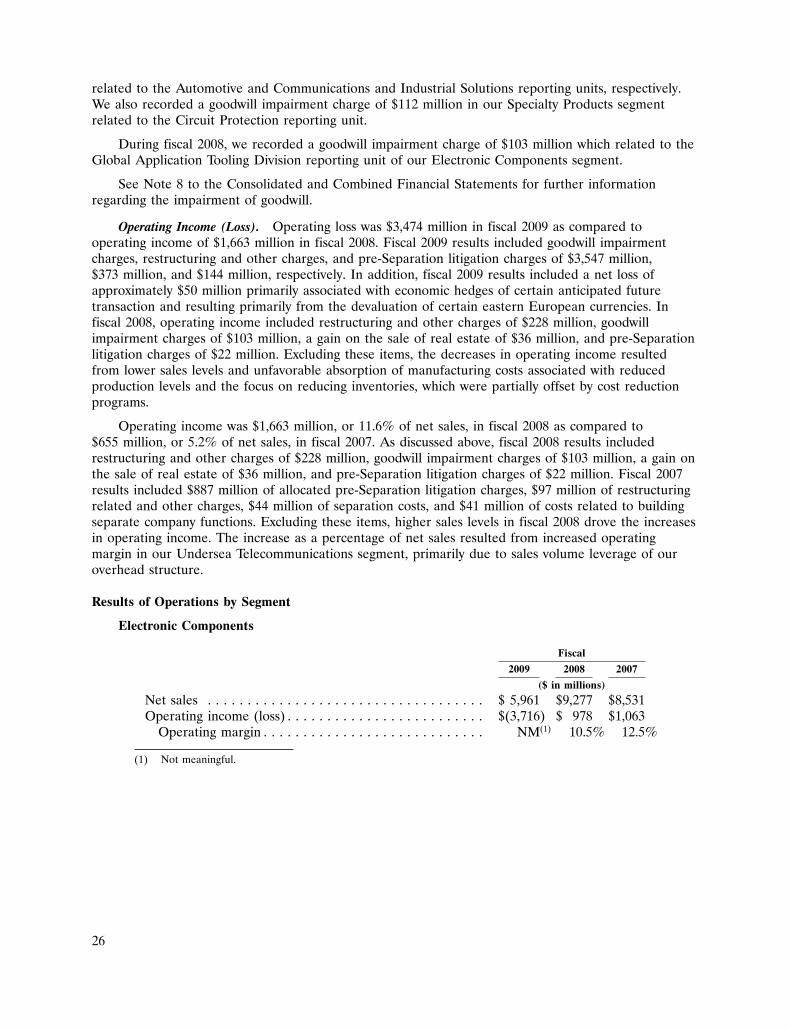
related to the Automotive and Communications and Industrial Solutions reporting units, respectively.We also recorded a goodwill impairment charge of $112 million in our Specialty Products segmentrelated to the Circuit Protection reporting unit.
During fiscal 2008, we recorded a goodwill impairment charge of $103 million which related to theGlobal Application Tooling Division reporting unit of our Electronic Components segment.
See Note 8 to the Consolidated and Combined Financial Statements for further informationregarding the impairment of goodwill.
Operating Income (Loss). Operating loss was $3,474 million in fiscal 2009 as compared tooperating income of $1,663 million in fiscal 2008. Fiscal 2009 results included goodwill impairmentcharges, restructuring and other charges, and pre-Separation litigation charges of $3,547 million,$373 million, and $144 million, respectively. In addition, fiscal 2009 results included a net loss ofapproximately $50 million primarily associated with economic hedges of certain anticipated futuretransaction and resulting primarily from the devaluation of certain eastern European currencies. Infiscal 2008, operating income included restructuring and other charges of $228 million, goodwillimpairment charges of $103 million, a gain on the sale of real estate of $36 million, and pre-Separationlitigation charges of $22 million. Excluding these items, the decreases in operating income resultedfrom lower sales levels and unfavorable absorption of manufacturing costs associated with reducedproduction levels and the focus on reducing inventories, which were partially offset by cost reductionprograms.
Operating income was $1,663 million, or 11.6% of net sales, in fiscal 2008 as compared to$655 million, or 5.2% of net sales, in fiscal 2007. As discussed above, fiscal 2008 results includedrestructuring and other charges of $228 million, goodwill impairment charges of $103 million, a gain onthe sale of real estate of $36 million, and pre-Separation litigation charges of $22 million. Fiscal 2007results included $887 million of allocated pre-Separation litigation charges, $97 million of restructuringrelated and other charges, $44 million of separation costs, and $41 million of costs related to buildingseparate company functions. Excluding these items, higher sales levels in fiscal 2008 drove the increasesin operating income. The increase as a percentage of net sales resulted from increased operatingmargin in our Undersea Telecommunications segment, primarily due to sales volume leverage of ouroverhead structure.
Results of Operations by Segment
Electronic Components
Fiscal
2009 2008 2007
($ in millions)
Net sales . . . . . . . . . . . . . . . . . . . . . . . . . . . . . . . . . . . $ 5,961 $9,277 $8,531Operating income (loss) . . . . . . . . . . . . . . . . . . . . . . . . . $(3,716) $ 978 $1,063
Operating margin . . . . . . . . . . . . . . . . . . . . . . . . . . . . NM(1) 10.5% 12.5%
(1) Not meaningful.
26
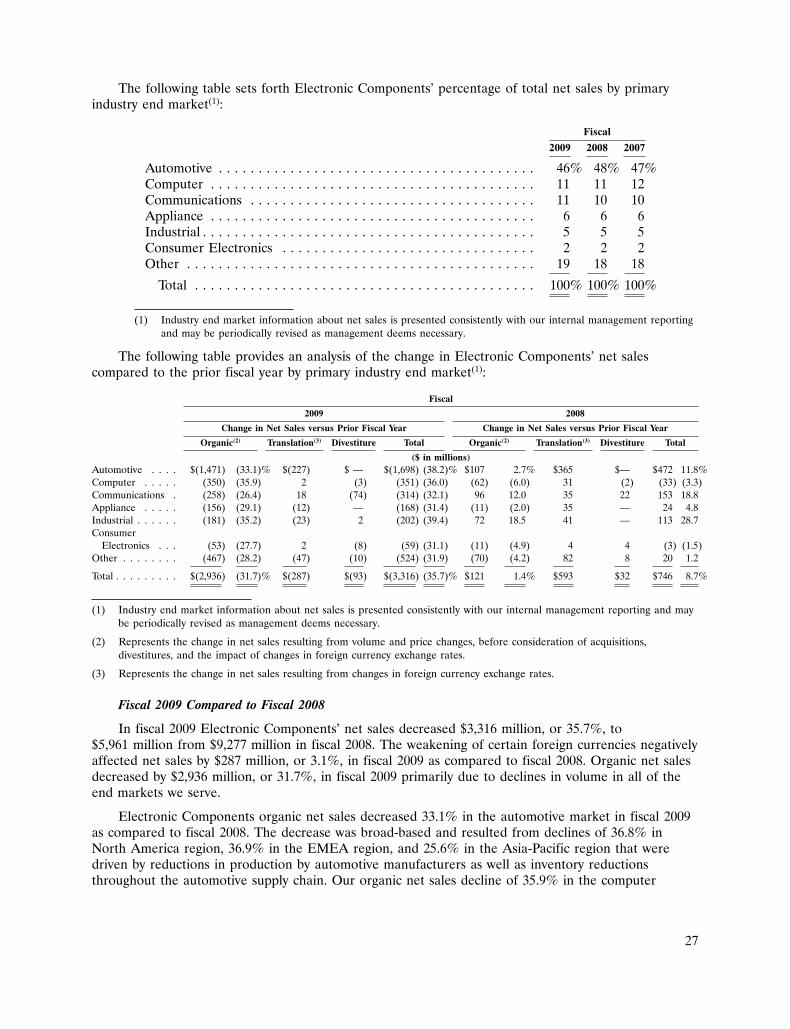
The following table sets forth Electronic Components’ percentage of total net sales by primaryindustry end market(1):
Fiscal
2009 2008 2007
Automotive . . . . . . . . . . . . . . . . . . . . . . . . . . . . . . . . . . . . . . . . 46% 48% 47%Computer . . . . . . . . . . . . . . . . . . . . . . . . . . . . . . . . . . . . . . . . . 11 11 12Communications . . . . . . . . . . . . . . . . . . . . . . . . . . . . . . . . . . . . 11 10 10Appliance . . . . . . . . . . . . . . . . . . . . . . . . . . . . . . . . . . . . . . . . . 6 6 6Industrial . . . . . . . . . . . . . . . . . . . . . . . . . . . . . . . . . . . . . . . . . . 5 5 5Consumer Electronics . . . . . . . . . . . . . . . . . . . . . . . . . . . . . . . . 2 2 2Other . . . . . . . . . . . . . . . . . . . . . . . . . . . . . . . . . . . . . . . . . . . . 19 18 18
Total . . . . . . . . . . . . . . . . . . . . . . . . . . . . . . . . . . . . . . . . . . . 100% 100% 100%
(1) Industry end market information about net sales is presented consistently with our internal management reportingand may be periodically revised as management deems necessary.
The following table provides an analysis of the change in Electronic Components’ net salescompared to the prior fiscal year by primary industry end market(1):
Fiscal
2009 2008
Change in Net Sales versus Prior Fiscal Year Change in Net Sales versus Prior Fiscal Year
Organic(2) Translation(3) Divestiture Total Organic(2) Translation(3) Divestiture Total
($ in millions)Automotive . . . . $(1,471) (33.1)% $(227) $ — $(1,698) (38.2)% $107 2.7% $365 $— $472 11.8%Computer . . . . . (350) (35.9) 2 (3) (351) (36.0) (62) (6.0) 31 (2) (33) (3.3)Communications . (258) (26.4) 18 (74) (314) (32.1) 96 12.0 35 22 153 18.8Appliance . . . . . (156) (29.1) (12) — (168) (31.4) (11) (2.0) 35 — 24 4.8Industrial . . . . . . (181) (35.2) (23) 2 (202) (39.4) 72 18.5 41 — 113 28.7Consumer
Electronics . . . (53) (27.7) 2 (8) (59) (31.1) (11) (4.9) 4 4 (3) (1.5)Other . . . . . . . . (467) (28.2) (47) (10) (524) (31.9) (70) (4.2) 82 8 20 1.2
Total . . . . . . . . . $(2,936) (31.7)% $(287) $(93) $(3,316) (35.7)% $121 1.4% $593 $32 $746 8.7%
(1) Industry end market information about net sales is presented consistently with our internal management reporting and maybe periodically revised as management deems necessary.
(2) Represents the change in net sales resulting from volume and price changes, before consideration of acquisitions,divestitures, and the impact of changes in foreign currency exchange rates.
(3) Represents the change in net sales resulting from changes in foreign currency exchange rates.
Fiscal 2009 Compared to Fiscal 2008
In fiscal 2009 Electronic Components’ net sales decreased $3,316 million, or 35.7%, to$5,961 million from $9,277 million in fiscal 2008. The weakening of certain foreign currencies negativelyaffected net sales by $287 million, or 3.1%, in fiscal 2009 as compared to fiscal 2008. Organic net salesdecreased by $2,936 million, or 31.7%, in fiscal 2009 primarily due to declines in volume in all of theend markets we serve.
Electronic Components organic net sales decreased 33.1% in the automotive market in fiscal 2009as compared to fiscal 2008. The decrease was broad-based and resulted from declines of 36.8% inNorth America region, 36.9% in the EMEA region, and 25.6% in the Asia-Pacific region that weredriven by reductions in production by automotive manufacturers as well as inventory reductionsthroughout the automotive supply chain. Our organic net sales decline of 35.9% in the computer
27
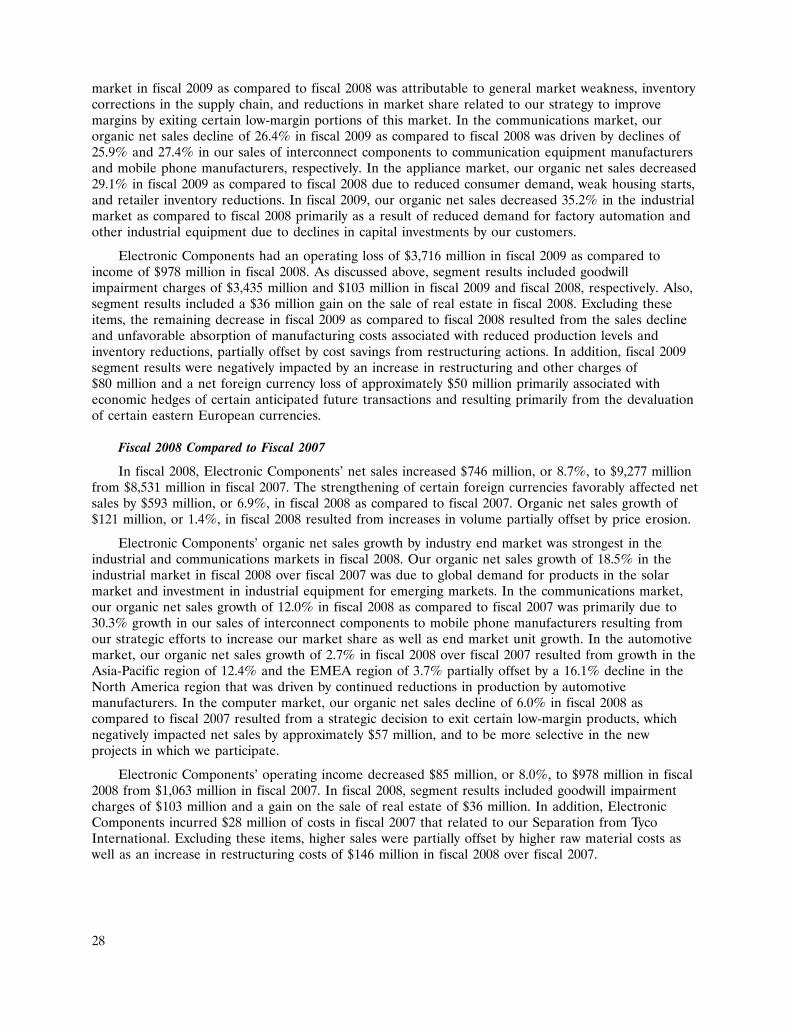
market in fiscal 2009 as compared to fiscal 2008 was attributable to general market weakness, inventorycorrections in the supply chain, and reductions in market share related to our strategy to improvemargins by exiting certain low-margin portions of this market. In the communications market, ourorganic net sales decline of 26.4% in fiscal 2009 as compared to fiscal 2008 was driven by declines of25.9% and 27.4% in our sales of interconnect components to communication equipment manufacturersand mobile phone manufacturers, respectively. In the appliance market, our organic net sales decreased29.1% in fiscal 2009 as compared to fiscal 2008 due to reduced consumer demand, weak housing starts,and retailer inventory reductions. In fiscal 2009, our organic net sales decreased 35.2% in the industrialmarket as compared to fiscal 2008 primarily as a result of reduced demand for factory automation andother industrial equipment due to declines in capital investments by our customers.
Electronic Components had an operating loss of $3,716 million in fiscal 2009 as compared toincome of $978 million in fiscal 2008. As discussed above, segment results included goodwillimpairment charges of $3,435 million and $103 million in fiscal 2009 and fiscal 2008, respectively. Also,segment results included a $36 million gain on the sale of real estate in fiscal 2008. Excluding theseitems, the remaining decrease in fiscal 2009 as compared to fiscal 2008 resulted from the sales declineand unfavorable absorption of manufacturing costs associated with reduced production levels andinventory reductions, partially offset by cost savings from restructuring actions. In addition, fiscal 2009segment results were negatively impacted by an increase in restructuring and other charges of$80 million and a net foreign currency loss of approximately $50 million primarily associated witheconomic hedges of certain anticipated future transactions and resulting primarily from the devaluationof certain eastern European currencies.
Fiscal 2008 Compared to Fiscal 2007
In fiscal 2008, Electronic Components’ net sales increased $746 million, or 8.7%, to $9,277 millionfrom $8,531 million in fiscal 2007. The strengthening of certain foreign currencies favorably affected netsales by $593 million, or 6.9%, in fiscal 2008 as compared to fiscal 2007. Organic net sales growth of$121 million, or 1.4%, in fiscal 2008 resulted from increases in volume partially offset by price erosion.
Electronic Components’ organic net sales growth by industry end market was strongest in theindustrial and communications markets in fiscal 2008. Our organic net sales growth of 18.5% in theindustrial market in fiscal 2008 over fiscal 2007 was due to global demand for products in the solarmarket and investment in industrial equipment for emerging markets. In the communications market,our organic net sales growth of 12.0% in fiscal 2008 as compared to fiscal 2007 was primarily due to30.3% growth in our sales of interconnect components to mobile phone manufacturers resulting fromour strategic efforts to increase our market share as well as end market unit growth. In the automotivemarket, our organic net sales growth of 2.7% in fiscal 2008 over fiscal 2007 resulted from growth in theAsia-Pacific region of 12.4% and the EMEA region of 3.7% partially offset by a 16.1% decline in theNorth America region that was driven by continued reductions in production by automotivemanufacturers. In the computer market, our organic net sales decline of 6.0% in fiscal 2008 ascompared to fiscal 2007 resulted from a strategic decision to exit certain low-margin products, whichnegatively impacted net sales by approximately $57 million, and to be more selective in the newprojects in which we participate.
Electronic Components’ operating income decreased $85 million, or 8.0%, to $978 million in fiscal2008 from $1,063 million in fiscal 2007. In fiscal 2008, segment results included goodwill impairmentcharges of $103 million and a gain on the sale of real estate of $36 million. In addition, ElectronicComponents incurred $28 million of costs in fiscal 2007 that related to our Separation from TycoInternational. Excluding these items, higher sales were partially offset by higher raw material costs aswell as an increase in restructuring costs of $146 million in fiscal 2008 over fiscal 2007.
28
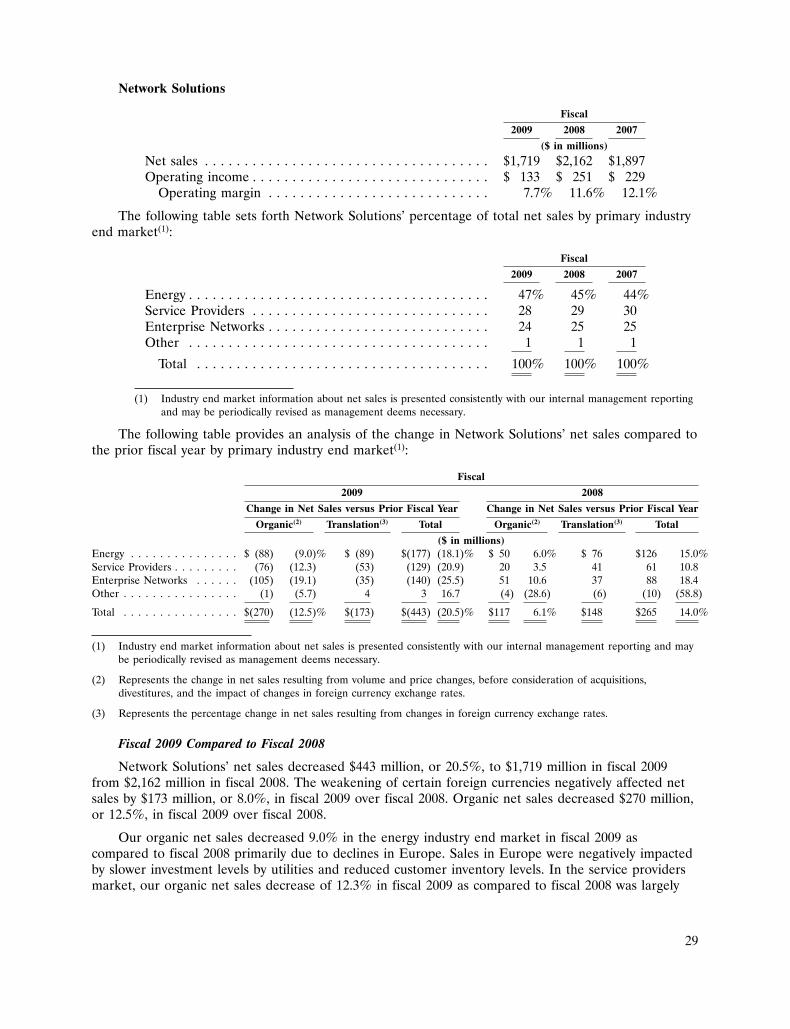
Network Solutions
Fiscal
2009 2008 2007
($ in millions)
Net sales . . . . . . . . . . . . . . . . . . . . . . . . . . . . . . . . . . . . $1,719 $2,162 $1,897Operating income . . . . . . . . . . . . . . . . . . . . . . . . . . . . . . $ 133 $ 251 $ 229
Operating margin . . . . . . . . . . . . . . . . . . . . . . . . . . . . 7.7% 11.6% 12.1%
The following table sets forth Network Solutions’ percentage of total net sales by primary industryend market(1):
Fiscal
2009 2008 2007
Energy . . . . . . . . . . . . . . . . . . . . . . . . . . . . . . . . . . . . . . 47% 45% 44%Service Providers . . . . . . . . . . . . . . . . . . . . . . . . . . . . . . 28 29 30Enterprise Networks . . . . . . . . . . . . . . . . . . . . . . . . . . . . 24 25 25Other . . . . . . . . . . . . . . . . . . . . . . . . . . . . . . . . . . . . . . 1 1 1
Total . . . . . . . . . . . . . . . . . . . . . . . . . . . . . . . . . . . . . 100% 100% 100%
(1) Industry end market information about net sales is presented consistently with our internal management reportingand may be periodically revised as management deems necessary.
The following table provides an analysis of the change in Network Solutions’ net sales compared tothe prior fiscal year by primary industry end market(1):
Fiscal
2009 2008
Change in Net Sales versus Prior Fiscal Year Change in Net Sales versus Prior Fiscal Year
Organic(2) Translation(3) Total Organic(2) Translation(3) Total
($ in millions)Energy . . . . . . . . . . . . . . . $ (88) (9.0)% $ (89) $(177) (18.1)% $ 50 6.0% $ 76 $126 15.0%Service Providers . . . . . . . . . (76) (12.3) (53) (129) (20.9) 20 3.5 41 61 10.8Enterprise Networks . . . . . . (105) (19.1) (35) (140) (25.5) 51 10.6 37 88 18.4Other . . . . . . . . . . . . . . . . (1) (5.7) 4 3 16.7 (4) (28.6) (6) (10) (58.8)
Total . . . . . . . . . . . . . . . . $(270) (12.5)% $(173) $(443) (20.5)% $117 6.1% $148 $265 14.0%
(1) Industry end market information about net sales is presented consistently with our internal management reporting and maybe periodically revised as management deems necessary.
(2) Represents the change in net sales resulting from volume and price changes, before consideration of acquisitions,divestitures, and the impact of changes in foreign currency exchange rates.
(3) Represents the percentage change in net sales resulting from changes in foreign currency exchange rates.
Fiscal 2009 Compared to Fiscal 2008
Network Solutions’ net sales decreased $443 million, or 20.5%, to $1,719 million in fiscal 2009from $2,162 million in fiscal 2008. The weakening of certain foreign currencies negatively affected netsales by $173 million, or 8.0%, in fiscal 2009 over fiscal 2008. Organic net sales decreased $270 million,or 12.5%, in fiscal 2009 over fiscal 2008.
Our organic net sales decreased 9.0% in the energy industry end market in fiscal 2009 ascompared to fiscal 2008 primarily due to declines in Europe. Sales in Europe were negatively impactedby slower investment levels by utilities and reduced customer inventory levels. In the service providersmarket, our organic net sales decrease of 12.3% in fiscal 2009 as compared to fiscal 2008 was largely
29
due to a general slowing of capital spending by telecommunications companies. Our organic sales in theenterprise networks market decreased 19.1% in fiscal 2009 as compared to fiscal 2008 as a result ofglobal declines in commercial construction and delayed investment in network upgrades.
Network Solutions’ operating income decreased $118 million, or 47.0%, to $133 million in fiscal2009 from $251 million in fiscal 2008. The decrease was the result of decreased sales, unfavorableabsorption of manufacturing costs associated with reduced production levels and our targeted inventoryreductions, and an increase in restructuring and other charges of $34 million in fiscal 2009 as comparedto fiscal 2008.
Fiscal 2008 Compared to Fiscal 2007
Network Solutions’ net sales increased $265 million, or 14.0%, to $2,162 million in fiscal 2008 from$1,897 million in fiscal 2007. The strengthening of certain foreign currencies favorably affected net salesby $148 million, or 7.9%, in fiscal 2008 over fiscal 2007. Organic net sales growth was $117 million, or6.1%, in fiscal 2008 over fiscal 2007.
On an organic basis, Network Solutions’ net sales growth was strongest in the enterprise networksindustry end market in fiscal 2008 over fiscal 2007 with growth of 10.6% attributable to strong globaldemand for faster, higher capacity, and more secure networks. In the energy market, our organic netsales growth of 6.0% in fiscal 2008 as compared to fiscal 2007 was attributable to solid growth inEMEA, Asia, and North America. In western Europe and North America, growth resulted from theupgrade of aging power grids and the demand for alternate energy sources. In emerging markets withinAsia and eastern Europe, growth was due to the build-out of energy infrastructure. In the serviceproviders market, our organic net sales growth of 3.5% in fiscal 2008 over fiscal 2007 reflects increasedspending levels at certain U.S. telecommunications carriers that more than offset declines in EMEA.
Network Solutions’ operating income increased $22 million, or 9.6%, to $251 million in fiscal 2008from $229 million in fiscal 2007. The operating income increase resulted from increases in volume anda decrease in restructuring costs of $14 million partially offset by a lower margin product mix and lowerproductivity levels in fiscal 2008 as compared to fiscal 2007. In addition, Network Solutions incurred$5 million of costs in fiscal 2007 that related to our Separation from Tyco International.
Specialty Products
Fiscal
2009 2008 2007
($ in millions)
Net sales . . . . . . . . . . . . . . . . . . . . . . . . . . . . . . . . . . . . $1,415 $1,769 $1,581Operating income . . . . . . . . . . . . . . . . . . . . . . . . . . . . . . $ 34 $ 296 $ 258
Operating margin . . . . . . . . . . . . . . . . . . . . . . . . . . . . 2.4% 16.7% 16.3%
The following table sets forth Specialty Products’ percentage of total net sales by primary industryend market(1):
Fiscal
2009 2008 2007
Aerospace, Defense, and Marine . . . . . . . . . . . . . . . . . . . 44% 42% 41%Touch Systems . . . . . . . . . . . . . . . . . . . . . . . . . . . . . . . . 24 25 25Medical . . . . . . . . . . . . . . . . . . . . . . . . . . . . . . . . . . . . . 17 16 16Circuit Protection . . . . . . . . . . . . . . . . . . . . . . . . . . . . . . 15 17 18
Total . . . . . . . . . . . . . . . . . . . . . . . . . . . . . . . . . . . . . 100% 100% 100%
(1) Industry end market information about net sales is presented consistently with our internal management reportingand may be periodically revised as management deems necessary.
30
The following table provides an analysis of the change in Specialty Products’ net sales compared tothe prior fiscal year by primary industry end market(1):
Fiscal
2009 2008
Change in Net Sales versus Prior Fiscal Year Change in Net Sales versus Prior Fiscal Year
Organic(2) Translation(3) Total Organic(2) Translation(3) Total
($ in millions)Aerospace, Defense, and
Marine . . . . . . . . . . . . . $(104) (14.0)% $(18) $(122) (16.4)% $ 65 9.9% $28 $ 93 14.3%Touch Systems . . . . . . . . . . (106) (23.7) (10) (116) (26.0) 33 8.5 23 56 14.4Medical . . . . . . . . . . . . . . (23) (8.6) (2) (25) (9.3) 3 1.0 8 11 4.2Circuit Protection . . . . . . . . (99) (32.1) 8 (91) (29.5) 6 2.3 22 28 10.0
Total . . . . . . . . . . . . . . . . $(332) (18.8)% $(22) $(354) (20.0)% $107 6.7% $81 $188 11.9%
(1) Industry end market information about net sales is presented consistently with our internal management reporting and maybe periodically revised as management deems necessary.
(2) Represents the change in net sales resulting from volume and price changes, before consideration of acquisitions,divestitures, and the impact of changes in foreign currency exchange rates.
(3) Represents the percentage change in net sales resulting from changes in foreign currency exchange rates.
Fiscal 2009 Compared to Fiscal 2008
In fiscal 2009, Specialty Products’ net sales decreased $354 million, or 20.0%, to $1,415 millionfrom $1,769 million in fiscal 2008. The weakening of certain foreign currencies negatively affected netsales by $22 million, or 1.2%, in fiscal 2009 as compared to fiscal 2008. Organic net sales decreased$332 million, or 18.8%, in fiscal 2009 as compared to fiscal 2008.
Our organic net sales declined 14.0% in the aerospace, defense, and marine market in fiscal 2009as compared to fiscal 2008 as a result of slowing demand for commercial aircraft and inventorycorrections in the supply chain. In the touch systems market, our organic net sales decreased 23.7% infiscal 2009 from fiscal 2008 due to global weakness in demand from the retail market. In the medicalmarket, our organic net sales decrease of 8.6% in fiscal 2009 as compared to fiscal 2008 was due toinventory corrections in the supply chain and delayed capital spending by most healthcare providers.On an organic basis, our net sales decline of 32.1% in the circuit protection market in fiscal 2009 ascompared to fiscal 2008 was due to reduced original equipment manufacturer production levels as wellas significant inventory corrections in the supply chain.
Specialty Products’ operating results decreased $262 million to $34 million in fiscal 2009 from$296 million in fiscal 2008. As discussed above, segment results included a goodwill impairment chargeof $112 million in fiscal 2009. The remaining decrease in operating results was due to lower sales,unfavorable absorption of manufacturing costs associated with reduced production levels and ourtargeted inventory reductions, and an increase in restructuring and other charges of $28 million in fiscal2009 as compared to fiscal 2008.
Fiscal 2008 Compared to Fiscal 2007
In fiscal 2008, Specialty Products’ net sales increased $188 million, or 11.9%, to $1,769 millionfrom $1,581 million in fiscal 2007. The strengthening of certain foreign currencies favorably affected netsales by $81 million, or 5.2%, in fiscal 2008 over fiscal 2007. Organic net sales growth of $107 million,or 6.7%, in fiscal 2008 over fiscal 2007 primarily related to sales of products to the aerospace, defense,and marine and touch systems markets.
In the aerospace, defense, and marine market, our organic net sales growth of 9.9% in fiscal 2008as compared to fiscal 2007 was primarily attributable to strong demand in the commercial aviation
31

market and spending for certain defense programs. Our organic net sales in the touch systems marketincreased 8.5% in fiscal 2008 as compared to fiscal 2007 largely due to the growing use of touch screeninterfaces in numerous markets, particularly in the retail, gaming, medical, and industrial markets. Inthe circuit protection market, our organic net sales growth slowed to 2.3% in fiscal 2008 as comparedto fiscal 2007 as a result of slowing growth in demand in the lithium-ion battery market for much offiscal 2008 and the supply chain inventory correction in this market in late fiscal 2008. In the medicalmarket, our organic net sales increase of 1.0% in fiscal 2008 as compared to fiscal 2007 reflected higherdemand in surgical and imaging applications that was largely offset by the exit of certain low marginbusiness in patient monitoring applications.
Specialty Products’ operating results increased $38 million to $296 million in fiscal 2008 from$258 million in fiscal 2007. The operating income increase resulted from increases in volume and ahigher margin product mix in fiscal 2008 as compared to fiscal 2007. These increases were partiallyoffset by an increase in research, development, and engineering of $16 million. In addition, SpecialtyProducts incurred $8 million of costs in fiscal 2008 related to a customs settlement. In fiscal 2007,Specialty Products also incurred $7 million of costs that related to our Separation from TycoInternational.
Undersea Telecommunications
Fiscal
2009 2008 2007
($ in millions)
Net sales . . . . . . . . . . . . . . . . . . . . . . . . . . . . . . . . . . . . . $1,161 $1,165 $565Operating income . . . . . . . . . . . . . . . . . . . . . . . . . . . . . . . $ 219 $ 160 $ 36
Operating margin . . . . . . . . . . . . . . . . . . . . . . . . . . . . . 18.9% 13.7% 6.4%
Fiscal 2009 Compared to Fiscal 2008
In fiscal 2009, Undersea Telecommunications’ net sales decreased $4 million, or 0.3%, to$1,161 million from $1,165 million in fiscal 2008. Undersea Telecommunications’ organic net salesdecreased 0.4% in fiscal 2009 as compared to fiscal 2008 as revenue from existing and new projectsoffset the reduction caused by the completion, in fiscal 2008, of a transoceanic system that connectsU.S. and China.
In fiscal 2009, Undersea Telecommunications’ operating income increased $59 million to$219 million from $160 million in fiscal 2008. The decrease in income from the transoceanic system andan increase in restructuring and other charges of $3 million were more than offset by income fromexisting and new projects and favorable project mix in fiscal 2009 as compared to fiscal 2008.
Fiscal 2008 Compared to Fiscal 2007
In fiscal 2008, Undersea Telecommunications’ net sales increased $600 million, or 106.2%, to$1,165 million from $565 million in fiscal 2007. This growth was attributable to our execution of theconstruction of a transoceanic system that connects the U.S. and China, as well as several otherprojects, including large projects in Asia, Africa, North America, and Europe.
In fiscal 2008, Undersea Telecommunications’ operating income increased $124 million to$160 million from $36 million in fiscal 2007 as a result of increased volumes and improved operatingleverage. Segment results included $1 million of costs in fiscal 2007 that related to our Separation fromTyco International.
32
Non-Operating Items
Interest Expense, Net
Net interest expense was $148 million in fiscal 2009 as compared to $158 million in fiscal 2008 and$179 million in fiscal 2007. The decrease of $10 million, or 6.3%, in fiscal 2009 from fiscal 2008 as wellas the decrease of $21 million, or 11.7%, in fiscal 2008 from fiscal 2007 was driven by lower averagedebt levels resulting in lower interest expense partially offset by lower interest income.
A portion of Tyco International’s net interest expense was allocated to us through June 1, 2007.During fiscal 2007, we were allocated net interest expense of $130 million, which included the impactof Tyco International’s interest rate swaps. Management believes the net interest expense allocationbasis was reasonable; however, these amounts may not be indicative of the actual amounts that wewould have incurred had we been operating as an independent, publicly-traded company for the periodprior to Separation.
Other Income (Expense), Net
In fiscal 2009, we recorded net other expense of $48 million, consisting of $68 million of expensepursuant to the Tax Sharing Agreement with Tyco International and Covidien, a $22 million gain on theretirement of debt, and $2 million of unrealized losses on rabbi trust assets. The $68 million of expenseis attributable to a net reduction of an indemnification asset primarily as a result of the settlement ofvarious matters with the IRS. See Note 15 to the Consolidated and Combined Financial Statements forfurther information regarding the Tax Sharing Agreement. See Note 11 to the Consolidated andCombined Financial Statements for additional information regarding the gain on retirement of debt.
In fiscal 2008, we recorded other income of $567 million, pursuant to the Tax Sharing Agreementwith Tyco International and Covidien, of which $545 million related to certain incremental tax liabilitiesrecorded in connection with the adoption of the uncertain tax position provisions of AccountingStandards Codification (‘‘ASC’’) 740 (Income Taxes). See Note 18 to the Consolidated and CombinedFinancial Statements for additional information regarding the adoption of the uncertain tax positionprovisions of ASC 740.
Net other expense of $219 million in fiscal 2007 includes an allocation from Tyco International of$232 million for loss on retirement of debt. See Note 11 to the Consolidated and Combined FinancialStatements for additional information. Additionally, in fiscal 2007, we recorded other income of$13 million pursuant to the Tax Sharing Agreement with Tyco International and Covidien.
Income Taxes
Our operations are conducted through our various subsidiaries in a number of countriesthroughout the world. We have provided for income taxes based upon the tax laws and rates in thecountries in which our operations are conducted and income and loss from operations is subject totaxation. In fiscal 2009, we changed our place of incorporation from Bermuda to Switzerland. We donot expect the change to materially impact our tax provision or cash tax burden.
Our effective tax rate was 15.7% for fiscal 2009 and includes the effects of the $3,547 millionpre-tax impairment of goodwill for which a partial tax benefit of $523 million was recorded, a$28 million charge related to the settlement of a tax matter, a $144 million pre-tax charge related topre-Separation securities litigation for which a partial tax benefit of $25 million was recorded, and a$24 million detriment related to a $68 million pre-tax expense recognized pursuant to our Tax SharingAgreement with Tyco International and Covidien. Additionally, the effective tax rate for fiscal 2009reflects adjustments related to prior years tax returns, including a $49 million tax benefit.
Our effective income tax rate was 26.1% for fiscal 2008 and includes a benefit of $198 millionprimarily related to the pre-tax income of $545 million recognized in connection with our adoption ofthe uncertain tax position provisions of ASC 740, for which no tax was provided. The effective tax rate
33
was also impacted by increased accruals in fiscal 2008 of interest related to uncertain tax positionspartially offset by a $42 million benefit associated with a favorable settlement with a taxing authorityfor certain pre-Separation tax issues. In addition, the effective tax rate for fiscal 2008 reflects thebenefits of increased profitability in operations in lower tax rate jurisdictions, a $33 million benefitrelated to adjustments to tax account balances, a $25 million increase in the valuation allowance relatedto restructuring charges, and a $22 million tax detriment recorded in connection with the goodwillimpairment charge for which a tax benefit was not fully realized.
Our effective tax rate for fiscal 2007 includes the effects of the pre-tax charges recorded inconnection with the allocated class action settlement and loss on retirement of debt for which no taxbenefits were recorded. These impacts on the effective tax rate in fiscal 2007 were $312 million and$81 million, respectively. In addition, the fiscal 2007 effective tax rate reflects tax detriments related toincreased borrowings in order to fund the class action settlement escrow and our Separation from TycoInternational.
The valuation allowance for deferred tax assets of $2,487 million and $873 million at fiscal yearend 2009 and 2008, respectively, relates principally to the uncertainty of the utilization of certaindeferred tax assets, primarily tax loss, capital loss, and credit carryforwards in various jurisdictions. Webelieve that we will generate sufficient future taxable income to realize the tax benefits related to theremaining net deferred tax assets on our Consolidated Balance Sheet. The valuation allowance wascalculated in accordance with the provisions of ASC 740 which require that a valuation allowance beestablished or maintained when it is more likely than not that all or a portion of deferred tax assets willnot be realized.
The calculation of our tax liabilities includes estimates for uncertainties in the application ofcomplex tax regulations across multiple global jurisdictions where we conduct our operations. Underthe uncertain tax position provisions of ASC 740, we recognize liabilities for tax as well as relatedinterest for issues in the U.S. and other tax jurisdictions based on our estimate of whether, and theextent to which, additional taxes and related interest will be due. These tax liabilities and relatedinterest are reflected net of the impact of related tax loss carryforwards as such tax loss carryforwardswill be applied against these tax liabilities and will reduce the amount of cash tax payments due uponthe eventual settlement with the tax authorities. These estimates may change due to changing facts andcircumstances; however, due to the complexity of these uncertainties, the ultimate resolution may resultin a settlement that differs from our current estimate of the tax liabilities and related interest. Further,management has reviewed with tax counsel the issues raised by certain taxing authorities and theadequacy of these recorded amounts. If our current estimate of tax and interest liabilities is less thanthe ultimate settlement, an additional charge to income tax expense may result. If our current estimateof tax and interest liabilities is more than the ultimate settlement, income tax benefits may berecognized. Substantially all of these tax liabilities and related interest are recorded in income taxes onthe Consolidated Balance Sheet as payment is not expected within one year.
We have provided income taxes for earnings that are currently distributed as well as the taxesassociated with several subsidiaries’ earnings that are expected to be distributed in fiscal 2010. Noadditional provision has been made for U.S. or non-U.S. income taxes on the undistributed earnings ofsubsidiaries or for unrecognized deferred tax liabilities for temporary differences related to basisdifferences in investments in subsidiaries, as such earnings are expected to be permanently reinvested,the investments are essentially permanent in duration, or we have concluded that no additional taxliability will arise as a result of the distribution of such earnings. As of September 25, 2009, certainsubsidiaries had approximately $14 billion of undistributed earnings that we intend to permanentlyreinvest. A liability could arise if our intentions to permanently reinvest such earnings were to changeand amounts are distributed by such subsidiaries or if such subsidiaries are ultimately disposed. It is notpracticable to estimate the additional income taxes related to permanently reinvested earnings or thebasis differences related to investments in subsidiaries.
34
Income (Loss) from Discontinued Operations, Net of Income Taxes
Loss from discontinued operations was $156 million in fiscal 2009 compared to income fromdiscontinued operations of $255 million in fiscal 2008. In fiscal 2007, loss from discontinued operationswas $340 million.
During fiscal 2009, we entered into a definitive agreement to sell our Wireless Systems business. InMay 2009, we completed the sale for $664 million in net cash proceeds and recognized a pre-tax gainof $59 million on this transaction.
Pre-tax loss from discontinued operations for fiscal 2009 included pre-tax charges of $111 millionrelated to the Wireless Systems business’s contract with the State of New York. See Note 15 to theConsolidated and Combined Financial Statements for additional information regarding the State ofNew York contract. The income tax provision on discontinued operations for fiscal 2009 included$68 million relating to the impact of $319 million of goodwill written off in connection with thedivestiture of the Wireless Systems business, for which a tax benefit was not fully realized, as well as$35 million of adjustments to the estimated tax provision on the Power Systems business as a result ofthe finalization of the tax basis of assets sold upon the filing of the fiscal 2008 income tax returns.
In September 2008, we completed the sale of the Radio Frequency Components and Subsystembusiness for net cash proceeds of $427 million and recorded a $184 million pre-tax gain on the sale. InSeptember 2008, we also completed the sale of the Automotive Radar Sensors business for net cashproceeds of $42 million and recorded a $31 million pre-tax gain on the sale. In fiscal 2009, we recordedan additional pre-tax gain on sale of $4 million in connection with the finalization of working capitaladjustments relating to the sale of the Radio Frequency Components and Subsystem and AutomotiveRadar Sensors businesses. The total pre-tax gain on the sale of the Radio Frequency Components andSubsystem and Automotive Radar Sensors businesses was $187 million and $32 million, respectively.Also during fiscal 2009, we received additional cash proceeds related to working capital of $29 millionin connection with the fiscal 2008 sale of the Radio Frequency Components and Subsystem andAutomotive Radar Sensors businesses.
During fiscal 2008, we completed the sale of our Power Systems business for $102 million in netcash proceeds and recorded a $51 million pre-tax gain on the sale.
During fiscal 2007, the divestiture of our Power Systems business was authorized, and inconnection with the approval, we recorded a $585 million pre-tax impairment charge. Also, in fiscal2007, we completed the sale of the Printed Circuit Group business for $227 million in net cashproceeds and recorded a $45 million pre-tax gain on the sale.
See Note 5 to the Consolidated and Combined Financial Statements for additional informationregarding discontinued operations.
Liquidity and Capital Resources
The following table summarizes our cash flows from operating, investing, and financing activities,as reflected on the Consolidated and Combined Statements of Cash Flows, for fiscal 2009, 2008, and2007:
Fiscal
2009 2008 2007
(in millions)
Net cash provided by (used in) operating activities . . . . . . . . . . . . . . . . . $ 1,329 $ 989 $ 1,525Net cash provided by (used in) investing activities . . . . . . . . . . . . . . . . . . 391 895 (1,528)Net cash provided by (used in) financing activities . . . . . . . . . . . . . . . . . . (1,254) (1,739) 431Effect of currency translation on cash . . . . . . . . . . . . . . . . . . . . . . . . . . . (31) 1 46
Net increase (decrease) in cash and cash equivalents . . . . . . . . . . . . . . . . $ 435 $ 146 $ 474
35
Our ability to fund our future capital needs will be affected by our ability to continue to generatecash from operations and our ability to access the capital markets, money markets, or other sources offinancing, as well as the capacity and terms of our financing arrangements. We believe that cashgenerated from operations and, to the extent necessary, these other sources of potential funding aresufficient to meet our anticipated capital needs for the foreseeable future. Also, we may use excesscapital to reduce our outstanding debt levels, including the possible repurchase of our public debt inaccordance with applicable law, and purchase a portion of our outstanding common shares pursuant toour authorized share repurchase program. Current economic conditions have negatively impacted cashgenerated from operations; however, we continue to believe that actions taken by management toreduce costs and working capital, along with other sources of liquidity, will enable us to meet ourfuture capital needs. There can be no assurance, however, that the cost or availability of futurefinancing will not be impacted by continued financial market instability. We will continue to monitorfinancial markets, to respond as necessary to changing conditions.
Cash Flows from Operating Activities
The following table summarizes the sources and uses of our cash flows from operating activities forfiscal 2009, 2008, and 2007:
Fiscal
2009 2008 2007
(in millions)
Operating income (loss) . . . . . . . . . . . . . . . . . . . . . . . . . . . . . . . . . . . . . . $(3,474) $1,663 $ 655Impairment of goodwill . . . . . . . . . . . . . . . . . . . . . . . . . . . . . . . . . . . . . . 3,547 103 —Class action settlement . . . . . . . . . . . . . . . . . . . . . . . . . . . . . . . . . . . . . . . — (936) 887Non-cash restructuring and other charges, net . . . . . . . . . . . . . . . . . . . . . . 49 81 23Depreciation and amortization . . . . . . . . . . . . . . . . . . . . . . . . . . . . . . . . . 515 539 496Deferred income taxes . . . . . . . . . . . . . . . . . . . . . . . . . . . . . . . . . . . . . . . (583) 164 144Provisions for losses on accounts receivable and inventory . . . . . . . . . . . . . 74 42 74Other, net . . . . . . . . . . . . . . . . . . . . . . . . . . . . . . . . . . . . . . . . . . . . . . . . 67 37 (18)Income tax advance payment . . . . . . . . . . . . . . . . . . . . . . . . . . . . . . . . . . — — (163)Changes in assets and liabilities, net:
Accounts receivable, net . . . . . . . . . . . . . . . . . . . . . . . . . . . . . . . . . . . . 651 (107) (97)Inventories . . . . . . . . . . . . . . . . . . . . . . . . . . . . . . . . . . . . . . . . . . . . . . 638 (221) (76)Accounts payable . . . . . . . . . . . . . . . . . . . . . . . . . . . . . . . . . . . . . . . . . (420) 41 79Other . . . . . . . . . . . . . . . . . . . . . . . . . . . . . . . . . . . . . . . . . . . . . . . . . (114) 214 87
Interest income . . . . . . . . . . . . . . . . . . . . . . . . . . . . . . . . . . . . . . . . . . . . 17 32 53Interest expense . . . . . . . . . . . . . . . . . . . . . . . . . . . . . . . . . . . . . . . . . . . . (165) (190) (232)Income tax (expense) benefit . . . . . . . . . . . . . . . . . . . . . . . . . . . . . . . . . . 576 (540) (465)
Net cash provided by (used in) continuing operating activities . . . . . . . . . . 1,378 922 1,447Net cash provided by (used in) discontinued operating activities . . . . . . . . . (49) 67 78
Net cash provided by (used in) operating activities . . . . . . . . . . . . . . . . . . . $ 1,329 $ 989 $1,525
Net cash provided by continuing operating activities was $1,378 million in fiscal 2009 as comparedto $922 million in fiscal 2008 and $1,447 million in fiscal 2007.
The finalization of the class action settlement in February 2008 negatively impacted cash flowsfrom operating activities during 2008. It resulted in a decrease to cash flows from operating activitiesand an increase to cash flows from investing activities of $936 million. It did not affect the cash balanceon the Consolidated Balance Sheet because we had fully funded our portion of the class actionsettlement into an escrow account intended to be used to settle the liability during fiscal 2007. Relatednet class action settlement costs of $887 million were recognized in fiscal 2007.
36
Excluding the class action settlement, net cash provided by continuing operating activities waslower in fiscal 2009 as compared to fiscal 2008 primarily due to lower income levels partially offset byworking capital improvements. Inventory levels decreased in the current year, with days on handdecreasing from 78 at fiscal year end 2008 to 68 at fiscal year end 2009.
The amount of pension and postretirement benefit contributions reflected in fiscal 2009, 2008, and2007, were $145 million, $77 million, and $71 million, respectively. These amounts included voluntarypension contributions of $61 million in fiscal 2009. We expect pension contributions to be $85 millionin fiscal 2010, before consideration of voluntary contributions.
The amount of income taxes paid, net of refunds, during fiscal 2009, 2008, and 2007, was$121 million, $359 million, $446 million, respectively. The decrease in fiscal 2009 reflects lower taxableearnings levels. The amount of income taxes paid, net of refunds, during fiscal 2007 included a$163 million advance payment to the IRS for pre-Separation tax liabilities.
Cash Flows from Investing Activities
The following table summarizes the sources and uses of our cash flows from investing activities forfiscal 2009, 2008, and 2007:
Fiscal
2009 2008 2007
(in millions)
Capital expenditures . . . . . . . . . . . . . . . . . . . . . . . . . . . . . . . . . . . . . . . . . . $(328) $(610) $ (863)Proceeds from sale of property, plant, and equipment . . . . . . . . . . . . . . . . . . 13 42 41Class action settlement escrow . . . . . . . . . . . . . . . . . . . . . . . . . . . . . . . . . . — 936 (928)Proceeds from divestiture of discontinued operations, net of cash retained by
operations sold . . . . . . . . . . . . . . . . . . . . . . . . . . . . . . . . . . . . . . . . . . . . 693 571 227Proceeds from divestiture of businesses, net of cash retained by businesses
sold . . . . . . . . . . . . . . . . . . . . . . . . . . . . . . . . . . . . . . . . . . . . . . . . . . . . 17 — —Other . . . . . . . . . . . . . . . . . . . . . . . . . . . . . . . . . . . . . . . . . . . . . . . . . . . . (1) (29) (3)
Net cash provided by (used in) continuing investing activities . . . . . . . . . . . 394 910 (1,526)Net cash provided by (used in) discontinued investing activities . . . . . . . . . (3) (15) (2)
Net cash provided by (used in) investing activities . . . . . . . . . . . . . . . . . . . $ 391 $ 895 $(1,528)
We continue to fund capital expenditures to support new programs and to invest in machinery andour manufacturing facilities to further enhance productivity and manufacturing capabilities. Capitalspending decreased $282 million in fiscal 2009 to $328 million as compared to $610 million in fiscal2008. We expect fiscal 2010 capital spending levels to be approximately $425 million. During fiscal 2007,we exercised our option to buy five cable-laying sea vessels that were previously leased to us and usedby the Undersea Telecommunications segment at a cost of $280 million, which was reflected as a capitalexpenditure.
In fiscal 2009, we received net cash proceeds of $664 million related to the sale of our WirelessSystems business. Also, in fiscal 2009, we received additional cash proceeds related to working capitalof $29 million in connection with the sale of the Radio Frequency Components and Subsystems andAutomotive Radar Sensors businesses which occurred in fiscal 2008 and $17 million primarily related tothe divestiture of the Battery Systems business.
In fiscal 2008, we received net cash proceeds of $102 million, $427 million, and $42 million relatedto the sale of the Power Systems, Radio Frequency Components and Subsystem, and Automotive RadarSensors businesses, respectively.
In fiscal 2007, we received $227 million in net cash proceeds related to the sale of the PrintedCircuit Group business.
37
As discussed above, during fiscal 2007, we funded our portion of the class action settlement escrowfor $928 million. The finalization of the class action settlement in fiscal 2008 resulted in an increase tocash flows from investing activities of $936 million, but did not affect the cash balance on theConsolidated Balance Sheet.
Cash Flows from Financing Activities and Capitalization
The following table summarizes the sources and uses of our cash flows from financing activities forfiscal 2009, 2008, and 2007:
Fiscal
2009 2008 2007
(in millions)
Net (decrease) increase in commercial paper . . . . . . . . . . . . . . . . . . . . . $ (649) $ 630 $ —Proceeds from long-term debt . . . . . . . . . . . . . . . . . . . . . . . . . . . . . . . . 448 900 5,676Repayment of long-term debt . . . . . . . . . . . . . . . . . . . . . . . . . . . . . . . . . (602) (1,751) (2,455)Allocated debt activity . . . . . . . . . . . . . . . . . . . . . . . . . . . . . . . . . . . . . . — — (3,743)Net transactions with former parent . . . . . . . . . . . . . . . . . . . . . . . . . . . . — — 1,112Repurchase of common shares . . . . . . . . . . . . . . . . . . . . . . . . . . . . . . . . (152) (1,242) —Payment of common share dividends and cash distributions to
shareholders . . . . . . . . . . . . . . . . . . . . . . . . . . . . . . . . . . . . . . . . . . . (294) (271) —Other . . . . . . . . . . . . . . . . . . . . . . . . . . . . . . . . . . . . . . . . . . . . . . . . . . (61) 47 (86)
Net cash provided by (used in) continuing financing activities . . . . . . . . . (1,310) (1,687) 504Net cash provided by (used in) discontinued financing activities . . . . . . . . 56 (52) (73)
Net cash provided by (used in) financing activities . . . . . . . . . . . . . . . . . . $(1,254) $(1,739) $ 431
Total debt at fiscal year end 2009 and 2008 was $2,417 million and $3,181 million, respectively. SeeNote 11 to the Consolidated and Combined Financial Statements for additional information regardingdebt.
During June 2009, Tyco Electronics Group S.A. (‘‘TEGSA’’), our wholly-owned subsidiary,commenced a tender offer to purchase up to $150 million principal amount of its 6.00% senior notesdue 2012, up to $100 million principal amount of its 6.55% senior notes due 2017, and up to$100 million principal amount of its 7.125% senior notes due 2037. On July 7, 2009, the tender offerexpired and on July 9, 2009, TEGSA purchased and cancelled $86 million principal amount of its6.00% senior notes due 2012, $42 million principal amount of its 6.55% senior notes due 2017, and$23 million principal amount of its 7.125% senior notes due 2037 for an aggregate payment of$141 million, plus paid accrued interest through July 7, 2009 of $3 million to the sellers of the notes.As a result of the transaction, in fiscal 2009, we recorded a pre-tax gain of $22 million, which isincluded in other income, including the write-off of unamortized discounts and fees of $1 million andthe recognition of a gain of $12 million associated with terminated interest rate swaps previouslydesignated as fair value hedges. Additionally, as a result of the re-purchase and cancellation,unamortized losses in accumulated other comprehensive income of $3 million related to terminatedstarting forward interest rate swaps designated as cash flow hedges were recognized as interest expense.
In April 2007, TEGSA entered into a five-year unsecured senior revolving credit facility (‘‘CreditFacility’’). In fiscal 2009, $75 million of the commitment was assigned by Lehman Brothers Bank, FSBto TEGSA, reducing the total effective commitment to $1,425 million. Borrowings under the CreditFacility bear interest, at TEGSA’s option, at a base rate or the London interbank offered rate plus amargin dependent on TEGSA’s credit ratings and the amount drawn under the facility. TEGSA isrequired to pay an annual facility fee ranging from 4.5 to 12.5 basis points depending on its creditratings. As of fiscal year end 2009 and 2008, TEGSA had no borrowings under the Credit Facility.Borrowings under the commercial paper program are backed by the Credit Facility.
38
As of fiscal year end 2008, TEGSA had $647 million of commercial paper outstanding at anaverage interest rate of 4.01%. We have repaid and suspended our borrowings under the commercialpaper program as a result of unfavorable market conditions in fiscal 2009.
Our Credit Facility contains a financial ratio covenant providing that if our ratio of ConsolidatedTotal Debt (as defined in the Credit Facility) to Consolidated EBITDA (as defined in the CreditFacility) for the then most recently concluded period of four consecutive fiscal quarters exceeds 3.5 to1.0, an Event of Default (as defined in the Credit Facility) is triggered under the Credit Facility. TheCredit Facility and our other debt agreements contain other customary covenants. None of ourcovenants are presently considered restrictive to our operations. As of September 25, 2009, we were incompliance with all of our debt covenants and believe that we will continue to be in compliance withour existing covenants for the foreseeable future.
TEGSA’s payment obligations under its senior notes, Credit Facility, commercial paper, and profitsharing notes issued by a subsidiary are fully and unconditionally guaranteed by Tyco Electronics Ltd.
Payments of common share dividends and cash distributions to shareholders were $294 million and$271 million in fiscal 2009 and 2008, respectively. In October 2009, our shareholders approved a cashdistribution to shareholders in the form of a capital reduction to the par value of our common sharesof CHF 0.17 per share for each of the first and second quarters of fiscal 2010. This capital reductionwill reduce the par value of our common shares from CHF 2.43 (equivalent to $2.24) to CHF 2.09(equivalent to $1.92). The distribution will be paid in U.S. Dollars at a rate of $0.16 per share for eachof the first and second quarters of fiscal 2010. Future distributions or dividends on our common shares,if any, must be approved by our shareholders. In exercising their discretion to recommend to theshareholders that such distributions or dividends be approved, our board of directors will consider ourresults of operations, cash requirements and surplus, financial condition, statutory requirements ofapplicable law, contractual restrictions, and other factors that they may deem relevant.
During fiscal 2009, we purchased approximately 6 million of our common shares for $125 millionunder our share repurchase program. Also, during fiscal 2009, we settled purchases of $27 million ofour common shares which occurred prior to the end of fiscal 2008. In fiscal 2008, we repurchasedapproximately 37 million common shares for $1,269 million under this program, of which $1,242 millionwas paid as of September 26, 2008. No common shares were repurchased under this program in fiscal2007. Since inception of the share repurchase program, which has a current authorization of$2,000 million, we have purchased approximately 43 million shares for $1,394 million.
39
Commitments and Contingencies
The following table provides a summary of our contractual obligations and commitments for debt,minimum lease payments obligations under non-cancelable leases, and other obligations at fiscal yearend 2009.
Payments due by fiscal year
There-Total 2010 2011 2012 2013 2014 after
(in millions)
Debt(1) . . . . . . . . . . . . . . . . . . . . . . . . . . . . . . . . $2,417 $101 $ 7 $ 1 $786 $301 $1,221Operating leases . . . . . . . . . . . . . . . . . . . . . . . . . 406 108 76 56 37 32 97Purchase obligations(2) . . . . . . . . . . . . . . . . . . . . 76 71 4 1 — — —
Total contractual cash obligations(3)(4)(5) . . . . . . . . $2,899 $280 $87 $58 $823 $333 $1,318
(1) Excludes interest.
(2) Purchase obligations consist of commitments for purchases of goods and services.
(3) The table above does not reflect unrecognized tax benefits of $1,799 million and related accrued interest and penalties of$1,215 million, the timing of which is uncertain. See Note 18 to the Consolidated and Combined Financial Statements foradditional information regarding unrecognized tax benefits, interest, and penalties.
(4) The table above does not reflect pension and postretirement benefit obligations to certain employees and formeremployees. We are obligated to make contributions to our pension plans and postretirement benefit plans; however, we areunable to determine the amount of plan contributions due to the inherent uncertainties of obligations of this type, includingtiming, interest rate charges, investment performance, and amounts of benefit payments. We expect to contribute$85 million to pension and postretirement benefit plans in fiscal 2010, before consideration of voluntary contributions.These plans and our estimates of future contributions and benefit payments are more fully described in Note 14 to theConsolidated and Combined Financial Statements.
(5) Other long-term liabilities of $634 million, of which $339 million related to our ASC 460 (Guarantees) liability, areexcluded from the table above as we are unable to estimate the timing of payment for these items. See Note 12 to theConsolidated and Combined Financial Statements for more information regarding ASC 460.
Income Tax Matters
In connection with the Separation, we entered into a Tax Sharing Agreement that generallygoverns Covidien’s, Tyco Electronics’, and Tyco International’s respective rights, responsibilities, andobligations after the distribution with respect to taxes, including ordinary course of business taxes andtaxes, if any, incurred as a result of any failure of the distribution of all of the shares of Covidien orTyco Electronics to qualify as a tax-free distribution for U.S. federal income tax purposes within themeaning of Section 355 of the Code or certain internal transactions undertaken in anticipation of thespin-offs to qualify for tax-favored treatment under the Code.
Pursuant to the Separation and Distribution Agreement and Tax Sharing Agreement, uponSeparation, we entered into certain guarantee commitments and indemnifications with TycoInternational and Covidien. Under these agreements, principally the Tax Sharing Agreement, TycoInternational, Covidien, and Tyco Electronics share 27%, 42%, and 31%, respectively, of certaincontingent liabilities relating to unresolved pre-Separation tax matters of Tyco International. The effectof the Tax Sharing Agreement is to indemnify us for 69% of certain liabilities settled in cash by TycoElectronics with respect to unresolved pre-Separation tax matters. Pursuant to that indemnification, wehave made similar indemnifications to Tyco International and Covidien with respect to 31% of certainliabilities settled in cash by the companies with respect to unresolved pre-Separation tax matters. If anyof the companies responsible for all or a portion of such liabilities were to default in its payment ofcosts or expenses related to any such liability, we would be responsible for a portion of the defaultingparty or parties’ obligation.
40
Prior to Separation, certain of our subsidiaries filed combined tax returns with Tyco International.Those and other of our income tax returns are periodically examined by various tax authorities. Inconnection with these examinations, tax authorities, including the IRS, have raised issues and proposedtax adjustments. Tyco International, as the U.S. income tax audit controlling party under the TaxSharing Agreement, is reviewing and contesting certain of the proposed tax adjustments. Amountsrelated to these tax adjustments and other tax contingencies and related interest that management hasassessed under the uncertain tax position provisions of ASC 740, which relate specifically to TycoElectronics entities, have been recorded on the Consolidated and Combined Financial Statements. Inaddition, we may be required to fund portions of Covidien and Tyco International’s tax obligations.Estimates about these guarantees have also been recognized on the Consolidated and CombinedFinancial Statements. See Note 12 to the Consolidated and Combined Financial Statements foradditional information.
In prior years, in connection with the IRS audit of various fiscal years, Tyco Internationalsubmitted to the IRS proposed adjustments to these prior period U.S. federal income tax returnsresulting in a reduction in the taxable income previously filed. The IRS accepted substantially all of theproposed adjustments for fiscal 1997 through 2000 for which the IRS had completed its field work. Onthe basis of previously accepted amendments, we have determined that acceptance of adjustmentspresented for additional periods through fiscal 2005 is probable and, accordingly, have recorded them,as well as the impacts of the adjustments accepted by the IRS, on the Consolidated and CombinedFinancial Statements.
Tyco International continues to complete proposed adjustments to the remainder of its U.S. federalincome tax returns. In fiscal 2009, certain proposed adjustments to U.S. federal income tax returnswere completed by Tyco International and in connection with these adjustments, we recorded a$97 million increase in income tax liabilities, a $10 million increase in deferred tax assets, a $60 millionincrease in the receivable from Tyco International and Covidien in connection with the Tax SharingAgreement, and a $27 million charge to contributed surplus. In fiscal 2008, certain proposedadjustments to U.S. federal income tax returns were completed by Tyco International and presented tothe IRS. As a result, in fiscal 2008, we recorded a $225 million decrease in income tax liabilities, a$42 million decrease in deferred tax assets, a $140 million decrease in the receivable from TycoInternational and Covidien in connection with the Tax Sharing Agreement, a $57 million increase in theindemnification liability to Tyco International and Covidien, and a $14 million charge to contributedsurplus. See Note 12 to the Consolidated and Combined Financial Statements for additionalinformation regarding the indemnification liability to Tyco International and Covidien.
In fiscal 2008, Tyco International, Covidien, and we completed and filed certain fiscal 2007 U.S.consolidated federal and state income tax returns which included a combination of Tyco International,Covidien, and our subsidiaries. As a result, we recorded a $66 million decrease in income tax liabilitieswith a corresponding offset to the income tax receivable, a $44 million decrease in the receivable fromTyco International and Covidien and a $42 million decrease in the payable to Tyco International andCovidien pursuant to the Tax Sharing Agreement, a $30 million increase in contributed surplus, and a$32 million net adjustment to other related tax accounts.
As our tax return positions continue to be updated for periods prior to Separation, additionaladjustments may be identified and recorded on the Consolidated and Combined Financial Statements.While the final adjustments cannot be determined until the income tax return amendment process iscompleted, we believe that any resulting adjustments will not have a material impact on our results ofoperations, financial position, or cash flows. Additionally, adjustments may be recorded to shareholders’equity in the future for the impact of filing final or amended income tax returns in certain jurisdictionswhere those returns include a combination of Tyco International, Covidien, and/or our subsidiaries forthe periods prior to the Separation.
41
During fiscal 2007, the IRS concluded its field examination of certain of Tyco International’s U.S.federal income tax returns for the years 1997 through 2000 and issued anticipated Revenue AgentReports which reflect the IRS’ determination of proposed tax adjustments for the periods under audit.Tyco International has agreed with the IRS on adjustments totaling $498 million, with an estimatedcash impact of $458 million which was paid by Tyco International during fiscal 2007. Our portion of thispayment was $163 million. It is our understanding that Tyco International has appealed other proposedadjustments totaling approximately $1 billion and is vigorously defending its prior filed tax returnpositions. Additionally, the IRS proposed civil fraud penalties against Tyco International arising fromalleged actions of former executives in connection with certain intercompany transfers of stock in 1998and 1999. Any penalty imposed would be subject to sharing with Tyco International and Covidien underthe Tax Sharing Agreement. It is our understanding that Tyco International is vigorously opposing theassertion of any such penalties.
It is our understanding that Tyco International has made progress during fiscal 2009 towardsresolving several of the disputed tax issues for the years 1997 through 2000 and it could reachagreement with the IRS on these matters within the next twelve months. During the fourth quarter offiscal 2009, Tyco International settled a matter with the IRS concerning certain tax deductions claimedon Tyco International’s income tax returns for the years 2001 through 2004. As a result of thissettlement, we recorded a $28 million income tax charge in the fourth quarter of fiscal 2009 to reflectthe disallowance of a portion of these deductions. The IRS continues to audit certain TycoInternational income tax returns for the years 2001 through 2004.
We continue to believe that the amounts recorded on our Consolidated and Combined FinancialStatements relating to the matters discussed above are appropriate. However, the ultimate resolution isuncertain and could result in a material impact to our results of operations, financial position, or cashflows.
Legal Matters
In the ordinary course of business, we are subject to various legal proceedings and claims,including patent infringement claims, antitrust claims, product liability matters, environmental matters,employment disputes, disputes on agreements, and other commercial disputes. Management believesthat these legal proceedings and claims likely will be resolved over an extended period of time.Although it is not feasible to predict the outcome of these proceedings, based upon our experience,current information, and applicable law, we do not expect that these proceedings will have a materialadverse effect on our results of operations, financial position, or cash flows. However, one or more ofthe proceedings could have a material adverse effect on our results of operations, financial position, orcash flows in a future period. See ‘‘Part I. Item 3. Legal Proceedings’’ and Note 15 to the Consolidatedand Combined Financial Statements for further information regarding legal proceedings.
As previously reported, prior to the Separation Tyco International and certain of its formerdirectors and officers were named as defendants in over 40 purported securities class action lawsuits,including ERISA-related litigation. As a part of the Separation and Distribution Agreement, anyexisting or potential liabilities related to the securities actions were allocated among Tyco International,Covidien, and us. We are responsible for 31% of potential liabilities that may arise upon the resolutionof the remaining pending litigation. If Tyco International or Covidien were to default on theirobligation to pay their allocated share of these liabilities, however, we would be required to payadditional amounts. Subject to the terms and conditions of the Separation and Distribution Agreement,Tyco International manages and controls all the legal matters related to the shared contingentliabilities, including the defense or settlement thereof, subject to certain limitations. The liabilitysharing provisions regarding these securities actions are set forth in the Separation and DistributionAgreement among Tyco International, Covidien, and us.
42
Class Action Settlement
As previously reported, Tyco International settled 32 of the purported securities class actionlawsuits arising from the actions alleged to have been taken by its prior management. All legalcontingencies that could have affected the final order approving the settlement expired on February 21,2008. The settlement did not resolve all securities cases. Additional settlements of remaining securitiesactions have been reached subsequently as discussed below. As of the opt-out deadline for thesettlement, Tyco International received opt-out notices from individuals and entities totalingapproximately 4% of the shares owned by class members. A number of these individuals and entitiesfiled actions separately against Tyco International and/or Tyco International, Covidien, and us, all ofwhich have been settled subsequently as discussed below. See ‘‘Part I. Item 3. Legal Proceedings’’ andNote 15 to the Consolidated and Combined Financial Statements for additional information aboutthese proceedings.
In fiscal 2007, we were allocated a charge from Tyco International of $922 million for the classaction settlement, for which no tax benefit was available. In addition, in fiscal 2007, we were allocated$35 million of income relating to Tyco International’s expected recovery of certain costs from insurers.The net charge of $887 million was recorded on the Consolidated and Combined Statement ofOperations as pre-Separation litigation charges, net. The portion allocated to us was consistent with thesharing percentage included in the Separation and Distribution Agreement. Tyco International placedfunds in escrow for the benefit of the class. The escrow account earned interest that was payable to theclass. In addition, interest was accrued on the class action settlement liability.
The finalization of the class action settlement in February 2008 resulted in the extinguishment ofour class action settlement liability of $3,020 million, interest in the escrow of $936 million, and classaction settlement receivable of $2,084 million from the Consolidated Balance Sheet in fiscal 2008. Thefinalization of the settlement resulted in a decrease to cash flows from operating activities and anincrease to cash flows from investing activities during fiscal 2008. It did not affect the cash balance onthe Consolidated Balance Sheet because we had previously fully funded our portion of the class actionsettlement into an escrow account intended to be used to settle the liability, as mentioned above.
Settlement of Securities Proceedings Not Covered by the Class Action Settlement
In fiscal 2008, Tyco International settled securities litigation captioned New Jersey v. TycoInternational Ltd., et al. and Ballard v. Tyco International Ltd., et al. for $73 million and $36 million,respectively. Pursuant to the sharing formula in the Separation and Distribution Agreement, werecorded charges of $34 million, for which no tax benefit was available, in fiscal 2008. In addition, werecorded income of $12 million in fiscal 2008 related to Tyco International’s recovery of certain costsfrom insurers.
During the first quarter of fiscal 2009, we, Tyco International, and Covidien entered into definitiveagreements to settle actions captioned Hess v. Tyco International Ltd., et al. and Sciallo v. TycoInternational Ltd., et al. and an opt-out case brought by the Commonwealth of Massachusetts PensionReserves Investment Management Board. Pursuant to the sharing formula in the Separation andDistribution Agreement, we recorded charges of $9 million, for which no tax benefit was available.
During the second quarter of fiscal 2009, we, Tyco International, and Covidien settled opt-outcases with Franklin Mutual Advisers, LLC and related plaintiffs and the Public Employees’ RetirementAssociation of Colorado. Pursuant to the sharing formula, we recorded charges of $19 million, forwhich no tax benefit was available. Additionally, we recorded reserves totaling $375 millionrepresenting the best estimate of probable loss for the remaining securities litigation claims subject tothe Separation and Distribution Agreement, including remaining opt-out cases and cases arising underERISA. As a result, we recorded a pre-tax charge in the second quarter of fiscal 2009 of $116 million
43
for our share of the reserves. Upon final settlement of the ERISA cases in the fourth quarter of fiscal2009, we recorded a $25 million tax benefit. There were no tax benefits attributable for the other cases.
During the third quarter of fiscal 2009, we, Tyco International, and Covidien settled five of theremaining opt-out cases for $199 million. Pursuant to the sharing formula, our share of the settlementamounts was $62 million. As we had previously established reserves for these opt-out cases during thesecond quarter of fiscal 2009, the settlements did not impact our Consolidated and CombinedStatement of Operations.
During the fourth quarter of fiscal 2009, we, Tyco International, and Covidien settled for a total of$70 million eight consolidated class actions brought under ERISA against Tyco International andcertain of its current and former employees, officers and directors. Pursuant to the sharing formula, ourshare of the settlement amount was $22 million. Also, during the fourth quarter of fiscal 2009, we, TycoInternational, and Covidien agreed to settle the remaining opt-out case for $2 million. Pursuant to thesharing formula, our share of the settlement amount was $1 million. As we had previously establishedreserves for these consolidated actions and this opt-out case during the second quarter of fiscal 2009,the settlements did not impact our Consolidated and Combined Statement of Operations. Only three ofthe securities cases remain outstanding.
Matters Related to Our Former Wireless Systems Business
Certain liabilities and contingencies related to our former Wireless Systems business were retainedby us when this business was sold in the third quarter of fiscal 2009. These include certain retainedliabilities related to the State of New York contract and a contingent purchase price commitmentrelated to the acquisition of Com-Net by the Wireless Systems business in 2001. See additionalinformation below. Also, see Note 5 to the Consolidated and Combined Financial Statements foradditional information regarding the divestiture of the Wireless Systems business.
State of New York Contract
On September 19, 2005, we were awarded a twenty-year lease contract with the State of New Yorkto construct, operate, and maintain a statewide wireless communications network for use by state andmunicipal first responders. On August 29, 2008, we were served by the State with a default noticerelated to the first regional network, pursuant to the contract. Under the terms of the contract, we had45 days to rectify the purported deficiencies noted by the State. On October 16, 2008, we informed theState that all technical deficiencies had been remediated and the system was operating in accordancewith the contract specifications and certified the system ready for testing. The State conducted furthertesting during November and December 2008. On January 15, 2009, the State notified us that, in theState’s opinion, we had not fully remediated the issues cited by the State and it had determined that wewere in default of the contract and that it had exercised its right to terminate the contract. The Statecontends that it has the right under the contract to recoup costs incurred by the State in conjunctionwith the implementation of the network, and as a result of this contention, on January 16, 2009, theState drew down $50 million against an irrevocable standby letter of credit funded by us. The State hasthe ability to draw up to an additional $50 million against the standby letter of credit, although wedispute that the State has any basis to do so.
On February 13, 2009, we filed a claim in the New York Court of Claims, seeking over$100 million in damages, and alleging a number of causes of action, including breach of contract, unjustenrichment, defamation, conversion, breach of the covenant of good faith and fair dealing, theimposition of a constructive trust, and seeking a declaration that the State terminated the contract ‘‘forconvenience.’’ On September 25, 2009, the Court granted the State’s motion to dismiss all counts of thecomplaint, with the exception of the breach of contract claims. On November 16, 2009, the State filedan answer to the complaint and counterclaim. The counterclaim asserts a claim for breach of contract
44
and alleges that the State has incurred damages in excess of $275 million. We believe that thecounterclaim is without merit and intend to vigorously pursue our claims in this matter. The parties arenow proceeding with discovery.
As a result of these actions, in the first quarter of fiscal 2009, we recorded pre-tax charges totaling$111 million associated with this contract. These charges are reflected in income (loss) fromdiscontinued operations on the Consolidated and Combined Statement of Operations as a result of oursale of the Wireless Systems business. See Note 5 to the Consolidated and Combined FinancialStatements for further discussion of discontinued operations and the sale of the Wireless Systemsbusiness. The charges included an impairment charge of $61 million to write-off all costs incurred inconstructing the network as well as a charge equal to the amount drawn by the State against thestandby letter of credit of $50 million. The assets related to the impairment charge were previouslyreflected primarily as inventory on the Consolidated Balance Sheet. We have not recognized anyrevenue related to the lease contract.
Com-Net
At September 25, 2009, we had a contingent purchase price commitment of $80 million related toour fiscal 2001 acquisition of Com-Net. This represents the maximum amount payable to the formershareholders of Com-Net only after the construction and installation of a communications system forthe State of Florida is finished and the State of Florida has approved the system based on theguidelines set forth in the contract. Under the terms of the purchase and sale agreement, we do notbelieve we have any obligation to the sellers. However, the sellers have contested our position andinitiated a lawsuit in June 2006 in the Court of Common Pleas in Allegheny County, Pennsylvania,which is in the motion pleading and discovery phase. A liability for this contingency has not beenrecorded on the Consolidated and Combined Financial Statements as we do not believe that anypayment is probable or estimable at this time.
Off-Balance Sheet Arrangements
Certain of our segments have guaranteed the performance of third parties and provided financialguarantees for uncompleted work and financial commitments. The terms of these guarantees vary withend dates ranging from fiscal 2010 through the completion of such transactions. The guarantees wouldbe triggered in the event of nonperformance, and the potential exposure for nonperformance under theguarantees would not have a material effect on our results of operations, financial position, or cashflows.
In disposing of assets or businesses, we often provide representations, warranties, and/orindemnities to cover various risks including unknown damage to the assets, environmental risksinvolved in the sale of real estate, liability for investigation and remediation of environmentalcontamination at waste disposal sites and manufacturing facilities, and unidentified tax liabilities andlegal fees related to periods prior to disposition. We do not have the ability to estimate the potentialliability from such indemnities because they relate to unknown conditions. However, we have no reasonto believe that these uncertainties would have a material adverse effect on our results of operations,financial position, or cash flows.
As of September 25, 2009, we had outstanding letters of credit and letters of guarantee in theamount of $395 million, of which $50 million was related to our contract with the State of New York.See Note 15 to the Consolidated and Combined Financial Statements for additional informationregarding the State of New York contract.
We have recorded liabilities for known indemnifications included as part of environmentalliabilities. See Note 15 to the Consolidated and Combined Financial Statements for a discussion ofthese liabilities.
45
In the normal course of business, we are liable for contract completion and product performance.In the opinion of management, except for the charges related to the contract with the State of NewYork discussed below, such obligations will not significantly affect our results of operations, financialposition, or cash flows.
As disclosed in Note 15 to the Consolidated and Combined Financial Statements, in January 2009,the State of New York drew down $50 million against an irrevocable standby letter of credit funded byus. As a result, we recorded a pre-tax charge equal to the draw. The State has the ability to draw up toan additional $50 million against the standby letter of credit which could result in additional chargesand could have a material adverse effect on our results of operations, financial position, and cash flows.
Pursuant to the Separation and Distribution Agreement and Tax Sharing Agreement, uponSeparation, we entered into certain guarantee commitments and indemnifications with TycoInternational and Covidien. Under these agreements, principally the Tax Sharing Agreement, TycoInternational, Covidien, and Tyco Electronics share 27%, 42%, and 31%, respectively, of certaincontingent liabilities relating to unresolved pre-Separation tax matters of Tyco International. The effectof the Tax Sharing Agreement is to indemnify us for 69% of certain liabilities settled in cash by us withrespect to unresolved pre-Separation tax matters. Pursuant to that indemnification, we have madesimilar indemnifications to Tyco International and Covidien with respect to 31% of certain liabilitiessettled in cash by the companies with respect to unresolved pre-Separation tax matters. If any of thecompanies responsible for all or a portion of such liabilities were to default in its payment of costs orexpenses related to any such liability, we would be responsible for a portion of the defaulting party orparties’ obligation. These arrangements have been valued upon our separation from Tyco Internationalin accordance with ASC 460 and, accordingly, liabilities amounting to $339 million were recorded onthe Consolidated Balance Sheet at September 25, 2009. See Notes 12 and 15 to the Consolidated andCombined Financial Statements for additional information.
We generally record estimated product warranty costs at the time of sale. See Note 12 to theConsolidated and Combined Financial Statements for further information regarding estimated productwarranty.
Critical Accounting Policies and Estimates
The preparation of the Consolidated and Combined Financial Statements in conformity withGAAP requires management to use judgment in making estimates and assumptions that affect thereported amounts of assets and liabilities, disclosure of contingent assets and liabilities, and thereported amounts of revenue and expenses. Our significant accounting policies are summarized inNote 2 to the Consolidated and Combined Financial Statements. The following noted accountingpolicies are based on, among other things, judgments and assumptions made by management thatinclude inherent risks and uncertainties. Management’s estimates are based on the relevant informationavailable at the end of each period.
Revenue Recognition
Our revenue recognition policies are in accordance with ASC 605 (Revenue Recognition) and SECStaff Accounting Bulletin Nos. 101 and 104.
Our revenues are generated principally from the sale of our products. Revenue from the sale ofproducts is recognized at the time title and the risks and rewards of ownership pass to the customer.This generally occurs when the products reach the free-on-board shipping point, the sales price is fixedand determinable, and collection is reasonably assured. For those items where title has not yettransferred, we have deferred the recognition of revenue. A reserve for estimated returns is establishedat the time of sale based on historical return experience and is recorded as a reduction of sales. Otherallowances include customer quantity and price discrepancies. A reserve for other allowances isestablished at the time of sale based on historical experience and is recorded as a reduction of sales.
46
Contract sales for construction related projects are recorded primarily on thepercentage-of-completion method. Profits recognized on contracts in process are based upon estimatedcontract revenue and related cost to complete. Percentage-of-completion is measured based on theratio of actual costs incurred to total estimated costs. Revisions in cost estimates as contracts progresshave the effect of increasing or decreasing profits in the current period. Provisions for anticipatedlosses are made in the period in which they first become determinable. Contract sales for constructionrelated projects are generated primarily within our Undersea Telecommunications segment.
Inventories
Inventories are recorded at the lower of cost or market value, except for inventoried costs whichare costs incurred in the performance of long-term contracts primarily by our UnderseaTelecommunications segment. Provisions for slow moving and obsolete inventory are made based uponproduct demand and historical experience. Should future product demand change, existing inventorycould become slow moving or obsolete and provisions would be increased accordingly.
Goodwill and Other Intangible Assets
Intangible assets acquired include both those that have a determinable life and residual goodwill.Intangible assets with a determinable life include primarily intellectual property consisting of patents,trademarks, and unpatented technology with estimates of recoverability ranging from 1 to 50 years thatare amortized on a straight-line basis. An evaluation of the remaining useful life of intangible assetswith a determinable life is performed on a periodic basis and when events and circumstances warrantan evaluation. We assess intangible assets with a determinable life for impairment consistent with ourpolicy for assessing other long-lived assets. Goodwill is assessed for impairment separately from otherintangible assets with a determinable life by comparing the carrying value of each reporting unit to itsfair value on the first day of the fourth quarter of each year or whenever we believe a triggering eventrequiring a more frequent assessment has occurred. In making this assessment, management relies on anumber of factors including operating results, business plans, economic projections, anticipated futurecash flows, transactions, and market place data. There are inherent uncertainties related to thesefactors and management’s judgment in applying them to the analysis of goodwill impairment.
When testing for goodwill impairment, we follow the guidance prescribed in ASC 350-20(Intangibles—Goodwill and Other: Goodwill). First, we perform a step I goodwill impairment test toidentify a potential impairment. In doing so, we compare the fair value of a reporting unit with itscarrying amount. If the carrying amount of a reporting unit exceeds its fair value, goodwill may beimpaired and a step II goodwill impairment test is performed to measure the amount of anyimpairment loss. In the step II goodwill impairment test, we compare the implied fair value ofreporting unit goodwill with the carrying amount of that goodwill. If the carrying amount of reportingunit goodwill exceeds its fair value, an impairment loss is recognized in an amount equal to the excess.The implied fair value of goodwill is determined in the same manner that the amount of goodwillrecognized in a business combination is determined. We allocate the fair value of a reporting unit to allof the assets and liabilities of that unit, including intangible assets, as if the reporting unit had beenacquired in a business combination. Any excess of the value of a reporting unit over the amountsassigned to its assets and liabilities is the implied fair value of goodwill.
Estimates about fair value used in the step I goodwill impairment tests have been calculated usingan income approach based on the present value of future cash flows of each reporting unit. Theincome approach has been supported by additional transaction and guideline analyses. Theseapproaches incorporate a number of assumptions including future growth rates, discount factors, andincome tax rates in assessing fair value. Changes in economic and operating conditions impacting theseassumptions could result in goodwill impairments in future periods.
47
Income Taxes
In determining income for financial statement purposes, we must make certain estimates andjudgments. These estimates and judgments affect the calculation of certain tax liabilities and thedetermination of the recoverability of certain of the deferred tax assets, which arise from temporarydifferences between the tax and financial statement recognition of revenue and expense.
In evaluating our ability to recover our deferred tax assets, we consider all available positive andnegative evidence including our past operating results, the existence of cumulative losses in the mostrecent years, and our forecast of future taxable income. In estimating future taxable income, wedevelop assumptions including the amount of future state, federal, and international pre-tax operatingincome, the reversal of temporary differences, and the implementation of feasible and prudent taxplanning strategies. These assumptions require significant judgment about the forecasts of futuretaxable income and are consistent with the plans and estimates we are using to manage the underlyingbusinesses.
We currently have recorded significant valuation allowances that we intend to maintain until it ismore likely than not the deferred tax assets will be realized. Our income tax expense recorded in thefuture will be reduced to the extent of decreases in our valuation allowances. The realization of ourremaining deferred tax assets is primarily dependent on future taxable income in the appropriatejurisdiction. Any reduction in future taxable income including any future restructuring activities mayrequire that we record an additional valuation allowance against our deferred tax assets. An increase inthe valuation allowance would result in additional income tax expense in such period and could have asignificant impact on our future earnings. Prior to September 26, 2009, if a change in a valuationallowance occurred, which was established in connection with an acquisition, the adjustment of suchallowance may have affected goodwill rather than the income tax provision. Subsequent to the adoptionof the business combination provisions of ASC 805 (Business Combinations) on September 26, 2009,any changes in a valuation allowance that was established in connection with an acquisition, regardlessof when the acquisition occurred, will be reflected in the income tax provision.
Changes in tax laws and rates also could affect recorded deferred tax assets and liabilities in thefuture. Management is not aware of any such changes that would have a material effect on our resultsof operations, financial position, or cash flows.
In addition, the calculation of our tax liabilities includes estimates for uncertainties in theapplication of complex tax regulations across multiple global jurisdictions where we conduct ouroperations. Under the uncertain tax position provisions of ASC 740 (Income Taxes), we recognizeliabilities for tax as well as related interest for issues in the U.S. and other tax jurisdictions based onour estimate of whether, and the extent to which, additional taxes and related interest will be due.These tax liabilities and related interest are reflected net of the impact of related tax loss carryforwardsas such tax loss carryforwards will be applied against these tax liabilities and will reduce the amount ofcash tax payments due upon the eventual settlement with the tax authorities. These estimates maychange due to changing facts and circumstances; however, due to the complexity of these uncertainties,the ultimate resolution may result in a settlement that differs from our current estimate of the taxliabilities and related interest. Further, management has reviewed with tax counsel the issues raised bycertain taxing authorities and the adequacy of these recorded amounts. If our current estimate of taxand interest liabilities is less than the ultimate settlement, an additional charge to income tax expensemay result. If our current estimate of tax and interest liabilities is more than the ultimate settlement,income tax benefits may be recognized. Substantially all of these tax liabilities and related interest arerecorded in income taxes on the Consolidated Balance Sheet as payment is not expected within oneyear.
48
Pension and Postretirement Benefit
Our pension expense and obligations are developed from actuarial assumptions. Two criticalassumptions in determining pension expense and obligations are the discount rate and expectedlong-term return on plan assets. We evaluate these assumptions at least annually. Other assumptionsreflect demographic factors such as retirement, mortality, and turnover and are evaluated periodicallyand updated to reflect our actual experience. Actual results may differ from actuarial assumptions. Thediscount rate represents the market rate for high-quality fixed income investments and is used tocalculate the present value of the expected future cash flows for benefit obligations to be paid underour pension plans. A decrease in the discount rate increases the present value of pension benefitobligations. A 25 basis point decrease in the discount rate would increase our present value of pensionobligations by $110 million, while a 25 basis point increase in the discount rate would decrease ourpresent value of pension obligations by $105 million. We consider the current and expected assetallocations of our pension plans, as well as historical and expected long-term rates of return on thosetypes of plan assets, in determining the expected long-term rate of return on plan assets. During fiscal2008, our Investment Committee made the decision to change the target asset allocation of the U.S.Plans’ Master Trust from 60% equity and 40% fixed income to 30% equity and 70% fixed income in aneffort to better align asset risk with the anticipated payment of benefit obligations. The target assetallocation transition began in fiscal 2008. As a result of economic conditions during 2009, we haveslowed the transition of the Master Trust asset allocation change. Asset reallocation will continue overa multi-year period based on the funded status of the U.S. Plans’ Master Trust. A 50 basis pointdecrease in the expected long-term return on plan assets would increase our pension expense by$9 million, while a 50 basis point increase in the expected long-term return on plan assets woulddecrease our pension expense by $9 million.
Share-Based Compensation
Under ASC 718 (Compensation—Stock Compensation), we determine the fair value of shareawards on the date of grant using the Black-Scholes-Merton valuation model. The Black-Scholes-Merton model requires certain assumptions that involve judgment. Such assumptions are the expectedshare price volatility, expected annual dividend yield, expected life of options, and risk-free interestrate. (See Note 23 to the Consolidated and Combined Financial Statements for additional informationrelated to share-based compensation.) An increase in the volatility of the Company’s stock will increasethe amount of compensation expense on new awards. An increase in the holding period of options willalso cause an increase in compensation expense. Dividend yields and risk-free interest rates are lessdifficult to estimate, but an increase in the dividend yield will cause a decrease in expense and anincrease in the risk-free interest rate will increase compensation expense.
Accounting Pronouncements
Recently Adopted Accounting Pronouncements
In June 2009, the Financial Accounting Standards Board (‘‘FASB’’) issued the AccountingStandards Codification (‘‘ASC’’) to serve as the single source of authoritative GAAP. We adopted theASC in the fourth quarter of fiscal 2009. Adoption did not have an impact on our Consolidated andCombined Financial Statements.
In May 2009, the FASB issued guidance in ASC 855 (Subsequent Events). ASC 855 establishesgeneral standards for accounting and disclosure of events occurring subsequent to the balance sheetdate but prior to issuance of the financial statements. We adopted ASC 855 in the third quarter offiscal 2009. See Note 26 to the Consolidated and Combined Financial Statements for the requireddisclosures related to subsequent events.
In March 2008, the FASB issued updates to guidance in ASC 815 (Derivatives and Hedging),amending and expanding the disclosure requirements related to the use of derivative instruments and
49
hedging activities to provide improved transparency into the uses and financial statement impact ofderivative instruments and hedging activities. The new disclosure provisions of ASC 815 were adoptedby us in the second quarter of fiscal 2009. See Note 13 to the Consolidated and Combined FinancialStatements for the required disclosures related to derivative instruments and hedging activities.
In March 2007, the FASB issued guidance in ASC 715-60 (Compensation—Retirement Benefits:Defined Benefit Plans—Other Postretirement) related to the accounting for collateral assignment split-dollar life insurance arrangements. We adopted the guidance in ASC 715-60 in the first quarter of fiscal2009. Accordingly, we recognized accrued and other current liabilities of $1 million and other liabilitiesof $4 million on our Consolidated Balance Sheet at the beginning of the first quarter of fiscal 2009with a corresponding decrease in the opening balance of accumulated deficit of $5 million.
In September 2006, the FASB issued guidance in ASC 820 (Fair Value Measurements andDisclosures) that defines fair value, establishes a framework for measuring fair value, expandsdisclosure about fair value measurements, and introduces the fair value option for certain financialassets and liabilities. ASC 820 was adopted by us in the first quarter of fiscal 2009. We did not elect tovalue any existing assets or liabilities at fair value upon adoption, nor did we apply the fair value optionto any eligible assets acquired or liabilities incurred during the quarter. We will adopt the non-financialasset and liability fair value provisions in fiscal 2010. See Note 16 to the Consolidated and CombinedFinancial Statements for additional information related to fair value measurements.
In September 2006, the FASB issued guidance in ASC 715 (Compensation—Retirement Benefits)that requires that employers recognize the funded status of defined benefit pension and otherpostretirement benefit plans as a net asset or liability on the balance sheet and recognize as acomponent of other comprehensive income, net of tax, the gains or losses and prior service costs orcredits that arise during the period but are not recognized as a component of net periodic benefit cost.Under ASC 715, companies are required to measure plan assets and benefit obligations as of theirfiscal year end. We adopted the presentation requirements of ASC 715 on September 28, 2007 and themeasurement date provisions in the fourth quarter of fiscal 2009. As a result of the change inmeasurement date, we recorded a charge of $7 million to accumulated deficit. See Note 14 to theConsolidated and Combined Financial Statements for additional information related to the change inmeasurement date provisions.
Recently Issued Accounting Pronouncements
In June 2009, the FASB issued updates to guidance in ASC 810 (Consolidation) that addressaccounting for variable interest entities. These updates to ASC 810 are effective for us in the firstquarter of fiscal 2011. We are currently assessing the impact that adoption will have on our results ofoperations, financial position, or cash flows.
In April 2009 and December 2007, the FASB issued guidance in ASC 805 (BusinessCombinations). ASC 805 addresses the recognition and accounting for identifiable assets acquired,liabilities assumed, and noncontrolling interests in business combinations. ASC 805 is effective for us inthe first quarter of fiscal 2010. Adoption is not expected to have a material impact on our results ofoperations, financial position, or cash flows.
In December 2008, the FASB issued updates to the guidance in ASC 715 (Compensation—Retirement Benefits) that enhance disclosures regarding assets in defined benefit pension or otherpostretirement plans. The updates to ASC 715 are effective for us in the fourth quarter of fiscal 2010.We are currently assessing the impact that adoption will have on our Consolidated and CombinedFinancial Statements.
In December 2007, the FASB issued updates to guidance in ASC 810 (Consolidation) that addressthe accounting and reporting framework for minority interests by a parent company. These updates to
50
ASC 810 are effective for us in the first quarter of fiscal 2010. Adoption is not expected to have amaterial impact on our results of operations, financial position, or cash flows.
Forward-Looking Information
Certain statements in this report are ‘‘forward-looking statements’’ within the meaning of the U.S.Private Securities Litigation Reform Act of 1995. These statements are based on our management’sbeliefs and assumptions and on information currently available to our management. Forward-lookingstatements include, among others, the information concerning our possible or assumed future results ofoperations, business strategies, financing plans, competitive position, potential growth opportunities,potential operating performance improvements, the effects of competition, and the effects of futurelegislation or regulations. Forward-looking statements include all statements that are not historical factsand can be identified by the use of forward-looking terminology such as the words ‘‘believe,’’ ‘‘expect,’’‘‘plan,’’ ‘‘intend,’’ ‘‘anticipate,’’ ‘‘estimate,’’ ‘‘predict,’’ ‘‘potential,’’ ‘‘continue,’’ ‘‘may,’’ ‘‘should,’’ or thenegative of these terms or similar expressions.
Forward-looking statements involve risks, uncertainties and assumptions. Actual results may differmaterially from those expressed in these forward-looking statements. You should not put unduereliance on any forward-looking statements. We do not have any intention or obligation to updateforward-looking statements after we file this report except as required by law.
The following risks, which are described in greater detail in ‘‘Part I. Item 1A. Risk Factors’’ of ourAnnual Report on Form 10-K for the fiscal year ended September 25, 2009 filed with the SEC, couldalso cause our results to differ materially from those expressed in forward-looking statements:
• Current and future conditions in the global economy and global capital and credit markets, andcyclical industry conditions;
• Conditions affecting demand for products in the industries we serve, particularly the automotiveindustry and the telecommunications, computer, and consumer electronics industries;
• Competition and pricing pressure;
• Risk of future goodwill impairment;
• Market acceptance of new product introductions and product innovations and product life cycles;
• Financial condition and consolidation of customers and vendors;
• Raw material availability, quality, and cost;
• Fluctuations in foreign currency exchange rates;
• Declines in the market value of our pension plans’ investment portfolios;
• Reliance on third party suppliers;
• Our ability to attract and retain highly qualified personnel;
• Risks associated with future acquisitions and divestitures;
• Global risks of political, economic, and military instability;
• Risks related to compliance with current and future environmental and other laws andregulations;
• Our ability to protect our intellectual property rights;
• Risks of litigation;
• Our ability to operate within the limitations imposed by our debt instruments;
• Risks relating to our Separation on June 29, 2007 from Tyco International Ltd.;
51
• The possible effects on us of various U.S. and non-U.S. legislative proposals and other initiativesthat, if adopted, could materially increase our worldwide corporate effective tax rate andnegatively impact our U.S. government contracts business;
• Various risks associated with being a Swiss corporation;
• The impact of fluctuations in the market price of our shares; and
• The impact of certain provisions of our articles of association on unsolicited takeover proposals.
There may be other risks and uncertainties that we are unable to predict at this time or that wecurrently do not expect to have a material adverse effect on our business.
QUANTITATIVE AND QUALITATIVE DISCLOSURES ABOUT MARKET RISK
In the normal course of business, our financial position is routinely subject to a variety of risks,including market risks associated with interest rate and currency movements on outstanding debt andnon-U.S. Dollar denominated assets and liabilities and commodity price movements. We utilizeestablished risk management policies and procedures in executing derivative financial instrumenttransactions to manage a portion of these risks.
We do not execute transactions or hold derivative financial instruments for trading or speculativepurposes. Counterparties to derivative financial instruments are limited to major financial institutionswith at least an A/A2 long-term debt rating. There is no significant concentration of exposures with anyone counterparty.
Foreign Currency Exposures
As part of managing the exposure to changes in foreign currency exchange rates, we use foreignexchange forward and swap contracts. The objective is to minimize impacts to cash flows andprofitability due to changes in foreign currency exchange rates on intercompany transactions, accountsreceivable, accounts payable, and other cash transactions. A 10% appreciation of the U.S. Dollar fromthe September 25, 2009 market rates would decrease the unrealized value of our forward contracts by$2 million, while a 10% depreciation of the U.S. Dollar would increase the unrealized value of ourforward contracts by $2 million. A 10% appreciation of the U.S. Dollar from the September 26, 2008market rates would have increased the unrealized value of our forward contracts by $95 million, while a10% depreciation of the U.S. Dollar would have decreased the unrealized value of our forwardcontracts by $116 million. Such gains or losses on these contracts would be generally offset by the gainsor losses on the revaluation or settlement of the underlying transactions.
Interest Rate Exposures
We issue debt, from time to time, in capital and money markets to fund our operations. Suchborrowings can result in interest rate exposure. To manage the interest rate exposure and to minimizeoverall interest cost, we have used, and may in the future use, interest rate swaps to convert a portionof fixed-rate debt into variable rate debt (fair value hedges) and/or convert a portion of variable ratedebt into fixed-rate debt (cash flow hedges). During fiscal 2009, we terminated interest rate swapsdesignated as fair value hedges on $300 million principal amount of our 6.55% senior notes and$200 million principal amount of our 6.00% senior notes that had been outstanding as ofSeptember 26, 2008. See Note 13 to the Consolidated and Combined Financial Statements foradditional information on the termination of the interest rate swaps. At September 25, 2009, we had nofloating rate debt outstanding. Based on our floating rate debt balance of $1,147 million atSeptember 26, 2008, an increase in the levels of the U.S. Dollar interest rates by 0.5%, with all othervariables held constant, would have resulted in an increase of annual interest expense of approximately$6 million.
52
Commodity Exposures
Our worldwide operations and product lines may expose us to risks from fluctuations in commodityprices. To limit the effects of fluctuations in the future market price paid and related volatility in cashflows, we have used and may use in the future forward and option contracts. We continually evaluatethe commodity market with respect to our forecasted usage requirements over the next twelve totwenty-four months and periodically enter into commodity forward or option contracts in order tohedge a portion of usage requirements over that period. At September 25, 2009 and September 26,2008, our commodity hedges, which related to purchases of gold, were in a gain position of $1 millionand $2 million, respectively, and had a notional value of $29 million and $21 million, respectively. A10% appreciation of the price of a troy ounce of gold from the September 25, 2009 prices wouldincrease the unrealized value of our forward contracts by $3 million, while a 10% depreciation of priceswould decrease the unrealized value of our forward contracts by $3 million. A 10% appreciation of theprice of a troy ounce of gold from the September 26, 2008 prices would have increased the unrealizedvalue of our forward contracts by $2 million, while a 10% depreciation of prices would have decreasedthe unrealized value of our forward contracts by $2 million.
See Note 13 to the Consolidated and Combined Financial Statements for additional informationon financial instruments.
CHANGES IN AND DISAGREEMENTS WITH ACCOUNTANTS ON ACCOUNTING ANDFINANCIAL DISCLOSURES
None.
CONTROLS AND PROCEDURES
Evaluation of Disclosure Controls and Procedures
Our management, with the participation of our chief executive officer and chief financial officer,evaluated the effectiveness of our disclosure controls and procedures (as defined in Rule 13a-15(e)under the Exchange Act) as of September 25, 2009. Based on that evaluation, our chief executiveofficer and chief financial officer concluded that our disclosure controls and procedures were effectiveas of September 25, 2009.
Management’s Report on Internal Control Over Financial Reporting
Our management is responsible for establishing and maintaining adequate internal control overfinancial reporting (as defined in Rule 13a-15(f) under the Exchange Act). Management, with theparticipation of our chief executive officer and chief financial officer, evaluated the effectiveness of ourinternal control over financial reporting based on the framework in Internal Control—IntegratedFramework issued by the Committee of Sponsoring Organizations of the Treadway Commission. Basedon this evaluation, management has concluded our internal control over financial reporting waseffective as of September 25, 2009.
Because of its inherent limitations, internal control over financial reporting may not prevent ordetect misstatements. Also, projections of any evaluation of effectiveness to future periods are subjectto the risk that controls may become inadequate because of changes in conditions, or that the degreeof compliance with policies and procedures may deteriorate.
Deloitte & Touche LLP, an independent registered public accounting firm, has issued an attestationreport on our internal control over financial reporting as of September 25, 2009, which is included inthis Annual Report.
53
Remediation of Material Weakness in Internal Control Over Financial Reporting
A material weakness is a deficiency, or combination of deficiencies, in internal control overfinancial reporting, such that there is a reasonable possibility that a material misstatement of theCompany’s annual or interim financial statements will not be prevented or detected on a timely basis.
We previously disclosed a material weakness in our internal control over financial reportingrelating to accounting for income taxes in our Annual Report on Form 10-K/A for the fiscal year endedSeptember 26, 2008 and our information statement filed as Exhibit 99.1 to our Current Report onForm 8-K on June 8, 2007. Subsequent to the filing of our combined financial statements for fiscal2006, 2005, and 2004 in the initial filing of our registration statement with the SEC, we determined thatour combined financial statements contained certain errors. The errors primarily resulted from theprocess of carving out certain income tax accounts from Tyco International’s consolidated financialstatements and related information. We substantially relied upon the processes at Tyco International toprepare our carve-out accounts for income taxes. We determined that certain of those tax processesutilized by Tyco International in determining certain carve out amounts for income taxes did notoperate at a sufficient level of precision relative to our materiality for us to ensure that the carve-outaccounts were materially correct. We also determined that we did not have sufficient control processesin place to ensure that the information provided by Tyco International was complete and accurate andconcluded that the absence of these control processes was a material weakness in our internal controlover financial reporting relating to income taxes.
We enhanced our tax accounting resources and capabilities to remediate the material weaknessindicated above, and implemented new control processes and procedures during fiscal 2007 and 2008.Improvements to our control processes included the following:
• We implemented appropriately designed processes and controls and instituted multi-levelmanagement reviews.
• We completed analysis and reconciliation of our tax accounts and recorded necessaryadjustments while implementing sustainable reconciliation processes to ensure continuedaccuracy of these accounts.
• We enhanced policies and procedures relating to tax account reconciliation and analysis.
• We expanded tax accounting resources at both the corporate and regional levels with personnelexperienced in accounting for income taxes in accordance with U.S. GAAP.
• We conducted training for both existing and newly hired tax accountants along with otheraccounting and finance personnel who are responsible for analyzing, documenting andaccounting for taxes in their jurisdiction.
• We increased accountability for accounting for income taxes by recording tax accounting at thelegal entity, developed and communicated clear responsibilities and expectations, andimplemented a multi-level review process.
• We invested in additional information systems to improve control around newly implementedprocesses and enable more effective review.
These processes have been operating for a sufficient period of time, and we have determined thatthey are operating effectively. As a result of these improvements in our control processes, we believethat the material weakness has been remediated.
Changes in Internal Control Over Financial Reporting
Except for the remediation of the material weakness discussed above, during the quarter endedSeptember 25, 2009, there were no changes in our internal control over financial reporting that havematerially affected, or are reasonably likely to materially affect, our internal control over financialreporting.
54
TYCO ELECTRONICS LTD.
INDEX TO CONSOLIDATED AND COMBINED FINANCIAL STATEMENTS
Page
Reports of Independent Registered Public Accounting Firm . . . . . . . . . . . . . . . . . . . . . . . . . . . . 56
Consolidated and Combined Statements of Operations for the Fiscal Years Ended September 25,2009, September 26, 2008, and September 28, 2007 . . . . . . . . . . . . . . . . . . . . . . . . . . . . . . . . 58
Consolidated Balance Sheets as of September 25, 2009 and September 26, 2008 . . . . . . . . . . . . . 59
Consolidated and Combined Statements of Equity for the Fiscal Years Ended September 25,2009, September 26, 2008, and September 28, 2007 . . . . . . . . . . . . . . . . . . . . . . . . . . . . . . . . 60
Consolidated and Combined Statements of Cash Flows for the Fiscal Years Ended September 25,2009, September 26, 2008, and September 28, 2007 . . . . . . . . . . . . . . . . . . . . . . . . . . . . . . . . 62
Notes to Consolidated and Combined Financial Statements . . . . . . . . . . . . . . . . . . . . . . . . . . . . 63
Schedule II—Valuation and Qualifying Accounts . . . . . . . . . . . . . . . . . . . . . . . . . . . . . . . . . . . . 140
Report of Statutory Auditor . . . . . . . . . . . . . . . . . . . . . . . . . . . . . . . . . . . . . . . . . . . . . . . . . . . 141
55
REPORT OF INDEPENDENT REGISTERED PUBLIC ACCOUNTING FIRM
To the Board of Directors and Shareholders of Tyco Electronics Ltd.:
We have audited the accompanying consolidated balance sheets of Tyco Electronics Ltd. andsubsidiaries (the ‘‘Company’’) as of September 25, 2009 and September 26, 2008 and the relatedconsolidated and combined statements of operations, equity, and cash flows for each of the three yearsin the period ended September 25, 2009. Our audits also included the financial statement schedulelisted in the Index at Item 15. These financial statements and financial statement schedule are theresponsibility of the Company’s management. Our responsibility is to express an opinion on thefinancial statements and financial statement schedule based on our audits.
We conducted our audits in accordance with the standards of the Public Company AccountingOversight Board (United States). Those standards require that we plan and perform the audit to obtainreasonable assurance about whether the financial statements are free of material misstatement. Anaudit includes examining, on a test basis, evidence supporting the amounts and disclosures in thefinancial statements. An audit also includes assessing the accounting principles used and significantestimates made by management, as well as evaluating the overall financial statement presentation. Webelieve that our audits provide a reasonable basis for our opinion.
In our opinion, such consolidated and combined financial statements present fairly, in all materialrespects, the financial position of the Company as of September 25, 2009 and September 26, 2008 andthe results of its operations and its cash flows for each of the three years in the period endedSeptember 25, 2009, in conformity with accounting principles generally accepted in the United States ofAmerica. Also, in our opinion, such financial statement schedule, when considered in relation to thebasic consolidated and combined financial statements taken as a whole, presents fairly, in all materialrespects, the information set forth therein.
As discussed in Note 1 to the consolidated and combined financial statements, prior to itsseparation from Tyco International Ltd. (‘‘Tyco International’’), the Company was comprised of theassets and liabilities used in managing and operating the electronics businesses of Tyco International.The combined financial statements also included allocations of corporate overhead, net class actionsettlement costs, net interest expense, and other expenses from Tyco International. These allocationsmay not be reflective of the actual level of costs which would have been incurred had the Companyoperated as a separate entity apart from Tyco International.
As discussed in Note 18 to the consolidated and combined financial statements, in fiscal 2008, theCompany adopted the Financial Accounting Standards Board (‘‘FASB’’)-issued guidance in AccountingStandards Codification (‘‘ASC’’) 740 (Income Taxes) relating to the accounting for uncertainties inincome taxes.
As discussed in Note 12 to the consolidated and combined financial statements, in connection withits separation from Tyco International, the Company entered into certain guarantee commitments withTyco International and Covidien plc and has recorded the fair value of these guarantees.
We have also audited, in accordance with the standards of the Public Company AccountingOversight Board (United States), the Company’s internal control over financial reporting as ofSeptember 25, 2009, based on the criteria established in Internal Control—Integrated Framework issuedby the Committee of Sponsoring Organizations of the Treadway Commission and our report datedNovember 18, 2009 expressed an unqualified opinion on the Company’s internal control over financialreporting.
/s/ Deloitte & Touche LLP
Philadelphia, PennsylvaniaNovember 18, 2009
56
REPORT OF INDEPENDENT REGISTERED PUBLIC ACCOUNTING FIRM
To the Board of Directors and Shareholders of Tyco Electronics Ltd.:We have audited Tyco Electronics Ltd. and subsidiaries’ (the ‘‘Company’s’’) internal control over
financial reporting as of September 25, 2009, based on criteria established in Internal Control—Integrated Framework issued by the Committee of Sponsoring Organizations of the TreadwayCommission. The Company’s management is responsible for maintaining effective internal control overfinancial reporting and for its assessment of the effectiveness of internal control over financialreporting, included in the accompanying Management’s Report on Internal Control Over FinancialReporting. Our responsibility is to express an opinion on the Company’s internal control over financialreporting based on our audit.
We conducted our audit in accordance with the standards of the Public Company AccountingOversight Board (United States). Those standards require that we plan and perform the audit to obtainreasonable assurance about whether effective internal control over financial reporting was maintainedin all material respects. Our audit included obtaining an understanding of internal control overfinancial reporting, assessing the risk that a material weakness exists, testing and evaluating the designand operating effectiveness of internal control based on that risk, and performing such otherprocedures as we considered necessary in the circumstances. We believe that our audit provides areasonable basis for our opinion.
A company’s internal control over financial reporting is a process designed by, or under thesupervision of, the company’s principal executive and principal financial officers, or persons performingsimilar functions, and effected by the company’s board of directors, management, and other personnelto provide reasonable assurance regarding the reliability of financial reporting and the preparation offinancial statements for external purposes in accordance with generally accepted accounting principles.A company’s internal control over financial reporting includes those policies and procedures that(1) pertain to the maintenance of records that, in reasonable detail, accurately and fairly reflect thetransactions and dispositions of the assets of the company; (2) provide reasonable assurance thattransactions are recorded as necessary to permit preparation of financial statements in accordance withgenerally accepted accounting principles, and that receipts and expenditures of the company are beingmade only in accordance with authorizations of management and directors of the company; and(3) provide reasonable assurance regarding prevention or timely detection of unauthorized acquisition,use, or disposition of the company’s assets that could have a material effect on the financial statements.
Because of the inherent limitations of internal control over financial reporting, including thepossibility of collusion or improper management override of controls, material misstatements due toerror or fraud may not be prevented or detected on a timely basis. Also, projections of any evaluationof the effectiveness of the internal control over financial reporting to future periods are subject to therisk that the controls may become inadequate because of changes in conditions, or that the degree ofcompliance with the policies or procedures may deteriorate.
In our opinion, the Company maintained, in all material respects, effective internal control overfinancial reporting as of September 25, 2009, based on the criteria established in Internal Control—Integrated Framework issued by the Committee of Sponsoring Organizations of the Treadway Commission.
We have also audited, in accordance with the standards of the Public Company AccountingOversight Board (United States), the consolidated and combined financial statements and financialstatement schedule of the Company as of and for the year ended September 25, 2009, and our reportdated November 18, 2009 expressed an unqualified opinion on those consolidated and combinedfinancial statements and financial statement schedule.
/s/ Deloitte & Touche LLP
Philadelphia, PennsylvaniaNovember 18, 2009
57

TYCO ELECTRONICS LTD.
CONSOLIDATED AND COMBINED STATEMENTS OF OPERATIONS
Fiscal Years Ended September 25, 2009, September 26, 2008, and September 28, 2007
Fiscal
2009 2008 2007
(in millions, except per share data)
Net sales . . . . . . . . . . . . . . . . . . . . . . . . . . . . . . . . . . . . . . . . . . $10,256 $14,373 $12,574Cost of sales . . . . . . . . . . . . . . . . . . . . . . . . . . . . . . . . . . . . . . . . 7,720 10,200 8,855
Gross income . . . . . . . . . . . . . . . . . . . . . . . . . . . . . . . . . . . . . 2,536 4,173 3,719Selling, general, and administrative expenses . . . . . . . . . . . . . . . . . 1,408 1,573 1,509Research, development, and engineering expenses . . . . . . . . . . . . . 536 593 532Pre-Separation litigation charges, net . . . . . . . . . . . . . . . . . . . . . . 144 22 887Separation costs . . . . . . . . . . . . . . . . . . . . . . . . . . . . . . . . . . . . . — — 44Restructuring and other charges, net . . . . . . . . . . . . . . . . . . . . . . 375 219 92Impairment of goodwill . . . . . . . . . . . . . . . . . . . . . . . . . . . . . . . . 3,547 103 —
Operating income (loss) . . . . . . . . . . . . . . . . . . . . . . . . . . . . . . (3,474) 1,663 655Interest income . . . . . . . . . . . . . . . . . . . . . . . . . . . . . . . . . . . . . . 17 32 53Interest expense . . . . . . . . . . . . . . . . . . . . . . . . . . . . . . . . . . . . . (165) (190) (232)Other income (expense), net . . . . . . . . . . . . . . . . . . . . . . . . . . . . (48) 567 (219)
Income (loss) from continuing operations before income taxesand minority interest . . . . . . . . . . . . . . . . . . . . . . . . . . . . . . (3,670) 2,072 257
Income tax (expense) benefit . . . . . . . . . . . . . . . . . . . . . . . . . . . . 576 (540) (465)Minority interest . . . . . . . . . . . . . . . . . . . . . . . . . . . . . . . . . . . . . (6) (5) (6)
Income (loss) from continuing operations . . . . . . . . . . . . . . . . . (3,100) 1,527 (214)Income (loss) from discontinued operations, net of income taxes . . (156) 255 (340)
Net income (loss) . . . . . . . . . . . . . . . . . . . . . . . . . . . . . . . . . . . . $ (3,256) $ 1,782 $ (554)
Basic earnings (loss) per share:Income (loss) from continuing operations . . . . . . . . . . . . . . . . . $ (6.75) $ 3.16 $ (0.43)Income (loss) from discontinued operations . . . . . . . . . . . . . . . . (0.34) 0.53 (0.68)
Net income (loss) . . . . . . . . . . . . . . . . . . . . . . . . . . . . . . . . . . $ (7.09) $ 3.69 $ (1.11)
Diluted earnings (loss) per share:Income (loss) from continuing operations . . . . . . . . . . . . . . . . . $ (6.75) $ 3.14 $ (0.43)Income (loss) from discontinued operations . . . . . . . . . . . . . . . . (0.34) 0.53 (0.68)
Net income (loss) . . . . . . . . . . . . . . . . . . . . . . . . . . . . . . . . . . $ (7.09) $ 3.67 $ (1.11)
Weighted-average number of shares outstanding:Basic . . . . . . . . . . . . . . . . . . . . . . . . . . . . . . . . . . . . . . . . . . . . 459 483 497Diluted . . . . . . . . . . . . . . . . . . . . . . . . . . . . . . . . . . . . . . . . . . 459 486 497
See Notes to Consolidated and Combined Financial Statements.
58
TYCO ELECTRONICS LTD.
CONSOLIDATED BALANCE SHEETS
As of September 25, 2009 and September 26, 2008
Fiscal
2009 2008
(in millions, exceptshare data)
AssetsCurrent Assets:
Cash and cash equivalents . . . . . . . . . . . . . . . . . . . . . . . . . . . . . . . . . . . . . . . . . . . . . $ 1,521 $ 1,090Accounts receivable, net of allowance for doubtful accounts of $48 and $40, respectively . . . 1,975 2,656Inventories . . . . . . . . . . . . . . . . . . . . . . . . . . . . . . . . . . . . . . . . . . . . . . . . . . . . . . . . 1,435 2,159Prepaid expenses and other current assets . . . . . . . . . . . . . . . . . . . . . . . . . . . . . . . . . . . 487 756Deferred income taxes . . . . . . . . . . . . . . . . . . . . . . . . . . . . . . . . . . . . . . . . . . . . . . . . 161 204Assets held for sale . . . . . . . . . . . . . . . . . . . . . . . . . . . . . . . . . . . . . . . . . . . . . . . . . . — 770
Total current assets . . . . . . . . . . . . . . . . . . . . . . . . . . . . . . . . . . . . . . . . . . . . . . . . 5,579 7,635Property, plant, and equipment, net . . . . . . . . . . . . . . . . . . . . . . . . . . . . . . . . . . . . . . . . 3,111 3,342Goodwill . . . . . . . . . . . . . . . . . . . . . . . . . . . . . . . . . . . . . . . . . . . . . . . . . . . . . . . . . . . 3,160 6,749Intangible assets, net . . . . . . . . . . . . . . . . . . . . . . . . . . . . . . . . . . . . . . . . . . . . . . . . . . 407 454Deferred income taxes . . . . . . . . . . . . . . . . . . . . . . . . . . . . . . . . . . . . . . . . . . . . . . . . . 2,518 1,915Receivable from Tyco International Ltd. and Covidien plc . . . . . . . . . . . . . . . . . . . . . . . . . 1,211 1,218Other assets . . . . . . . . . . . . . . . . . . . . . . . . . . . . . . . . . . . . . . . . . . . . . . . . . . . . . . . . 234 287
Total Assets . . . . . . . . . . . . . . . . . . . . . . . . . . . . . . . . . . . . . . . . . . . . . . . . . . . . . $16,220 $21,600
Liabilities and Shareholders’ EquityCurrent Liabilities:
Current maturities of long-term debt . . . . . . . . . . . . . . . . . . . . . . . . . . . . . . . . . . . . . . $ 101 $ 20Accounts payable . . . . . . . . . . . . . . . . . . . . . . . . . . . . . . . . . . . . . . . . . . . . . . . . . . . 1,068 1,433Accrued and other current liabilities . . . . . . . . . . . . . . . . . . . . . . . . . . . . . . . . . . . . . . 1,243 1,558Deferred revenue . . . . . . . . . . . . . . . . . . . . . . . . . . . . . . . . . . . . . . . . . . . . . . . . . . . 203 207Liabilities held for sale . . . . . . . . . . . . . . . . . . . . . . . . . . . . . . . . . . . . . . . . . . . . . . . — 169
Total current liabilities . . . . . . . . . . . . . . . . . . . . . . . . . . . . . . . . . . . . . . . . . . . . . . 2,615 3,387Long-term debt . . . . . . . . . . . . . . . . . . . . . . . . . . . . . . . . . . . . . . . . . . . . . . . . . . . . . . 2,316 3,161Long-term pension and postretirement liabilities . . . . . . . . . . . . . . . . . . . . . . . . . . . . . . . . 1,129 721Deferred income taxes . . . . . . . . . . . . . . . . . . . . . . . . . . . . . . . . . . . . . . . . . . . . . . . . . 188 289Income taxes . . . . . . . . . . . . . . . . . . . . . . . . . . . . . . . . . . . . . . . . . . . . . . . . . . . . . . . . 2,312 2,291Other liabilities . . . . . . . . . . . . . . . . . . . . . . . . . . . . . . . . . . . . . . . . . . . . . . . . . . . . . . 634 668
Total Liabilities . . . . . . . . . . . . . . . . . . . . . . . . . . . . . . . . . . . . . . . . . . . . . . . . . . . 9,194 10,517
Commitments and contingencies (Note 15)Minority interest . . . . . . . . . . . . . . . . . . . . . . . . . . . . . . . . . . . . . . . . . . . . . . . . . . . . . 10 10Shareholders’ Equity:
Preferred shares, none at September 25, 2009; 125,000,000 shares authorized and noneoutstanding, $0.20 par value, at September 26, 2008 . . . . . . . . . . . . . . . . . . . . . . . . . . — —
Common shares, 468,215,574 shares authorized and issued, CHF 2.43 par value, atSeptember 25, 2009; 1,000,000,000 shares authorized and 500,241,706 shares issued, $0.20par value, at September 26, 2008 . . . . . . . . . . . . . . . . . . . . . . . . . . . . . . . . . . . . . . . 1,049 100
Capital in excess:Share premium . . . . . . . . . . . . . . . . . . . . . . . . . . . . . . . . . . . . . . . . . . . . . . . . . . . — 61Contributed surplus . . . . . . . . . . . . . . . . . . . . . . . . . . . . . . . . . . . . . . . . . . . . . . . . 8,135 10,106
Accumulated earnings (deficit) . . . . . . . . . . . . . . . . . . . . . . . . . . . . . . . . . . . . . . . . . . (2,274) 1,141Treasury shares, at cost, 9,425,172 shares at September 25, 2009; 36,904,702 shares at
September 26, 2008 . . . . . . . . . . . . . . . . . . . . . . . . . . . . . . . . . . . . . . . . . . . . . . . . (349) (1,264)Accumulated other comprehensive income . . . . . . . . . . . . . . . . . . . . . . . . . . . . . . . . . . 455 929
Total Shareholders’ Equity . . . . . . . . . . . . . . . . . . . . . . . . . . . . . . . . . . . . . . . . . . . 7,016 11,073
Total Liabilities and Shareholders’ Equity . . . . . . . . . . . . . . . . . . . . . . . . . . . . . . . . . $16,220 $21,600
See Notes to Consolidated and Combined Financial Statements.
59

TYCO ELECTRONICS LTD.
CONSOLIDATED AND COMBINED STATEMENTS OF EQUITY
Fiscal Years Ended September 25, 2009, September 26, 2008, and September 28, 2007
AccumulatedParent Accumulated OtherCommon Shares Treasury Shares Share Contributed Company Earnings Comprehensive Total
Shares Amount Shares Amount Premium Surplus Investment (Deficit) Income Equity
(in millions)Balance at September 29, 2006 . . . . . . . — $ — — $ — $— $ — $ 10,490 $ — $ 670 $11,160Comprehensive income:
Net income (loss) . . . . . . . . . . . . . — — — — — — (810) 256 — (554)Currency translation . . . . . . . . . . . . — — — — — — — — 453 453Minimum pension liability, net of
income taxes . . . . . . . . . . . . . . . — — — — — — — — 207 207Unrealized loss on cash flow hedge . . . — — — — — — — — (53) (53)
Total comprehensive income . . . . . . . 53
Adoption of funded status recognitionprovisions of ASC 715(Compensation—Retirement Benefits),net of tax . . . . . . . . . . . . . . . . . . — — — — — — — — (225) (225)
Net transfers from former parent . . . . . — — — — — — 848 — — 848Transfer of parent company investment to
contributed surplus . . . . . . . . . . . . — — — — — 10,528 (10,528) — — —Guarantees and shared tax liabilities to
Tyco International and Covidien inaccordance with the Tax SharingAgreement . . . . . . . . . . . . . . . . . — — — — — (296) — — — (296)
Due from Tyco International andCovidien in accordance with the TaxSharing Agreement . . . . . . . . . . . . — — — — — 844 — — — 844
Income tax liabilities assumed uponSeparation . . . . . . . . . . . . . . . . . — — — — — (1,091) — — — (1,091)
Issuance of common shares . . . . . . . . . 497 99 — — — — — — — 99Compensation expense, including charge
related to Tyco International equityaward conversion . . . . . . . . . . . . . — — — — — 44 — — — 44
Dividends declared . . . . . . . . . . . . . . — — — — — — — (70) — (70)Exercise of share options . . . . . . . . . . — — — — 13 — — — — 13Repurchase of common shares . . . . . . . — — — (2) — — — — — (2)
Balance at September 28, 2007 . . . . . . . 497 99 — (2) 13 10,029 — 186 1,052 11,377Adoption of uncertain tax position
provisions of ASC 740 (Income Taxes) . — — — — — — — (549) — (549)Comprehensive income:
Net income . . . . . . . . . . . . . . . . . — — — — — — — 1,782 — 1,782Currency translation . . . . . . . . . . . . — — — — — — — — (22) (22)Adjustments to unrecognized pension
and postretirement benefit costs, netof income taxes . . . . . . . . . . . . . — — — — — — — — (107) (107)
Gain on cash flow hedge . . . . . . . . . — — — — — — — — 7 7Unrealized loss on securities, net of
income taxes . . . . . . . . . . . . . . . — — — — — — — — (1) (1)
Total comprehensive income . . . . . . . 1,659
Compensation expense . . . . . . . . . . . . — — — — — 61 — — — 61Dividends declared . . . . . . . . . . . . . . — — — — — — — (276) — (276)Exercise of share options . . . . . . . . . . 3 1 — 7 48 — — (2) — 54Adjustment for pre-Separation tax
matters . . . . . . . . . . . . . . . . . . . — — — — — 16 — — — 16Repurchase of common shares . . . . . . . — — (37) (1,269) — — — — — (1,269)
Balance at September 26, 2008 . . . . . . . 500 $100 (37) $(1,264) $61 $10,106 $ — $1,141 $ 929 $11,073
60
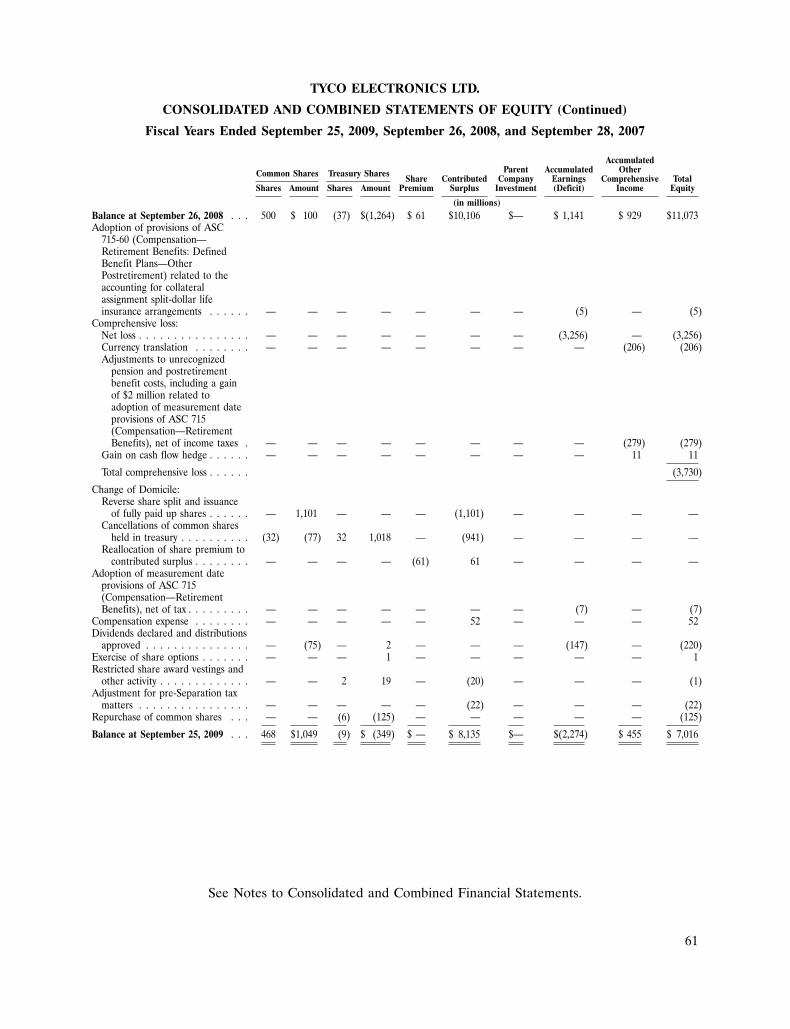
TYCO ELECTRONICS LTD.
CONSOLIDATED AND COMBINED STATEMENTS OF EQUITY (Continued)
Fiscal Years Ended September 25, 2009, September 26, 2008, and September 28, 2007
AccumulatedParent Accumulated OtherCommon Shares Treasury Shares Share Contributed Company Earnings Comprehensive Total
Shares Amount Shares Amount Premium Surplus Investment (Deficit) Income Equity
(in millions)Balance at September 26, 2008 . . . 500 $ 100 (37) $(1,264) $ 61 $10,106 $— $ 1,141 $ 929 $11,073Adoption of provisions of ASC
715-60 (Compensation—Retirement Benefits: DefinedBenefit Plans—OtherPostretirement) related to theaccounting for collateralassignment split-dollar lifeinsurance arrangements . . . . . . — — — — — — — (5) — (5)
Comprehensive loss:Net loss . . . . . . . . . . . . . . . . — — — — — — — (3,256) — (3,256)Currency translation . . . . . . . . — — — — — — — — (206) (206)Adjustments to unrecognized
pension and postretirementbenefit costs, including a gainof $2 million related toadoption of measurement dateprovisions of ASC 715(Compensation—RetirementBenefits), net of income taxes . — — — — — — — — (279) (279)
Gain on cash flow hedge . . . . . . — — — — — — — — 11 11
Total comprehensive loss . . . . . . (3,730)
Change of Domicile:Reverse share split and issuance
of fully paid up shares . . . . . . — 1,101 — — — (1,101) — — — —Cancellations of common shares
held in treasury . . . . . . . . . . (32) (77) 32 1,018 — (941) — — — —Reallocation of share premium to
contributed surplus . . . . . . . . — — — — (61) 61 — — — —Adoption of measurement date
provisions of ASC 715(Compensation—RetirementBenefits), net of tax . . . . . . . . . — — — — — — — (7) — (7)
Compensation expense . . . . . . . . — — — — — 52 — — — 52Dividends declared and distributions
approved . . . . . . . . . . . . . . . — (75) — 2 — — — (147) — (220)Exercise of share options . . . . . . . — — — 1 — — — — — 1Restricted share award vestings and
other activity . . . . . . . . . . . . . — — 2 19 — (20) — — — (1)Adjustment for pre-Separation tax
matters . . . . . . . . . . . . . . . . — — — — — (22) — — — (22)Repurchase of common shares . . . — — (6) (125) — — — — — (125)
Balance at September 25, 2009 . . . 468 $1,049 (9) $ (349) $ — $ 8,135 $— $(2,274) $ 455 $ 7,016
See Notes to Consolidated and Combined Financial Statements.
61

TYCO ELECTRONICS LTD.
CONSOLIDATED AND COMBINED STATEMENTS OF CASH FLOWS
Fiscal Years Ended September 25, 2009, September 26, 2008, and September 28, 2007
Fiscal
2009 2008 2007
(in millions)Cash Flows From Operating Activities:Net income (loss) . . . . . . . . . . . . . . . . . . . . . . . . . . . . . . . . . . . . . . . . . . . . . . . . . . . . . . $(3,256) $ 1,782 $ (554)
(Income) loss from discontinued operations, net of income taxes . . . . . . . . . . . . . . . . . . . . . . . . 156 (255) 340
Income (loss) from continuing operations . . . . . . . . . . . . . . . . . . . . . . . . . . . . . . . . . . . . . . . . (3,100) 1,527 (214)Adjustments to reconcile net cash provided by operating activities:
Impairment of goodwill . . . . . . . . . . . . . . . . . . . . . . . . . . . . . . . . . . . . . . . . . . . . . . . . . 3,547 103 —Class action settlement . . . . . . . . . . . . . . . . . . . . . . . . . . . . . . . . . . . . . . . . . . . . . . . . . — (936) 887Non-cash restructuring and other charges, net . . . . . . . . . . . . . . . . . . . . . . . . . . . . . . . . . . . 49 81 23Depreciation and amortization . . . . . . . . . . . . . . . . . . . . . . . . . . . . . . . . . . . . . . . . . . . . . 515 539 496Deferred income taxes . . . . . . . . . . . . . . . . . . . . . . . . . . . . . . . . . . . . . . . . . . . . . . . . . . (583) 164 144Provision for losses on accounts receivable and inventory . . . . . . . . . . . . . . . . . . . . . . . . . . . . . 74 42 74Tax sharing income . . . . . . . . . . . . . . . . . . . . . . . . . . . . . . . . . . . . . . . . . . . . . . . . . . . . 68 (567) (13)Allocated loss on retirement of debt . . . . . . . . . . . . . . . . . . . . . . . . . . . . . . . . . . . . . . . . . — — 232Other . . . . . . . . . . . . . . . . . . . . . . . . . . . . . . . . . . . . . . . . . . . . . . . . . . . . . . . . . . . . 53 42 (12)Changes in assets and liabilities, net of the effects of acquisitions and divestitures:
Accounts receivable, net . . . . . . . . . . . . . . . . . . . . . . . . . . . . . . . . . . . . . . . . . . . . . . . 651 (107) (97)Inventories . . . . . . . . . . . . . . . . . . . . . . . . . . . . . . . . . . . . . . . . . . . . . . . . . . . . . . . 638 (221) (76)Inventoried costs on long-term contracts . . . . . . . . . . . . . . . . . . . . . . . . . . . . . . . . . . . . . (4) (46) 16Prepaid expenses and other current assets . . . . . . . . . . . . . . . . . . . . . . . . . . . . . . . . . . . . . 184 56 (138)Accounts payable . . . . . . . . . . . . . . . . . . . . . . . . . . . . . . . . . . . . . . . . . . . . . . . . . . . (420) 41 79Accrued and other liabilities . . . . . . . . . . . . . . . . . . . . . . . . . . . . . . . . . . . . . . . . . . . . . (124) 120 108Income taxes . . . . . . . . . . . . . . . . . . . . . . . . . . . . . . . . . . . . . . . . . . . . . . . . . . . . . . (115) 18 (112)Deferred revenue . . . . . . . . . . . . . . . . . . . . . . . . . . . . . . . . . . . . . . . . . . . . . . . . . . . (7) 120 34Other . . . . . . . . . . . . . . . . . . . . . . . . . . . . . . . . . . . . . . . . . . . . . . . . . . . . . . . . . . . (48) (54) 16
Net cash provided by (used in) continuing operating activities . . . . . . . . . . . . . . . . . . . . . . . 1,378 922 1,447Net cash provided by (used in) discontinued operating activities . . . . . . . . . . . . . . . . . . . . . . (49) 67 78
Net cash provided by (used in) operating activities . . . . . . . . . . . . . . . . . . . . . . . . . . . . . . 1,329 989 1,525
Cash Flows From Investing Activities:Capital expenditures . . . . . . . . . . . . . . . . . . . . . . . . . . . . . . . . . . . . . . . . . . . . . . . . . . . . (328) (610) (863)Proceeds from sale of property, plant, and equipment . . . . . . . . . . . . . . . . . . . . . . . . . . . . . . . . 13 42 41Class action settlement escrow . . . . . . . . . . . . . . . . . . . . . . . . . . . . . . . . . . . . . . . . . . . . . . — 936 (928)Proceeds from divestiture of discontinued operations, net of cash retained by operations sold . . . . . . . . 693 571 227Proceeds from divestiture of businesses, net of cash retained by businesses sold . . . . . . . . . . . . . . . . . 17 — —Other . . . . . . . . . . . . . . . . . . . . . . . . . . . . . . . . . . . . . . . . . . . . . . . . . . . . . . . . . . . . . (1) (29) (3)
Net cash provided by (used in) continuing investing activities . . . . . . . . . . . . . . . . . . . . . . . . 394 910 (1,526)Net cash provided by (used in) discontinued investing activities . . . . . . . . . . . . . . . . . . . . . . (3) (15) (2)
Net cash provided by (used in) investing activities . . . . . . . . . . . . . . . . . . . . . . . . . . . . . . 391 895 (1,528)
Cash Flows From Financing Activities:Net (decrease) increase in commercial paper . . . . . . . . . . . . . . . . . . . . . . . . . . . . . . . . . . . . . . (649) 630 —Proceeds from long-term debt . . . . . . . . . . . . . . . . . . . . . . . . . . . . . . . . . . . . . . . . . . . . . . . 448 900 5,676Repayment of long-term debt . . . . . . . . . . . . . . . . . . . . . . . . . . . . . . . . . . . . . . . . . . . . . . . (602) (1,751) (2,455)Allocated debt activity . . . . . . . . . . . . . . . . . . . . . . . . . . . . . . . . . . . . . . . . . . . . . . . . . . . — — (3,743)Net transactions with former parent . . . . . . . . . . . . . . . . . . . . . . . . . . . . . . . . . . . . . . . . . . . — — 1,112Repurchase of common shares . . . . . . . . . . . . . . . . . . . . . . . . . . . . . . . . . . . . . . . . . . . . . . (152) (1,242) —Payment of common share dividends and cash distributions to shareholders . . . . . . . . . . . . . . . . . . . (294) (271) —Proceeds from exercise of share options . . . . . . . . . . . . . . . . . . . . . . . . . . . . . . . . . . . . . . . . . 1 54 13Transfers (to) from discontinued operations . . . . . . . . . . . . . . . . . . . . . . . . . . . . . . . . . . . . . . (56) 5 (84)Minority interest distributions paid . . . . . . . . . . . . . . . . . . . . . . . . . . . . . . . . . . . . . . . . . . . . (5) (11) (7)Other . . . . . . . . . . . . . . . . . . . . . . . . . . . . . . . . . . . . . . . . . . . . . . . . . . . . . . . . . . . . . (1) (1) (8)
Net cash provided by (used in) continuing financing activities . . . . . . . . . . . . . . . . . . . . . . . (1,310) (1,687) 504Net cash provided by (used in) discontinued financing activities . . . . . . . . . . . . . . . . . . . . . . 56 (52) (73)
Net cash provided by (used in) financing activities . . . . . . . . . . . . . . . . . . . . . . . . . . . . . . (1,254) (1,739) 431
Effect of currency translation on cash . . . . . . . . . . . . . . . . . . . . . . . . . . . . . . . . . . . . . . . . . . (31) 1 46Net increase (decrease) in cash and cash equivalents . . . . . . . . . . . . . . . . . . . . . . . . . . . . . . . . 435 146 474Less: net (increase) decrease in cash and cash equivalents related to discontinued operations . . . . . . . . (4) — (3)Cash and cash equivalents at beginning of fiscal year . . . . . . . . . . . . . . . . . . . . . . . . . . . . . . . . 1,090 944 473
Cash and cash equivalents at end of fiscal year . . . . . . . . . . . . . . . . . . . . . . . . . . . . . . . . . . . . $ 1,521 $ 1,090 $ 944
Supplementary Cash Flow Information:Interest paid . . . . . . . . . . . . . . . . . . . . . . . . . . . . . . . . . . . . . . . . . . . . . . . . . . . . . . . . . $ 163 $ 100 $ 231Income taxes paid, net of refunds . . . . . . . . . . . . . . . . . . . . . . . . . . . . . . . . . . . . . . . . . . . . 121 359 446
See Notes to Consolidated and Combined Financial Statements.
62
TYCO ELECTRONICS LTD.
NOTES TO CONSOLIDATED AND COMBINED FINANCIAL STATEMENTS
1. Basis of Presentation
Tyco Electronics Ltd. (‘‘Tyco Electronics’’ or the ‘‘Company’’) is a leading global provider ofengineered electronic components, network solutions, specialty products, and underseatelecommunication systems.
Change of Domicile
Effective June 25, 2009, the Company discontinued its existence as a Bermuda company asprovided in Section 132G of The Companies Act of 1981 of Bermuda, as amended (the ‘‘BermudaCompanies Act’’), and, in accordance with article 161 of the Swiss Federal Code on InternationalPrivate Law, continued its existence as a Swiss corporation under articles 620 et seq. of the Swiss Codeof Obligations (the ‘‘Change of Domicile’’). The rights of holders of the Company’s shares are nowgoverned by Swiss law, the Company’s Swiss articles of association, and the Company’s Swissorganizational regulations.
The Separation
Effective June 29, 2007, the Company became the parent company of the former electronicsbusinesses of Tyco International Ltd. (‘‘Tyco International’’). On June 29, 2007, Tyco Internationaldistributed all of its shares of Tyco Electronics, as well as its shares of its former healthcare businesses(‘‘Covidien’’), to its common shareholders (the ‘‘Separation’’).
Basis of Presentation
The accompanying Consolidated and Combined Financial Statements reflect the consolidatedoperations of Tyco Electronics Ltd. and its subsidiaries as an independent, publicly-traded companysubsequent to the Separation and a combined reporting entity comprising the assets and liabilities usedin managing and operating the electronics businesses of Tyco International, including TycoElectronics Ltd., for the period prior to the Separation.
The Consolidated and Combined Financial Statements have been prepared in United StatesDollars, in accordance with accounting principles generally accepted in the United States of America(‘‘GAAP’’). The preparation of the Consolidated and Combined Financial Statements in conformitywith GAAP requires management to make use of estimates and assumptions that affect the reportedamount of assets and liabilities, the disclosure of contingent assets and liabilities, and the reportedamounts of revenues and expenses. Significant estimates in these Consolidated and Combined FinancialStatements include restructuring and other charges, acquisition liabilities, allowances for doubtfulaccounts receivable, estimates of future cash flows associated with asset impairments, useful lives fordepreciation and amortization, loss contingencies, net realizable value of inventories, estimated contractrevenue and related costs, legal contingencies, tax reserves and deferred tax asset valuation allowances,and the determination of discount and other rate assumptions for pension and postretirement employeebenefit expenses. Actual results could differ materially from these estimates.
The Consolidated and Combined Financial Statements for the period prior to the Separation maynot be indicative of the Company’s future performance and do not necessarily reflect what itsconsolidated and combined results of operations, financial position, and cash flows would have beenhad it operated as an independent, publicly-traded company prior to June 29, 2007. To the extent thatan asset, liability, revenue, or expense is directly associated with the Company, it is reflected in theaccompanying Consolidated and Combined Financial Statements. Certain general corporate overhead,net class action settlement costs, net interest expense, and other expenses for the period prior to the
63
TYCO ELECTRONICS LTD.
NOTES TO CONSOLIDATED AND COMBINED FINANCIAL STATEMENTS (Continued)
1. Basis of Presentation (Continued)
Separation were allocated by Tyco International to the Company. Management believes such allocationswere reasonable; however, they may not be indicative of the actual results of the Company had theCompany been operating as an independent, publicly-traded company for the period prior to theSeparation. See Note 17 for further information regarding allocations.
Description of the Business
The Company consists of four reportable segments:
• Electronic Components. The Electronic Components segment is one of the world’s largestsuppliers of passive electronic components, which includes connectors and interconnect systems,relays, switches, sensors, and wire and cable. The products sold by the Electronic Componentssegment are sold primarily to original equipment manufacturers and their contractmanufacturers in the automotive, computer, communications, industrial, appliance, andconsumer electronics markets.
• Network Solutions. The Network Solutions segment is one of the world’s largest suppliers ofinfrastructure components and systems for telecommunications and energy markets. Thesecomponents include connectors, above-and below-ground enclosures, heat shrink tubing, cableaccessories, surge arrestors, fiber optic cabling, copper cabling, and racks for copper and fibernetworks. This segment also provides electronic systems for test access and intelligent cross-connect applications as well as integrated cabling solutions for cabling and building management.
• Specialty Products. The Specialty Products segment is a leader in providing highly-engineeredcustom solutions, components, and connectors for electronic systems, subsystems, and devices inthe aerospace, defense, and marine; touch systems; medical; and circuit protection markets.
• Undersea Telecommunications. The Undersea Telecommunications segment designs, builds,maintains, and tests undersea fiber optic networks for both the telecommunications and oil andgas markets.
Principles of Consolidation
The Company consolidates entities in which it owns or controls more than fifty percent of thevoting shares or otherwise has the ability to control through similar rights. In addition, the Companyconsolidates variable interest entities in which the Company bears a majority of the risk to the entities’expected losses or stands to gain from a majority of the entities’ expected returns. All intercompanytransactions have been eliminated. The results of companies acquired or disposed of are included onthe Consolidated and Combined Financial Statements from the effective date of acquisition or up tothe date of disposal.
Fiscal Year
Unless otherwise indicated, references in the Consolidated and Combined Financial Statements tofiscal 2009, fiscal 2008, and fiscal 2007 are to Tyco Electronics’ fiscal years ended September 25, 2009,September 26, 2008, and September 28, 2007. Tyco Electronics’ fiscal year is a ‘‘52-53 week’’ yearending on the last Friday of September, such that each quarterly period is 13 weeks in length. For fiscalyears in which there are 53 weeks, the fourth quarter reporting period will include 14 weeks, with thefirst such occurrence taking place in fiscal 2011.
64

TYCO ELECTRONICS LTD.
NOTES TO CONSOLIDATED AND COMBINED FINANCIAL STATEMENTS (Continued)
1. Basis of Presentation (Continued)
Reclassifications
During fiscal 2009, the Company reclassified certain expenses on its Consolidated and CombinedStatements of Operations. Research, development, and engineering expenses, which were previouslyclassified as cost of sales, are separately presented on the Consolidated and Combined Statements ofOperations. Intangible asset amortization expense, which was previously reflected in selling, general,and administrative expenses, is now presented in cost of sales. Also, impairment of long-lived assetswhich was previously presented in impairment of goodwill and long-lived assets is now reflected inrestructuring and other charges, net.
Research, development, and engineering expenses were $536 million, $593 million, and$532 million in fiscal 2009, 2008, and 2007, respectively. Intangible asset amortization expense in fiscal2009, 2008, and 2007 was $31 million, $33 million, and $32 million, respectively. Impairment oflong-lived assets was $14 million and $34 million in fiscal 2009 and 2008, respectively. Thereclassifications had no impact on previously reported operating income (loss), net income (loss), orearnings (loss) per share. All prior periods have been reclassified to conform to the currentpresentation.
2. Summary of Significant Accounting Policies
Revenue Recognition
The Company’s revenues are generated principally from the sale of its products. Revenue from thesale of products is recognized at the time title and the risks and rewards of ownership pass to thecustomer. This generally occurs when the products reach the free-on-board shipping point, the salesprice is fixed and determinable, and collection is reasonably assured. For those items where title hasnot yet transferred, the Company has deferred the recognition of revenue.
The Company provides certain distributors with an inventory allowance for returns or scrap equalto a percentage of qualified purchases. A reserve for estimated scrap and returns allowances isestablished at the time of the sale based on a fixed percentage of sales to distributors authorized andagreed to by the Company and is recorded as a reduction of sales.
Other allowances include customer quantity and price discrepancies. A reserve for otherallowances is established at the time of sale based on historical experience and is recorded as areduction of sales. The Company believes it can reasonably and reliably estimate the amounts of futureallowances.
Contract sales for construction related projects are recorded primarily on thepercentage-of-completion method. Profits recognized on contracts in process are based upon estimatedcontract revenue and related cost to complete. Percentage-of-completion is measured based on theratio of actual costs incurred to total estimated costs. Revisions in cost estimates as contracts progresshave the effect of increasing or decreasing profits in the current period. Provisions for anticipatedlosses are made in the period in which they first become determinable. Contract sales for constructionrelated projects are generated primarily within the Company’s Undersea Telecommunications segment.
The Company generally warrants that its products will conform to the Company’s or mutuallyagreed to specifications and that its products will be free from material defects in materials andworkmanship for a limited time. The Company limits its warranty to the replacement or repair of
65
TYCO ELECTRONICS LTD.
NOTES TO CONSOLIDATED AND COMBINED FINANCIAL STATEMENTS (Continued)
2. Summary of Significant Accounting Policies (Continued)
defective parts or a refund or credit of the price of the defective product. The Company acceptsreturned goods only when the customer makes a verified claim and the Company has authorized thereturn. Returns result primarily from defective products or shipping discrepancies. A reserve forestimated returns is established at the time of sale based on historical return experience and isrecorded as a reduction of sales.
Additionally, certain of the Company’s long-term contracts in its Undersea Telecommunicationssegment have warranty obligations. Estimated warranty costs for each contract are determined based onthe contract terms and technology-specific considerations. These costs are included in total estimatedcontract costs and are accrued over the construction period of the respective contracts underpercentage-of-completion accounting.
Research and Development
Research and development expenditures are expensed when incurred and are included in research,development, and engineering expenses. Research and development expenses include salaries, directcosts incurred, and building and overhead expenses. The amounts expensed in fiscal 2009, 2008, and2007 were $439 million, $482 million, and $428 million, respectively.
Cash and Cash Equivalents
All highly liquid investments purchased with maturities of three months or less from the time ofpurchase are considered to be cash equivalents.
Allowance for Doubtful Accounts
The allowance for doubtful accounts receivable reflects the best estimate of probable lossesinherent in the Company’s outstanding receivables determined on the basis of historical experience,specific allowances for known troubled accounts, and other currently available evidence.
Inventories
Inventories are recorded at the lower of cost (first-in, first-out) or market value, except forinventoried costs which are costs incurred in the performance of long-term contracts primarily by theCompany’s Undersea Telecommunications segment.
Property, Plant, and Equipment, Net and Long-Lived Assets
Net property, plant, and equipment is recorded at cost less accumulated depreciation. Maintenanceand repair expenditures are charged to expense when incurred. Depreciation is calculated using thestraight-line method over the estimated useful lives of the related assets as follows:
Buildings and related improvements . . . . 5 to 40 yearsLeasehold improvements . . . . . . . . . . . . Lesser of remaining term of the lease or
economic useful lifeMachinery and equipment . . . . . . . . . . . 1 to 15 years
66
TYCO ELECTRONICS LTD.
NOTES TO CONSOLIDATED AND COMBINED FINANCIAL STATEMENTS (Continued)
2. Summary of Significant Accounting Policies (Continued)
The Company periodically evaluates the net realizable value of long-lived assets, includingproperty, plant, and equipment and amortizable intangible assets, relying on a number of factorsincluding operating results, business plans, economic projections, and anticipated future cash flows.When indicators of potential impairment are present, the carrying values of the assets are evaluated inrelation to the operating performance and estimated future undiscounted cash flows of the underlyingbusiness. An impairment in the carrying value of an asset group is recognized whenever anticipatedfuture undiscounted cash flows from an asset group are estimated to be less than its carrying value.The amount of impairment recognized is the difference between the carrying value of the asset and itsfair value. Fair value estimates are based on assumptions concerning the amount and timing ofestimated future cash flows and assumed discount rates, reflecting varying degrees of perceived risk.
Goodwill and Other Intangible Assets
Intangible assets acquired include both those that have a determinable life and residual goodwill.Intangible assets with a determinable life include primarily intellectual property consisting of patents,trademarks, and unpatented technology with estimates of recoverability ranging from 1 to 50 years thatare amortized on a straight-line basis. See Note 9 for additional information regarding intangible assets.An evaluation of the remaining useful life of intangible assets with a determinable life is performed ona periodic basis and when events and circumstances warrant an evaluation. The Company assessesintangible assets with a determinable life for impairment consistent with its policy for assessing otherlong-lived assets. Goodwill is assessed for impairment separately from other intangible assets with adeterminable life by comparing the carrying value of each reporting unit to its fair value on the firstday of the fourth quarter of each year or whenever the Company believes a triggering event requiring amore frequent assessment has occurred. In making this assessment, management relies on a number offactors including operating results, business plans, economic projections, anticipated future cash flows,transactions, and market place data. There are inherent uncertainties related to these factors andmanagement’s judgment in applying them to the analysis of goodwill impairment.
At fiscal year end 2009, the Company had 9 reporting units, of which 7 contained goodwill. SeeNote 8 for information regarding goodwill impairment testing. When changes occur in the compositionof one or more operating segments or reporting units, goodwill is reassigned to the reporting unitsaffected based on their relative fair values.
When testing for goodwill impairment, the Company performs a step I goodwill impairment test toidentify a potential impairment. In doing so, the Company compares the fair value of a reporting unitwith its carrying amount. If the carrying amount of a reporting unit exceeds its fair value, goodwill maybe impaired and a step II goodwill impairment test is performed to measure the amount of anyimpairment loss. In the step II goodwill impairment test, the Company compares the implied fair valueof reporting unit goodwill with the carrying amount of that goodwill. If the carrying amount ofreporting unit goodwill exceeds the implied fair value of that goodwill, an impairment loss is recognizedin an amount equal to the excess. The implied fair value of goodwill is determined in the same mannerthat the amount of goodwill recognized in a business combination is determined. The Companyallocates the fair value of a reporting unit to all of the assets and liabilities of that unit, includingintangible assets, as if the reporting unit had been acquired in a business combination. Any excess ofthe value of a reporting unit over the amounts assigned to its assets and liabilities is the implied fairvalue of goodwill.
67
TYCO ELECTRONICS LTD.
NOTES TO CONSOLIDATED AND COMBINED FINANCIAL STATEMENTS (Continued)
2. Summary of Significant Accounting Policies (Continued)
Estimates about fair value used in the step I goodwill impairment tests have been calculated usingan income approach based on the present value of future cash flows of each reporting unit. Theincome approach has been supported by additional transaction and guideline analyses. Theseapproaches incorporate a number of assumptions including future growth rates, discount factors, andincome tax rates in assessing fair value. Changes in economic and operating conditions impacting theseassumptions could result in goodwill impairments in future periods.
Income Taxes
Income taxes are computed in accordance with the provisions of Accounting StandardsCodification 740 (Income Taxes). In these Consolidated and Combined Financial Statements, thebenefits of a consolidated return have been reflected where such returns have or could be filed basedon the entities and jurisdictions included in the financial statements. Deferred tax liabilities and assetsare recognized for the expected future tax consequences of events that have been reflected on theConsolidated and Combined Financial Statements. Deferred tax liabilities and assets are determinedbased on the differences between the book and tax bases of particular assets and liabilities andoperating loss carryforwards using tax rates in effect for the years in which the differences are expectedto reverse. A valuation allowance is provided to offset deferred tax assets if, based upon the availableevidence, it is more likely than not that some or all of the deferred tax assets will not be realized.
Financial Instruments
In order to address certain financial exposures, the Company has established policies regarding theuse of derivative financial instruments. The Company currently enters into foreign exchange forwardand swap contracts to reduce the effects of fluctuating foreign exchange rates and forward contracts toreduce the effects of commodity price fluctuations. Also, the Company has designated certainintercompany non-derivative financial instruments denominated in foreign currencies as a hedge of itsnet investments in certain foreign operations denominated in the same foreign currencies.
All derivative financial instruments are reported on the Consolidated Balance Sheets at fair value.Changes in the fair value of derivative instruments that are not designated as either cash flow or fairvalue hedges are recognized currently in earnings in selling, general, and administrative expenses on theConsolidated and Combined Statements of Operations. Changes in the fair value of derivativeinstruments designated as fair value hedges affect the carrying value of the asset or liability hedged,with changes in both the derivative instrument and the hedged asset or liability being recognized inearnings. Changes in the fair value of derivative instruments designated as cash flow hedges arereflected in other comprehensive income, a component of equity, to the extent that they are deemedeffective. Effectiveness of cash flow hedges is measured quarterly and any changes in fair value that aredetermined to be ineffective are recognized currently in earnings in either cost of sales or selling,general, and administrative expenses. The remeasurement of the intercompany non-derivative financialinstruments designated as a hedge of the Company’s net investment in foreign operations is recorded incumulative translation adjustment in accumulated other comprehensive income on the ConsolidatedBalance Sheets offsetting the change in cumulative translation adjustment attributable to theCompany’s net investments in certain foreign operations.
The Company determines the fair value of its financial instruments by using methods andassumptions that are based on market conditions and risks existing at each balance sheet date.
68

TYCO ELECTRONICS LTD.
NOTES TO CONSOLIDATED AND COMBINED FINANCIAL STATEMENTS (Continued)
2. Summary of Significant Accounting Policies (Continued)
Standard market conventions are used to determine the fair value of financial instruments, includingderivatives.
Share-Based Compensation
Under Accounting Standards Codification 718 (Compensation—Stock Compensation), theCompany determines the fair value of share awards on the date of grant. Share options are valuedusing the Black-Scholes-Merton valuation model; restricted share awards are valued using theend-of-day share price of Tyco Electronics on the date of grant. That fair value is expensed ratably overthe expected service period, with an allowance made for estimated forfeitures based on historicalemployee activity. See Note 23 for additional information related to the Company’s share-basedcompensation.
Currency Translation
For the Company’s non-U.S. Dollar functional currency subsidiaries, assets and liabilities aretranslated into U.S. Dollars using year-end exchange rates. Sales and expenses are translated at theaverage exchange rates in effect during the year. Foreign currency translation gains and losses areincluded as a component of accumulated other comprehensive income within equity.
Gains and losses resulting from foreign currency transactions, which are included in net income(loss), were $71 million of losses during fiscal 2009 and immaterial amounts in fiscal 2008 and 2007.
Recently Adopted Accounting Pronouncements
In June 2009, the Financial Accounting Standards Board (‘‘FASB’’) issued the AccountingStandards Codification (‘‘ASC’’) to serve as the single source of authoritative GAAP. The Companyadopted the ASC in the fourth quarter of fiscal 2009. Adoption did not have an impact on itsConsolidated and Combined Financial Statements.
In May 2009, the FASB issued guidance in ASC 855 (Subsequent Events). ASC 855 establishesgeneral standards for accounting and disclosure of events occurring subsequent to the balance sheetdate but prior to issuance of the financial statements. The Company adopted ASC 855 in the thirdquarter of fiscal 2009. See Note 26 for the required disclosures related to subsequent events.
In March 2008, the FASB issued updates to guidance in ASC 815 (Derivatives and Hedging),amending and expanding the disclosure requirements related to the use of derivative instruments andhedging activities to provide improved transparency into the uses and financial statement impact ofderivative instruments and hedging activities. The new disclosure provisions of ASC 815 were adoptedby the Company in the second quarter of fiscal 2009. See Note 13 for the required disclosures relatedto derivative instruments and hedging activities.
In March 2007, the FASB issued guidance in ASC 715-60 (Compensation—Retirement Benefits:Defined Benefit Plans—Other Postretirement) related to the accounting for collateral assignment split-dollar life insurance arrangements. The Company adopted the guidance in ASC 715-60 in the firstquarter of fiscal 2009. Accordingly, the Company recognized accrued and other current liabilities of$1 million and other liabilities of $4 million on its Consolidated Balance Sheet at the beginning of thefirst quarter of fiscal 2009 with a corresponding decrease in the opening balance of accumulated deficitof $5 million.
69
TYCO ELECTRONICS LTD.
NOTES TO CONSOLIDATED AND COMBINED FINANCIAL STATEMENTS (Continued)
2. Summary of Significant Accounting Policies (Continued)
In September 2006, the FASB issued guidance in ASC 820 (Fair Value Measurements andDisclosures) that defines fair value, establishes a framework for measuring fair value, expandsdisclosure about fair value measurements, and introduces the fair value option for certain financialassets and liabilities. ASC 820 was adopted by the Company in the first quarter of fiscal 2009. TheCompany did not elect to value any existing assets or liabilities at fair value upon adoption, nor did itapply the fair value option to any eligible assets acquired or liabilities incurred during the quarter. TheCompany will adopt the non-financial asset and liability fair value provisions in fiscal 2010. See Note 16for additional information related to fair value measurements.
In September 2006, the FASB issued guidance in ASC 715 (Compensation—Retirement Benefits)that requires that employers recognize the funded status of defined benefit pension and otherpostretirement benefit plans as a net asset or liability on the balance sheet and recognize as acomponent of other comprehensive income, net of tax, the gains or losses and prior service costs orcredits that arise during the period but are not recognized as a component of net periodic benefit cost.Under ASC 715, companies are required to measure plan assets and benefit obligations as of theirfiscal year end. The Company adopted the presentation requirements of ASC 715 on September 28,2007 and the measurement date provisions in the fourth quarter of fiscal 2009. As a result of thechange in measurement date, the Company recorded a charge of $7 million to accumulated deficit. SeeNote 14 for additional information related to the change in measurement date provisions.
Recently Issued Accounting Pronouncements
In June 2009, the FASB issued updates to guidance in ASC 810 (Consolidation) that addressaccounting for variable interest entities. These updates to ASC 810 are effective for the Company inthe first quarter of fiscal 2011. The Company is currently assessing the impact that adoption will haveon its results of operations, financial position, or cash flows.
In April 2009 and December 2007, the FASB issued guidance in ASC 805 (BusinessCombinations). ASC 805 addresses the recognition and accounting for identifiable assets acquired,liabilities assumed, and noncontrolling interests in business combinations. ASC 805 is effective for theCompany in the first quarter of fiscal 2010. Adoption is not expected to have a material impact on theCompany’s results of operations, financial position, or cash flows.
In December 2008, the FASB issued updates to the guidance in ASC 715 (Compensation—Retirement Benefits) that enhance disclosures regarding assets in defined benefit pension or otherpostretirement plans. The updates to ASC 715 are effective for the Company in the fourth quarter offiscal 2010. The Company is currently assessing the impact that adoption will have on its Consolidatedand Combined Financial Statements.
In December 2007, the FASB issued updates to guidance in ASC 810 (Consolidation) that addressthe accounting and reporting framework for minority interests by a parent company. These updates toASC 810 are effective for the Company in the first quarter of fiscal 2010. Adoption is not expected tohave a material impact on the Company’s results of operations, financial position, or cash flows.
70
TYCO ELECTRONICS LTD.
NOTES TO CONSOLIDATED AND COMBINED FINANCIAL STATEMENTS (Continued)
3. Separation Costs
In connection with the Separation, the Company incurred costs of $44 million in fiscal 2007,primarily related to employee costs, including non-cash compensation expense of $11 million related tothe modification of share option awards at Separation and $12 million related to the acceleration ofrestricted share award vesting as a result of Separation. See Note 23 for further information on theconversion of Tyco International share option awards into Tyco Electronics share option awards.
4. Restructuring and Other Charges, Net
Restructuring and other charges, net consisted of the following during fiscal 2009, 2008, and 2007:
Fiscal
2009 2008 2007
(in millions)
Restructuring and related charges, net . . . . . . . . . . . . . . . . . . . $354 $185 $92Loss on divestiture . . . . . . . . . . . . . . . . . . . . . . . . . . . . . . . . . 7 — —Impairment of long-lived assets . . . . . . . . . . . . . . . . . . . . . . . . 14 34 —
$375 $219 $92
Restructuring and Related Charges, Net
Charges to operations by segment during fiscal 2009, 2008, and 2007 were as follows:
Fiscal
2009 2008 2007
(in millions)
Electronic Components . . . . . . . . . . . . . . . . . . . . . . . . . . . . . . $269 $164 $52Network Solutions . . . . . . . . . . . . . . . . . . . . . . . . . . . . . . . . . . 44 22 36Specialty Products . . . . . . . . . . . . . . . . . . . . . . . . . . . . . . . . . . 31 3 4Undersea Telecommunications . . . . . . . . . . . . . . . . . . . . . . . . . 8 5 5
352 194 97Less: (charges) credits in cost of sales . . . . . . . . . . . . . . . . . . . . 2 (9) (5)
Restructuring and related charges, net . . . . . . . . . . . . . . . . . . . $354 $185 $92
Amounts recognized on the Consolidated and Combined Statements of Operations during fiscal2009, 2008, and 2007 were as follows:
Fiscal
2009 2008 2007
(in millions)
Cash charges . . . . . . . . . . . . . . . . . . . . . . . . . . . . . . . . . . . . . . $317 $147 $74Non-cash charges . . . . . . . . . . . . . . . . . . . . . . . . . . . . . . . . . . 35 47 23
352 194 97Less: (charges) credits in cost of sales . . . . . . . . . . . . . . . . . . . . 2 (9) (5)
Restructuring and related charges, net . . . . . . . . . . . . . . . . . . . $354 $185 $92
71
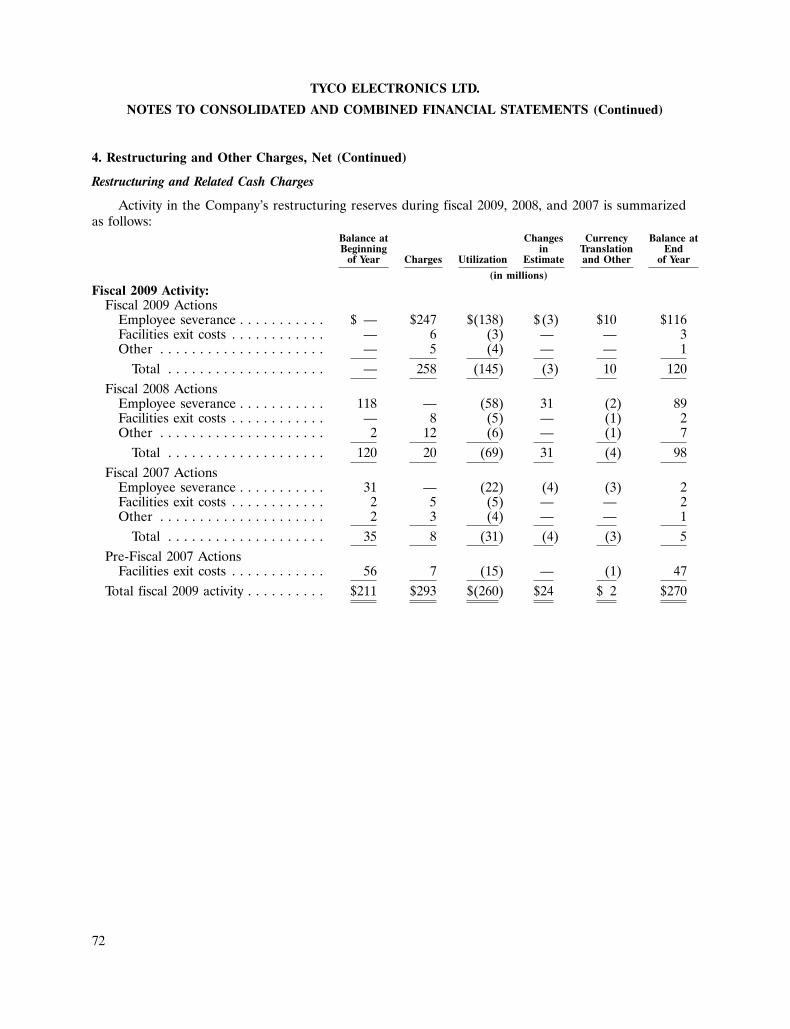
TYCO ELECTRONICS LTD.
NOTES TO CONSOLIDATED AND COMBINED FINANCIAL STATEMENTS (Continued)
4. Restructuring and Other Charges, Net (Continued)
Restructuring and Related Cash Charges
Activity in the Company’s restructuring reserves during fiscal 2009, 2008, and 2007 is summarizedas follows:
Balance at Changes Currency Balance atBeginning in Translation End
of Year Charges Utilization Estimate and Other of Year
(in millions)
Fiscal 2009 Activity:Fiscal 2009 Actions
Employee severance . . . . . . . . . . . $ — $247 $(138) $(3) $10 $116Facilities exit costs . . . . . . . . . . . . — 6 (3) — — 3Other . . . . . . . . . . . . . . . . . . . . . — 5 (4) — — 1
Total . . . . . . . . . . . . . . . . . . . . — 258 (145) (3) 10 120Fiscal 2008 Actions
Employee severance . . . . . . . . . . . 118 — (58) 31 (2) 89Facilities exit costs . . . . . . . . . . . . — 8 (5) — (1) 2Other . . . . . . . . . . . . . . . . . . . . . 2 12 (6) — (1) 7
Total . . . . . . . . . . . . . . . . . . . . 120 20 (69) 31 (4) 98Fiscal 2007 Actions
Employee severance . . . . . . . . . . . 31 — (22) (4) (3) 2Facilities exit costs . . . . . . . . . . . . 2 5 (5) — — 2Other . . . . . . . . . . . . . . . . . . . . . 2 3 (4) — — 1
Total . . . . . . . . . . . . . . . . . . . . 35 8 (31) (4) (3) 5Pre-Fiscal 2007 Actions
Facilities exit costs . . . . . . . . . . . . 56 7 (15) — (1) 47Total fiscal 2009 activity . . . . . . . . . . $211 $293 $(260) $24 $ 2 $270
72

TYCO ELECTRONICS LTD.
NOTES TO CONSOLIDATED AND COMBINED FINANCIAL STATEMENTS (Continued)
4. Restructuring and Other Charges, Net (Continued)
Balance at Changes Currency Balance atBeginning in Translation End
of Year Charges Utilization Estimate and Other of Year
(in millions)
Fiscal 2008 Activity:Fiscal 2008 Actions
Employee severance . . . . . . . . . . . $ — $125 $ (7) $— $— $118Facilities exit costs . . . . . . . . . . . . — 1 (1) — — —Other . . . . . . . . . . . . . . . . . . . . . — 4 (2) — — 2
Total . . . . . . . . . . . . . . . . . . . . — 130 (10) — — 120Fiscal 2007 Actions
Employee severance . . . . . . . . . . . 62 — (39) (1) 9 31Facilities exit costs . . . . . . . . . . . . 1 6 (6) 1 — 2Other . . . . . . . . . . . . . . . . . . . . . 1 6 (5) — — 2
Total . . . . . . . . . . . . . . . . . . . . 64 12 (50) — 9 35Pre-Fiscal 2007 Actions
Facilities exit costs . . . . . . . . . . . . 64 4 (16) 1 3 56Total fiscal 2008 activity . . . . . . . . . . $128 $146 $ (76) $ 1 $12 $211
Fiscal 2007 Activity:Fiscal 2007 Actions
Employee severance . . . . . . . . . . . $ — $ 66 $ (3) $— $(1) $ 62Facilities exit costs . . . . . . . . . . . . — 1 (1) — 1 1Other . . . . . . . . . . . . . . . . . . . . . — 2 (1) — — 1
Total . . . . . . . . . . . . . . . . . . . . — 69 (5) — — 64Pre-Fiscal 2007 Actions
Employee severance . . . . . . . . . . . 2 — (2) — — —Facilities exit costs . . . . . . . . . . . . 66 5 (16) — 9 64
Total . . . . . . . . . . . . . . . . . . . . 68 5 (18) — 9 64Total fiscal 2007 activity . . . . . . . . . . $ 68 $ 74 $ (23) $— $ 9(1) $128
(1) During fiscal 2007, the Printed Circuit Group business was sold and $8 million of restructuring liabilities were retained bythe Company. See Note 5 for additional information regarding the divestiture of the Printed Circuit Group business.
Fiscal 2009 Actions
The Company initiated restructuring programs during fiscal 2009 primarily relating to headcountreductions and manufacturing site closures in the Electronic Components, Network Solutions, andSpecialty Products segments. In connection with these actions, during fiscal 2009, the Companyrecorded restructuring charges of $255 million primarily related to employee severance and benefits.The Company expects to complete all restructuring activities commenced in fiscal 2009 by the end offiscal 2011 and to incur additional charges, primarily in the Electronic Components segment, ofapproximately $20 million relating to these initiated actions by completion.
73
TYCO ELECTRONICS LTD.
NOTES TO CONSOLIDATED AND COMBINED FINANCIAL STATEMENTS (Continued)
4. Restructuring and Other Charges, Net (Continued)
Fiscal 2008 Actions
The Company initiated restructuring programs during fiscal 2008 primarily relating to themigration of product lines to lower-cost countries and the exit of certain manufacturing operations inthe Electronic Components and Network Solutions segments. In connection with these actions, duringfiscal 2009, the Company recorded restructuring charges of $51 million, primarily related to employeeseverance and benefits, including $31 million of changes in estimate primarily associated with the exitof a European manufacturing operation in the Electronic Components segment. During fiscal 2008, theCompany recorded restructuring charges of $130 million, primarily related to employee severance andbenefits. The Company expects to complete all restructuring activities commenced in fiscal 2008 by theend of fiscal 2010 and to incur additional charges, primarily in the Electronic Components segment, ofapproximately $10 million relating to these initiated actions by completion.
Fiscal 2007 Actions
Fiscal 2007 actions included the migration of product lines to lower-cost countries and the exit ofmanufacturing operations in the Electronic Components and Network Solutions segments and therationalization of a product line in the Wireless Systems segment. In connection with these actions,during fiscal 2009, 2008, and 2007, the Company recorded restructuring charges of $4 million,$12 million, and $69 million, respectively, primarily related to employee severance and benefits. As offiscal year end 2009, all actions under these plans are complete.
Pre-Fiscal 2007 Actions
During fiscal 2002, the Company recorded restructuring charges of $779 million primarily relatedto a significant downturn in the telecommunications industry and certain other end markets. Theseactions have been completed. As of fiscal year end 2009, the remaining restructuring reserves related tothe fiscal 2002 actions were $47 million, relating to exited lease facilities. During fiscal 2009, 2008, and2007 the Company recorded restructuring charges of $7 million, $4 million, and $5 million, respectively,for interest accretion on these reserves. The Company expects that its remaining reserves will continueto be paid out over the expected terms of the obligations which range from one to fifteen years.
Restructuring and Related Non-Cash Charges and Credits
During fiscal 2009, the Company recorded non-cash charges of $35 million primarily related to theimpairment of fixed assets in connection with exited manufacturing facilities and product lines.
During fiscal 2008, the Company recorded non-cash charges of $38 million primarily related tofixed assets and intangibles in connection with exited manufacturing facilities and product lines. Also,the Company recorded non-cash charges of $9 million in cost of goods sold for write-downs in carryingvalue of inventory related to exited product lines in fiscal 2008.
During fiscal 2007, the Company recorded non-cash charges of $18 million primarily related tofixed assets in connection with exited manufacturing operations and $5 million in cost of goods sold forwrite-downs in carrying value of inventory related to exited product lines.
74

TYCO ELECTRONICS LTD.
NOTES TO CONSOLIDATED AND COMBINED FINANCIAL STATEMENTS (Continued)
4. Restructuring and Other Charges, Net (Continued)
Total Restructuring Reserves
The Company’s restructuring reserves by segment at fiscal year end 2009 and 2008 were as follows:
Fiscal
2009 2008
(in millions)
Electronic Components . . . . . . . . . . . . . . . . . . . . . . . . . . . . . . . . . . . $186 $121Network Solutions . . . . . . . . . . . . . . . . . . . . . . . . . . . . . . . . . . . . . . 27 33Specialty Products . . . . . . . . . . . . . . . . . . . . . . . . . . . . . . . . . . . . . . . 9 3Undersea Telecommunications . . . . . . . . . . . . . . . . . . . . . . . . . . . . . . 48 54
Restructuring reserves . . . . . . . . . . . . . . . . . . . . . . . . . . . . . . . . . . . . $270 $211
At fiscal year end 2009 and 2008, restructuring reserves were included on the ConsolidatedBalance Sheets as follows:
Fiscal
2009 2008
(in millions)
Accrued and other current liabilities . . . . . . . . . . . . . . . . . . . . . . . . . $231 $131Other liabilities . . . . . . . . . . . . . . . . . . . . . . . . . . . . . . . . . . . . . . . . 39 80
Restructuring reserves . . . . . . . . . . . . . . . . . . . . . . . . . . . . . . . . . . . . $270 $211
Loss on Divestiture
During fiscal 2009, the Company recorded a pre-tax loss on divestiture of $7 million related to thesale of the Battery Systems business. The Battery Systems business, which was part of the ElectronicComponents segment, was sold for net cash proceeds of $14 million after working capital adjustments.The loss is reflected in restructuring and other charges, net on the Consolidated and CombinedStatement of Operations. The Company has presented the loss on sale and the operations of theBattery Systems business in continuing operations due to immateriality.
Impairment of Long-Lived Assets
During fiscal 2009, the Company recorded long-lived asset impairment charges of $14 millionprimarily related to the divestiture of the Dulmison connectors and fittings product line. During fiscal2009, the Company’s board of directors authorized management to pursue the divestiture of theproduct line within the Company’s energy business in the Network Solutions segment. Based on anestimated sales price of $16 million, the Company determined that the carrying value of the productline’s assets and liabilities was in excess of its fair value. An impairment charge of $12 million wasrecorded in fiscal 2009 to write the carrying value of the assets and liabilities down to fair value. Thecharge is presented in restructuring and other charges, net on the Consolidated and CombinedStatement of Operations. The Dulmison connectors and fittings product line generated sales of$53 million in fiscal 2009.
75
TYCO ELECTRONICS LTD.
NOTES TO CONSOLIDATED AND COMBINED FINANCIAL STATEMENTS (Continued)
4. Restructuring and Other Charges, Net (Continued)
During fiscal 2008, the Company’s board of directors authorized management to proceed withstrategic alternatives with respect to the Company’s Battery Systems business. Based on a negotiatedsales price of $30 million, the Company determined that the carrying value of the Battery Systemsbusiness’ assets and liabilities exceeded its fair value. Consequently, a pre-tax impairment charge of$22 million was recorded in fiscal 2008 to write the carrying value of the assets and liabilities down tothe fair value. The charge is presented in restructuring and other charges, net on the Consolidated andCombined Statement of Operations.
During fiscal 2008, the Company determined that the certain North American automotivecustomer-specific product lines in the Electronic Components segment were impaired due to decliningfuture production expectations. The Company determined that an impairment test was necessary due tochanges in the North American automotive industry. These asset groups were assessed forrecoverability and impaired based on estimates of the asset group fair values. Using a discounted cashflows analysis, the Company determined that a pre-tax impairment charge of $12 million was requiredto write the carrying value down to the fair value. The charge is presented in restructuring and othercharges, net on the Consolidated and Combined Statement of Operations.
5. Discontinued Operations
During fiscal 2009, the Company entered into a definitive agreement to sell its Wireless Systemsbusiness. In May 2009, the Company completed the sale for $664 million in net cash proceeds andrecognized a pre-tax gain of $59 million on this transaction.
In September 2008, the Company completed the sale of the Radio Frequency Components andSubsystem business for net cash proceeds of $427 million and recorded a $184 million pre-tax gain onthe sale. In September 2008, the Company also completed the sale of the Automotive Radar Sensorsbusiness for net cash proceeds of $42 million and recorded a $31 million pre-tax gain on the sale. Infiscal 2009, the Company recorded an additional pre-tax gain on sale of $4 million in connection withthe finalization of working capital adjustments relating to the sale of the Radio Frequency Componentsand Subsystem and Automotive Radar Sensors businesses. The total pre-tax gain on the sale of theRadio Frequency Components and Subsystem and Automotive Radar Sensors businesses was$187 million and $32 million, respectively. Also during fiscal 2009, the Company received additionalcash proceeds related to working capital of $29 million in connection with the fiscal 2008 sale of theRadio Frequency Components and Subsystem and Automotive Radar Sensors businesses. TheConsolidated Balance Sheet reflected the $29 million in prepaid expenses and other current assets atSeptember 26, 2008.
The divestiture of the Company’s Power Systems business was authorized during fiscal 2007. As aresult, the Company assessed Power Systems’ assets for impairment and determined that the book valueof the Power Systems business exceeded its estimated fair value. The Company recorded a $585 millionpre-tax impairment charge in fiscal 2007 in income (loss) from discontinued operations, net of incometaxes on the Consolidated and Combined Statement of Operations. In fiscal 2008, the Companycompleted the sale of its Power Systems business for $102 million in net cash proceeds and recorded a$51 million pre-tax gain on the sale.
In fiscal 2007, the Company completed the sale of the Printed Circuit Group business for$227 million in net cash proceeds and recorded a $45 million pre-tax gain on the sale.
76
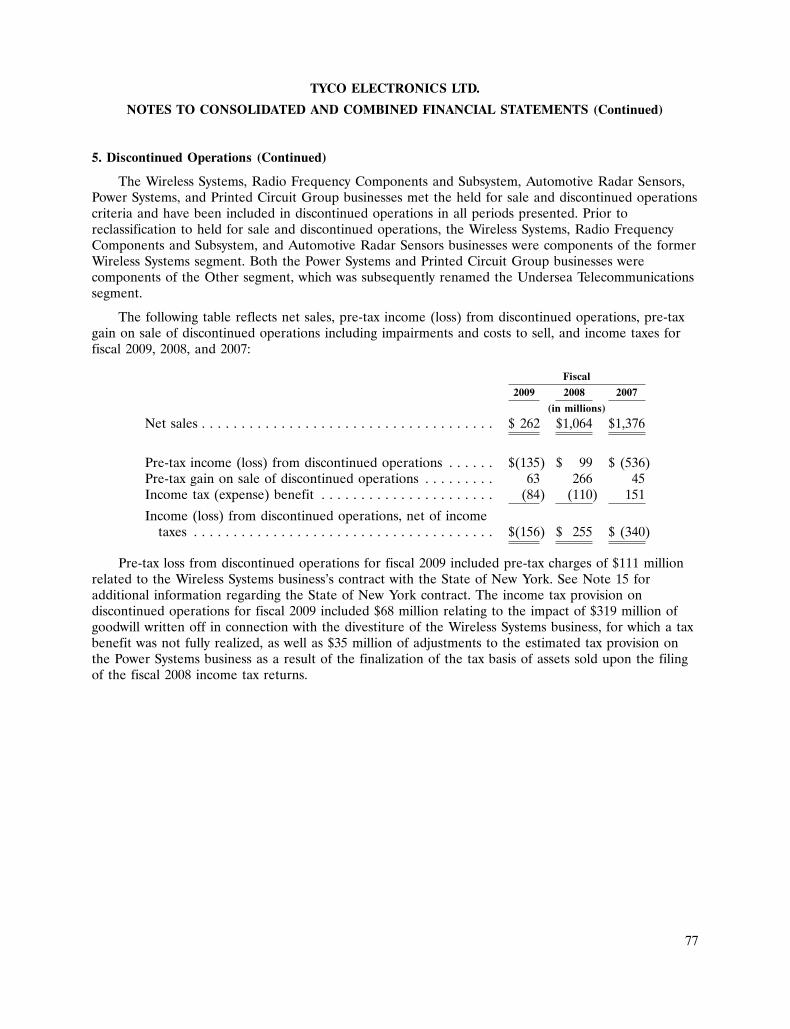
TYCO ELECTRONICS LTD.
NOTES TO CONSOLIDATED AND COMBINED FINANCIAL STATEMENTS (Continued)
5. Discontinued Operations (Continued)
The Wireless Systems, Radio Frequency Components and Subsystem, Automotive Radar Sensors,Power Systems, and Printed Circuit Group businesses met the held for sale and discontinued operationscriteria and have been included in discontinued operations in all periods presented. Prior toreclassification to held for sale and discontinued operations, the Wireless Systems, Radio FrequencyComponents and Subsystem, and Automotive Radar Sensors businesses were components of the formerWireless Systems segment. Both the Power Systems and Printed Circuit Group businesses werecomponents of the Other segment, which was subsequently renamed the Undersea Telecommunicationssegment.
The following table reflects net sales, pre-tax income (loss) from discontinued operations, pre-taxgain on sale of discontinued operations including impairments and costs to sell, and income taxes forfiscal 2009, 2008, and 2007:
Fiscal
2009 2008 2007
(in millions)
Net sales . . . . . . . . . . . . . . . . . . . . . . . . . . . . . . . . . . . . . $ 262 $1,064 $1,376
Pre-tax income (loss) from discontinued operations . . . . . . $(135) $ 99 $ (536)Pre-tax gain on sale of discontinued operations . . . . . . . . . 63 266 45Income tax (expense) benefit . . . . . . . . . . . . . . . . . . . . . . (84) (110) 151
Income (loss) from discontinued operations, net of incometaxes . . . . . . . . . . . . . . . . . . . . . . . . . . . . . . . . . . . . . . $(156) $ 255 $ (340)
Pre-tax loss from discontinued operations for fiscal 2009 included pre-tax charges of $111 millionrelated to the Wireless Systems business’s contract with the State of New York. See Note 15 foradditional information regarding the State of New York contract. The income tax provision ondiscontinued operations for fiscal 2009 included $68 million relating to the impact of $319 million ofgoodwill written off in connection with the divestiture of the Wireless Systems business, for which a taxbenefit was not fully realized, as well as $35 million of adjustments to the estimated tax provision onthe Power Systems business as a result of the finalization of the tax basis of assets sold upon the filingof the fiscal 2008 income tax returns.
77

TYCO ELECTRONICS LTD.
NOTES TO CONSOLIDATED AND COMBINED FINANCIAL STATEMENTS (Continued)
5. Discontinued Operations (Continued)
The following table presents balance sheet information for assets and liabilities held for sale atfiscal year end 2008; there were no such amounts at fiscal year end 2009:
Fiscal 2008
(in millions)
Accounts receivable, net . . . . . . . . . . . . . . . . . . . . . . . . . . . . . . . . . . . $ 70Inventories . . . . . . . . . . . . . . . . . . . . . . . . . . . . . . . . . . . . . . . . . . . . . 153Property, plant, and equipment, net . . . . . . . . . . . . . . . . . . . . . . . . . . . 175Goodwill . . . . . . . . . . . . . . . . . . . . . . . . . . . . . . . . . . . . . . . . . . . . . . . 319Intangible assets, net . . . . . . . . . . . . . . . . . . . . . . . . . . . . . . . . . . . . . . 32Other assets . . . . . . . . . . . . . . . . . . . . . . . . . . . . . . . . . . . . . . . . . . . . 21
Total assets . . . . . . . . . . . . . . . . . . . . . . . . . . . . . . . . . . . . . . . . . . . $ 770
Accounts payable . . . . . . . . . . . . . . . . . . . . . . . . . . . . . . . . . . . . . . . . $ 36Accrued and other current liabilities . . . . . . . . . . . . . . . . . . . . . . . . . . . 38Deferred revenue . . . . . . . . . . . . . . . . . . . . . . . . . . . . . . . . . . . . . . . . 40Other liabilities . . . . . . . . . . . . . . . . . . . . . . . . . . . . . . . . . . . . . . . . . . 55
Total liabilities . . . . . . . . . . . . . . . . . . . . . . . . . . . . . . . . . . . . . . . . . $ 169
6. Inventories
At fiscal year end 2009 and 2008, inventories consisted of the following:
Fiscal
2009 2008
(in millions)
Raw materials . . . . . . . . . . . . . . . . . . . . . . . . . . . . . . . . . $ 253 $ 410Work in progress . . . . . . . . . . . . . . . . . . . . . . . . . . . . . . . 439 670Finished goods . . . . . . . . . . . . . . . . . . . . . . . . . . . . . . . . . 624 964Inventoried costs on long-term contracts . . . . . . . . . . . . . . 119 115
Inventories . . . . . . . . . . . . . . . . . . . . . . . . . . . . . . . . . . . . $ 1,435 $ 2,159
7. Property, Plant, and Equipment, Net
At fiscal year end 2009 and 2008, net property, plant, and equipment consisted of the following:
Fiscal
2009 2008
(in millions)
Land and improvements . . . . . . . . . . . . . . . . . . . . . . . . . . $ 259 $ 252Buildings and leasehold improvements . . . . . . . . . . . . . . . . 1,342 1,338Machinery and equipment . . . . . . . . . . . . . . . . . . . . . . . . . 6,600 6,477Construction in process . . . . . . . . . . . . . . . . . . . . . . . . . . . 373 481
Gross property, plant, and equipment . . . . . . . . . . . . . . . . 8,574 8,548Accumulated depreciation . . . . . . . . . . . . . . . . . . . . . . . . . (5,463) (5,206)
Property, plant, and equipment, net . . . . . . . . . . . . . . . . . . $ 3,111 $ 3,342
78
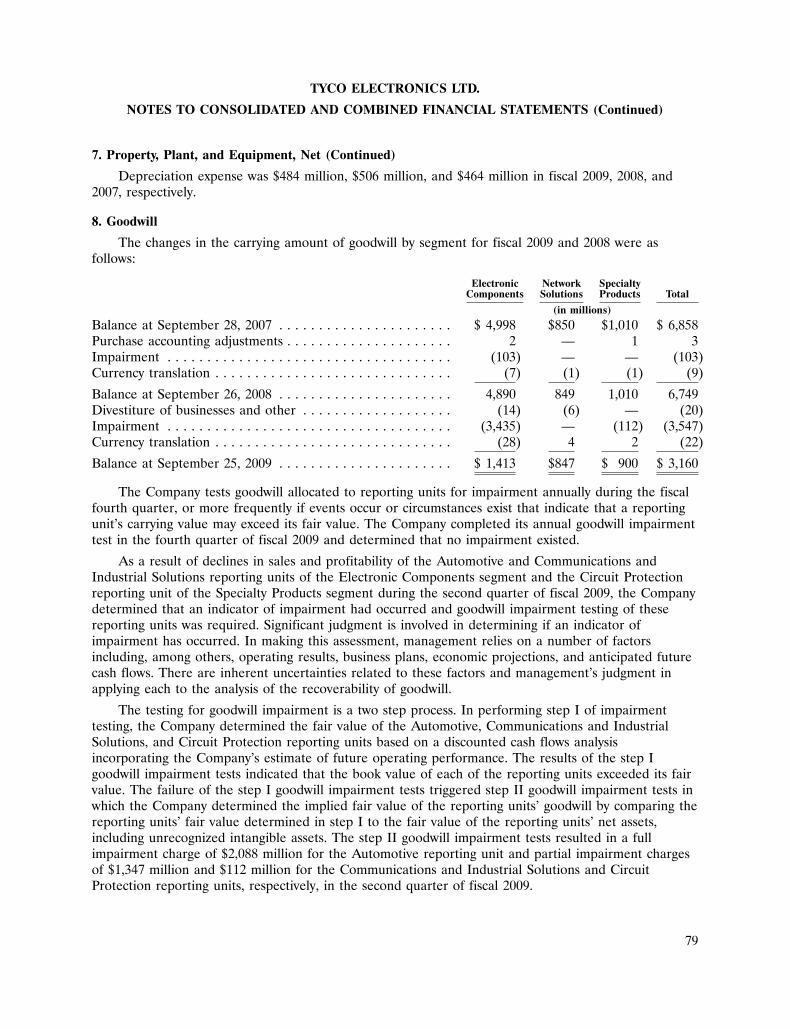
TYCO ELECTRONICS LTD.
NOTES TO CONSOLIDATED AND COMBINED FINANCIAL STATEMENTS (Continued)
7. Property, Plant, and Equipment, Net (Continued)
Depreciation expense was $484 million, $506 million, and $464 million in fiscal 2009, 2008, and2007, respectively.
8. Goodwill
The changes in the carrying amount of goodwill by segment for fiscal 2009 and 2008 were asfollows:
Electronic Network SpecialtyComponents Solutions Products Total
(in millions)
Balance at September 28, 2007 . . . . . . . . . . . . . . . . . . . . . . $ 4,998 $850 $1,010 $ 6,858Purchase accounting adjustments . . . . . . . . . . . . . . . . . . . . . 2 — 1 3Impairment . . . . . . . . . . . . . . . . . . . . . . . . . . . . . . . . . . . . (103) — — (103)Currency translation . . . . . . . . . . . . . . . . . . . . . . . . . . . . . . (7) (1) (1) (9)
Balance at September 26, 2008 . . . . . . . . . . . . . . . . . . . . . . 4,890 849 1,010 6,749Divestiture of businesses and other . . . . . . . . . . . . . . . . . . . (14) (6) — (20)Impairment . . . . . . . . . . . . . . . . . . . . . . . . . . . . . . . . . . . . (3,435) — (112) (3,547)Currency translation . . . . . . . . . . . . . . . . . . . . . . . . . . . . . . (28) 4 2 (22)
Balance at September 25, 2009 . . . . . . . . . . . . . . . . . . . . . . $ 1,413 $847 $ 900 $ 3,160
The Company tests goodwill allocated to reporting units for impairment annually during the fiscalfourth quarter, or more frequently if events occur or circumstances exist that indicate that a reportingunit’s carrying value may exceed its fair value. The Company completed its annual goodwill impairmenttest in the fourth quarter of fiscal 2009 and determined that no impairment existed.
As a result of declines in sales and profitability of the Automotive and Communications andIndustrial Solutions reporting units of the Electronic Components segment and the Circuit Protectionreporting unit of the Specialty Products segment during the second quarter of fiscal 2009, the Companydetermined that an indicator of impairment had occurred and goodwill impairment testing of thesereporting units was required. Significant judgment is involved in determining if an indicator ofimpairment has occurred. In making this assessment, management relies on a number of factorsincluding, among others, operating results, business plans, economic projections, and anticipated futurecash flows. There are inherent uncertainties related to these factors and management’s judgment inapplying each to the analysis of the recoverability of goodwill.
The testing for goodwill impairment is a two step process. In performing step I of impairmenttesting, the Company determined the fair value of the Automotive, Communications and IndustrialSolutions, and Circuit Protection reporting units based on a discounted cash flows analysisincorporating the Company’s estimate of future operating performance. The results of the step Igoodwill impairment tests indicated that the book value of each of the reporting units exceeded its fairvalue. The failure of the step I goodwill impairment tests triggered step II goodwill impairment tests inwhich the Company determined the implied fair value of the reporting units’ goodwill by comparing thereporting units’ fair value determined in step I to the fair value of the reporting units’ net assets,including unrecognized intangible assets. The step II goodwill impairment tests resulted in a fullimpairment charge of $2,088 million for the Automotive reporting unit and partial impairment chargesof $1,347 million and $112 million for the Communications and Industrial Solutions and CircuitProtection reporting units, respectively, in the second quarter of fiscal 2009.
79
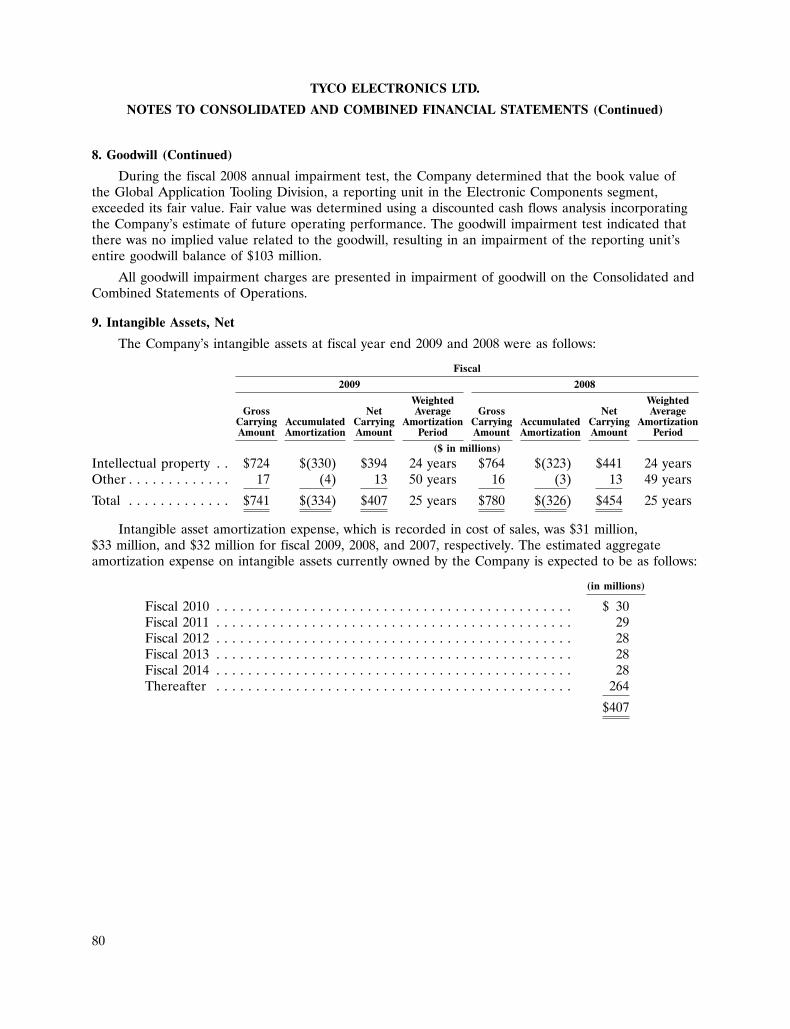
TYCO ELECTRONICS LTD.
NOTES TO CONSOLIDATED AND COMBINED FINANCIAL STATEMENTS (Continued)
8. Goodwill (Continued)
During the fiscal 2008 annual impairment test, the Company determined that the book value ofthe Global Application Tooling Division, a reporting unit in the Electronic Components segment,exceeded its fair value. Fair value was determined using a discounted cash flows analysis incorporatingthe Company’s estimate of future operating performance. The goodwill impairment test indicated thatthere was no implied value related to the goodwill, resulting in an impairment of the reporting unit’sentire goodwill balance of $103 million.
All goodwill impairment charges are presented in impairment of goodwill on the Consolidated andCombined Statements of Operations.
9. Intangible Assets, Net
The Company’s intangible assets at fiscal year end 2009 and 2008 were as follows:
Fiscal
2009 2008
Weighted WeightedGross Net Average Gross Net Average
Carrying Accumulated Carrying Amortization Carrying Accumulated Carrying AmortizationAmount Amortization Amount Period Amount Amortization Amount Period
($ in millions)
Intellectual property . . $724 $(330) $394 24 years $764 $(323) $441 24 yearsOther . . . . . . . . . . . . . 17 (4) 13 50 years 16 (3) 13 49 years
Total . . . . . . . . . . . . . $741 $(334) $407 25 years $780 $(326) $454 25 years
Intangible asset amortization expense, which is recorded in cost of sales, was $31 million,$33 million, and $32 million for fiscal 2009, 2008, and 2007, respectively. The estimated aggregateamortization expense on intangible assets currently owned by the Company is expected to be as follows:
(in millions)
Fiscal 2010 . . . . . . . . . . . . . . . . . . . . . . . . . . . . . . . . . . . . . . . . . . . . . $ 30Fiscal 2011 . . . . . . . . . . . . . . . . . . . . . . . . . . . . . . . . . . . . . . . . . . . . . 29Fiscal 2012 . . . . . . . . . . . . . . . . . . . . . . . . . . . . . . . . . . . . . . . . . . . . . 28Fiscal 2013 . . . . . . . . . . . . . . . . . . . . . . . . . . . . . . . . . . . . . . . . . . . . . 28Fiscal 2014 . . . . . . . . . . . . . . . . . . . . . . . . . . . . . . . . . . . . . . . . . . . . . 28Thereafter . . . . . . . . . . . . . . . . . . . . . . . . . . . . . . . . . . . . . . . . . . . . . 264
$407
80
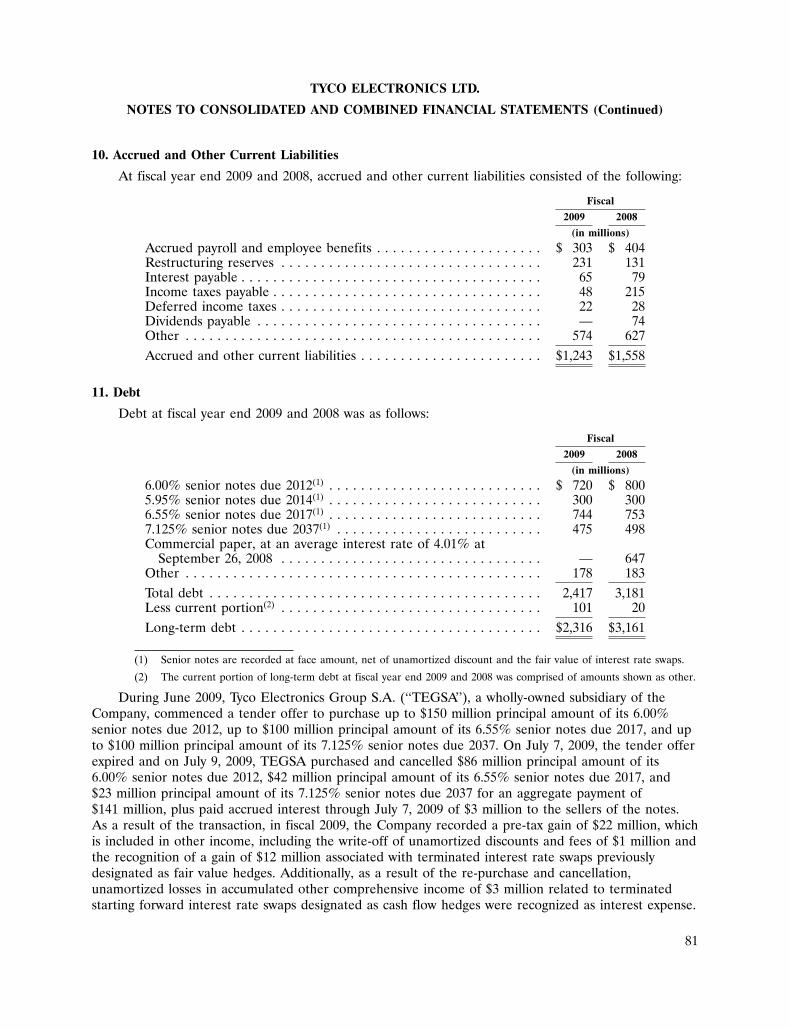
TYCO ELECTRONICS LTD.
NOTES TO CONSOLIDATED AND COMBINED FINANCIAL STATEMENTS (Continued)
10. Accrued and Other Current Liabilities
At fiscal year end 2009 and 2008, accrued and other current liabilities consisted of the following:
Fiscal
2009 2008
(in millions)
Accrued payroll and employee benefits . . . . . . . . . . . . . . . . . . . . . $ 303 $ 404Restructuring reserves . . . . . . . . . . . . . . . . . . . . . . . . . . . . . . . . . 231 131Interest payable . . . . . . . . . . . . . . . . . . . . . . . . . . . . . . . . . . . . . . 65 79Income taxes payable . . . . . . . . . . . . . . . . . . . . . . . . . . . . . . . . . . 48 215Deferred income taxes . . . . . . . . . . . . . . . . . . . . . . . . . . . . . . . . . 22 28Dividends payable . . . . . . . . . . . . . . . . . . . . . . . . . . . . . . . . . . . . — 74Other . . . . . . . . . . . . . . . . . . . . . . . . . . . . . . . . . . . . . . . . . . . . . 574 627Accrued and other current liabilities . . . . . . . . . . . . . . . . . . . . . . . $1,243 $1,558
11. Debt
Debt at fiscal year end 2009 and 2008 was as follows:
Fiscal
2009 2008
(in millions)
6.00% senior notes due 2012(1) . . . . . . . . . . . . . . . . . . . . . . . . . . . $ 720 $ 8005.95% senior notes due 2014(1) . . . . . . . . . . . . . . . . . . . . . . . . . . . 300 3006.55% senior notes due 2017(1) . . . . . . . . . . . . . . . . . . . . . . . . . . . 744 7537.125% senior notes due 2037(1) . . . . . . . . . . . . . . . . . . . . . . . . . . 475 498Commercial paper, at an average interest rate of 4.01% at
September 26, 2008 . . . . . . . . . . . . . . . . . . . . . . . . . . . . . . . . . — 647Other . . . . . . . . . . . . . . . . . . . . . . . . . . . . . . . . . . . . . . . . . . . . . 178 183Total debt . . . . . . . . . . . . . . . . . . . . . . . . . . . . . . . . . . . . . . . . . . 2,417 3,181Less current portion(2) . . . . . . . . . . . . . . . . . . . . . . . . . . . . . . . . . 101 20Long-term debt . . . . . . . . . . . . . . . . . . . . . . . . . . . . . . . . . . . . . . $2,316 $3,161
(1) Senior notes are recorded at face amount, net of unamortized discount and the fair value of interest rate swaps.
(2) The current portion of long-term debt at fiscal year end 2009 and 2008 was comprised of amounts shown as other.
During June 2009, Tyco Electronics Group S.A. (‘‘TEGSA’’), a wholly-owned subsidiary of theCompany, commenced a tender offer to purchase up to $150 million principal amount of its 6.00%senior notes due 2012, up to $100 million principal amount of its 6.55% senior notes due 2017, and upto $100 million principal amount of its 7.125% senior notes due 2037. On July 7, 2009, the tender offerexpired and on July 9, 2009, TEGSA purchased and cancelled $86 million principal amount of its6.00% senior notes due 2012, $42 million principal amount of its 6.55% senior notes due 2017, and$23 million principal amount of its 7.125% senior notes due 2037 for an aggregate payment of$141 million, plus paid accrued interest through July 7, 2009 of $3 million to the sellers of the notes.As a result of the transaction, in fiscal 2009, the Company recorded a pre-tax gain of $22 million, whichis included in other income, including the write-off of unamortized discounts and fees of $1 million andthe recognition of a gain of $12 million associated with terminated interest rate swaps previouslydesignated as fair value hedges. Additionally, as a result of the re-purchase and cancellation,unamortized losses in accumulated other comprehensive income of $3 million related to terminatedstarting forward interest rate swaps designated as cash flow hedges were recognized as interest expense.
81
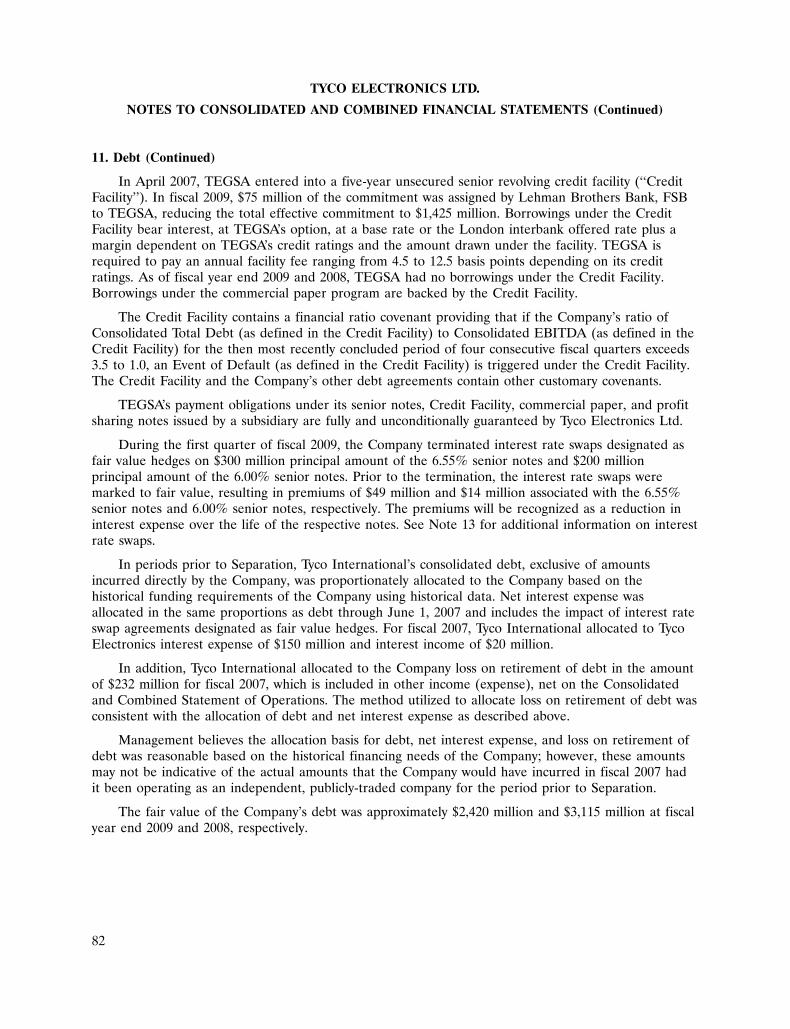
TYCO ELECTRONICS LTD.
NOTES TO CONSOLIDATED AND COMBINED FINANCIAL STATEMENTS (Continued)
11. Debt (Continued)
In April 2007, TEGSA entered into a five-year unsecured senior revolving credit facility (‘‘CreditFacility’’). In fiscal 2009, $75 million of the commitment was assigned by Lehman Brothers Bank, FSBto TEGSA, reducing the total effective commitment to $1,425 million. Borrowings under the CreditFacility bear interest, at TEGSA’s option, at a base rate or the London interbank offered rate plus amargin dependent on TEGSA’s credit ratings and the amount drawn under the facility. TEGSA isrequired to pay an annual facility fee ranging from 4.5 to 12.5 basis points depending on its creditratings. As of fiscal year end 2009 and 2008, TEGSA had no borrowings under the Credit Facility.Borrowings under the commercial paper program are backed by the Credit Facility.
The Credit Facility contains a financial ratio covenant providing that if the Company’s ratio ofConsolidated Total Debt (as defined in the Credit Facility) to Consolidated EBITDA (as defined in theCredit Facility) for the then most recently concluded period of four consecutive fiscal quarters exceeds3.5 to 1.0, an Event of Default (as defined in the Credit Facility) is triggered under the Credit Facility.The Credit Facility and the Company’s other debt agreements contain other customary covenants.
TEGSA’s payment obligations under its senior notes, Credit Facility, commercial paper, and profitsharing notes issued by a subsidiary are fully and unconditionally guaranteed by Tyco Electronics Ltd.
During the first quarter of fiscal 2009, the Company terminated interest rate swaps designated asfair value hedges on $300 million principal amount of the 6.55% senior notes and $200 millionprincipal amount of the 6.00% senior notes. Prior to the termination, the interest rate swaps weremarked to fair value, resulting in premiums of $49 million and $14 million associated with the 6.55%senior notes and 6.00% senior notes, respectively. The premiums will be recognized as a reduction ininterest expense over the life of the respective notes. See Note 13 for additional information on interestrate swaps.
In periods prior to Separation, Tyco International’s consolidated debt, exclusive of amountsincurred directly by the Company, was proportionately allocated to the Company based on thehistorical funding requirements of the Company using historical data. Net interest expense wasallocated in the same proportions as debt through June 1, 2007 and includes the impact of interest rateswap agreements designated as fair value hedges. For fiscal 2007, Tyco International allocated to TycoElectronics interest expense of $150 million and interest income of $20 million.
In addition, Tyco International allocated to the Company loss on retirement of debt in the amountof $232 million for fiscal 2007, which is included in other income (expense), net on the Consolidatedand Combined Statement of Operations. The method utilized to allocate loss on retirement of debt wasconsistent with the allocation of debt and net interest expense as described above.
Management believes the allocation basis for debt, net interest expense, and loss on retirement ofdebt was reasonable based on the historical financing needs of the Company; however, these amountsmay not be indicative of the actual amounts that the Company would have incurred in fiscal 2007 hadit been operating as an independent, publicly-traded company for the period prior to Separation.
The fair value of the Company’s debt was approximately $2,420 million and $3,115 million at fiscalyear end 2009 and 2008, respectively.
82
TYCO ELECTRONICS LTD.
NOTES TO CONSOLIDATED AND COMBINED FINANCIAL STATEMENTS (Continued)
11. Debt (Continued)
The aggregate amounts of total debt maturing during the next five years and thereafter are asfollows:
(in millions)
Fiscal 2010 . . . . . . . . . . . . . . . . . . . . . . . . . . . . . . . . . . . . . . . . . . . . . $ 101Fiscal 2011 . . . . . . . . . . . . . . . . . . . . . . . . . . . . . . . . . . . . . . . . . . . . . 7Fiscal 2012 . . . . . . . . . . . . . . . . . . . . . . . . . . . . . . . . . . . . . . . . . . . . . 1Fiscal 2013 . . . . . . . . . . . . . . . . . . . . . . . . . . . . . . . . . . . . . . . . . . . . . 786Fiscal 2014 . . . . . . . . . . . . . . . . . . . . . . . . . . . . . . . . . . . . . . . . . . . . . 301Thereafter . . . . . . . . . . . . . . . . . . . . . . . . . . . . . . . . . . . . . . . . . . . . . 1,221
Total . . . . . . . . . . . . . . . . . . . . . . . . . . . . . . . . . . . . . . . . . . . . . . . . . . $2,417
12. Guarantees
Separation and Distribution Agreement
Upon Separation, the Company entered into a Separation and Distribution Agreement and otheragreements with Tyco International and Covidien to effect the Separation and provide a framework forthe Company’s relationships with Tyco International and Covidien after the distribution of theCompany’s and Covidien’s shares to Tyco International’s shareholders. These agreements govern therelationships among Tyco International, Covidien, and the Company subsequent to the Separation andprovide for the allocation to the Company and Covidien of certain of Tyco International’s assets,liabilities, and obligations attributable to periods prior to the Separation.
Under the Separation and Distribution Agreement and other agreements, subject to certainexceptions contained in the Tax Sharing Agreement, the Company, Covidien, and Tyco Internationalassumed 31%, 42%, and 27%, respectively, of certain of Tyco International’s contingent and othercorporate liabilities. All costs and expenses associated with the management of these contingent andother corporate liabilities are shared equally among the parties. These contingent and other corporateliabilities primarily relate to consolidated securities litigation and any actions with respect to theSeparation or the Distribution brought by any third party. If any party responsible for such liabilitieswere to default in its payment, when due, of any of these assumed obligations, each non-defaultingparty would be required to pay equally with any other non-defaulting party the amounts in default.Accordingly, under certain circumstances, Tyco Electronics may be obligated to pay amounts in excessof its agreed-upon share of the assumed obligations related to such contingent and other corporateliabilities, including associated costs and expenses.
Tax Sharing Agreement
Upon Separation, the Company entered into a Tax Sharing Agreement, under which the Companyshares responsibility for certain of its, Tyco International’s, and Covidien’s income tax liabilities basedon a sharing formula for periods prior to and including June 29, 2007. The Company, Covidien, andTyco International share 31%, 42%, and 27%, respectively, of U.S. income tax liabilities that arise fromadjustments made by tax authorities to its, Tyco International’s, and Covidien’s U.S. income tax returns.The effect of the Tax Sharing Agreement is to indemnify the Company for 69% of certain liabilitiessettled in cash by the Company with respect to unresolved pre-Separation tax matters. Pursuant to that
83
TYCO ELECTRONICS LTD.
NOTES TO CONSOLIDATED AND COMBINED FINANCIAL STATEMENTS (Continued)
12. Guarantees (Continued)
indemnification, the Company has made similar indemnifications to Tyco International and Covidienwith respect to 31% of certain liabilities settled in cash by the companies relating to unresolvedpre-Separation tax matters. All costs and expenses associated with the management of these shared taxliabilities are shared equally among the parties. The Company is responsible for all of its own taxes thatare not shared pursuant to the Tax Sharing Agreement’s sharing formula. In addition, TycoInternational and Covidien are responsible for their tax liabilities that are not subject to the TaxSharing Agreement’s sharing formula.
All of the tax liabilities of Tyco International that were associated with Tyco Internationalsubsidiaries that are included in Tyco Electronics following the Separation became Tyco Electronics’ taxliabilities upon Separation. Although Tyco Electronics has agreed to share certain tax liabilities withTyco International and Covidien pursuant to the Tax Sharing Agreement, Tyco Electronics remainsprimarily liable for all of these liabilities. If Tyco International and Covidien default on their obligationsto Tyco Electronics under the Tax Sharing Agreement, Tyco Electronics would be liable for the entireamount of these liabilities.
If any party to the Tax Sharing Agreement were to default in its obligation to another party to payits share of the distribution taxes that arise as a result of no party’s fault, each non-defaulting partywould be required to pay, equally with any other non-defaulting party, the amounts in default. Inaddition, if another party to the Tax Sharing Agreement that is responsible for all or a portion of anincome tax liability were to default in its payment of such liability to a taxing authority, the Companycould be legally liable under applicable tax law for such liabilities and required to make additional taxpayments. Accordingly, under certain circumstances, the Company may be obligated to pay amounts inexcess of its agreed upon share of its, Tyco International’s, and Covidien’s tax liabilities.
Indemnification
The Company’s indemnification created under the Tax Sharing Agreement qualifies as a guaranteeof a third party entity’s debt under ASC 460 (Guarantees). ASC 460 addresses the measurement anddisclosure of a guarantor’s obligation to pay a debt incurred by a third party. To value the initialguarantee obligation, the Company considered a range of probability-weighted future cash flows thatrepresented the likelihood of payment of each class of liability by each of the three post-Separationcompanies. The expected cash flows incorporated interest and penalties that the companies believedwould be incurred on each class of liabilities and were discounted to the present value to reflect thevalue associated with each at Separation. The calculation of the guarantee liability also included apremium that reflected the cost for an insurance carrier to stand in and assume the payment obligationat the Separation date.
At inception of the guarantee, based on the probability-weighted future cash flows related tounresolved tax matters, the Company, under the Tax Sharing Agreement, faced a maximum potentialliability of $3 billion, based on undiscounted estimates and interest and penalties used to determine thefair value of the guarantee and an assumption of 100% default on the parts of Tyco International andCovidien, a likelihood that management believes to be remote. In the event that the Company isrequired, due to bankruptcy or other business interruption on the part of Tyco International orCovidien, to pay more than the contractually determined 31%, the Company retains the right to seekpayment from the effected entity.
84
TYCO ELECTRONICS LTD.
NOTES TO CONSOLIDATED AND COMBINED FINANCIAL STATEMENTS (Continued)
12. Guarantees (Continued)
At September 28, 2007, the probability-weighted cash flows and risk premium of certain unresolvedpre-Separation tax matters for which the Company has made indemnifications to Tyco International andCovidien resulted in a fair value of the liability of $296 million, which was reflected as an adjustment tocontributed surplus on the Consolidated Balance Sheet. During fiscal 2008, the Company, whileassessing its income tax positions under the uncertain tax position provisions of ASC 740, decreasedthis liability by $14 million and recorded the adjustment to other income on the Consolidated andCombined Statement of Operations. Also, in fiscal 2008, this liability was increased by $57 million as aresult of the completion by Tyco International of certain proposed tax adjustments to U.S. federalincome tax returns. (See Note 15 for additional information regarding the proposed tax adjustments.)As of September 25, 2009, the total liability of $339 million was recorded in other liabilities on theConsolidated Balance Sheet. The Company has assessed the probable future cash payments to TycoInternational and Covidien for pre-Separation income tax matters pursuant to the terms of the TaxSharing Agreement and determined this amount remains sufficient to satisfy these expected obligations.
Other Matters
In disposing of assets or businesses, the Company often provides representations, warranties,and/or indemnities to cover various risks including unknown damage to the assets, environmental risksinvolved in the sale of real estate, liability for investigation and remediation of environmentalcontamination at waste disposal sites and manufacturing facilities, and unidentified tax liabilities andlegal fees related to periods prior to disposition. The Company does not have the ability to estimatethe potential liability from such indemnities because they relate to unknown conditions; however, theCompany has no reason to believe that these uncertainties would have a material adverse effect on theCompany’s results of operations, financial position, or cash flows.
At September 25, 2009, the Company had outstanding letters of credit and letters of guarantee inthe amount of $395 million, of which $50 million was related to its contract with the State of NewYork. See Note 15 for additional information regarding the State of New York contract.
In the normal course of business, the Company is liable for contract completion and productperformance. In the opinion of management, except for the charges related to the contract with theState of New York discussed below, such obligations will not significantly affect the Company’s resultsof operations, financial position, or cash flows.
As disclosed in Note 15, in January 2009, the State of New York (the ‘‘State’’) drew down$50 million against an irrevocable standby letter of credit funded by the Company. As a result, theCompany recorded a pre-tax charge equal to the draw. The State has the ability to draw up to anadditional $50 million against the standby letter of credit which could result in additional charges andcould have a material adverse effect on the Company’s results of operations, financial position, andcash flows.
85
TYCO ELECTRONICS LTD.
NOTES TO CONSOLIDATED AND COMBINED FINANCIAL STATEMENTS (Continued)
12. Guarantees (Continued)
The Company generally records estimated product warranty costs at the time of sale. The changesin the Company’s warranty liability for fiscal 2009 and 2008 were as follows:
Fiscal
2009 2008
(in millions)
Balance at beginning of fiscal year . . . . . . . . . . . . . . . . . . . . . . . . . . . . $27 $20Warranties issued during the fiscal year . . . . . . . . . . . . . . . . . . . . . . . . 18 6Warranty expirations and changes in estimate . . . . . . . . . . . . . . . . . . . . 1 3Settlements . . . . . . . . . . . . . . . . . . . . . . . . . . . . . . . . . . . . . . . . . . . . . (3) (2)
Balance at end of fiscal year . . . . . . . . . . . . . . . . . . . . . . . . . . . . . . . . $43 $27
13. Financial Instruments
The Company’s financial instruments consist primarily of cash and cash equivalents, accountsreceivable, accounts payable, debt, and derivative financial instruments. The fair value of cash and cashequivalents, accounts receivable, and accounts payable approximated book value as of September 25,2009 and September 26, 2008. See Note 11 for additional information on the fair value of debt andNote 16 for additional information on fair value measurements.
The Company uses derivative and non-derivative financial instruments to manage certain exposuresto foreign currency, interest rate, and commodity risks.
The Company accounts for derivative financial instrument contracts on its Consolidated BalanceSheets at fair value. For instruments not designated as hedges under ASC 815 (Derivatives andHedging), the changes in the instruments’ fair value are recognized as selling, general, andadministrative expenses on the Consolidated and Combined Statements of Operations. For instrumentsdesignated as cash flow hedges, the effective portion of changes in the fair value of a derivative isrecorded in other comprehensive income and reclassified into earnings in the same period or periodsduring which the underlying hedged item affects earnings. Ineffective portions of a cash flow hedge arerecognized currently, based on the nature of the ineffectiveness, in cost of sales or selling, general, andadministrative expenses on the Consolidated and Combined Statements of Operations. Changes in thefair value of derivative instruments designated as fair value hedges affect the carrying value of the assetor liability hedged, with changes in both the derivative instrument and the hedged asset or liabilitybeing recognized in earnings.
To the extent that Tyco International entered into hedges on behalf of the Company prior toSeparation, the statement of operations effects of those hedges have been allocated to the Company aspart of the Tyco International general corporate overhead expense allocation or interest expenseallocation as appropriate. See Note 17 for additional information regarding allocated expenses.
The cash flows related to derivative financial instruments are reported in the operating activitiessection of the Consolidated and Combined Statements of Cash Flows.
The Company’s derivative financial instruments present certain market and counterparty risks;however, concentration of counterparty risk is mitigated as the Company deals with a variety offinancial institutions worldwide with long-term Standard & Poor’s, Moody’s, and/or Fitch credit ratings
86
TYCO ELECTRONICS LTD.
NOTES TO CONSOLIDATED AND COMBINED FINANCIAL STATEMENTS (Continued)
13. Financial Instruments (Continued)
of A/A2 or higher. In addition, only conventional derivative financial instruments are utilized. TheCompany is exposed to potential losses if a counterparty fails to perform according to the terms of itsagreement. With respect to counterparty net asset positions recognized at September 25, 2009, theCompany has assessed the likelihood of counterparty default as remote. At this time, the Company isnot required, nor does it require, collateral or other security to be furnished by the counterparties to itsderivative financial instruments.
Foreign Exchange Risks
As part of managing the exposure to changes in foreign currency exchange rates, the Companyutilizes foreign exchange forward and swap contracts, a portion of which are designated as cash flowhedges pursuant to ASC 815-30 (Derivatives and Hedging: Cash Flow Hedges). The objective of thesecontracts is to minimize impacts to cash flows and profitability due to changes in foreign currencyexchange rates on intercompany transactions, accounts receivable, accounts payable, and other cashtransactions.
At September 25, 2009 and September 26, 2008, the Company had net liabilities of $1 million and$5 million, respectively, on the Consolidated Balance Sheets related to foreign exchange instruments.The Company expects that significantly all of the balance in accumulated other comprehensive incomeassociated with the cash flow hedge-designated instruments will be reclassified into the Consolidatedand Combined Statements of Operations within the next twelve months as adjustments to cost of sales.
Interest Rate Risk Management
The Company issues debt, from time to time, in capital and money markets to fund its operations.Such borrowings can result in interest rate exposure. To manage the interest rate exposure and tominimize overall interest cost, the Company has used, and may use in the future, interest rate swaps toconvert a portion of fixed-rate debt into variable-rate debt (fair value hedges) and/or convert a portionof variable-rate debt into fixed-rate debt (cash flow hedges).
During the first quarter of fiscal 2009, the Company terminated interest rate swaps designated asfair value hedges on $300 million principal amount of the 6.55% senior notes and $200 millionprincipal amount of the 6.00% senior notes. Prior to the termination, the interest rate swaps weremarked to fair value, resulting in premiums of $49 million and $14 million associated with the 6.55%senior notes and 6.00% senior notes, respectively. The premiums will be recognized as a reduction ininterest expense over the life of the respective notes. As a result of the termination of the interest rateswaps the Company recognized reductions in interest expense of $8 million during fiscal 2009. As aresult of the Company’s tender offer, as discussed in Note 11, the Company recognized $12 million ofthe premiums as a component of the gain on retirement of debt included in other income (expense),net on the Consolidated and Combined Statement of Operations.
During fiscal 2007, in anticipation of issuing fixed-rate debt, the Company entered into and,concurrent with the Company’s fixed-rate debt issuance, terminated forward starting interest rate swapsto hedge the variability in interest expense that would result from changes in interest rates between thedate of the swap and the Company’s anticipated date of issuing fixed-rate debt. These forward startinginterest rate swaps were designated as effective hedges of the probable interest payments under ASC815-30. Upon the issuance of the Company’s senior notes in September 2007, these swaps wereterminated for a cash payment of $54 million. The effective portion of these swaps of $53 million was
87
TYCO ELECTRONICS LTD.
NOTES TO CONSOLIDATED AND COMBINED FINANCIAL STATEMENTS (Continued)
13. Financial Instruments (Continued)
recorded in accumulated other comprehensive income and is recognized in earnings as interest expenseover the remaining term of the related debt instruments. As a result of the termination of the forwardstarting interest rate swaps, the Company recognized interest expense of $9 million, $6 million, and$1 million during the years ended September 25, 2009, September 26, 2008, and September 28, 2007,respectively. Interest expense recognized during fiscal 2009 included $3 million of interest expenserecognized as a result of the Company’s tender offer. See Note 11 for additional information regardingthe tender offer.
Commodity Hedges
As part of managing the exposure to certain commodity price fluctuations, the Company utilizescommodity swap contracts, all of which are designated as cash flow hedges. The objective of thesecontracts is to minimize impacts to cash flows and profitability due to changes in prices of commoditiesused in production.
At September 25, 2009 and September 26, 2008, the Company’s commodity hedges, which relatedto purchases of gold, were in a gain position of $1 million and $2 million, respectively, and had anotional value of $29 million and $21 million, respectively. The Company expects that significantly allof the balance in accumulated other comprehensive income associated with the commodities hedgeswill be reclassified into the Consolidated and Combined Statements of Operations within the nexttwelve months as adjustments to cost of sales.
Hedges of Net Investment
The Company hedges its net investment in certain foreign operations using intercompanynon-derivative financial instruments denominated in the same currencies. The aggregate notional valueof these hedges was $1,027 million and $1,161 million at September 25, 2009 and September 26, 2008,respectively. The Company reclassified foreign exchange losses of $72 million, $168 million, and$118 million in fiscal 2009, 2008, and 2007, respectively. These amounts were recorded as currencytranslation, a component of accumulated other comprehensive income, offsetting foreign exchangegains or losses attributable to the translation of the net investment. See Note 22 for additionalinformation.
88
TYCO ELECTRONICS LTD.
NOTES TO CONSOLIDATED AND COMBINED FINANCIAL STATEMENTS (Continued)
13. Financial Instruments (Continued)
Derivative Instrument Summary
The fair value of the Company’s derivative instruments at September 25, 2009 is summarizedbelow.
Fair Value Fair Valueof Asset of Liability
Positions(1) Positions(2)
(in millions)
Derivatives designated as hedging instruments:Foreign currency contracts(3) . . . . . . . . . . . . . . . . . . . . . . $ 4 $ 2Commodity swap contracts . . . . . . . . . . . . . . . . . . . . . . . 1 —
Total derivatives designated as hedging instruments . . . . . . . 5 2
Derivatives not designated as hedging instruments:Foreign currency contracts(3) . . . . . . . . . . . . . . . . . . . . . . 8 11
Total derivatives not designated as hedging instruments . . . . 8 11
Total derivatives . . . . . . . . . . . . . . . . . . . . . . . . . . . . . . . . . $13 $13
(1) All derivatives in asset positions are recorded in prepaid expenses and other current assets on the ConsolidatedBalance Sheet, except where a right of offset against liability positions exists. As disclosed in Note 16, derivativeinstruments in prepaid expenses and other current assets on the Consolidated Balance Sheet totaled $4 million.
(2) All derivatives in liability positions are recorded in accrued and other current liabilities on the ConsolidatedBalance Sheet, except where a right of offset against asset positions exists. As disclosed in Note 16, derivativeinstruments in accrued and other current liabilities on the Consolidated Balance Sheet totaled $4 million.
(3) Contracts are presented gross without regard to any right of offset that exists.
The effects of derivative instruments designated as fair value hedges on the Consolidated andCombined Statement of Operations at fiscal year end 2009 were as follows:
Location ofGain Recognized Amount of
Derivatives Designated as Fair Value Hedges on Derivative Gain Recognized
(in millions)
Interest rate swaps(1) . . . . . . . . . . . . . . . . . . . . . . Interest expense $ 8Interest rate swaps(2) . . . . . . . . . . . . . . . . . . . . . . Other income 12
Total . . . . . . . . . . . . . . . . . . . . . . . . . . . . . . . . . $20
(1) Interest rate swaps were terminated in December 2008. See discussion above.
(2) As a result of the Company’s tender offer, as discussed in Note 11, the Company recognized $12 million of thepremiums as a component of the gain on retirement of debt included in other income (expense), net on theConsolidated and Combined Statement of Operations.
89
TYCO ELECTRONICS LTD.
NOTES TO CONSOLIDATED AND COMBINED FINANCIAL STATEMENTS (Continued)
13. Financial Instruments (Continued)
The effects of derivative instruments designated as cash flow hedges on the Consolidated andCombined Statement of Operations at fiscal year end 2009 were as follows:
Amount ofLocation of Gain (Loss)
Amount of Gain (Loss) RecognizedGain (Loss) Recognized in IncomeReclassified in Income (Ineffective
Amount of from (Ineffective Portion andGain (Loss) Location of Gain Accumulated Portion AmountRecognized (Loss) Reclassified OCI into and Amount Excluded
in OCI from Accumulated Income Excluded from fromDerivatives Designated (Effective OCI into Income (Effective Effectiveness Effectivenessas Cash Flow Hedges Portion) (Effective Portion) Portion) Testing) Testing)
(in millions)Foreign currency contracts . . . . . . . . . $ 1 Cost of sales $(1) Cost of sales(1) $—Commodity swap contracts . . . . . . . . . 3 Cost of sales 3 Cost of sales —Forward starting interest rate swaps(2) . — Interest expense(3) (9) Interest expense —
Total . . . . . . . . . . . . . . . . . . . . . . . . $ 4 $(7) $—
(1) Depending on the nature of the hedge, ineffectiveness is recorded in cost of sales or selling, general, and administrativeexpenses.
(2) Forward starting interest rate swaps were terminated in September 2007. See discussion above.
(3) Interest expense recognized during fiscal 2009 included $3 million of interest expense recognized as a result of theCompany’s tender offer. See Note 11 for additional information regarding the tender offer.
The effects of derivative instruments not designated as hedging instruments on the Consolidatedand Combined Statement of Operations at fiscal year end 2009 were as follows:
Location of Loss Amount ofDerivatives not Designated as Hedging Instruments Recognized on Derivative Loss Recognized
(in millions)
Foreign currency contracts . . . . . . . . . . . . . . . . . . . . . . . . . . Selling, general, andadministrative expenses $(178)
Total . . . . . . . . . . . . . . . . . . . . . . . . . . . . . . . . . . . . . . . . . . $(178)
During fiscal 2009, the Company incurred losses of $178 million as a result of marking foreigncurrency derivatives not designated as hedging instruments to fair value, particularly derivatives relatedto certain Eastern European currencies during the first quarter of fiscal 2009. These losses were largelyoffset by the gains realized as a result of re-measuring the underlying assets and liabilities denominatedin foreign currencies to primarily the Euro or U.S. Dollar. These gains and losses were reflected inselling, general, and administrative expenses on the Consolidated and Combined Statement ofOperations.
14. Retirement Plans
Adoption of Measurement Date Provisions and Funded Status Recognition Provisions of ASC 715
In the fourth quarter of fiscal 2009, the Company adopted the measurement date provisions ofASC 715 (Compensation—Retirement Benefits), which require that plan assets and benefits obligations
90
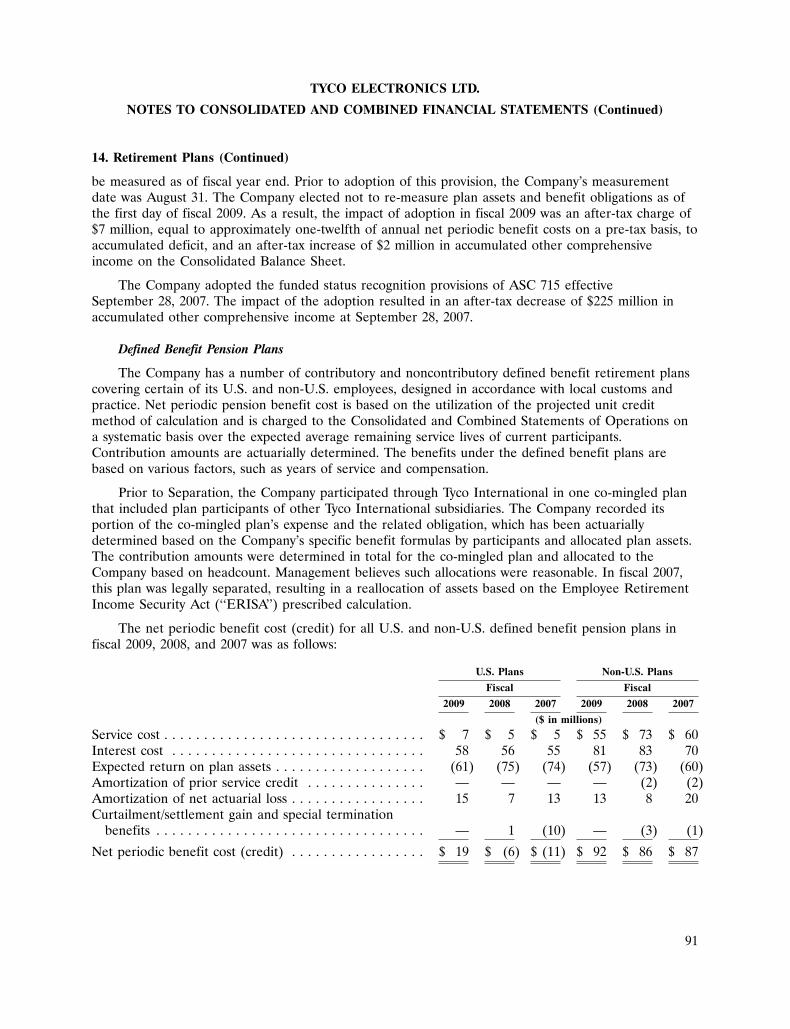
TYCO ELECTRONICS LTD.
NOTES TO CONSOLIDATED AND COMBINED FINANCIAL STATEMENTS (Continued)
14. Retirement Plans (Continued)
be measured as of fiscal year end. Prior to adoption of this provision, the Company’s measurementdate was August 31. The Company elected not to re-measure plan assets and benefit obligations as ofthe first day of fiscal 2009. As a result, the impact of adoption in fiscal 2009 was an after-tax charge of$7 million, equal to approximately one-twelfth of annual net periodic benefit costs on a pre-tax basis, toaccumulated deficit, and an after-tax increase of $2 million in accumulated other comprehensiveincome on the Consolidated Balance Sheet.
The Company adopted the funded status recognition provisions of ASC 715 effectiveSeptember 28, 2007. The impact of the adoption resulted in an after-tax decrease of $225 million inaccumulated other comprehensive income at September 28, 2007.
Defined Benefit Pension Plans
The Company has a number of contributory and noncontributory defined benefit retirement planscovering certain of its U.S. and non-U.S. employees, designed in accordance with local customs andpractice. Net periodic pension benefit cost is based on the utilization of the projected unit creditmethod of calculation and is charged to the Consolidated and Combined Statements of Operations ona systematic basis over the expected average remaining service lives of current participants.Contribution amounts are actuarially determined. The benefits under the defined benefit plans arebased on various factors, such as years of service and compensation.
Prior to Separation, the Company participated through Tyco International in one co-mingled planthat included plan participants of other Tyco International subsidiaries. The Company recorded itsportion of the co-mingled plan’s expense and the related obligation, which has been actuariallydetermined based on the Company’s specific benefit formulas by participants and allocated plan assets.The contribution amounts were determined in total for the co-mingled plan and allocated to theCompany based on headcount. Management believes such allocations were reasonable. In fiscal 2007,this plan was legally separated, resulting in a reallocation of assets based on the Employee RetirementIncome Security Act (‘‘ERISA’’) prescribed calculation.
The net periodic benefit cost (credit) for all U.S. and non-U.S. defined benefit pension plans infiscal 2009, 2008, and 2007 was as follows:
U.S. Plans Non-U.S. Plans
Fiscal Fiscal
2009 2008 2007 2009 2008 2007
($ in millions)
Service cost . . . . . . . . . . . . . . . . . . . . . . . . . . . . . . . . . $ 7 $ 5 $ 5 $ 55 $ 73 $ 60Interest cost . . . . . . . . . . . . . . . . . . . . . . . . . . . . . . . . 58 56 55 81 83 70Expected return on plan assets . . . . . . . . . . . . . . . . . . . (61) (75) (74) (57) (73) (60)Amortization of prior service credit . . . . . . . . . . . . . . . — — — — (2) (2)Amortization of net actuarial loss . . . . . . . . . . . . . . . . . 15 7 13 13 8 20Curtailment/settlement gain and special termination
benefits . . . . . . . . . . . . . . . . . . . . . . . . . . . . . . . . . . — 1 (10) — (3) (1)
Net periodic benefit cost (credit) . . . . . . . . . . . . . . . . . $ 19 $ (6) $ (11) $ 92 $ 86 $ 87
91
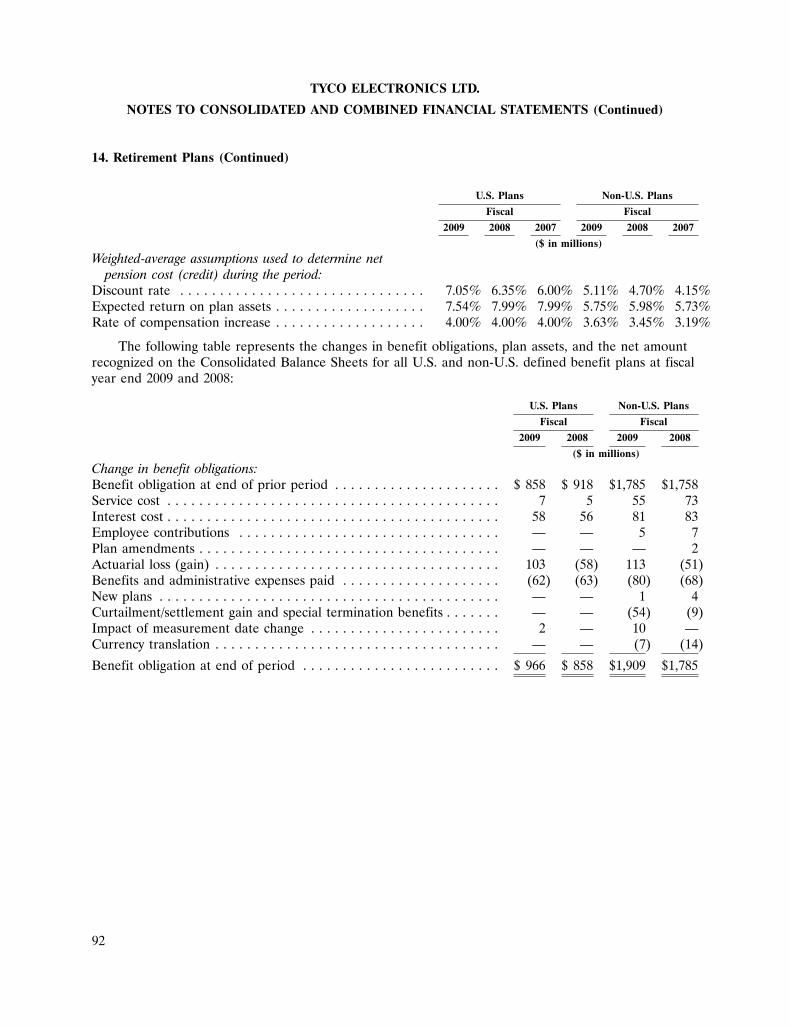
TYCO ELECTRONICS LTD.
NOTES TO CONSOLIDATED AND COMBINED FINANCIAL STATEMENTS (Continued)
14. Retirement Plans (Continued)
U.S. Plans Non-U.S. Plans
Fiscal Fiscal
2009 2008 2007 2009 2008 2007
($ in millions)
Weighted-average assumptions used to determine netpension cost (credit) during the period:
Discount rate . . . . . . . . . . . . . . . . . . . . . . . . . . . . . . . 7.05% 6.35% 6.00% 5.11% 4.70% 4.15%Expected return on plan assets . . . . . . . . . . . . . . . . . . . 7.54% 7.99% 7.99% 5.75% 5.98% 5.73%Rate of compensation increase . . . . . . . . . . . . . . . . . . . 4.00% 4.00% 4.00% 3.63% 3.45% 3.19%
The following table represents the changes in benefit obligations, plan assets, and the net amountrecognized on the Consolidated Balance Sheets for all U.S. and non-U.S. defined benefit plans at fiscalyear end 2009 and 2008:
U.S. Plans Non-U.S. Plans
Fiscal Fiscal
2009 2008 2009 2008
($ in millions)
Change in benefit obligations:Benefit obligation at end of prior period . . . . . . . . . . . . . . . . . . . . . $ 858 $ 918 $1,785 $1,758Service cost . . . . . . . . . . . . . . . . . . . . . . . . . . . . . . . . . . . . . . . . . . 7 5 55 73Interest cost . . . . . . . . . . . . . . . . . . . . . . . . . . . . . . . . . . . . . . . . . . 58 56 81 83Employee contributions . . . . . . . . . . . . . . . . . . . . . . . . . . . . . . . . . — — 5 7Plan amendments . . . . . . . . . . . . . . . . . . . . . . . . . . . . . . . . . . . . . . — — — 2Actuarial loss (gain) . . . . . . . . . . . . . . . . . . . . . . . . . . . . . . . . . . . . 103 (58) 113 (51)Benefits and administrative expenses paid . . . . . . . . . . . . . . . . . . . . (62) (63) (80) (68)New plans . . . . . . . . . . . . . . . . . . . . . . . . . . . . . . . . . . . . . . . . . . . — — 1 4Curtailment/settlement gain and special termination benefits . . . . . . . — — (54) (9)Impact of measurement date change . . . . . . . . . . . . . . . . . . . . . . . . 2 — 10 —Currency translation . . . . . . . . . . . . . . . . . . . . . . . . . . . . . . . . . . . . — — (7) (14)
Benefit obligation at end of period . . . . . . . . . . . . . . . . . . . . . . . . . $ 966 $ 858 $1,909 $1,785
92
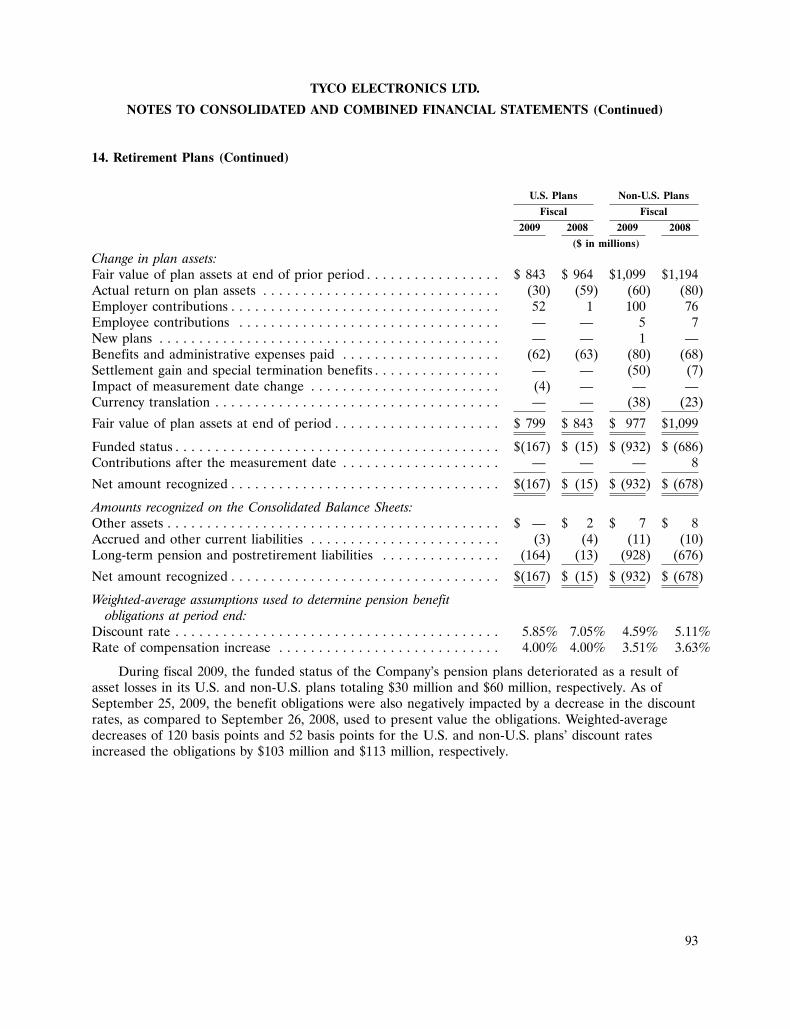
TYCO ELECTRONICS LTD.
NOTES TO CONSOLIDATED AND COMBINED FINANCIAL STATEMENTS (Continued)
14. Retirement Plans (Continued)
U.S. Plans Non-U.S. Plans
Fiscal Fiscal
2009 2008 2009 2008
($ in millions)
Change in plan assets:Fair value of plan assets at end of prior period . . . . . . . . . . . . . . . . . $ 843 $ 964 $1,099 $1,194Actual return on plan assets . . . . . . . . . . . . . . . . . . . . . . . . . . . . . . (30) (59) (60) (80)Employer contributions . . . . . . . . . . . . . . . . . . . . . . . . . . . . . . . . . . 52 1 100 76Employee contributions . . . . . . . . . . . . . . . . . . . . . . . . . . . . . . . . . — — 5 7New plans . . . . . . . . . . . . . . . . . . . . . . . . . . . . . . . . . . . . . . . . . . . — — 1 —Benefits and administrative expenses paid . . . . . . . . . . . . . . . . . . . . (62) (63) (80) (68)Settlement gain and special termination benefits . . . . . . . . . . . . . . . . — — (50) (7)Impact of measurement date change . . . . . . . . . . . . . . . . . . . . . . . . (4) — — —Currency translation . . . . . . . . . . . . . . . . . . . . . . . . . . . . . . . . . . . . — — (38) (23)
Fair value of plan assets at end of period . . . . . . . . . . . . . . . . . . . . . $ 799 $ 843 $ 977 $1,099
Funded status . . . . . . . . . . . . . . . . . . . . . . . . . . . . . . . . . . . . . . . . . $(167) $ (15) $ (932) $ (686)Contributions after the measurement date . . . . . . . . . . . . . . . . . . . . — — — 8
Net amount recognized . . . . . . . . . . . . . . . . . . . . . . . . . . . . . . . . . . $(167) $ (15) $ (932) $ (678)
Amounts recognized on the Consolidated Balance Sheets:Other assets . . . . . . . . . . . . . . . . . . . . . . . . . . . . . . . . . . . . . . . . . . $ — $ 2 $ 7 $ 8Accrued and other current liabilities . . . . . . . . . . . . . . . . . . . . . . . . (3) (4) (11) (10)Long-term pension and postretirement liabilities . . . . . . . . . . . . . . . (164) (13) (928) (676)
Net amount recognized . . . . . . . . . . . . . . . . . . . . . . . . . . . . . . . . . . $(167) $ (15) $ (932) $ (678)
Weighted-average assumptions used to determine pension benefitobligations at period end:
Discount rate . . . . . . . . . . . . . . . . . . . . . . . . . . . . . . . . . . . . . . . . . 5.85% 7.05% 4.59% 5.11%Rate of compensation increase . . . . . . . . . . . . . . . . . . . . . . . . . . . . 4.00% 4.00% 3.51% 3.63%
During fiscal 2009, the funded status of the Company’s pension plans deteriorated as a result ofasset losses in its U.S. and non-U.S. plans totaling $30 million and $60 million, respectively. As ofSeptember 25, 2009, the benefit obligations were also negatively impacted by a decrease in the discountrates, as compared to September 26, 2008, used to present value the obligations. Weighted-averagedecreases of 120 basis points and 52 basis points for the U.S. and non-U.S. plans’ discount ratesincreased the obligations by $103 million and $113 million, respectively.
93
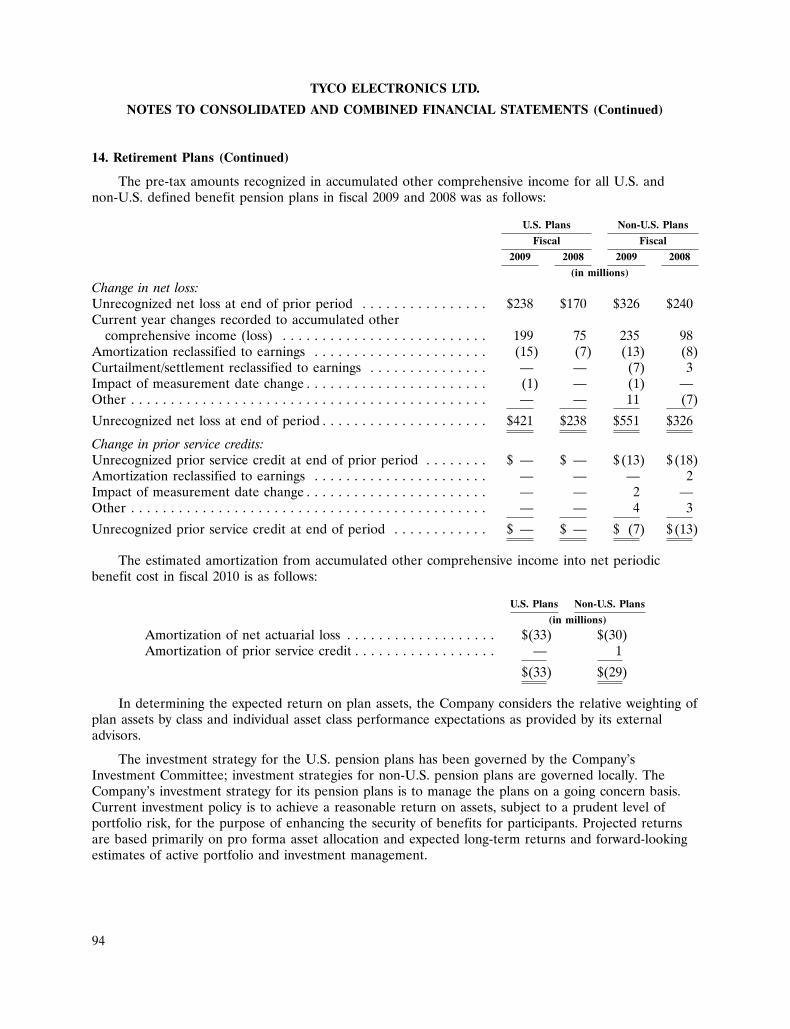
TYCO ELECTRONICS LTD.
NOTES TO CONSOLIDATED AND COMBINED FINANCIAL STATEMENTS (Continued)
14. Retirement Plans (Continued)
The pre-tax amounts recognized in accumulated other comprehensive income for all U.S. andnon-U.S. defined benefit pension plans in fiscal 2009 and 2008 was as follows:
U.S. Plans Non-U.S. Plans
Fiscal Fiscal
2009 2008 2009 2008
(in millions)
Change in net loss:Unrecognized net loss at end of prior period . . . . . . . . . . . . . . . . $238 $170 $326 $240Current year changes recorded to accumulated other
comprehensive income (loss) . . . . . . . . . . . . . . . . . . . . . . . . . . 199 75 235 98Amortization reclassified to earnings . . . . . . . . . . . . . . . . . . . . . . (15) (7) (13) (8)Curtailment/settlement reclassified to earnings . . . . . . . . . . . . . . . — — (7) 3Impact of measurement date change . . . . . . . . . . . . . . . . . . . . . . . (1) — (1) —Other . . . . . . . . . . . . . . . . . . . . . . . . . . . . . . . . . . . . . . . . . . . . . — — 11 (7)
Unrecognized net loss at end of period . . . . . . . . . . . . . . . . . . . . . $421 $238 $551 $326
Change in prior service credits:Unrecognized prior service credit at end of prior period . . . . . . . . $ — $ — $(13) $(18)Amortization reclassified to earnings . . . . . . . . . . . . . . . . . . . . . . — — — 2Impact of measurement date change . . . . . . . . . . . . . . . . . . . . . . . — — 2 —Other . . . . . . . . . . . . . . . . . . . . . . . . . . . . . . . . . . . . . . . . . . . . . — — 4 3
Unrecognized prior service credit at end of period . . . . . . . . . . . . $ — $ — $ (7) $(13)
The estimated amortization from accumulated other comprehensive income into net periodicbenefit cost in fiscal 2010 is as follows:
U.S. Plans Non-U.S. Plans
(in millions)
Amortization of net actuarial loss . . . . . . . . . . . . . . . . . . . $(33) $(30)Amortization of prior service credit . . . . . . . . . . . . . . . . . . — 1
$(33) $(29)
In determining the expected return on plan assets, the Company considers the relative weighting ofplan assets by class and individual asset class performance expectations as provided by its externaladvisors.
The investment strategy for the U.S. pension plans has been governed by the Company’sInvestment Committee; investment strategies for non-U.S. pension plans are governed locally. TheCompany’s investment strategy for its pension plans is to manage the plans on a going concern basis.Current investment policy is to achieve a reasonable return on assets, subject to a prudent level ofportfolio risk, for the purpose of enhancing the security of benefits for participants. Projected returnsare based primarily on pro forma asset allocation and expected long-term returns and forward-lookingestimates of active portfolio and investment management.
94
TYCO ELECTRONICS LTD.
NOTES TO CONSOLIDATED AND COMBINED FINANCIAL STATEMENTS (Continued)
14. Retirement Plans (Continued)
During fiscal 2008, the Company’s Investment Committee made the decision to change the targetasset allocation of the U.S. Plans’ Master Trust from 60% equity and 40% fixed income to 30% equityand 70% fixed income in an effort to better align asset risk with the anticipated payment of benefitobligations. The target asset allocation transition began in fiscal 2008. As a result of economicconditions during fiscal 2009, the Company has slowed the transition of the Master Trust assetallocation change. Asset reallocation will continue over a multi-year period based on the funded statusof the U.S. Plans’ Master Trust.
Target weighted-average asset allocations and weighted-average asset allocations for U.S. andnon-U.S. pension plans at fiscal year end 2009 and 2008 were as follows:
U.S. Plans Non-U.S. Plans
Fiscal Fiscal Fiscal FiscalTarget 2009 2008 Target 2009 2008
Asset Category:Equity securities . . . . . . . . . . . . . . . . . . . . . . . . . . . . . . . 30% 44% 54% 45% 40% 45%Debt securities . . . . . . . . . . . . . . . . . . . . . . . . . . . . . . . . 70 52 44 44 47 45Real estate . . . . . . . . . . . . . . . . . . . . . . . . . . . . . . . . . . . — — — 3 3 3Cash and cash equivalents . . . . . . . . . . . . . . . . . . . . . . . . — 4 2 8 10 7
Total . . . . . . . . . . . . . . . . . . . . . . . . . . . . . . . . . . . . . . . 100% 100% 100% 100% 100% 100%
Tyco Electronics’ common shares are not a direct investment of the Company’s pension funds;however, the pension funds may indirectly include Tyco Electronics shares. The aggregate amount ofthe Tyco Electronics common shares would not be considered material relative to the total pensionfund assets.
The Company’s funding policy is to make contributions in accordance with the laws and customs ofthe various countries in which it operates as well as to make discretionary voluntary contributions fromtime-to-time. The Company anticipates that, at a minimum, it will make the minimum requiredcontributions to its pension plans in fiscal 2010 of $3 million for U.S. plans and $80 million fornon-U.S. plans.
Benefit payments, which reflect future expected service, as appropriate, are expected to be paid asfollows:
U.S. Plans Non-U.S. Plans
(in millions)
Fiscal 2010 . . . . . . . . . . . . . . . . . . . . . . . . . . . . . . . . . . . $ 56 $ 63Fiscal 2011 . . . . . . . . . . . . . . . . . . . . . . . . . . . . . . . . . . . 56 68Fiscal 2012 . . . . . . . . . . . . . . . . . . . . . . . . . . . . . . . . . . . 59 73Fiscal 2013 . . . . . . . . . . . . . . . . . . . . . . . . . . . . . . . . . . . 61 83Fiscal 2014 . . . . . . . . . . . . . . . . . . . . . . . . . . . . . . . . . . . 62 78Fiscal 2015-2019 . . . . . . . . . . . . . . . . . . . . . . . . . . . . . . . . 335 480
95
TYCO ELECTRONICS LTD.
NOTES TO CONSOLIDATED AND COMBINED FINANCIAL STATEMENTS (Continued)
14. Retirement Plans (Continued)
The accumulated benefit obligation for all U.S. and non-U.S. plans as of fiscal year end 2009 and2008 was as follows:
U.S. Plans Non-U.S. Plans
Fiscal Fiscal
2009 2008 2009 2008
(in millions)
Accumulated benefit obligation . . . . . . . . . . . . . . . . . . . . . . . . . . . . . $963 $855 $1,619 $1,518
The accumulated benefit obligation and fair value of plan assets for U.S. and non-U.S. pensionplans with accumulated benefit obligations in excess of plan assets at fiscal year end 2009 and 2008were as follows:
U.S. Plans Non-U.S. Plans
Fiscal Fiscal
2009 2008 2009 2008
(in millions)
Accumulated benefit obligation . . . . . . . . . . . . . . . . . . . . . . . . . . . . . $958 $808 $1,560 $1,314Fair value of plan assets . . . . . . . . . . . . . . . . . . . . . . . . . . . . . . . . . . 794 793 900 862
The projected benefit obligation and fair value of plan assets for U.S. and non-U.S. pension planswith projected benefit obligations in excess of plan assets at fiscal year end 2009 and 2008 were asfollows:
U.S. Plans Non-U.S. Plans
Fiscal Fiscal
2009 2008 2009 2008
(in millions)
Projected benefit obligation . . . . . . . . . . . . . . . . . . . . . . . . . . . . . . . . $962 $810 $1,879 $1,726Fair value of plan assets . . . . . . . . . . . . . . . . . . . . . . . . . . . . . . . . . . 794 793 939 1,032
Defined Contribution Retirement Plans
The Company maintains several defined contribution retirement plans, which include 401(k)matching programs, as well as qualified and nonqualified profit sharing and share bonus retirementplans. Expense for the defined contribution plans is computed as a percentage of participants’compensation and was $55 million, $66 million, and $61 million for fiscal 2009, 2008, and 2007,respectively.
Deferred Compensation Plans
The Company maintains nonqualified deferred compensation plans, which permit eligibleemployees to defer a portion of their compensation. A record keeping account is set up for eachparticipant and the participant chooses from a variety of measurement funds for the deemedinvestment of their accounts. The measurement funds correspond to a number of funds in TycoElectronics’ 401(k) plans and the account balance fluctuates with the investment returns on thosefunds. Total deferred compensation liabilities were $43 million and $38 million at fiscal year end 2009and 2008, respectively.
96
TYCO ELECTRONICS LTD.
NOTES TO CONSOLIDATED AND COMBINED FINANCIAL STATEMENTS (Continued)
14. Retirement Plans (Continued)
Rabbi Trusts
The Company has established rabbi trusts, related to certain acquired companies, through whichthe assets may be used to pay non-qualified plan benefits. The trusts primarily hold bonds and equities.The rabbi trust assets are subject to the claims of the Company’s creditors in the event of theCompany’s insolvency. The value of the assets held by these trusts, included in other assets on theConsolidated Balance Sheets, was $76 million and $84 million at fiscal year end 2009 and 2008,respectively. Total liabilities related to the assets held by the rabbi trust and reflected on theConsolidated Balance Sheets were $9 million and $14 million at fiscal year end 2009 and 2008,respectively. Plan participants are general creditors of the Company with respect to these benefits.
Postretirement Benefit Plans
In addition to providing pension and 401(k) benefits, the Company also provides certain healthcare coverage continuation for qualifying retirees from date of retirement to age 65.
Net periodic postretirement benefit cost in fiscal 2009, 2008, and 2007 was as follows:
Fiscal
2009 2008 2007
($ in millions)
Service cost . . . . . . . . . . . . . . . . . . . . . . . . . . . . . . . . . . . . . $ 1 $ 1 $ 1Interest cost . . . . . . . . . . . . . . . . . . . . . . . . . . . . . . . . . . . . 2 2 3Curtailment/settlement gain and special termination benefits . (1) — (3)
Net periodic postretirement benefit cost . . . . . . . . . . . . . . . . $ 2 $ 3 $ 1
Weighted-average assumptions used to determine netpostretirement benefit cost during the period:
Discount rate . . . . . . . . . . . . . . . . . . . . . . . . . . . . . . . . . . . 7.05% 6.35% 5.75%Rate of compensation increase . . . . . . . . . . . . . . . . . . . . . . . 4.00% 4.00% 4.00%
97
TYCO ELECTRONICS LTD.
NOTES TO CONSOLIDATED AND COMBINED FINANCIAL STATEMENTS (Continued)
14. Retirement Plans (Continued)
The components of the accrued postretirement benefit obligations, substantially all of which areunfunded, at fiscal year end 2009 and 2008, were as follows:
Fiscal
2009 2008
($ in millions)
Change in benefit obligations:Benefit obligation at beginning of period . . . . . . . . . . . . . . . . . . . . $ 38 $ 41Service cost . . . . . . . . . . . . . . . . . . . . . . . . . . . . . . . . . . . . . . . . . 1 1Interest cost . . . . . . . . . . . . . . . . . . . . . . . . . . . . . . . . . . . . . . . . . 2 2Actuarial loss (gain) . . . . . . . . . . . . . . . . . . . . . . . . . . . . . . . . . . . 4 (3)Benefits paid . . . . . . . . . . . . . . . . . . . . . . . . . . . . . . . . . . . . . . . . (2) (3)Other . . . . . . . . . . . . . . . . . . . . . . . . . . . . . . . . . . . . . . . . . . . . . . (1) —
Benefit obligation at end of period . . . . . . . . . . . . . . . . . . . . . . . . . $ 42 $ 38
Change in plan assets:Fair value of assets at beginning of period . . . . . . . . . . . . . . . . . . . $ 4 $ 4Employer contributions . . . . . . . . . . . . . . . . . . . . . . . . . . . . . . . . . 1 3Benefits paid . . . . . . . . . . . . . . . . . . . . . . . . . . . . . . . . . . . . . . . . (2) (3)Impact of measurement date change . . . . . . . . . . . . . . . . . . . . . . . — —
Fair value of plan assets at end of period . . . . . . . . . . . . . . . . . . . . $ 3 $ 4
Funded status / net amount recognized . . . . . . . . . . . . . . . . . . . . . . $ (39) $ (34)
Amounts recognized on the Consolidated Balance Sheets:Accrued and other postretirement liabilities . . . . . . . . . . . . . . . . . . $ (2) $ (2)Long-term pension and postretirement liabilities . . . . . . . . . . . . . . . (37) (32)
Net amount recognized . . . . . . . . . . . . . . . . . . . . . . . . . . . . . . . . . (39) $ (34)
Weighted-average assumptions used to determine postretirement benefitobligations at period end:
Discount rate . . . . . . . . . . . . . . . . . . . . . . . . . . . . . . . . . . . . . . . . 6.05% 7.05%Rate of compensation increase . . . . . . . . . . . . . . . . . . . . . . . . . . . . 4.00% 4.00%
Unrecognized prior service costs and actuarial losses of $4 million and $2 million at fiscal year end2009 and 2008, respectively, were recorded in accumulated other comprehensive income. There isexpected to be no significant amortization of the current balance into net periodic benefit cost in fiscal2010.
The Company expects to make contributions to its postretirement benefit plans of $2 million infiscal 2010.
98
TYCO ELECTRONICS LTD.
NOTES TO CONSOLIDATED AND COMBINED FINANCIAL STATEMENTS (Continued)
14. Retirement Plans (Continued)
Benefit payments, including those amounts to be paid out of corporate assets and reflecting futureexpected service as appropriate, are expected to be paid as follows:
(in millions)
Fiscal 2010 . . . . . . . . . . . . . . . . . . . . . . . . . . . . . . . . . . . . . . . . . . . . . $ 3Fiscal 2011 . . . . . . . . . . . . . . . . . . . . . . . . . . . . . . . . . . . . . . . . . . . . . 3Fiscal 2012 . . . . . . . . . . . . . . . . . . . . . . . . . . . . . . . . . . . . . . . . . . . . . 3Fiscal 2013 . . . . . . . . . . . . . . . . . . . . . . . . . . . . . . . . . . . . . . . . . . . . . 3Fiscal 2014 . . . . . . . . . . . . . . . . . . . . . . . . . . . . . . . . . . . . . . . . . . . . . 3Fiscal 2015-2019 . . . . . . . . . . . . . . . . . . . . . . . . . . . . . . . . . . . . . . . . . 14
Health care cost trend assumptions are as follows:
Fiscal
2009 2008
Health care cost trend rate assumed for next fiscal year . . . . . . . . . . . 9.19% 9.21%Rate to which the cost trend rate is assumed to decline . . . . . . . . . . . 5.00% 5.00%Fiscal year the ultimate trend rate is achieved . . . . . . . . . . . . . . . . . . 2015 2014
A one-percentage point change in assumed healthcare cost trend rates would have the followingeffects:
One Percentage One PercentagePoint Increase Point Decrease
(in millions)
Effect on total of service and interest cost . . . . . . . . . . $— $—Effect on postretirement benefit obligation . . . . . . . . . 4 (3)
15. Commitments and Contingencies
General Matters
The Company has facility, land, vehicle, and equipment leases that expire at various dates throughthe year 2056. Rental expense under these leases was $153 million, $168 million, and $152 million forfiscal 2009, 2008, and 2007, respectively. At fiscal year end 2009, the minimum lease paymentobligations under non-cancelable lease obligations were as follows:
(in millions)
Fiscal 2010 . . . . . . . . . . . . . . . . . . . . . . . . . . . . . . . . . . . . . . . . . . . . . $108Fiscal 2011 . . . . . . . . . . . . . . . . . . . . . . . . . . . . . . . . . . . . . . . . . . . . . 76Fiscal 2012 . . . . . . . . . . . . . . . . . . . . . . . . . . . . . . . . . . . . . . . . . . . . . 56Fiscal 2013 . . . . . . . . . . . . . . . . . . . . . . . . . . . . . . . . . . . . . . . . . . . . . 37Fiscal 2014 . . . . . . . . . . . . . . . . . . . . . . . . . . . . . . . . . . . . . . . . . . . . . 32Thereafter . . . . . . . . . . . . . . . . . . . . . . . . . . . . . . . . . . . . . . . . . . . . . 97
Total . . . . . . . . . . . . . . . . . . . . . . . . . . . . . . . . . . . . . . . . . . . . . . . . . . $406
99
TYCO ELECTRONICS LTD.
NOTES TO CONSOLIDATED AND COMBINED FINANCIAL STATEMENTS (Continued)
15. Commitments and Contingencies (Continued)
The Company also has purchase obligations related to commitments to purchase certain goods andservices. At fiscal year end 2009, the Company had commitments to purchase $71 million in fiscal 2010,$4 million in fiscal 2011, and $1 million in fiscal 2012.
Tyco Electronics Legal Proceedings
Intellectual Property and Antitrust Litigation
The Company is a party to a number of patent infringement and antitrust actions that may requirethe Company to pay damage awards. The Company has assessed the status of these matters and hasrecorded liabilities related to certain of these matters where appropriate.
Other Matters
The Company is a defendant in a number of other pending legal proceedings incidental to presentand former operations, acquisitions, and dispositions. The Company does not expect the outcome ofthese proceedings, either individually or in the aggregate, to have a material adverse effect on itsresults of operations, financial position, or cash flows.
Legal Matters under Separation and Distribution Agreement
The Separation and Distribution Agreement among the Company, Tyco International, andCovidien provided for the allocation among the parties of Tyco International’s assets, liabilities, andobligations attributable to periods prior to the Company’s and Covidien’s separations from TycoInternational on June 29, 2007. Under the Separation and Distribution Agreement, the Companyassumed the liability for, and control of, all pending and threatened legal matters at Separation relatedto the Company’s business or assumed or retained liabilities, and will indemnify the other parties forany liability arising out of or resulting from such assumed legal matters. Tyco Electronics remainsresponsible for 31% of certain potential liabilities that may arise from litigation pending or threatenedat Separation that was not allocated to one of the three parties, and Tyco International and Covidienare responsible for 27% and 42%, respectively, of such liabilities. If any party defaults in payment of itsallocated share of any such liability, each non-defaulting party will be responsible for an equal portionof the amount in default together with any other non-defaulting party, although any such payments willnot release the obligation of the defaulting party. Subject to the terms and conditions of the Separationand Distribution Agreement, Tyco International manages and controls all the legal matters related tothe shared contingent liabilities, including the defense or settlement thereof, subject to certainlimitations. All costs and expenses that Tyco International incurs in connection with the defense of suchlitigation, other than the amount of any judgment or settlement, which will be allocated in the mannerdescribed above, will be borne equally by Tyco International, Covidien, and the Company.
Tyco International Legal Proceedings
Securities Class Actions and Settlement
As previously reported in the Company’s periodic filings, prior to the Separation, TycoInternational and certain of its former directors and officers were named as defendants in over 40purported securities class action lawsuits. As a part of the Separation and Distribution Agreement, anyexisting or potential liabilities related to the securities class actions were allocated among Tyco
100
TYCO ELECTRONICS LTD.
NOTES TO CONSOLIDATED AND COMBINED FINANCIAL STATEMENTS (Continued)
15. Commitments and Contingencies (Continued)
International, Covidien, and the Company. The Company is responsible for 31% of potential liabilitiesthat may arise upon the resolution of the remaining pending litigation. Most of the securities classactions were transferred to the United States District Court for the District of New Hampshire forcoordinated or consolidated pre-trial proceedings. A consolidated securities class action complaint wasfiled in these proceedings and on June 12, 2006, the court entered an order certifying a class‘‘consisting of all persons and entities who purchased or otherwise acquired Tyco securities betweenDecember 13, 1999 and June 7, 2002, and who were damaged thereby, excluding defendants, all of theofficers, directors and partners thereof, members of their immediate families and their legalrepresentatives, heirs, successors or assigns, and any entity in which any of the foregoing have or had acontrolling interest.’’ As previously reported, Tyco International settled 32 of the purported securitiesclass action lawsuits arising from the actions alleged to have been taken by its prior management, forwhich the Company was responsible for 31%. All legal contingencies that could have affected the finalorder entered in the United States District Court for the District of New Hampshire approving thesettlement expired on February 21, 2008. As of the opt-out deadline for the settlement, TycoInternational received opt-out notices from individuals and entities totaling approximately 4% of theshares owned by class members. A number of these individuals and entities filed actions separatelyagainst Tyco International and/or Tyco International, Covidien, and the Company, all of which havebeen settled subsequently as discussed below. In addition, several cases asserting claims arising underERISA were filed, all of which have been settled subsequently as discussed below.
In fiscal 2007, the Company was allocated a charge from Tyco International of $922 million for theclass action settlement, for which no tax benefit was available. In addition, in fiscal 2007, the Companywas allocated $35 million of income relating to Tyco International’s expected recovery of certain costsfrom insurers. The net charge of $887 million was recorded on the Consolidated and CombinedStatement of Operations as pre-Separation litigation charges, net. The portion allocated to theCompany was consistent with the sharing percentage included in the Separation and DistributionAgreement. Tyco International placed funds in escrow for the benefit of the class. The escrow accountearned interest that was payable to the class. In addition, interest was accrued on the class actionsettlement liability.
The finalization of the class action settlement in February 2008 resulted in the extinguishment ofthe Company’s class action settlement liability of $3,020 million, interest in the escrow of $936 million,and class action settlement receivable of $2,084 million from the Consolidated Balance Sheet in fiscal2008. The finalization of the settlement resulted in a decrease to cash flows from operating activitiesand an increase to cash flows from investing activities during fiscal 2008. It did not affect the cashbalance on the Consolidated Balance Sheet because the Company had previously fully funded itsportion of the class action settlement into an escrow account intended to be used to settle the liability,as mentioned above.
Settlement of Securities Proceedings Not Covered by the Class Action Settlement
In fiscal 2008, Tyco International settled securities litigation captioned New Jersey v. TycoInternational Ltd., et al. and Ballard v. Tyco International Ltd., et al. for $73 million and $36 million,respectively. Pursuant to the sharing formula in the Separation and Distribution Agreement, theCompany recorded charges of $34 million, for which no tax benefit was available, in fiscal 2008. Inaddition, the Company recorded income of $12 million in fiscal 2008 related to Tyco International’srecovery of certain costs from insurers.
101
TYCO ELECTRONICS LTD.
NOTES TO CONSOLIDATED AND COMBINED FINANCIAL STATEMENTS (Continued)
15. Commitments and Contingencies (Continued)
During the first quarter of fiscal 2009, Tyco International, Covidien, and the Company entered intodefinitive agreements to settle actions captioned Hess v. Tyco International Ltd., et al. and Sciallo v. TycoInternational Ltd., et al. and an opt-out case brought by the Commonwealth of Massachusetts PensionReserves Investment Management Board. Pursuant to the sharing formula in the Separation andDistribution Agreement, the Company recorded charges of $9 million, for which no tax benefit wasavailable.
During the second quarter of fiscal 2009, Tyco International, Covidien, and the Company settledopt-out cases with Franklin Mutual Advisers, LLC and related plaintiffs and the Public Employees’Retirement Association of Colorado. Pursuant to the sharing formula, the Company recorded chargesof $19 million, for which no tax benefit was available. Additionally, the Company recorded reservestotaling $375 million representing the best estimate of probable loss for the remaining securitieslitigation claims subject to the Separation and Distribution Agreement, including remaining opt-outcases and cases arising under ERISA. As a result, the Company recorded a pre-tax charge in thesecond quarter of fiscal 2009 of $116 million for its share of the reserves. Upon final settlement of theERISA cases in the fourth quarter of fiscal 2009, the Company recorded a $25 million tax benefit.There were no tax benefits attributable for the other cases.
During the third quarter of fiscal 2009, Tyco International, Covidien, and the Company settled fiveof the remaining opt-out cases for $199 million. Pursuant to the sharing formula, the Company’s shareof the settlement amounts was $62 million. As the Company had previously established reserves forthese opt-out cases during the second quarter of fiscal 2009, the settlements did not impact itsConsolidated and Combined Statement of Operations.
During the fourth quarter of fiscal 2009, Tyco International, Covidien, and the Company settled fora total of $70 million eight consolidated class actions brought under ERISA against Tyco Internationaland certain of its current and former employees, officers and directors. Pursuant to the sharingformula, the Company’s share of the settlement amount was $22 million. Also, during the fourthquarter of fiscal 2009, Tyco International, Covidien, and the Company agreed to settle the remainingopt-out case for $2 million. Pursuant to the sharing formula, the Company’s share of the settlementamount was $1 million. As the Company had previously established reserves for these consolidatedactions and this opt-out case during the second quarter of fiscal 2009, the settlements did not impact itsConsolidated and Combined Statement of Operations. Only three of the securities cases remainoutstanding.
Investigations
As previously reported in the Company’s periodic filings, Tyco International and others receivedvarious subpoenas and requests from the Securities and Exchange Commission’s (‘‘SEC’’) Division ofEnforcement, the U.S. Department of Labor, the General Services Administration, and others seekingthe production of documents in connection with various investigations into Tyco International’sgovernance, management, operations, accounting, and related controls prior to the Separation. TheDepartment of Labor is investigating Tyco International and the administrators of certain of its benefitplans. Tyco International has advised the Company that it cannot predict when these investigations willbe completed, nor can it predict what the results of these investigations may be. It is possible that TycoInternational will be required to pay material fines or suffer other penalties, and pursuant to theliability sharing provisions of the Separation and Distribution Agreement, a portion of such payments
102

TYCO ELECTRONICS LTD.
NOTES TO CONSOLIDATED AND COMBINED FINANCIAL STATEMENTS (Continued)
15. Commitments and Contingencies (Continued)
may be allocated to the Company. It is not possible to estimate the amount of loss, or range of possibleloss, if any, that might result from an adverse resolution of these matters. As a result, the Company’sshare of such potential losses also is not estimable and may have a material adverse effect on theCompany’s results of operations, financial position, or cash flows.
Compliance Matters
As previously reported in the Company’s periodic filings, Tyco International received and hasresponded to various allegations that certain improper payments were made by Tyco Internationalsubsidiaries, including Tyco Electronics subsidiaries, in recent years prior to the Separation. TycoInternational reported to the U.S. Department of Justice and the SEC the investigative steps andremedial measures that it had taken in response to the allegations, including that it retained outsidecounsel to perform a company-wide baseline review of its policies, controls, and practices with respectto compliance with the Foreign Corrupt Practices Act (‘‘FCPA’’), and that it would continue toinvestigate and make periodic progress reports to these agencies. To date, the Company’s baselinereview has revealed that some of the Company’s former business practices may not comply with FCPArequirements. At this time, the Company cannot predict the outcome of these matters and otherallegations reported to regulatory and law enforcement authorities and therefore cannot estimate therange of potential loss or extent of risk, if any, that may result from an adverse resolution of thesematters. However, it is possible that the Company may be required to pay judgments, suffer penalties,or incur settlements in amounts that may have a material adverse effect on the Company’s results ofoperations, financial position, or cash flows. Any judgment, settlement, or other cost incurred by TycoInternational in connection with these matters not specifically allocated to Tyco International, Covidien,or the Company would be subject to the liability sharing provisions of the Separation and DistributionAgreement.
Income Taxes
In connection with the Separation, the Company entered into a Tax Sharing Agreement thatgenerally governs Covidien’s, Tyco Electronics’, and Tyco International’s respective rights,responsibilities, and obligations after the distribution with respect to taxes, including ordinary course ofbusiness taxes and taxes, if any, incurred as a result of any failure of the distribution of all of the sharesof Covidien or Tyco Electronics to qualify as a tax-free distribution for U.S. federal income taxpurposes within the meaning of Section 355 of the Internal Revenue Code (the ‘‘Code’’) or certaininternal transactions undertaken in anticipation of the spin-offs to qualify for tax-favored treatmentunder the Code.
Pursuant to the Separation and Distribution Agreement and Tax Sharing Agreement, uponSeparation, the Company entered into certain guarantee commitments and indemnifications with TycoInternational and Covidien. Under these agreements, principally the Tax Sharing Agreement, TycoInternational, Covidien, and Tyco Electronics share 27%, 42%, and 31%, respectively, of certaincontingent liabilities relating to unresolved pre-Separation tax matters of Tyco International. The effectof the Tax Sharing Agreement is to indemnify the Company for 69% of certain liabilities settled in cashby the Company with respect to unresolved pre-Separation tax matters. Pursuant to thatindemnification, the Company has made similar indemnifications to Tyco International and Covidienwith respect to 31% of certain liabilities settled in cash by the companies with respect to unresolvedpre-Separation tax matters. If any of the companies responsible for all or a portion of such liabilities
103
TYCO ELECTRONICS LTD.
NOTES TO CONSOLIDATED AND COMBINED FINANCIAL STATEMENTS (Continued)
15. Commitments and Contingencies (Continued)
were to default in its payment of costs or expenses related to any such liability, the Company would beresponsible for a portion of the defaulting party or parties’ obligation.
Prior to Separation, certain of the Company’s subsidiaries filed combined tax returns with TycoInternational. Those and other of the Company and its subsidiaries’ income tax returns are periodicallyexamined by various tax authorities. In connection with these examinations, tax authorities, includingthe Internal Revenue Service (‘‘IRS’’), have raised issues and proposed tax adjustments. TycoInternational, as the U.S. income tax audit controlling party under the Tax Sharing Agreement, isreviewing and contesting certain of the proposed tax adjustments. Amounts related to these taxadjustments and other tax contingencies and related interest that management has assessed under theuncertain tax position provisions of ASC 740, which relate specifically to Tyco Electronics entities havebeen recorded on the Consolidated and Combined Financial Statements. In addition, the Company maybe required to fund portions of Covidien and Tyco International’s tax obligations. Estimates about theseguarantees have also been recognized on the Consolidated and Combined Financial Statements. SeeNote 12 for additional information.
In prior years, in connection with the IRS audit of various fiscal years, Tyco Internationalsubmitted to the IRS proposed adjustments to these prior period U.S. federal income tax returnsresulting in a reduction in the taxable income previously filed. The IRS accepted substantially all of theproposed adjustments for fiscal 1997 through 2000 for which the IRS had completed its field work. Onthe basis of previously accepted amendments, the Company has determined that acceptance ofadjustments presented for additional periods through fiscal 2005 is probable and, accordingly, hasrecorded them, as well as the impacts of the adjustments accepted by the IRS, on the Consolidated andCombined Financial Statements.
Tyco International continues to complete proposed adjustments to the remainder of its U.S. federalincome tax returns. In fiscal 2009, certain proposed adjustments to U.S. federal income tax returnswere completed by Tyco International and in connection with these adjustments, the Company recordeda $97 million increase in income tax liabilities, a $10 million increase in deferred tax assets, a$60 million increase in the receivable from Tyco International and Covidien in connection with the TaxSharing Agreement, and a $27 million charge to contributed surplus. In fiscal 2008, certain proposedadjustments to U.S. federal income tax returns were completed by Tyco International and presented tothe IRS. As a result, in fiscal 2008, the Company recorded a $225 million decrease in income taxliabilities, a $42 million decrease in deferred tax assets, a $140 million decrease in the receivable fromTyco International and Covidien in connection with the Tax Sharing Agreement, a $57 million increasein the indemnification liability to Tyco International and Covidien, and a $14 million charge tocontributed surplus. See Note 12 for additional information regarding the indemnification liability toTyco International and Covidien.
In fiscal 2008, Tyco International, Covidien, and the Company completed and filed certain fiscal2007 U.S. consolidated federal and state income tax returns which included a combination of TycoInternational, Covidien, and the Company’s subsidiaries. As a result, the Company recorded a$66 million decrease in income tax liabilities with a corresponding offset to the income tax receivable, a$44 million decrease in the receivable from Tyco International and Covidien and a $42 million decreasein the payable to Tyco International and Covidien pursuant to the Tax Sharing Agreement, a$30 million increase in contributed surplus, and a $32 million net adjustment to other related taxaccounts.
104
TYCO ELECTRONICS LTD.
NOTES TO CONSOLIDATED AND COMBINED FINANCIAL STATEMENTS (Continued)
15. Commitments and Contingencies (Continued)
As the Company’s tax return positions continue to be updated for periods prior to Separation,additional adjustments may be identified and recorded on the Consolidated and Combined FinancialStatements. While the final adjustments cannot be determined until the income tax return amendmentprocess is completed, the Company believes that any resulting adjustments will not have a materialimpact on its results of operations, financial position, or cash flows. Additionally, adjustments may berecorded to shareholders’ equity in the future for the impact of filing final or amended income taxreturns in certain jurisdictions where those returns include a combination of Tyco International,Covidien, and/or the Company’s subsidiaries for the periods prior to the Separation.
During fiscal 2007, the IRS concluded its field examination of certain of Tyco International’s U.S.federal income tax returns for the years 1997 through 2000 and issued anticipated Revenue AgentReports which reflect the IRS’ determination of proposed tax adjustments for the periods under audit.Tyco International has agreed with the IRS on adjustments totaling $498 million, with an estimatedcash impact of $458 million which was paid by Tyco International during fiscal 2007. The Company’sportion of this payment was $163 million. It is the Company’s understanding that Tyco Internationalhas appealed other proposed adjustments totaling approximately $1 billion and is vigorously defendingits prior filed tax return positions. Additionally, the IRS proposed civil fraud penalties against TycoInternational arising from alleged actions of former executives in connection with certain intercompanytransfers of stock in 1998 and 1999. Any penalty imposed would be subject to sharing with TycoInternational and Covidien under the Tax Sharing Agreement. It is the Company’s understanding thatTyco International is vigorously opposing the assertion of any such penalties.
It is the Company’s understanding that Tyco International has made progress during fiscal 2009towards resolving several of the disputed tax issues for the years 1997 through 2000 and it could reachagreement with the IRS on these matters within the next twelve months. During the fourth quarter offiscal 2009, Tyco International settled a matter with the IRS concerning certain tax deductions claimedon Tyco International’s income tax returns for the years 2001 through 2004. As a result of thissettlement, the Company recorded a $28 million income tax charge in the fourth quarter of fiscal 2009to reflect the disallowance of a portion of these deductions. The IRS continues to audit certain TycoInternational income tax returns for the years 2001 through 2004.
The Company continues to believe that the amounts recorded in its Consolidated and CombinedFinancial Statements relating to the matters discussed above are appropriate. However, the ultimateresolution is uncertain and could result in a material impact to the Company’s results of operations,financial position, or cash flows.
Environmental Matters
The Company is involved in various stages of investigation and cleanup related to environmentalremediation matters at a number of sites. The ultimate cost of site cleanup is difficult to predict giventhe uncertainties regarding the extent of the required cleanup, the interpretation of applicable laws andregulations, and alternative cleanup methods. As of fiscal year end 2009, the Company concluded thatit was probable that it would incur remedial costs in the range of approximately $13 million to$26 million. As of fiscal year end 2009, the Company concluded that the best estimate within this rangeis approximately $16 million, of which $5 million is included in accrued and other current liabilities and$11 million is included in other liabilities on the Consolidated Balance Sheet. In view of the Company’sfinancial position and reserves for environmental matters of $16 million, the Company believes that anypotential payment of such estimated amounts will not have a material adverse effect on its results ofoperations, financial position, or cash flows.
105
TYCO ELECTRONICS LTD.
NOTES TO CONSOLIDATED AND COMBINED FINANCIAL STATEMENTS (Continued)
15. Commitments and Contingencies (Continued)
Matters Related to the Company’s Former Wireless Systems Business
Certain liabilities and contingencies related to the Company’s former Wireless Systems businesswere retained by the Company when this business was sold in the third quarter of fiscal 2009. Theseinclude certain retained liabilities related to the State of New York contract and a contingent purchaseprice commitment related to the acquisition of Com-Net by the Wireless Systems business in 2001. Seeadditional information below. Also, see Note 5 for additional information regarding the divestiture ofthe Wireless Systems business.
State of New York Contract
On September 19, 2005, the Company was awarded a twenty-year lease contract with the State ofNew York to construct, operate, and maintain a statewide wireless communications network for use bystate and municipal first responders. On August 29, 2008, the Company was served by the State with adefault notice related to the first regional network, pursuant to the contract. Under the terms of thecontract, the Company had 45 days to rectify the purported deficiencies noted by the State. OnOctober 16, 2008, the Company informed the State that all technical deficiencies had been remediatedand the system was operating in accordance with the contract specifications and certified the systemready for testing. The State conducted further testing during November and December 2008. OnJanuary 15, 2009, the State notified the Company that, in the State’s opinion, the Company had notfully remediated the issues cited by the State and it had determined that the Company was in defaultof the contract and that it had exercised its right to terminate the contract. The State contends that ithas the right under the contract to recoup costs incurred by the State in conjunction with theimplementation of the network, and as a result of this contention, on January 16, 2009, the State drewdown $50 million against an irrevocable standby letter of credit funded by the Company. The State hasthe ability to draw up to an additional $50 million against the standby letter of credit, although theCompany disputes that the State has any basis to do so.
On February 13, 2009, the Company filed a claim in the New York Court of Claims, seeking over$100 million in damages, and alleging a number of causes of action, including breach of contract, unjustenrichment, defamation, conversion, breach of the covenant of good faith and fair dealing, theimposition of a constructive trust, and seeking a declaration that the State terminated the contract ‘‘forconvenience.’’ On September 25, 2009, the Court granted the State’s motion to dismiss all counts of thecomplaint, with the exception of the breach of contract claims. On November 16, 2009, the State filedan answer to the complaint and counterclaim. The counterclaim asserts a claim for breach of contractand alleges that the State has incurred damages in excess of $275 million. The Company believes thatthe counterclaim is without merit and intends to vigorously pursue its claims in this matter. The partiesare now proceeding with discovery.
As a result of these actions, in the first quarter of fiscal 2009, the Company recorded pre-taxcharges totaling $111 million associated with this contract. These charges are reflected in income (loss)from discontinued operations on the Consolidated and Combined Statement of Operations as a resultof the Company’s sale of the Wireless Systems business. See Note 5 for further discussion ofdiscontinued operations and the sale of the Wireless Systems business. The charges included animpairment charge of $61 million to write-off all costs incurred in constructing the network as well as acharge equal to the amount drawn by the State against the standby letter of credit of $50 million. Theassets related to the impairment charge were previously reflected primarily as inventory on the
106
TYCO ELECTRONICS LTD.
NOTES TO CONSOLIDATED AND COMBINED FINANCIAL STATEMENTS (Continued)
15. Commitments and Contingencies (Continued)
Consolidated Balance Sheet. The Company has not recognized any revenue related to the leasecontract.
Com-Net
At September 25, 2009, the Company had a contingent purchase price commitment of $80 millionrelated to its fiscal 2001 acquisition of Com-Net. This represents the maximum amount payable to theformer shareholders of Com-Net only after the construction and installation of a communicationssystem for the State of Florida is finished and the State of Florida has approved the system based onthe guidelines set forth in the contract. Under the terms of the purchase and sale agreement, theCompany does not believe it has any obligation to the sellers. However, the sellers have contested theCompany’s position and initiated a lawsuit in June 2006 in the Court of Common Pleas in AlleghenyCounty, Pennsylvania, which is in the motion pleading and discovery phase. A liability for thiscontingency has not been recorded on the Consolidated and Combined Financial Statements as theCompany does not believe that any payment is probable or estimable at this time.
16. Fair Value Measurements
The Company adopted ASC 820 (Fair Value Measurements and Disclosures) on September 27,2008. ASC 820 defines fair value as the exchange price that would be received for an asset or paid totransfer a liability in the principal or most advantageous market for the asset or liability in an orderlytransaction between market participants. The Company will adopt the provisions of ASC 820 fornonfinancial assets and liabilities in fiscal 2010; adoption will not have a material impact on theCompany’s results of operations, financial position, or cash flows.
ASC 820 specifies a fair value hierarchy based upon the observability of the inputs utilized in thevaluation. Observable inputs (highest level) reflect market data obtained from independent sources,while unobservable inputs (lowest level) reflect internally developed market assumptions. In accordancewith ASC 820, fair value measurements are classified under the following hierarchy:
• Level 1—Quoted prices in active markets for identical assets and liabilities.
• Level 2—Quoted prices in active markets for similar assets and liabilities, or other inputs thatare observable for the asset or liability, either directly or indirectly, for substantially the full termof the financial instrument.
• Level 3—Unobservable inputs that are supported by little or no market activity and that aresignificant to the fair value of the assets and liabilities. This includes certain pricing models,discounted cash flows methodologies and similar techniques that use significant unobservableinputs.
The adoption of the fair value provisions of ASC 820 had no effect on the Company’s results ofoperations, financial position, or cash flows.
107

TYCO ELECTRONICS LTD.
NOTES TO CONSOLIDATED AND COMBINED FINANCIAL STATEMENTS (Continued)
16. Fair Value Measurements (Continued)
Assets and liabilities recorded at fair value were as follows:
Fair Value MeasurementsUsing Inputs Considered as Fair Value at
Description Level 1 Level 2 Level 3 September 25, 2009
(in millions)
Assets:Commodity swap contracts . . . . . . . . . . . . . . . . . . . . . . . . $ 1 $— $— $ 1Foreign currency contracts . . . . . . . . . . . . . . . . . . . . . . . . . — 3 — 3Rabbi trust assets . . . . . . . . . . . . . . . . . . . . . . . . . . . . . . . 76 — — 76
Total assets at fair value . . . . . . . . . . . . . . . . . . . . . . . . . . $77 $ 3 $— $80
Liabilities:Foreign currency contracts . . . . . . . . . . . . . . . . . . . . . . . . . $— $ 4 $— $ 4
The Company does not have significant financial assets or liabilities that are measured at fair valueon a non-recurring basis.
The following is a description of the valuation methodologies used for the respective assets andliabilities measured at fair value:
• Commodity swap contracts—Fair value of these assets and liabilities is determined using quotedfutures exchanges (level 1).
• Foreign currency contracts—Fair value of these assets and liabilities is determined based onobservable market transactions of spot currency rates and forward rates (level 2).
• Rabbi trust assets—Rabbi trust assets are comprised of marketable debt and equity securitiesthat are marked to fair value based on unadjusted quoted prices in active markets (level 1).
The majority of derivatives entered into by the Company are valued using the over-the-counterquoted market prices for similar instruments. The Company does not believe that fair values of thesederivative instruments materially differ from the amounts that could be realized upon settlement ormaturity.
17. Related Party Transactions
Trade Activity
Prior to Separation, the Company sold certain of its manufactured products consisting primarily ofconnectors and cable assemblies to Tyco International and its affiliates, at prices which approximatedfair value. Sales to Tyco International and its affiliates, which are included in net sales on theConsolidated and Combined Statements of Operations, were $60 million during the first nine monthsof fiscal 2007.
Debt Related Allocations
The Company was allocated a portion of Tyco International’s net interest expense and loss onretirement of debt in fiscal 2007. See Note 11 for further information regarding these allocations.
108
TYCO ELECTRONICS LTD.
NOTES TO CONSOLIDATED AND COMBINED FINANCIAL STATEMENTS (Continued)
17. Related Party Transactions (Continued)
Allocated Expenses
In fiscal 2007, the Company was allocated a net charge from Tyco International of $887 millionrelated to the class action settlement. See Note 15 for further information regarding the class actionsettlement.
Prior to Separation, the Company was allocated general corporate overhead expenses from TycoInternational for corporate-related functions based on a pro-rata percentage of Tyco International’sconsolidated net revenue. General corporate overhead expenses primarily related to centralizedcorporate functions, including treasury, tax, legal, internal audit, human resources, and riskmanagement functions. During fiscal 2007, the Company was allocated $152 million of generalcorporate overhead expenses incurred by Tyco International, which are included within selling, general,and administrative expenses on the Consolidated and Combined Statement of Operations.
As discussed in Note 1, the Company believes the assumptions and methodologies underlying theallocation of general corporate overhead expenses and net class action settlement costs from TycoInternational were reasonable. However, such expenses may not be indicative of the actual level ofexpenses that would have been incurred by the Company had it been operating as an independent,publicly-traded company during the period prior to Separation.
Transactions with Tyco Electronics’ and Tyco International’s Directors
During fiscal 2009, 2008, and 2007, the Company engaged in commercial transactions in thenormal course of business with companies where Tyco Electronics’ directors were employed and servedas officers. Purchases from and sales to such companies were not material during each of these periods.In addition, during the period prior to the Separation in fiscal 2007, the Company engaged incommercial transactions in the normal course of business with companies where Tyco International’sdirectors were employed and served as officers. Tyco Electronics’ purchases from and sales to suchcompanies were not material in pre-Separation fiscal 2007.
18. Income Taxes
The Company’s operations are conducted through its various subsidiaries in a number of countriesthroughout the world. The Company has provided for income taxes based upon the tax laws and ratesin the countries in which its operations are conducted and income and loss from operations is subjectto taxation. In fiscal 2009, the Company changed its place of incorporation from Bermuda toSwitzerland. The Company does not expect the change to materially impact its tax provision or cash taxburden.
109
TYCO ELECTRONICS LTD.
NOTES TO CONSOLIDATED AND COMBINED FINANCIAL STATEMENTS (Continued)
18. Income Taxes (Continued)
Significant components of the income tax provision (benefit) for fiscal 2009, 2008, and 2007 wereas follows:
Fiscal
2009 2008 2007
(in millions)
Current:United States:
Federal . . . . . . . . . . . . . . . . . . . . . . . . . . . . . . . . $ (92) $ 132 $ 45State . . . . . . . . . . . . . . . . . . . . . . . . . . . . . . . . . . (16) (20) —
Non-U.S. . . . . . . . . . . . . . . . . . . . . . . . . . . . . . . . . 115 264 276
Current income tax provision (benefit) . . . . . . . . . . . 7 376 321
Deferred:United States:
Federal . . . . . . . . . . . . . . . . . . . . . . . . . . . . . . . . (490) 116 151State . . . . . . . . . . . . . . . . . . . . . . . . . . . . . . . . . . (12) 34 (9)
Non-U.S. . . . . . . . . . . . . . . . . . . . . . . . . . . . . . . . . (81) 14 2
Deferred income tax provision (benefit) . . . . . . . . . . (583) 164 144
$ (576) $ 540 $465
The U.S. and non-U.S. components of income (loss) from continuing operations before incometaxes and minority interest for 2009, 2008, and 2007 were as follows:
Fiscal
2009 2008 2007
(in millions)
U.S. . . . . . . . . . . . . . . . . . . . . . . . . . . . . . . . . . . . . . $(3,813) $ 271 $282Non-U.S. . . . . . . . . . . . . . . . . . . . . . . . . . . . . . . . . . . 143 1,801 (25)
Income (loss) from continuing operations beforeincome taxes and minority interest . . . . . . . . . . . . . . $(3,670) $2,072 $257
110
TYCO ELECTRONICS LTD.
NOTES TO CONSOLIDATED AND COMBINED FINANCIAL STATEMENTS (Continued)
18. Income Taxes (Continued)
The reconciliation between U.S. federal income taxes at the statutory rate and the Company’sprovision (benefit) for income taxes on continuing operations for fiscal 2009, 2008, and 2007 was asfollows:
Fiscal
2009 2008 2007
(in millions)
Notional U.S. federal income tax expense (benefit) at thestatutory rate . . . . . . . . . . . . . . . . . . . . . . . . . . . . . . . . . $(1,285) $ 725 $ 90
Adjustments to reconcile to the income tax provision(benefit):U.S. state income tax provision (benefit), net . . . . . . . . . (18) 2 (5)Other (income) expense—Tax Sharing Agreement . . . . . . 24 (198) (5)Class action settlement . . . . . . . . . . . . . . . . . . . . . . . . . . 26 8 312Divestitures and impairments . . . . . . . . . . . . . . . . . . . . . 734 21 —Proposed adjustments to prior year tax returns . . . . . . . . — (4) 9Tax law changes . . . . . . . . . . . . . . . . . . . . . . . . . . . . . . . (21) 5 (11)Tax credits . . . . . . . . . . . . . . . . . . . . . . . . . . . . . . . . . . . (19) (8) (6)Non-U.S. net earnings(1) . . . . . . . . . . . . . . . . . . . . . . . . . (127) (121) (99)Nondeductible charges . . . . . . . . . . . . . . . . . . . . . . . . . . 6 10 5Change in accrued income tax liabilities . . . . . . . . . . . . . 48 100 53Allocated loss (gain) on retirement of debt . . . . . . . . . . . (7) — 81Valuation allowance . . . . . . . . . . . . . . . . . . . . . . . . . . . . 48 23 26Adjustment to tax account balances . . . . . . . . . . . . . . . . — (33) —Other . . . . . . . . . . . . . . . . . . . . . . . . . . . . . . . . . . . . . . 15 10 15
Provision (benefit) for income taxes . . . . . . . . . . . . . . . . $ (576) $ 540 $465
(1) Excludes asset impairments, nondeductible charges, and other items which are broken out separately in the table.
The tax provision for fiscal 2009 was impacted by the $3,547 million pre-tax impairment ofgoodwill for which a partial tax benefit of $523 million was recorded, a $28 million charge related tothe settlement of a tax matter (see Note 15 for additional information), a $144 million pre-tax chargerelated to pre-Separation securities litigation for which a partial tax benefit of $25 million wasrecorded, and a $24 million detriment related to a $68 million pre-tax expense recognized pursuant tothe Company’s Tax Sharing Agreement with Tyco International and Covidien. See Notes 15 and 19 foradditional information regarding the Tax Sharing Agreement. Additionally, the fiscal 2009 tax provisionincluded adjustments related to prior years tax returns, including a $49 million tax benefit, as discussedbelow. The $49 million tax benefit is reflected in change in accrued income tax liabilities in fiscal 2009in the reconciliation above.
During fiscal 2009, in connection with the IRS examination of the Company’s 2001 through 2004U.S. federal income tax returns, certain favorable adjustments were identified and presented to theIRS. These adjustments resulted in a net $49 million tax benefit included in the tax provision, a$42 million increase to deferred tax assets, and a $7 million reduction of income tax liabilities. TheCompany concluded these items were not material to current or prior years financial statements and,accordingly, recorded them during the fourth quarter of fiscal 2009.
111
TYCO ELECTRONICS LTD.
NOTES TO CONSOLIDATED AND COMBINED FINANCIAL STATEMENTS (Continued)
18. Income Taxes (Continued)
The provision for fiscal 2008 includes a benefit of $198 million primarily related to the pre-taxincome of $545 million recognized in connection with the adoption of the uncertain tax positionprovisions of ASC 740, for which no tax was provided. The provision was also impacted by increasedaccruals in fiscal 2008 of interest related to uncertain tax positions partially offset by a $42 millionbenefit associated with a favorable settlement with a taxing authority for certain pre-Separation taxissues. In addition, the provision for fiscal 2008 reflects the benefits of increased profitability inoperations in lower tax rate jurisdictions, a $33 million benefit related to adjustments to tax accountbalances, a $25 million increase in the valuation allowance related to restructuring charges, and a$22 million tax detriment recorded in connection with the goodwill impairment charge for which a taxbenefit was not fully realized.
During fiscal 2008, the Company, in connection with the implementation of certain new controlprocesses, completed the analysis and reconciliation of its tax accounts. As a result of this analysis, theCompany adjusted its tax account balances and recorded a $34 million reduction in income taxliabilities, a $1 million increase in deferred tax liabilities, and a $33 million benefit in the income taxprovision.
In fiscal 2007, no tax benefits were recorded related to the pre-tax charges for the class actionsettlement and loss on retirement of debt. The net increase of $26 million of deferred tax assetvaluation allowances in fiscal 2007 reflects the tax impacts of increased borrowings as a result of theclass action settlement and the Company’s Separation from Tyco International.
112
TYCO ELECTRONICS LTD.
NOTES TO CONSOLIDATED AND COMBINED FINANCIAL STATEMENTS (Continued)
18. Income Taxes (Continued)
Deferred income taxes result from temporary differences between the amount of assets andliabilities recognized for financial reporting and tax purposes. The components of the net deferredincome tax asset at fiscal year end 2009 and 2008 were as follows:
Fiscal
2009 2008
(in millions)
Deferred tax assets:Accrued liabilities and reserves . . . . . . . . . . . . . . . . . . . . . . . . $ 292 $ 273Tax loss and credit carryforwards . . . . . . . . . . . . . . . . . . . . . . 4,131 2,512Inventories . . . . . . . . . . . . . . . . . . . . . . . . . . . . . . . . . . . . . . 79 46Pension and postretirement benefits . . . . . . . . . . . . . . . . . . . . 301 175Deferred revenue . . . . . . . . . . . . . . . . . . . . . . . . . . . . . . . . . . 20 43Interest . . . . . . . . . . . . . . . . . . . . . . . . . . . . . . . . . . . . . . . . . 196 227Unrecognized tax benefits . . . . . . . . . . . . . . . . . . . . . . . . . . . 413 392Other . . . . . . . . . . . . . . . . . . . . . . . . . . . . . . . . . . . . . . . . . . 16 23
5,448 3,691
Deferred tax liabilities:Intangible assets . . . . . . . . . . . . . . . . . . . . . . . . . . . . . . . . . . (368) (875)Property, plant, and equipment . . . . . . . . . . . . . . . . . . . . . . . . (86) (94)Other . . . . . . . . . . . . . . . . . . . . . . . . . . . . . . . . . . . . . . . . . . (38) (47)
(492) (1,016)
Net deferred tax asset before valuation allowance . . . . . . . . . . . . 4,956 2,675Valuation allowance . . . . . . . . . . . . . . . . . . . . . . . . . . . . . . . . . (2,487) (873)
Net deferred tax asset . . . . . . . . . . . . . . . . . . . . . . . . . . . . . . $ 2,469 $ 1,802
During fiscal 2009, tax loss and credit carryforwards increased primarily due to tax losses of$1,550 million (tax effected) generated in connection with the write-down of investments in subsidiariesin certain jurisdictions. The valuation allowance was increased by a corresponding amount due to theuncertainty of the future realization of these tax losses.
At fiscal year end 2009, the Company had approximately $1,447 million of U.S. federal and$181 million of U.S state net operating loss carryforwards (tax effected) which will expire in futureyears through 2029. In addition, at fiscal year end 2009, the Company had approximately $149 millionof U.S. federal tax credit carryforwards, of which $29 million have no expiration and $120 million willexpire in future years through 2029, and $31 million of U.S. state tax credits carryforwards which willexpire in future years through 2024. The Company also had $84 million of U.S. federal capital losscarryforwards (tax effected) expiring through 2014 at fiscal year end 2009.
At fiscal year end 2009, the Company had approximately $2,228 million of net operating losscarryforwards (tax effected) in certain non-U.S. jurisdictions, of which $1,728 million have no expirationand $500 million will expire in future years through 2023. Also, at fiscal year end 2009, there were$4 million of non-U.S. tax credit carryforwards which will expire in future years through 2023 and$7 million of non-U.S. capital loss carryforwards (tax effected) with no expiration.
113
TYCO ELECTRONICS LTD.
NOTES TO CONSOLIDATED AND COMBINED FINANCIAL STATEMENTS (Continued)
18. Income Taxes (Continued)
The valuation allowance for deferred tax assets of $2,487 million and $873 million at fiscal yearend 2009 and 2008, respectively, relates principally to the uncertainty of the utilization of certaindeferred tax assets, primarily tax loss, capital loss, and credit carryforwards in various jurisdictions. TheCompany believes that it will generate sufficient future taxable income to realize the tax benefitsrelated to the remaining net deferred tax assets on its Consolidated Balance Sheet. The valuationallowance was calculated in accordance with the provisions of ASC 740 which require that a valuationallowance be established or maintained when it is more likely than not that all or a portion of deferredtax assets will not be realized. At fiscal year end 2009, approximately $40 million of the valuationallowance relates to share-based compensation and will be recorded to equity if certain net operatinglosses and tax credit carryforwards are utilized.
The calculation of the Company’s tax liabilities includes estimates for uncertainties in theapplication of complex tax regulations across multiple global jurisdictions where the Company conductsits operations. Under the uncertain tax position provisions of ASC 740, the Company recognizesliabilities for tax as well as related interest for issues in the U.S. and other tax jurisdictions based on itsestimate of whether, and the extent to which, additional taxes and related interest will be due. Thesetax liabilities and related interest are reflected net of the impact of related tax loss carryforwards assuch tax loss carryforwards will be applied against these tax liabilities and will reduce the amount ofcash tax payments due upon the eventual settlement with the tax authorities. These estimates maychange due to changing facts and circumstances; however, due to the complexity of these uncertainties,the ultimate resolution may result in a settlement that differs from the Company’s current estimate ofthe tax liabilities and related interest. Further, management has reviewed with tax counsel the issuesraised by certain taxing authorities and the adequacy of these recorded amounts. If the Company’scurrent estimate of tax and interest liabilities is less than the ultimate settlement, an additional chargeto income tax expense may result. If the Company’s current estimate of tax and interest liabilities ismore than the ultimate settlement, income tax benefits may be recognized. Substantially all of these taxliabilities and related interest are recorded in income taxes on the Consolidated Balance Sheet aspayment is not expected within one year.
The Company has provided income taxes for earnings that are currently distributed as well as thetaxes associated with several subsidiaries’ earnings that are expected to be distributed in fiscal 2010. Noadditional provision has been made for U.S. or non-U.S. income taxes on the undistributed earnings ofsubsidiaries or for unrecognized deferred tax liabilities for temporary differences related to basisdifferences in investments in subsidiaries, as such earnings are expected to be permanently reinvested,the investments are essentially permanent in duration, or the Company has concluded that noadditional tax liability will arise as a result of the distribution of such earnings. As of September 25,2009, certain subsidiaries had approximately $14 billion of undistributed earnings that the Companyintends to permanently reinvest. A liability could arise if the Company’s intention to permanentlyreinvest such earnings were to change and amounts are distributed by such subsidiaries or if suchsubsidiaries are ultimately disposed. It is not practicable to estimate the additional income taxes relatedto permanently reinvested earnings or the basis differences related to investments in subsidiaries.
Uncertain Tax Position Provisions of ASC 740
Effective September 29, 2007, the beginning of fiscal 2008, the Company adopted the uncertain taxposition provisions of ASC 740. In connection with the adoption, the Company recorded a net increasein contingent tax liabilities of $1,197 million, an increase in deferred tax assets of $648 million, and acorresponding decrease in the opening balance of accumulated earnings of $549 million. Furthermore,
114
TYCO ELECTRONICS LTD.
NOTES TO CONSOLIDATED AND COMBINED FINANCIAL STATEMENTS (Continued)
18. Income Taxes (Continued)
pursuant to the Tax Sharing Agreement, certain contingent tax liabilities related to unresolved taxmatters are subject to sharing between Tyco International, Covidien, and the Company. See Note 15 foradditional information regarding responsibilities for unresolved pre-Separation tax matters. TycoInternational and Covidien are contractually obligated for $531 million of the Company’s net increasein contingent tax liabilities recorded in connection with its adoption of the uncertain tax positionprovisions of ASC 740. Accordingly, the Company recorded this amount in 2008 as other income andrecorded the related increase in the receivable from Tyco International and Covidien for sharedcontingent tax liabilities. In addition, in connection with the adoption of the uncertain tax positionprovisions of ASC 740, the Company reassessed and decreased its guarantee liabilities pursuant to ASC460 liability to Tyco International and Covidien and recorded $14 million of other income. See Note 12for additional information regarding the Company’s indemnifications under the Tax Sharing Agreement.These adjustments are summarized in the following table:
Adoption of Uncertain Tax Position Provisions of ASC 740 and Related Tax Sharing AgreementIncome:
Adjustment toOpening
Balance ofAccumulated Tax Sharing
Earnings Income
(in millions)
Contingent tax liabilities . . . . . . . . . . . . . . . . . . . . . . . . . $(1,197) $ 531Deferred tax assets . . . . . . . . . . . . . . . . . . . . . . . . . . . . . 648 —Guarantee liabilities pursuant to ASC 460 . . . . . . . . . . . . . — 14
$ (549) $ 545
As of September 25, 2009, the Company had total unrecognized tax benefits of $1,799 million. Ifrecognized in future periods, $1,732 million of these currently unrecognized tax benefits would impactthe income tax provision and effective tax rate. Of the remaining currently unrecognized tax benefits,$10 million is associated with discontinued operations. As of September 26, 2008, the Company hadtotal unrecognized tax benefits of $2,009 million. If recognized in future periods, $1,773 million of thesecurrently unrecognized tax benefits would impact the income tax provision and effective tax rate. Of theremaining currently unrecognized tax benefits, $57 million is associated with discontinued operations.The following table summarizes the activity related to the Company’s unrecognized tax benefits:
Fiscal
2009 2008
(in millions)
Balance at beginning of fiscal year . . . . . . . . . . . . . . . . . . $ 2,009 $1,906Adjustments to beginning balance . . . . . . . . . . . . . . . . . . — 123Additions related to prior periods tax positions . . . . . . . . . 57 259Reductions related to prior periods tax positions . . . . . . . . (292) (312)Additions related to current period tax positions . . . . . . . . 29 42Settlements . . . . . . . . . . . . . . . . . . . . . . . . . . . . . . . . . . . (2) (1)Reductions due to lapse of applicable statute of limitations (2) (8)Balance at end of fiscal year . . . . . . . . . . . . . . . . . . . . . . $ 1,799 $2,009
115
TYCO ELECTRONICS LTD.
NOTES TO CONSOLIDATED AND COMBINED FINANCIAL STATEMENTS (Continued)
18. Income Taxes (Continued)
The Company records accrued interest as well as penalties related to uncertain tax positions aspart of the provision for income taxes. As of September 25, 2009, the Company had recorded$1,215 million of accrued interest and penalties related to uncertain tax positions on the ConsolidatedBalance Sheet of which $1,214 million was recorded in income taxes and $1 million was recorded inaccrued and other current liabilities. During fiscal 2009 and 2008, the Company recognized $82 millionand $115 million, respectively, of interest and penalties on the Consolidated and Combined Statementsof Operations. As of September 26, 2008, the balance of accrued interest and penalties was$1,110 million of which $1,106 million was recorded in income taxes and $4 million was recorded inaccrued and other current liabilities.
In fiscal 2007, the IRS concluded its field examination of certain of Tyco International’s U.S.federal income tax returns for the years 1997 through 2000. Tyco International is in the process ofappealing certain tax adjustments proposed by the IRS related to this period. In fiscal 2008, the IRScommenced its field examination of certain Tyco International U.S. federal income tax returns for theyears 2001 through 2004. Tyco International’s U.S. federal tax filings for years subsequent to 2004 alsoremain open to examination by the IRS. See Note 15 for additional information regarding the status ofIRS examinations.
The Company files income tax returns on a combined, unitary, or stand-alone basis in multiplestate and local jurisdictions, which generally have statutes of limitations ranging from 3 to 4 years.Various state and local income tax returns are currently in the process of examination or administrativeappeal.
The Company’s non-U.S. subsidiaries file income tax returns in the countries in which they haveoperations. Generally, these countries have statutes of limitations ranging from 3 to 10 years. Variousnon-U.S. subsidiary income tax returns are currently in the process of examination by taxing authorities.
116
TYCO ELECTRONICS LTD.
NOTES TO CONSOLIDATED AND COMBINED FINANCIAL STATEMENTS (Continued)
18. Income Taxes (Continued)
As of September 25, 2009, under applicable statutes, the following tax years remained subject toexamination in the major tax jurisdictions indicated:
Jurisdiction Open Years
Belgium . . . . . . . . . . . . . . . . . . . . . . . . . . . . . . . . . . . . . . . . . 2006 through 2009Brazil . . . . . . . . . . . . . . . . . . . . . . . . . . . . . . . . . . . . . . . . . . . 2004 through 2009Canada . . . . . . . . . . . . . . . . . . . . . . . . . . . . . . . . . . . . . . . . . . 2002 through 2009China . . . . . . . . . . . . . . . . . . . . . . . . . . . . . . . . . . . . . . . . . . . 1999 through 2009Czech Republic . . . . . . . . . . . . . . . . . . . . . . . . . . . . . . . . . . . . 2006 through 2009France . . . . . . . . . . . . . . . . . . . . . . . . . . . . . . . . . . . . . . . . . . 2007 through 2009Germany . . . . . . . . . . . . . . . . . . . . . . . . . . . . . . . . . . . . . . . . 2003 through 2009Hong Kong . . . . . . . . . . . . . . . . . . . . . . . . . . . . . . . . . . . . . . . 2003 through 2009India . . . . . . . . . . . . . . . . . . . . . . . . . . . . . . . . . . . . . . . . . . . 2001 through 2009Italy . . . . . . . . . . . . . . . . . . . . . . . . . . . . . . . . . . . . . . . . . . . . 2004 through 2009Japan . . . . . . . . . . . . . . . . . . . . . . . . . . . . . . . . . . . . . . . . . . . 2003 through 2009Korea . . . . . . . . . . . . . . . . . . . . . . . . . . . . . . . . . . . . . . . . . . . 2004 through 2009Luxembourg . . . . . . . . . . . . . . . . . . . . . . . . . . . . . . . . . . . . . . 2004 through 2009Netherlands . . . . . . . . . . . . . . . . . . . . . . . . . . . . . . . . . . . . . . 2006 through 2009Portugal . . . . . . . . . . . . . . . . . . . . . . . . . . . . . . . . . . . . . . . . . 2006 through 2009Singapore . . . . . . . . . . . . . . . . . . . . . . . . . . . . . . . . . . . . . . . . 2000 through 2009Spain . . . . . . . . . . . . . . . . . . . . . . . . . . . . . . . . . . . . . . . . . . . 2004 through 2009Switzerland . . . . . . . . . . . . . . . . . . . . . . . . . . . . . . . . . . . . . . . 2008 through 2009United Kingdom . . . . . . . . . . . . . . . . . . . . . . . . . . . . . . . . . . . 2007 through 2009United States, federal and state and local . . . . . . . . . . . . . . . . . 1994 through 2009
In most jurisdictions, taxing authorities retain the ability to review prior tax years and to adjust anynet operating loss and tax credit carryforwards from these years that are utilized in a subsequentperiod.
Although it is difficult to predict the timing or results of certain pending examinations, it is theCompany’s understanding that Tyco International has made progress during fiscal 2009 towardsresolving with the IRS certain disputed tax adjustments related to Tyco International’s U.S. federalincome tax returns for the years 1997 through 2000. Accordingly, Tyco International and the IRS couldreach agreement on these matters within the next twelve months. However, the ultimate resolution isuncertain and it is not possible to estimate the impact of an agreement with respect to the amount ofunrecognized tax benefits on the Consolidated Balance Sheet as of September 25, 2009.
The Company is not aware of any other matters that would result in significant changes to theamount of unrecognized tax benefits reflected on the Consolidated Balance Sheet as of September 25,2009.
19. Other Income (Expense), Net
In fiscal 2009, the Company recorded net other expense of $48 million, consisting of $68 million ofexpense pursuant to the Tax Sharing Agreement with Tyco International and Covidien, a $22 milliongain on the retirement of debt, and $2 million of unrealized losses on rabbi trust assets. The$68 million of expense is attributable to a net reduction of an indemnification asset primarily as a
117

TYCO ELECTRONICS LTD.
NOTES TO CONSOLIDATED AND COMBINED FINANCIAL STATEMENTS (Continued)
19. Other Income (Expense), Net (Continued)
result of the settlement of various matters with the IRS. See Note 15 for further information regardingthe Tax Sharing Agreement. See Note 11 for additional information regarding the gain on retirement ofdebt.
In fiscal 2008, the Company recorded other income of $567 million pursuant to the Tax SharingAgreement with Tyco International and Covidien, of which $545 million ($1.13 for basic earnings pershare and $1.12 for diluted earnings per share in fiscal 2008) related to certain incremental taxliabilities recorded by the Company in connection with the adoption of the uncertain tax positionprovisions of ASC 740. See Note 18 for additional information regarding the adoption of the uncertaintax position provisions of ASC 740.
Net other expense of $219 million in fiscal 2007 includes an allocation from Tyco International of$232 million for loss on retirement of debt. See Note 11 for additional information. Additionally, infiscal 2007, the Company recorded other income of $13 million pursuant to the Tax Sharing Agreementwith Tyco International and Covidien.
20. Earnings (Loss) Per Share
The computation of basic earnings (loss) per share is based on the Company’s net income (loss)divided by the basic weighted-average number of common shares outstanding. The computation ofdiluted earnings (loss) per share is based on the Company’s net income (loss) divided by the weighted-average number of common shares outstanding adjusted for potentially dilutive unexercised shareoptions and non-vested restricted share awards. The following table sets forth the denominators of thebasic and diluted earnings (loss) per share computations:
Fiscal
2009 2008 2007
(in millions)
Weighted-average shares outstanding:Basic . . . . . . . . . . . . . . . . . . . . . . . . . . . . . . . . . . . . . . . . . . . 459 483 497Share options and restricted share awards . . . . . . . . . . . . . . . . — 3 —
Diluted . . . . . . . . . . . . . . . . . . . . . . . . . . . . . . . . . . . . . . . . . 459 486 497
For fiscal 2009, 2008, and 2007, certain share options were not included in the computation ofdiluted earnings (loss) per share because the underlying exercise prices were greater than the averagemarket prices of Tyco Electronics’ common shares and inclusion would be antidilutive. Such shares notincluded in the computation of diluted earnings (loss) per share totaled 20 million, 21 million, and20 million as of September 25, 2009, September 26, 2008, and September 28, 2007, respectively.
For fiscal 2009 and 2007, non-vested restricted share awards and options to purchase TycoElectronics’ common shares with the underlying exercise prices less than the average market priceswere outstanding, but were excluded from the calculations of diluted loss per share as inclusion ofthese securities would have been antidilutive. Such shares not included in the computation of dilutedloss per share totaled 1 million and 3 million as of September 25, 2009 and September 28, 2007,respectively.
118
TYCO ELECTRONICS LTD.
NOTES TO CONSOLIDATED AND COMBINED FINANCIAL STATEMENTS (Continued)
21. Equity
Change of Domicile
Effective June 25, 2009, the Company changed its jurisdiction of incorporation from Bermuda toSwitzerland. In connection with the Change of Domicile and in accordance with the laws ofSwitzerland, the par value of the Company’s common shares increased from $0.20 per share to 2.60Swiss Francs (‘‘CHF’’) per share (or $2.40 based on an exchange rate in effect on June 22, 2009). TheChange of Domicile was approved at a special meeting of shareholders held on June 22, 2009. Thefollowing steps occurred in connection with the Change of Domicile, which did not result in a changeto total Shareholders’ Equity:
1) the par value of common shares was increased from $0.20 to CHF 2.60 through a 1-for-12reverse share split, followed by the issuance of 11 fully paid bonus shares so that the samenumber of shares were outstanding before and after the Change of Domicile but with anincreased par value per share, which reduced contributed surplus by $1.1 billion with acorresponding increase to common shares;
2) the cancellation of approximately 32 million shares held in treasury;
3) the elimination of share premium with a corresponding increase to contributed surplus, all ofwhich was designated as freely distributable reserves for Swiss corporate law purposes; and
4) the elimination of 125 million authorized preferred shares, none of which were issued andoutstanding.
Preferred Shares
In connection with the Change of Domicile, as discussed above, all authorized preferred shareswere eliminated. At September 26, 2008, the Company had authorized 125,000,000 preferred shares,par value of $0.20, none of which were issued and outstanding.
Common Shares
As a result of the adoption of the Company’s new articles of association in connection with theChange of Domicile but prior to the distribution to shareholders discussed under ‘‘Distributions toShareholders’’ below, the Company’s ordinary share capital was $1,124 million with 468 millionregistered common shares and a par value of CHF 2.60 (or $2.40 based on an exchange rate in effecton June 22, 2009). Subject to certain conditions specified in the articles of association, the shareholdershave authorized the Company’s board of directors to increase the Company’s share capital (the value,in CHF, of authorized shares multiplied by the par value), by issuing up to 234 million conditionalshares and up to 234 million authorized shares (until June 22, 2011). Although the Company states itspar value in Swiss Francs, it continues to use the U.S. Dollar as its reporting currency for preparing itsConsolidated and Combined Financial Statements.
Common Shares Held in Treasury
During the fourth quarter of fiscal 2009, the Company transferred 10 million common shares heldin treasury to a subsidiary. Shares held by the subsidiary continue to be presented as treasury shares onthe Consolidated Balance Sheet.
119
TYCO ELECTRONICS LTD.
NOTES TO CONSOLIDATED AND COMBINED FINANCIAL STATEMENTS (Continued)
21. Equity (Continued)
Prior to the Change of Domicile, approximately 32 million shares held by the Company in treasurywere cancelled, leaving 10 million shares held in treasury as of June 26, 2009. At September 26, 2008,there were 37 million shares held in treasury.
Share Premium and Contributed Surplus
As of September 26, 2008, the Company was incorporated under the laws of Bermuda. Prior to theChange of Domicile, in accordance with the Bermuda Companies Act, when the Company issuedshares for cash at a premium to their par value, the resulting premium was an increase to a sharepremium account, a non-distributable reserve. Contributed surplus, subject to certain conditions, is adistributable reserve.
Distributions to Shareholders
Under current Swiss law, distributions to shareholders made in the form of a reduction ofregistered share capital are exempt from Swiss withholding tax. Beginning on January 1, 2011, subjectto the adoption of implementing regulations and amendments to Swiss tax law, distributions toshareholders made out of contributed surplus will be exempt from Swiss withholding tax. Distributionsor dividends on the Company’s shares must be approved by the Company’s shareholders.
On June 22, 2009, the Company’s shareholders approved a cash distribution to shareholders in theform of a capital reduction to the par value of the Company’s common shares of CHF 0.17 per share.During the quarter ended September 25, 2009, the distribution was paid in U.S. Dollars at a rate of$0.16 per share. This capital reduction reduced the par value of the Company’s common shares fromCHF 2.60 (equivalent to $2.40) to CHF 2.43 (equivalent to $2.24).
Upon approval by the shareholders of the cash distribution in the form of a capital reduction, theCompany records a liability with a corresponding charge to common shares. There were no unpaiddividends and distributions to shareholders as of September 25, 2009. Dividends declared but not paidwere recorded in accrued and other current liabilities on the Consolidated Balance Sheet atSeptember 26, 2008.
Share Repurchase Program
During fiscal 2009, the Company purchased approximately 6 million of its common shares for$125 million under its share repurchase program. Also, during fiscal 2009, the Company settledpurchases of $27 million of its common shares which occurred prior to the end of fiscal 2008. In fiscal2008, the Company repurchased approximately 37 million common shares for $1,269 million under thisprogram, of which $1,242 million was paid as of September 26, 2008. No common shares wererepurchased under this program in fiscal 2007. Since inception of the share repurchase program, whichhas a current authorization of $2,000 million, the Company has purchased approximately 43 millionshares for $1,394 million.
Parent Company Investment and Separation Related Equity Adjustments
For the period prior to June 29, 2007, Tyco International’s investment in the electronics businessesis shown as parent company investment on the Consolidated and Combined Financial Statements.Parent company investment represents the historical investment of capital into the Company, the
120

TYCO ELECTRONICS LTD.
NOTES TO CONSOLIDATED AND COMBINED FINANCIAL STATEMENTS (Continued)
21. Equity (Continued)
Company’s accumulated net earnings after taxes, and the net effect of transactions with and allocationsfrom Tyco International. See Note 17 for additional information regarding the allocation to theCompany of various expenses incurred by Tyco International.
On June 29, 2007, Tyco International completed a distribution of one common share of TycoElectronics Ltd. for every four common shares of Tyco International. Following the Separation, theCompany had 497 million common shares outstanding. After the Separation adjustments were recordedon June 29, 2007, the remaining parent company investment balance, which includes all earnings priorto the Separation, was transferred to contributed surplus. Net income subsequent to the Separation isincluded in accumulated earnings.
During fiscal 2007, the Company assumed $1,091 million of contingent tax liabilities from TycoInternational and recorded a related receivable of $844 million from Tyco International and Covidiento reflect the 69% indemnification granted by each. These items were recorded as adjustments tocontributed surplus on the Consolidated and Combined Financial Statements. Certain adjustments weremade to those amounts assumed on Separation in periods subsequent to fiscal 2007.
22. Accumulated Other Comprehensive Income
The components of accumulated other comprehensive income were as follows:
Unrecognized (Loss) AccumulatedUnrealized Pension and Gain Other
Currency Gain (Loss) Postretirement on Cash ComprehensiveTranslation(1) on Securities Benefit Costs Flow Hedge Income
(in millions)
Balance at September 29, 2006 . . . . . . . $ 899 $ 1 $(230) $ — $ 670Pre-tax current period change . . . . . . 453 — 319 (53) 719Income tax expense . . . . . . . . . . . . . . — — (112) — (112)
1,352 1 (23) (53) 1,277Adoption of funded status recognition
provisions of ASC 715:Pre-tax current period change . . . . . — — (347) — (347)Income tax benefit . . . . . . . . . . . . . — — 122 — 122
Total . . . . . . . . . . . . . . . . . . . . . . . — — (225) — (225)
Balance at September 28, 2007 . . . . . . . 1,352 1 (248) (53) 1,052Pre-tax current period change . . . . . . (22) — (159) 8 (173)Income tax (expense) benefit . . . . . . . — (1) 52 (1) 50
Balance at September 26, 2008 . . . . . . . 1,330 — (355) (46) 929
Pre-tax current period change . . . . . . (206) — (416) 11 (611)Income tax benefit . . . . . . . . . . . . . . — — 137 — 137
Balance at September 25, 2009 . . . . . . . $1,124 $— $(634) $(35) $ 455
(1) Includes hedge of net investment foreign exchange gains or losses, offsetting foreign exchange gains or losses attributable tothe translation of the net investments.
121
TYCO ELECTRONICS LTD.
NOTES TO CONSOLIDATED AND COMBINED FINANCIAL STATEMENTS (Continued)
23. Share Plans
All equity awards (restricted share awards and share options) granted by the Company subsequentto Separation were granted under the Tyco Electronics Ltd. 2007 Stock and Incentive Plan, as amendedand restated (the ‘‘2007 Plan’’). The 2007 Plan is administered by the Management Development andCompensation Committee of the board of directors of Tyco Electronics, which consists exclusively ofindependent directors of Tyco Electronics and provides for the award of share options, stockappreciation rights, annual performance bonuses, long-term performance awards, restricted units,deferred stock units, restricted shares, promissory shares, and other share-based awards (collectively,‘‘Awards’’). The 2007 Plan provides for a maximum of 25 million common shares to be issued asAwards, subject to adjustment as provided under the terms of the 2007 Plan. The 2007 Plan allows forthe use of authorized but unissued shares or treasury shares to be used to satisfy such awards. As ofSeptember 25, 2009, the Company had 10 million shares available under the 2007 Plan.
Prior to the Separation on June 29, 2007, all equity awards held by Company employees weregranted by Tyco International under the Tyco International Ltd. 2004 Stock and Incentive Plan or otherTyco International equity incentive plans. Based on the grant date, type of award, and employingcompany, awards converted from Tyco International to Tyco Electronics awards in different manners.As a result of the conversion, all Tyco Electronics restricted share awards granted to employees of TycoInternational and Covidien are fully vested. Approximately 4 million vested options to purchasecommon shares of the Company are held by current or former employees of Tyco International andCovidien. All share option award conversions were done in accordance with Sections 409A and 424 ofthe Code.
Restricted Share Awards
Restricted share awards are granted subject to certain restrictions. Conditions of vesting aredetermined at the time of grant under the 2007 Plan. All restrictions on the award will lapse upondeath or disability of the employee. If the employee satisfies retirement or normal retirementrequirements, all or a portion of the award may lapse, depending on the terms and conditions of theparticular grant. Recipients of restricted shares have the right to vote such shares and receivedividends, whereas recipients of restricted units have no voting rights and receive dividend equivalents.For grants that vest based on certain specified performance criteria, the fair market value of the sharesor units is expensed over the period of performance, once achievement of criteria is deemed probable.For grants that vest through passage of time, the fair market value of the award at the time of thegrant is amortized to expense over the period of vesting. The fair value of restricted share awards isdetermined based on the market value of the Company’s shares on the grant date. Restricted shareawards generally vest in increments over a period of four years as determined by the ManagementDevelopment and Compensation Committee, or upon attainment of various levels of performance thatequal or exceed targeted levels, if applicable. The compensation expense recognized for restricted shareawards is net of estimated forfeitures.
122
TYCO ELECTRONICS LTD.
NOTES TO CONSOLIDATED AND COMBINED FINANCIAL STATEMENTS (Continued)
23. Share Plans (Continued)
Restricted share award activity for grants as of fiscal year end 2009 and changes during the yearthen ended is presented below:
Weighted-AverageNon-vested Restricted Share Awards Shares Grant-Date Fair Value
Non-vested at September 26, 2008 . . . . . . . . . . . . . 3,328,270 $36.97Granted . . . . . . . . . . . . . . . . . . . . . . . . . . . . . . . . 2,938,062 14.30Vested . . . . . . . . . . . . . . . . . . . . . . . . . . . . . . . . . (1,409,434) 35.45Forfeited . . . . . . . . . . . . . . . . . . . . . . . . . . . . . . . (604,708) 23.00
Non-vested at September 25, 2009 . . . . . . . . . . . . . 4,252,190 $23.80
The weighted-average grant-date fair value of Tyco Electronics restricted share awards grantedduring fiscal 2009, 2008, and 2007 were $14.30, $33.94, and $39.69, respectively. The weighted-averagegrant-date fair value of Tyco International restricted share awards granted to Tyco Electronicsemployees during pre-Separation fiscal 2007 was $30.34.
As of fiscal year end 2009, there was $57 million of total unrecognized compensation cost relatedto non-vested Tyco Electronics restricted share awards. That cost is expected to be recognized over aweighted-average period of 2.5 years.
Deferred Stock Units
Deferred Stock Units (‘‘DSUs’’) are notional units that are tied to the value of Tyco Electronicscommon shares with distribution deferred until termination of employment. Distribution, when made,will be in the form of actual shares. Similar to restricted share grants that vest through the passage oftime, the fair value of DSUs is determined based on the market value of the Company’s shares on thegrant date and is amortized to expense over the vesting period. Recipients of DSUs do not have theright to vote such shares and do not have the right to receive cash dividends. However, they have theright to receive dividend equivalents, which are delivered at the same time as the underlying DSUs.Conditions of vesting are determined at the time of grant. As of fiscal year end 2009 and 2008, 111,138and 53,295 vested but undistributed DSUs were outstanding, respectively. The grant-date fair value ofvested but undistributed DSU grants was expensed immediately, is included in the total share-basedcompensation cost referred to below, and was not significant during fiscal 2009, fiscal 2008, andpost-Separation fiscal 2007. There were no DSUs issued prior to Separation.
Share Options
Share options are granted to purchase Tyco Electronics common shares at prices which are equalto or greater than the market price of the common shares on the date the option is granted.Conditions of vesting are determined at the time of grant under the 2007 Plan. Options generally vestand become exercisable in equal annual installments over a period of four years and will generallyexpire 10 years after the date of grant.
123
TYCO ELECTRONICS LTD.
NOTES TO CONSOLIDATED AND COMBINED FINANCIAL STATEMENTS (Continued)
23. Share Plans (Continued)
Share option activity for grants as of fiscal year end 2009 and changes during the year then endedis presented below:
Weighted-Weighted- AverageAverage Remaining AggregateExercise Contractual Intrinsic
Shares Price Term Value
(in years) (in millions)
Outstanding at September 26, 2008 . . . . . . . . . . . . . . . 25,465,020 $43.81Granted . . . . . . . . . . . . . . . . . . . . . . . . . . . . . . . . . . 4,260,100 14.44Exercised . . . . . . . . . . . . . . . . . . . . . . . . . . . . . . . . . (62,551) 16.48Expired . . . . . . . . . . . . . . . . . . . . . . . . . . . . . . . . . . . (3,384,433) 51.77Forfeited . . . . . . . . . . . . . . . . . . . . . . . . . . . . . . . . . . (643,041) 29.45
Outstanding at September 25, 2009 . . . . . . . . . . . . . . . 25,635,095 $38.30 4.6 $48
Vested and non-vested expected to vest atSeptember 25, 2009 . . . . . . . . . . . . . . . . . . . . . . . . 24,949,666 $38.73 4.6 $45
Exercisable at September 25, 2009 . . . . . . . . . . . . . . . 19,485,960 $43.26 3.3 $16
The conversion of Tyco International share option awards into Tyco Electronics share optionawards at Separation was considered a modification of an award in accordance with ASC 718. As aresult, the Company compared the fair value of the award immediately prior to the Separation to thefair value immediately after the Separation to measure incremental compensation cost. The conversionresulted in an increase in the fair value of the awards of $13 million. Of that amount, the Companyrecorded non-cash compensation expense of $1 million, $1 million, and $11 million in selling, general,and administrative and separation costs on the Consolidated and Combined Statements of Operationsfor fiscal 2009, 2008, and 2007, respectively.
As of fiscal year end 2009, there was $29 million of total unrecognized compensation cost relatedto non-vested Tyco Electronics share options granted under Tyco Electronics share option plans. Thecost is expected to be recognized over a weighted-average period of 2.3 years.
Share-Based Compensation
Share-based compensation cost during fiscal 2009, 2008, and 2007 totaled $53 million, $62 million,and $100 million, respectively, of which $51 million, $56 million, and $89 million, respectively, havebeen included on the Consolidated and Combined Statements of Operations within selling, general, andadministrative expenses and separation costs. Share-based compensation expense of $2 million,$6 million, and $11 million has been included on the Consolidated and Combined Statements ofOperations within income (loss) from discontinued operations, net of tax for fiscal 2009, 2008, and2007, respectively. The Company has recognized a related tax benefit associated with its share-basedcompensation arrangements of $13 million, $17 million, and $27 million in fiscal 2009, 2008, and 2007,respectively.
The grant-date fair value of each option grant is estimated using the Black-Scholes-Merton optionpricing model. The fair value is then amortized on a straight-line basis over the requisite serviceperiods of the awards, which is generally the vesting period. Use of a valuation model requiresmanagement to make certain assumptions with respect to selected model inputs. Expected share pricevolatility was calculated based on the historical volatility of the stock of a composite of peers of Tyco
124
TYCO ELECTRONICS LTD.
NOTES TO CONSOLIDATED AND COMBINED FINANCIAL STATEMENTS (Continued)
23. Share Plans (Continued)
Electronics and implied volatility derived from exchange traded options on that same composite ofpeers. The average expected life was based on the contractual term of the option and expectedemployee exercise and post-vesting employment termination behavior. The risk-free interest rate isbased on U.S. Treasury zero-coupon issues with a remaining term which approximates the expected lifeassumed at the date of grant. The expected annual dividend per share was based on Tyco Electronics’expected dividend rate. The compensation expense recognized is net of estimated forfeitures.Forfeitures are estimated based on voluntary termination behavior, as well as an analysis of actualoption forfeitures.
The weighted-average grant-date fair value of Tyco Electronics options granted during fiscal 2009,fiscal 2008, and post-Separation fiscal 2007 and the weighted-average assumptions Tyco Electronicsused in the Black-Scholes-Merton option pricing model for fiscal 2009, fiscal 2008, and post-Separationfiscal 2007 were as follows:
Fiscal
2009 2008 2007
Weighted-average grant-date fair value . . . . . . . . . . . . . . . . $3.54 $8.87 $12.34Assumptions:Expected share price volatility . . . . . . . . . . . . . . . . . . . . . . 39% 30% 30%Risk free interest rate . . . . . . . . . . . . . . . . . . . . . . . . . . . . 2.4% 3.2% 4.9%Expected annual dividend per share . . . . . . . . . . . . . . . . . . $0.64 $0.59 $ 0.56Expected life of options (years) . . . . . . . . . . . . . . . . . . . . . 5.0 5.0 5.2
The weighted-average grant-date fair values of Tyco International options granted to TycoElectronics employees during pre-Separation fiscal 2007 and the weighted-average assumptions TycoInternational used in the Black-Scholes-Merton option pricing model for pre-Separation fiscal 2007were as follows:
Fiscal 2007
Weighted-average grant-date fair value . . . . . . . . . . . . . . . . . . . . . . . . . . $9.52Assumptions:Expected share price volatility . . . . . . . . . . . . . . . . . . . . . . . . . . . . . . . . 32%Risk free interest rate . . . . . . . . . . . . . . . . . . . . . . . . . . . . . . . . . . . . . . 4.3%Expected annual dividend per share . . . . . . . . . . . . . . . . . . . . . . . . . . . . $0.64Expected life of options (years) . . . . . . . . . . . . . . . . . . . . . . . . . . . . . . . 4.9
The total intrinsic value of Tyco Electronics options exercised during fiscal 2009 was insignificant.The total intrinsic value of Tyco Electronics options exercised during fiscal 2008 and post-Separationfiscal 2007 were $39 million and $7 million, respectively. The total cash received by the Companyrelated to the exercise of options totaled $1 million, $54 million, and $13 million in fiscal 2009, fiscal2008, and post-Separation fiscal 2007, respectively. The related excess cash tax benefit classified as afinancing cash inflow for fiscal 2009, 2008, and 2007 on the Consolidated and Combined Statements ofCash Flows was not significant.
The total intrinsic value of Tyco International options exercised by Tyco Electronics employeesduring pre-Separation fiscal 2007 was $48 million.
125
TYCO ELECTRONICS LTD.
NOTES TO CONSOLIDATED AND COMBINED FINANCIAL STATEMENTS (Continued)
23. Share Plans (Continued)
Employee Stock Purchase Plans
The Company also maintains employee stock purchase plans for the benefit of employees ofcertain qualified U.S. and non-U.S. subsidiaries. The terms of these plans provide employees the rightto purchase shares of the Company’s stock at a stated price and receive certain tax benefits. Thesignificant plans are discussed below.
Substantially all full-time employees of the Company’s U.S. subsidiaries and employees of certainqualified non-U.S. subsidiaries are eligible to participate in the Tyco Electronics Ltd. Employee StockPurchase Plan (the ‘‘ESP Plan’’). Eligible employees authorize payroll deductions to be made for thepurchase of shares. The Company matches a portion of the employee contribution by contributing anadditional 15% of the employee’s payroll deduction on the first $40,000 of payroll deductions. Allcommon shares purchased under the ESP Plan are purchased from a subsidiary of the Company.Participation in the ESP Plan began in December 2007. The Company incurred $1 million in matchingcontribution expense in both fiscal 2009 and 2008.
Substantially all full-time employees of the Company’s United Kingdom subsidiaries are eligible toparticipate in the Tyco Electronics Ltd. Savings Related Share Plan (the ‘‘UK SAYE Plan’’). Under theUK SAYE Plan, eligible employees are granted options to purchase shares at the end of three years ofservice at 85% of the market price at the time of grant. Options under the UK SAYE Plan aregenerally exercisable after a period of three years and expire six months after the date of vesting.Participation in the UK SAYE Plan began in February 2008. As of fiscal year end 2009 and 2008,206,614 and 123,818 non-vested options are outstanding under the UK SAYE Plan, respectively; thereare no vested options outstanding. Non-cash compensation expense related to the UK SAYE Plan,which is included in the total share-based compensation cost referred to above, was not significant infiscal 2009 and 2008.
24. Segment and Geographic Data
The Company operates through four reporting segments: Electronic Components, NetworkSolutions, Specialty Products, and Undersea Telecommunications. See Note 1 for a description of thesegments in which the Company operates. The Company aggregates its operating segments intoreportable segments based upon the Company’s internal business structure. Segment information hasbeen revised to reflect the Company’s current segment reporting structure. Prior period segment resultshave been reclassified to conform to the current presentation.
The Company sold its Wireless Systems business in May 2009. This business has been reclassifiedas discontinued operations on the Consolidated and Combined Financial Statements. See Note 5 foradditional information regarding discontinued operations and the divestiture of the Wireless Systemsbusiness. Prior to reclassification to held for sale and discontinued operations, this business wasreported as the Company’s former Wireless Systems segment.
Effective January 1, 2009, the Company established the Specialty Products Group from its existingbusinesses. The results of this new organization are reported as a separate reporting segment on theConsolidated and Combined Financial Statements. This new segment is comprised of the Aerospace,Defense, and Marine; Touch Systems; Medical; and Circuit Protection businesses which were formerlyreported in the Electronic Components segment.
Segment performance is evaluated based on net sales and operating income. Generally, theCompany considers all expenses to be of an operating nature, and, accordingly, allocates them to each
126
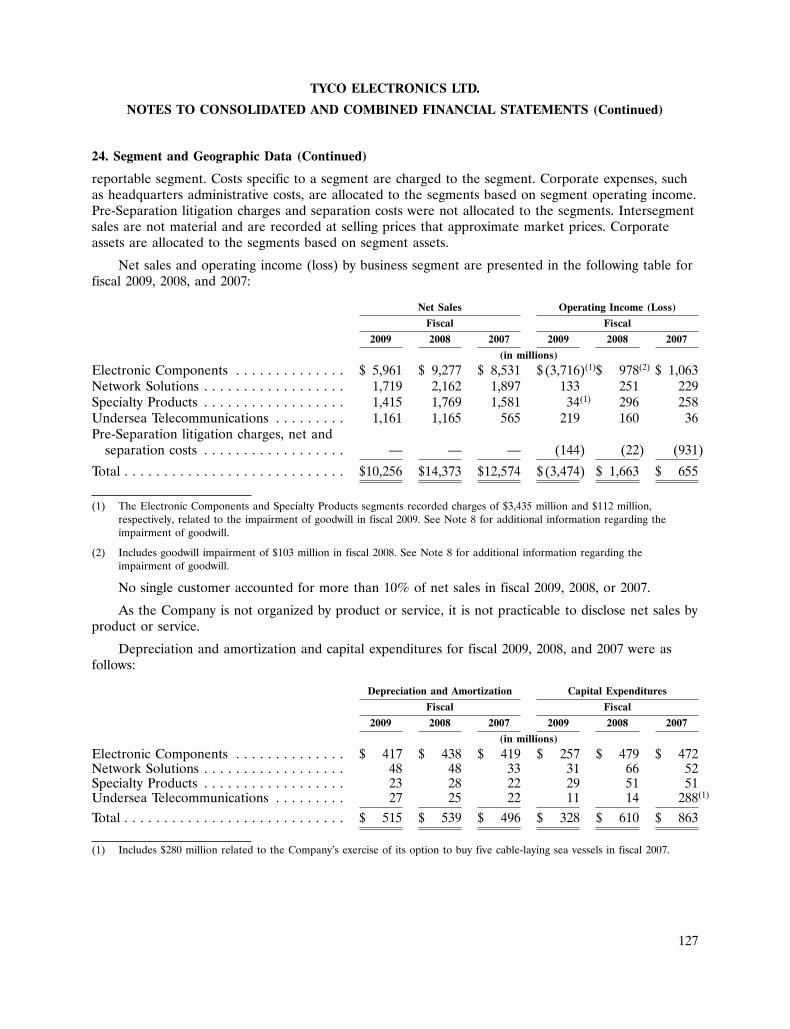
TYCO ELECTRONICS LTD.
NOTES TO CONSOLIDATED AND COMBINED FINANCIAL STATEMENTS (Continued)
24. Segment and Geographic Data (Continued)
reportable segment. Costs specific to a segment are charged to the segment. Corporate expenses, suchas headquarters administrative costs, are allocated to the segments based on segment operating income.Pre-Separation litigation charges and separation costs were not allocated to the segments. Intersegmentsales are not material and are recorded at selling prices that approximate market prices. Corporateassets are allocated to the segments based on segment assets.
Net sales and operating income (loss) by business segment are presented in the following table forfiscal 2009, 2008, and 2007:
Net Sales Operating Income (Loss)
Fiscal Fiscal
2009 2008 2007 2009 2008 2007
(in millions)
Electronic Components . . . . . . . . . . . . . . $ 5,961 $ 9,277 $ 8,531 $(3,716)(1)$ 978(2) $ 1,063Network Solutions . . . . . . . . . . . . . . . . . . 1,719 2,162 1,897 133 251 229Specialty Products . . . . . . . . . . . . . . . . . . 1,415 1,769 1,581 34(1) 296 258Undersea Telecommunications . . . . . . . . . 1,161 1,165 565 219 160 36Pre-Separation litigation charges, net and
separation costs . . . . . . . . . . . . . . . . . . — — — (144) (22) (931)
Total . . . . . . . . . . . . . . . . . . . . . . . . . . . . $10,256 $14,373 $12,574 $(3,474) $ 1,663 $ 655
(1) The Electronic Components and Specialty Products segments recorded charges of $3,435 million and $112 million,respectively, related to the impairment of goodwill in fiscal 2009. See Note 8 for additional information regarding theimpairment of goodwill.
(2) Includes goodwill impairment of $103 million in fiscal 2008. See Note 8 for additional information regarding theimpairment of goodwill.
No single customer accounted for more than 10% of net sales in fiscal 2009, 2008, or 2007.
As the Company is not organized by product or service, it is not practicable to disclose net sales byproduct or service.
Depreciation and amortization and capital expenditures for fiscal 2009, 2008, and 2007 were asfollows:
Depreciation and Amortization Capital Expenditures
Fiscal Fiscal
2009 2008 2007 2009 2008 2007
(in millions)
Electronic Components . . . . . . . . . . . . . . $ 417 $ 438 $ 419 $ 257 $ 479 $ 472Network Solutions . . . . . . . . . . . . . . . . . . 48 48 33 31 66 52Specialty Products . . . . . . . . . . . . . . . . . . 23 28 22 29 51 51Undersea Telecommunications . . . . . . . . . 27 25 22 11 14 288(1)
Total . . . . . . . . . . . . . . . . . . . . . . . . . . . . $ 515 $ 539 $ 496 $ 328 $ 610 $ 863
(1) Includes $280 million related to the Company’s exercise of its option to buy five cable-laying sea vessels in fiscal 2007.
127
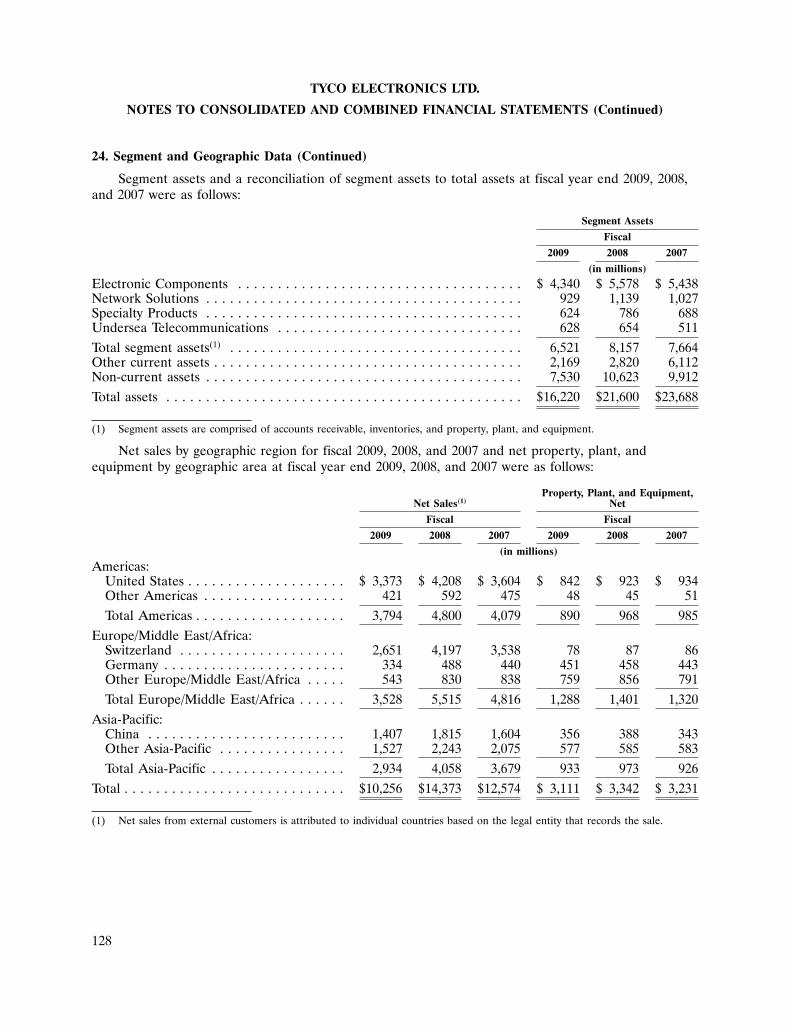
TYCO ELECTRONICS LTD.
NOTES TO CONSOLIDATED AND COMBINED FINANCIAL STATEMENTS (Continued)
24. Segment and Geographic Data (Continued)
Segment assets and a reconciliation of segment assets to total assets at fiscal year end 2009, 2008,and 2007 were as follows:
Segment Assets
Fiscal
2009 2008 2007
(in millions)
Electronic Components . . . . . . . . . . . . . . . . . . . . . . . . . . . . . . . . . . . . $ 4,340 $ 5,578 $ 5,438Network Solutions . . . . . . . . . . . . . . . . . . . . . . . . . . . . . . . . . . . . . . . . 929 1,139 1,027Specialty Products . . . . . . . . . . . . . . . . . . . . . . . . . . . . . . . . . . . . . . . . 624 786 688Undersea Telecommunications . . . . . . . . . . . . . . . . . . . . . . . . . . . . . . . 628 654 511Total segment assets(1) . . . . . . . . . . . . . . . . . . . . . . . . . . . . . . . . . . . . . 6,521 8,157 7,664Other current assets . . . . . . . . . . . . . . . . . . . . . . . . . . . . . . . . . . . . . . . 2,169 2,820 6,112Non-current assets . . . . . . . . . . . . . . . . . . . . . . . . . . . . . . . . . . . . . . . . 7,530 10,623 9,912Total assets . . . . . . . . . . . . . . . . . . . . . . . . . . . . . . . . . . . . . . . . . . . . . $16,220 $21,600 $23,688
(1) Segment assets are comprised of accounts receivable, inventories, and property, plant, and equipment.
Net sales by geographic region for fiscal 2009, 2008, and 2007 and net property, plant, andequipment by geographic area at fiscal year end 2009, 2008, and 2007 were as follows:
Property, Plant, and Equipment,Net Sales(1) Net
Fiscal Fiscal
2009 2008 2007 2009 2008 2007
(in millions)
Americas:United States . . . . . . . . . . . . . . . . . . . . $ 3,373 $ 4,208 $ 3,604 $ 842 $ 923 $ 934Other Americas . . . . . . . . . . . . . . . . . . 421 592 475 48 45 51Total Americas . . . . . . . . . . . . . . . . . . . 3,794 4,800 4,079 890 968 985
Europe/Middle East/Africa:Switzerland . . . . . . . . . . . . . . . . . . . . . 2,651 4,197 3,538 78 87 86Germany . . . . . . . . . . . . . . . . . . . . . . . 334 488 440 451 458 443Other Europe/Middle East/Africa . . . . . 543 830 838 759 856 791Total Europe/Middle East/Africa . . . . . . 3,528 5,515 4,816 1,288 1,401 1,320
Asia-Pacific:China . . . . . . . . . . . . . . . . . . . . . . . . . 1,407 1,815 1,604 356 388 343Other Asia-Pacific . . . . . . . . . . . . . . . . 1,527 2,243 2,075 577 585 583Total Asia-Pacific . . . . . . . . . . . . . . . . . 2,934 4,058 3,679 933 973 926
Total . . . . . . . . . . . . . . . . . . . . . . . . . . . . $10,256 $14,373 $12,574 $ 3,111 $ 3,342 $ 3,231
(1) Net sales from external customers is attributed to individual countries based on the legal entity that records the sale.
128
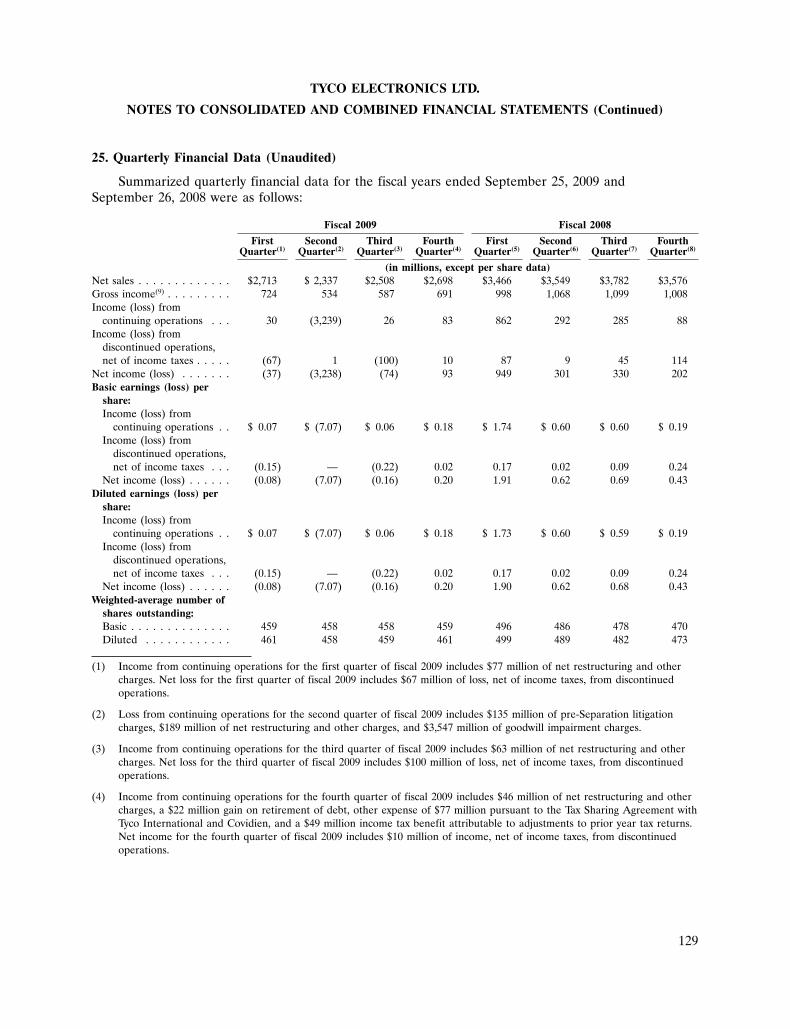
TYCO ELECTRONICS LTD.
NOTES TO CONSOLIDATED AND COMBINED FINANCIAL STATEMENTS (Continued)
25. Quarterly Financial Data (Unaudited)
Summarized quarterly financial data for the fiscal years ended September 25, 2009 andSeptember 26, 2008 were as follows:
Fiscal 2009 Fiscal 2008
First Second Third Fourth First Second Third FourthQuarter(1) Quarter(2) Quarter(3) Quarter(4) Quarter(5) Quarter(6) Quarter(7) Quarter(8)
(in millions, except per share data)Net sales . . . . . . . . . . . . . $2,713 $ 2,337 $2,508 $2,698 $3,466 $3,549 $3,782 $3,576Gross income(9) . . . . . . . . . 724 534 587 691 998 1,068 1,099 1,008Income (loss) from
continuing operations . . . 30 (3,239) 26 83 862 292 285 88Income (loss) from
discontinued operations,net of income taxes . . . . . (67) 1 (100) 10 87 9 45 114
Net income (loss) . . . . . . . (37) (3,238) (74) 93 949 301 330 202Basic earnings (loss) per
share:Income (loss) from
continuing operations . . $ 0.07 $ (7.07) $ 0.06 $ 0.18 $ 1.74 $ 0.60 $ 0.60 $ 0.19Income (loss) from
discontinued operations,net of income taxes . . . (0.15) — (0.22) 0.02 0.17 0.02 0.09 0.24
Net income (loss) . . . . . . (0.08) (7.07) (0.16) 0.20 1.91 0.62 0.69 0.43Diluted earnings (loss) per
share:Income (loss) from
continuing operations . . $ 0.07 $ (7.07) $ 0.06 $ 0.18 $ 1.73 $ 0.60 $ 0.59 $ 0.19Income (loss) from
discontinued operations,net of income taxes . . . (0.15) — (0.22) 0.02 0.17 0.02 0.09 0.24
Net income (loss) . . . . . . (0.08) (7.07) (0.16) 0.20 1.90 0.62 0.68 0.43Weighted-average number of
shares outstanding:Basic . . . . . . . . . . . . . . 459 458 458 459 496 486 478 470Diluted . . . . . . . . . . . . 461 458 459 461 499 489 482 473
(1) Income from continuing operations for the first quarter of fiscal 2009 includes $77 million of net restructuring and othercharges. Net loss for the first quarter of fiscal 2009 includes $67 million of loss, net of income taxes, from discontinuedoperations.
(2) Loss from continuing operations for the second quarter of fiscal 2009 includes $135 million of pre-Separation litigationcharges, $189 million of net restructuring and other charges, and $3,547 million of goodwill impairment charges.
(3) Income from continuing operations for the third quarter of fiscal 2009 includes $63 million of net restructuring and othercharges. Net loss for the third quarter of fiscal 2009 includes $100 million of loss, net of income taxes, from discontinuedoperations.
(4) Income from continuing operations for the fourth quarter of fiscal 2009 includes $46 million of net restructuring and othercharges, a $22 million gain on retirement of debt, other expense of $77 million pursuant to the Tax Sharing Agreement withTyco International and Covidien, and a $49 million income tax benefit attributable to adjustments to prior year tax returns.Net income for the fourth quarter of fiscal 2009 includes $10 million of income, net of income taxes, from discontinuedoperations.
129
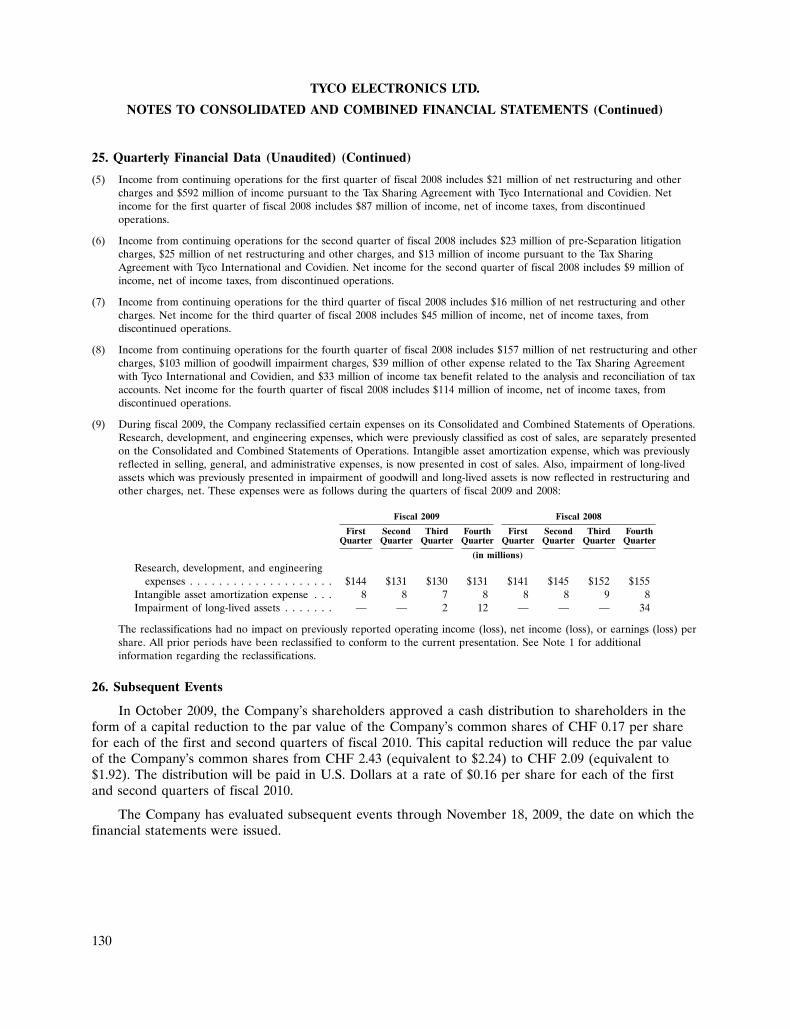
TYCO ELECTRONICS LTD.
NOTES TO CONSOLIDATED AND COMBINED FINANCIAL STATEMENTS (Continued)
25. Quarterly Financial Data (Unaudited) (Continued)
(5) Income from continuing operations for the first quarter of fiscal 2008 includes $21 million of net restructuring and othercharges and $592 million of income pursuant to the Tax Sharing Agreement with Tyco International and Covidien. Netincome for the first quarter of fiscal 2008 includes $87 million of income, net of income taxes, from discontinuedoperations.
(6) Income from continuing operations for the second quarter of fiscal 2008 includes $23 million of pre-Separation litigationcharges, $25 million of net restructuring and other charges, and $13 million of income pursuant to the Tax SharingAgreement with Tyco International and Covidien. Net income for the second quarter of fiscal 2008 includes $9 million ofincome, net of income taxes, from discontinued operations.
(7) Income from continuing operations for the third quarter of fiscal 2008 includes $16 million of net restructuring and othercharges. Net income for the third quarter of fiscal 2008 includes $45 million of income, net of income taxes, fromdiscontinued operations.
(8) Income from continuing operations for the fourth quarter of fiscal 2008 includes $157 million of net restructuring and othercharges, $103 million of goodwill impairment charges, $39 million of other expense related to the Tax Sharing Agreementwith Tyco International and Covidien, and $33 million of income tax benefit related to the analysis and reconciliation of taxaccounts. Net income for the fourth quarter of fiscal 2008 includes $114 million of income, net of income taxes, fromdiscontinued operations.
(9) During fiscal 2009, the Company reclassified certain expenses on its Consolidated and Combined Statements of Operations.Research, development, and engineering expenses, which were previously classified as cost of sales, are separately presentedon the Consolidated and Combined Statements of Operations. Intangible asset amortization expense, which was previouslyreflected in selling, general, and administrative expenses, is now presented in cost of sales. Also, impairment of long-livedassets which was previously presented in impairment of goodwill and long-lived assets is now reflected in restructuring andother charges, net. These expenses were as follows during the quarters of fiscal 2009 and 2008:
Fiscal 2009 Fiscal 2008
First Second Third Fourth First Second Third FourthQuarter Quarter Quarter Quarter Quarter Quarter Quarter Quarter
(in millions)Research, development, and engineering
expenses . . . . . . . . . . . . . . . . . . . . $144 $131 $130 $131 $141 $145 $152 $155Intangible asset amortization expense . . . 8 8 7 8 8 8 9 8Impairment of long-lived assets . . . . . . . — — 2 12 — — — 34
The reclassifications had no impact on previously reported operating income (loss), net income (loss), or earnings (loss) pershare. All prior periods have been reclassified to conform to the current presentation. See Note 1 for additionalinformation regarding the reclassifications.
26. Subsequent Events
In October 2009, the Company’s shareholders approved a cash distribution to shareholders in theform of a capital reduction to the par value of the Company’s common shares of CHF 0.17 per sharefor each of the first and second quarters of fiscal 2010. This capital reduction will reduce the par valueof the Company’s common shares from CHF 2.43 (equivalent to $2.24) to CHF 2.09 (equivalent to$1.92). The distribution will be paid in U.S. Dollars at a rate of $0.16 per share for each of the firstand second quarters of fiscal 2010.
The Company has evaluated subsequent events through November 18, 2009, the date on which thefinancial statements were issued.
130

TYCO ELECTRONICS LTD.
NOTES TO CONSOLIDATED AND COMBINED FINANCIAL STATEMENTS (Continued)
27. Tyco Electronics Group S.A.
In December 2006, prior to the Separation, TEGSA, a 100%-owned subsidiary of TycoElectronics Ltd., was formed. TEGSA, a Luxembourg company, is a holding company that owns,directly or indirectly, all of the operating subsidiaries of Tyco Electronics Ltd. TEGSA is the obligorunder the Company’s senior notes, Credit Facility, and commercial paper, all of which, including profitsharing notes issued by a subsidiary, are fully and unconditionally guaranteed by its parent, TycoElectronics Ltd. The following tables present condensed consolidating financial information for TycoElectronics Ltd., TEGSA, and all other subsidiaries that are not providing a guarantee of debt butwhich represent assets of TEGSA, using the equity method of accounting.
Consolidating Statement of Operations
For the Fiscal Year Ended September 25, 2009
TycoTyco Electronics Other Consolidating
Electronics Ltd. Group S.A. Subsidiaries Adjustments Total
(in millions)
Net sales . . . . . . . . . . . . . . . . . . . . . . $ — $ — $10,256 $ — $10,256Cost of sales . . . . . . . . . . . . . . . . . . . . — — 7,720 — 7,720
Gross income . . . . . . . . . . . . . . . . . — — 2,536 — 2,536Selling, general, and administrative
expenses . . . . . . . . . . . . . . . . . . . . . 108 10 1,290 — 1,408Research, development, and
engineering expenses . . . . . . . . . . . . — — 536 — 536Pre-Separation litigation charges, net . . 74 — 70 — 144Restructuring and other charges, net . . — — 375 — 375Impairment of goodwill . . . . . . . . . . . . — — 3,547 — 3,547
Operating loss . . . . . . . . . . . . . . . . . (182) (10) (3,282) — (3,474)Interest income . . . . . . . . . . . . . . . . . . — — 17 — 17Interest expense . . . . . . . . . . . . . . . . . — (155) (10) — (165)Other income (expense), net . . . . . . . . — 22 (70) — (48)Equity in net loss of subsidiaries . . . . . (2,891) (2,824) — 5,715 —Equity in net loss of subsidiaries of
discontinued operations . . . . . . . . . . (156) (156) — 312 —Intercompany interest and fees . . . . . . (27) 76 (49) — —
Loss from continuing operationsbefore income taxes and minorityinterest . . . . . . . . . . . . . . . . . . . . (3,256) (3,047) (3,394) 6,027 (3,670)
Income tax benefit . . . . . . . . . . . . . . . — — 576 — 576Minority interest . . . . . . . . . . . . . . . . . — — (6) — (6)
Loss from continuing operations . . . (3,256) (3,047) (2,824) 6,027 (3,100)Loss from discontinued operations, net
of income taxes . . . . . . . . . . . . . . . . — — (156) — (156)
Net loss . . . . . . . . . . . . . . . . . . . . . $(3,256) $(3,047) $(2,980) $6,027 $(3,256)
131
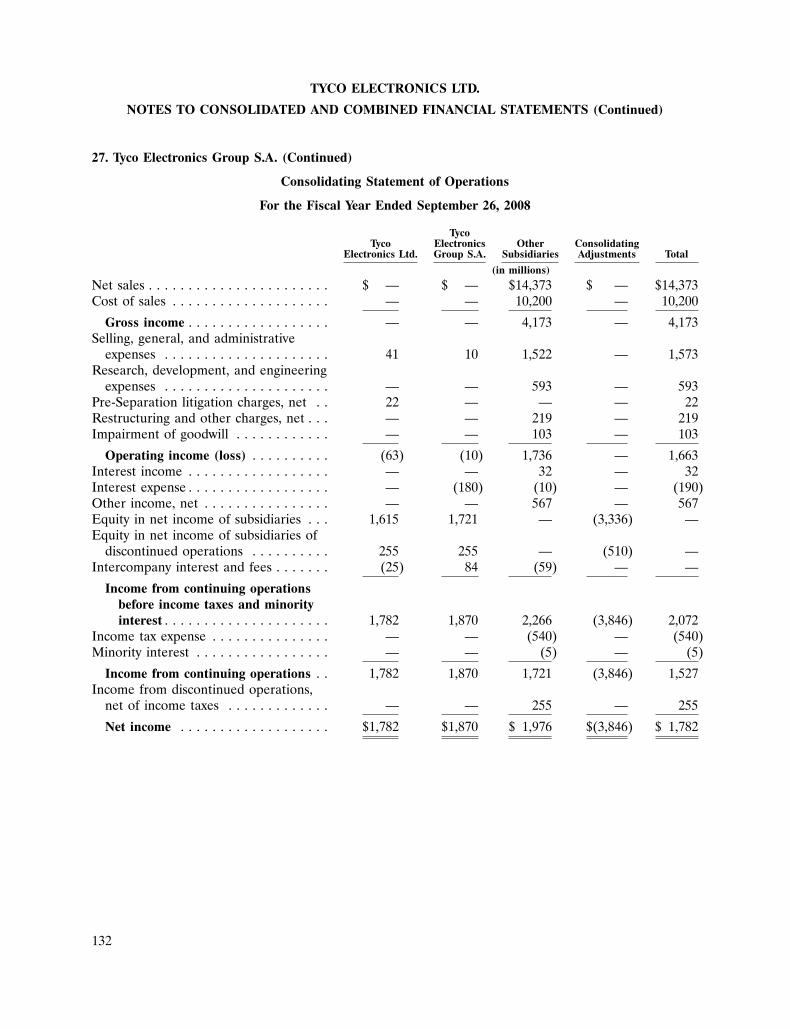
TYCO ELECTRONICS LTD.
NOTES TO CONSOLIDATED AND COMBINED FINANCIAL STATEMENTS (Continued)
27. Tyco Electronics Group S.A. (Continued)
Consolidating Statement of Operations
For the Fiscal Year Ended September 26, 2008
TycoTyco Electronics Other Consolidating
Electronics Ltd. Group S.A. Subsidiaries Adjustments Total
(in millions)
Net sales . . . . . . . . . . . . . . . . . . . . . . . $ — $ — $14,373 $ — $14,373Cost of sales . . . . . . . . . . . . . . . . . . . . — — 10,200 — 10,200
Gross income . . . . . . . . . . . . . . . . . . — — 4,173 — 4,173Selling, general, and administrative
expenses . . . . . . . . . . . . . . . . . . . . . 41 10 1,522 — 1,573Research, development, and engineering
expenses . . . . . . . . . . . . . . . . . . . . . — — 593 — 593Pre-Separation litigation charges, net . . 22 — — — 22Restructuring and other charges, net . . . — — 219 — 219Impairment of goodwill . . . . . . . . . . . . — — 103 — 103
Operating income (loss) . . . . . . . . . . (63) (10) 1,736 — 1,663Interest income . . . . . . . . . . . . . . . . . . — — 32 — 32Interest expense . . . . . . . . . . . . . . . . . . — (180) (10) — (190)Other income, net . . . . . . . . . . . . . . . . — — 567 — 567Equity in net income of subsidiaries . . . 1,615 1,721 — (3,336) —Equity in net income of subsidiaries of
discontinued operations . . . . . . . . . . 255 255 — (510) —Intercompany interest and fees . . . . . . . (25) 84 (59) — —
Income from continuing operationsbefore income taxes and minorityinterest . . . . . . . . . . . . . . . . . . . . . 1,782 1,870 2,266 (3,846) 2,072
Income tax expense . . . . . . . . . . . . . . . — — (540) — (540)Minority interest . . . . . . . . . . . . . . . . . — — (5) — (5)
Income from continuing operations . . 1,782 1,870 1,721 (3,846) 1,527Income from discontinued operations,
net of income taxes . . . . . . . . . . . . . — — 255 — 255
Net income . . . . . . . . . . . . . . . . . . . $1,782 $1,870 $ 1,976 $(3,846) $ 1,782
132
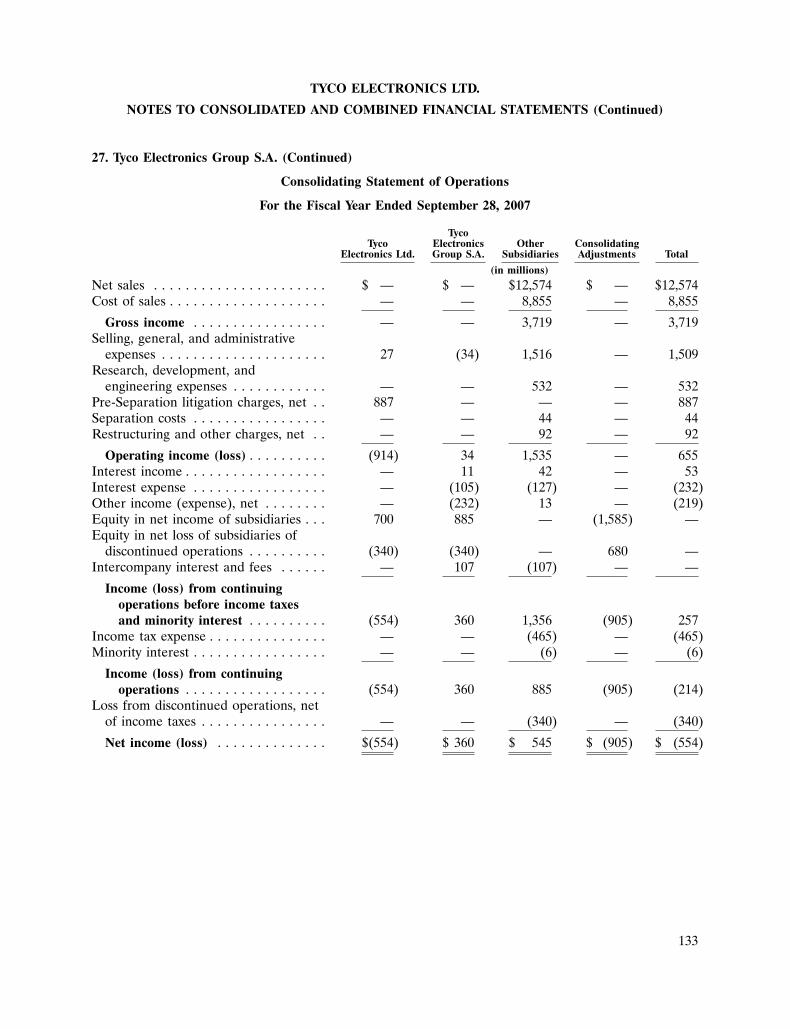
TYCO ELECTRONICS LTD.
NOTES TO CONSOLIDATED AND COMBINED FINANCIAL STATEMENTS (Continued)
27. Tyco Electronics Group S.A. (Continued)
Consolidating Statement of Operations
For the Fiscal Year Ended September 28, 2007
TycoTyco Electronics Other Consolidating
Electronics Ltd. Group S.A. Subsidiaries Adjustments Total
(in millions)
Net sales . . . . . . . . . . . . . . . . . . . . . . $ — $ — $12,574 $ — $12,574Cost of sales . . . . . . . . . . . . . . . . . . . . — — 8,855 — 8,855
Gross income . . . . . . . . . . . . . . . . . — — 3,719 — 3,719Selling, general, and administrative
expenses . . . . . . . . . . . . . . . . . . . . . 27 (34) 1,516 — 1,509Research, development, and
engineering expenses . . . . . . . . . . . . — — 532 — 532Pre-Separation litigation charges, net . . 887 — — — 887Separation costs . . . . . . . . . . . . . . . . . — — 44 — 44Restructuring and other charges, net . . — — 92 — 92
Operating income (loss) . . . . . . . . . . (914) 34 1,535 — 655Interest income . . . . . . . . . . . . . . . . . . — 11 42 — 53Interest expense . . . . . . . . . . . . . . . . . — (105) (127) — (232)Other income (expense), net . . . . . . . . — (232) 13 — (219)Equity in net income of subsidiaries . . . 700 885 — (1,585) —Equity in net loss of subsidiaries of
discontinued operations . . . . . . . . . . (340) (340) — 680 —Intercompany interest and fees . . . . . . — 107 (107) — —
Income (loss) from continuingoperations before income taxesand minority interest . . . . . . . . . . (554) 360 1,356 (905) 257
Income tax expense . . . . . . . . . . . . . . . — — (465) — (465)Minority interest . . . . . . . . . . . . . . . . . — — (6) — (6)
Income (loss) from continuingoperations . . . . . . . . . . . . . . . . . . (554) 360 885 (905) (214)
Loss from discontinued operations, netof income taxes . . . . . . . . . . . . . . . . — — (340) — (340)
Net income (loss) . . . . . . . . . . . . . . $(554) $ 360 $ 545 $ (905) $ (554)
133
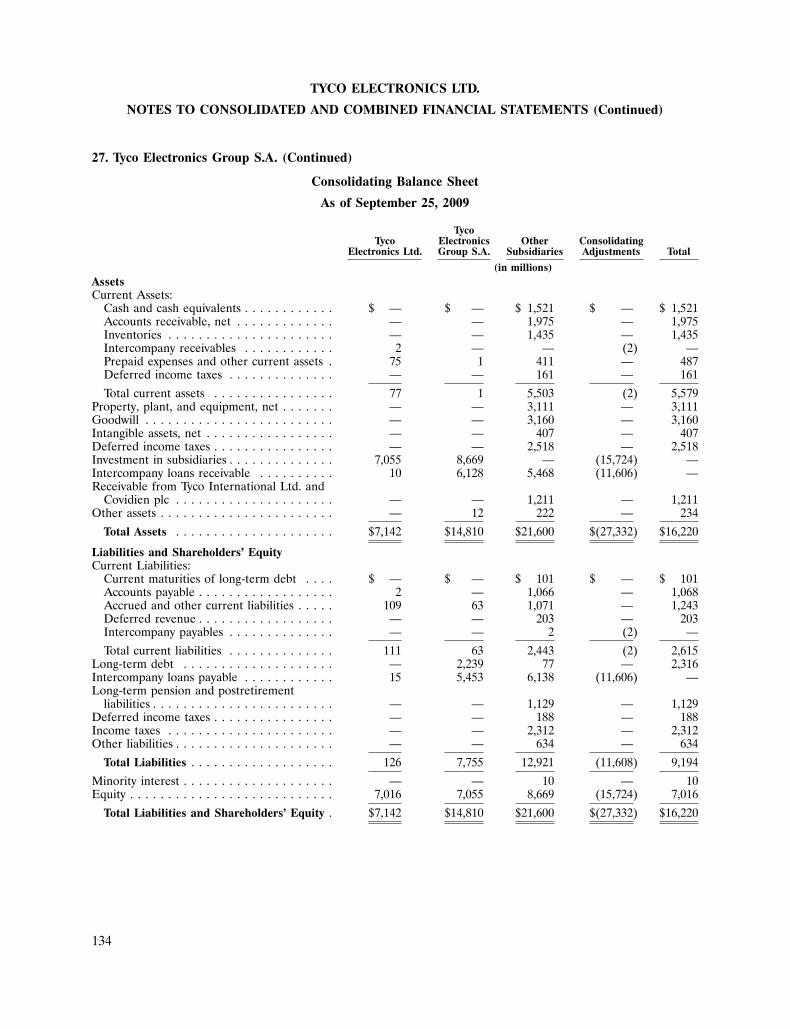
TYCO ELECTRONICS LTD.
NOTES TO CONSOLIDATED AND COMBINED FINANCIAL STATEMENTS (Continued)
27. Tyco Electronics Group S.A. (Continued)
Consolidating Balance Sheet
As of September 25, 2009
TycoTyco Electronics Other Consolidating
Electronics Ltd. Group S.A. Subsidiaries Adjustments Total
(in millions)AssetsCurrent Assets:
Cash and cash equivalents . . . . . . . . . . . . $ — $ — $ 1,521 $ — $ 1,521Accounts receivable, net . . . . . . . . . . . . . — — 1,975 — 1,975Inventories . . . . . . . . . . . . . . . . . . . . . . — — 1,435 — 1,435Intercompany receivables . . . . . . . . . . . . 2 — — (2) —Prepaid expenses and other current assets . 75 1 411 — 487Deferred income taxes . . . . . . . . . . . . . . — — 161 — 161
Total current assets . . . . . . . . . . . . . . . . 77 1 5,503 (2) 5,579Property, plant, and equipment, net . . . . . . . — — 3,111 — 3,111Goodwill . . . . . . . . . . . . . . . . . . . . . . . . . — — 3,160 — 3,160Intangible assets, net . . . . . . . . . . . . . . . . . — — 407 — 407Deferred income taxes . . . . . . . . . . . . . . . . — — 2,518 — 2,518Investment in subsidiaries . . . . . . . . . . . . . . 7,055 8,669 — (15,724) —Intercompany loans receivable . . . . . . . . . . 10 6,128 5,468 (11,606) —Receivable from Tyco International Ltd. and
Covidien plc . . . . . . . . . . . . . . . . . . . . . — — 1,211 — 1,211Other assets . . . . . . . . . . . . . . . . . . . . . . . — 12 222 — 234
Total Assets . . . . . . . . . . . . . . . . . . . . . $7,142 $14,810 $21,600 $(27,332) $16,220
Liabilities and Shareholders’ EquityCurrent Liabilities:
Current maturities of long-term debt . . . . $ — $ — $ 101 $ — $ 101Accounts payable . . . . . . . . . . . . . . . . . . 2 — 1,066 — 1,068Accrued and other current liabilities . . . . . 109 63 1,071 — 1,243Deferred revenue . . . . . . . . . . . . . . . . . . — — 203 — 203Intercompany payables . . . . . . . . . . . . . . — — 2 (2) —
Total current liabilities . . . . . . . . . . . . . . 111 63 2,443 (2) 2,615Long-term debt . . . . . . . . . . . . . . . . . . . . — 2,239 77 — 2,316Intercompany loans payable . . . . . . . . . . . . 15 5,453 6,138 (11,606) —Long-term pension and postretirement
liabilities . . . . . . . . . . . . . . . . . . . . . . . . — — 1,129 — 1,129Deferred income taxes . . . . . . . . . . . . . . . . — — 188 — 188Income taxes . . . . . . . . . . . . . . . . . . . . . . — — 2,312 — 2,312Other liabilities . . . . . . . . . . . . . . . . . . . . . — — 634 — 634
Total Liabilities . . . . . . . . . . . . . . . . . . . 126 7,755 12,921 (11,608) 9,194
Minority interest . . . . . . . . . . . . . . . . . . . . — — 10 — 10Equity . . . . . . . . . . . . . . . . . . . . . . . . . . . 7,016 7,055 8,669 (15,724) 7,016
Total Liabilities and Shareholders’ Equity . $7,142 $14,810 $21,600 $(27,332) $16,220
134
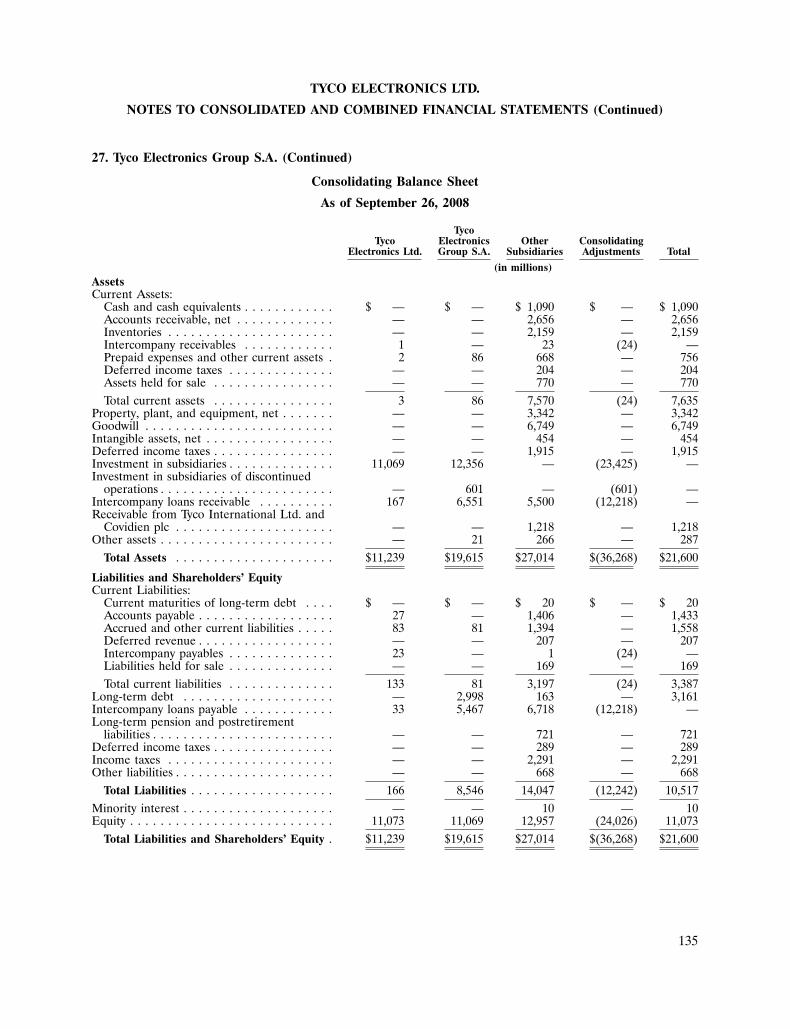
TYCO ELECTRONICS LTD.
NOTES TO CONSOLIDATED AND COMBINED FINANCIAL STATEMENTS (Continued)
27. Tyco Electronics Group S.A. (Continued)
Consolidating Balance Sheet
As of September 26, 2008
TycoTyco Electronics Other Consolidating
Electronics Ltd. Group S.A. Subsidiaries Adjustments Total
(in millions)AssetsCurrent Assets:
Cash and cash equivalents . . . . . . . . . . . . $ — $ — $ 1,090 $ — $ 1,090Accounts receivable, net . . . . . . . . . . . . . — — 2,656 — 2,656Inventories . . . . . . . . . . . . . . . . . . . . . . — — 2,159 — 2,159Intercompany receivables . . . . . . . . . . . . 1 — 23 (24) —Prepaid expenses and other current assets . 2 86 668 — 756Deferred income taxes . . . . . . . . . . . . . . — — 204 — 204Assets held for sale . . . . . . . . . . . . . . . . — — 770 — 770Total current assets . . . . . . . . . . . . . . . . 3 86 7,570 (24) 7,635
Property, plant, and equipment, net . . . . . . . — — 3,342 — 3,342Goodwill . . . . . . . . . . . . . . . . . . . . . . . . . — — 6,749 — 6,749Intangible assets, net . . . . . . . . . . . . . . . . . — — 454 — 454Deferred income taxes . . . . . . . . . . . . . . . . — — 1,915 — 1,915Investment in subsidiaries . . . . . . . . . . . . . . 11,069 12,356 — (23,425) —Investment in subsidiaries of discontinued
operations . . . . . . . . . . . . . . . . . . . . . . . — 601 — (601) —Intercompany loans receivable . . . . . . . . . . 167 6,551 5,500 (12,218) —Receivable from Tyco International Ltd. and
Covidien plc . . . . . . . . . . . . . . . . . . . . . — — 1,218 — 1,218Other assets . . . . . . . . . . . . . . . . . . . . . . . — 21 266 — 287
Total Assets . . . . . . . . . . . . . . . . . . . . . $11,239 $19,615 $27,014 $(36,268) $21,600
Liabilities and Shareholders’ EquityCurrent Liabilities:
Current maturities of long-term debt . . . . $ — $ — $ 20 $ — $ 20Accounts payable . . . . . . . . . . . . . . . . . . 27 — 1,406 — 1,433Accrued and other current liabilities . . . . . 83 81 1,394 — 1,558Deferred revenue . . . . . . . . . . . . . . . . . . — — 207 — 207Intercompany payables . . . . . . . . . . . . . . 23 — 1 (24) —Liabilities held for sale . . . . . . . . . . . . . . — — 169 — 169Total current liabilities . . . . . . . . . . . . . . 133 81 3,197 (24) 3,387
Long-term debt . . . . . . . . . . . . . . . . . . . . — 2,998 163 — 3,161Intercompany loans payable . . . . . . . . . . . . 33 5,467 6,718 (12,218) —Long-term pension and postretirement
liabilities . . . . . . . . . . . . . . . . . . . . . . . . — — 721 — 721Deferred income taxes . . . . . . . . . . . . . . . . — — 289 — 289Income taxes . . . . . . . . . . . . . . . . . . . . . . — — 2,291 — 2,291Other liabilities . . . . . . . . . . . . . . . . . . . . . — — 668 — 668
Total Liabilities . . . . . . . . . . . . . . . . . . . 166 8,546 14,047 (12,242) 10,517Minority interest . . . . . . . . . . . . . . . . . . . . — — 10 — 10Equity . . . . . . . . . . . . . . . . . . . . . . . . . . . 11,073 11,069 12,957 (24,026) 11,073
Total Liabilities and Shareholders’ Equity . $11,239 $19,615 $27,014 $(36,268) $21,600
135
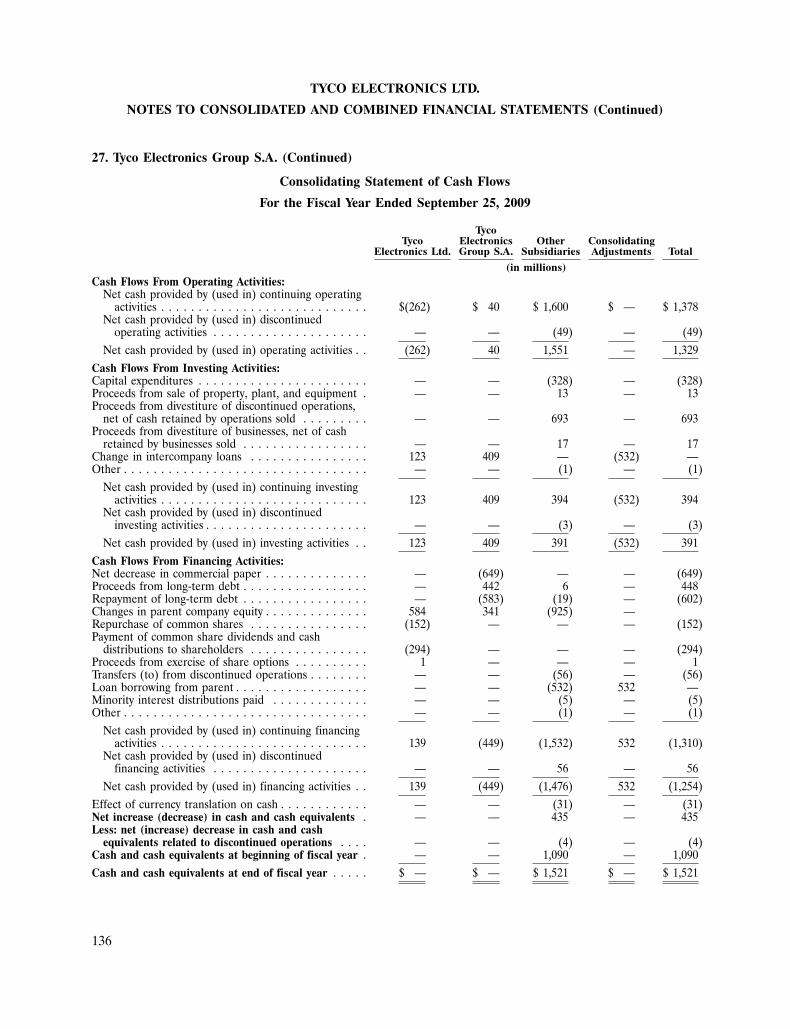
TYCO ELECTRONICS LTD.
NOTES TO CONSOLIDATED AND COMBINED FINANCIAL STATEMENTS (Continued)
27. Tyco Electronics Group S.A. (Continued)
Consolidating Statement of Cash Flows
For the Fiscal Year Ended September 25, 2009
TycoTyco Electronics Other Consolidating
Electronics Ltd. Group S.A. Subsidiaries Adjustments Total
(in millions)Cash Flows From Operating Activities:
Net cash provided by (used in) continuing operatingactivities . . . . . . . . . . . . . . . . . . . . . . . . . . . . $(262) $ 40 $ 1,600 $ — $ 1,378
Net cash provided by (used in) discontinuedoperating activities . . . . . . . . . . . . . . . . . . . . . — — (49) — (49)
Net cash provided by (used in) operating activities . . (262) 40 1,551 — 1,329Cash Flows From Investing Activities:Capital expenditures . . . . . . . . . . . . . . . . . . . . . . . — — (328) — (328)Proceeds from sale of property, plant, and equipment . — — 13 — 13Proceeds from divestiture of discontinued operations,
net of cash retained by operations sold . . . . . . . . . — — 693 — 693Proceeds from divestiture of businesses, net of cash
retained by businesses sold . . . . . . . . . . . . . . . . . — — 17 — 17Change in intercompany loans . . . . . . . . . . . . . . . . 123 409 — (532) —Other . . . . . . . . . . . . . . . . . . . . . . . . . . . . . . . . . — — (1) — (1)
Net cash provided by (used in) continuing investingactivities . . . . . . . . . . . . . . . . . . . . . . . . . . . . 123 409 394 (532) 394
Net cash provided by (used in) discontinuedinvesting activities . . . . . . . . . . . . . . . . . . . . . . — — (3) — (3)
Net cash provided by (used in) investing activities . . 123 409 391 (532) 391Cash Flows From Financing Activities:Net decrease in commercial paper . . . . . . . . . . . . . . — (649) — — (649)Proceeds from long-term debt . . . . . . . . . . . . . . . . . — 442 6 — 448Repayment of long-term debt . . . . . . . . . . . . . . . . . — (583) (19) — (602)Changes in parent company equity . . . . . . . . . . . . . . 584 341 (925) —Repurchase of common shares . . . . . . . . . . . . . . . . (152) — — — (152)Payment of common share dividends and cash
distributions to shareholders . . . . . . . . . . . . . . . . (294) — — — (294)Proceeds from exercise of share options . . . . . . . . . . 1 — — — 1Transfers (to) from discontinued operations . . . . . . . . — — (56) — (56)Loan borrowing from parent . . . . . . . . . . . . . . . . . . — — (532) 532 —Minority interest distributions paid . . . . . . . . . . . . . — — (5) — (5)Other . . . . . . . . . . . . . . . . . . . . . . . . . . . . . . . . . — — (1) — (1)
Net cash provided by (used in) continuing financingactivities . . . . . . . . . . . . . . . . . . . . . . . . . . . . 139 (449) (1,532) 532 (1,310)
Net cash provided by (used in) discontinuedfinancing activities . . . . . . . . . . . . . . . . . . . . . — — 56 — 56
Net cash provided by (used in) financing activities . . 139 (449) (1,476) 532 (1,254)Effect of currency translation on cash . . . . . . . . . . . . — — (31) — (31)Net increase (decrease) in cash and cash equivalents . — — 435 — 435Less: net (increase) decrease in cash and cash
equivalents related to discontinued operations . . . . — — (4) — (4)Cash and cash equivalents at beginning of fiscal year . — — 1,090 — 1,090Cash and cash equivalents at end of fiscal year . . . . . $ — $ — $ 1,521 $ — $ 1,521
136
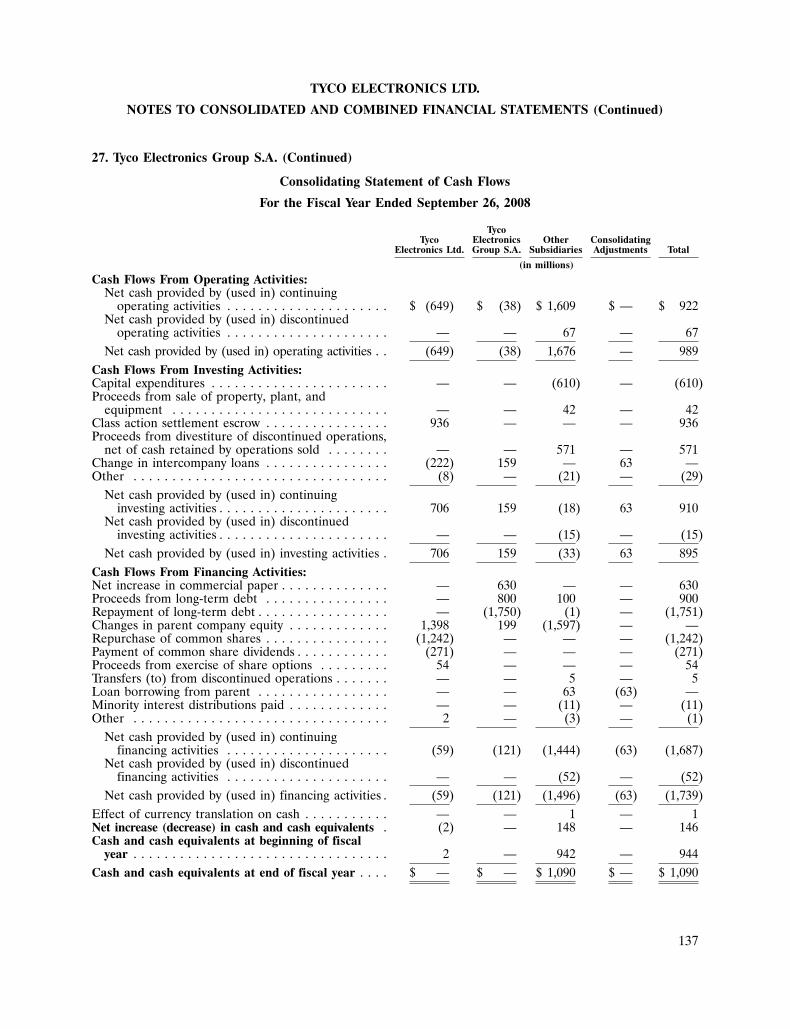
TYCO ELECTRONICS LTD.
NOTES TO CONSOLIDATED AND COMBINED FINANCIAL STATEMENTS (Continued)
27. Tyco Electronics Group S.A. (Continued)
Consolidating Statement of Cash Flows
For the Fiscal Year Ended September 26, 2008
TycoTyco Electronics Other Consolidating
Electronics Ltd. Group S.A. Subsidiaries Adjustments Total
(in millions)
Cash Flows From Operating Activities:Net cash provided by (used in) continuing
operating activities . . . . . . . . . . . . . . . . . . . . . $ (649) $ (38) $ 1,609 $ — $ 922Net cash provided by (used in) discontinued
operating activities . . . . . . . . . . . . . . . . . . . . . — — 67 — 67Net cash provided by (used in) operating activities . . (649) (38) 1,676 — 989
Cash Flows From Investing Activities:Capital expenditures . . . . . . . . . . . . . . . . . . . . . . . — — (610) — (610)Proceeds from sale of property, plant, and
equipment . . . . . . . . . . . . . . . . . . . . . . . . . . . . — — 42 — 42Class action settlement escrow . . . . . . . . . . . . . . . . 936 — — — 936Proceeds from divestiture of discontinued operations,
net of cash retained by operations sold . . . . . . . . — — 571 — 571Change in intercompany loans . . . . . . . . . . . . . . . . (222) 159 — 63 —Other . . . . . . . . . . . . . . . . . . . . . . . . . . . . . . . . . (8) — (21) — (29)
Net cash provided by (used in) continuinginvesting activities . . . . . . . . . . . . . . . . . . . . . . 706 159 (18) 63 910
Net cash provided by (used in) discontinuedinvesting activities . . . . . . . . . . . . . . . . . . . . . . — — (15) — (15)
Net cash provided by (used in) investing activities . 706 159 (33) 63 895Cash Flows From Financing Activities:Net increase in commercial paper . . . . . . . . . . . . . . — 630 — — 630Proceeds from long-term debt . . . . . . . . . . . . . . . . — 800 100 — 900Repayment of long-term debt . . . . . . . . . . . . . . . . . — (1,750) (1) — (1,751)Changes in parent company equity . . . . . . . . . . . . . 1,398 199 (1,597) — —Repurchase of common shares . . . . . . . . . . . . . . . . (1,242) — — — (1,242)Payment of common share dividends . . . . . . . . . . . . (271) — — — (271)Proceeds from exercise of share options . . . . . . . . . 54 — — — 54Transfers (to) from discontinued operations . . . . . . . — — 5 — 5Loan borrowing from parent . . . . . . . . . . . . . . . . . — — 63 (63) —Minority interest distributions paid . . . . . . . . . . . . . — — (11) — (11)Other . . . . . . . . . . . . . . . . . . . . . . . . . . . . . . . . . 2 — (3) — (1)
Net cash provided by (used in) continuingfinancing activities . . . . . . . . . . . . . . . . . . . . . (59) (121) (1,444) (63) (1,687)
Net cash provided by (used in) discontinuedfinancing activities . . . . . . . . . . . . . . . . . . . . . — — (52) — (52)
Net cash provided by (used in) financing activities . (59) (121) (1,496) (63) (1,739)Effect of currency translation on cash . . . . . . . . . . . — — 1 — 1Net increase (decrease) in cash and cash equivalents . (2) — 148 — 146Cash and cash equivalents at beginning of fiscal
year . . . . . . . . . . . . . . . . . . . . . . . . . . . . . . . . . 2 — 942 — 944Cash and cash equivalents at end of fiscal year . . . . $ — $ — $ 1,090 $ — $ 1,090
137

TYCO ELECTRONICS LTD.
NOTES TO CONSOLIDATED AND COMBINED FINANCIAL STATEMENTS (Continued)
27. Tyco Electronics Group S.A. (Continued)
Consolidating Statement of Cash Flows
For the Fiscal Year Ended September 28, 2007
TycoTyco Electronics Other Consolidating
Electronics Ltd. Group S.A. Subsidiaries Adjustments Total
(in millions)
Cash Flows From Operating Activities:Net cash provided by (used in) continuing
operating activities . . . . . . . . . . . . . . . . . . . . $ (74) $ (264) $ 1,785 $ — $ 1,447Net cash provided by (used in) discontinued
operating activities . . . . . . . . . . . . . . . . . . . . — — 78 — 78Net cash provided by (used in) operating
activities . . . . . . . . . . . . . . . . . . . . . . . . . . (74) (264) 1,863 — 1,525Cash Flows From Investing Activities:Capital expenditures . . . . . . . . . . . . . . . . . . . . . — — (863) — (863)Proceeds from sale of property, plant, and
equipment . . . . . . . . . . . . . . . . . . . . . . . . . . . — — 41 — 41Class action settlement escrow . . . . . . . . . . . . . . . (928) — — — (928)Proceeds from divestiture of discontinued
operations, net of cash retained by operationssold . . . . . . . . . . . . . . . . . . . . . . . . . . . . . . . — — 227 — 227
Change in intercompany loans . . . . . . . . . . . . . . . — 2,011 — (2,011) —Other . . . . . . . . . . . . . . . . . . . . . . . . . . . . . . . — — (3) — (3)
Net cash provided by (used in) continuinginvesting activities . . . . . . . . . . . . . . . . . . . . (928) 2,011 (598) (2,011) (1,526)
Net cash provided by (used in) discontinuedinvesting activities . . . . . . . . . . . . . . . . . . . . — — (2) — (2)
Net cash provided by (used in) investing activities . (928) 2,011 (600) (2,011) (1,528)Cash Flows From Financing Activities:Proceeds from long-term debt . . . . . . . . . . . . . . . — 5,676 — — 5,676Repayment of long-term debt . . . . . . . . . . . . . . . — (2,393) (62) — (2,455)Allocated debt activity . . . . . . . . . . . . . . . . . . . . — (3,743) — — (3,743)Net transactions with former parent . . . . . . . . . . . 875 (2,956) 3,193 — 1,112Changes in parent company equity . . . . . . . . . . . . 129 1,669 (1,798) — —Proceeds from exercise of share options . . . . . . . . 13 — — — 13Transfers (to) from discontinued operations . . . . . . — — (84) — (84)Loan borrowing from parent . . . . . . . . . . . . . . . . — — (2,011) 2,011 —Minority interest distributions paid . . . . . . . . . . . . — — (7) — (7)Other . . . . . . . . . . . . . . . . . . . . . . . . . . . . . . . (13) — 5 — (8)
Net cash provided by (used in) continuingfinancing activities . . . . . . . . . . . . . . . . . . . . 1,004 (1,747) (764) 2,011 504
Net cash provided by (used in) discontinuedfinancing activities . . . . . . . . . . . . . . . . . . . . — — (73) — (73)
Net cash provided by (used in) financingactivities . . . . . . . . . . . . . . . . . . . . . . . . . . 1,004 (1,747) (837) 2,011 431
Effect of currency translation on cash . . . . . . . . . . — — 46 — 46Net increase (decrease) in cash and cash
equivalents . . . . . . . . . . . . . . . . . . . . . . . . . . 2 — 472 — 474Less: net (increase) decrease in cash and cash
equivalents related to discontinued operations . . — — (3) — (3)Cash and cash equivalents at beginning of fiscal
year . . . . . . . . . . . . . . . . . . . . . . . . . . . . . . . — — 473 — 473Cash and cash equivalents at end of fiscal year . . . $ 2 $ — $ 942 $ — $ 944
138
TYCO ELECTRONICS LTD.
NOTES TO CONSOLIDATED AND COMBINED FINANCIAL STATEMENTS (Continued)
28. Disclosures Required by Swiss Law
Following the Change of Domicile, the Company became subject to statutory reportingrequirements in Switzerland. The following disclosures are presented in accordance with, and are basedon definitions contained in, the Swiss Code of Obligations.
Personnel Expenses
Total personnel expenses were $2,931 million and $3,686 million in fiscal 2009 and 2008,respectively.
Fire Insurance Value
The fire insurance value of property, plant, and equipment was $10,258 million and $9,778 millionat year end fiscal 2009 and 2008, respectively.
Risk Assessment
The Company’s Board of Directors is responsible for appraising the Company’s major risks andoverseeing that appropriate risk management and control procedures are in place. The AuditCommittee of the Board meets to review and discuss, as determined to be appropriate, withmanagement, the internal auditor, and the independent registered public accountants, the Company’smajor financial and accounting risk exposures and related policies and practices to assess and controlsuch exposures, and assist the Board in fulfilling its oversight responsibilities regarding the Company’spolicies and guidelines with respect to risk assessment and risk management.
The Company’s risk assessment process was in place upon Separation from Tyco International andfollowed by the Board of Directors.
139
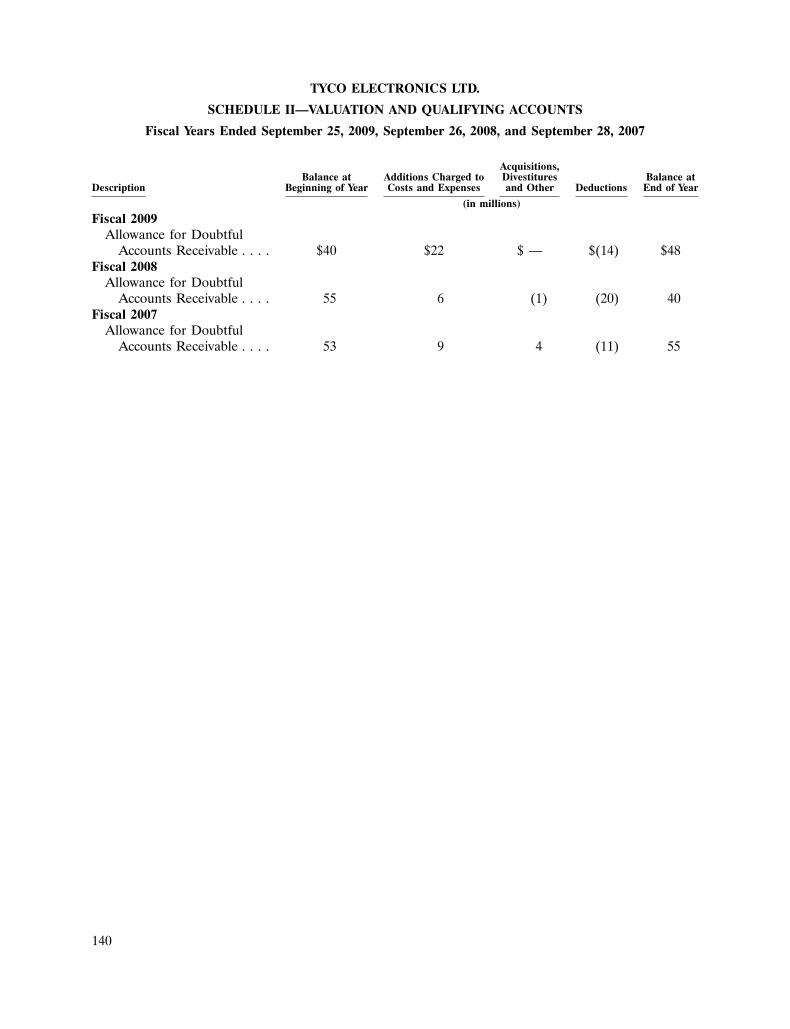
TYCO ELECTRONICS LTD.
SCHEDULE II—VALUATION AND QUALIFYING ACCOUNTS
Fiscal Years Ended September 25, 2009, September 26, 2008, and September 28, 2007
Acquisitions,Balance at Additions Charged to Divestitures Balance at
Description Beginning of Year Costs and Expenses and Other Deductions End of Year
(in millions)
Fiscal 2009Allowance for Doubtful
Accounts Receivable . . . . $40 $22 $ — $(14) $48Fiscal 2008
Allowance for DoubtfulAccounts Receivable . . . . 55 6 (1) (20) 40
Fiscal 2007Allowance for Doubtful
Accounts Receivable . . . . 53 9 4 (11) 55
140
REPORT OF THE STATUTORY AUDITOR ON THE CONSOLIDATEDFINANCIAL STATEMENTS OF TYCO ELECTRONICS LTD.
To the General meeting ofTYCO ELECTRONICS LTD., SCHAFFHAUSEN
Report of the statutory auditor on the consolidated financial statements
As statutory auditor, we have audited the accompanying consolidated financial statements of TycoElectronics Ltd., which comprise the balance sheet, statement of operations, statement of equity,statement of cash flows and notes (pages 58-139) for the year ended September 25, 2009.
Board of Directors’ Responsibility
The Board of Directors is responsible for the preparation and fair presentation of the consolidatedfinancial statements in accordance with accounting principles generally accepted in the United States ofAmerica (‘‘US GAAP’’) and the requirements of Swiss law (‘‘CO’’). This responsibility includesdesigning, implementing and maintaining an internal control system relevant to the preparation and fairpresentation of the consolidated financial statements that are free from material misstatement, whetherdue to fraud or error. The Board of Directors is further responsible for selecting and applyingappropriate accounting policies and making accounting estimates that are reasonable in thecircumstances.
Auditor’s Responsibility
Our responsibility is to express an opinion on these consolidated financial statements based on ouraudit. We conducted our audit in accordance with Swiss law, Swiss Auditing Standards and inaccordance with the auditing standards of the Public Company Accounting Oversight Board (UnitedStates). Those standards require that we plan and perform the audit to obtain reasonable assurancewhether the consolidated financial statements are free from material misstatement.
An audit involves performing procedures to obtain audit evidence about the amounts anddisclosures in the consolidated financial statements. The procedures selected depend on the auditor’sjudgment, including the assessment of the risks of material misstatement of the consolidated financialstatements, whether due to fraud or error. In making those risk assessments, the auditor considers theinternal control system relevant to the entity’s preparation and fair presentation of the consolidatedfinancial statements in order to design audit procedures that are appropriate in the circumstances, butnot for the purpose of expressing an opinion on the effectiveness of the entity’s internal control system.An audit also includes evaluating the appropriateness of the accounting policies used and thereasonableness of accounting estimates made, as well as evaluating the overall presentation of theconsolidated financial statements. We believe that the audit evidence we have obtained is sufficient andappropriate to provide a basis for our audit opinion.
Opinion
In our opinion, the consolidated financial statements for the year ended September 25, 2009present fairly, in all material respects, the financial position of the Company and the results of itsoperations and its cash flows in accordance with accounting principles generally accepted in the UnitedStates of America and comply with Swiss law.
141
Report on Other Legal Requirements
We confirm that we meet the legal requirements on licensing. according to the Auditor OversightAct (‘‘AOA’’), and independence (Article 728 CO and Article 11 AOA), and that there are nocircumstances incompatible with our independence.
In accordance with Article 728a, paragraph 1, item 3, CO, and Swiss Auditing Standard 890, weconfirm that an internal control system exists, which has been designed for the preparation of theconsolidated financial statements according to the instructions of the Board of Directors.
We recommend that the consolidated financial statements submitted to you be approved.
Deloitte AG
/s/ James D. Horiguchi /s/ Martin WelserLicensed Audit Expert Licensed Audit ExpertAuditor in charge
Zurich, November 18, 2009
142

TYCO ELECTRONICS LTD.
INDEX TO SWISS STATUTORY FINANCIAL STATEMENTS
Page
Statements of Operations for the Period from June 22, 2009 to September 25, 2009 . . . . . . . . . . 144
Balance Sheets as of September 25, 2009 and June 22, 2009 . . . . . . . . . . . . . . . . . . . . . . . . . . . 145
Notes to Swiss Statutory Financial Statements . . . . . . . . . . . . . . . . . . . . . . . . . . . . . . . . . . . . . . 146
Report of Statutory Auditor . . . . . . . . . . . . . . . . . . . . . . . . . . . . . . . . . . . . . . . . . . . . . . . . . . . 158
143
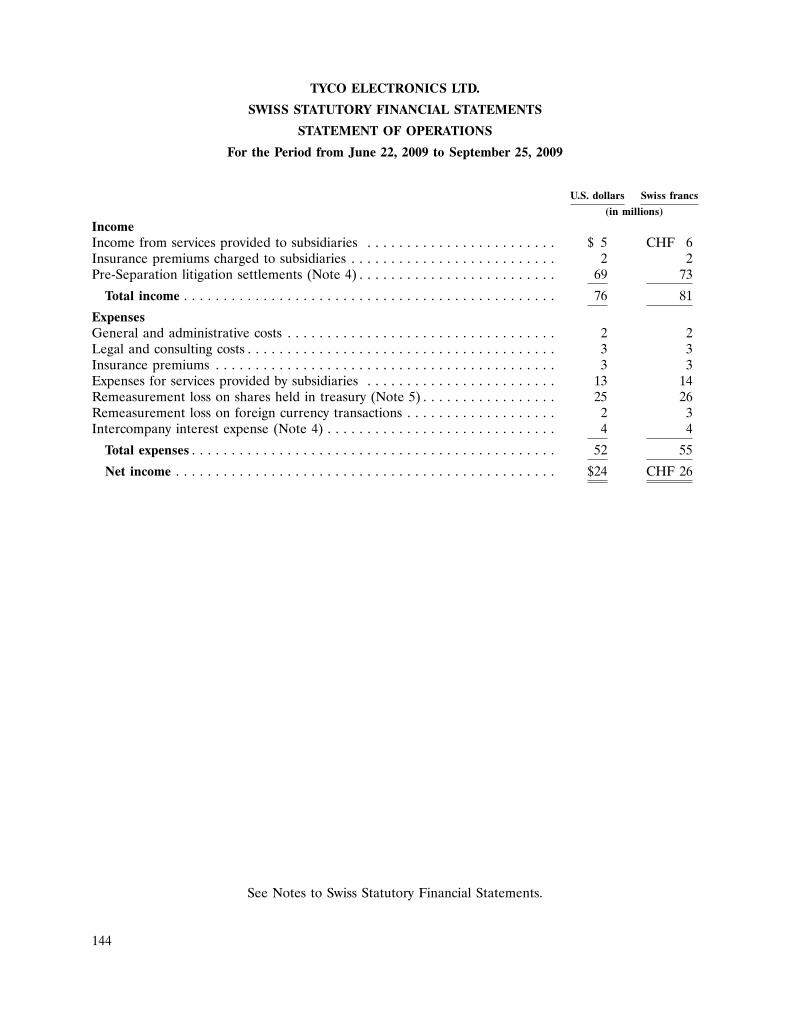
TYCO ELECTRONICS LTD.
SWISS STATUTORY FINANCIAL STATEMENTS
STATEMENT OF OPERATIONS
For the Period from June 22, 2009 to September 25, 2009
U.S. dollars Swiss francs
(in millions)
IncomeIncome from services provided to subsidiaries . . . . . . . . . . . . . . . . . . . . . . . . $ 5 CHF 6Insurance premiums charged to subsidiaries . . . . . . . . . . . . . . . . . . . . . . . . . . 2 2Pre-Separation litigation settlements (Note 4) . . . . . . . . . . . . . . . . . . . . . . . . . 69 73
Total income . . . . . . . . . . . . . . . . . . . . . . . . . . . . . . . . . . . . . . . . . . . . . . . 76 81
ExpensesGeneral and administrative costs . . . . . . . . . . . . . . . . . . . . . . . . . . . . . . . . . . 2 2Legal and consulting costs . . . . . . . . . . . . . . . . . . . . . . . . . . . . . . . . . . . . . . . 3 3Insurance premiums . . . . . . . . . . . . . . . . . . . . . . . . . . . . . . . . . . . . . . . . . . . 3 3Expenses for services provided by subsidiaries . . . . . . . . . . . . . . . . . . . . . . . . 13 14Remeasurement loss on shares held in treasury (Note 5) . . . . . . . . . . . . . . . . . 25 26Remeasurement loss on foreign currency transactions . . . . . . . . . . . . . . . . . . . 2 3Intercompany interest expense (Note 4) . . . . . . . . . . . . . . . . . . . . . . . . . . . . . 4 4
Total expenses . . . . . . . . . . . . . . . . . . . . . . . . . . . . . . . . . . . . . . . . . . . . . . 52 55
Net income . . . . . . . . . . . . . . . . . . . . . . . . . . . . . . . . . . . . . . . . . . . . . . . . $24 CHF 26
See Notes to Swiss Statutory Financial Statements.
144
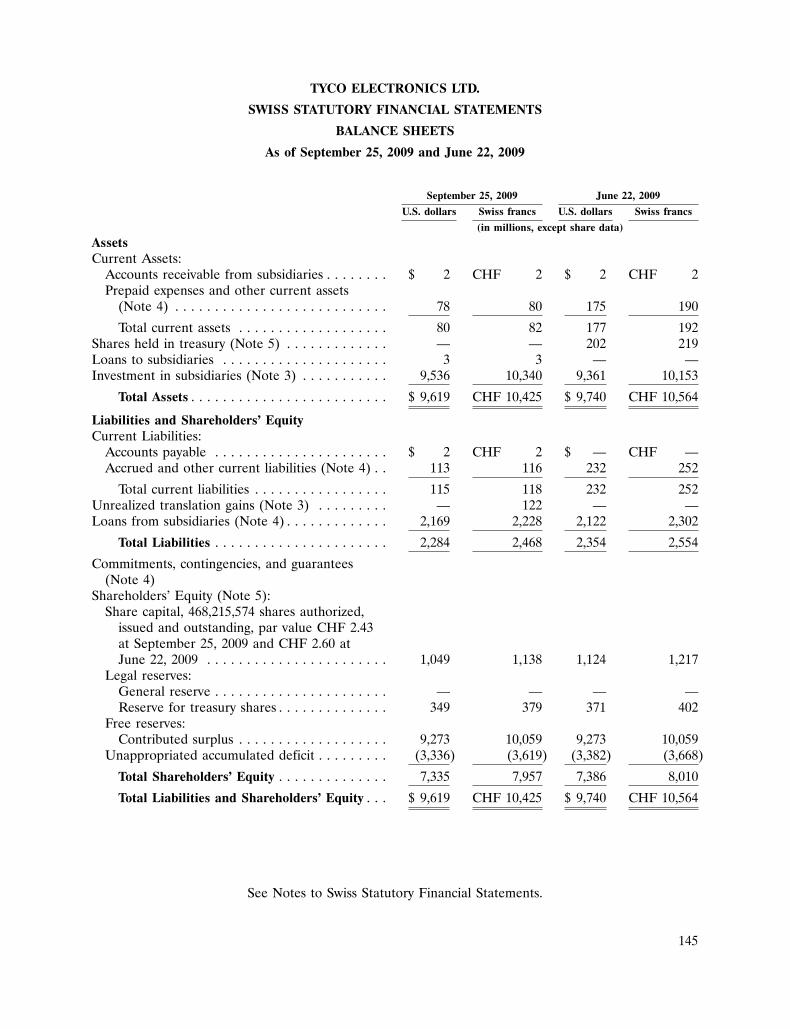
TYCO ELECTRONICS LTD.
SWISS STATUTORY FINANCIAL STATEMENTS
BALANCE SHEETS
As of September 25, 2009 and June 22, 2009
September 25, 2009 June 22, 2009
U.S. dollars Swiss francs U.S. dollars Swiss francs
(in millions, except share data)
AssetsCurrent Assets:
Accounts receivable from subsidiaries . . . . . . . . $ 2 CHF 2 $ 2 CHF 2Prepaid expenses and other current assets
(Note 4) . . . . . . . . . . . . . . . . . . . . . . . . . . . 78 80 175 190
Total current assets . . . . . . . . . . . . . . . . . . . 80 82 177 192Shares held in treasury (Note 5) . . . . . . . . . . . . . — — 202 219Loans to subsidiaries . . . . . . . . . . . . . . . . . . . . . 3 3 — —Investment in subsidiaries (Note 3) . . . . . . . . . . . 9,536 10,340 9,361 10,153
Total Assets . . . . . . . . . . . . . . . . . . . . . . . . . $ 9,619 CHF 10,425 $ 9,740 CHF 10,564
Liabilities and Shareholders’ EquityCurrent Liabilities:
Accounts payable . . . . . . . . . . . . . . . . . . . . . . $ 2 CHF 2 $ — CHF —Accrued and other current liabilities (Note 4) . . 113 116 232 252
Total current liabilities . . . . . . . . . . . . . . . . . 115 118 232 252Unrealized translation gains (Note 3) . . . . . . . . . — 122 — —Loans from subsidiaries (Note 4) . . . . . . . . . . . . . 2,169 2,228 2,122 2,302
Total Liabilities . . . . . . . . . . . . . . . . . . . . . . 2,284 2,468 2,354 2,554
Commitments, contingencies, and guarantees(Note 4)
Shareholders’ Equity (Note 5):Share capital, 468,215,574 shares authorized,
issued and outstanding, par value CHF 2.43at September 25, 2009 and CHF 2.60 atJune 22, 2009 . . . . . . . . . . . . . . . . . . . . . . . 1,049 1,138 1,124 1,217
Legal reserves:General reserve . . . . . . . . . . . . . . . . . . . . . . — — — —Reserve for treasury shares . . . . . . . . . . . . . . 349 379 371 402
Free reserves:Contributed surplus . . . . . . . . . . . . . . . . . . . 9,273 10,059 9,273 10,059
Unappropriated accumulated deficit . . . . . . . . . (3,336) (3,619) (3,382) (3,668)
Total Shareholders’ Equity . . . . . . . . . . . . . . 7,335 7,957 7,386 8,010
Total Liabilities and Shareholders’ Equity . . . $ 9,619 CHF 10,425 $ 9,740 CHF 10,564
See Notes to Swiss Statutory Financial Statements.
145
TYCO ELECTRONICS LTD.
NOTES TO SWISS STATUTORY FINANCIAL STATEMENTS
1. Basis of Presentation
Tyco Electronics Ltd. (‘‘Tyco Electronics’’ or the ‘‘Company’’) is the ultimate holding company ofTyco Electronics Ltd. and its subsidiaries (the ‘‘Tyco Electronics Group’’ or the ‘‘Group’’) with a listingon the New York Stock Exchange.
Change of Domicile
At a special general meeting on June 22, 2009, the Company’s shareholders approved a proposalto move the Company’s jurisdiction of incorporation from Bermuda to Switzerland. Effective June 25,2009, the Company discontinued its existence as a Bermuda company as provided in Section 132G ofThe Companies Act of 1981 of Bermuda, as amended, and, in accordance with article 161 of the SwissFederal Code on International Private Law, continued its existence as a Swiss corporation underarticles 620 et seq. of the Swiss Code of Obligations (the ‘‘Change of Domicile’’). The rights of holdersof the Company’s shares are now governed by Swiss law, the Company’s Swiss articles of association,and its Swiss organizational regulations.
The balance sheet at June 22, 2009 has been presented as the comparative to the accompanyingbalance sheet at September 25, 2009. Also, the accompanying statement of operations reflects theresults of operations for the period from June 22, 2009 to September 25, 2009.
Information in Notes 6 and 7 is presented for the fiscal year ended September 25, 2009, which isdeemed more relevant than partial year amounts corresponding with the period shown in the statementof operations. In addition, Notes 6 through 8 are consistent with similar information publicly availablevia regulatory filings with the U.S. Securities and Exchange Commission (the ‘‘SEC’’) and,consequently, are presented in U.S. dollars only.
Basis of Presentation
The accompanying financial statements have been prepared in accordance with the requirements ofSwiss law for companies, the Swiss Code of Obligations. The financial statements present the results ofthe holding company on a stand alone basis and do not represent the consolidated operations of theholding company and its subsidiaries.
2. Risk Assessment
The Company’s Board of Directors is responsible for appraising the Tyco Electronics Group’smajor risks and overseeing that appropriate risk management and control procedures are in place. TheAudit Committee of the Board meets to review and discuss, as determined to be appropriate, withmanagement, the internal auditor, and the independent registered public accountants, the Group’smajor financial and accounting risk exposures and related policies and practices to assess and controlsuch exposures, and assist the Board in fulfilling its oversight responsibilities regarding the Group’spolicies and guidelines with respect to risk assessment and risk management.
The Tyco Electronics Group’s risk assessment process was in place for the reporting period andfollowed by the Board of Directors. Tyco Electronics Ltd., as the ultimate holding company of the TycoElectronics Group, is fully integrated into the Group-wide risk assessment process.
146
TYCO ELECTRONICS LTD.
NOTES TO SWISS STATUTORY FINANCIAL STATEMENTS (Continued)
3. Summary of Significant Accounting Policies
Investment in Subsidiaries
Investments in subsidiaries are equity interests, which are held on a long-term basis for thepurpose of the Company’s business activities. Investments in subsidiaries, on an aggregate basis, arecarried at a value no higher than cost less adjustments for impairment. The cost basis at June 22, 2009was determined when the Company effected its Change of Domicile. No impairments were recordedduring the period from June 22, 2009 through September 25, 2009.
Currency Translation
The Company’s functional currency is the U.S. dollar. The Company presents financial statementsin both U.S. dollars and Swiss francs (‘‘CHF’’). Assets and liabilities in U.S. dollars are converted toSwiss francs for presentation purposes using historical and current foreign exchange rates, asappropriate. Revenue and expenses are translated using the average exchange rates in effect for theperiod presented. Net unrealized foreign currency translation gains are deferred in the balance sheet,while translation losses and realized translation gains and losses are reflected in the statement ofoperations.
4. Commitments, Contingencies, and Guarantees
Debt
The Company maintains a revolving credit line with a wholly-owned subsidiary that bears interestat 1-month LIBOR plus 0.40% (0.65% and 0.72% at September 25, 2009 and June 22, 2009,respectively). The revolving credit line does not have a limit on the amount drawable and matures inApril 2017. At September 25, 2009 and June 22, 2009, CHF 2,228 million and CHF 2,302 million wasoutstanding under the revolving credit line, respectively.
The Company has fully and unconditionally guaranteed the debt of its subsidiary, Tyco ElectronicsGroup S.A. (‘‘TEGSA’’), totaling approximately CHF 2,300 and CHF 2,608 million at September 25,2009 and June 22, 2009, respectively. As of September 25, 2009, the Company has not been required toperform on its guarantee.
Guarantees Related to Separation from Tyco International Ltd.
The Company is a party to the Tax Sharing Agreement (‘‘TSA’’) and the Separation andDistribution Agreement (‘‘S&DA’’) with Tyco International Ltd. (‘‘Tyco International’’) andCovidien plc. (‘‘Covidien’’).
The S&DA provided for the allocation among the parties of Tyco International’s assets, liabilities,and obligations attributable to periods prior to the Company’s and Covidien’s separation from TycoInternational on June 29, 2007 (the ‘‘Separation’’). Under the S&DA, the Company assumed theliability for, and control of, all pending and threatened legal matters at Separation related to theCompany’s business or assumed or retained liabilities, and will indemnify the other parties for anyliability arising out of or resulting from such assumed legal matters. Tyco Electronics remainsresponsible for 31% of certain potential liabilities that may arise from litigation pending or threatenedat Separation that was not allocated to one of the three parties, and Tyco International and Covidienare responsible for 27% and 42%, respectively, of such liabilities. If any party defaults in payment of itsallocated share of any such liability, each non-defaulting party will be responsible for an equal portion
147
TYCO ELECTRONICS LTD.
NOTES TO SWISS STATUTORY FINANCIAL STATEMENTS (Continued)
4. Commitments, Contingencies, and Guarantees (Continued)
of the amount in default together with any other non-defaulting party, although any such payments willnot release the obligation of the defaulting party. Subject to the terms and conditions of the S&DA,Tyco International manages and controls all the legal matters related to the shared contingentliabilities, including the defense or settlement thereof, subject to certain limitations. All costs andexpenses that Tyco International incurs in connection with the defense of such litigation, other than theamount of any judgment or settlement, which will be allocated in the manner described above, will beborne equally by Tyco International, Covidien, and the Company. Until settlement of a matter subjectto the S&DA, liabilities are considered to be joint and several against all parties.
As of September 25, 2009 and June 22, 2009, the Company’s balance sheet included estimated losscontingencies related to the S&DA of CHF 109 million and CHF 245 million, respectively, in Accruedand other current liabilities. Pursuant to the S&DA, the Company’s balance sheet included receivablesfrom Tyco International and Covidien totaling CHF 75 million and CHF 169 million at September 25,2009 and June 22, 2009, respectively, in Prepaid expenses and other current assets. During the periodfrom June 22, 2009 through September 25, 2009, the Company reversed an accrual of approximatelyCHF 73 million by transferring the obligation to a subsidiary, paid approximately CHF 18 million toTyco International to settle certain litigation, and received approximately CHF 50 million from TycoInternational and Covidien related to a settlement payment made by a subsidiary of the Company.
Similar to the S&DA, the TSA establishes responsibility for income tax positions and contingenciesattributable to periods prior to Separation from Tyco International. Under the TSA, the sharingpercentages and obligation to perform in the event of default are consistent with the requirements ofthe S&DA. The Company did not record any activity related to the TSA during the period fromJune 22, 2009 to September 25, 2009.
Performance Guarantees
The Company, from time to time, provides performance guarantees and surety bonds in favor ofits subsidiaries. At September 25, 2009 and June 22, 2009, these performance guarantees totaledCHF 413 million and CHF 436 million, respectively. The Company does not anticipate having toperform under these guarantees.
5. Equity
Change of Domicile
Effective June 25, 2009, the Company changed its jurisdiction of incorporation from Bermuda toSwitzerland. In connection with the Change of Domicile and in accordance with the laws ofSwitzerland, the par value of the Company’s common shares increased from $0.20 per share toCHF 2.60 per share. The Change of Domicile was approved at a special meeting of shareholders heldon June 22, 2009. The following steps occurred in connection with the Change of Domicile, which didnot result in a change to total Shareholders’ Equity:
1) the par value of common shares was increased from $0.20 to CHF 2.60 through a 1-for-12reverse share split, followed by the issuance of 11 fully paid bonus shares so that the samenumber of shares were outstanding before and after the Change of Domicile but with anincreased par value per share, which reduced contributed surplus by CHF 1,194 million with acorresponding increase to common shares;
148
TYCO ELECTRONICS LTD.
NOTES TO SWISS STATUTORY FINANCIAL STATEMENTS (Continued)
5. Equity (Continued)
2) the cancellation of approximately 32 million shares held in treasury;
3) the elimination of share premium with a corresponding increase to contributed surplus, all ofwhich was designated as freely distributable reserves for Swiss corporate law purposes; and
4) the elimination of 125 million authorized preferred shares, none of which were issued andoutstanding.
The effects of the Change of Domicile are included in the balance sheet as of June 22, 2009.
Common Shares
As a result of the adoption of the Company’s new articles of association in connection with theChange of Domicile but prior to the distribution to shareholders discussed under ‘‘Distributions toShareholders’’ below, the Company’s ordinary share capital was CHF 1,217 million with 468 millionregistered common shares and a par value of CHF 2.60. Following the distribution to shareholders inSeptember 2009, the Company’s ordinary share capital was CHF 1,138 million with 468 millionregistered common shares and a par value of CHF 2.43.
Authorized Share Capital
Subject to certain conditions specified in the articles of association, the shareholders haveauthorized the Company’s Board of Directors to increase the Company’s share capital by issuing up to234 million authorized shares. The authorization expires on June 22, 2011. As of September 25, 2009,no authorized shares had been issued.
Conditional Share Capital
Subject to certain conditions specified in the articles of association, the shareholders haveauthorized the Company’s Board of Directors to increase the Company’s share capital by issuing up to234 million conditional shares. As of September 25, 2009, no conditional shares had been issued.
Common Shares Held in Treasury
During the period from June 22, 2009 to September 25, 2009, activity related to common sharesheld in treasury was as follows:
Number of Fair Value Total CostShares (in millions CHF) (in millions CHF)
Held by the Company as of June 22, 2009 . . . . . . . . . . . . 10,000,000 219 402Additions . . . . . . . . . . . . . . . . . . . . . . . . . . . . . . . . . . 26,782 1 —Disposals . . . . . . . . . . . . . . . . . . . . . . . . . . . . . . . . . . (445,810) (10) (17)Remeasurement loss prior to transfer to subsidiaries . . — (26) —Transfers to subsidiary . . . . . . . . . . . . . . . . . . . . . . . . (9,580,972) (184) (385)
Held by the Company as of September 25, 2009 . . . . . . . — — —
On July 1, 2009, the Company transferred approximately 9.6 million common shares held intreasury to a subsidiary. As a result of the transfer, the Company no longer holds common shares in
149
TYCO ELECTRONICS LTD.
NOTES TO SWISS STATUTORY FINANCIAL STATEMENTS (Continued)
5. Equity (Continued)
treasury. A remeasurement loss of CHF 26 million was recorded in the Statement of Operations as aresult of treasury share activity until the transfer.
In September 2007, the Company’s Board of Directors authorized a share repurchase program of$750 million (approximately CHF 770 million) to purchase a portion of the Company’s outstandingcommon shares. The Company’s Board of Directors authorized increases in the share repurchaseprogram to $2,000 million (approximately CHF 2,055 million) in 2008. To date, the Company purchasedapproximately 43 million common shares for $1,394 million (approximately CHF 1,432 million) underthis program. There were no repurchases during the period from June 22, 2009 through September 25,2009.
Contributed surplus
Contributed surplus, subject to certain conditions, is a distributable reserve. No distributions weremade from contributed surplus during the period June 22, 2009 through September 25, 2009.
General Reserve
To comply with the Swiss Code of Obligations, 5% of annual net income must be appropriated tothe general reserve until the general reserve equals 20% of the share capital of the Company. Becauseof the Company’s accumulated deficit position, the Company has not proposed any appropriations tothe general reserve. The general reserve is not a distributable reserve.
Distributions to Shareholders
Under current Swiss law, distributions to shareholders made in the form of a reduction ofregistered share capital are exempt from Swiss withholding tax. Beginning on January 1, 2011, subjectto the adoption of implementing regulations and amendments to Swiss tax law, distributions toshareholders made out of contributed surplus will be exempt from Swiss withholding tax. Distributionsor dividends on the Company’s shares must be approved by the Company’s shareholders.
On June 22, 2009, following the Change of Domicile, the Company’s shareholders approved a cashdistribution to shareholders in the form of a capital reduction to the par value of the Company’scommon shares of CHF 0.17 per share. During the quarter ended September 25, 2009, the distributionwas paid in U.S. Dollars at a rate of $0.16 per share. This capital reduction reduced the par value ofthe Company’s common shares from CHF 2.60 to CHF 2.43.
Upon approval by the shareholders of the cash distribution in the form of a capital reduction, theCompany records a liability with a corresponding charge to common shares. There were no unpaiddividends and distributions to shareholders as of September 25, 2009.
6. Executive Compensation
The following table summarizes the compensation of the named executive officers for the fiscalyear ended September 25, 2009 (‘‘fiscal 2009’’). The named executive officers are the Company’sprincipal executive officer, principal financial officer and the three other most highly compensatedexecutives.
150
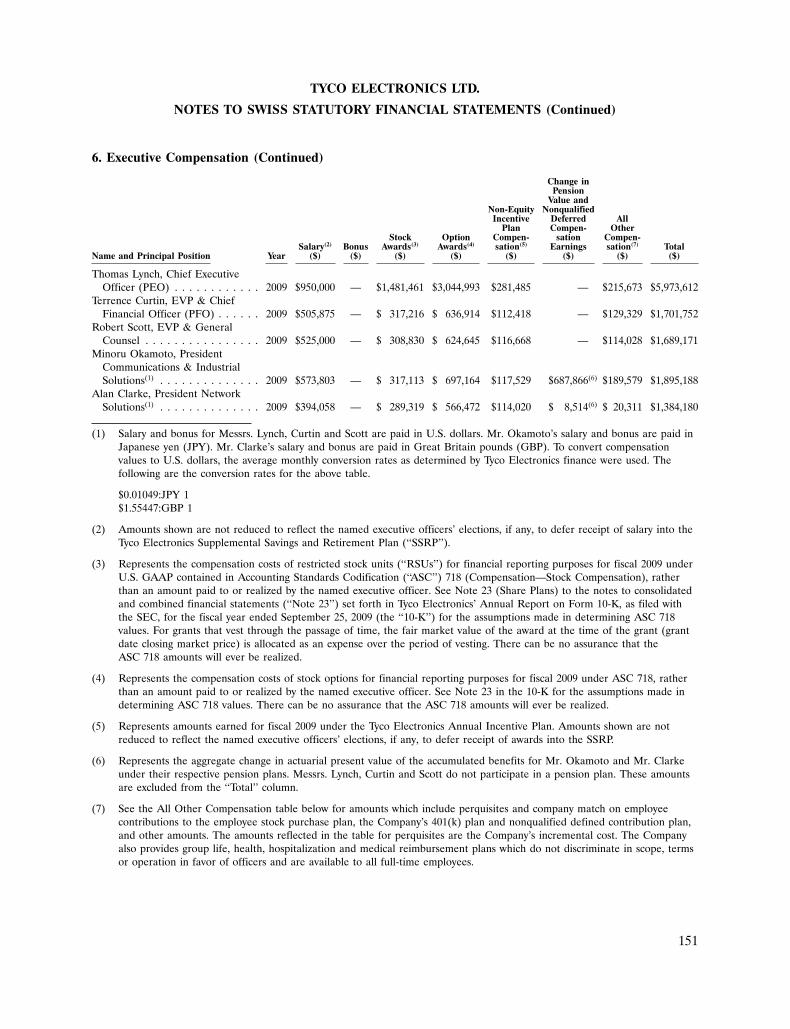
TYCO ELECTRONICS LTD.
NOTES TO SWISS STATUTORY FINANCIAL STATEMENTS (Continued)
6. Executive Compensation (Continued)
Change inPension
Value andNon-Equity Nonqualified
Incentive Deferred AllPlan Compen- Other
Stock Option Compen- sation Compen-Salary(2) Bonus Awards(3) Awards(4) sation(5) Earnings sation(7) Total
Name and Principal Position Year ($) ($) ($) ($) ($) ($) ($) ($)
Thomas Lynch, Chief ExecutiveOfficer (PEO) . . . . . . . . . . . . 2009 $950,000 — $1,481,461 $3,044,993 $281,485 — $215,673 $5,973,612
Terrence Curtin, EVP & ChiefFinancial Officer (PFO) . . . . . . 2009 $505,875 — $ 317,216 $ 636,914 $112,418 — $129,329 $1,701,752
Robert Scott, EVP & GeneralCounsel . . . . . . . . . . . . . . . . 2009 $525,000 — $ 308,830 $ 624,645 $116,668 — $114,028 $1,689,171
Minoru Okamoto, PresidentCommunications & IndustrialSolutions(1) . . . . . . . . . . . . . . 2009 $573,803 — $ 317,113 $ 697,164 $117,529 $687,866(6) $189,579 $1,895,188
Alan Clarke, President NetworkSolutions(1) . . . . . . . . . . . . . . 2009 $394,058 — $ 289,319 $ 566,472 $114,020 $ 8,514(6) $ 20,311 $1,384,180
(1) Salary and bonus for Messrs. Lynch, Curtin and Scott are paid in U.S. dollars. Mr. Okamoto’s salary and bonus are paid inJapanese yen (JPY). Mr. Clarke’s salary and bonus are paid in Great Britain pounds (GBP). To convert compensationvalues to U.S. dollars, the average monthly conversion rates as determined by Tyco Electronics finance were used. Thefollowing are the conversion rates for the above table.
$0.01049:JPY 1$1.55447:GBP 1
(2) Amounts shown are not reduced to reflect the named executive officers’ elections, if any, to defer receipt of salary into theTyco Electronics Supplemental Savings and Retirement Plan (‘‘SSRP’’).
(3) Represents the compensation costs of restricted stock units (‘‘RSUs’’) for financial reporting purposes for fiscal 2009 underU.S. GAAP contained in Accounting Standards Codification (‘‘ASC’’) 718 (Compensation—Stock Compensation), ratherthan an amount paid to or realized by the named executive officer. See Note 23 (Share Plans) to the notes to consolidatedand combined financial statements (‘‘Note 23’’) set forth in Tyco Electronics’ Annual Report on Form 10-K, as filed withthe SEC, for the fiscal year ended September 25, 2009 (the ‘‘10-K’’) for the assumptions made in determining ASC 718values. For grants that vest through the passage of time, the fair market value of the award at the time of the grant (grantdate closing market price) is allocated as an expense over the period of vesting. There can be no assurance that theASC 718 amounts will ever be realized.
(4) Represents the compensation costs of stock options for financial reporting purposes for fiscal 2009 under ASC 718, ratherthan an amount paid to or realized by the named executive officer. See Note 23 in the 10-K for the assumptions made indetermining ASC 718 values. There can be no assurance that the ASC 718 amounts will ever be realized.
(5) Represents amounts earned for fiscal 2009 under the Tyco Electronics Annual Incentive Plan. Amounts shown are notreduced to reflect the named executive officers’ elections, if any, to defer receipt of awards into the SSRP.
(6) Represents the aggregate change in actuarial present value of the accumulated benefits for Mr. Okamoto and Mr. Clarkeunder their respective pension plans. Messrs. Lynch, Curtin and Scott do not participate in a pension plan. These amountsare excluded from the ‘‘Total’’ column.
(7) See the All Other Compensation table below for amounts which include perquisites and company match on employeecontributions to the employee stock purchase plan, the Company’s 401(k) plan and nonqualified defined contribution plan,and other amounts. The amounts reflected in the table for perquisites are the Company’s incremental cost. The Companyalso provides group life, health, hospitalization and medical reimbursement plans which do not discriminate in scope, termsor operation in favor of officers and are available to all full-time employees.
151
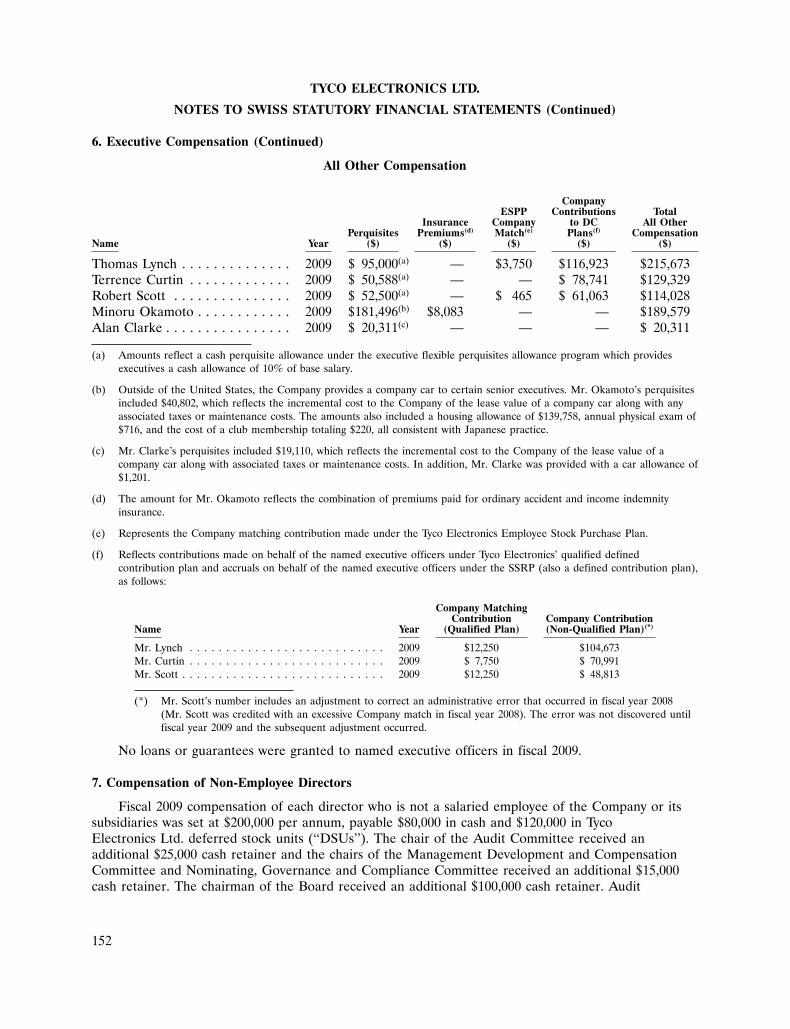
TYCO ELECTRONICS LTD.
NOTES TO SWISS STATUTORY FINANCIAL STATEMENTS (Continued)
6. Executive Compensation (Continued)
All Other Compensation
CompanyESPP Contributions Total
Insurance Company to DC All OtherPerquisites Premiums(d) Match(e) Plans(f) Compensation
Name Year ($) ($) ($) ($) ($)
Thomas Lynch . . . . . . . . . . . . . . 2009 $ 95,000(a) — $3,750 $116,923 $215,673Terrence Curtin . . . . . . . . . . . . . 2009 $ 50,588(a) — — $ 78,741 $129,329Robert Scott . . . . . . . . . . . . . . . 2009 $ 52,500(a) — $ 465 $ 61,063 $114,028Minoru Okamoto . . . . . . . . . . . . 2009 $181,496(b) $8,083 — — $189,579Alan Clarke . . . . . . . . . . . . . . . . 2009 $ 20,311(c) — — — $ 20,311
(a) Amounts reflect a cash perquisite allowance under the executive flexible perquisites allowance program which providesexecutives a cash allowance of 10% of base salary.
(b) Outside of the United States, the Company provides a company car to certain senior executives. Mr. Okamoto’s perquisitesincluded $40,802, which reflects the incremental cost to the Company of the lease value of a company car along with anyassociated taxes or maintenance costs. The amounts also included a housing allowance of $139,758, annual physical exam of$716, and the cost of a club membership totaling $220, all consistent with Japanese practice.
(c) Mr. Clarke’s perquisites included $19,110, which reflects the incremental cost to the Company of the lease value of acompany car along with associated taxes or maintenance costs. In addition, Mr. Clarke was provided with a car allowance of$1,201.
(d) The amount for Mr. Okamoto reflects the combination of premiums paid for ordinary accident and income indemnityinsurance.
(e) Represents the Company matching contribution made under the Tyco Electronics Employee Stock Purchase Plan.
(f) Reflects contributions made on behalf of the named executive officers under Tyco Electronics’ qualified definedcontribution plan and accruals on behalf of the named executive officers under the SSRP (also a defined contribution plan),as follows:
Company MatchingContribution Company Contribution
Name Year (Qualified Plan) (Non-Qualified Plan)(*)
Mr. Lynch . . . . . . . . . . . . . . . . . . . . . . . . . . . 2009 $12,250 $104,673Mr. Curtin . . . . . . . . . . . . . . . . . . . . . . . . . . . 2009 $ 7,750 $ 70,991Mr. Scott . . . . . . . . . . . . . . . . . . . . . . . . . . . . 2009 $12,250 $ 48,813
(*) Mr. Scott’s number includes an adjustment to correct an administrative error that occurred in fiscal year 2008(Mr. Scott was credited with an excessive Company match in fiscal year 2008). The error was not discovered untilfiscal year 2009 and the subsequent adjustment occurred.
No loans or guarantees were granted to named executive officers in fiscal 2009.
7. Compensation of Non-Employee Directors
Fiscal 2009 compensation of each director who is not a salaried employee of the Company or itssubsidiaries was set at $200,000 per annum, payable $80,000 in cash and $120,000 in TycoElectronics Ltd. deferred stock units (‘‘DSUs’’). The chair of the Audit Committee received anadditional $25,000 cash retainer and the chairs of the Management Development and CompensationCommittee and Nominating, Governance and Compliance Committee received an additional $15,000cash retainer. The chairman of the Board received an additional $100,000 cash retainer. Audit
152
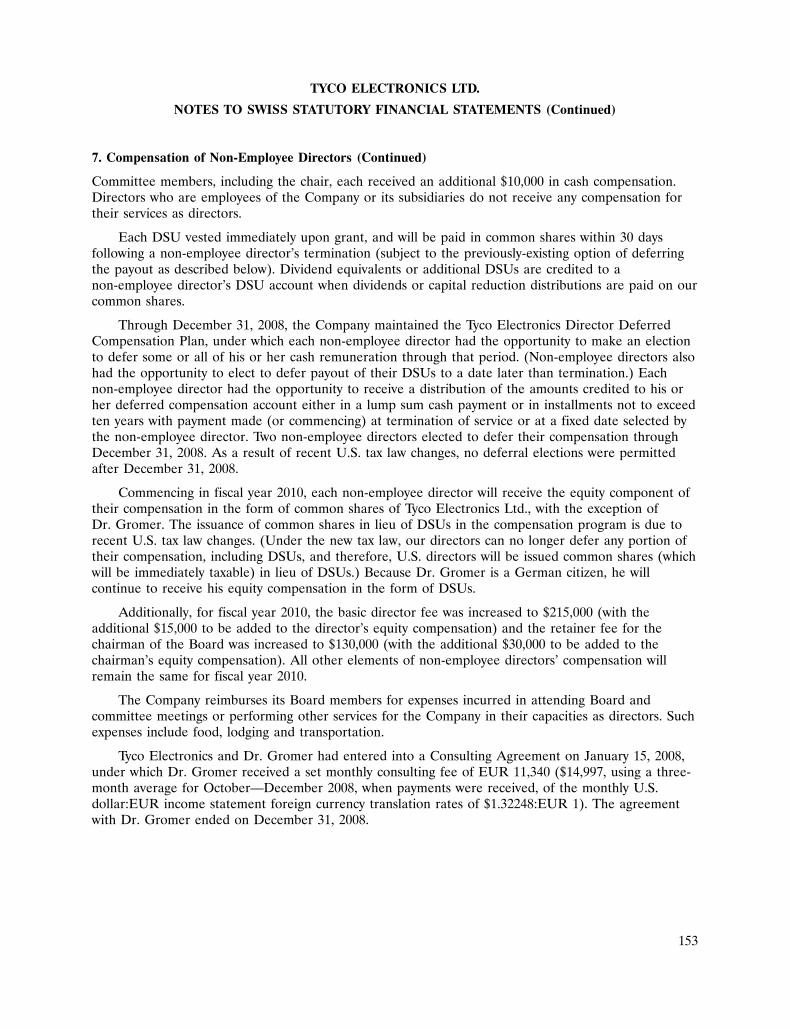
TYCO ELECTRONICS LTD.
NOTES TO SWISS STATUTORY FINANCIAL STATEMENTS (Continued)
7. Compensation of Non-Employee Directors (Continued)
Committee members, including the chair, each received an additional $10,000 in cash compensation.Directors who are employees of the Company or its subsidiaries do not receive any compensation fortheir services as directors.
Each DSU vested immediately upon grant, and will be paid in common shares within 30 daysfollowing a non-employee director’s termination (subject to the previously-existing option of deferringthe payout as described below). Dividend equivalents or additional DSUs are credited to anon-employee director’s DSU account when dividends or capital reduction distributions are paid on ourcommon shares.
Through December 31, 2008, the Company maintained the Tyco Electronics Director DeferredCompensation Plan, under which each non-employee director had the opportunity to make an electionto defer some or all of his or her cash remuneration through that period. (Non-employee directors alsohad the opportunity to elect to defer payout of their DSUs to a date later than termination.) Eachnon-employee director had the opportunity to receive a distribution of the amounts credited to his orher deferred compensation account either in a lump sum cash payment or in installments not to exceedten years with payment made (or commencing) at termination of service or at a fixed date selected bythe non-employee director. Two non-employee directors elected to defer their compensation throughDecember 31, 2008. As a result of recent U.S. tax law changes, no deferral elections were permittedafter December 31, 2008.
Commencing in fiscal year 2010, each non-employee director will receive the equity component oftheir compensation in the form of common shares of Tyco Electronics Ltd., with the exception ofDr. Gromer. The issuance of common shares in lieu of DSUs in the compensation program is due torecent U.S. tax law changes. (Under the new tax law, our directors can no longer defer any portion oftheir compensation, including DSUs, and therefore, U.S. directors will be issued common shares (whichwill be immediately taxable) in lieu of DSUs.) Because Dr. Gromer is a German citizen, he willcontinue to receive his equity compensation in the form of DSUs.
Additionally, for fiscal year 2010, the basic director fee was increased to $215,000 (with theadditional $15,000 to be added to the director’s equity compensation) and the retainer fee for thechairman of the Board was increased to $130,000 (with the additional $30,000 to be added to thechairman’s equity compensation). All other elements of non-employee directors’ compensation willremain the same for fiscal year 2010.
The Company reimburses its Board members for expenses incurred in attending Board andcommittee meetings or performing other services for the Company in their capacities as directors. Suchexpenses include food, lodging and transportation.
Tyco Electronics and Dr. Gromer had entered into a Consulting Agreement on January 15, 2008,under which Dr. Gromer received a set monthly consulting fee of EUR 11,340 ($14,997, using a three-month average for October—December 2008, when payments were received, of the monthly U.S.dollar:EUR income statement foreign currency translation rates of $1.32248:EUR 1). The agreementwith Dr. Gromer ended on December 31, 2008.
153
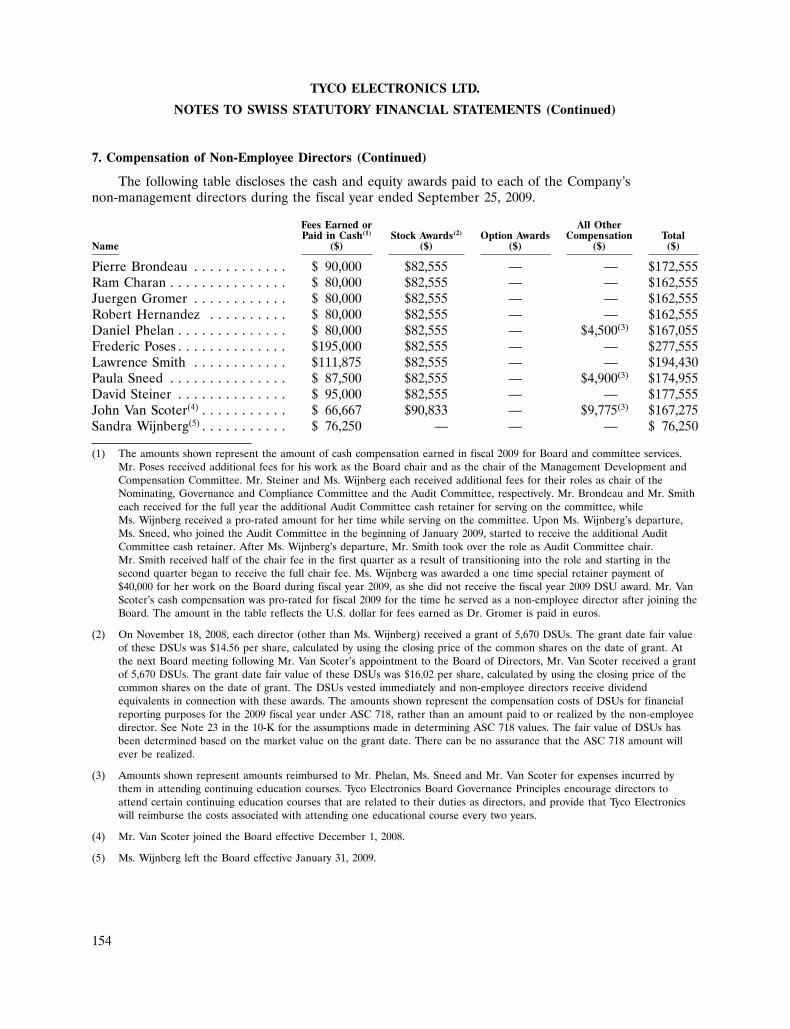
TYCO ELECTRONICS LTD.
NOTES TO SWISS STATUTORY FINANCIAL STATEMENTS (Continued)
7. Compensation of Non-Employee Directors (Continued)
The following table discloses the cash and equity awards paid to each of the Company’snon-management directors during the fiscal year ended September 25, 2009.
Fees Earned or All OtherPaid in Cash(1) Stock Awards(2) Option Awards Compensation Total
Name ($) ($) ($) ($) ($)
Pierre Brondeau . . . . . . . . . . . . $ 90,000 $82,555 — — $172,555Ram Charan . . . . . . . . . . . . . . . $ 80,000 $82,555 — — $162,555Juergen Gromer . . . . . . . . . . . . $ 80,000 $82,555 — — $162,555Robert Hernandez . . . . . . . . . . $ 80,000 $82,555 — — $162,555Daniel Phelan . . . . . . . . . . . . . . $ 80,000 $82,555 — $4,500(3) $167,055Frederic Poses . . . . . . . . . . . . . . $195,000 $82,555 — — $277,555Lawrence Smith . . . . . . . . . . . . $111,875 $82,555 — — $194,430Paula Sneed . . . . . . . . . . . . . . . $ 87,500 $82,555 — $4,900(3) $174,955David Steiner . . . . . . . . . . . . . . $ 95,000 $82,555 — — $177,555John Van Scoter(4) . . . . . . . . . . . $ 66,667 $90,833 — $9,775(3) $167,275Sandra Wijnberg(5) . . . . . . . . . . . $ 76,250 — — — $ 76,250
(1) The amounts shown represent the amount of cash compensation earned in fiscal 2009 for Board and committee services.Mr. Poses received additional fees for his work as the Board chair and as the chair of the Management Development andCompensation Committee. Mr. Steiner and Ms. Wijnberg each received additional fees for their roles as chair of theNominating, Governance and Compliance Committee and the Audit Committee, respectively. Mr. Brondeau and Mr. Smitheach received for the full year the additional Audit Committee cash retainer for serving on the committee, whileMs. Wijnberg received a pro-rated amount for her time while serving on the committee. Upon Ms. Wijnberg’s departure,Ms. Sneed, who joined the Audit Committee in the beginning of January 2009, started to receive the additional AuditCommittee cash retainer. After Ms. Wijnberg’s departure, Mr. Smith took over the role as Audit Committee chair.Mr. Smith received half of the chair fee in the first quarter as a result of transitioning into the role and starting in thesecond quarter began to receive the full chair fee. Ms. Wijnberg was awarded a one time special retainer payment of$40,000 for her work on the Board during fiscal year 2009, as she did not receive the fiscal year 2009 DSU award. Mr. VanScoter’s cash compensation was pro-rated for fiscal 2009 for the time he served as a non-employee director after joining theBoard. The amount in the table reflects the U.S. dollar for fees earned as Dr. Gromer is paid in euros.
(2) On November 18, 2008, each director (other than Ms. Wijnberg) received a grant of 5,670 DSUs. The grant date fair valueof these DSUs was $14.56 per share, calculated by using the closing price of the common shares on the date of grant. Atthe next Board meeting following Mr. Van Scoter’s appointment to the Board of Directors, Mr. Van Scoter received a grantof 5,670 DSUs. The grant date fair value of these DSUs was $16.02 per share, calculated by using the closing price of thecommon shares on the date of grant. The DSUs vested immediately and non-employee directors receive dividendequivalents in connection with these awards. The amounts shown represent the compensation costs of DSUs for financialreporting purposes for the 2009 fiscal year under ASC 718, rather than an amount paid to or realized by the non-employeedirector. See Note 23 in the 10-K for the assumptions made in determining ASC 718 values. The fair value of DSUs hasbeen determined based on the market value on the grant date. There can be no assurance that the ASC 718 amount willever be realized.
(3) Amounts shown represent amounts reimbursed to Mr. Phelan, Ms. Sneed and Mr. Van Scoter for expenses incurred bythem in attending continuing education courses. Tyco Electronics Board Governance Principles encourage directors toattend certain continuing education courses that are related to their duties as directors, and provide that Tyco Electronicswill reimburse the costs associated with attending one educational course every two years.
(4) Mr. Van Scoter joined the Board effective December 1, 2008.
(5) Ms. Wijnberg left the Board effective January 31, 2009.
154
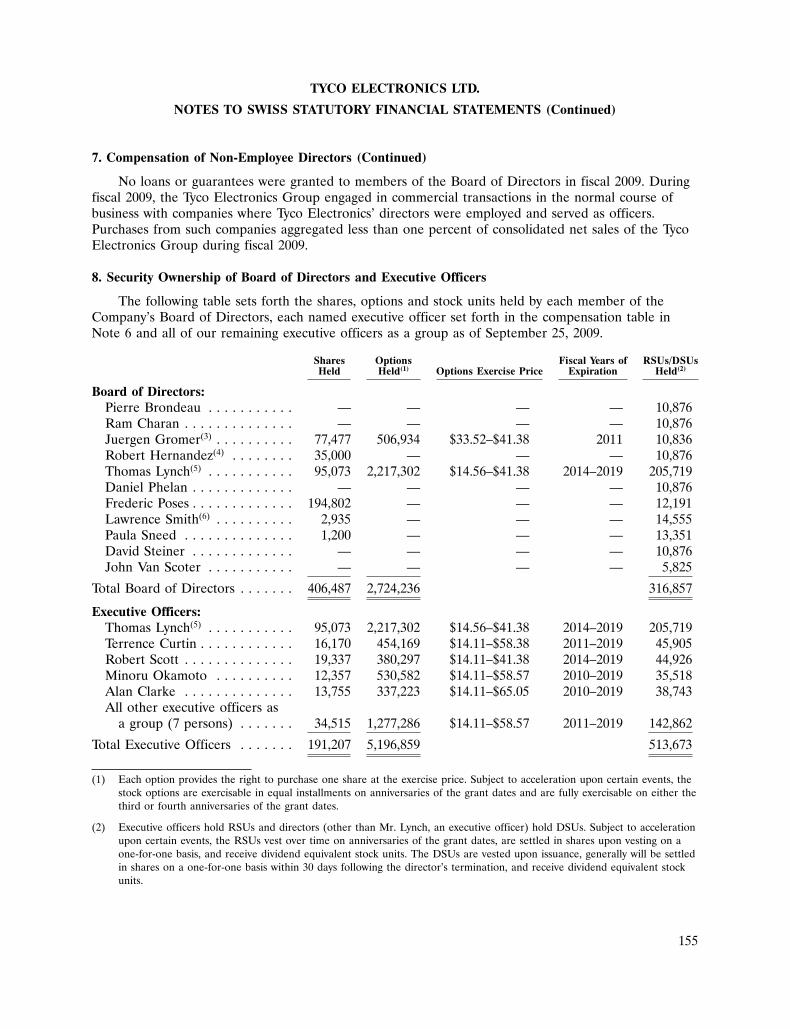
TYCO ELECTRONICS LTD.
NOTES TO SWISS STATUTORY FINANCIAL STATEMENTS (Continued)
7. Compensation of Non-Employee Directors (Continued)
No loans or guarantees were granted to members of the Board of Directors in fiscal 2009. Duringfiscal 2009, the Tyco Electronics Group engaged in commercial transactions in the normal course ofbusiness with companies where Tyco Electronics’ directors were employed and served as officers.Purchases from such companies aggregated less than one percent of consolidated net sales of the TycoElectronics Group during fiscal 2009.
8. Security Ownership of Board of Directors and Executive Officers
The following table sets forth the shares, options and stock units held by each member of theCompany’s Board of Directors, each named executive officer set forth in the compensation table inNote 6 and all of our remaining executive officers as a group as of September 25, 2009.
Shares Options Fiscal Years of RSUs/DSUsHeld Held(1) Options Exercise Price Expiration Held(2)
Board of Directors:Pierre Brondeau . . . . . . . . . . . — — — — 10,876Ram Charan . . . . . . . . . . . . . . — — — — 10,876Juergen Gromer(3) . . . . . . . . . . 77,477 506,934 $33.52–$41.38 2011 10,836Robert Hernandez(4) . . . . . . . . 35,000 — — — 10,876Thomas Lynch(5) . . . . . . . . . . . 95,073 2,217,302 $14.56–$41.38 2014–2019 205,719Daniel Phelan . . . . . . . . . . . . . — — — — 10,876Frederic Poses . . . . . . . . . . . . . 194,802 — — — 12,191Lawrence Smith(6) . . . . . . . . . . 2,935 — — — 14,555Paula Sneed . . . . . . . . . . . . . . 1,200 — — — 13,351David Steiner . . . . . . . . . . . . . — — — — 10,876John Van Scoter . . . . . . . . . . . — — — — 5,825
Total Board of Directors . . . . . . . 406,487 2,724,236 316,857
Executive Officers:Thomas Lynch(5) . . . . . . . . . . . 95,073 2,217,302 $14.56–$41.38 2014–2019 205,719Terrence Curtin . . . . . . . . . . . . 16,170 454,169 $14.11–$58.38 2011–2019 45,905Robert Scott . . . . . . . . . . . . . . 19,337 380,297 $14.11–$41.38 2014–2019 44,926Minoru Okamoto . . . . . . . . . . 12,357 530,582 $14.11–$58.57 2010–2019 35,518Alan Clarke . . . . . . . . . . . . . . 13,755 337,223 $14.11–$65.05 2010–2019 38,743All other executive officers as
a group (7 persons) . . . . . . . 34,515 1,277,286 $14.11–$58.57 2011–2019 142,862
Total Executive Officers . . . . . . . 191,207 5,196,859 513,673
(1) Each option provides the right to purchase one share at the exercise price. Subject to acceleration upon certain events, thestock options are exercisable in equal installments on anniversaries of the grant dates and are fully exercisable on either thethird or fourth anniversaries of the grant dates.
(2) Executive officers hold RSUs and directors (other than Mr. Lynch, an executive officer) hold DSUs. Subject to accelerationupon certain events, the RSUs vest over time on anniversaries of the grant dates, are settled in shares upon vesting on aone-for-one basis, and receive dividend equivalent stock units. The DSUs are vested upon issuance, generally will be settledin shares on a one-for-one basis within 30 days following the director’s termination, and receive dividend equivalent stockunits.
155
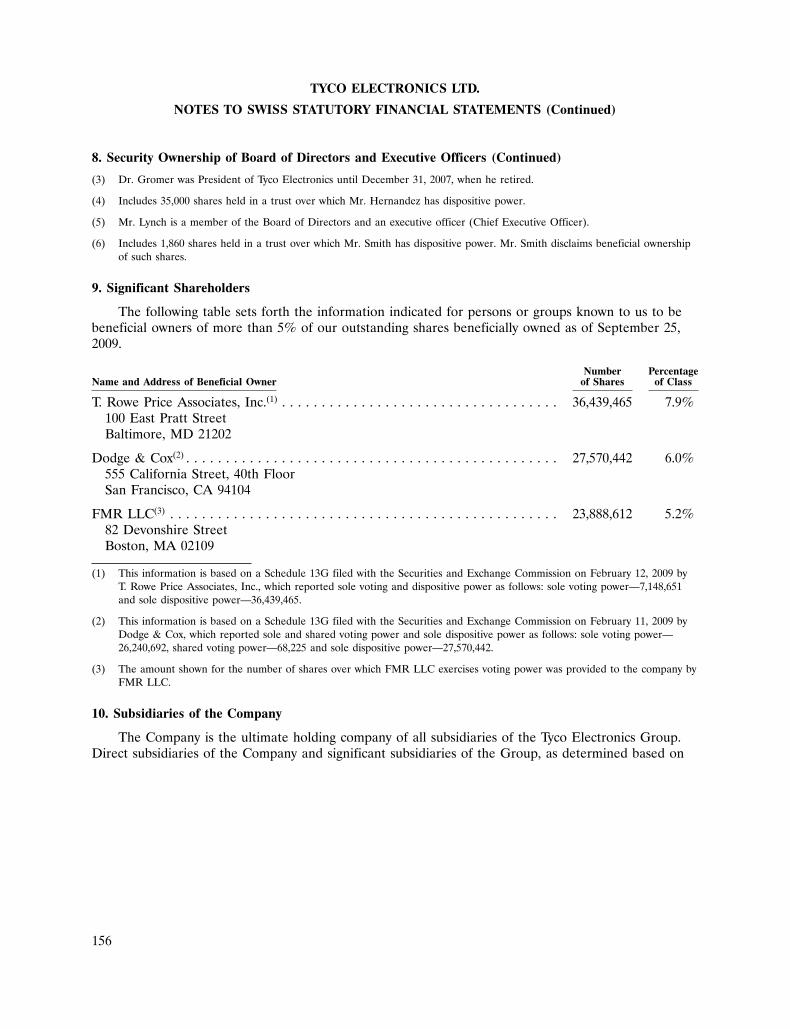
TYCO ELECTRONICS LTD.
NOTES TO SWISS STATUTORY FINANCIAL STATEMENTS (Continued)
8. Security Ownership of Board of Directors and Executive Officers (Continued)
(3) Dr. Gromer was President of Tyco Electronics until December 31, 2007, when he retired.
(4) Includes 35,000 shares held in a trust over which Mr. Hernandez has dispositive power.
(5) Mr. Lynch is a member of the Board of Directors and an executive officer (Chief Executive Officer).
(6) Includes 1,860 shares held in a trust over which Mr. Smith has dispositive power. Mr. Smith disclaims beneficial ownershipof such shares.
9. Significant Shareholders
The following table sets forth the information indicated for persons or groups known to us to bebeneficial owners of more than 5% of our outstanding shares beneficially owned as of September 25,2009.
Number PercentageName and Address of Beneficial Owner of Shares of Class
T. Rowe Price Associates, Inc.(1) . . . . . . . . . . . . . . . . . . . . . . . . . . . . . . . . . . . 36,439,465 7.9%100 East Pratt StreetBaltimore, MD 21202
Dodge & Cox(2) . . . . . . . . . . . . . . . . . . . . . . . . . . . . . . . . . . . . . . . . . . . . . . . 27,570,442 6.0%555 California Street, 40th FloorSan Francisco, CA 94104
FMR LLC(3) . . . . . . . . . . . . . . . . . . . . . . . . . . . . . . . . . . . . . . . . . . . . . . . . . 23,888,612 5.2%82 Devonshire StreetBoston, MA 02109
(1) This information is based on a Schedule 13G filed with the Securities and Exchange Commission on February 12, 2009 byT. Rowe Price Associates, Inc., which reported sole voting and dispositive power as follows: sole voting power—7,148,651and sole dispositive power—36,439,465.
(2) This information is based on a Schedule 13G filed with the Securities and Exchange Commission on February 11, 2009 byDodge & Cox, which reported sole and shared voting power and sole dispositive power as follows: sole voting power—26,240,692, shared voting power—68,225 and sole dispositive power—27,570,442.
(3) The amount shown for the number of shares over which FMR LLC exercises voting power was provided to the company byFMR LLC.
10. Subsidiaries of the Company
The Company is the ultimate holding company of all subsidiaries of the Tyco Electronics Group.Direct subsidiaries of the Company and significant subsidiaries of the Group, as determined based on
156
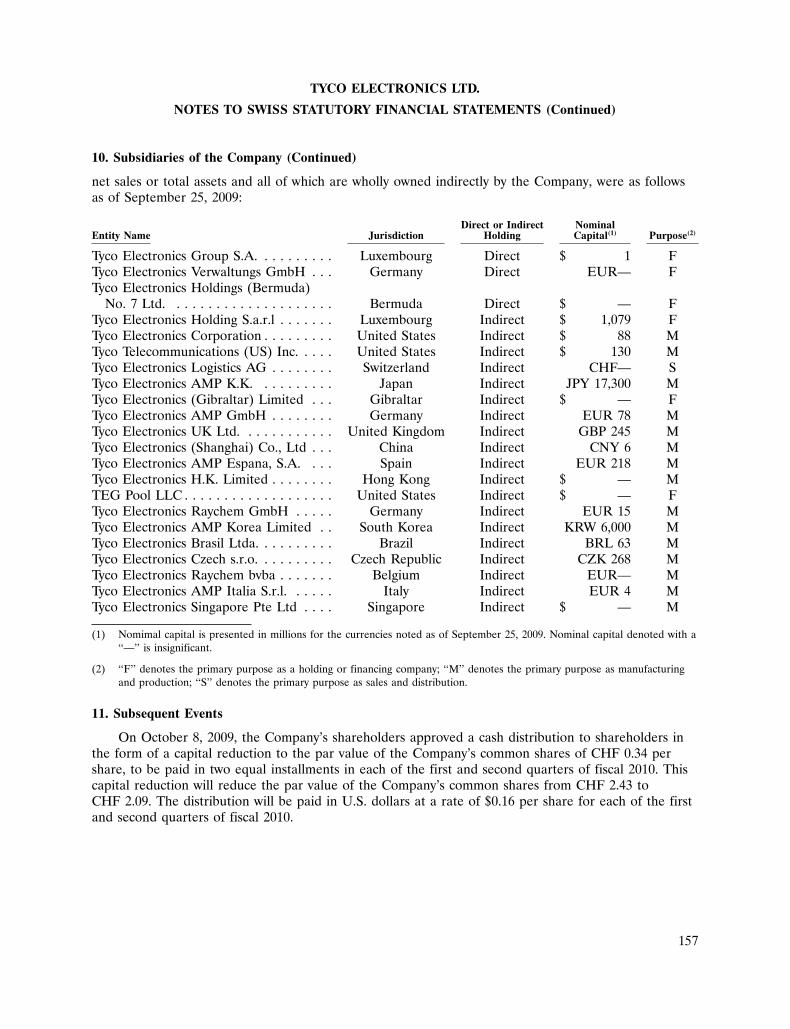
TYCO ELECTRONICS LTD.
NOTES TO SWISS STATUTORY FINANCIAL STATEMENTS (Continued)
10. Subsidiaries of the Company (Continued)
net sales or total assets and all of which are wholly owned indirectly by the Company, were as followsas of September 25, 2009:
Direct or Indirect NominalEntity Name Jurisdiction Holding Capital(1) Purpose(2)
Tyco Electronics Group S.A. . . . . . . . . . Luxembourg Direct $ 1 FTyco Electronics Verwaltungs GmbH . . . Germany Direct EUR— FTyco Electronics Holdings (Bermuda)
No. 7 Ltd. . . . . . . . . . . . . . . . . . . . . Bermuda Direct $ — FTyco Electronics Holding S.a.r.l . . . . . . . Luxembourg Indirect $ 1,079 FTyco Electronics Corporation . . . . . . . . . United States Indirect $ 88 MTyco Telecommunications (US) Inc. . . . . United States Indirect $ 130 MTyco Electronics Logistics AG . . . . . . . . Switzerland Indirect CHF— STyco Electronics AMP K.K. . . . . . . . . . Japan Indirect JPY 17,300 MTyco Electronics (Gibraltar) Limited . . . Gibraltar Indirect $ — FTyco Electronics AMP GmbH . . . . . . . . Germany Indirect EUR 78 MTyco Electronics UK Ltd. . . . . . . . . . . . United Kingdom Indirect GBP 245 MTyco Electronics (Shanghai) Co., Ltd . . . China Indirect CNY 6 MTyco Electronics AMP Espana, S.A. . . . Spain Indirect EUR 218 MTyco Electronics H.K. Limited . . . . . . . . Hong Kong Indirect $ — MTEG Pool LLC . . . . . . . . . . . . . . . . . . . United States Indirect $ — FTyco Electronics Raychem GmbH . . . . . Germany Indirect EUR 15 MTyco Electronics AMP Korea Limited . . South Korea Indirect KRW 6,000 MTyco Electronics Brasil Ltda. . . . . . . . . . Brazil Indirect BRL 63 MTyco Electronics Czech s.r.o. . . . . . . . . . Czech Republic Indirect CZK 268 MTyco Electronics Raychem bvba . . . . . . . Belgium Indirect EUR— MTyco Electronics AMP Italia S.r.l. . . . . . Italy Indirect EUR 4 MTyco Electronics Singapore Pte Ltd . . . . Singapore Indirect $ — M
(1) Nomimal capital is presented in millions for the currencies noted as of September 25, 2009. Nominal capital denoted with a‘‘—’’ is insignificant.
(2) ‘‘F’’ denotes the primary purpose as a holding or financing company; ‘‘M’’ denotes the primary purpose as manufacturingand production; ‘‘S’’ denotes the primary purpose as sales and distribution.
11. Subsequent Events
On October 8, 2009, the Company’s shareholders approved a cash distribution to shareholders inthe form of a capital reduction to the par value of the Company’s common shares of CHF 0.34 pershare, to be paid in two equal installments in each of the first and second quarters of fiscal 2010. Thiscapital reduction will reduce the par value of the Company’s common shares from CHF 2.43 toCHF 2.09. The distribution will be paid in U.S. dollars at a rate of $0.16 per share for each of the firstand second quarters of fiscal 2010.
157
REPORT OF THE STATUTORY AUDITOR ON THE SWISS STATUTORY FINANCIALSTATEMENTS OF TYCO ELECTRONICS LTD.
To the General meeting ofTYCO ELECTRONICS LTD., SCHAFFHAUSEN
Report of the statutory auditor on the financial statements
As statutory auditor, we have audited the accompanying financial statements of TycoElectronics Ltd., which is comprised of the balance sheet as of September 25, 2009, and statement ofoperations and notes (pages 143-157) for the period June 22, 2009 through September 25, 2009.
Board of Directors’ Responsibility
The Board of Directors is responsible for the preparation of the financial statements in accordancewith the requirements of Swiss law and the Company’s articles of incorporation. This responsibilityincludes designing, implementing and maintaining an internal control system relevant to thepreparation of financial statements that are free from material misstatement, whether due to fraud orerror. The Board of Directors is further responsible for selecting and applying appropriate accountingpolicies and making accounting estimates that are reasonable in the circumstances.
Auditor’s Responsibility
Our responsibility is to express an opinion on these financial statements based on our audit. Weconducted our audit in accordance with Swiss law (‘‘CO’’) and Swiss Auditing Standards. Thosestandards require that we plan and perform the audit to obtain reasonable assurance whether thefinancial statements are free from material misstatement.
An audit involves performing procedures to obtain audit evidence about the amounts anddisclosures in the financial statements. The procedures selected depend on the auditor’s judgment,including the assessment of the risks of material misstatement of the financial statements, whether dueto fraud or error. In making those risk assessments, the auditor considers the internal control systemrelevant to the entity’s preparation of the financial statements in order to design audit procedures thatare appropriate in the circumstances, but not for the purpose of expressing an opinion on theeffectiveness of the entity’s internal control system. An audit also includes evaluating theappropriateness of the accounting policies used and the reasonableness of accounting estimates made,as well as evaluating the overall presentation of the financial statements. We believe that the auditevidence we have obtained is sufficient and appropriate to provide a basis for our audit opinion.
Opinion
In our opinion, the financial statements for the period ended September 25, 2009 comply withSwiss law and the Company’s articles of incorporation.
158
Report on Other Legal Requirements
We confirm that we meet the legal requirements on licensing, according to the Auditor OversightAct (‘‘AOA’’), and independence (Article 728 CO and Article 11 AOA) and that there are nocircumstances incompatible with our independence.
In accordance with Article 728a, paragraph 1, item 3, CO and Swiss Auditing Standard 890, weconfirm that an internal control system exists, which has been designed for the preparation of financialstatements according to the instructions of the Board of Directors.
We recommend that the financial statements submitted to you be approved.
Deloitte AG
/s/ James D. Horiguchi /s/ Martin WelserLicensed Audit Expert Licensed Audit ExpertAuditor in charge
Zurich, November 18, 2009
159
REGISTERED & PRINCIPAL EXECUTIVE OFFICETyco Electronics Ltd.Rheinstrasse 20CH-8200 SchaffhausenSwitzerland+41 (0)52 633 66 61
INDEPENDENT AUDITORSDeloitte & Touche LLP1700 Market StreetPhiladelphia, PA 19103
Deloitte AGGeneral Guisan-Quai 38CH-8022 ZurichSwitzerland
STOCK EXCHANGEThe company’s common shares aretraded on the New York StockExchange (NYSE) under the ticker symbol TEL.
FORM 10-KCopies of the company’s Annual Reporton Form 10-K for the fiscal year endedSeptember 25, 2009 may be obtainedby shareholders without charge uponwritten request to Tyco Electronics Ltd.,Rheinstrasse 20, CH-8200Schaffhausen, Switzerland. The AnnualReport on Form 10-K is also availableon the company’s website at www.tycoelectronics.com.
SHAREHOLDER SERVICESRegistered shareholders (shares held in your own name with our transferagent) with requests such as change of address and replacement of lost certificates or dividend checks shouldcontact Tyco Electronics’ transfer agent at:
Mellon Investor Services LLC480 Washington BoulevardJersey City, NJ 07310866-258-4745shrrelations@melloninvestor.comwww.melloninvestor.com
Beneficial shareholders (shares heldwith a bank or broker) should contactthe bank or brokerage holding theirshares with their requests.
Other shareholder inquiries may be directed to Tyco ElectronicsShareholder Services at the company’sregistered office address.
TRADEMARKSTE logo and Tyco Electronics are trademarks. All product names appearing in this document are trademarks owned by, or licensed to,the company or its subsidiaries.
Tyco Electronics Ltd.Rheinstrasse 20CH-8200 SchaffhausenSwitzerland+41 (0)52 633 66 61
www.tycoelectronics.com
2-1773456-0TE logo and Tyco Electronics are trademarks.
This document was printed using soy-based inks and paper containing 30% postconsumer recycled fiber. The paper was produced by a Forest Stewardship Council (FSC) Chain ofCustody supplier. Printing was done according to ISO workflow procedures.