Central Bank’s Response to Economic Crises from a …€¦ · · 2013-03-19... monetary policy,...
27
1 Central Bank’s Response to Economic Crises from a Developing African Economy Perspective: Lessons from Kenya’s Experience ∗ By Maureen Were (correspondence author) KSMS Research Centre/Research Department, Central Bank of Kenya P.O. Box 60000-00200, Nairobi, Kenya. Tel: +254-20-2860000, 8646000 Email: [email protected] and Samuel Tiriongo MPC Secretariat, Central Bank of Kenya P.O. Box 60000-00200, Nairobi, Kenya. Tel: +254-20-2860000 Email: [email protected] May 2012 JEL classification: E580, E520, E590. Key words: monetary policy, central bank, crisis, Kenya Disclaimer: The views expressed in this paper are those of the authors and should not be misconstrued to be synonymous with those of the Bank. ∗ We acknowledge comments from Dr. Nyamongo. We are responsible for any errors and omissions.
Transcript of Central Bank’s Response to Economic Crises from a …€¦ · · 2013-03-19... monetary policy,...
1
Central Bank’s Response to Economic Crises from a Developing African Economy Perspective: Lessons from Kenya’s Experience∗
By
Maureen Were (correspondence author) KSMS Research Centre/Research Department, Central Bank of Kenya
P.O. Box 60000-00200, Nairobi, Kenya. Tel: +254-20-2860000, 8646000 Email: [email protected]
and
Samuel Tiriongo
MPC Secretariat, Central Bank of Kenya P.O. Box 60000-00200, Nairobi, Kenya. Tel: +254-20-2860000
Email: [email protected]
May 2012
JEL classification: E580, E520, E590.
Key words: monetary policy, central bank, crisis, Kenya
Disclaimer: The views expressed in this paper are those of the authors and should not be misconstrued to be
synonymous with those of the Bank.
∗ We acknowledge comments from Dr. Nyamongo. We are responsible for any errors and omissions.
2
Abstract
Much of the debate on the policy responses undertaken with respect to the global financial crisis has
largely focused on advanced economies, leaving out African economies’ perspective. This paper
examines the Central Bank of Kenya’s policy responses in mitigating the economic effects of the global
as well as domestic crisis that preceded the effects of the global crisis in the early 2008. We note that
whereas the policy interventions were initially effective in restoring confidence, lowering the short term
interest rates and maintaining macroeconomic stability, the loose monetary policy stance could not be
sustained following increased inflationary pressures and unprecedented depreciation of the exchange
rate. The abrupt shift to a tight monetary policy stance led to a sudden rise in both short term and long
term interest rates, thus partly counteracting the gains that had been achieved. Additionally, an
assessment of the effectiveness of monetary policy using VAR analysis indicates weak monetary policy
transmission mechanism. There are important lessons that can be drawn from Kenya’s experience: the
need for a clear exit strategy particularly when adopting a major policy shift, strengthening of the
monetary transmission mechanism in a way that make monetary policy more effective and, a wholistic
approach to addressing structural weaknesses and vulnerability of most African economies to shocks,
since monetary policy on its own is not adequate.
3
1. Introduction
The importance of effective regulation and a sound financial system cannot be overemphasized in a
highly and uncertain globalized world of today. A sound financial sector not only fosters economic
growth by mobilizing resources for investment, but also provides a framework for undertaking effective
monetary policy. Problems and inefficiencies in financial systems can reduce the effectiveness of
monetary policy, deepen or prolong economic downturns, and, in case of large scale problems, trigger
capital flight. Moreover, financial weaknesses or crisis in one country can rapidly spill over across
national borders, as clearly evidenced by the recent 2008 global financial crisis, which had far reaching
effects in many countries across the world.
Economic crises not only affect the level of economic activities but can also cause financial panic, which
lowers monetary policy efficiency with more damaging effects on the economy. A central bank’s main
objective during a crisis is to contain the damage and limit the impact of the crisis on the real economy.
This can be achieved through various means such as enhancing confidence and calming the market,
ensuring uninterrupted flow of credit, reducing uncertainty; ensuring that markets for short term credit
function properly, among others. Additionally, central banks also have an important role in reducing the
probability of a crisis occurring by undertaking pre-emptive measures that among other things reduce
systemic risks. The role played by central bank as a key regulator of the financial sector is, therefore,
critical.
Many central banks in the developed economies reacted to the global crisis by reducing interest rates to
historically low levels, complemented by use of unconventional monetary policy measures such as
quantitative and credit easing. However, because of differences in monetary policy frameworks,
development level, political interference, quality of institutions and degree of vulnerability to global
macroeconomic shocks, the nature of central banks’ responses to crises and the extent of their
effectiveness in the African economies are bound to differ from that of developed economies. Also
important is the question on how much “policy space” the developing countries have to adopt
autonomous and effective countercyclical macroeconomic policies consistent with the long term
development objectives (Jordan 2012). Moreover, there is no consensus on how quick and aggressive
policy actions should be nor on what policy responses are most effective.
4
Much of the debate on the policy responses undertaken with respect to the financial crisis and their
effectiveness have largely focused on the US, Europe and other advanced economies (see Taylor and
Williams 2009; Carboni and Carboni 2012; Andrea and Aït-Sahalia et al 2012). African countries’
perspective is still lacking. This is despite the fact that the degree of impact and the depth of responses
varied across countries, depending on the interplay of domestic and institutional factors. The extent and
differences across central banks’ reactions to the crises should, therefore, be understood in the light of
the varying design of their operational frameworks for monetary policy and the different structures of
respective financial systems (Lenza et al., 2010). Kenya is a developing African economy whose
experience is a bit unique in the sense that by the time the impact of the financial crisis became manifest,
the country was already reaping from the adverse effects of the domestic political crisis occasioned by
post-election violence that erupted in January 2008 after the country held its parliamentary and
presidential elections in December 2007. The disputed outcome of the electioneering process led to civil
unrests that disrupted economic activity, blocked supply chains, led to loss of property and a drastic
slowdown in the level of economic activities affecting investment and employment. It would therefore,
be misleading to discuss the effect of the global financial crisis in Kenya in isolation from the domestic
crisis that arose from the post-election violence. This paper examines the Central Bank of Kenya
(CBK)’s policy responses to the domestic and global financial crises, the outcomes, challenges and
lessons to be drawn from Kenya’s experience. The paper largely focuses on the period 2007 to
2011within which the two crises occurred.
The rest of the paper is organised as follows; section 2 gives a brief background of the crises while
section 3 outlines an overview of the economic effects. Section 4 discusses the monetary policy and
other measures undertaken including the outcomes. The last section concludes and outlines lessons
learnt.
2. Background of the Crises
2.1 The Domestic Crisis
The domestic crisis was politically triggered by the post-election violence following the contested
outcome of the presidential and parliamentary general elections held in December 2007. From the
onset of multi-party democracy in 1991, political party formations in Kenya were based on ethnic
backgrounds, and consequently, voting patterns in general elections would largely be along ethnic lines.
Following the peaceful and well conducted elections in 2002, the new (NARC) Government that took
over (from KANU) initiated an economic growth recovery programme that revamped the economy
from the doldrums to realize a historic real growth rate of 7.1 percent in 2007. The economic recovery
5
witnessed could easily back Collier and Hoeffler’s (2009) assertion that democratic processes are
certainly compatible with good economic performance the world over. However, in their analysis of
effects of elections, Chauvet and Collier (2009) observe that elections have cyclical and structural effects
and conclude that badly conducted elections have detrimental effects on the economy and vice versa.
This was clearly evidenced in Kenya after the disputed general elections of December 2007. The
economy slipped into a recession as the key sectors that form the backbone of the economy such as
agriculture and tourism were adversely affected. The impact of the violence on the economy was
widespread as many people were displaced in the agricultural rich zones, supply chains were disrupted
and overall confidence in the economy deteriorated. This adversely impacted on the economy and
derailed it from a strong growth path that had earlier been witnessed. The Kenya shilling depreciated
substantially against the US dollar and other currencies, having been fairly stable for a considerable
period of time. The official foreign exchange reserves were drawn down from USD 3,355 million in
December 2007 to USD 2,769 million by January 2009. In addition, the activity at the domestic stock
market recorded dramatic decline as foreign investors exited the stock market in search for safer
markets.
2.2 The Global Financial Crisis
There is a general consensus that the 2007/2008 global economic and financial crisis is the worst since
the Great Crash of 1929 and the Great Depression that followed. A lot has been documented on the
origins and causes of the crisis (see Acharya, et al. 2009, Greenlaw et al. 2008, Morgan 2009, Adrian and
Shin 2010, among many others). However, most of the causes are generally traced to the low interest
rate policies adopted by the Federal Reserve and other central banks after the collapse of the technology
stock bubble in 2000 and the 9/11 terrorist attack in 2001. In addition, the appetite of Asian central
banks for (debt) securities contributed to lax credit. These factors helped fuel a dramatic increase in
house prices in the United States and several other countries such as Spain and Ireland which had
adopted loose monetary policy (Adrian and Shin 2010, Brunnermeier 2009, Greenlaw et al. 2008, and
Taylor 2008).
Starting in the summer 2007, the global financial crisis was linked to the incentive problems in the U.S.
mortgage industry. The low interest rate regime together with other policy incentives in the US helped to
boost demand for houses that resulted in increased house prices. In 2006, this bubble reached its peak in
the United States and house prices started to fall. The bubble was much larger in the US though it also
affected other countries.1 Nadauld and Sherlund (2008) provide an account of the developments in the
1
6
housing market preceding the crisis and observe that the fall in house prices led to a fall in the prices of
securitized subprime mortgages, affecting financial markets worldwide. During the fall of 2007, the
prices of subprime securitizations continued to fall and many financial institutions started to come under
strain.
However, the climax came in September 2008 when Lehman's collapse forced markets to re-assess risk.
While Lehman's bankruptcy induced substantial losses to several counterparties, its more disruptive
consequence was the signal it sent to the international markets that credit risk in the banking sector and
financial industry was a serious concern. Reassessing risks previously overlooked, investors withdrew
from the markets and liquidity dried up. In the months that followed and in the first quarter of 2009
economic activity in the United States and many other countries declined significantly. Consequently,
unemployment in these countries rose dramatically as firms undertook downsizing measures.
Many other factors such as subprime mortgages, weak regulatory structures, and high leverage in the
banking sector are cited to have exacerbated the effects of the crisis (Allen and Carletti, 2009). Senbet
(2008) summarises the factors that caused the global financial crisis to five factors: First, the housing
boom and the sub-prime lending; second, excessive risk taking by banks and other financial institutions (
also associated with lax regulation); third, easy money and overconfidence affecting participants in the
financial sector; fourth, rating agencies and grade inflation; and fifth, complex and opaque securitization.
The failure of major financial institutions such as Lehman Brothers and Merill Lynch created a crisis of
confidence leading to global panic, flight to quality from traditionally safe assets such as money market
funds and commercial paper, and eventually to drying up of private capital. Due to increased
globalization, the US crisis spread to highly exposed economies.
3. An Overview of the Economic Effects of the Crises on Kenya
The economic impact of the politically instigated domestic crisis was immediately felt in the key
economic sectors that drive the economy, particularly agriculture, tourism and manufacturing. Like
most African economies, Kenya’s economy is primarily agro-based, with agricultural sector contributing
about 24 percent of the GDP. Before the post-election violence, the economic recovery had been
impressive and the economy was on a steady growth path, with real GDP growth rate rising from 5.1%
in 2004 to 7.1% in 2007, and was poised to grow at even higher growth rate in 2008, sustaining the
growth momentum to 10% in the medium-term as envisaged in the country’s blueprint aimed at
transforming Kenya into an industrialized nation, dubbed Vision 2030. However, as a result of
7
developments following the domestic crisis, output growth declined sharply from a real GDP growth
rate of 7.5 percent in the first quarter of 2007 to a negative growth rate of 1 percent in the first quarter
of 2008. The shilling depreciated against the US dollar from an average of Ksh. 63.30 in December 2007
to Ksh 70.62 per US dollar in February 2008. Coupled with the rise in the international prices of crude
oil in the early 2008, the supply side constraints put pressure on domestic prices, with overall inflation
rate rising from 5.7% in December 2007 to a peak of 18.6% in May 2008.2
The high inflation continued
in 2009, largely as a result of increases in prices for food commodities owing to the drought that was
experienced early that year.
On the other hand, the effects of the global financial crisis on the domestic economy were to a large
extent, bound to depend on the structure of the economy and the level to which it is integrated into the
global economy. These factors influence the extent to which macro prices (stock prices, interest rates
and exchange rates) are affected and how these in turn affect the real economy. The global economic
and financial crisis impacted on Kenya’s economy mainly by reducing external demand for Kenya’s
exports.
The onset of the global crisis in the last quarter of 2008 reinforced the negative effects of the domestic
crisis. The first round effects included declining stock market and volatility in the foreign exchange
market. Before the shilling could fully recover, it depreciated against the major foreign currencies, from
September 2008 to January 2009, owing to the impact of the global financial crisis. The second round
effects resulted from a decline in global economic activity which led to a decline in demand for Kenya’s
exports of goods and services. This further affected the economic recovery process and economic
growth trajectory.
Given the sensitivity of the tourism sector, the impact of domestic and global crises was almost
instantaneous. In the first quarter of 2008, the violence and bloodshed associated with the political
crisis kept off tourists and as a result, tourist arrivals in the country declined substantially by about 62%
from 96,336 in December 2007 to 36,970 in February 2008 when peace was restored. Before the sector
could fully recover, the impact of the global financial crisis set in and decreased the demand for tourism
among holiday makers, though the impact was less severe. As the adverse effects of the global
economic crises dissipated, the number of tourist arrivals picked up once more.3
2 The inflation numbers reported at that time before the methodology was changed from arithmetic mean to geometric mean were much higher—e.g. inflation for May 2008 was reported to be 31.5%. 3 On average, about 69 percent of Kenya’s tourists come from Europe and 6 percent from the US.
8
Besides tourism, Kenya’s key exports are agricultural commodities i.e. horticulture (mainly cut flowers),
tea and coffee. According to the Tea Board of Kenya, Kenya exports about 95 percent of its tea produce
and much of the product is grown by small scale farmers. Kenya supplies over 35 percent of cut flowers
and ornamentals to the EU, which is estimated to consume approximately 50 percent of the world’s
flowers. Following the reduction in global demand for cut flowers, the labour intensive horticultural
industry, had to cut around 1200 jobs, as it suffered a 35 percent drop in exports of flowers in April
2009, compared with the year before. While large-scale exporters were performing fairly well, small scale
farmers were the most affected by the shrinking markets, reduced earnings and rising costs of
production. Additionally, tea and coffee output declined by 11.89 percent and 30.82 percent between the
fiscal years 2006/07 and 2007/2008, which was mainly attributed to displacement of labour following
the post election disturbances in tea and coffee-growing zones. The decline in demand for these
commodities in the global market occasioned by the global financial crises came at a time the tea and
coffee subsectors were just starting to recover from the effects of post election violence. The
depreciation of the shilling against the US dollar and other currencies was further magnified by the
reduced foreign exchange inflows from exports of goods and services such as tourism and horticulture.
With respect to the financial sector, Kenya’ banking sector is fairly insulated from foreign finance in the
sense that banks hardly have derivatives or asset-backed securities in their portfolios. African banks
largely retain loans that originate from their balance sheets and the market for securitised or derivative
instruments is either small or non-existent. It is thus not surprising that unlike the other sectors, Kenya’s
banking sector remained resilient to the adverse developments in the global financial crisis. However,
the sector recorded some negative, though not significant effects. Due to increased perception of risk
and a decline in economic growth, non-performing loans increased by 14.0 percent from Ksh 56.3
billion in June 2008 to Ksh 64.2 billion by June 2009. Although the banks were less exposed, they
tightened their risk assessment of customers seeking loans with a number of banks increasing their
lending rates and /or restricting lending to particular sectors as a result of the perceived risks emanating
from the crisis. As opportunities for lending narrowed, banks channelled more of their investment funds
to the risk-free government securities.
Kenya’s financial sector is mostly dominated by commercial banks, though the level of bank penetration
is still low. Although foreign owned banks may be viewed as likely sources of financial vulnerability due
to their exposure to foreign finance, stress tests and financial soundness indicators showed that the
foreign banks operating their subsidiaries in Kenya were stable and sound as there was no evidence that
the share of foreign banks (in terms of core capital) changed fundamentally between 2007 and 2010.
9
Further, there is no evidence that the value of bank collateral reduced to the level that could affect the
stability of the banking system. On the contrary, property prices increased substantially in 2008 and
2009. During this period, the banking sector improved tremendously in terms of product offerings and
service quality, stability and profitability. As at end of June 2009, the banking sector maintained high
capital adequacy ratios, adequate liquidity and low non-performing loans in relation to gross loans. The
total shareholders’ funds, deposits and assets expanded by 25.4 percent, 9.5 percent and 15.0 percent,
respectively. Liquidity remained strong, with the ratio of liquid assets to total deposit liabilities at 40.9
percent, which was well above the statutory minimum requirement of 20 percent. The overall
performance of the banking sector has since remained strong and sound4. Financial institutions have
continued to outperform firms in other economic sectors, reporting enviable profits despite the high
interest rates and inflation, leading to high cost of credit.5
4. Monetary Policy Inventions and Financial Sector Measures
Most Sub-Saharan African (SSA) countries including Kenya adopted expansionary monetary and fiscal
policies in response to the effects of global crisis, in line with a similar trend witnessed worldwide.
International food and fuel price shocks that preceded the global financial crisis had put upward pressure
on domestic inflation in most SSA countries. As the price shocks subsided, there was a slowdown in
inflation, thus creating more room for the easing of monetary policy (Kasekende and Brownbridge
2010). However, the challenge that countries like Kenya have faced is not whether monetary easing was
necessary but whether the extent of the expansion was appropriate and effective in yielding the desired
effects. Following the derailment of the growth trajectory occasioned by both the domestic and global
financial crises, there is no doubt that there was need for countercyclical monetary and fiscal policies to
resuscitate the economy and restore growth.
First and foremost, was the urgent need to address the waning confidence in the economy occasioned by
the aftermaths of the domestic and there after global financial crisis. The Central Bank responded to the
crises by loosening monetary policy complemented by other intervention measures. It was envisaged that
the expansionary monetary policy would facilitate release of resources that would eventually be
channelled to the real sector to finance economic recovery. However, to be more effective, this needed
to be complemented by a fiscal economic stimulus to stimulate demand. Thus, the Government
initiated an infrastructure bonds programme to finance public investments in targeted infrastructure
project and the first infrastructure bond was issued in February 2009. It was envisaged that lower interest
4 Stress tests results reported by the Banking supervision Department of the Central Bank of Kenya show that the sector is strong, sound and resilient to withstand extreme shocks. 5 2009 and 2010 overall banking sector reported average annual profits of over Ksh.70 billion

10
rates would facilitate the government to spend more on infrastructure without crowding out the private
sector. An economic stimulus package of Ksh 22 billion (about USD 280 million) directed at creating
employment and funding rural-labour intensive projects (dubbed “kazi kwa vijana”6
) was incorporated in
the 2009/2010 fiscal budget. The package was expected to stimulate consumption levels, thereby
generating the necessary demand to boost production in the economy. However, the actual
implementation of fiscal stimulus package lagged behind and was marred by implementation bottlenecks
relating to bureaucracy and delays due to government procurement procedures and other setbacks. In
contrast, the flexibility in employing monetary policy tools enabled a quick response by the central bank
in mitigating the effects of the crises.
The monetary policy implemented by the central bank was geared towards ensuring availability of
liquidity to enhance private sector credit for financing economic activities. The use of traditional
monetary policy instruments was complemented by additional policy tools and other measures to
enhance the effectiveness of monetary policy actions and support the functioning of the financial
markets. In developed economies like the UK and USA, non-standard measures were adopted with the
intention of easing financing conditions further in cases where the scope to lower the interest rates
further was constrained by a lower bond (Lenza et al., 2010). We briefly discuss some of the policy
measures in detail below.
4.1 Expansionary monetary policy
Although CBK follows a monetary targeting framework, it uses a policy rate, i.e. the Central Bank Rate
(CBR) which is set by the Monetary Policy Committee (MPC) to signal monetary policy stance. The rate
is raised or lowered depending on the prevailing conditions. Following the onset of the global financial
crises in September 2008, the Bank lowered its policy rate from 9.00 percent to 8.50 percent and the
Cash Requirement Ratio (CRR) from 6.00 percent to 5.00 percent in December 2008, as a policy signal
for lower interest rates in order to enhance credit supply in the economy. In July 2009, the CRR was
further reduced to 4.50 percent, releasing about Ksh 5 billion (about USD 65 million) to the banks to
lend. The availability of liquidity was further enhanced by consistently lowering the CBR up to 6.75
percent in March 2010. The lowering of the policy rate was complemented by quantitative measures
operationalised through open market operations, injecting (on a net basis) more liquidity to the banking
system than the withdrawals. This was the case for the better part of the first half of 2008 just after the
domestic political crisis, and from the second half of 2009 following the global financial crisis (see Chart
1).
6 Means “jobs for the youth”
11
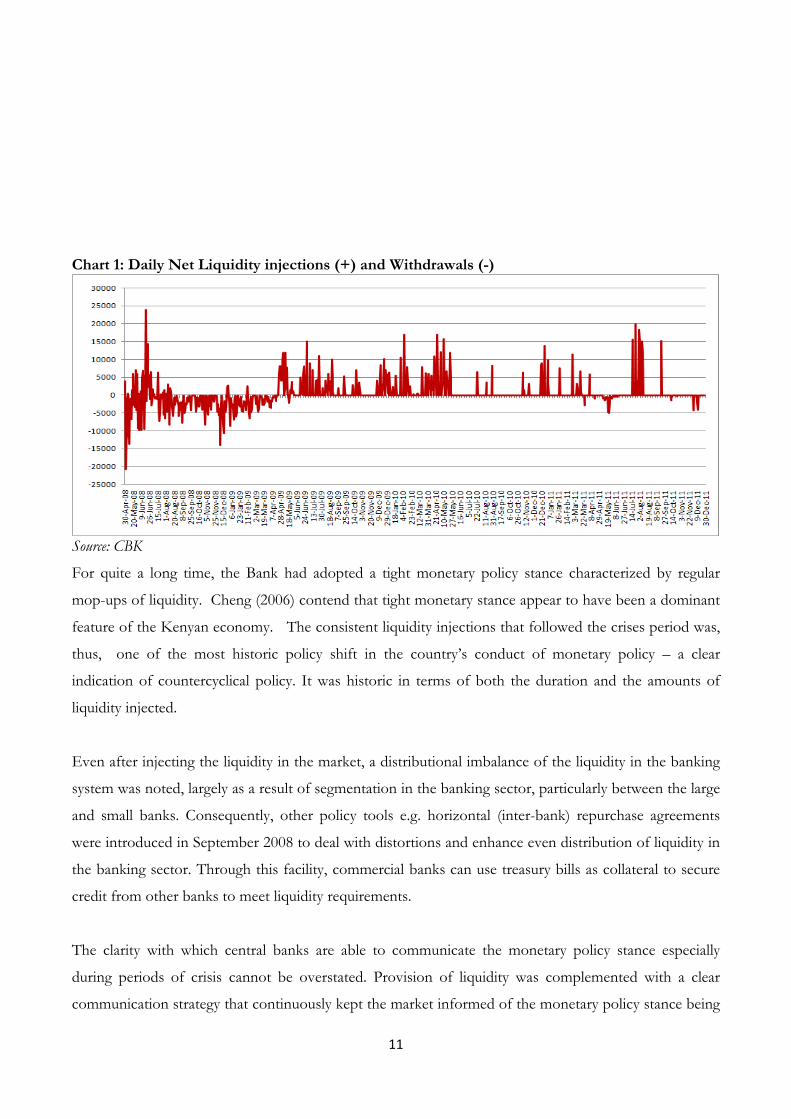
Chart 1: Daily Net Liquidity injections (+) and Withdrawals (-)
Source: CBK
For quite a long time, the Bank had adopted a tight monetary policy stance characterized by regular
mop-ups of liquidity. Cheng (2006) contend that tight monetary stance appear to have been a dominant
feature of the Kenyan economy. The consistent liquidity injections that followed the crises period was,
thus, one of the most historic policy shift in the country’s conduct of monetary policy – a clear
indication of countercyclical policy. It was historic in terms of both the duration and the amounts of
liquidity injected.
Even after injecting the liquidity in the market, a distributional imbalance of the liquidity in the banking
system was noted, largely as a result of segmentation in the banking sector, particularly between the large
and small banks. Consequently, other policy tools e.g. horizontal (inter-bank) repurchase agreements
were introduced in September 2008 to deal with distortions and enhance even distribution of liquidity in
the banking sector. Through this facility, commercial banks can use treasury bills as collateral to secure
credit from other banks to meet liquidity requirements.
The clarity with which central banks are able to communicate the monetary policy stance especially
during periods of crisis cannot be overstated. Provision of liquidity was complemented with a clear
communication strategy that continuously kept the market informed of the monetary policy stance being
12
pursued and other measures or issues that emerged. This was particularly critical in fostering stability of
the market and defusing anxiety and unnecessary panic at the onset both the domestic and financial
crises.
4.2 Financial sector policy measures
Besides the direct monetary policy interventions aimed at enhancing liquidity in the market, efforts were
directed towards other measures7
that would arguably, enhance the depth, operation and efficiency of
the financial market and ultimately enhance monetary policy effectiveness. Additionally, these measures
were also envisaged to assist in bringing down the cost of credit, which is still regarded to be relatively
high. These include creation of credit reference bureaus with the licensing of the first credit reference
bureau in the first quarter of 2010 to facilitate the lowering of the cost of credit after it emerged that
challenges in the realization of collateral and the sufficiency of information for pricing risk were among
the factors that impeded efficiency in the banking sector and gave rise to higher cost of credit. The
existing models of pricing risk do not reflect a competitive market structure as would be expected.
CBK has also been pursuing a policy of broadening financial inclusion to the majority of Kenyans. This
has been pursued through several channels including: the introduction of agency banking (use of third
party agents to offer specific banking services) in a bid to reach the unbanked population especially in
small towns and rural areas; embracing ICT-related innovations such as mobile money transfer and
banking services and increasing access to investments in government securities by reducing the
minimum investment in Treasury bill from Ksh 1,000,000 to Ksh 100,000 to encourage small investors
to participate in the risk free government debt and offer competition to large investors. As a fiscal agent
to the Government, the Bank in collaboration with the Treasury has been spearheading reforms in the
domestic government securities market to broaden the investor base, promote secondary trading and
develop an appropriate yield curve for government securities. Additionally, a Microfinance Act was
operationalised in 2008 by putting the deposit taking microfinance institutions under the regulatory
purview of CBK.
5. The Outcomes
By and large, it has been acknowledged that the aggressive monetary policy measures undertaken by
central banks in the developed economies starting with the US were effective in lessening the severity of
the economic downturn following the global crisis (Mishkin 2011). Aït-Sahalia et al (2012) examine the
impact of macroeconomic and financial sector policy inventions in the US, UK, the Euro area and Japan
7 Some of which are still on-going.
13
using event study methodology. They contend that the policy interventions were associated with
reductions in interbank risk premia, with market responses depending on the broader context in which
market participants interpreted the policy news. However, with respect to African economies,
Kasekende and Brownbridge( 2010) conclude based on 10 SSA countries (including Kenya) that the
attempt to stimulate demand through monetary policy was not fully successful, as bank lending to the
private sector fell sharply in 2009 to an average of 16 percent, from an average of over 30 percent in the
few previous years. Following the increased liquidity, most banks, as was also evidenced by Kenya’s case
increased their accumulation of reserves with the central bank and the purchase of government securities
in their portfolios. Efforts to further increase bank credit to the private sector were hindered by
inefficiencies in the transmission of monetary policy from short term interest rates to long term (lending)
rates. Kasekende and Brownbridge (2010) show that for five countries (Ghana, Kenya, Tanzania,
Uganda and Zambia), the fall in the Treasury bill rate left bank lending rates virtually unchanged, and
attribute the stickiness in the lending rates to lack of competition in the banking sector.
5.1 An Exploratory Analysis
Interest rates and exchange rates
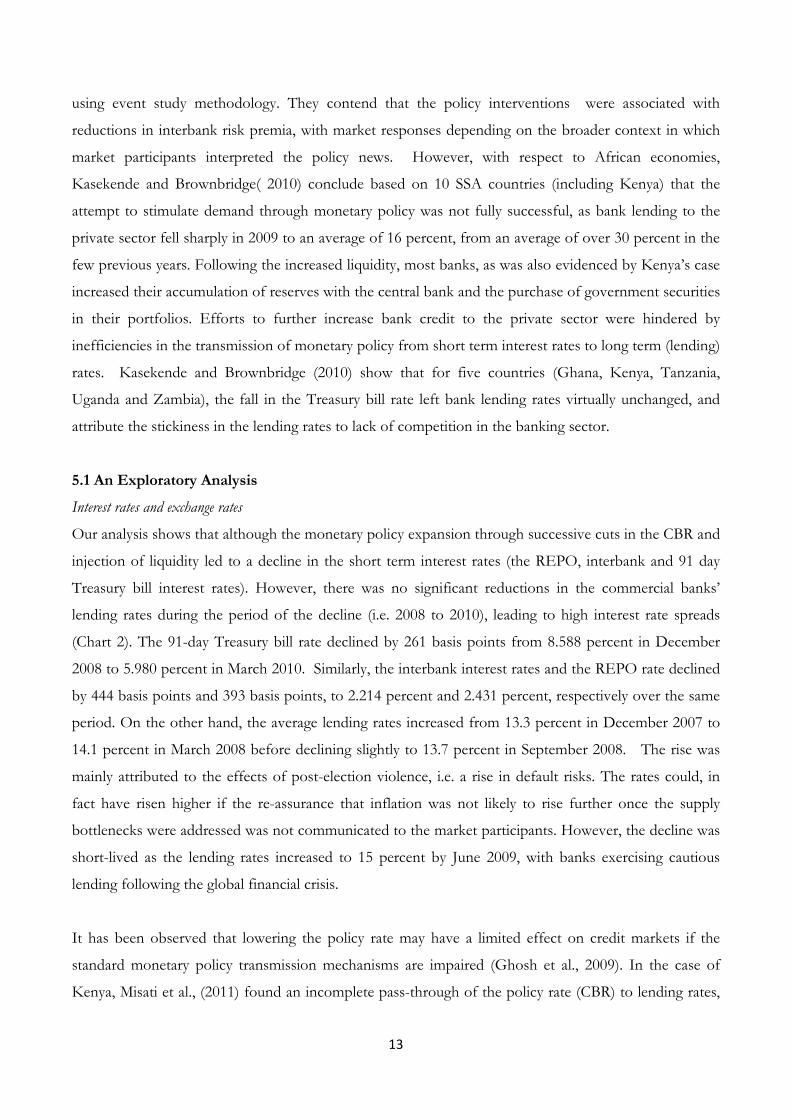
Our analysis shows that although the monetary policy expansion through successive cuts in the CBR and
injection of liquidity led to a decline in the short term interest rates (the REPO, interbank and 91 day
Treasury bill interest rates). However, there was no significant reductions in the commercial banks’
lending rates during the period of the decline (i.e. 2008 to 2010), leading to high interest rate spreads
(Chart 2). The 91-day Treasury bill rate declined by 261 basis points from 8.588 percent in December
2008 to 5.980 percent in March 2010. Similarly, the interbank interest rates and the REPO rate declined
by 444 basis points and 393 basis points, to 2.214 percent and 2.431 percent, respectively over the same
period. On the other hand, the average lending rates increased from 13.3 percent in December 2007 to
14.1 percent in March 2008 before declining slightly to 13.7 percent in September 2008. The rise was
mainly attributed to the effects of post-election violence, i.e. a rise in default risks. The rates could, in
fact have risen higher if the re-assurance that inflation was not likely to rise further once the supply
bottlenecks were addressed was not communicated to the market participants. However, the decline was
short-lived as the lending rates increased to 15 percent by June 2009, with banks exercising cautious
lending following the global financial crisis.
It has been observed that lowering the policy rate may have a limited effect on credit markets if the
standard monetary policy transmission mechanisms are impaired (Ghosh et al., 2009). In the case of
Kenya, Misati et al., (2011) found an incomplete pass-through of the policy rate (CBR) to lending rates,
14
both in the short term and the long term. Their findings showed that it takes approximately between 11
and 24 months for the policy rate to be transmitted to long term rates in Kenya. Based on simulations
from the CBK macroeconometric model, Were et al (2012) provide further evidence which show that
whereas the impact of a change in the policy rate on short term rates such as interbank is strong, the
transmission to the lending rates is weak. The ineffectiveness of monetary transmission from short to
long term rates should partly be understood in the context of the structure of the banking sector in
which only a few banks dominate the market and the perception of risk is high. Basically, the need to
understand and strengthen the transmission mechanism to the long term rates is of essence.
Chart 2: Trends in Short Term Interest Rates
Source: CBK
Chart 2 shows the vivid turn around in the interest rates, from a remarkable decline to a sudden, sharp
rise starting around mid 2011. This followed a shift in the monetary policy stance from an expansionary
policy to a tight monetary policy, in response to build-up in inflationary pressure and a rise in exchange
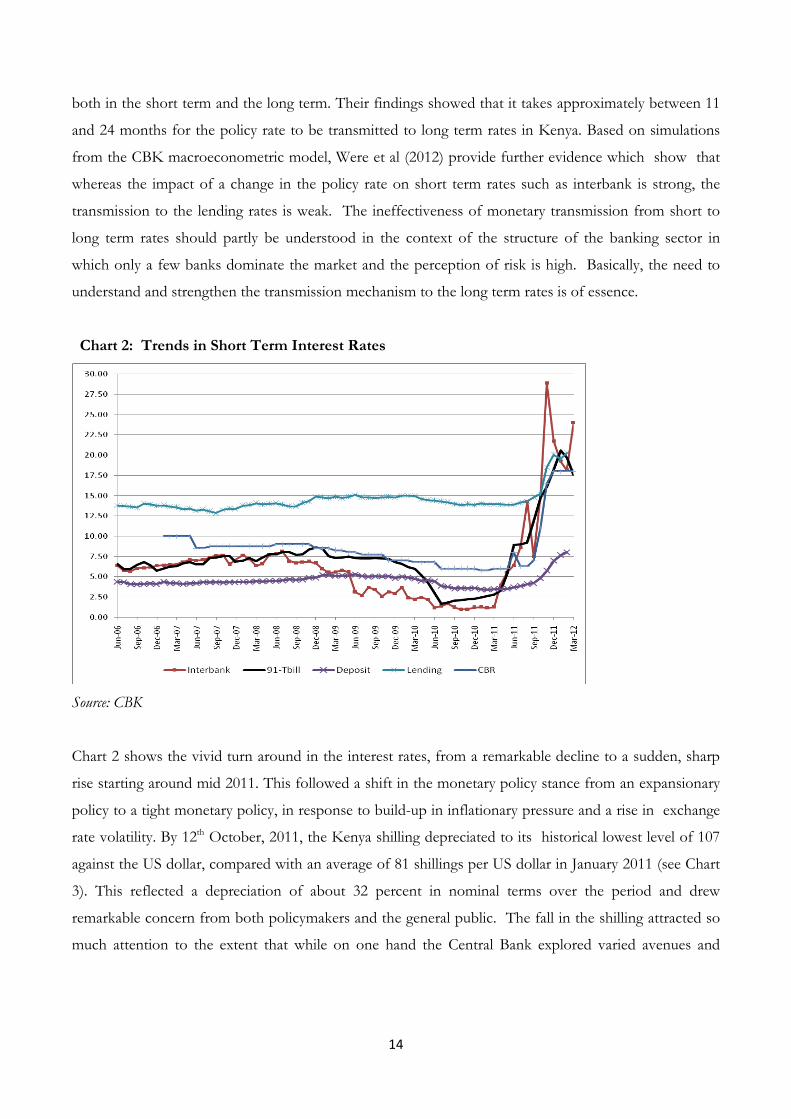
rate volatility. By 12th October, 2011, the Kenya shilling depreciated to its historical lowest level of 107
against the US dollar, compared with an average of 81 shillings per US dollar in January 2011 (see Chart
3). This reflected a depreciation of about 32 percent in nominal terms over the period and drew
remarkable concern from both policymakers and the general public. The fall in the shilling attracted so
much attention to the extent that while on one hand the Central Bank explored varied avenues and
15
monetary policy tools to tame the exchange rate volatility, the legislative assembly instituted a special
committee to investigate and establish the factors that were causing the depreciation8
.
Chart 3: Trends in Kenya Shilling Exchange Rates against Major Currencies
Source: Central Bank of Kenya
On its part, the Central Bank took a number of measures to address the inflationary pressures and the
sharp depreciation of the shilling. The MPC was compelled to raise the CBR from a low level of 6.25
percent in early September 2011 to a high level of 18 percent in December 2011, which is currently the
highest MPC has ever set. Other measures to stabilise the shilling included interventions in the foreign
exchange market through sale of foreign exchange and an audit of the foreign exchange activities of
commercial banks, leading to a review of the foreign exchange guidelines with a view to mitigate against
speculative behaviour.
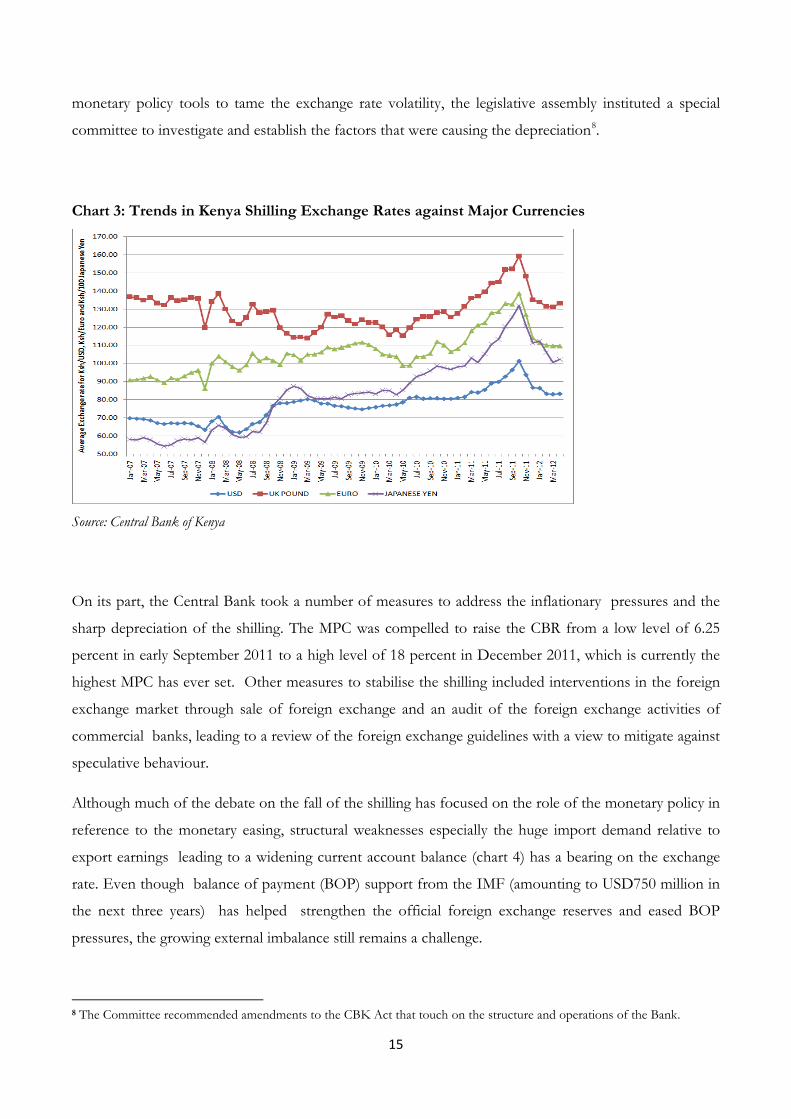
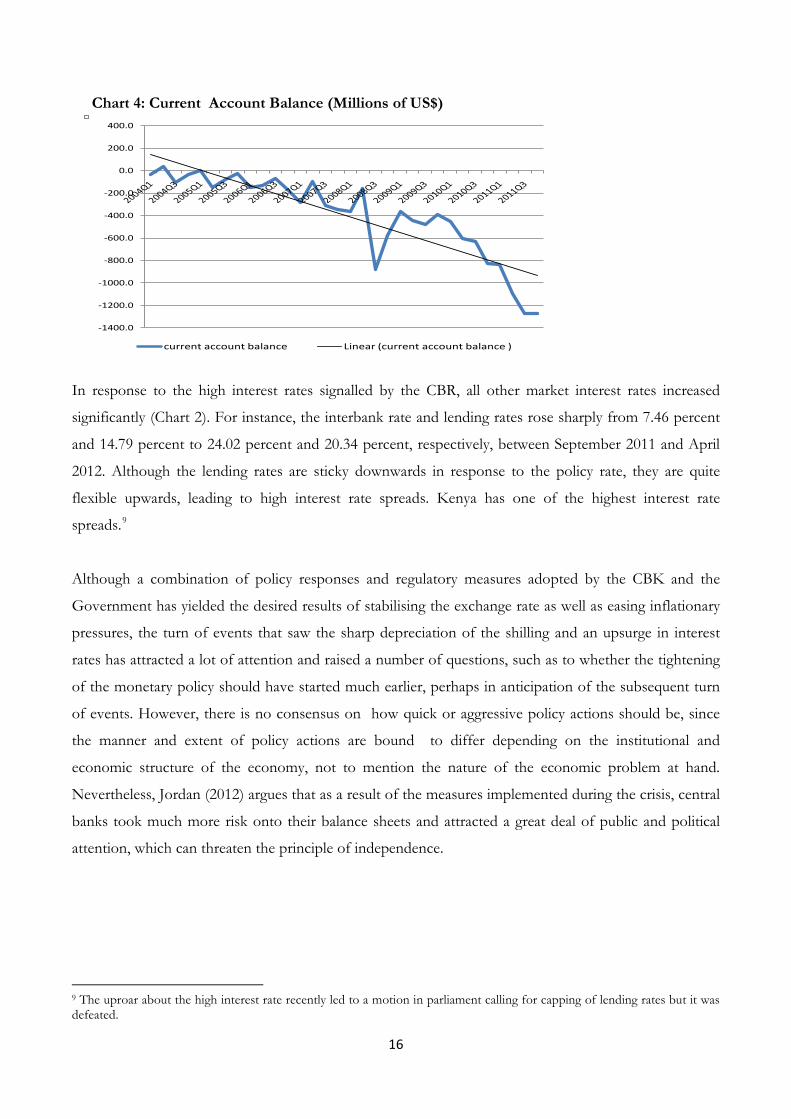
Although much of the debate on the fall of the shilling has focused on the role of the monetary policy in
reference to the monetary easing, structural weaknesses especially the huge import demand relative to
export earnings leading to a widening current account balance (chart 4) has a bearing on the exchange
rate. Even though balance of payment (BOP) support from the IMF (amounting to USD750 million in
the next three years) has helped strengthen the official foreign exchange reserves and eased BOP
pressures, the growing external imbalance still remains a challenge.
8 The Committee recommended amendments to the CBK Act that touch on the structure and operations of the Bank.
16
Chart 4: Current Account Balance (Millions of US$)
-1400.0
-1200.0
-1000.0
-800.0
-600.0
-400.0
-200.0
0.0
200.0
400.0
current account balance Linear (current account balance )
In response to the high interest rates signalled by the CBR, all other market interest rates increased
significantly (Chart 2). For instance, the interbank rate and lending rates rose sharply from 7.46 percent
and 14.79 percent to 24.02 percent and 20.34 percent, respectively, between September 2011 and April
2012. Although the lending rates are sticky downwards in response to the policy rate, they are quite
flexible upwards, leading to high interest rate spreads. Kenya has one of the highest interest rate
spreads.9
Although a combination of policy responses and regulatory measures adopted by the CBK and the
Government has yielded the desired results of stabilising the exchange rate as well as easing inflationary
pressures, the turn of events that saw the sharp depreciation of the shilling and an upsurge in interest
rates has attracted a lot of attention and raised a number of questions, such as to whether the tightening
of the monetary policy should have started much earlier, perhaps in anticipation of the subsequent turn
of events. However, there is no consensus on how quick or aggressive policy actions should be, since
the manner and extent of policy actions are bound to differ depending on the institutional and
economic structure of the economy, not to mention the nature of the economic problem at hand.
Nevertheless, Jordan (2012) argues that as a result of the measures implemented during the crisis, central
banks took much more risk onto their balance sheets and attracted a great deal of public and political
attention, which can threaten the principle of independence.
9 The uproar about the high interest rate recently led to a motion in parliament calling for capping of lending rates but it was defeated.
17
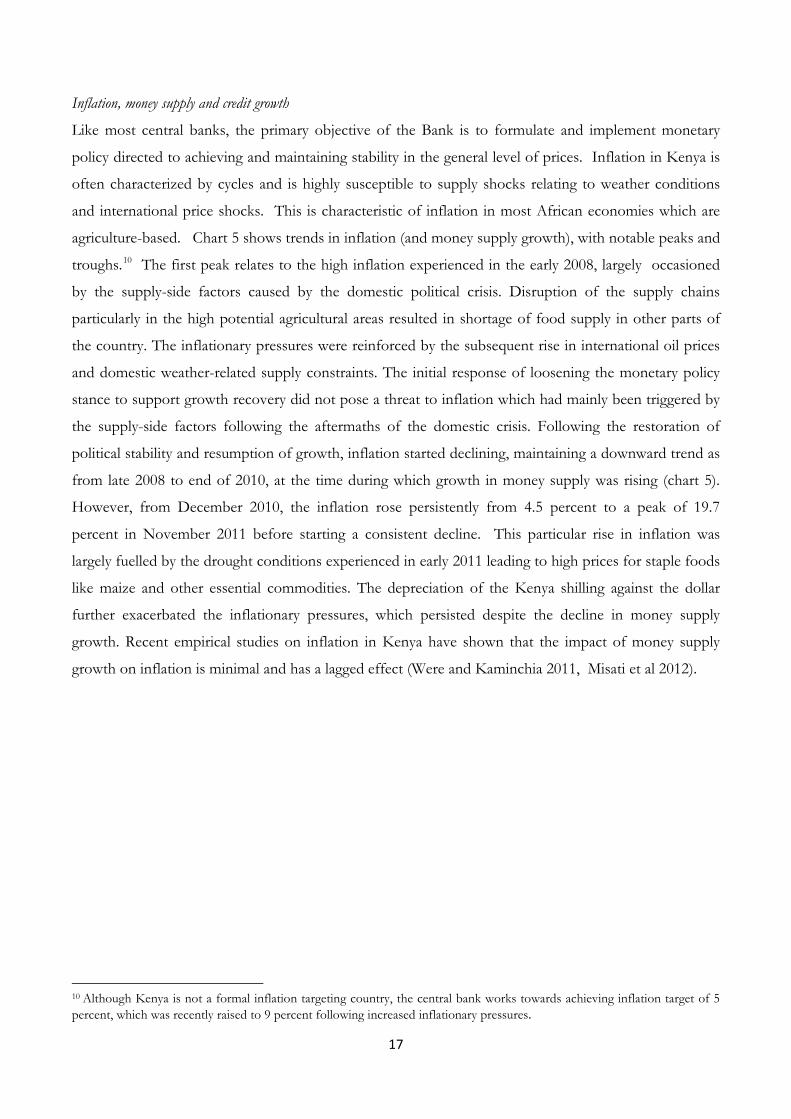
Inflation, money supply and credit growth
Like most central banks, the primary objective of the Bank is to formulate and implement monetary
policy directed to achieving and maintaining stability in the general level of prices. Inflation in Kenya is
often characterized by cycles and is highly susceptible to supply shocks relating to weather conditions
and international price shocks. This is characteristic of inflation in most African economies which are
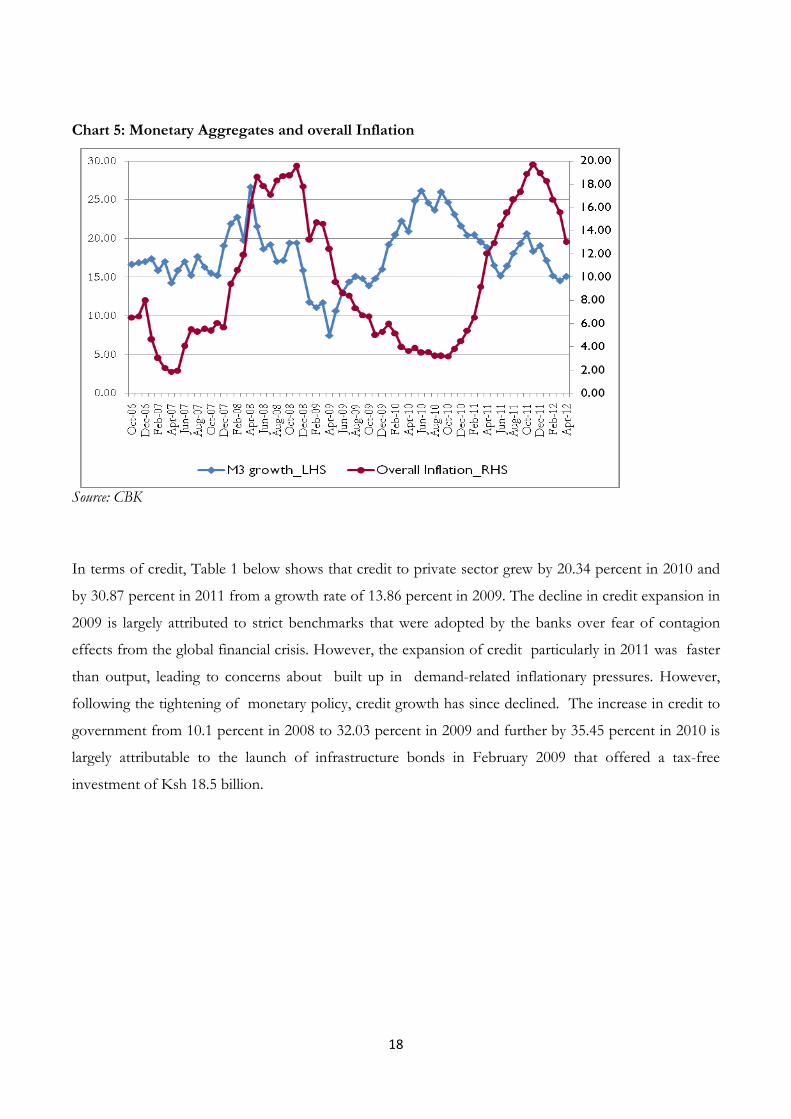
agriculture-based. Chart 5 shows trends in inflation (and money supply growth), with notable peaks and
troughs.10
The first peak relates to the high inflation experienced in the early 2008, largely occasioned
by the supply-side factors caused by the domestic political crisis. Disruption of the supply chains
particularly in the high potential agricultural areas resulted in shortage of food supply in other parts of
the country. The inflationary pressures were reinforced by the subsequent rise in international oil prices
and domestic weather-related supply constraints. The initial response of loosening the monetary policy
stance to support growth recovery did not pose a threat to inflation which had mainly been triggered by
the supply-side factors following the aftermaths of the domestic crisis. Following the restoration of
political stability and resumption of growth, inflation started declining, maintaining a downward trend as
from late 2008 to end of 2010, at the time during which growth in money supply was rising (chart 5).
However, from December 2010, the inflation rose persistently from 4.5 percent to a peak of 19.7
percent in November 2011 before starting a consistent decline. This particular rise in inflation was
largely fuelled by the drought conditions experienced in early 2011 leading to high prices for staple foods
like maize and other essential commodities. The depreciation of the Kenya shilling against the dollar
further exacerbated the inflationary pressures, which persisted despite the decline in money supply
growth. Recent empirical studies on inflation in Kenya have shown that the impact of money supply
growth on inflation is minimal and has a lagged effect (Were and Kaminchia 2011, Misati et al 2012).
10 Although Kenya is not a formal inflation targeting country, the central bank works towards achieving inflation target of 5 percent, which was recently raised to 9 percent following increased inflationary pressures.
18
Chart 5: Monetary Aggregates and overall Inflation
Source: CBK
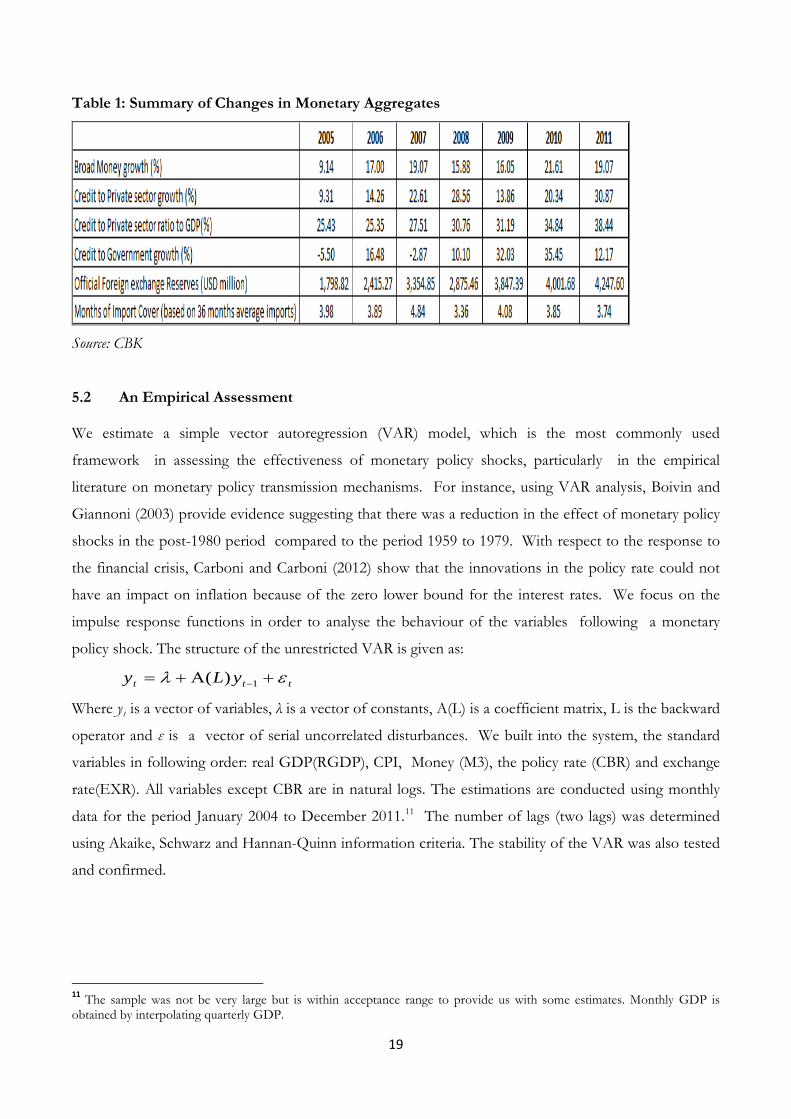
In terms of credit, Table 1 below shows that credit to private sector grew by 20.34 percent in 2010 and
by 30.87 percent in 2011 from a growth rate of 13.86 percent in 2009. The decline in credit expansion in
2009 is largely attributed to strict benchmarks that were adopted by the banks over fear of contagion
effects from the global financial crisis. However, the expansion of credit particularly in 2011 was faster
than output, leading to concerns about built up in demand-related inflationary pressures. However,
following the tightening of monetary policy, credit growth has since declined. The increase in credit to
government from 10.1 percent in 2008 to 32.03 percent in 2009 and further by 35.45 percent in 2010 is
largely attributable to the launch of infrastructure bonds in February 2009 that offered a tax-free
investment of Ksh 18.5 billion.
19
Table 1: Summary of Changes in Monetary Aggregates
Source: CBK
5.2 An Empirical Assessment We estimate a simple vector autoregression (VAR) model, which is the most commonly used
framework in assessing the effectiveness of monetary policy shocks, particularly in the empirical
literature on monetary policy transmission mechanisms. For instance, using VAR analysis, Boivin and
Giannoni (2003) provide evidence suggesting that there was a reduction in the effect of monetary policy
shocks in the post-1980 period compared to the period 1959 to 1979. With respect to the response to
the financial crisis, Carboni and Carboni (2012) show that the innovations in the policy rate could not
have an impact on inflation because of the zero lower bound for the interest rates. We focus on the
impulse response functions in order to analyse the behaviour of the variables following a monetary
policy shock. The structure of the unrestricted VAR is given as:
ttt yLy ελ +Α+= −1)( Where yt is a vector of variables, λ is a vector of constants, A(L) is a coefficient matrix, L is the backward
operator and ε is a vector of serial uncorrelated disturbances. We built into the system, the standard
variables in following order: real GDP(RGDP), CPI, Money (M3), the policy rate (CBR) and exchange
rate(EXR). All variables except CBR are in natural logs. The estimations are conducted using monthly
data for the period January 2004 to December 2011.11
The number of lags (two lags) was determined
using Akaike, Schwarz and Hannan-Quinn information criteria. The stability of the VAR was also tested
and confirmed.
11 The sample was not be very large but is within acceptance range to provide us with some estimates. Monthly GDP is obtained by interpolating quarterly GDP.
20
For robustness, the impulse response functions are first conducted on the basis of the first four
variables (RGDP, CPI, M3, CBR,) and with all the variables including EXR12
. The corresponding
impulse response functions are reported in Chart 1A and Chart 2A in the Appendix, respectively. The
results are consistent across the two charts. For instance Chart 2A (fourth column) shows that following
a monetary policy shock (i.e. unexpected rise in the policy rate), real GDP begins declining after 10
periods(months) whereas there is no significant impact on domestic price. The monetary aggregate M3
declines but the impact is not quite significant. The exchange rate appreciates after about two months.
Cheng (2006) also found an appreciation following a monetary policy shock using Repo rate. The
results seems to confirm the fact that interest rate channel is weak, particularly in controlling inflation.
A shock in the monetary aggregate M3 has even much weaker impact on all the variables considered.
6. Conclusion and Lessons Learnt
Although much has been said about the global financial crisis, African countries’ experience has largely
been overshadowed. Kenya is a developing African economy, but whose experience is a bit unique in the
sense that the economy was struggling to recover from the aftermaths of politically instigated domestic
crisis by the time the effects of global financial crisis became apparent. The paper examines policy
measures undertaken by the CBK in response to the domestic and global crises, the outcomes,
challenges and lessons to inform future policies and actions.
To a great extent, the measures undertaken were effective in restoring confidence and resuscitating
economic growth particularly after the economy sunk into a recession after the domestic crisis and the
global financial crisis that followed. A quick monetary policy response was needed as it set the pace for
the implementation of fiscal policy measures such as the fiscal stimulus package in order to coordinate
the policy responses and facilitate economic recovery. For the better part of period 2008 to 2010, the
short term interest rates and the rate of inflation declined. A rise in private sector credit was also
witnessed, though the lending rates did not decline significantly. However, the challenge that arose was
on how to sustain the gains that had been made, over the medium to long term. 2011 witnessed a
marked rise in inflation owing to increases in international oil prices and decreased rainfall. Additionally,
the exchange rate depreciated to unprecedented levels towards end of 2011 forcing a turnaround from
a loosened to a tight monetary policy. This led to sudden rise in both short term and long term interest
rates, thus partly counteracting the gains that had been achieved.
12 These are standard variables in empirical literature on assessing monetary policy transmission mechanisms using the VAR framework. Some studies include exchange rate while others don’t. The ordering followed is also consistent with that in the literature including studies on Kenya e.g. by Cheng (2006).
21
There are important lessons that can be drawn from Kenya’s experience with the crises. There is no
doubt that central banks have a role to play in mitigating the negative effects associated with economic
crises, e.g. through pursuance of countercyclical policies. That notwithstanding, it is worthwhile to map
out a clear exit strategy from the beginning when adopting a major policy shift to avoid undesirable and
unexpected outcomes. This is importantly so in the context of African economies where policy space
to manoeuvre may be limited. Moreover, the cost of cleaning up can be high and counterproductive, and
hence the importance to keep in mind the trade-off between the gains (e.g. lower interest rates) and
undesirable outcomes that may be associated with the policies undertaken.
Secondly, the external environment that SSA economies face is increasingly becoming volatile. The
vulnerability of the African economies to external shocks coupled with structural weaknesses in these
economies is likely to affect the conduct and effectiveness of monetary policy. consequently, monetary
policy alone on its own is not adequate in addressing the vulnerability of the macro economy to supply-
side and external shocks. In economies that are largely agro-based with large informal sectors like Kenya,
fluctuations in real output and inflationary pressures are likely to be caused by supply side shocks than
aggregate demand shocks. A wholistic approach is paramount in dealing with structural imbalances such
as high dependence on imports and agriculture. Aggressive measures and incentives to promote high
value exports and counter the over reliance on imports would go a long way in enhancing the foreign
exchange earnings and boost growth. Thirdly, there is need for appropriate monetary policy framework
and policy instruments that would make monetary policy more effective. Use of monetary policy for
active management of aggregate demand based on current monetary framework is bound to be set by
challenges. Fourth, strengthening of the monetary transmission mechanism in a way that make
monetary policy actions have a predictable impact on variables of interest is a challenge that needs to be
addressed. Compared to industrialised and even emerging economies, the monetary policy transmission
mechanisms in African economies is still relatively weak and has hampered the transition to modern
policy frameworks such as inflation targeting. The ineffective monetary policy transmission mechanisms
have been attributed to shallow and less integrated financial markets and limited competition in the
banking sector, among others. The financial sector reforms needed go beyond monetary policy
implementation. More reforms are needed to deal with the structural rigidities, increase the level of
competition and address underlying bottlenecks that affect the operations and hamper the efficiency of
the financial sector.
Last but not least is the political autonomy of the central bank. It is important to safeguard the role of
the central bank and ensure that it has ample policy space to manoeuvre and take appropriate actions

22
without undue influence from the political system—i.e. ensure that the governing bodies are appointed
and operate without political interference.
23
References
Acharya, V., Philippon, T., Richardson, M. and Roubini, N. (2009). “The Financial Crisis of
2007-2009: Causes and Remedies.” New York University Salomon Center and Wiley
Periodicals, Inc.
Adrian, T. and Shin, H. (2010): “Liquidity and Leverage” Journal of Financial Intermediation, 19(3),
pp.418-437.
Allen, F. and Carletti, E. (2009): “An Overview of the Crisis: Causes, Consequences and
Solutions” International Review of Finance, 10(1), pp. 1-26.
Aїt-Sahalia, Y., Andritzky, J., Andreas, J., Sylwia, N and Tamirisa, N. 2012. “Market Response to
Policy Initiatives during the Global Financial Crisis” Journal of International Economics,
87, pp. 162-177.
Boivin, J and Giannoni, M. 2003. “Has Monetary Policy Become More Effective?” NBER
Working Paper 9459. National Bureau of Economic Research: Massachusetts.
Brunnermeier, M. (2009): “Deciphering the Liquidity and Credit Crunch 2007-08” Journal of
Economic Perspectives, 23, pp. 77-100.
Carboni, A and Carboni, A. 2012. “From Taylor Rule to Money. Traditional and Unconventional
Monetary Policies in the First Years of the Financial Crisis. Evidence from the United
Kingdom, the USA and Europe”
http://papers.ssrn.com/sol3/papers.cfm?abstract_id=1986999&download=yes
Chauvet, L. and Collier, P. (2009): “Elections and Economic Policy in Developing Counties”
Economic Policy, 24 (59), pp. 509-550.
Cheng, K. V. 2006. “A VAR Analysis of Kenya’s Monetary Policy Transmission Mechanism:
How Does the Central Bank’s REPO Rate Affect the Economy?” IMF Working Paper
WP/06/300, IMF: Washington D.C.
Collier, P. and Hoeffler, A. (2009): “Testing the NeoCon Agenda: Democracy in Resource-Rich
Societies” European Economic Review, 53 (3), pp. 293-308.
Devarajan, S. (2008): “Financial Market Turmoil and Africa”, World Bank Africa Can ... End
Poverty Blog, 29 September.
Ghosh, A.R., Chamon, M., Crowe, C., Kim, J.I. and Jonathan D. Ostry. 2009. “Coping with the
Crisis: Policy Options for Emerging Market Countries,” IMF Staff Position Note,
SPN/09/08. Washington, D.C: IMF.
Greenlaw, D., J. Hatzius, A. Kashyap, and H. Shin (2008): “Leveraged Losses: Lessons from the
Mortgage Market Meltdown”, US Monetary Policy Forum, Report no. 2, pp. 7-59.
24
International Monetary Fund. (2009): “The Global Financial Crisis and Adjustment to Shocks in
Kenya, Tanzania and Uganda: A Balance-sheet Analysis Perspective”, IMF, Washington,
DC.
Jordan, T. J. (2012). “Some Lessons for Monetary Policy from the Recent Financial Crises”
International Journal of Central Banking, Vol. 8, No. S1, pp. 289-292.
Kasekende, L and Brownbridge, M. 2010. “Post Crisis Monetary Policy Frameworks in Sub-
Saharan Africa.” Bank of Uganda.
Kibaara, B. (2008): “The Impact of Financial Crisis on Developing countries: Kenya”, IDS,
Brighton.
Lenza, M., Pill, H. and Reichlin, J. (2010): “Monetary Policy in Exceptional Times” Economic
Policy, April, pp. 295-339.
Massa, I. (2009): “The Global Financial Crisis and Developing Countries. Methodology
Background Paper 3: Financial Contagion”, Draft.
Misati, R.N, Nyamongo, E.M, Njoroge, L.K and Kaminchia, S. Feasibility of inflation targeting
in an emerging market: Evidence from Kenya. Journal of Financial Economic policy, Vol. 4, No. 2
Misati, R.N., Nyamongo, E. M. and Kamau, A.W. (2011): “Interest Rate Pass-Through in
Kenya” International Journal of Development Issues, 10(2), pp. 170-182.
Morgan, J. (2009). “The Limits of Central Bank Policy: Economic Crisis and the Challenge of
Effective Solutions” Cambridge Journal of Economics, 33, pp. 581-608.
Mwega, F.M. (2010): “Global Financial Crisis”, Discussion Series, Paper No. 17, Kenya Phase 2,
Oversees Development Institute, London.
Nadauld, T. and Sherlund, S. (2008): “The Role of the Securitization Process in the Expansion of
Subprime Credit”, Working Paper, Federal Reserve Board.
Senbet, L.W. (2008): “The 2008 Financial Crisis: Diagnostic and Policy Responses”, Prepared for
the December 2008 AERC Bi-annual Research Workshop, Nairobi, 29 November-4
December.
Taylor, J. (2008): ‘The Financial Crisis and the Monetary Policy Responses: An Empirical Analysis of What
Went Wrong', Working Paper, Stanford University, California.
Taylor, J.B and Williams, J. C. 2009. “A Black Swan in the Money Market” American Economic
Journal: Macroeconomics 1 (1), pp. 58-83.
Were, M and Kaminchia, S. 2011. “Is Inflation Targeting Feasible in Kenya?” A paper presented
at the Global Development Finance Conference, Crowne Plaza Hotel, 8th to 10th
November 2011.
25
Were, M., Nyamongo, E., Sichei, M., Kamau, A and Wambua, J. 2012. “Effectiveness of
Monetary Policy in Developing Countries: Evidence from the Central Bank of Kenya
Macroeconomic Model” A paper prepared for the African Econometric Society
Conference in Kampala, July 2012.

26
Appendix
Chart 1A: Impulse Response Functions (RGDP, CPI, M3 and CBR)
-.02
-.01
.00
.01
.02
.03
.04
5 10 15 20 25 30
Response of LN_RGDP to LN_RGDP
-.02
-.01
.00
.01
.02
.03
.04
5 10 15 20 25 30
Response of LN_RGDP to LN_CPI
-.02
-.01
.00
.01
.02
.03
.04
5 10 15 20 25 30
Response of LN_RGDP to LN_M3
-.02
-.01
.00
.01
.02
.03
.04
5 10 15 20 25 30
Response of LN_RGDP to CBR100
-.02
-.01
.00
.01
.02
5 10 15 20 25 30
Response of LN_CPI to LN_RGDP
-.02
-.01
.00
.01
.02
5 10 15 20 25 30
Response of LN_CPI to LN_CPI
-.02
-.01
.00
.01
.02
5 10 15 20 25 30
Response of LN_CPI to LN_M3
-.02
-.01
.00
.01
.02
5 10 15 20 25 30
Response of LN_CPI to CBR100
-.02
-.01
.00
.01
.02
5 10 15 20 25 30
Response of LN_M3 to LN_RGDP
-.02
-.01
.00
.01
.02
5 10 15 20 25 30
Response of LN_M3 to LN_CPI
-.02
-.01
.00
.01
.02
5 10 15 20 25 30
Response of LN_M3 to LN_M3
-.02
-.01
.00
.01
.02
5 10 15 20 25 30
Response of LN_M3 to CBR100
-.008
-.004
.000
.004
.008
.012
.016
5 10 15 20 25 30
Response of CBR100 to LN_RGDP
-.008
-.004
.000
.004
.008
.012
.016
5 10 15 20 25 30
Response of CBR100 to LN_CPI
-.008
-.004
.000
.004
.008
.012
.016
5 10 15 20 25 30
Response of CBR100 to LN_M3
-.008
-.004
.000
.004
.008
.012
.016
5 10 15 20 25 30
Response of CBR100 to CBR100
Response to Cholesky One S.D. Innovations ± 2 S.E.

27
Chart 2A: Impulse Response Functions (RGDP, CPI, M3 and CBR)
-.02
-.01
.00
.01
.02
.03
5 10 15 20 25 30
Response of LN_RGDP to LN_RGDP
-.02
-.01
.00
.01
.02
.03
5 10 15 20 25 30
Response of LN_RGDP to LN_CPI
-.02
-.01
.00
.01
.02
.03
5 10 15 20 25 30
Response of LN_RGDP to LN_M3
-.02
-.01
.00
.01
.02
.03
5 10 15 20 25 30
Response of LN_RGDP to CBR100
-.02
-.01
.00
.01
.02
.03
5 10 15 20 25 30
Response of LN_RGDP to LN_EXR
-.02
-.01
.00
.01
.02
5 10 15 20 25 30
Response of LN_CPI to LN_RGDP
-.02
-.01
.00
.01
.02
5 10 15 20 25 30
Response of LN_CPI to LN_CPI
-.02
-.01
.00
.01
.02
5 10 15 20 25 30
Response of LN_CPI to LN_M3
-.02
-.01
.00
.01
.02
5 10 15 20 25 30
Response of LN_CPI to CBR100
-.02
-.01
.00
.01
.02
5 10 15 20 25 30
Response of LN_CPI to LN_EXR
-.02
-.01
.00
.01
.02
5 10 15 20 25 30
Response of LN_M3 to LN_RGDP
-.02
-.01
.00
.01
.02
5 10 15 20 25 30
Response of LN_M3 to LN_CPI
-.02
-.01
.00
.01
.02
5 10 15 20 25 30
Response of LN_M3 to LN_M3
-.02
-.01
.00
.01
.02
5 10 15 20 25 30
Response of LN_M3 to CBR100
-.02
-.01
.00
.01
.02
5 10 15 20 25 30
Response of LN_M3 to LN_EXR
-.010
-.005
.000
.005
.010
.015
5 10 15 20 25 30
Response of CBR100 to LN_RGDP
-.010
-.005
.000
.005
.010
.015
5 10 15 20 25 30
Response of CBR100 to LN_CPI
-.010
-.005
.000
.005
.010
.015
5 10 15 20 25 30
Response of CBR100 to LN_M3
-.010
-.005
.000
.005
.010
.015
5 10 15 20 25 30
Response of CBR100 to CBR100
-.010
-.005
.000
.005
.010
.015
5 10 15 20 25 30
Response of CBR100 to LN_EXR
-.04
-.02
.00
.02
.04
5 10 15 20 25 30
Response of LN_EXR to LN_RGDP
-.04
-.02
.00
.02
.04
5 10 15 20 25 30
Response of LN_EXR to LN_CPI
-.04
-.02
.00
.02
.04
5 10 15 20 25 30
Response of LN_EXR to LN_M3
-.04
-.02
.00
.02
.04
5 10 15 20 25 30
Response of LN_EXR to CBR100
-.04
-.02
.00
.02
.04
5 10 15 20 25 30
Response of LN_EXR to LN_EXR
Response to Cholesky One S.D. Innovations ± 2 S.E.