CELLULAR MOBILE CONSUMER 2012/13 · PDF fileCELLULAR MOBILE CONSUMER SATISFACTION SURVEY...
34
CELLULAR MOBILE CONSUMER SATISFACTION SURVEY 2012/13 PREPARED FOR: National Communications Authority (NCA) Cantonments, Accra-Ghana September 2013 M M U O N C I C L A A T N I O O I N T A S N N A
Transcript of CELLULAR MOBILE CONSUMER 2012/13 · PDF fileCELLULAR MOBILE CONSUMER SATISFACTION SURVEY...

CELLULAR MOBILE CONSUMER
SATISFACTION SURVEY 2012/13
PREPARED FOR: National Communications Authority (NCA) Cantonments, Accra-GhanaSeptember 2013
MMUO NC ICLA ATN IO OI NTA SN N A


CELLULAR MOBILE CONSUMER SATISFACTION SURVEY 1
Table of Content LIST OF TABLES 2LIST OF FIGURES 3LIST OF ABBREVIATIONS 4EXECUTIVE SUMMARY 5STUDY OBJECTIVES 7
1.0 TECHNICAL APPROACHES AND METHODOLOGY 8 1.0.1 Research Design 8 1.0.2 Sample size and Allocation 8
1.1 Data Management, Data Integrity and Consistency checks 9 1.2 Statistical Analyses 9 1.2.1 Socio-Demographic Data 9 1.2.2 Wealth Data 9 1.2.3 Key Performance Indices and Other Service Ratings 10 1.2.4 Statistical and Data Management Software Packages 10
2.0 DISTRIBUTION OF RESPONDENTS 10
3.0 MOBILE SERVICE CUSTOMERS 11 3.1 Distribution of Urban-Rural Customers 11 3.2 Gender Distribution of Customers 12 3.3 Age Distribution of Customers 13
4.0 FINDINGS 15 4.1 Objectives 15 4.2 Overall Consumer Satisfaction 15 4.3 The First Objective of the Survey 16 4.4 The Second Objective of the Survey 16 4.5 The Third Objective of the Survey 17 4.5.1 Service Usage Problems 17 4.6 The Fourth Objective of the Survey 20 4.7 The Fifth Objective of the Survey 20 4.7.1 Level of Importance of Services 20 5.0 ADDITIONAL FINDINGS 22 5.01 Activities for Mobile Phone Usage 22 5.0.2 Number of Service Providers Connected 22 5.0.3 What Respondents like most about their Primary Service Provider 24 5.0.4 What respondents dislike most about their Primary Service Provider 26
6.0 WEALTH DISTRIBUTION OF CUSTOMERS 27
CONCLUSION 30

CELLULAR MOBILE CONSUMER SATISFACTION SURVEY2
LIST OF TABLES
Table 1: Required Sample Size of Households, by region 8
Table 2: Regional Distribution of Pre-Paid Respondents 10
Table 3: Distribution of Urban-Rural Customers 11
Table 4: Age Distribution of Customers 13
Table 5: Overall Consumer Satisfaction with Mobile Network Operator’s Services 15
Table 6: Level of Satisfaction with Service Attributes (%) 16
Table 7: Problems in the Last 10 Call Attempts 17
Table 8: Types of Problems Experienced by Respondents 18
Table 9: Relative Performance of Service Providers 20
Table 10: Level of Importance of Services 21
Table 11: Most Frequent Uses of Mobile Phones 22
Table 12: The Number of Service Providers Consumers are Connected To 23
Table 13: Reasons for Wanting to Change to a New Mobile Service Provider 24
Table 14: What do you like most about your Service Provider 25
Table 15: What do you dislike about your Service Provider 26
Table 16: Descriptive Statistics for Wealth Index 27

CELLULAR MOBILE CONSUMER SATISFACTION SURVEY 3
LIST OF FIGURES
Figure 1: Distribution of Customers by Urban-Rural Groups 12
Figure 2: Gender Distribution of Customers 13
Figure 3: Level of Importance of the 4 Most Popular Services
Attributes and Expectations 21
Figure 4: Number of Mobile Service Providers are Connected to 23
Figure 5: Box Plots of Wealth Index 28
Figure 6: Wealth Categories of Consumers 29

CELLULAR MOBILE CONSUMER SATISFACTION SURVEY4
LIST OF ABBREVIATIONS
ANOVA Analysis of Variance
CS Customer Satisfaction
CSS Consumer Satisfaction Survey
DCE District Chief Executive
EA Enumeration Area
GSS Ghana Statistical Service
KPI Key Performance Indicator
MLGRD Ministry of Local Government and Rural Development
MMDA Metropolitan, Municipal and District Assembly
MNO Mobile Network Operator
NCA National Communications Authority
SSU Secondary Sampling Unit
CELLULAR MOBILE CONSUMER SATISFACTION SURVEY 5
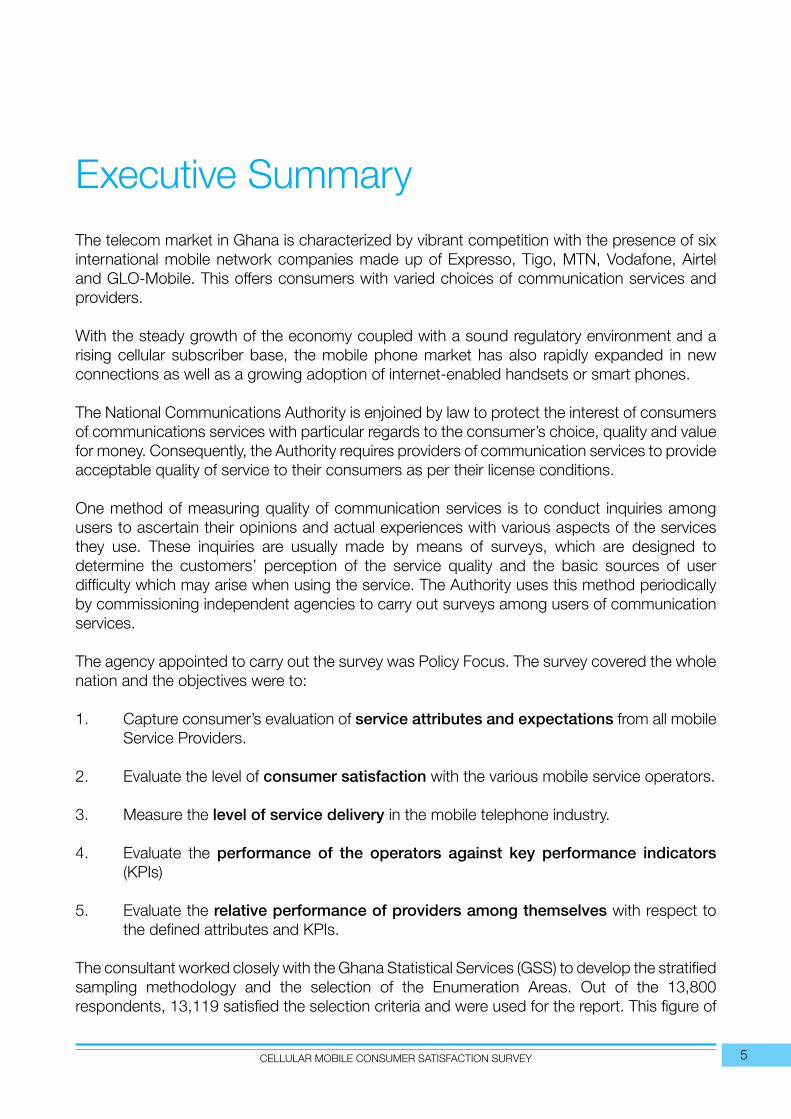
Executive SummaryThe telecom market in Ghana is characterized by vibrant competition with the presence of six international mobile network companies made up of Expresso, Tigo, MTN, Vodafone, Airtel and GLO-Mobile. This offers consumers with varied choices of communication services and providers.
With the steady growth of the economy coupled with a sound regulatory environment and a rising cellular subscriber base, the mobile phone market has also rapidly expanded in new connections as well as a growing adoption of internet-enabled handsets or smart phones.
The National Communications Authority is enjoined by law to protect the interest of consumers of communications services with particular regards to the consumer’s choice, quality and value for money. Consequently, the Authority requires providers of communication services to provide acceptable quality of service to their consumers as per their license conditions.
One method of measuring quality of communication services is to conduct inquiries among users to ascertain their opinions and actual experiences with various aspects of the services they use. These inquiries are usually made by means of surveys, which are designed to determine the customers’ perception of the service quality and the basic sources of user difficulty which may arise when using the service. The Authority uses this method periodically by commissioning independent agencies to carry out surveys among users of communication services.
The agency appointed to carry out the survey was Policy Focus. The survey covered the whole nation and the objectives were to:
1. Capture consumer’s evaluation of service attributes and expectations from all mobile Service Providers.
2. Evaluate the level of consumer satisfaction with the various mobile service operators.
3. Measure the level of service delivery in the mobile telephone industry.
4. Evaluate the performance of the operators against key performance indicators (KPIs)
5. Evaluate the relative performance of providers among themselves with respect to the defined attributes and KPIs.
The consultant worked closely with the Ghana Statistical Services (GSS) to develop the stratified sampling methodology and the selection of the Enumeration Areas. Out of the 13,800 respondents, 13,119 satisfied the selection criteria and were used for the report. This figure of

CELLULAR MOBILE CONSUMER SATISFACTION SURVEY6
13,119 represented a 95 % response rate. About 400 Enumeration Areas were selected for the survey, 202 were from the urban areas and 198 were from the rural areas. Similarly, 6,000 households participated in the survey, 3,030 were from the urban areas and 2,970 from the rural areas.
The report findings revealed that 74.7 % of mobile subscribers were satisfied with the services of their mobile network operators, while 25.3 % were dissatisfied. The findings also indicate areas that need improvement as some operators were not able to meet all the benchmarks for the defined Key Performance Indicators (KPIs).
The National Communications Authority (NCA) had set a benchmark of 85 % or more for billing performance and help or inquiry services, 90 % for supplementary services and 75 % for overall quality of service. MTN and Vodafone were unable to meet any of the NCA’s stipulated benchmarks, while Tigo, Airtel and Expresso met only one of the stipulated benchmarks being overall quality of service. However, GLO-Mobile which entered the market few months prior to the survey met all the NCA’s stipulated benchmarks with the exception of supplementary services.
In addition, the survey was able to determine the various activities mobile phones were used for, the number of service providers the average consumer was connected to, and consumers’ likes and dislikes of their service providers. Interestingly, the survey findings was able to indicate the wealth distribution of mobile phone subscribers across the country.
Respondents singled out quality of service as the most important service attribute in the industry. Other service attributes which respondents found important regarding service delivery included Tariffs and Billing, Coverage Area and Ease of Making Calls.
It is the view of the NCA that the findings of this survey will go a long way to help operators identify critical areas that need improvement and enhance service experience for consumers. This will further promote sustainable growth in the country’s telecom market.
In addition, it would provide the NCA with a road map to focus on the key areas which demand regulatory attention.
CELLULAR MOBILE CONSUMER SATISFACTION SURVEY 7
STUDY OBJECTIVES
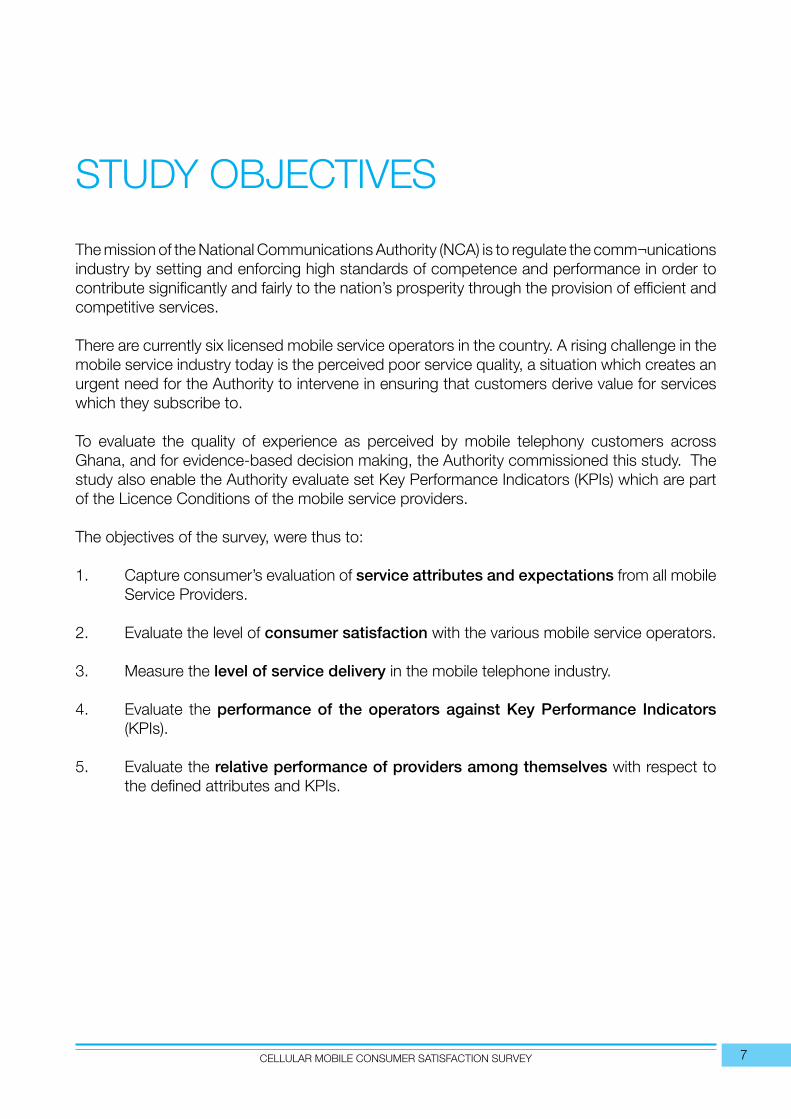
The mission of the National Communications Authority (NCA) is to regulate the comm¬unications industry by setting and enforcing high standards of competence and performance in order to contribute significantly and fairly to the nation’s prosperity through the provision of efficient and competitive services.
There are currently six licensed mobile service operators in the country. A rising challenge in the mobile service industry today is the perceived poor service quality, a situation which creates an urgent need for the Authority to intervene in ensuring that customers derive value for services which they subscribe to.
To evaluate the quality of experience as perceived by mobile telephony customers across Ghana, and for evidence-based decision making, the Authority commissioned this study. The study also enable the Authority evaluate set Key Performance Indicators (KPIs) which are part of the Licence Conditions of the mobile service providers.
The objectives of the survey, were thus to:
1. Capture consumer’s evaluation of service attributes and expectations from all mobile Service Providers.
2. Evaluate the level of consumer satisfaction with the various mobile service operators.
3. Measure the level of service delivery in the mobile telephone industry.
4. Evaluate the performance of the operators against Key Performance Indicators (KPIs).
5. Evaluate the relative performance of providers among themselves with respect to the defined attributes and KPIs.

CELLULAR MOBILE CONSUMER SATISFACTION SURVEY8
1.0 TECHNICAL APPROACHES AND METHODOLOGY
1.0.1 Research Design
A three-stage, stratified cluster sampling method was adopted for the selection of the survey sample in all ten administrative regions in the country, with all the 170 MMDAs considered as sampling strata. 1
The first stage involved the selection of the urban and rural Enumeration Areas (EAs) in each stratum (district). The households in the selected EAs constituted the secondary sampling unit (SSUs) in the second stage of the sampling design. Not all household members were however interviewed in the exercise. Responses were restricted only to users of mobile phones and/or the internet. Thus, the unit of measurement was household members using mobile phones. This constituted the third stage sampling.
1.0.2 Sample size and Allocation
The methodology for sample size determination utilized some factors and values adopted from survey methodologies used by the Ghana Statistical Services (GSS) for similar surveys.
Table 1: Required Sample Size of Households, by region
REGIONENUMERATION AREAS HOUSEHOLD
Urban Rural Total Urban Rural Total1. Western 16 22 38 240 330 5702. Central 16 18 34 240 270 5103. Greater Accra 57 6 63 855 90 9454. Volta 11 22 33 165 330 4955. Eastern 18 24 42 270 360 6306. Ashanti 46 30 76 690 450 1,1407. Brong Ahafo 16 20 36 240 300 5408. Northern 12 27 39 180 405 5859. Upper East 6 15 21 90 225 31510. Upper West 4 14 18 60 210 270
National 202 198 400 3,030 2,970 6,000
Table 1 above shows the final list of Enumeration Areas (EAs) by region, and number of households from which the study participants were drawn.
1 For large metropolitan areas, sub-metros were included as “districts” to ensure urban-rural representations.

CELLULAR MOBILE CONSUMER SATISFACTION SURVEY 9
1.1 Data Management, Data Integrity and Consistency checks
Data was captured using Census Processing Software (CSPRO) along with a highly structured data entry module. For data quality assurance, verification (double entry) was performed and further bolstered with an integrity check program to ensure internal consistencies. SAS® DATASET, SQL procedures and SCL programs were utilized in the development of programs for analyzing the data.
1.2 Statistical Analyses
1.2.1 Socio-Demographic Data For socio-demographic categorical data (e.g. occupation, gender, age group,
etc.) summary tables of frequency counts and percentages were presented for all six mobile providers. The service providers were compared using Pearson’s chi-square tests, Mantel-Haenszel tests (for ordinal attributes) and Fisher’s exact tests (for small cell frequencies).
Graphical presentations were provided to highlight the differences among these
providers.
1.2.2 Wealth Data The wealth index (WI) is a composite measure using information on household size,
household income and household expenditure as well as data on household’s ownership of selected assets such as televisions and bicycles, materials used for housing construction, types of water access and sanitation facilities. It is calculated using data on a household’s ownership of selected assets, such as televisions and bicycles; materials used for housing construction; and types of water access and sanitation facilities. Generated using principal components analysis (a statistical procedure), the wealth index places individual households on a continuous standardized scale of relative wealth ranging from 0—100. Respondents’ wealth status was analyzed and presented accordingly.
Summary tables of means, standard deviations and ranges were presented for the mobile providers. The Kruskal-Wallis method (a non-parametric ANOVA method) was employed to ascertain the existence of differences among service providers. After categorizing wealth groups into three, namely low wealth (below poverty line of 25%), middle wealth (between 25% and 70%) and upper wealth (top 30%), the Mantel-Haenszel test was employed to determine the association between wealth categorization and the choice of mobile service provider. Graphical presentations were provided to highlight the differences among providers.
1.2.3 Key Performance Indices and Other Service Ratings Summary tables of frequency counts and percentages for the relevant indicators
including KPIs were presented for the service providers. The significance of differences among the service providers were determined using Pearson’s chi-

CELLULAR MOBILE CONSUMER SATISFACTION SURVEY10
square or Cochran-Mantel-Haenszel tests (controlling for districts/regions) where appropriate.
1.2.4 Statistical and Data Management Software Packages For data entry and verification, Census Processing software (CSPRO) was used.
Data cleaning was performed using SPSS. Data integrity and internal consistency checks were performed using SAS® ver. 9.3.
Tabulations of frequencies (and percentages) were performed using SAS® ver. 9.3. All graphical presentations and statistical tests (p-values) were conducted using SAS® ver. 9.3.
Statistical tests were conducted as two-sided, and declared significant for p-value <0.05.
2.0 DISTRIBUTION OF RESPONDENTS
Thirteen thousand eight hundred (13,800) mobile phone users, representing consumers of services provided by the six NCA-licensed mobile service providers were sampled for the survey. After applying the inclusion/exclusion criteria (age≥13 years, no family member or friend working with a mobile service operator, no participation in any telecom survey within past 6 months, etc.), 13,119 qualifying pre-paid users were subsequently interviewed on their experience of quality of the various services provided by the mobile network operators.
Table 2 shows the distribution of the participants, ranked by the number per region and per primary service provider.
Table 2: Regional Distribution of Pre-Paid Respondents
RegionMTN Vodafone TiGo AirTel Glo Expresso
N (%) n (%) n (%) n (%) N (%) n (%) Total (%)Ashanti 1,767 13.5 266 2.0 148 1.1 156 1.2 27 0.2 10 0.1 2,374 18.1Greater Accra
1,180 9.0 240 1.8 482 3.7 228 1.7 62 0.5 16 0.1 2,208 16.8
Eastern 1,060 8.1 229 1.7 95 0.7 91 0.7 18 0.1 8 0.1 1,501 11.4Central 884 6.7 158 1.2 175 1.3 89 0.7 29 0.2 8 0.1 1,343 10.2Northern 728 5.5 276 2.1 80 0.6 141 1.1 76 0.6 16 0.1 1,317 10.0Western 659 5.0 197 1.5 268 2.0 59 0.4 23 0.2 2 0.0 1,208 9.2Brong-Ahafo
656 5.0 218 1.7 99 0.8 83 0.6 8 0.1 2 0.0 1,066 8.1
Volta 720 5.5 146 1.1 61 0.5 23 0.2 5 0.0 4 0.0 959 7.3

CELLULAR MOBILE CONSUMER SATISFACTION SURVEY 11
RegionMTN TiGo AirTel Glo Expresso
N (%) n (%) n (%) n (%) N (%) n (%) Total (%)Upper East
356 2.7 90 0.7 41 0.3 68 0.5 23 0.2 4 0.0 582 4.4
Upper West
280 2.1 233 1.8 11 0.1 36 0.3 1 0.0 0 0.0 561 4.3
TOTAL 8,290 63.2 2,053 15.6 1,460 11.1 974 7.4 272 2.1 70 0.5 13,119 100
(a) Ashanti Region with the highest number accounted for over 18% of the consumers who participated in the survey while the Upper East Region with the least number accounted for 4.3%.
(b) Expresso had only single-digit representations for 7 out of the 10 regions (except for Ashanti, Greater Accra and Northern region), indicating how sparsely spread the operator is across the length and breadth of the country. In particular it is observed that there was no representation at all in Upper West for this operator.
3.0 MOBILE SERVICE CUSTOMERS
3.1 Distribution of Urban-Rural Customers
The distribution of the prepaid customers of the six service providers is presented in Table 3 segregated by urban-rural grouping. The chart of the distribution is presented in Figure 1 in descending order of frequencies.
Table 3: Distribution of Urban-Rural Customers
LocalityAirTel Expresso Glo MTN Tigo Vodafone TOTAL
n (%) n (%) n (%) n (%) n (%) n (%) n (%)Urban 590 60.6 53 75.7 211 77.6 4,17 49.9 989 67.7 895 43.6 6,875 52.4Rural 384 39.4 17 24.3 61 22.4 4,153 50.1 471 32.3 1,158 56.4 6,244 47.6Total 974 70 272 8,290 1,460 2,053 13,119

CELLULAR MOBILE CONSUMER SATISFACTION SURVEY12
Figure 1: Distribution of Customers by Urban-Rural Groups
(a) As a primary mobile service provider, MTN accounts for 63% share of pre-paid consumers, followed at a distance by Vodafone with nearly 16%. Expresso with less than 1% share is the least used as a primary service provider.
(b) Nationwide mobile consumers are along a 52% urban and 48% rural split.(c) MTN and Vodafone are the only mobile service providers with rural customer bases
larger than their corresponding urban ones. The two service providers control about 67% and 18% respectively of the rural customer base, together providing primary mobile services to over 85% of rural consumers (Table 3).
(d) Urban users of Expresso as primary mobile provider are more than 3 times the size of rural users. Glo also has 3 times more urban users, and TiGo has more than 2 times as many urban users as rural ones. AirTel’s urban customers are over one-and-half times more than their rural counterparts.
3.2 Gender Distribution of Customers
Figure 2 depicts the distribution of customers, by gender and primary mobile service provider, presented in descending order of the proportion of males.

CELLULAR MOBILE CONSUMER SATISFACTION SURVEY 13
Figure 2: Gender Distribution of Customers
(a) TiGo, with a female customer base of nearly 53%, is the only service provider with a higher female-to-male ratio.
(b) Other service providers have higher male customer bases, with Glo having the highest male proportion of over 60% and the least female proportion of fewer than 40%.
3.3 Age Distribution of Customers
Table 4: Age Distribution of Customers
AGE GROUP(YRS)
AirTel Expresso Glo MTN Tigo Vodafone
n (%) n (%) N (%) n (%) n (%) n (%) TOTAL (%)
13 – 18 85 9.0 0 0 37 14.5 579 7.3 90 6.4 141 7.2 932 7.419 – 30 426 45.3 19 30.2 130 50.8 3,314 41.5 520 36.9 775 39.5 5,184 41.131 – 45 284 30.2 20 31.7 60 23.4 2,497 31.3 468 33.2 615 31.4 3,944 31.346 – 60 112 11.9 14 22.2 22 8.6 1,188 14.9 258 18.3 333 17.0 1,927 15.3> 60 33 3.5 10 15.9 7 2.7 408 5.1 73 5.2 96 4.9 627 5.0Total 940 63 256 7,986 1,409 1,960 12,614
Median Group (yr)
19-30 31-45 19-30 31-45 31-45 31-45 31-45
CELLULAR MOBILE CONSUMER SATISFACTION SURVEY14
From Table 4 above it is noted that,
(a) For each of MTN, TiGo and Vodafone, one-half (or the median) of their primary customers are between the ages of 13 and 45 years (inclusive).
(b) Glo has the highest proportion (65%) of younger users (13 to 30 years) followed by AirTel with 54%.
(c) Expresso on the other hand has the highest (70%) customer base of older users who are above 30 years.
(d) AirTel has over 54% of its young primary users with ages ranging between 13 and 30 years inclusive.
(e) Nationwide about 49% of mobile service consumers are young users (13 to 30years).

CELLULAR MOBILE CONSUMER SATISFACTION SURVEY 15
4.0 FINDINGS
The main purpose of the study was to understand the behavior of mobile phone customers in the country and also document their satisfaction level that is influenced by various factors.
4.1 Objectives
The findings of the survey were divided into sections in accordance with the objectives of the survey as listed below:
4.1.1. Capture consumer’s evaluation of service attributes and expectations from all mobile Service Providers.
4.1.2. Evaluate the level of consumer satisfaction with the various mobile service operators.
4.1.3. Measure the level of service delivery in the mobile telephone industry.4.1.4. Evaluate the performance of the operators against key performance
indicators (KPIs)4.1.5. Evaluate the relative performance of providers among themselves with
respect to the defined attributes and KPIs.
In addition, the survey made findings on activities for mobile phone usage, number of service providers each consumer is connected to, what consumers like most and dislike most about their primary service providers and wealth distribution of mobile phone subscribers.
4.2 Overall Consumer Satisfaction
The overall consumer satisfaction was measured through the following question:
Overall, “are you satisfied with the services being provided by your main mobile network operators?” and to answer this question, a dichotomous scale was used giving the respondents two options: yes (coded 2) and no (coded 1).The majority of respondent (74.7 percent) were satisfied with the performance of their Mobile Network Operators.
Table 5: Overall Consumer Satisfaction with Mobile Network Operator’s Services
ResponseAirTel Expresso Glo MTN TiGo Vodafone
n (%) n (%) n (%) n (%) n (%) n (%) Total (%)Yes 826 86.2 56 87.5 246 93.2 5,625 69.2 1,239 85.9 1,638 80.8 9,630 74.7No 132 13.8 8 12.5 18 6.8 2,507 30.8 204 14.1 389 19.2 3,258 25.3
Total 958 64 264 8,132 1,443 2,027 12,888 p<0.05. Test based on Pearson Chi-square statistic. Categories with < 2% excluded from tests.

CELLULAR MOBILE CONSUMER SATISFACTION SURVEY16
4.3 The first objective of the survey was to;
• Captureconsumersevaluationof serviceattributesandexpectations fromallmobileservice providers.
Here the NCA sought to determine consumers’ perception with regard to the service attributes and expectations from all Mobile Network Operators. To arrive at this, the survey looked at consumers’ level of satisfaction with the defined attributes and the level of importance of these attributes. The responses or findings were determined and can be found in the findings for objectives 2 and 5 respectively.
4.4 The second objective of the survey was to:
• Evaluatethelevelofcustomersatisfactionwiththevariousmobileserviceoperators.
This evaluation of consumer satisfaction was determined using a list of functional service attributes as per the table below;
FUNCTIONAL ATTRIBUTES
Table 6: Level of Satisfaction with Service Attributes (%)
Service Attributes AirTel Expresso Glo MTN TiGo Vodafone Nation-wide
1. Quality of Reception 86.7 89.2 91.4 64 81.6 74.5 70.02. Tariffs/Billing 79.8 78.5 86.9 36.8 69.5 68.7 49.83. Coverage 82.0 68.8 75.9 77.0 79.9 77.4 77.74. Ease of Making
Calls89.2 90.8 92.0 67.5 87.5 80.6 74.0
5. Customer Relations 78.8 86.4 86.1 60.0 79.0 69.0 65.26. Response to
Complaints to Call Centers
76.5 81.4 85.1 58.9 77.7 67.1 63.9
7. Overall Level of Service
89.9 87.7 92.7 67.6 86.4 79.7 73.8
8. Reliability of Service 82.2 77.8 80.6 56.0 77.6 70.7 63.39. Availability of Service
(Maintainability)77.3 70.3 76.7 54.6 75.3 64.2 60.6
10. Supplemental Services
80.2 71.2 82.9 64.4 79.7 73.9 69.2
CELLULAR MOBILE CONSUMER SATISFACTION SURVEY 17
Internet Services Only AirTel Expresso Glo MTN TiGo Vodafone Nation-wide
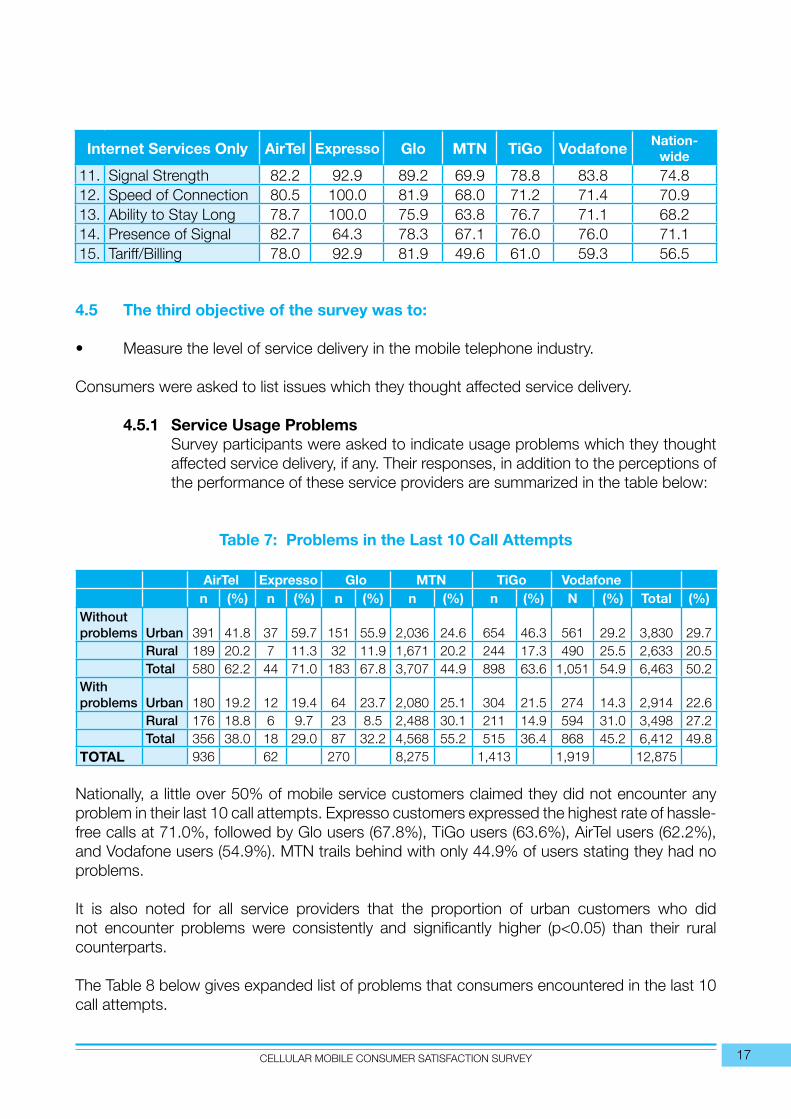
11. Signal Strength 82.2 92.9 89.2 69.9 78.8 83.8 74.812. Speed of Connection 80.5 100.0 81.9 68.0 71.2 71.4 70.913. Ability to Stay Long 78.7 100.0 75.9 63.8 76.7 71.1 68.214. Presence of Signal 82.7 64.3 78.3 67.1 76.0 76.0 71.115. Tariff/Billing 78.0 92.9 81.9 49.6 61.0 59.3 56.5
4.5 The third objective of the survey was to:
• Measurethelevelofservicedeliveryinthemobiletelephoneindustry.
Consumers were asked to list issues which they thought affected service delivery.
4.5.1 Service Usage ProblemsSurvey participants were asked to indicate usage problems which they thought affected service delivery, if any. Their responses, in addition to the perceptions of the performance of these service providers are summarized in the table below:
Table 7: Problems in the Last 10 Call Attempts
AirTel Expresso Glo MTN TiGo Vodafonen (%) n (%) n (%) n (%) n (%) N (%) Total (%)
Withoutproblems Urban 391 41.8 37 59.7 151 55.9 2,036 24.6 654 46.3 561 29.2 3,830 29.7
Rural 189 20.2 7 11.3 32 11.9 1,671 20.2 244 17.3 490 25.5 2,633 20.5Total 580 62.2 44 71.0 183 67.8 3,707 44.9 898 63.6 1,051 54.9 6,463 50.2
With problems Urban 180 19.2 12 19.4 64 23.7 2,080 25.1 304 21.5 274 14.3 2,914 22.6
Rural 176 18.8 6 9.7 23 8.5 2,488 30.1 211 14.9 594 31.0 3,498 27.2Total 356 38.0 18 29.0 87 32.2 4,568 55.2 515 36.4 868 45.2 6,412 49.8
TOTAL 936 62 270 8,275 1,413 1,919 12,875 Nationally, a little over 50% of mobile service customers claimed they did not encounter any problem in their last 10 call attempts. Expresso customers expressed the highest rate of hassle-free calls at 71.0%, followed by Glo users (67.8%), TiGo users (63.6%), AirTel users (62.2%), and Vodafone users (54.9%). MTN trails behind with only 44.9% of users stating they had no problems.
It is also noted for all service providers that the proportion of urban customers who did not encounter problems were consistently and significantly higher (p<0.05) than their rural counterparts.
The Table 8 below gives expanded list of problems that consumers encountered in the last 10 call attempts.
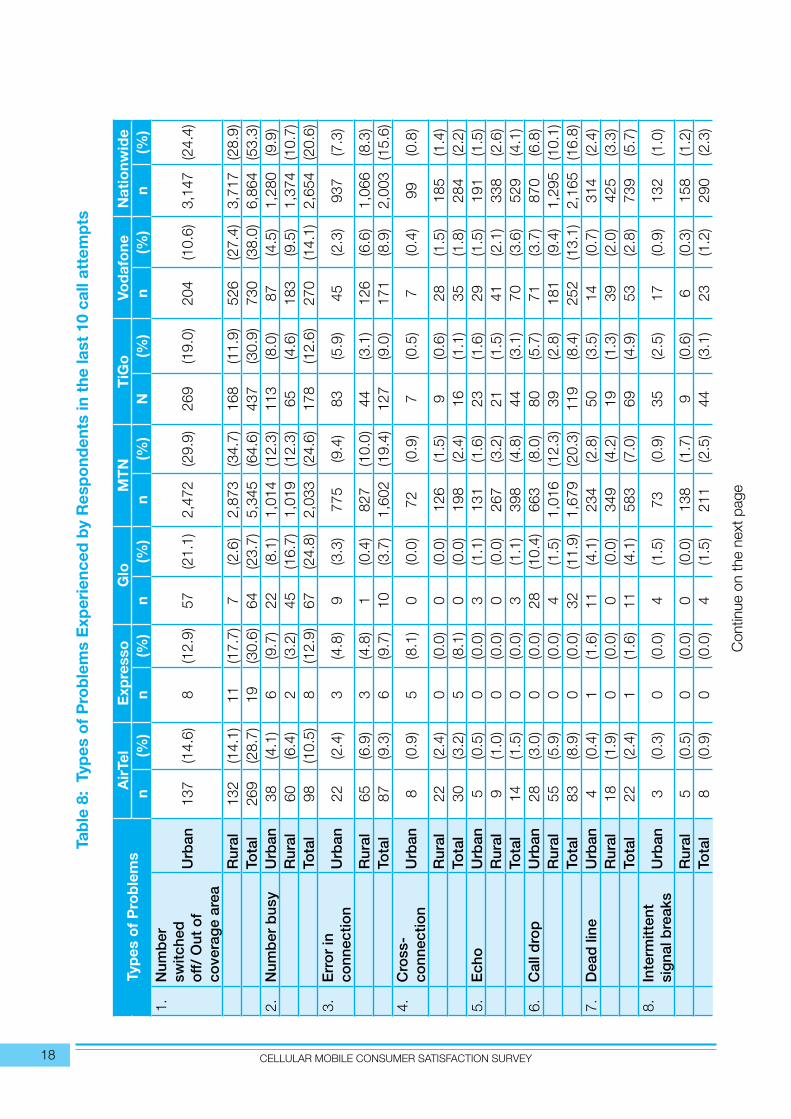
CELLULAR MOBILE CONSUMER SATISFACTION SURVEY18
Ta
ble
8:
Typ
es o
f P
rob
lem
s E
xper
ienc
ed b
y R
esp
ond
ents
in t
he la
st 1
0 ca
ll at
tem
pts
Typ
es o
f P
rob
lem
sA
irTe
lE
xpre
sso
Glo
MT
NT
iGo
Vod
afo
neN
atio
nwid
en
(%)
n(%
)n
(%)
n(%
)N
(%)
n(%
)n
(%)
1.N
umb
er
switc
hed
o
ff/
Out
of
cove
rag
e ar
ea
Urb
an13
7(1
4.6)
8(1
2.9)
57(2
1.1)
2,47
2(2
9.9)
269
(19.
0)20
4(1
0.6)
3,14
7(2
4.4)
Rur
al13
2(1
4.1)
11(1
7.7)
7(2
.6)
2,87
3(3
4.7)
168
(11.
9)52
6(2
7.4)
3,71
7(2
8.9)
Tota
l26
9(2
8.7)
19(3
0.6)
64(2
3.7)
5,34
5(6
4.6)
437
(30.
9)73
0(3
8.0)
6,86
4(5
3.3)
2.N
umb
er b
usy
Urb
an38
(4.1
)6
(9.7
)22
(8.1
)1,
014
(12.
3)11
3(8
.0)
87(4
.5)
1,28
0(9
.9)
Rur
al60
(6.4
)2
(3.2
)45
(16.
7)1,
019
(12.
3)65
(4.6
)18
3(9
.5)
1,37
4(1
0.7)
Tota
l98
(10.
5)8
(12.
9)67
(24.
8)2,
033
(24.
6)17
8(1
2.6)
270
(14.
1)2,
654
(20.
6)3.
Err
or
in
conn
ectio
nU
rban
22(2
.4)
3(4
.8)
9(3
.3)
775
(9.4
)83
(5.9
)45
(2.3
)93
7(7
.3)
Rur
al65
(6.9
)3
(4.8
)1
(0.4
)82
7(1
0.0)
44(3
.1)
126
(6.6
)1,
066
(8.3
)To
tal
87(9
.3)
6(9
.7)
10(3
.7)
1,60
2(1
9.4)
127
(9.0
)17
1(8
.9)
2,00
3(1
5.6)
4.C
ross
-co
nnec
tion
Urb
an8
(0.9
)5
(8.1
)0
(0.0
)72
(0.9
)7
(0.5
)7
(0.4
)99
(0.8
)
Rur
al22
(2.4
)0
(0.0
)0
(0.0
)12
6(1
.5)
9(0
.6)
28(1
.5)
185
(1.4
)To
tal
30(3
.2)
5(8
.1)
0(0
.0)
198
(2.4
)16
(1.1
)35
(1.8
)28
4(2
.2)
5.E
cho
Urb
an5
(0.5
)0
(0.0
)3
(1.1
)13
1(1
.6)
23(1
.6)
29(1
.5)
191
(1.5
)R
ural
9(1
.0)
0(0
.0)
0(0
.0)
267
(3.2
)21
(1.5
)41
(2.1
)33
8(2
.6)
Tota
l14
(1.5
)0
(0.0
)3
(1.1
)39
8(4
.8)
44(3
.1)
70(3
.6)
529
(4.1
)6.
Cal
l dro
pU
rban
28(3
.0)
0(0
.0)
28(1
0.4)
663
(8.0
)80
(5.7
)71
(3.7
)87
0(6
.8)
Rur
al55
(5.9
)0
(0.0
)4
(1.5
)1,
016
(12.
3)39
(2.8
)18
1(9
.4)
1,29
5(1
0.1)
Tota
l83
(8.9
)0
(0.0
)32
(11.
9)1,
679
(20.
3)11
9(8
.4)
252
(13.
1)2,
165
(16.
8)7.
Dea
d li
neU
rban
4(0
.4)
1(1
.6)
11(4
.1)
234
(2.8
)50
(3.5
)14
(0.7
)31
4(2
.4)
Rur
al18
(1.9
)0
(0.0
)0
(0.0
)34
9(4
.2)
19(1
.3)
39(2
.0)
425
(3.3
)To
tal
22(2
.4)
1(1
.6)
11(4
.1)
583
(7.0
)69
(4.9
)53
(2.8
)73
9(5
.7)
8.In
term
itten
t si
gna
l bre
aks
Urb
an3
(0.3
)0
(0.0
)4
(1.5
)73
(0.9
)35
(2.5
)17
(0.9
)13
2(1
.0)
Rur
al5
(0.5
)0
(0.0
)0
(0.0
)13
8(1
.7)
9(0
.6)
6(0
.3)
158
(1.2
)To
tal
8(0
.9)
0(0
.0)
4(1
.5)
211
(2.5
)44
(3.1
)23
(1.2
)29
0(2
.3)
Con
tinue
on
the
next
pag
e

CELLULAR MOBILE CONSUMER SATISFACTION SURVEY 19
Con
tinue
on
the
next
pag
e
cont
inue
from
the
prev
ious
pag
e
Tab
le 8
: Ty
pes
of
Pro
ble
ms
Exp
erie
nced
by
Res
po
nden
ts in
the
last
10
call
atte
mp
ts
Typ
es o
f P
rob
lem
sA
irTe
lE
xpre
sso
Glo
MT
NT
iGo
Vod
afo
neN
atio
nwid
en
(%)
n(%
)n
(%)
n(%
)N
(%)
n(%
)n
(%)
9.C
all c
lari
tyU
rban
16(1
.7)
4(6
.5)
0(0
.0)
115
(1.4
)33
(2.3
)9
(0.5
)17
7(1
.4)
Rur
al0
(0.0
)0
(0.0
)0
(0.0
)28
3(3
.4)
8(0
.6)
44(2
.3)
335
(2.6
)To
tal
16(1
.7)
4(6
.5)
0(0
.0)
398
(4.8
)41
(2.9
)53
(2.8
)51
2(4
.0)
10.
Net
wo
rk f
ailu
reU
rban
57(6
.1)
12(1
9.4)
52(1
9.3)
1,30
7(1
5.8)
60(4
.2)
60(3
.1)
1,54
8(1
2.0)
Rur
al14
7(1
5.7)
10(1
6.1)
59(2
1.9)
2,49
2(3
0.1)
193
(13.
7)65
8(3
4.3)
3,55
9(2
7.6)
Tota
l20
4(2
1.8)
22(3
5.5)
111
(41.
1)3,
799
(45.
9)25
3(1
7.9)
718
(37.
4)5,
107
(39.
7)11
.D
ifficu
lty
rech
arg
ing
un
itsU
rban
3(0
.3)
1(1
.6)
0(0
.0)
51(0
.6)
7(0
.5)
11(0
.6)
73(0
.6)
Rur
al0
(0.0
)0
(0.0
)0
(0.0
)98
(1.2
)0
(0.0
)1
(0.1
)99
(0.8
)To
tal
3(0
.3)
1(1
.6)
0(0
.0)
149
(1.8
)7
(0.5
)12
(0.6
)17
2(1
.3)
12.
Rec
eip
ts o
f m
ultip
le S
MS
Urb
an4
(0.4
)0
(0.0
)0
(0.0
)36
(0.4
)23
(1.6
)5
(0.3
)68
(0.5
)
Rur
al1
(0.1
)0
(0.0
)0
(0.0
)56
(0.7
)1
(0.1
)3
(0.2
)61
(0.5
)To
tal
5(0
.5)
0(0
.0)
0(0
.0)
92(1
.1)
24(1
.7)
8(0
.4)
129
(1.0
)13
.Vo
ice
bre
aks
Urb
an12
(1.3
)0
(0.0
)4
(1.5
)11
0(1
.3)
19(1
.3)
15(0
.8)
160
(1.2
)R
ural
4(0
.4)
0(0
.0)
6(2
.2)
208
(2.5
)30
(2.1
)62
(3.2
)31
0(2
.4)
Tota
l16
(1.7
)0
(0.0
)10
(3.7
)31
8(3
.8)
49(3
.5)
77(4
.0)
470
(3.7
)14
.B
ad in
do
or
rece
ptio
nU
rban
7(0
.7)
0(0
.0)
1(0
.4)
28(0
.3)
1(0
.1)
7(0
.4)
44(0
.3)
Rur
al11
(1.2
)0
(0.0
)0
(0.0
)34
7(4
.2)
24(1
.7)
144
(7.5
)52
6(4
.1)
Tota
l18
(1.9
)0
(0.0
)1
(0.4
)37
5(4
.5)
25(1
.8)
151
(7.9
)57
0(4
.4)
15.
Bad
sp
ot
rece
ptio
nU
rban
9(1
.0)
0(0
.0)
2(0
.7)
23(0
.3)
0(0
.0)
6(0
.3)
40(0
.3)
Rur
al22
(2.4
)0
(0.0
)0
(0.0
)77
7(9
.4)
72(5
.1)
359
(18.
7)1,
230
(9.6
)To
tal
31(3
.3)
0(0
.0)
2(0
.7)
800
(9.7
)72
(5.1
)36
5(1
9.0)
1,27
0(9
.9)
TO
TAL
936
6227
08,
275
1,41
31,
919
12,8
75

CELLULAR MOBILE CONSUMER SATISFACTION SURVEY20
4.6 The fourth objective of the survey was to:
• EvaluatetheperformanceoftheoperatorsagainstthedefinedKPIs.
This section shows the results of operator’s performance against the KPIs and the benchmark established by the Authority.
Table 9: Relative Performance of Service Providers
CUSTOMER SATISFACTIONWITH:
AirTel Expresso Glo MTN TiGo VodafoneBench Mark
% % % % % %
1. BILLING PERFORMANCE
79.8 78.5 86.9 36.8 69.5 68.7 85%
2. HELP/ENQUIRY SERVICES
77.6 83.5 85.6 59.4 78.3 68.1 85%
3. OFFERED SUPPLEMENTARY SVCS
80.2 71.2 82.9 64.4 79.7 73.9 90%
4. OVERALL QUALITY OF SVC
81.6 83.5 83.8 61.7 77.2 72.5 75%
* Excludes ranking for Quality of Internet Service
4.7 The Fifth Objective of the Survey
• Evaluatetherelativeperformanceofprovidersamongthemselveswithrespecttothedefined attributes and KPIs.
4.7.1 Level of Importance of Services
Participants in the survey were asked to indicate the degree of importance of the services listed in Table 10 when selecting a mobile service provider. The summaries in the table are presented and ranked by the frequency of selections.
Quality of reception was the most selected service by 87.1% (11,430 out of 13,119) respondents, followed closely by Tariffs/Billing by 86.0% (11,286 out of 13,119) respondents, coverage by 75.7%, and Ease of making calls by 75.6%, completing the top 4 services selected most by respondents; interestingly, overall level of service was given varying degrees of importance across the four rankings [1 (most important) to 4 (least important)] by 30.3% respondents, making it the 6th in popularity. Customer relations and Response by call centers trailed in popularity, selected by 19.2% and 17.4 respondents respectively.

CELLULAR MOBILE CONSUMER SATISFACTION SURVEY 21
Figure 3: Level of Importance of the 4 Most Popular Services Attributes and Expectations
The level of importance was calculated by adding together those repondents that selected either “Most important” or “Least Important”.
Table 10: Level of Importance of Services
SERVICES1=Most Imp 2=Important 3=Some Imp 4=Least Impn (%) n (%) n (%) n (%) Total (%)
Quality of Reception
4,770 (41.7) 2,900 (25.4) 2,191 (19.2) 1,569 (13.7) 11,430 (87.1)
Tariffs / Billing 3,575 (31.7) 3,190 (28.3) 2,269 (20.1) 2,252 (20.0) 11,286 (86.0)Coverage 2,844 (28.6) 2,855 (28.8) 2,563 (25.8) 1,666 (16.8) 9,928 (75.7)Ease of Making Calls
3,100 (31.2) 2,246 (22.6) 2,351 (23.7) 2,224 (22.4) 9,921 (75.6)
Network used by family, friends
2,024 (30.9) 1,650 (25.2) 1,165 (17.8) 1,701 (26.0) 6,540 (49.9)
Overall Level of Service
1,069 (26.9) 947 (23.8) 737 (18.6) 1,218 (30.7) 3,971 (30.3)
Customer Relations
313 (12.5) 584 (23.2) 639 (25.4) 978 (38.9) 2,514 (19.2)
Response of Call Centers
239 (10.5) 526 (23.2) 427 (18.8) 1,076 (47.4) 2,268 (17.4)

CELLULAR MOBILE CONSUMER SATISFACTION SURVEY22
5.0 ADDITIONAL FINDINGS
5.0.1 Activities for Mobile Phone Usage
The most popular activities that mobile phones are used for are shown below, ranked by order of importance. (a) Making and/or receiving calls: This is the most popular activity for using the mobile
phone as reported by over 97% of consumers nationwide. (b) Sending and/or receiving emails: The next popular activity is reported by only about
16% of nationwide consumers.(c) Internet browsing is popular in 10% of the nationwide consumers.
Popularity levels of most activities are about the same for urban and rural consumers except for internet browsing, which is found to be more than twice as popular among urban (14%) than rural group (6%).
Table 11: Most Frequent Uses of Mobile Phones
ActivityUrban Rural Totaln (%) n (%) n (%)
2. Making / receiving calls 6,742 (98.1) 6,029 (96.6) 12,771 (97.3)3. Sending / receiving e-mails 1,220 (17.7) 838 (13.4) 2,058 (15.7)4. Mobile money transfer 104 (1.5) 76 (1.2) 180 (1.4)5. Browsing the internet 959 (13.9) 366 (5.9) 1,325 (10.1)6. Social network (Facebook, twitter,
etc.)173 (2.5) 114 (1.8) 287 (2.2)
7. Other 5 (0.1) 4 (0.1) 9 (0.1)
5.0.2 Number of Service Providers Consumers Connected to
Over 76% of rural consumers compared to about 64% of urban counterparts are connected to only one network; thus, only about 24% of rural compared to 36% of urban consumers are able to connect to 2 or more mobile service providers.

CELLULAR MOBILE CONSUMER SATISFACTION SURVEY 23
Table 12: The Number of Service Providers Consumers are Connected to
No. of ProvidersUrban Rural Total
n (%) n (%) n (%)1 4,371 63.9 4,727 76.2 9,098 69.82 2,026 29.6 1,331 21.5 3,357 25.73 329 4.8 107 1.7 436 3.34 81 1.2 32 0.5 113 0.95 23 0.3 6 0.1 29 0.26 6 0.1 1 0 7 0.1
Total 6,838 100 6,204 100 13,040 100p<0.05. Test based on Mantel-Haenszel Chi-square statistics. providers were collapsed into one category for test purposes. Those connected to 3 or higher providers were collapsed into one category for test purposes.
Figure 4: Number of Mobile Service Providers Consumers are Connected to

CELLULAR MOBILE CONSUMER SATISFACTION SURVEY24
Table 13: Reasons for Wanting to Change to a New Mobile Service Provider
Ran
k
ReasonAirTel Expresso Glo MTN TiGo Vodafone TOTAL
n (%) n (%) n (%) n (%) n (%) n (%) n (%)
1 Units cheaper/lower tariffs
17 3.2 2 0.4 4 0.8 427 80.4 53 10.0 28 5.3 531 20.9
2 They have better reception
23 4.4 0 0.0 3 0.6 394 75.9 64 12.3 35 6.7 519 20.5
3 Easy to get your calls through
13 4.3 3 1.0 0 0.0 238 78.0 32 10.5 19 6.2 305 12.0
4 They are more reliable
13 5.1 0 0.0 0 0.0 202 78.9 27 10.5 14 5.5 256 10.1
5 My friends use this network
13 6.0 0 0.0 6 2.8 130 60.5 42 19.5 24 11.2 215 8.5
6 They have wider coverage
11 5.3 2 1.0 1 0.5 133 63.9 34 16.3 27 13.0 208 8.2
7 They offer new services
8 6.0 1 0.8 1 0.8 95 71.4 15 11.3 13 9.8 133 5.2
8 Very convenient to use
8 6.0 2 1.5 1 0.8 97 72.9 13 9.8 12 9.0 133 5.2
9 Longer period before recharge
0 0.0 0 0.0 0 0.0 30 81.1 6 16.2 1 2.7 37 1.5
10 They offer transfer of units
0 0.0 1 4.2 0 0.0 10 41.7 4 16.7 9 37.5 24 0.9
11 Their SIM card is cheaper
0 0.0 0 0.0 0 0.0 16 94.1 0 0.0 1 5.9 17 0.7
12 To enjoy their free night calls
0 0.0 1 7.1 0 0.0 6 42.9 3 21.4 4 28.6 14 0.6
13 Other 7 4.8 1 0.7 4 2.8 101 69.7 16 11.0 16 11.0 145 5.7 Total Reported 113 4.5 13 0.5 20 0.8 1,879 74.1 309 12.2 203 8.0 2,537 100
5.0.3 What Respondents like most about their Primary Service Provider
Respondents were asked to state what they liked most about their primary service provider. In order of popularity, their responses include wider coverage area, good reception, ease of making calls to other networks, bonus credit offers, unit not running out faster, and affordable recharge units. Other minor reasons include non-expiring account and lower IDD charges.

CELLULAR MOBILE CONSUMER SATISFACTION SURVEY 25
Table 14: What do you like most about your Service Provider
Ran
k
ReasonAirTel Expresso Glo MTN TiGo Vodafone
n (%) n (%) n (%) N (%) n (%) n (%) Total1 Wider coverage
area181 3.5 8 0.2 37 0.7 4,217 81.3 217 4.2 527 10.2 5,187
2 Good reception 259 8.8 17 0.6 64 2.2 1,658 56.0 325 11.0 637 21.5 2,9603 Easy to make
calls to other networks
374 12.8 18 0.6 71 2.4 1,421 48.7 422 14.5 614 21.0 2,920
4 Offers bonus credits
189 8.9 6 0.3 67 3.2 847 40.0 368 17.4 643 30.3 2,120
5 Lower prices on their units
281 17.2 16 1.0 74 4.5 541 33.2 334 20.5 384 23.6 1,630
6 Introduction of unit transfer
19 1.3 0 0.0 4 0.3 1,347 89.6 84 5.6 50 3.3 1,504
7 Units do not run down fast or low tariffs
291 21.8 15 1.1 63 4.7 376 28.1 267 20.0 324 24.3 1,336
8 Recharge units prices are lower or affordable
62 6.5 5 0.5 10 1.0 651 68.0 102 10.6 128 13.4 958
9 Offers promotions
57 7.8 5 0.7 13 1.8 284 38.7 104 14.2 271 36.9 734
10 It has ring back tone on it
49 7.1 0 0.0 7 1.0 461 67.1 82 11.9 88 12.8 687
11 Free night calls 19 2.8 4 0.6 4 0.6 571 83.8 22 3.2 61 9.0 68112 Always
introducing new things into the market
45 7.7 1 0.2 7 1.2 322 55.3 67 11.5 140 24.1 582
13 Good customer service
65 11.2 1 0.2 17 2.9 307 53.1 84 14.5 104 18.0 578
14 They are reliable 50 11.3 2 0.5 6 1.4 226 51.1 49 11.1 109 24.7 44215 Other 14 4.0 0 0.0 7 2.0 255 72.0 60 16.9 18 5.1 35416 Subscriber to
subscriber unit transfer
2 0.8 1 0.4 1 0.4 202 83.8 15 6.2 20 8.3 241
17 None or no response
9 4.5 2 1.0 1 0.5 150 75.8 25 12.6 11 5.6 198
18 Account does not expire
10 9.3 1 0.9 1 0.9 73 67.6 10 9.3 13 12.0 108
19 Their IDD call charges are lower
9 10.8 3 3.6 4 4.8 36 43.4 12 14.5 19 22.9 83

CELLULAR MOBILE CONSUMER SATISFACTION SURVEY26
5.0.4 What respondents dislike most about their Primary Service Provider
In a bid to improve services rendered by the MNOs, respondents were asked what they disliked most about their MNOs. These were multiple responses which are listed in order of overall popularity in the table below. Out of 25,658 responses (i.e. each individual was allowed to provide more than one response), respondents mostly disliked unstable or jammed network, which had 20% of the responses. This is followed by high tariffs (17.5%), bad reception (10.5%) and high cost of calling other networks (10.3%). Others were “Switched off or out of coverage area” messages (8.7%) and difficulty in calling other networks (7.2%).
Among some of the relatively ‘unpopular’ responses given were free night calls (1.4% of responses), short validity period (1.1%), per second billing not well understood (1.0%), starting time for free night calls being too late (0.9%), time for free night calls being too short (0.4%) and inability to send text messages (0.2%). The table below gives a detailed presentation of the reasons aforementioned.
Table 15: What do you dislike about your Service Provider
Ran
k
ReasonAirTel Expresso Glo MTN TiGo Vodafone
n (%) n (%) n (%) n (%) n (%) n (%) Total1 Network is
sometimes unstable or jammed
234 4.5 13 0.3 68 1.3 3,723 72.4 417 8.1 688 13.4 5,143
2 High call tariffs 136 3.0 8 0.2 30 0.7 3,663 81.8 242 5.4 399 8.9 4,4783 Has bad
reception123 4.5 4 0.1 17 0.6 2,018 74.6 178 6.6 364 13.5 2,704
4 Expensive when calling other networks
112 4.2 8 0.3 29 1.1 1,889 71.3 220 8.3 390 14.7 2,648
5 There are switched off or out of coverage area messages
93 4.2 6 0.3 24 1.1 1,653 74.4 198 8.9 248 11.2 2,222
6 Not easy calling other networks
69 3.7 1 0.1 18 1.0 1,435 77.8 110 6.0 212 11.5 1,845
7 They should improve upon services
140 11.3 12 1.0 24 1.9 668 54.0 149 12.0 245 19.8 1,238
8 Other 134 14.0 8 0.8 24 2.5 304 31.7 337 35.2 151 15.8 9589 Do not have
wider coverage150 16.8 24 2.7 62 6.9 305 34.1 176 19.7 177 19.8 894
10 No free credit or bonus credit
34 4.9 4 0.6 7 1.0 552 79.3 43 6.2 56 8.0 696
11 Should stop interrupting services
39 6.6 3 0.5 5 0.8 396 66.6 62 10.4 90 15.1 595

CELLULAR MOBILE CONSUMER SATISFACTION SURVEY 27
Ran
k
ReasonAirTel Expresso Glo MTN TiGo Vodafone
n (%) n (%) n (%) n (%) n (%) n (%) Total12 Sometimes
deduct units for free night calls
18 4.1 0 0.0 0 0.0 329 74.9 41 9.3 51 11.6 439
13 Bad customer relationship
24 6.0 2 0.5 4 1.0 297 74.6 22 5.5 49 12.3 398
14 No free night calls
58 15.9 4 1.1 17 4.7 161 44.1 57 15.6 68 18.6 365
15 Short validity period
35 11.9 0 0.0 2 0.7 138 47.1 47 16.0 71 24.2 293
16 Per second billing is not well understood
25 9.5 3 1.1 7 2.7 169 64.3 17 6.5 42 16.0 263
17 Starting time for free night calls is too late
11 4.9 0 0.0 1 0.4 158 70.2 25 11.1 30 13.3 225
18 They burn people chip or line
9 7.9 0 0.0 1 0.9 85 74.6 14 12.3 5 4.4 114
19 Time for free night calls is too short
14 14.1 0 0.0 0 0.0 62 62.6 9 9.1 14 14.1 99
20 You can’t send text messages
8 19.5 0 0.0 1 2.4 20 48.8 6 14.6 6 14.6 41
6.0 Wealth Distribution of Customers
Table 16 below presents the means, medians, minimum and maximum values of wealth indices for the service providers. The box plots of Figure 5 consist of the wealth index data and the descriptive statistics in Table 16 are conveniently presented graphically through the quartiles (25th, 50th, 75th percentiles).
Figure 6 below presents the wealth categorization (poverty line, middle and upper wealth) of the customers.
Table 16: Descriptive Statistics for Wealth Index
Statistics AirTel Expresso Glo MTN TiGo VodafoneNation-
wide
N 915 62 244 7,608 1,362 1,904 12,095Mean 63.0 74.9 69.4 59.7 63.8 58.2 60.4Median 62.1 86.2 75.9 62.1 69.0 62.1 62.1Range (Min, Max)
0.0, 100.0
27.6, 100.0
6.9, 100.0
0.0, 100.0
0.0, 100.0
0.0, 100.0
0.0, 100.0

CELLULAR MOBILE CONSUMER SATISFACTION SURVEY28
Figure 5: Box Plots of Wealth Index
The height of each box in Figure 5 represents the middle 50% of the ranked indices for the service provider.(a) On the average Expresso customers are the most affluent users of mobile service,
followed by Glo customers (average indices of 75 and 69, respectively).
(b) MTN and Vodafone customers are the least affluent users with average wealth indices of 58 and 60, respectively.
(c) The national median wealth index for mobile telecommunication consumers is about 62 on the wealth scale of 0—100.
(d) At least half of Expresso customers have wealth index values of 86 or higher, and for Glo half of its customers have indices of 76 or higher.
(e) Half of the users of each of AirTel, MTN and Vodafone have wealth indices of 62 or below; this threshold also coincide with the national median wealth index.
(f) 50% of Expresso’s respondents are concentrated between 58 and 94 wealth index as compared to the nationwide figures which are spread between 27 and 90 on the wealth index scale (Figure 5).

CELLULAR MOBILE CONSUMER SATISFACTION SURVEY 29
Figure 6: Wealth Categories of Consumers
In Figure 6, it is observed that,
(a) Fewer than 7% of Expresso customers fall below the poverty line (lower wealth category), compared with the national figure of 25%.
(b) Glo, TiGo and AirTel with respective customer proportions of 16%, 22% and 23%, all have lower figures falling below the national poverty line.
(c) MTN and Vodafone with respective figures of 26% and 27% have relatively higher proportions of their respective customers considered poor (below national poverty line).
(d) Over half of Expresso customers (53%) are considered to be affluent (upper wealth). The corresponding figures for Glo, AirTel and TiGo are 41%, 33% and 33% respectively, compared to the national affluent group (top 30%).
(e) MTN and Vodafone have about 29% and 28% respectively of affluent customers, and these are below the 30% national figure.

CELLULAR MOBILE CONSUMER SATISFACTION SURVEY30
CONCLUSIONThe consumer satisfaction survey was undertaken to examine and understand consumers’ perceptions of the services provided by their mobile network operators. In this regard, consumers’ perception of the services and performances of their service providers varies widely in relations to the service attributes and KPIs used in the survey.
The report findings seem to indicate that consumers are relatively satisfied with the services of their mobile network operators. However, there are areas that need improvement as operators were not able to meet all the benchmarks for the KPIs.
The Authority believes that the findings of this survey will go a long way to help operators identify critical areas that are needed for improvement and enhance service experience for consumers.

CELLULAR MOBILE CONSUMER SATISFACTION SURVEY 31

National Communications Authority, Head Office, Accra1st Rangoon Close, Switchback Road, Cantonments, Accra, GhanaP. O. Box CT 1568, Cantonments, AccraTel: +233 - (0)30 - 2776621/2771701 Fax: +233 - (0)30 – 2763449E-mail: [email protected]@nca.org.ghWebsite: www.nca.org.gh
Bolgatanga OfficeNational Communications Authority, H/No ZB 70, Zorbisi EstatesPrivate Mail Bag, Bolgatanga, Upper East RegionTel: +233 - (0)382 - 021141E-mail: [email protected]
Ho OfficeNational Communications Authority, H/No A6/29, Stadium RoadP. O. Box HP1576, Ho, Volta RegionTel: +233 - (0)36-2026375/2026339E-Mail: [email protected]
Koforidua OfficeNational Communications Authority, Nico Annan’s Plaza Private Mail Bag, Koforidua, Eastern RegionTel: +233 - (0)03420- 28378/ 28380/ 28382E-Mail: [email protected]
Kumasi OfficeNational Communications Authority, H/No 99, AdumP. O. Box KS 10768, Kumasi, Ashanti Region, GhanaTel: + 233(0)3220-20014/ (0)3220-20018/ (0)3220-20019E-Mail: [email protected]
Sunyani OfficeNational Communications Authority, Plot No 83/D PeakwaseP. O. Box SY125, Sunyani, BrongAhafo RegionTel: 233(0)352-027564E-Mail: [email protected]
Takoradi OfficeNational Communications Authority, Chapel HillP. O. Box SL 409, Sekondi, Western Region, GhanaTel: +233 (0)3120-28073/ (0)3120-28049 Fax: +233 (0)3120-28063E-Mail: [email protected]
Tamale OfficeNational Communications Authority, Watherson Residential AreaP. O. Box TL 1590, Tamale, Northern Region, GhanaTel: + 233-(0)37-2028105/ (0)37-0208104E-Mail: [email protected]
Our Contacts: