cells in HCV-infected patients: Multiple ISSN: 0191-3123 ...
13
Full Terms & Conditions of access and use can be found at http://www.tandfonline.com/action/journalInformation?journalCode=iusp20 Download by: [Soheir Mansy] Date: 21 July 2016, At: 04:55 Ultrastructural Pathology ISSN: 0191-3123 (Print) 1521-0758 (Online) Journal homepage: http://www.tandfonline.com/loi/iusp20 Spotlight on the three main hepatic fibrogenic cells in HCV-infected patients: Multiple immunofluorescence and ultrastructure study Soheir S. Mansy PhD, Mona M. Nosseir MD, May M. Othman MSc, Mona A. Zoheiry MD, Mohammed F. Guda MD, Hoda A. Yehia PhD & Moataz H. Hassanein MD To cite this article: Soheir S. Mansy PhD, Mona M. Nosseir MD, May M. Othman MSc, Mona A. Zoheiry MD, Mohammed F. Guda MD, Hoda A. Yehia PhD & Moataz H. Hassanein MD (2016): Spotlight on the three main hepatic fibrogenic cells in HCV-infected patients: Multiple immunofluorescence and ultrastructure study, Ultrastructural Pathology, DOI: 10.1080/01913123.2016.1194507 To link to this article: http://dx.doi.org/10.1080/01913123.2016.1194507 Published online: 13 Jul 2016. Submit your article to this journal Article views: 8 View related articles View Crossmark data
Transcript of cells in HCV-infected patients: Multiple ISSN: 0191-3123 ...

Full Terms & Conditions of access and use can be found athttp://www.tandfonline.com/action/journalInformation?journalCode=iusp20
Download by: [Soheir Mansy] Date: 21 July 2016, At: 04:55
Ultrastructural Pathology
ISSN: 0191-3123 (Print) 1521-0758 (Online) Journal homepage: http://www.tandfonline.com/loi/iusp20
Spotlight on the three main hepatic fibrogeniccells in HCV-infected patients: Multipleimmunofluorescence and ultrastructure study
Soheir S. Mansy PhD, Mona M. Nosseir MD, May M. Othman MSc, MonaA. Zoheiry MD, Mohammed F. Guda MD, Hoda A. Yehia PhD & Moataz H.Hassanein MD
To cite this article: Soheir S. Mansy PhD, Mona M. Nosseir MD, May M. Othman MSc,Mona A. Zoheiry MD, Mohammed F. Guda MD, Hoda A. Yehia PhD & Moataz H. HassaneinMD (2016): Spotlight on the three main hepatic fibrogenic cells in HCV-infected patients:Multiple immunofluorescence and ultrastructure study, Ultrastructural Pathology, DOI:10.1080/01913123.2016.1194507
To link to this article: http://dx.doi.org/10.1080/01913123.2016.1194507
Published online: 13 Jul 2016.
Submit your article to this journal
Article views: 8
View related articles
View Crossmark data

ORIGINAL ARTICLE
Spotlight on the three main hepatic fibrogenic cells in HCV-infected patients:Multiple immunofluorescence and ultrastructure studySoheir S. Mansy, PhDa, Mona M. Nosseir, MDb, May M. Othman, MSca, Mona A. Zoheiry, MDc,Mohammed F. Guda, MDd, Hoda A. Yehia, PhDa, and Moataz H. Hassanein, MDd
aElectron Microscopy Research Department (Pathology), Theodor Bilharz Research Institute, Giza, Egypt; bPathology Department, TheodorBilharz Research Institute, Giza, Egypt; cImmunology Department, Theodor Bilharz Research Institute, Giza, Egypt; dHepatogastroenterologyDepartment, Theodor Bilharz Research Institute, Giza, Egypt
ABSTRACTThepresentwork dealswith the simultaneous ultrastructure and triple immunofluorescence study of thethree main hepatic fibrogenic cells, hepatic stellate cell, myofibroblast (MF), and fibroblast, in a group ofhepatitis C virus (HCV) RNA positive patients, as their exact interrelation behavior in vivo with theprogress of hepatic fibrosis is still inadequate. In this study, for the first time, cells having the morpho-logical characteristic of MF and not bone marrow fibrocytes were revealed in liver portal vessels. Thisnecessitates the reevaluation of the available knowledge concerning bone marrow fibrocyte. Also, thedistribution, cellular interrelations, and the fate of MF were highlighted.
ARTICLE HISTORYReceived 13 May 2016Accepted 23 May 2016Published online 14 July2016
KEYWORDSBone marrow fibrocyte;fibroblast; hepatic stellatecell; liver fibrosis;myofibroblast
Introduction
Hepatitis C virus (HCV) infection is one of themajor causes of chronic liver disease worldwide.The number of chronically infected persons isapproximately about 160–185 million persons[1,2]. Fibrosis and cirrhosis with or without hepa-tocellular carcinoma (HCC) are the main long-term impact of HCV and the main causes ofmorbidity and mortality [2,3]. The currently avail-able management is liver transplantation. Thus,the need for organs is continually increasing andmany patients die while being on the waiting list[4]. On the other hand, an important alternative isthe modulation of the fibrogenic process by betterunderstanding of the contributing factors and thedevelopment of antifibrotics. Until now, despitethe running researches no effective drugs havebeen validated in the clinical practice [5,6].
Hepatic stellate cells, myofibroblasts, and portalfibroblasts have been shown to be crucial players inthe process of hepatic fibrogenesis [7–15]. Manyresearchers have tackled these cells from diverse
aspects as morphological, molecular, functional, andsecreted material [13,14,16–21]. Also,Nepomnyashchikh et al. [22] and Mansy et al. [23]have shed light on hepatic stellate cells in patients withHCV at an ultrastructure level. Meanwhile, the exactbehavior of these cells is still inadequate and the originof myofibroblasts is not yet resolved [13,24]. As wellas, to our knowledge, no one has laid importance tothe dynamic and interrelation of these cells in vivowith the progress of hepatic fibrosis.
The aim of this study is to determine the overallimpact value of these cells on the process of hepaticfibrogenesis. This is achieved not solely based on theavailable specific markers of these cells using tripleimmunofluorescence technique but also on theirmor-phology and interaction at an ultrastructure level.Moreover, correlation of the quantitative assessmentof these cells with the corresponding evaluation ofserum levels of hyaluronic acid and morphometricimage analysis of collagen in liver sections is consid-ered. Serum hyaluronic acid is among the most vali-dated non-invasive serum biomarkers for monitoringhepatic fibrosis [25,26]. Meanwhile, this study has
CONTACT Soheir S. Mansy [email protected]; [email protected] Electron Microscopy Research Department (Pathology), Theodor BilharzResearch Institute, El Nile Street, Warrak-El Hadar, Imbaba 12411, Giza, Egypt.Color versions of one or more of the figures in this article can be found online at www.tandfonline.com/iusp.
ULTRASTRUCTURAL PATHOLOGYhttp://dx.doi.org/10.1080/01913123.2016.1194507
© 2016 Taylor & Francis
Dow
nloa
ded
by [
Sohe
ir M
ansy
] at
04:
55 2
1 Ju
ly 2
016

used fibroblast surface proteins, α smooth muscleactin and reelin, which are secreted by fibroblastcells,myofibroblasts, andHSC, respectively, as specificmarkers for the determination of these cells in thesame immunostained liver section [17,27–31]. Theprospective of this work is to increase our understand-ing of the available knowledge and to point out thecells that deserve to be inactivated to control the pro-gress of fibrosis.
Material and methods
A total of 64 cases positive for serum HCV RNAconfirmed by polymerase chain reaction and havingHCV genotype 4 were enrolled in this study. They allwere above 19 years of age. They were among thepatients admitted consecutively to Theodor BilharzResearch Institute at the hepatogastroenterologydepartment for performing liver biopsy or acquiringtreatment between 2013 and 2014. All the patientssubjected to this study had not any additional causeof chronic liver diseases as result of other viral infec-tions, parasitic infections, and biliary or metabolicdisorders. They were not subjected to antifibrotic,immunosuppressive, or antiviral treatment. They didnot have any associated organic diseases such asosteoarthritis, autoimmune diseases, rheumatoidarthritis, or HCC. These patient’s inclusion and exclu-sion criteria were determined after complete clinicalexamination and laboratory investigations.
A control group consisting of 15 age-matchedhealthy volunteers was involved in the study. Theywere subjected only to blood sample collection forthe assessment of serum hyaluronic acid.
This study was approved by Theodor BilharzResearch Institute Institutional Review Board.Informed consent was taken from all patients accord-ing to the rules of Declaration of Helsinki before anymedical intervention.
Samples collection and processing
Two percutaneous liver core biopsies were taken fromeach patient by applying Menghini’s technique.Hepafix needle with 16 gauge was used under ultra-sound guidance. Fasting blood sample (3 ml) wascollected from the patients and the control group forthe analysis of serum hyaluronic acid.
The harvested liver biopsies were processed for:
Electron microscopic examinationOne core of liver specimens was divided into tinypieces of about 1 mm3 and fixed in 4% bufferedglutaraldehyde (SERVA, Frankfurt, Germany) in0.2% cacodylate (TAAB essential for microscopy,Aldermaston, Berks, UK) and processed for electronmicroscopic examination. The fixed liver biopsieswere washed in equal volumes of 0.3 M cacodylateand sucrose 0.4M for two successive baths of 1 h each,then postfixed in 2% osmium tetroxide (TAAB essen-tial for microscopy, Aldermaston, Berks, England) for2 h, dehydrated in ascending concentrations of alco-hol and propylene oxide and embedded in epoxyresin. Inclusion in gelatin capsules was performedusing the mixture of Epon 812, dodecenyl succinicanhydride, methyl nadic anhydride, and benzyldi-methylamine (Electron Microscopy Sciences,Hatfield, PA). Polymerization was done at 60°C for48 h. Semithin liver sections of 1 µm thick wereperformed using the ultramicrotome (Leica UltracutR, Vienna, Austria). The sections were stained withmethylene blue and azur II for the selection of the sitesto perform ultrathin sections. The midzonal and peri-portal areas of hepatic lobule as well as the portal tractwere the considered sites. Ultrathin liver sections weredone. They were stained with uranyl acetate 7% inwater and lead citrate (Loba Chemie Pvt. Ltd., Colaba,Mumbai, India). The differentiation between thethree studied fibrogenic cells at the ultrastructurelevel was based on the previously reported morpho-logic criteria of each cell [32]. Ultrastructure examina-tion of the ultrathin liver sections was done usingPhillips Electron Microscope 208S (FEI Company,Eindhoven, The Netherlands).
Formation of paraffin block for light and confocallaser scanning microscopic examinationThe second core of liver biopsies not less than 2.5 cmin length was fixed in 10% buffered formalin andprocessed until embedded in paraffin blocks for lightand confocal laser scanning microscopic procedures.
Histological examination of liver samples. Serialliver sections of 4 μm thickness were performedfrom the paraffin-embedded liver biopsies.They were stained with hematoxylin and eosinand Masson Trichrome. The stage of fibrosisand necroinflammatory grade of activity wereassessed according to the METAVIR scoring
2 S. S. MANSY ET AL.
Dow
nloa
ded
by [
Sohe
ir M
ansy
] at
04:
55 2
1 Ju
ly 2
016

system [33]. Fibrosis was staged on a scale of 0–4in which F4 constitutes liver cirrhosis. It wasfurther grouped into moderate fibrosis (F1 + F2)and severe hepatic fibrosis (F3 + F4) [34–36].
Morphometric image analysis of hepatic collagen.Liver sections of 5 μm thickness were stained withSirius red. Fibrous tissue appeared pink in a color-less background. Morphometric measurement wascarried out using the Kontron image analysis sys-tem with the Rel.4.8 Axio Vision software pro-gram. The pink-colored stained collagen withSirius red was measured in the sections as a per-centage of quantifiable, integrated, optical density(IOD) of the sum of the area of microscopic fields.For each patient, five fields per slide illustratingmaximum area of fibrosis were evaluated using 5×Zeiss objective lens and the mean value wasconsidered.
Triple immunofluorescence staining of the threestudied cells. The technique was applied to iden-tify and assess the three studied fibrogenic cells:HSC, myofibroblast, and fibroblast in the sameliver section.
The triple immunofluorescence techniqueusing multiple fluorochromes was performed on5 μm thick deparaffinized liver sections depositedon Super Frost Plus glass slides [37]. The appliedprimary antibodies were mouse anti-humanreelin antibody (Santa Cruz Biotechnology, Inc.,Dallas, TX) for the determination of hepatic stel-late cells; rabbit anti-human fibroblast surfaceprotein 1B10 (FSP) (Biorbyt, Berkeley, CA) forthe determination of fibroblast; and goat anti-human smooth muscle a-actin (Sigma-Aldrich,Darmstadt, Germany) for the determination ofmyofibroblast. A mixture of these primary anti-bodies was applied on the studied sections in thedilution of 1:150, 1:50, and 1:100, respectively.The secondary antibodies were donkey affinipureanti-goat IgG antibody cyanine (CY2) conjugated(Rockland Antibodies and Assays, Limerick, PA);donkey affinipure anti-mouse IgG antibody ami-nomethylcoumarin (AMCA) conjugated (JacksonImmunoResearch Laboratories, West Grove, PA);and donkey affinipure anti-rabbit IgG antibodyindocarbocyanine (CY3) conjugated (JacksonImmunoResearch Laboratories). A mixture of labeled
secondary antibodies in the dilution of 1:400, 1:150,and 1:200 were applied for the revelation of primaryantibodies. The AMCA, the CY2, and the CY3 labelsare visualized as blue, green, and red, respectively,when excited with laser wavelength. DakoEnVisiona FLEX Target retrieval solution, high pH(50×) (Dako Denmark A/S, Glostrup, Denmark) wasused for epitope antigen retrieval according the man-ufacturer’s manual for the reagent. The stained slideswere mounted using ready-to-use Dako faramountaqueous mounting media. Negative control sampleswere processed concomitantly in the same runaccording to the standard protocols. The immuno-fluorescence stained slides were examined using con-focal laser scanning microscope (Carl Zeiss 710, ZeissInternational, Oberkochen, Germany). The used soft-ware was ZEN, 2009 version. The applied laser wave-lengths were 405, 458, 488, 514, 543, and 633 nm.Examinationwas done using the objective: Plan-apoc-hromat 63× oil, EC plan-neofluar 40× oil, 20×, and10×. Scoring of the positively stained immunoreactivecells in five images showing maximum reaction wasdone, and the mean value was calculated for eachpatient’s sample. The images were taken for eachsample at the level of CLSM using EC plan, neofluar40×/1.30 oil DIC M27.
Determination of serum hyaluronic acid with ELISAtechniqueSerum hyaluronic acid was assessed using thequantitative sandwich immunoassay technique. Acommercially available enzyme-linked immuno-sorbent assay (ELISA) kit was applied. The micro-titer plate has been pre-coated with a polyclonalHA antibody. The detection reagent was horse-radish peroxidase (HRP)–conjugated polyclonalantibody for HA. The chromogenic substrate wasA and B solution (BlueGene Biotech Co., Ltd.,Shanghai, China). The manufacturer-reported sen-sitivity of the applied ELISA kit was 1.0 ng/ml, theintra-assay variability coefficient of variation (CV)was <10% and inter-assay CV was <12%.
The technique was achieved according theinstructions in the manufacturer reagent’s opera-tion manual. Standards and samples were done atthe same time. The measurement of the colorchange was done using the spectrophotometer ata wavelength of 450 nm (ELISA reader BioRad,Marnes-la-Coquette, France). The quantitative
ULTRASTRUCTURAL PATHOLOGY 3
Dow
nloa
ded
by [
Sohe
ir M
ansy
] at
04:
55 2
1 Ju
ly 2
016

measurement of serum hyaluronic acid in thesamples was interpolated from the appropriatestandard curve according to the OD of the sam-ples. All assays were performed in duplicate.
Statistical analysis
Statistical analysis of data was done using StatisticalPackage for Social Sciences (SPSS), version 21.Numerical data were summarized using means andstandard deviations. Data were explored for normalityusing Kolmogorov–Smirnov test and Shapiro–Wilktest. Exploration of data revealed that the collectedvalues were not normally distributed. Comparisonsbetween the two groups were done by Mann–Whitney test. Comparisons between more than twogroups were performed using the Kruskal–Wallisnonparametric test. This test was followed by thepost hoc Bonferroni corrections to adjust theP-values. Univariate analyses were performed toselect a first set of features to be tested for inclusionin a multivariate model. All features with a P-valueless than 0.1 were included in the stepwise logisticregression model. Estimated odds ratios (ORs)with confidence intervals (CIs) were calculated.To assess the degree of association between thedifferent measurements, the Spearman’s correla-tion coefficient was calculated. All P-values aretwo-sided. P-values <0.05 were consideredsignificant.
Results
Examination of the three fibrogenic cells at theCLSM and EM levels
The distribution of HSCs, myofibroblasts, and fibro-blasts in the studied liver sections stained with multi-ple fluorochromes was identified. Reelinimmunoreactivity, which is the marker of HSCs,showed preferential intralobular localization in theintercellular and perisinusoidal areas. Scattered cellswere detected in the portal tract and septal fibrosis,especially in stages F3 and F4 fibrosis. The green αsmooth muscle actin immunoreactivity denotingstained myofibroblasts was mostly confined to theportal tract in stage F1 hepatic fibrosis. They revealedoutspreading to the periportal and lobular areas instages F2–F4. In these later stages, positive green
myofibroblast processes were seen extending in theliver lobule along blood sinusoids and intercellularareas. The smooth muscle cells (SMCs) forming thewall of blood vessels showed equally intense greenfluorescent reaction for α smooth muscle actin.These SMCs were not included in myofibroblastcellular count. Immunoreactivity for fibroblast sur-face protein was scarcely detected in the examinedsections in comparison with the immunoreactivity ofreelin and α smooth muscle actin. They were mainlyrestricted to portal tracts. Co-localization of redfibroblast surface protein immunoreactivity in αsmooth muscle actin positive myofibroblasts wasmostly seen in stage F4 fibrosis. The overlapped co-localized immunostaining took orange-yellow col-oration. Also, co-localization of reelin and α smoothmuscle actin positive myofibroblasts was oftendetected. They were clearly distinguished in thesame cell. The co-localization of the three markerswas not disclosed in the same cell in the examinedsections (Figures 1 and 2).
This distribution of the three fibrogenic cells, seenat the level of the multiple fluorochromes stainedsections, was similar to their location identified byelectron microscopy (EM). Myofibroblast consti-tuted the main cell detected in examined sectionsespecially in stage F2 fibrosis upward to stage F4fibrosis. The detected myofibroblasts in liver lobulewere mainly of HSC origin. They were characterizedby the presence of single intracytoplasmic fat dro-plet. Fibroblasts whenever detected were seenmainlyin the vicinity of myofibroblasts. Fibroblast andmyofibroblast cells were not noticed in the Dissespace. Instead, thin cytoplasmic cellular spindle-shaped structures showing cytoplasmic fibrillarymaterial were frequently depicted in the Dissespace and intercellular areas. This cytoplasmic struc-ture seems originating from myofibroblasts, as simi-lar thin cellular projections extended from themyofibroblasts and appeared insinuating betweenthe hepatocytes or communicating cells togetherwere disclosed in the α smooth muscle actin immu-nostained sections. As well as, detached or cleavedcellular parts from myofibroblasts were visualized inthe examined sections. Some of them showed bun-dles of cytoplasmic microfilaments. Myofibroblastsshowing cleavage appeared mainly solitary and sur-rounded by fibrous tissue. Their rough endoplasmicreticulum was not hypertrophied. Their nuclei were
4 S. S. MANSY ET AL.
Dow
nloa
ded
by [
Sohe
ir M
ansy
] at
04:
55 2
1 Ju
ly 2
016

no more indented and the cells exhibited rudimen-tary basal lamina. They looked undergoing modula-tion to fibroblasts (Figure 3).
At the level of EM, spindle-shaped cells havingthe characteristic morphologic picture of myofi-broblasts and not fibrocytes were depicted in the
Figure 1. Triple fluorochromes stained liver sections using AMCA, CY2, and CY3 labels for reelin, α SMA, and FSP, respectively. (A)HSCs, fibroblasts, and myofibroblasts show blue, red, and green immunoreactivity, respectively. Note the extended cellularprojections of myofibroblast (arrow). (B) Part of a portal tract shows positive myofibroblasts (arrows) and SMCs for α smooth muscleactin immunoreactivity. The latter takes circular configuration around blood vessels (arrowhead). (C) Co-localization of α smoothmuscle actin and fibroblast surface protein in many cells (arrows). (D) Blue immunoreactivity for reelin in intimate localization with αsmooth muscle actin of myofibroblasts (arrows) (40×/1.30 oil DIC M27 EC plan-neofluar).
Figure 2. Triple immunofluorescence stained liver sections for the simultaneous visualization of HSCs, myofibroblasts (MF), andfibroblasts (Fb) cells. (A) Part of the liver lobule shows HSCs and myofibroblasts only. No fibroblasts are detected in the section.Myofibroblasts reveal extended cellular projections. (B) Myofibroblasts shows extending (arrows) and communicating cellularprojections (arrowhead) (40×/1.30 oil DIC M27 EC plan-neofluar).
ULTRASTRUCTURAL PATHOLOGY 5
Dow
nloa
ded
by [
Sohe
ir M
ansy
] at
04:
55 2
1 Ju
ly 2
016
portal circulation of the examined liver sections.These cells were characterized by fusiformindented nucleus, the presence of many pinocyto-tic vesicles along the cell membrane, plasmalem-mal attachment plaques, and well-developedhypertrophied rough endoplasmic reticulum. Thislast criterion differentiates these cells from SMCs(Figure 4).
Relations between the three fibrogenic cells,stages of hepatic fibrosis, and hepatic fibrogenicparameters
Quantitative assessment of the three fibrogeniccells was performed in the liver sections of thestudied cases. The results were correlated withthe corresponding necroinflammatory activities,the stage of hepatic fibrosis, the values of the
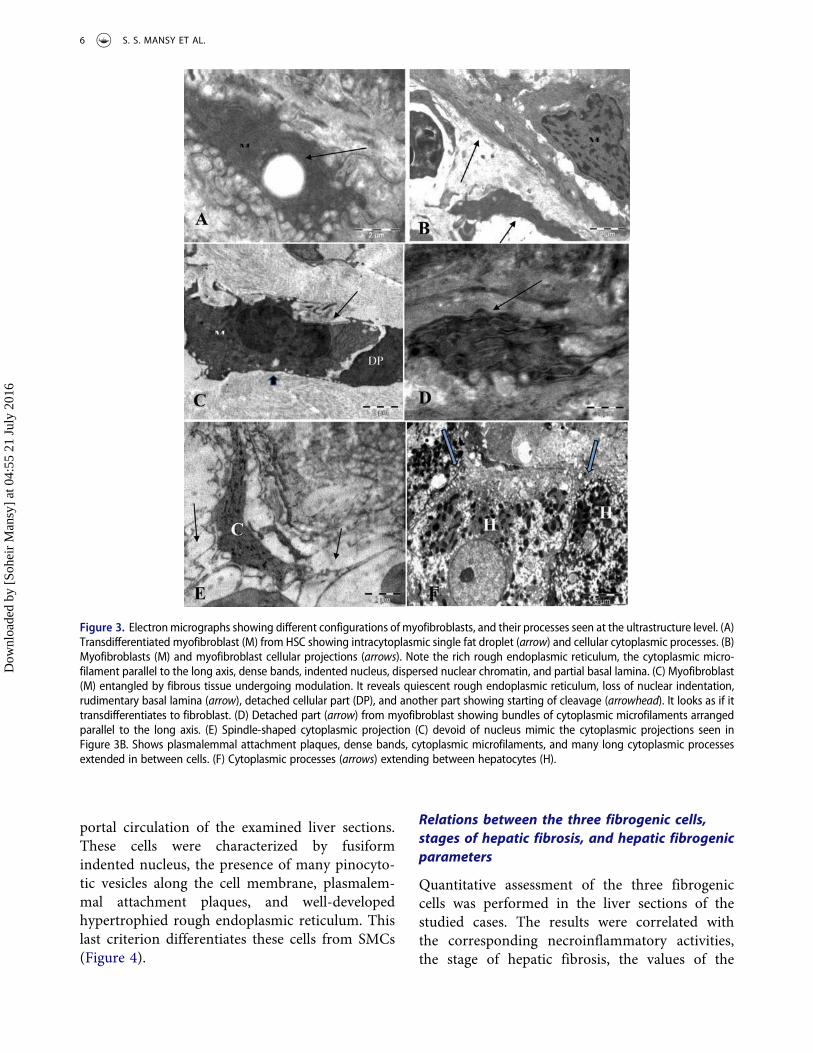
Figure 3. Electronmicrographs showing different configurations of myofibroblasts, and their processes seen at the ultrastructure level. (A)Transdifferentiated myofibroblast (M) from HSC showing intracytoplasmic single fat droplet (arrow) and cellular cytoplasmic processes. (B)Myofibroblasts (M) and myofibroblast cellular projections (arrows). Note the rich rough endoplasmic reticulum, the cytoplasmic micro-filament parallel to the long axis, dense bands, indented nucleus, dispersed nuclear chromatin, and partial basal lamina. (C) Myofibroblast(M) entangled by fibrous tissue undergoing modulation. It reveals quiescent rough endoplasmic reticulum, loss of nuclear indentation,rudimentary basal lamina (arrow), detached cellular part (DP), and another part showing starting of cleavage (arrowhead). It looks as if ittransdifferentiates to fibroblast. (D) Detached part (arrow) from myofibroblast showing bundles of cytoplasmic microfilaments arrangedparallel to the long axis. (E) Spindle-shaped cytoplasmic projection (C) devoid of nucleus mimic the cytoplasmic projections seen inFigure 3B. Shows plasmalemmal attachment plaques, dense bands, cytoplasmic microfilaments, and many long cytoplasmic processesextended in between cells. (F) Cytoplasmic processes (arrows) extending between hepatocytes (H).
6 S. S. MANSY ET AL.
Dow
nloa
ded
by [
Sohe
ir M
ansy
] at
04:
55 2
1 Ju
ly 2
016

morphometric quantitative assessment of fibrosisand the serum levels of HA (Tables 1–3, Figure 5).
The myofibroblasts showed significant increase ingrade A3 activities versus grade A1 (P < 0.012).Meanwhile, the fibroblasts and HSCs did not revealany relation with the degree of hepatic necroinflam-matory activities. Moderate correlation was detectedbetween the quantitative values of myofibroblast ver-sus fibroblasts and hepatic stellate cells (r = 0.461, P <
.001; r = 0.489, P < .001, respectively). Hepatic stellatecells revealed weak correlation with fibroblasts (r =0.254, P = .045). Significant correlation was detectedbetween the three cells and the morphometric imageanalysis of liver tissue collagen. This correlation wassignificantly moderate with the quantitative value ofmyofibroblasts (r = 0.553, P < .001) and weak with theother two cells. Good and moderate significant corre-lations were detected between the serum levels of HA
A B
C
pv pv
pv
Figure 4. Electron micrograph showing myofibroblasts circulating in hepatic portal vein (P). (A) Two spindle-shaped cells with deepindented nucleus. (B and C) High power view of myofibroblasts circulating in the portal vein (P). They are spindle-like in shape. Theyshow indented nucleus with dispersed chromatin, rich hypertrophied rough endoplasmic reticulum, pinocytotic vesicles (arrows),and fine cellular cytoplasmic projections (bent arrows).
Table 1. Correlation between the grade of activity and the fibrogenic cells.Activity
P-value
0 (n = 8) 1 (n = 30) 2 (n = 15) 3 (n = 11)
Mean Standard deviation Mean Standard deviation Mean Standard deviation Mean Standard deviation
Fb 9.3 3.7 8.3 3.5 10.0 2.9 8.9 3.0 .384MF 24.5 6.7 23.1* 7.3 28.5 5.7 32.2* 7.9 .007HSC 14.6 4.8 15.9 5.5 19.8 4.8 17.4 5.8 .066
P-values < .05 were considered significant.*Significant.
ULTRASTRUCTURAL PATHOLOGY 7
Dow
nloa
ded
by [
Sohe
ir M
ansy
] at
04:
55 2
1 Ju
ly 2
016

versus the quantitative mean values of myofibroblastsand HSCs, respectively. Significant correlation wasdetected between the stages of hepatic fibrosis andthe mean values of myofibroblasts, fibroblasts, andhepatic stellate cells. This correlation was good, mod-erate, and weak, respectively (r = 0.750, P < .001; r =0.598, P < .001; r = 0.287, P < .021, respectively). Thequantitative values of fibroblasts and myofibroblastsin stage F4 or cirrhosis were significantly increasedthan stage F1 (P < .001 and P < .001, respectively).Conversely, HSCs in stage F4 fibrosis did not revealsignificant increase in relation to stage F1 fibrosis(Figure 5). Significant increase was noted in themean value of myofibroblasts and fibroblasts in severehepatic fibrosis (F3 + F4) versus moderate fibrosis (F1+ F2) (P < .001; Table 4). Meanwhile HSC revealed nosignificant increase in severe fibrosis. The analysis ofthe logistic regression (Table 5) of myofibroblasts andfibroblasts pointed to the important impact of myofi-broblasts on hepatic fibrogenesis versus fibroblasts.This was deduced from the P-value of myofibroblastswhich was smaller than that of fibroblasts (P < .001, P< .012, respectively). Meanwhile, the increase in fibro-blasts denoted the development of hepatic cirrhosis.Every unit increase in the mean value of fibroblastsand myofibroblasts is associated, respectively, with41% and 30% increase in the risk of liver cirrhosisdevelopment.
Discussion
To our knowledge this is the first study whichtackles the study of these three hepatic fibrogeniccells simultaneously at the level of EM and CLSMusing multiple fluorochromes staining. In the pre-sent work, the quantitative assessment of α smoothmuscle actin immunoreactive cells conformingwith myofibroblasts, whatever its origin, revealed,respectively, moderate and good significant corre-lation with the corresponding morphometricimage analysis of liver tissue collagen, serum levelsof HA, and the stage of hepatic fibrosis.Controversially, HSCs and fibroblasts revealedweak or moderate correlation. Also, the logisticregression test has proved the significant involve-ment of myofibroblasts in the progress of hepaticfibrosis. These results were confirmed by EM ofliver sections in which myofibroblasts and myofi-broblasts transdifferentiated from activated HSCsrepresented the main encountered cells. These find-ings reinforce the published concept that myofibro-blasts are the key players in the process of hepaticfibrogenesis [15,24,30,38]. Moreover, the significantcorrelation detected between these studied fibro-genic cells pick out the synergistic manner bywhich the three cells orchestrate the process ofhepatic fibrogenesis. The detected myofibroblastcellular intercommunicating processes, detached
Table 2. Correlation between the three fibrogenic cells and the morphometric image analysis of collagen, the stage of hepaticfibrosis, as well as serum hyaluronic acid.
Spearman’s ρ
HA (pg/ml) MIA of collagen Stage of fibrosis Fb MF
r P-value r P-value r P-value r P-value r P-value
Fb 0.381# .002 0.395# .001 0.598^ < .001MF 0.660* < .001 0.553^ < .001 0.750* < .001 0.461^ < .001HSC 0.598^ < .001 0.260# .038 0.287# .021 0.254# .045 0.489^ < .001
P-values < .05 were considered significant.*Good correlation, ^Moderate correlation, #weak correlation (r < 0.4).
Table 3. Relation between the studied three cells and the stages of hepatic fibrosis.Stage of fibrosis
F1 (n = 15) F2 (n = 22) F3 (n = 16) F4 (n = 11)
Mean Standard deviation Mean Standard deviation Mean Standard deviation Mean Standard deviation P-value
Fb 5.6^ 1.9 8.8^ 2.3 11.0^ 3.7 10.7^ 2.2 < .001MF 16.9* 4.5 25.4*# 4.2 30.7* 4.4 33.5*# 7.6 < .001HSC 11.6+ 3.4 19.5+ 5.5 19.4+ 4.0 15.3 3.8 < .001
^F1 significantly different with the other three groups; P = .009, < .001, and < .001.*F1 significantly different with the other three stages; P = .008, < .001, and < .001. #F2 significantly different than #F4, P = .034.+F1 different than +F2 and +F3, P < .001 and < .001.
8 S. S. MANSY ET AL.
Dow
nloa
ded
by [
Sohe
ir M
ansy
] at
04:
55 2
1 Ju
ly 2
016

cellular spindle-shaped projections, or cleaved cel-lular parts, most probably carrying genetic informa-tion, may be one of the underlying contributingfactors to the progress of lobular fibrosis. Also, it
represents a way to maintain intercellular talk andtransport of soluble mediators.
HSCs are considered by this study as well as bymany other authors [11,24,30,39] as the majorsource of myofibroblasts. It was reported thatupon activation, HSCs modify their morphology,drift to the site of injury, and differentiate into
Figure 5. Figures illustrating the relations between myofibroblasts and the studied parameters. (A) The mean values of the positivecellular count of the three fibrogenic cells in relation to the stages of hepatic fibrosis. (B) Correlation between myofibroblasts andMIA of collagen. (C) Correlation between myofibroblasts and serum hyaluronic acid. (D) Correlation between myofibroblasts and HSC.(E) Correlation between myofibroblasts and fibroblasts. (F) Correlation between HSC and fibroblasts.
Table 4. Relation between moderate fibrosis (F1 + F2), severefibrosis (F3 + F4), and the quantitative assessment of the threefibrogenic cells.
Stage of hepatic fibrosis
F1 and F2 (n = 37) F3 and F4 (n = 27)
Mean Standard deviation Mean Standard deviation P-value
Fb 7.5 2.6 10.9* 3.1 < .001MF 21.9 6.0 31.8^ 6.0 < .001HSC 16.3 6.2 17.7 4.4 .288
P-values < 0.05 were considered significant. Fb significantly increased in*F3 and F4 versus F1 and F2. MF significantly increased in ^F3 and F4versus F1 and F2.
Table 5. Logistic regression of fibroblasts and myofibroblast onthe process of hepatic fibrosis.
B SE SignificanceExp(B)
95% CI forEXP (B)
Lower Upper
Fb 0.343 0.137 0.012 1.41 1.08 1.84MF 0.265 0.073 <0.001 1.30 1.13 1.50Constant −10.733 2.618 <0.001
B, regression coefficient; Exp B, OR or odds ratio (risk of the disease); CI,confidence intervals.
ULTRASTRUCTURAL PATHOLOGY 9
Dow
nloa
ded
by [
Sohe
ir M
ansy
] at
04:
55 2
1 Ju
ly 2
016

myofibroblasts [21,39,40]. The present work addto this knowledge that myofibroblasts detected inliver lobules are mainly of HSCs origin. At thelevel of EM, nearly all the encountered myofibro-blasts in hepatic lobules disclosed the specific mor-phological criteria of myofibroblast with thepresence of single residual fat droplet which char-acterizes the myofibroblasts transdifferentiatedfrom activated HSCs [23]. Moreover, the detectedresidual co-localization of reelin immunoreactiv-ity, which is a specific marker of HSCs [28,31,41]in myofibroblasts confined in the lobular areas,confirms this observation.
For the first time, this study depicted cells showingmorphological criteria of myofibroblasts, [32] distin-guished from SMCs and fibroblasts, circulating inhepatic portal circulation. This finding may drawattention to the possible reliability of the transdiffer-entiation of myofibroblasts from bone marrow stemcells postulated by Forbes and Parola [11] rather thanbone marrow–derived fibrocytes [13,39,42–44]. Inthis study, the recruited myofibroblasts were seen incases of stage F4. This stage of cirrhosis was associatedwith decrease in the quantitativemean values ofHSCs,which represent the main source of myofibroblasts.This decrease may be considered one of the triggeringfactors contributing to the recruitment of myofibro-blasts from bone marrow.
The present work opens the door for discussing thepossiblemodulation ofmyofibroblast to fibroblasts. Inother words, fibroblasts represent the fate of myofi-broblasts. This postulation is based on the noticedultrastructuralmorphologicalmodulation of themyo-fibroblast toward fibroblast configuration whentrapped in area of dense collagen deposition; thedetected relation between the increase in fibroblastsand the development of cirrhosis; the absence of myo-fibroblasts from normal liver [24,39]; the uncertaintyof the reported data concerning the transdifferentia-tion of bone marrow fibrocytes into myofibroblasts;and the difficulty to trace the lineage of the progeny offibrocytes in tissues [13]. All these previously reporteddata may support this hypothesis. In general, fibro-genic cells are not static but dynamic in nature and it isaccepted that what occurs with fibroblasts and myofi-broblasts in vitro or in cell culture does not closelymimic what happens in vivo [11].
In conclusion, the present work provided sub-stantial insight on the dynamic figures of three
important hepatic fibrogenic cells all through thestages of hepatic fibrosis. Also, this study proposesthe possible origin of myofibroblasts from bonemarrow progenitor cells and the hypothesis of itspossible fate into fibroblast. This last assumptiondeserves further study, especially that the func-tional similarities and differences between myofi-broblasts and fibroblasts isolated from living bodyare not completely identified [45].
In this context, it is recommended that parallelto the deployed effort in the production of treat-ment for the inactivation of HSCs [14,46–48]research targeting myofibroblast inactivation is arealistic hope for outcoming anti-fibrotic therapy.
Acknowledgments
The authors thank Prof. Dr. Inas Elattar, Professor of BiomedicalStatistics at the National Cancer Institute, Egypt, for the statisticalanalysis of the obtained data. Thanks are due to Mr. WalidMohamed for performing EM ultrathin sections. We acknowl-edge Mrs. Sahar Abbas for her assistance in the staining of liversections using multiple immunofluorescence technique and forprocessing EM samples.
Author contributions: Soheir S. Mansy conceived the idea,designed and managed the study, obtained funding, orga-nized logistics, and performed the study of liver sections atthe level of light, confocal laser scanning, and electron micro-scopes. She analyzed and interpreted findings. She wrote thearticle and the discussion of the results. Mona N. Nosseirperformed the morphometric image analysis. Mona A.Zoheiry carried out the assessment of serum hyaluronicacid. Moataz H. Hassanein and Mohammed F. Guda pro-vided the study with the liver biopsies and patient clinicaldata. May M. Othman and Hoda A. Yehia assisted in logisticsand data entry. All authors reviewed and approved the article.
Declaration of interest
The authors assert that there is no conflict of interest inregard to this article.
Funding
The authors acknowledge funding from the Science andTechnology Development Fund (project number 1703).
References
1. Hajarizadeh B, Grebely J, Dore GJ. Epidemiology andnatural history of HCV infection. Nat RevGastroenterol Hepatol 2013;10:553–562.
10 S. S. MANSY ET AL.
Dow
nloa
ded
by [
Sohe
ir M
ansy
] at
04:
55 2
1 Ju
ly 2
016

2. European Association for the study of the Liver(EASL). Clinical practice guidelines: Management ofhepatitis C virus infection. J Hepatol 2014;60:392–420.
3. Lee YA, Wallace MC, Friedman SL. Pathobiology ofliver fibrosis: A translational success story. Gut2015;64:830–841.
4. Jiang JX, Török NJ. Liver injury and the activation ofthe hepatic myofibroblasts. Curr Pathobiol Rep2013;1:215–223.
5. Schuppan D, Pinzani M. Anti-fibrotic therapy: Lost intranslation? J Hepatol 2012;56:566–574.
6. Chen L, Li J, Zhang J, et al. S100A4 promotes liverfibrosis via activation of hepatic stellate cells. J Hepatol2015;62:156–164.
7. Gressner AM, Weiskirchen R. Modern pathogenetic con-cepts of liver fibrosis suggest stellate cells and TCF-beta asmajor players and therapeutic targets. J Cell Mol Med2006;10:76–99.
8. Kisseleva T, Brenner DA. Fibrogenesis of parenchymalorgans. Proc Am Thorac Soc 2008;5:338–342.
9. Friedman SL. Hepatic stellate cells: Protean, multifunc-tional, and enigmatic cells of the liver. Physiol Rev2008;88:125–172
10. Kisseleva T, Brenner DA. Anti-fibrogenic strategiesand the regression of fibrosis. Best Pract Res ClinGastroenterol 2011;25:305–317.
11. Forbes SJ, Parola M. Liver fibrogenic cells. Best PractRes Clin Gastroenterol 2011;25:207–217.
12. Mederacke I, Hsu CC, Troeger JS, et al. Fate tracing revealshepatic stellate cells as dominant contributors to liverfibrosis independent of its etiology. Nat Commun2013;4:2823–2832.
13. Xu J, Min Cong M, Park TJ, et al. Contribution of bonemarrow-derived fibrocytes to liver fibrosis.Hepatobiliary Surg Nutr 2015;4:34–47.
14. Bárcena C, StefanovicM, Tutusaus A, et al. Gas6/Axl path-way is activated in chronic liver disease and its targetingreduces fibrosis via hepatic stellate cell inactivation. JHepatol 2015;63:670–678.
15. Lei XF, Fu W, Kaneyama J, et al. Huc-5 deficiencyattenuates the activation of hepatic stellate cells andliver fibrosis through upregulation of Smad7 in mice.J Hepatol 2016;64:110–117.
16. Miyata E, Masuya M, Yoshida S, et al. Hematopoieticorigin of hepatic stellate cells in the adult liver. Blood2008;111:2427–2435.
17. Goodpaster T, Legesse-Miller A, Hameed MR, et al. Animmunohistochemical method for identifying fibro-blasts in formalin-fixed, paraffin-embedded tissue. JHistochem Cytochem 2008;56:347–358.
18. Novo E, Bonzo L, Cannito S, et al. Hepatic myofibro-blasts: A heterogeneous population of multifunctionalcells in liver fibrogenesis. Int J Biochem Cell Biol2009;41:2089–2093.
19. Atzori L, Pli G, Perr A. Hepatic stellate cell: A starcell in the liver. Int J Biochem Cell Biol 2009;41:1639–1642.
20. Venugopal SK, Jiang J, Kim TH, et al. Liver fibrosiscauses downregulation of miRNA-150 and miRNA-194in hepatic stellate cells, and their overexpression causesdecreased stellate cell activation. Am J PhysiolGastrointest Liver Physiol 2010;298:G101–G106.
21. Yin C, Evason KJ, Asahina K, et al. Hepatic stellatecells in liver development, regeneration, and cancer. JClin Invest 2013;123:1902–1910.
22. Nepomnyashchikh GI, Aidagulova SV, NepomnyashchikhDL, et al. Ultrastructural and immunohistochemical studyof hepatic stellate cells over the course of infectious viralfibrosis and cirrhosis of the liver. Bull Exp Biol Med2006;142:723–728.
23. Mansy SS, ElKafif N, AbdelFatah A, et al. Hepaticstellate cell and fibrogenesis in cases of HCV infec-tion: An ultrastructural insight. Ultrastruct Pathol2010;34:62–67.
24. Iwaisako K, Taura K, Koyama Y, et al. Strategies todetect Hepatic myofibroblasts in liver cirrhosis of dif-ferent etiologies. Curr Pathobiol Rep 2014;2:209–215.
25. Halfon P, Bourlière M, Pénaranda G, et al. Accuracyof hyaluronic acid level for predicting liver fibrosisstages in patients with hepatitis C. Comp Hepatol2005;4:6–11.
26. Baranova A, Lal P, Birerdinc A, et al. Non-invasivemarkers for hepatic fibrosis. BMC Gastroenterol2011;11:91–106.
27. Singer KH, Scearce RM, Tuck DT, et al. Removal offibroblasts from human epithelial cell cultures with useof a complement fixing monoclonal antibody reactivewith human fibroblasts and monocytes/macrophages. JInvest Dermatol 1989;92:166–170.
28. Botella-López A, Madaria E, Jover R, et al. Reelin isover-expressed in the liver and plasma of bile ductligated rats and its levels and glycosylation are alteredin plasma of humans with cirrhosis. Int J Biochem CellBiol 2008;40:766–775.
29. Alt E, Yan Y, Gehmert S, et al. Fibroblasts sharemesenchymal phenotypes with stem cells, but lacktheir differentiation and colony-forming potential.Biol Cell 2011;103:197–208.
30. Liu X, Xu J, Brenner DA, et al. Reversibility of liverfibrosis and inactivation of fibrogenic myofibroblasts.Curr Pathobiol Rep 2013;1:209–214.
31. Mansy SS, Nosseir MM, Zoheiry MA, et al. Value ofreelin for assessing hepatic fibrogenesis in a group ofEgyptian HCV infected patients. Clin Chem Lab Med2014;52:1319–1328.
32. Schurch W, Seemayer TA, Hinz B, Gabbiani G.Myofibroblast. In: Mills SE, (ed.), Histology forpathologists. Philadelphia: Lippincott Williams &Wilkins, 2007, p. 125.
33. Bedossa P, Bioulac-Sage P, Callard P, et al. The FrenchMETAVIR Cooperative Study Group intraobserver andinterobserver variations in liver biopsy interpretationin patients with chronic hepatitis C. Hepatology1994;20:15–20.
ULTRASTRUCTURAL PATHOLOGY 11
Dow
nloa
ded
by [
Sohe
ir M
ansy
] at
04:
55 2
1 Ju
ly 2
016

34. Leroy V, Hilleret MN, Sturm N, et al. Prospectivecomparison of six non-invasive scores for the diagnosisof liver fibrosis in chronic hepatitis C. J Hepatol2007;46:775–782.
35. Becker L, Salameh W, Sferruzza A, et al. Validation ofHepascore, compared with simple indices of fibrosis, inpatients with chronic hepatitis C virus infection in UnitedStates. Clin Gastroenterol Hepatol 2009;7:696–701.
36. Ahmad W, Ijaz B, Javed FT, et al. Comparison of fourfibrosis indexes in chronic HCV: Development of newfibrosis-cirrhosis index (FCI). BMC Gastroenterol2011;11:44–54.
37. Johnson ID. Practical considerations in the selectionand application of fluorescent probes. In: Pawley JB,(ed.), Handbook of biological confocal microscopy, 3rdedn. New York: Plenum Press; 2006; p. 362.
38. Seki E, Brenner DA. Recent advancement of molecularmechanisms of liver fibrosis. J Hepatobiliary PancreatSci 2015;22:512–518.
39. Iwaisako K, Brenner DA, Kisseleva T. What’s new inliver fibrosis? The origin of myofibroblasts in liverfibrosis. J Gastroenterol Hepatol 2012;27:65–68.
40. Shirakami Y, Lee SA, Clugston RD, et al. Hepaticmetabolism of retinoids and disease association.Biochim Biophys Acta 2012;1821:124–136.
41. Samama B, Boehm N. Reelin immunoreactivity in lym-phatics and liver during development and adult life. AnatRec A Discov Mol Cell Evol Biol 2005;285:595–599.
42. Abe R, Donnelly SC, Peng T, et al. Peripheral bloodfibrocytes: Differentiation pathway and migration towound sites. J Immunol 2001;166:7556–7562.
43. Kisseleva T, Uchinami H, Feirt N, et al. Bone marrow-derived fibrocytes participate in pathogenesis of liverfibrosis. J Hepatol 2006;45:429–438.
44. Scholten D, Reichart D, Paik YH, et al. Migration of fibro-cytes in fibrogenic liver injury. Am J Pathol 2011;179:189–198.
45. Akamatsu T, Arai Y, Kosugi I, et al. Direct isolation ofmyofibroblasts and fibroblasts from bleomycin-injuredlungs reveals their functional similarities and differ-ences. Fibrogenesis Tissue Repair 2013;6:15–621.
46. Bataller R, BrennerDA.Hepatic stellate cells as a target forthe treatment of liver fibrosis. Semin Liver Dis2001;21:437–451.
47. Moles A, Tarrats N, Morales A, et al. Acidic sphingomye-linase controls hepatic stellate cell activation and in vivoliver fibrogenesis. Am J Pathol 2010;177:1214–1224.
48. Schuppan D, Kim YO. Evolving therapies for liverfibrosis. J Clin Invest 2013;123:1887–1901.
12 S. S. MANSY ET AL.
Dow
nloa
ded
by [
Sohe
ir M
ansy
] at
04:
55 2
1 Ju
ly 2
016