CellPhoneDB v2.0: Inferring cell-cell communication from ...CellPhoneDB v2.0: Inferring cell-cell...
31
CellPhoneDB v2.0: Inferring cell-cell communication from combined expression of multi-subunit receptor-ligand complexes Mirjana Efremova 1 , Miquel Vento-Tormo 2 , Sarah A. Teichmann 1,3 and Roser Vento-Tormo 1 1 Wellcome Sanger Institute, Wellcome Genome Campus, Cambridge CB10 1SD, UK 2 YDEVS software development, Valencia, 46009, Spain. 3 Theory of Condensed Matter Group, Cavendish Laboratory, University of Cambridge, JJ Thomson Ave, Cambridge CB3 0EH, UK Corresponding authors Correspondence to Roser Vento-Tormo [email protected] Abstract Cell-cell communication mediated by receptor-ligand complexes is crucial for coordinating diverse biological processes, such as development, differentiation and responses to infection. In order to understand how the context-dependent crosstalk of different cell types enables physiological processes to proceed, we developed CellPhoneDB, a novel repository of ligands, receptors and their interactions 1 . Our repository takes into account the subunit architecture of both ligands and receptors, representing heteromeric complexes accurately. We integrated our resource with a statistical framework that predicts enriched cellular interactions between two cell types from single-cell transcriptomics data. Here, we outline the structure and content of our repository, the procedures for inferring cell-cell communication networks from scRNA-seq data and present a practical step-by-step guide to help implement the protocol. CellPhoneDB v2.0 is a novel version of our resource that incorporates additional functionalities to allow users to introduce new interacting molecules and reduce the time and resources needed to interrogate large datasets. CellPhoneDB v2.0 is publicly available at https://github.com/Teichlab/cellphonedb and as a user-friendly web interface at http://www.cellphonedb.org/. In our protocol, we demonstrate how to reveal meaningful biological discoveries from CellPhoneDB v2.0 using published data sets. . CC-BY-NC-ND 4.0 International license not certified by peer review) is the author/funder. It is made available under a The copyright holder for this preprint (which was this version posted June 24, 2019. . https://doi.org/10.1101/680926 doi: bioRxiv preprint
Transcript of CellPhoneDB v2.0: Inferring cell-cell communication from ...CellPhoneDB v2.0: Inferring cell-cell...
CellPhoneDB v2.0: Inferring cell-cell communication from combined expression of multi-subunit receptor-ligand complexes Mirjana Efremova1, Miquel Vento-Tormo2, Sarah A. Teichmann1,3 and Roser Vento-Tormo1
1 Wellcome Sanger Institute, Wellcome Genome Campus, Cambridge CB10 1SD, UK 2 YDEVS software development, Valencia, 46009, Spain. 3 Theory of Condensed Matter Group, Cavendish Laboratory, University of Cambridge, JJ Thomson Ave, Cambridge CB3 0EH, UK Corresponding authors Correspondence to Roser Vento-Tormo [email protected] Abstract Cell-cell communication mediated by receptor-ligand complexes is crucial for coordinating diverse biological processes, such as development, differentiation and responses to infection. In order to understand how the context-dependent crosstalk of different cell types enables physiological processes to proceed, we developed CellPhoneDB, a novel repository of ligands, receptors and their interactions1. Our repository takes into account the subunit architecture of both ligands and receptors, representing heteromeric complexes accurately. We integrated our resource with a statistical framework that predicts enriched cellular interactions between two cell types from single-cell transcriptomics data. Here, we outline the structure and content of our repository, the procedures for inferring cell-cell communication networks from scRNA-seq data and present a practical step-by-step guide to help implement the protocol. CellPhoneDB v2.0 is a novel version of our resource that incorporates additional functionalities to allow users to introduce new interacting molecules and reduce the time and resources needed to interrogate large datasets. CellPhoneDB v2.0 is publicly available at https://github.com/Teichlab/cellphonedb and as a user-friendly web interface at http://www.cellphonedb.org/. In our protocol, we demonstrate how to reveal meaningful biological discoveries from CellPhoneDB v2.0 using published data sets.
.CC-BY-NC-ND 4.0 International licensenot certified by peer review) is the author/funder. It is made available under aThe copyright holder for this preprint (which wasthis version posted June 24, 2019. . https://doi.org/10.1101/680926doi: bioRxiv preprint

2
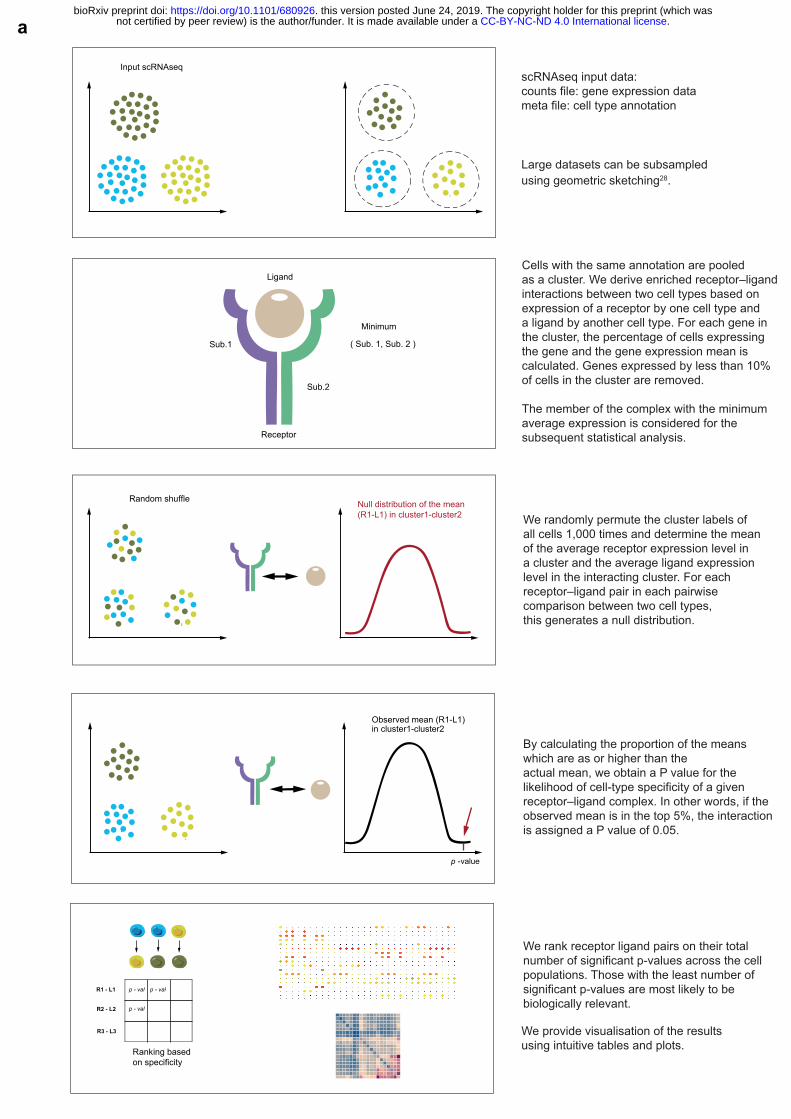
Introduction We developed CellPhoneDB, a public repository of ligands, receptors and their interactions to enable a comprehensive, systematic analysis of cell–cell communication molecules. Our repository relies on the use of public resources to annotate receptors and ligands as well as 5 manual curation of specific families of proteins involved in cell-cell communication. We include subunit architecture for both ligands and receptors to represent heteromeric complexes accurately (Figure 1). This is crucial, as cell-cell communication relies on multi-subunit protein complexes that go beyond the binary representation used in most databases and studies. In order to integrate all the information in a flexible, distributable and amendable environment, 10 we developed an SQLite relational database. CellPhoneDB v2.0 enables systematic updates of the stored information in database releases, as well as the continuous submission of novel interacting partners by users. Our repository forms the basis of a computational approach to identify biologically relevant 15 interacting ligand-receptor partners from single-cell transcriptomics (scRNAseq) data. We consider the expression levels of ligands and receptors within each cell type, and use empirical shuffling to calculate which ligand–receptor pairs display significant cell-type specificity (Figure 2). This predicts molecular interactions between cell populations via specific protein complexes and generates potential cell–cell communication networks. Specificity of the 20 ligand-receptor interaction is important, as some of the ligand-receptor pairs are ubiquitously expressed by the cells in a tissue, and therefore not informative regarding specific communication between particular cell states. The computational code is available in github https://github.com/Teichlab/cellphonedb. In addition, we developed a user-friendly web interface at www.CellPhoneDB.org, where users can search for ligand–receptor complexes, 25 interrogate their own scRNAseq data and download and visualise their results. Our new database implementation now offers improved visualization capability including dot plots and heatmaps. We originally applied this computational framework to study maternal-fetal communication at 30 the decidual-placental interface during early pregnancy1. Briefly, our analysis revealed new immunoregulatory mechanisms and cytokine signaling networks existing between the cells in the maternal-fetal interface, which guarantee the coexistence of both the mother and developing fetus (Figure 3). In the present protocol, we describe and discuss in detail how this analysis can be carried out, using our maternal-fetal study as an illustration. 35 The protocol is generalizable to any other dataset containing potentially interacting cell populations. For example, CellPhoneDB helped us identify a shift in the cellular communication from a network that was dominated by mesenchymal-epithelial interactions in healthy airways, to a Th2 cell--dominated interactome in asthmatic airways2. In another recent 40 example, our cell-cell communication framework revealed the complex interplay among diverse cells in the evolving tumor microenvironment of a murine melanoma model where multiple immunosuppressive mechanisms coexist within a heterogeneous stromal compartment3. We anticipate that the information stored in CellPhoneDB 2.0 will have the
.CC-BY-NC-ND 4.0 International licensenot certified by peer review) is the author/funder. It is made available under aThe copyright holder for this preprint (which wasthis version posted June 24, 2019. . https://doi.org/10.1101/680926doi: bioRxiv preprint
3
potential to resolve cellular communication when combined with the spatial location of the cells that can be quantified using highly multiplexed spatial methods 4–7. Single cell transcriptomics technologies have provided a unique opportunity to analyse the expression of multiple cell types and systematically decode intercellular communication 5 networks. There are now several other published methods to infer potentially relevant interactions between two cell populations from scRNAseq. The majority of these methods use lists of binary ligand-receptor pairs to assign communication between cells, without considering multimeric receptors. Relevant interactions are inferred by filtering based on the expression level of the ligand and receptor. In these methods, only the interaction pairs that 10 pass a certain threshold of cells expressing the specific interactors in the respective cell populations are selected for the downstream analysis 8–13. For example, in addition to filtering based on expression level, Cohen et al.14 used hierarchical clustering with Spearman correlation to identify ligand/receptor modules and construct an interaction graph. Others, such as Kumar et al15, scored interactions by calculating the product of average receptor and 15 average ligand expression in the corresponding cell types and used a one-sided Wilcoxon rank-sum test to assess the statistical significance of each interaction score. Halpern et al.16 computed a z-score of the mean of each interacting molecule in each cluster to calculate the enrichment of each ligand and receptor in each cluster. To test for enrichment of the number of receptor-ligand pairs between two cell populations, Joost et al.17 performed random 20 sampling of receptors and ligands and compared this number with the observed number of receptor-ligand pairs. In a similar way, Boisset et al.17,18 applied cluster label permutations to create a distribution of the number of chance interacting pairs between cell populations and then compared this to the actual number of interactions to identify enriched or depleted interactions compared with the numbers in the background model. 25 A major strength of CellPhoneDB beyond most other databases is that it takes into account the structural composition of ligands and receptors, which often involve the interaction of multiple subunits. This is particularly clear for protein families like many of the cytokine families, where receptors share structural subunits, and the affinity of the ligand is determined 30 by the specific combination of the subunits (Figure 3e). Roughly one third of the receptor-ligand complexes in our database have a multi-subunit stoichiometry greater than binary one-to-one interactions. Specifically, there are 466 interactions in our repository which involve heteromers, and 163 of them comprise cytokines. 35 CellPhoneDB v2.0 has new features, such as subsampling of the original dataset to enable the fast query of large datasets, and visualisation of the results using intuitive tables and plots. The statistical analysis package of CellPhoneDB is available as a user-friendly web interface (CellPhoneDB.org) and an easy-to-use python package available on github.
Database design and analysis method 40
Database input files CellPhoneDB stores ligand-receptor interactions as well as other properties of the interacting partners, including their subunit architecture and gene and protein identifiers. In order to create
.CC-BY-NC-ND 4.0 International licensenot certified by peer review) is the author/funder. It is made available under aThe copyright holder for this preprint (which wasthis version posted June 24, 2019. . https://doi.org/10.1101/680926doi: bioRxiv preprint

4
the content of the database, four main .csv data files are required: “genes_input.csv”, “proteins_input.csv”, “ complexes_input.csv” and “interactions_input.csv” (Figure 4).
1. “gene_input” 5 Mandatory fields: “gene_name”; “uniprot”; “hgnc_symbol” and “ensembl” This file is crucial for establishing the link between the scRNAseq data and the interaction pairs stored at the protein level. It includes the following gene and protein identifiers: i) gene 10 name (“gene_name”); ii) UniProt identifier (“uniprot”); iiii) HUGO nomenclature committee symbol (HGNC) (“hgnc_symbol”) and iv) gene ensembl identifier (ENSG) (“ensembl”). In order to create this file, lists of linked proteins and genes identifiers are downloaded from UniProt and merged using gene names. Several rules need to be considered when merging the files:
- UniProt annotation prevails over the gene Ensembl annotation when the same gene 15 Ensembl points towards different UniProt identifiers.
- UniProt and Ensembl lists are also merged by their UniProt identifier but this information is only used when the UniProt or Ensembl identifier are missing in the original merged list by gene name.
- If the same gene name points towards different HGNC symbols, only the HGNC 20 symbol matching the gene name annotation is considered.
- Only one HLA isoform is considered in our interaction analysis and it is stored in a manually HLA-curated list of genes, named “HLA_curated”.
25
2. “protein_input” Mandatory fields: “uniprot”; “protein_name” Optional fields: “transmembrane”; “peripheral”; “secreted”; “secreted_desc”; “secreted_highlight”; “receptor”; “receptor_desc” ; “integrin”; “other”; “other_desc”; “tags”; 30 “tags_ description”; “tags_reason” Two types of input are needed to create this file: i) systematic input using UniProt annotation, and ii) manual input using curated annotation both from developers of CellPhoneDB (“proteins_curated”) and users. For the systematic input, the UniProt identifier (“uniprot”) and 35 the name of the protein (“protein_name”) are downloaded from UniProt. For the curated input, developers and users can introduce additional fields relevant to the future systematic assignment of ligand-receptor interactions (see below the “Systematic input from other databases” section for interaction_list). Importantly, the curated information always has priority over the systematic information. 40 The optional input is organised using the fields described below:
a) Location of the protein in the cell 45 There are four non-exclusive options: transmembrane (“transmembrane”), peripheral (“peripheral”) and secreted (“secreted”, “secreted_desc” and “secreted_highlight”).
.CC-BY-NC-ND 4.0 International licensenot certified by peer review) is the author/funder. It is made available under aThe copyright holder for this preprint (which wasthis version posted June 24, 2019. . https://doi.org/10.1101/680926doi: bioRxiv preprint

5
Plasma membrane proteins are downloaded from UniProt using the keyword KW-1003 (cell membrane). Peripheral proteins from the plasma membrane are annotated using the UniProt keyword SL-9903, and the remaining proteins are annotated as transmembrane proteins. We complete our lists of plasma transmembrane proteins by doing an extensive manual curation using literature mining and UniProt description of proteins with transmembrane and 5 immunoglobulin-like domains. Secreted proteins are downloaded from UniProt using the keyword KW-0964 (secreted), and are further annotated as cytokines (KW-0202), hormones (KW-0372), growth factors (KW-0339) and immune-related using UniProt keywords and manual annotation. Cytokines, 10 hormones, growth factors and other immune-related proteins are indicated as “secreted_highlight” in the protein_input lists. “secreted_desc” indicates a quality for the secreted protein. All the manually annotated information is carefully tagged and can be identified. Please see 15 the “curation tags” section below.
b) Receptors and integrins Three fields are allocated to annotate receptors or integrins: “receptor”, “receptor_desc” and 20 “integrin”. Receptors are defined by the UniProt keyword KW-0675. The receptors list is extensively reviewed and new receptors are added based on UniProt description and bibliography revision. Receptors involved in immune-cell communication are carefully curated. For some 25 of the receptors, a short description is included in “receptor_desc”. Integrin is a manual curation field that indicates the protein is part of the integrin family. All the annotated information is carefully tagged and can be identified. For details, see “curation tags” section below. 30
c) Membrane and secreted proteins not considered for the cell-cell communication analysis (“others”) We created another column named “others” that consists of proteins that are excluded from 35 our analysis. We also added “others_desc” to add a brief description of the excluded protein. Those proteins include: (i) co-receptors; (ii) nerve-specific receptors such as those related to ear-binding, olfactory receptors, taste receptors and salivary receptors; (iii) small molecule receptors; (iv) immunoglobulin chains; (v) viral and retroviral proteins, pseudogenes, cancer antigens and photoreceptors. 40
d) Curation “tags” Three fields indicate whether the protein has been manually curated: “tags”, “tags_ description” and “tags_reason”. 45 The “tags” field is related to the manual curation of a protein and contains three fields: (i) ‘N/A’, which indicates that the protein matched with UniProt description in all fields; (ii) ‘To_add’,
.CC-BY-NC-ND 4.0 International licensenot certified by peer review) is the author/funder. It is made available under aThe copyright holder for this preprint (which wasthis version posted June 24, 2019. . https://doi.org/10.1101/680926doi: bioRxiv preprint
6
which indicates that secreted and/or plasma membrane protein annotation has been added; and (iii) ‘To_comment’, which indicates that the protein is either secreted (KW-0964) or membrane-associated (KW-1003), but that we manually added a specific property of the protein (that is, the protein is annotated as a receptor). 5 The “tags_reason” field is related to the protein properties and has five possible values: (i) ‘extracellular_add’, which indicates that the protein is manually annotated as plasma membrane; (ii) ‘peripheral_add’, which indicates that the protein is manually annotated as a peripheral protein instead of plasma membrane; (iii) ‘secreted_add’, which indicates that the protein is manually annotated as secreted; (iv) ‘secreted_high’, which indicates that the protein 10 is manually annotated as secreted highlight. For cytokines, hormones, growth factors and other immune-related proteins, the option (v) ‘receptor_add’ indicates that the protein is manually annotated as a receptor. Finally, the “tags_description” field is a brief description of the protein, function or property 15 related to the manually curated protein.
3. “complex_input” 20 Mandatory fields: “complex_name”; “uniprot1, 2,...” Optional fields: “transmembrane”; “peripheral”; “secreted”; “secreted_desc”; “secreted_highlight”; “receptor”; “receptor_desc” ; “integrin”; “other”; “other_desc”; “pdb_id”; “pdb_structure” ; “stoichiometry”; “comments_complex” 25 Heteromeric receptors and ligands - that is, proteins that are complexes of multiple gene products - are annotated by reviewing the literature and UniProt descriptions. Cytokine complexes, TGF family complexes and integrin complexes are carefully annotated. These lists contain the UniProt identifiers for each of the heteromeric ligands and receptors 30 (“uniprot1”, “uniprot2”,...) and a name given to the complex (“complex_name”). Common fields with “proteins_input” include: “transmembrane”, “peripheral”, “secreted”, “secreted_desc”, “secreted_highlight”, “receptor”, “receptor_desc”, “integrin”, “other”, “other_desc” (see description in the above “protein_input” section for clarification). In addition, we include other optional information that may be relevant for the stoichiometry of the heterodimers. If 35 heteromers are defined in the RCSB Protein Data Bank (http://www.rcsb.org/), structural information is included in our CellPhoneDB annotation in the “pdb_structure”, “pdb_id” and “stoichiometry”. An additional field “comments_complex” was created to add a brief description of the heteromer. 40
4. “interaction_input” Mandatory fields: “partner_a”; “partner_b”; “annotation_strategy”; “source” Optional fields: “protein_name_a”; “protein_name_b” 45 Interactions stored in CellPhoneDB are annotated using their UniProt identifier (binary interactions) or the name of the complex (interactions involving heteromers) (“partner_a” and
.CC-BY-NC-ND 4.0 International licensenot certified by peer review) is the author/funder. It is made available under aThe copyright holder for this preprint (which wasthis version posted June 24, 2019. . https://doi.org/10.1101/680926doi: bioRxiv preprint

7
“partner_b”). The name of the protein is also included, yet not mandatory (“protein_name_a” and “protein_name_b”). Protein names are not stored in the database. There are two main inputs of interactions: i) a systematic input querying other databases, and ii) a manual input using curated information from CellPhoneDB developers 5 (“interactions_curated”) and users. The method used to assign the interaction is indicated in the “annotation_strategy” column. Each interaction stored has a CellPhoneDB unique identifier (“id_cp_interaction”) generated automatically by the internal pipeline. 10
a) Systematic input from other databases We consider interacting partners as: (i) binary interactions annotated by IUPHAR (http://www.guidetopharmacology.org/) and (ii) cytokines, hormones and growth factors 15 interactions annotated by innateDB (https://www.innatedb.com/) and the iMEX consortium (https://www.imexconsortium.org/). Binary interactions from IUPHAR are directly downloaded from “http://www.guidetopharmacology.org/DATA/interactions.csv” and 20 “guidetopharmachology.org” is indicated in the “annotation_strategy” field. For the iMEX consortium all protein-protein interactions are downloaded using the PSICQUIC REST APIs19. The IMEx20, IntAct 21, InnateDB 22, UCL-BHF, MatrixDB 23, MINT 24, I2D 25, UniProt, MBInfo registries are used. Interacting partners are defined as follows:
- Interacting partner A has to be transmembrane, receptor and cannot be classified as 25 “others” (see the previous “protein_list” section for more information).
- Interacting partner B has to be “secreted_highlight”. This group of proteins includes cytokines, hormones, growth factors and other immune-related proteins (see the previous “protein_list” section for more information).
30 In both cases, some interactions are excluded: i) interactions where one of the components is part of a complex (see “complex_curated” list in the above section); ii) interactions which are not involved in cell-cell communication or are wrongly annotated by our systematic method. These are stored in a curated list of proteins named “excluded_interaction”. The “excluded_interaction” file contains five fields: a) uniprot_1: name of the interacting partner A 35 that is going to be excluded; b) uniprot_2: name of the interacting partner B that is going to be excluded; c) name.1: name of the protein to be excluded corresponding to uniprot_1; d) name.2: name of the protein to be excluded corresponding to uniprot_2; e) comments: information about the exclusion of the protein. 40 Homomeric complexes - proteins interacting with themselves - are excluded from the systematic analysis. Importantly, in cases where both the systematic and the curated input detect the interactions, the curated input always prevails over the systematic information.
b) Curated approach 45
The majority of ligand–receptor interactions are manually curated by reviewing UniProt descriptions and PubMed information on membrane receptors. Cytokine and chemokine
.CC-BY-NC-ND 4.0 International licensenot certified by peer review) is the author/funder. It is made available under aThe copyright holder for this preprint (which wasthis version posted June 24, 2019. . https://doi.org/10.1101/680926doi: bioRxiv preprint

8
interactions were annotated following the International Union of Pharmacology annotation 26. The interactions of other groups of cell-surface proteins were manually reviewed, including the TGF family, integrins, lymphocyte receptors, semaphorins, ephrins, Notch and TNF receptors. The bibliography used to annotate the interaction is stored in “source”. ‘Uniprot’ indicates that the interaction has been annotated using UniProt descriptions. 5 User-defined receptor-ligand datasets Our system allows users to create their own lists of curated proteins and complexes. In order to do so, the format of the users’ lists must be compatible with the input files. Users can submit 10 their lists using the Python package version of CellPhoneDB, and then send them via email, the cellphonedb.org form, or a pull request to the CellPhoneDB data repository (https://github.com/Teichlab/cellphonedb-data).
Database structure 15
Information is stored in an SQLite relational database (https://www.sqlite.org/). SQLAlchemy (www.sqlalchemy.org) and Python 3 were used to build the database structure and the query logic. The application is designed to allow analysis on potentially large count matrices to be performed in parallel. This requires an efficient database design, including optimisation for 20 query times, indices and related strategies. All application code is open source and uploaded both to github and the web server. An explanation of the content of the tables and the database schema is available in Supplementary methods and Supplementary Figure 1 and 2.
Statistical inference of receptor-ligand specificity 25
To assess cellular crosstalk between different cell types, we use our repository in a statistical framework for inferring cell–cell communication networks from single-cell transcriptome data. We predict enriched receptor–ligand interactions between two cell types based on expression of a receptor by one cell type and a ligand by another cell type, using scRNA-seq data. To 30 identify the most relevant interactions between cell types, we look for the cell-type specific interactions between ligands and receptors. Only receptors and ligands expressed in more than a user-specified threshold percentage of the cells in the specific cluster are considered significant (default is 10%). 35 We then perform pairwise comparisons between all cell types. First, we randomly permute the cluster labels of all cells (1,000 times as a default) and determine the mean of the average receptor expression level in a cluster and the average ligand expression level in the interacting cluster. For each receptor–ligand pair in each pairwise comparison between two cell types, this generates a null distribution. By calculating the proportion of the means which are as or 40 higher than the actual mean, we obtain a p-value for the likelihood of cell-type specificity of a given receptor–ligand complex. We then prioritize interactions that are highly enriched between cell types based on the number of significant pairs, so that the user can manually select biologically relevant ones. For the multi-subunit heteromeric complexes, we require that
.CC-BY-NC-ND 4.0 International licensenot certified by peer review) is the author/funder. It is made available under aThe copyright holder for this preprint (which wasthis version posted June 24, 2019. . https://doi.org/10.1101/680926doi: bioRxiv preprint

9
all subunits of the complex are expressed (using a user-specified threshold), and therefore we use the member of the complex with the minimum average expression to perform the random shuffling.
Cell subsampling for accelerating analyses 5 Technological developments and protocol improvements have enabled an exponential growth of the number of cells obtained from scRNA-seq experiments27. Large-scale datasets can profile hundreds of thousands cells, which presents a challenge for the existing analysis methods in terms of both memory usage and runtime. In order to improve the speed and efficiency of our protocol and facilitate its broad accessibility, we integrated subsampling as 10 described in Hie et al.28. This “geometric sketching” approach aims to maintain the transcriptomic heterogeneity within a dataset with a smaller subset of cells. The subsampling step is optional, enabling users to perform the analysis either on all cells, or with other subsampling methods of their choice. 15
Procedure Input data files and software required:
- META file: Cell type annotation. Contains two columns: “Cell” indicating the name of the cell, and “cell_type” indicating the name of the cluster considered. Format 20 accepted: .csv, .txt, .tsv, .tab, pickle.
- COUNTS file: scRNA-seq count data containing gene expression values where rows are genes presented with gene names identifiers (Ensembl IDs, gene names or hgnc_symbol annotation) and columns are cells. We recommend using normalised count data. Importantly, when using the subsampling option, the user needs to specify 25 whether the data was log-transformed. Format accepted: .csv or .txt, .tsv, .tab, pickle.
Example input data can be downloaded from our webserver at https://www.cellphonedb.org/explore-sc-rna-seq or by running: curl 30 https://raw.githubusercontent.com/Teichlab/cellphonedb/master/in/example_data/test_counts.txt --output test_counts.txt curl https://raw.githubusercontent.com/Teichlab/cellphonedb/master/in/example_data/test_meta.t35 xt --output test_meta.txt Software: Python 3.5 or higher, SQLAlchemy, SQLite. 40 Pre-processing of raw data and input files for the protocol
.CC-BY-NC-ND 4.0 International licensenot certified by peer review) is the author/funder. It is made available under aThe copyright holder for this preprint (which wasthis version posted June 24, 2019. . https://doi.org/10.1101/680926doi: bioRxiv preprint
10
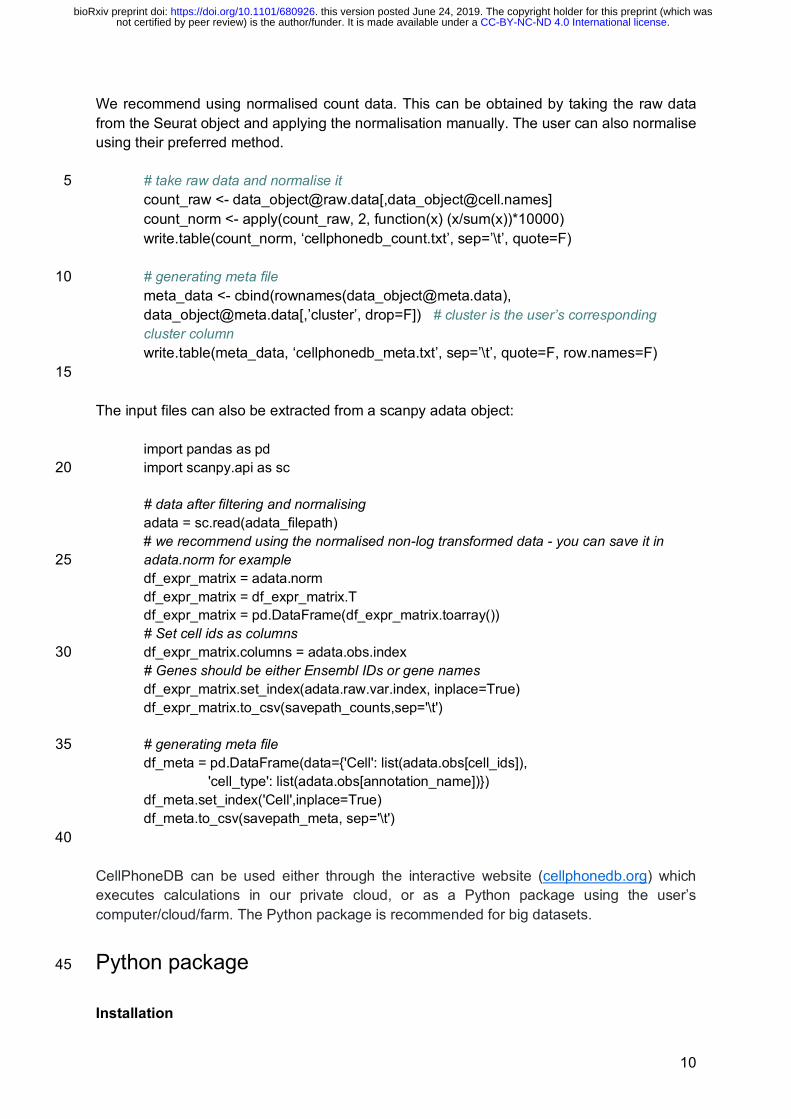
We recommend using normalised count data. This can be obtained by taking the raw data from the Seurat object and applying the normalisation manually. The user can also normalise using their preferred method.
# take raw data and normalise it 5 count_raw <- [email protected][,[email protected]] count_norm <- apply(count_raw, 2, function(x) (x/sum(x))*10000) write.table(count_norm, ‘cellphonedb_count.txt’, sep=’\t’, quote=F) # generating meta file 10 meta_data <- cbind(rownames([email protected]), [email protected][,’cluster’, drop=F]) # cluster is the user’s corresponding cluster column write.table(meta_data, ‘cellphonedb_meta.txt’, sep=’\t’, quote=F, row.names=F) 15
The input files can also be extracted from a scanpy adata object:
import pandas as pd import scanpy.api as sc 20 # data after filtering and normalising adata = sc.read(adata_filepath)
# we recommend using the normalised non-log transformed data - you can save it in adata.norm for example 25
df_expr_matrix = adata.norm df_expr_matrix = df_expr_matrix.T df_expr_matrix = pd.DataFrame(df_expr_matrix.toarray())
# Set cell ids as columns df_expr_matrix.columns = adata.obs.index 30
# Genes should be either Ensembl IDs or gene names df_expr_matrix.set_index(adata.raw.var.index, inplace=True)
df_expr_matrix.to_csv(savepath_counts,sep='\t')
# generating meta file 35 df_meta = pd.DataFrame(data={'Cell': list(adata.obs[cell_ids]), 'cell_type': list(adata.obs[annotation_name])}) df_meta.set_index('Cell',inplace=True) df_meta.to_csv(savepath_meta, sep='\t') 40 CellPhoneDB can be used either through the interactive website (cellphonedb.org) which executes calculations in our private cloud, or as a Python package using the user’s computer/cloud/farm. The Python package is recommended for big datasets.
Python package 45
Installation
.CC-BY-NC-ND 4.0 International licensenot certified by peer review) is the author/funder. It is made available under aThe copyright holder for this preprint (which wasthis version posted June 24, 2019. . https://doi.org/10.1101/680926doi: bioRxiv preprint

11
Note: If the default Python interpreter is for v2.x (can be checked with the command: python --version), calls to python/pip must be substituted by python3/pip3.
We highly recommend using a virtual environment (steps 1 and 2), but can be omitted. 5
1. Create python > 3.5 virtual-env
python -m venv cpdb-venv
2. Activate virtual-env
source cpdb-venv/bin/activate
3. Install cellphonedb 10
pip install cellphonedb
Running with statistical analysis
4. Activate virtual-env if you have not activated previously
source cpdb-venv/bin/activate 15
5. Run in statistical analysis mode using the input files for metadata and counts cellphonedb method statistical_analysis test_meta.txt test_counts.txt
Optional parameters: 20 --project-name: Name of the project. It creates a subfolder in output folder --iterations: Number of pvalues analysis iterations [1000] --threshold: % of cells expressing a gene --result-precision: Number of decimal digits in results [3] 25 --output-path: Directory where the results will be allocated (the directory must exist) [out] --means-result-name: Name of the means result file [means.txt] --significant-mean-result-name: Name of the significant means result file [significant_means.txt] --deconvoluted-result-name: Name of the deconvoluted result file [deconvoluted.txt] 30 --verbose/--quiet: Print or hide cellphonedb logs [verbose] --pvalues-result-name: Name of the pvalues result file [pvalues.txt] --debug-seed: Debug random seed -1 for disable it. >=0 [-1] --threads: Number of threads to use. >=1 [-1] 35
Usage Examples:
.CC-BY-NC-ND 4.0 International licensenot certified by peer review) is the author/funder. It is made available under aThe copyright holder for this preprint (which wasthis version posted June 24, 2019. . https://doi.org/10.1101/680926doi: bioRxiv preprint
12
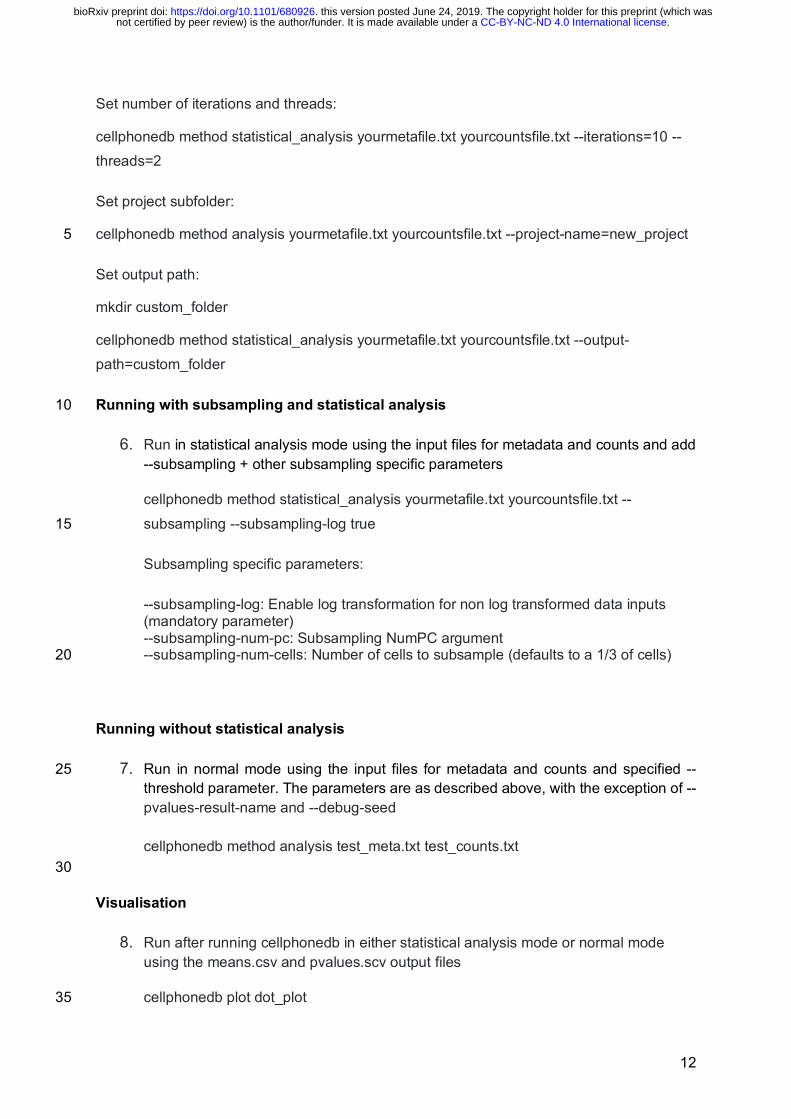
Set number of iterations and threads:
cellphonedb method statistical_analysis yourmetafile.txt yourcountsfile.txt --iterations=10 --threads=2
Set project subfolder:
cellphonedb method analysis yourmetafile.txt yourcountsfile.txt --project-name=new_project 5
Set output path:
mkdir custom_folder
cellphonedb method statistical_analysis yourmetafile.txt yourcountsfile.txt --output-path=custom_folder
Running with subsampling and statistical analysis 10
6. Run in statistical analysis mode using the input files for metadata and counts and add --subsampling + other subsampling specific parameters
cellphonedb method statistical_analysis yourmetafile.txt yourcountsfile.txt --subsampling --subsampling-log true 15
Subsampling specific parameters:
--subsampling-log: Enable log transformation for non log transformed data inputs (mandatory parameter) --subsampling-num-pc: Subsampling NumPC argument --subsampling-num-cells: Number of cells to subsample (defaults to a 1/3 of cells) 20
Running without statistical analysis
7. Run in normal mode using the input files for metadata and counts and specified --25 threshold parameter. The parameters are as described above, with the exception of --pvalues-result-name and --debug-seed cellphonedb method analysis test_meta.txt test_counts.txt
30
Visualisation
8. Run after running cellphonedb in either statistical analysis mode or normal mode using the means.csv and pvalues.scv output files
cellphonedb plot dot_plot 35
.CC-BY-NC-ND 4.0 International licensenot certified by peer review) is the author/funder. It is made available under aThe copyright holder for this preprint (which wasthis version posted June 24, 2019. . https://doi.org/10.1101/680926doi: bioRxiv preprint

13
Dot plot specific parameters:
--means-path: Analysis output means [./out/means.txt] --pvalues-path: Analysis output pvalues [./out/pvalues.txt] --output-path: Output folder [./out] 5 --output-name: Name of the output plot [plot.pdf]; available output formats are those supported by R's ggplot2 package, among others are: pdf, png, jpeg --rows: File with a list of rows to plot, one per line [all available] --columns: File with a list of columns to plot, one per line [all available] --verbose / --quiet: Print or hide cellphonedb logs [verbose] 10 To plot only desired rows/columns :
cellphonedb plot dot_plot --rows in/rows.txt --columns in/columns.txt
9. Run after running cellphonedb in either statistical analysis mode or normal mode using the the pvalues.scv output file. 15
cellphonedb plot heatmap_plot meta_data
Heatmap plot specific parameters:
--pvalues-path: Analysis output pvalues [./out/pvalues.txt] --output-path: Output folder [./out] 20 --count-name: Name of the output plot [heatmap_count.pdf] --log-name: Name of the output log plot [heatmap_log_count.pdf] --verbose / --quiet: Print or hide cellphonedb logs [verbose]
10. The user can run the analysis using a user-specified version of the database 25
cellphonedb method statistical_analysis in/example_data/test_meta.txt in/example_data/test_counts.txt --database=v0.0.2
11. Detailed description of the mandatory and optional parameters can be found using the help option:
cellphonedb method statistical_analysis yourmetafile.txt yourcountsfile.txt --help 30
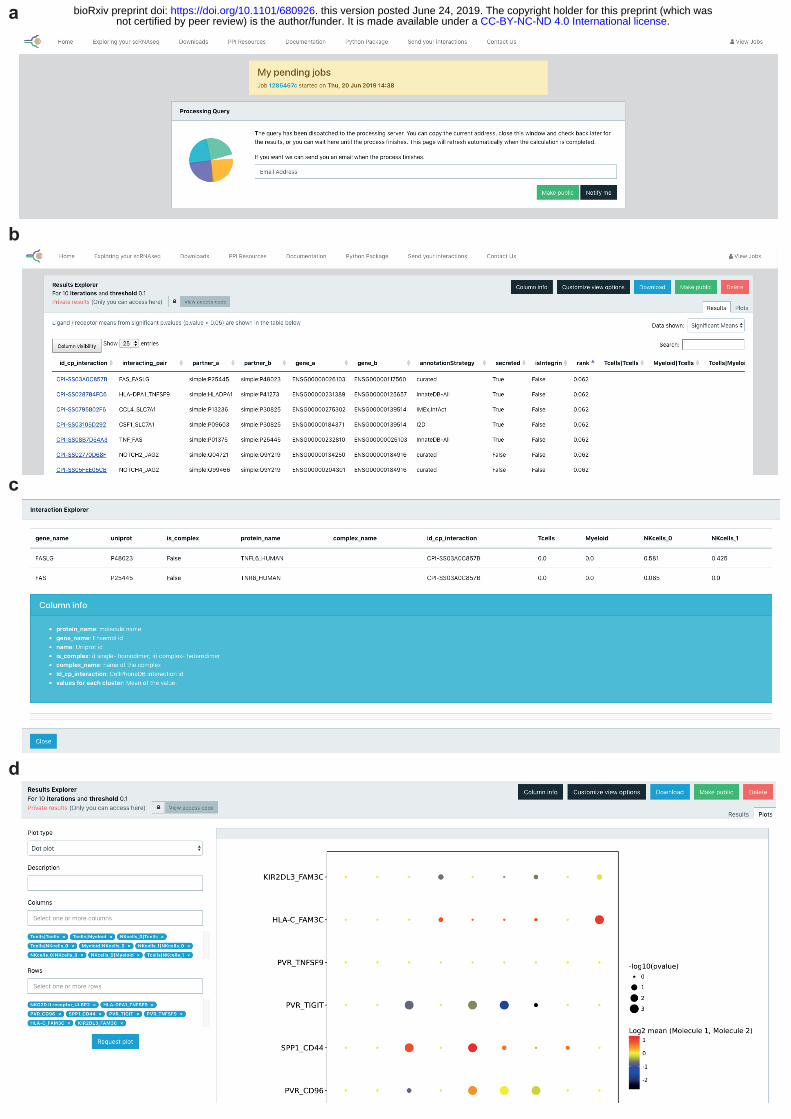
Interactive web portal The web interface includes form inputs for the user to decide on analysis parameters before submission. Downstream calculations are performed on the application’s servers, rendering the information of ligand and receptor expression, and visualisation diagrams once analysis is 35 complete (Figure 5).
.CC-BY-NC-ND 4.0 International licensenot certified by peer review) is the author/funder. It is made available under aThe copyright holder for this preprint (which wasthis version posted June 24, 2019. . https://doi.org/10.1101/680926doi: bioRxiv preprint

14
12. Go to the tab “Exploring your scRNAseq” and input the meta and count input files.
13. Provide an email address if you would like to get an update when the process finishes
(Figure 5a). 5
14. The significant means results table will appear as in Figure 5c. You can change the current view by clicking on the :Data Shown” button (Figure 5b) and can download the results as well. By clicking on any field from the id_cp_interaction column, detailed information for the specific interaction pair will appear (Figure 5c). 10
15. Go to the tab “Plots” and pick the type of plot you would like to produce. For plotting dot plots, please select the columns and rows you need (Figure 5d).
The online results viewer allows you to select which columns you wish to display in each table. 15 This option is quite useful as an aid to visualize the results.
Anticipated results: formats of files We originally applied CellPhoneDB to study the maternal-fetal communication at the decidual-placental interface during early pregnancy1. The results obtained with our new CellPhoneDB 20 v2.0 using subsampling were consistent with our original conclusions (Figure 3). Here we provide an explanation of the results generated in this example. Without running statistical inference of receptor-ligand interactions, only “means.csv” and “desconvoluted.csv” are generated. The “means.csv” file contains mean values for each 25 ligand-receptor interaction. The “deconvoluted.csv” file gives additional information for each of the interacting partners. This is important as some of the interacting partners are heteromers. In other words, multiple molecules have to be expressed in the same cluster in order for the interacting partner to be functional. If the user uses the statistical inference approach, additional “pvalues.csv” and “significant_means.csv” file are generated with the 30 values for the significant interactions. It is important to bear in mind that the interactions are not symmetric. In other words, when testing a ligand/receptor pair A_B between clusters X_Y, the expression of partner A is considered within the first cluster (X), and the expression of partner B within the second cluster 35 (Y). Therefore, X_Y and Y_X represent different comparisons and will have different p-values and means.
Code availability CellPhoneDB code is available at https://github.com/Teichlab/cellphonedb. It can also be 40 downloaded from https://cellphonedb.org/downloads.
.CC-BY-NC-ND 4.0 International licensenot certified by peer review) is the author/funder. It is made available under aThe copyright holder for this preprint (which wasthis version posted June 24, 2019. . https://doi.org/10.1101/680926doi: bioRxiv preprint
15
Data availability The decidua and placenta datasets were deposited in ArrayExpress, with experiment code E-MTAB-6701. 5
Acknowledgments
We thank Kerstin Meyer and Mike Stubbington for scientific discussions, Pablo Porras for advice on querying the IMEx database, Luz Garcia-Alonso and Krzysztof Polanski for carefully reading the manuscript, Gavin J Wright, Laura Wood and Gerard Graham for advice on 10 protein-protein interactions and Jana Eliasova and Ania Hupalowska for help with the illustrations. We are grateful to Adria Lopez and YDEVS members for their help with the webserver and the implementation of the code in github, and all the Teichmann lab and Vento-Tormo lab members for their fruitful advice. The project was supported by Wellcome Sanger core funding (no. WT206194). 15
Author contribution M.E, S.A.T and R.V-T conceived and developed the protocol and wrote the manuscript. M.V-T developed the protocol, implemented the code in the web server and github and contributed to writing the manuscript.
Competing interests 20
The authors declare no competing interests.
Figures Figure 1. Overview of the database. a, Information aggregated within www.CellPhoneDB.org. CellPhoneDB stores a total of 978 proteins, 501 are secreted proteins and 585 are membrane 25 proteins. These proteins are involved in 1396 interactions, out of those 466 are heteromers. There are 474 interactions that involve secreted proteins and 490 interactions that involve only membrane proteins. There are a total of 250 interactions that involve integrins. Figure 2. Overview of the statistical method. a, Statistical framework used to infer ligand–receptor complex specific to two cell types from single-cell transcriptomics data. Predicted P 30 values for a ligand–receptor complex across two cell clusters are calculated using permutations, in which cells are randomly re-assigned to cluster. Figure 3. Diagram generation lists. a, Basic steps in the generation of lists to populate the tables in CellPhoneDB. Figure 4. Example dataset run with CellPhoneDB and CellPhoneDB v2.0. a, Overview of 35 selected ligand–receptor interactions using CellPhoneDB on the decidua dataset from 1; P
.CC-BY-NC-ND 4.0 International licensenot certified by peer review) is the author/funder. It is made available under aThe copyright holder for this preprint (which wasthis version posted June 24, 2019. . https://doi.org/10.1101/680926doi: bioRxiv preprint

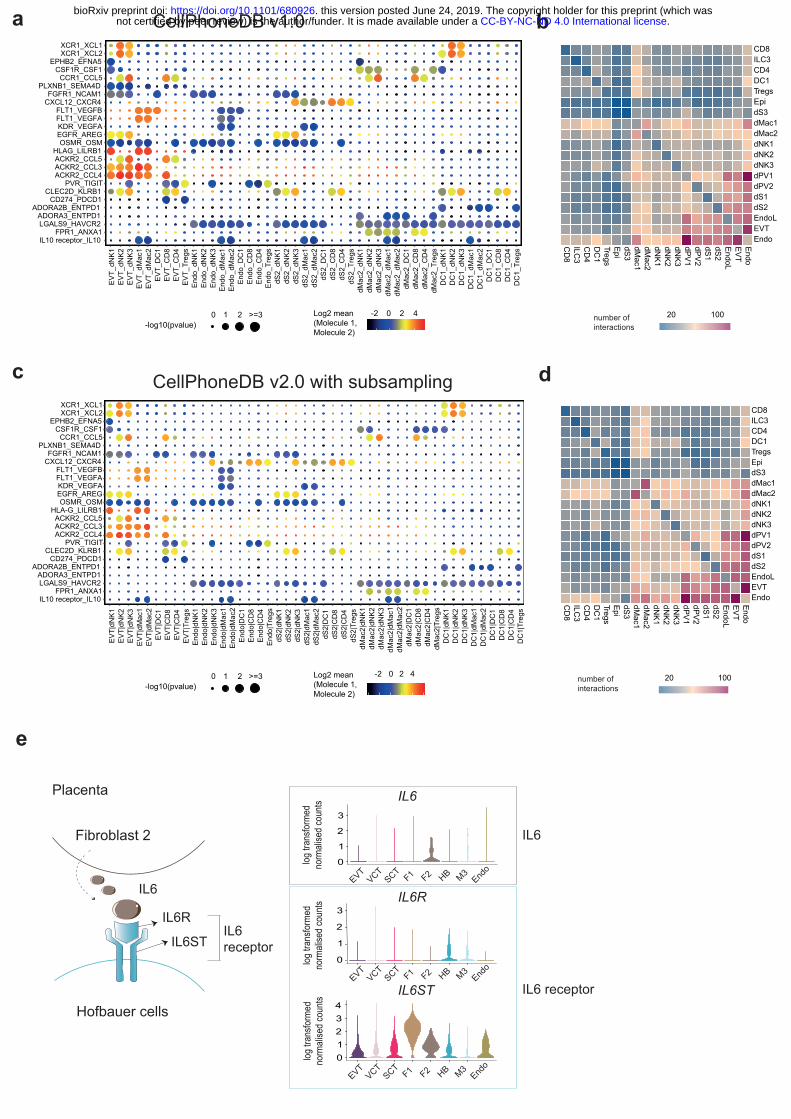
16
values indicated by circle size, scale on right. The means of the average expression level of interacting molecule 1 in cluster 1 and interacting molecule 2 in cluster 2 are indicated by colour. b, Heatmap showing the total number of interactions between cell types in the decidua dataset obtained with CellPhoneDB. c, Overview of selected ligand–receptor interactions using the CellPhoneDB v2.0 with subsampling on the decidua dataset. P values indicated by 5 circle size, scale on right. The means of the average expression level of interacting molecule 1 in cluster 1 and interacting molecule 2 in cluster 2 are indicated by colour. ⅓ of the dataset was subsampled. d, Heatmap showing the total number of interactions between cell types in the decidua dataset obtained with CellPhoneDB v2.0 with subsampling. ⅓ of the dataset was subsampled. e. An example of significant interactions involving complexes identified by 10 CellPhoneDB in the placenta dataset 1. Violin plots show log-transformed, normalized expression levels of the components of the IL6–IL6R complex in placental cells. IL6 expression is enriched in the fibroblast 2 cluster and the two subunits of the IL6 receptors (IL6R and IL6ST) are co-expressed in Hofbauer cells. Figure 5. Screenshot of web portal. a, Screenshot showing how to input the email in order to 15 get notification when the job is done. b, Screenshot showing the significant_means results table. The user can click on a selected id_cp_interaction field to get a more detailed information for the specific interaction pair. c, Screenshot showing detailed information for the specific interaction pair that appears when the user clicks on a specific id_cp_interaction field. d, Screenshot showing the dot plot visualisation page. 20
Tables Table 1. Troubleshooting table. Table 2. Description of the output files means.csv, pvalues.csv and significant_means.csv. 25 Table 3. Description of the output file deconvoluted.csv.
References 30
1. Vento-Tormo, R. et al. Single-cell reconstruction of the early maternal-fetal interface in
humans. Nature 563, 347–353 (2018).
2. Braga, F. A. V. et al. A cellular census of human lungs identifies novel cell states in
health and in asthma. Nature Medicine (2019). doi:10.1038/s41591-019-0468-5
3. Davidson, S. et al. Single-cell RNA sequencing reveals a dynamic stromal niche within 35
the evolving tumour microenvironment. doi:10.1101/467225
4. Lubeck, E., Coskun, A. F., Zhiyentayev, T., Ahmad, M. & Cai, L. Single-cell in situ RNA
.CC-BY-NC-ND 4.0 International licensenot certified by peer review) is the author/funder. It is made available under aThe copyright holder for this preprint (which wasthis version posted June 24, 2019. . https://doi.org/10.1101/680926doi: bioRxiv preprint
17
profiling by sequential hybridization. Nat. Methods 11, 360–361 (2014).
5. Ståhl, P. L. et al. Visualization and analysis of gene expression in tissue sections by
spatial transcriptomics. Science 353, 78–82 (2016).
6. Rodriques, S. G. et al. Slide-seq: A scalable technology for measuring genome-wide
expression at high spatial resolution. Science 363, 1463–1467 (2019). 5
7. Svensson, V. A method for transcriptome-wide gene expression quantification in intact
tissues. Immunol. Cell Biol. 97, 439–441 (2019).
8. Skelly, D. A. et al. Single-Cell Transcriptional Profiling Reveals Cellular Diversity and
Intercommunication in the Mouse Heart. Cell Rep. 22, 600–610 (2018).
9. Camp, J. G. et al. Multilineage communication regulates human liver bud development 10
from pluripotency. Nature 546, 533–538 (2017).
10. Pavličev, M. et al. Single-cell transcriptomics of the human placenta: inferring the cell
communication network of the maternal-fetal interface. Genome Res. 27, 349–361
(2017).
11. Puram, S. V. et al. Single-Cell Transcriptomic Analysis of Primary and Metastatic Tumor 15
Ecosystems in Head and Neck Cancer. Cell 171, 1611–1624.e24 (2017).
12. Suryawanshi, H. et al. A single-cell survey of the human first-trimester placenta and
decidua. Sci Adv 4, eaau4788 (2018).
13. Zhou, J. X., Taramelli, R., Pedrini, E., Knijnenburg, T. & Huang, S. Author Correction:
Extracting Intercellular Signaling Network of Cancer Tissues using Ligand-Receptor 20
Expression Patterns from Whole-tumor and Single-cell Transcriptomes. Sci. Rep. 8,
17903 (2018).
14. Cohen, M. et al. Lung Single-Cell Signaling Interaction Map Reveals Basophil Role in
Macrophage Imprinting. Cell 175, 1031–1044.e18 (2018).
15. Kumar, M. P. et al. Analysis of Single-Cell RNA-Seq Identifies Cell-Cell Communication 25
Associated with Tumor Characteristics. Cell Rep. 25, 1458–1468.e4 (2018).
16. Halpern, K. B. et al. Paired-cell sequencing enables spatial gene expression mapping of
liver endothelial cells. Nat. Biotechnol. 36, 962–970 (2018).
.CC-BY-NC-ND 4.0 International licensenot certified by peer review) is the author/funder. It is made available under aThe copyright holder for this preprint (which wasthis version posted June 24, 2019. . https://doi.org/10.1101/680926doi: bioRxiv preprint

18
17. Joost, S. et al. Single-Cell Transcriptomics of Traced Epidermal and Hair Follicle Stem
Cells Reveals Rapid Adaptations during Wound Healing. Cell Rep. 25, 585–597.e7
(2018).
18. Boisset, J.-C. et al. Mapping the physical network of cellular interactions. Nat. Methods
15, 547–553 (2018). 5
19. Proteomics Standards Initiative Common Query Interface. Encyclopedia of Systems
Biology 1798–1798 (2013). doi:10.1007/978-1-4419-9863-7_101243
20. Orchard, S. et al. Protein interaction data curation: the International Molecular Exchange
(IMEx) consortium. Nat. Methods 9, 345–350 (2012).
21. Orchard, S. et al. The MIntAct project--IntAct as a common curation platform for 11 10
molecular interaction databases. Nucleic Acids Res. 42, D358–63 (2014).
22. Breuer, K. et al. InnateDB: systems biology of innate immunity and beyond--recent
updates and continuing curation. Nucleic Acids Res. 41, D1228–33 (2013).
23. Clerc, O. et al. MatrixDB: integration of new data with a focus on glycosaminoglycan
interactions. Nucleic Acids Res. 47, D376–D381 (2019). 15
24. Licata, L. et al. MINT, the molecular interaction database: 2012 update. Nucleic Acids
Res. 40, D857–61 (2012).
25. Brown, K. R. & Jurisica, I. Unequal evolutionary conservation of human protein
interactions in interologous networks. Genome Biol. 8, R95 (2007).
26. Bachelerie, F. et al. International Union of Basic and Clinical Pharmacology. [corrected]. 20
LXXXIX. Update on the extended family of chemokine receptors and introducing a new
nomenclature for atypical chemokine receptors. Pharmacol. Rev. 66, 1–79 (2014).
27. Svensson, V., Vento-Tormo, R. & Teichmann, S. A. Exponential scaling of single-cell
RNA-seq in the past decade. Nat. Protoc. 13, 599–604 (2018).
28. Hie, B., Cho, H., DeMeo, B., Bryson, B. & Berger, B. Geometric Sketching Compactly 25
Summarizes the Single-Cell Transcriptomic Landscape: Supplementary Information.
doi:10.1101/536730
.CC-BY-NC-ND 4.0 International licensenot certified by peer review) is the author/funder. It is made available under aThe copyright holder for this preprint (which wasthis version posted June 24, 2019. . https://doi.org/10.1101/680926doi: bioRxiv preprint

19
Table 1. Troubleshooting table
Step Problem Possible reason Solution
5, 6, 7 [ERROR] Invalid Counts data
The order of the input count and meta data might be switched or the genes are neither Ensembl IDs nor gene names
Please use the meta data as first and the count data as second input parameter and provide a count table with genes presented as either Ensembl IDs or gene names
5, 6, 7 [ERROR] Invalid Counts data: Some cells in meta do not exist in counts columns. Maybe incorrect file format.
The cell ids in the columns of the count data do not match the cell ids in the cell_type column of the meta data
Please make sure that you have the same cell ids in the columns of the count data and the cell_type column of the meta data
6 [ERROR] In order to perform subsampling you need to specify whether to log1p input counts or not: to do this specify in your command as --subsampling-log [true|false]
--subsampling-log needs to be specified (True or False)
Please provide BOOLEAN value to the --subsampling-log input parameter
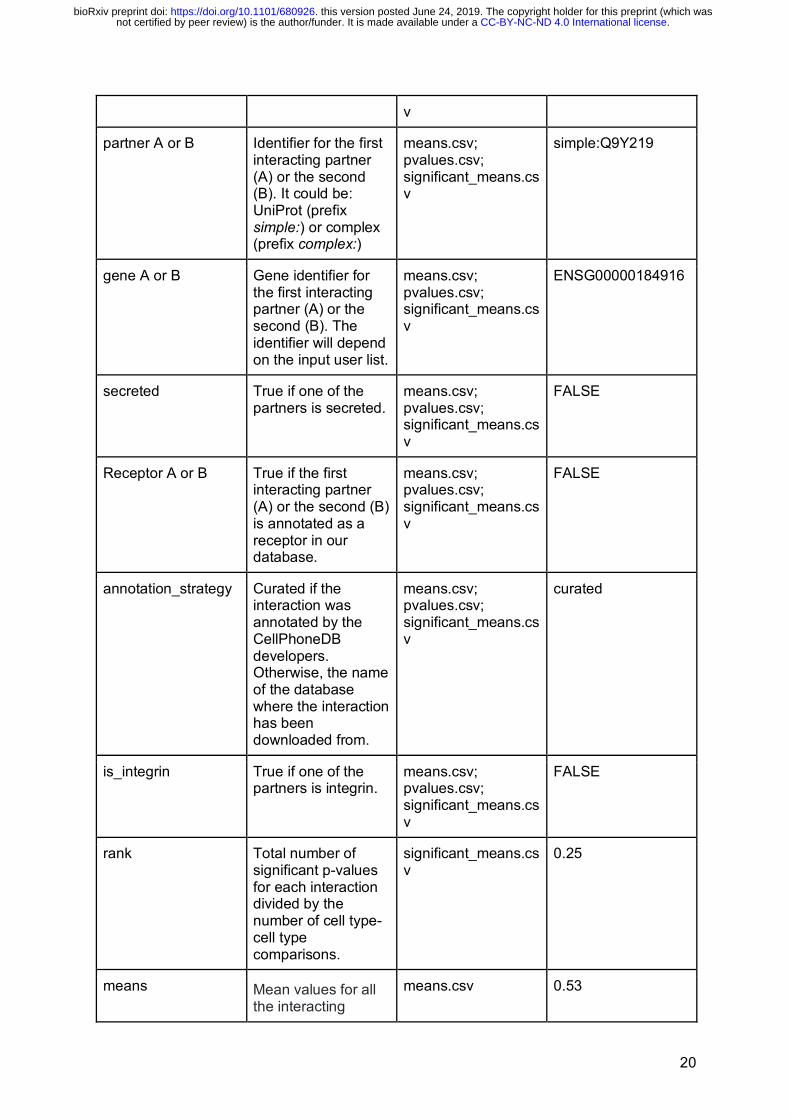
5 Table 2. Description of the output files means.csv, pvalues.csv and significant_means.csv
Identifier Definition Output file Example
id_cp_interaction Unique CellPhoneDB identifier for each interaction stored in the database.
means.csv; pvalues.csv; significant_means.csv
CPI-SS096F3E0F2
interacting_pair Name of the interacting pairs separated by “|”.
means.csv; pvalues.csv; significant_means.cs
JAG2|NOTCH4
.CC-BY-NC-ND 4.0 International licensenot certified by peer review) is the author/funder. It is made available under aThe copyright holder for this preprint (which wasthis version posted June 24, 2019. . https://doi.org/10.1101/680926doi: bioRxiv preprint
20
v
partner A or B Identifier for the first interacting partner (A) or the second (B). It could be: UniProt (prefix simple:) or complex (prefix complex:)
means.csv; pvalues.csv; significant_means.csv
simple:Q9Y219
gene A or B Gene identifier for the first interacting partner (A) or the second (B). The identifier will depend on the input user list.
means.csv; pvalues.csv; significant_means.csv
ENSG00000184916
secreted True if one of the partners is secreted.
means.csv; pvalues.csv; significant_means.csv
FALSE
Receptor A or B True if the first interacting partner (A) or the second (B) is annotated as a receptor in our database.
means.csv; pvalues.csv; significant_means.csv
FALSE
annotation_strategy Curated if the interaction was annotated by the CellPhoneDB developers. Otherwise, the name of the database where the interaction has been downloaded from.
means.csv; pvalues.csv; significant_means.csv
curated
is_integrin True if one of the partners is integrin.
means.csv; pvalues.csv; significant_means.csv
FALSE
rank Total number of significant p-values for each interaction divided by the number of cell type-cell type comparisons.
significant_means.csv
0.25
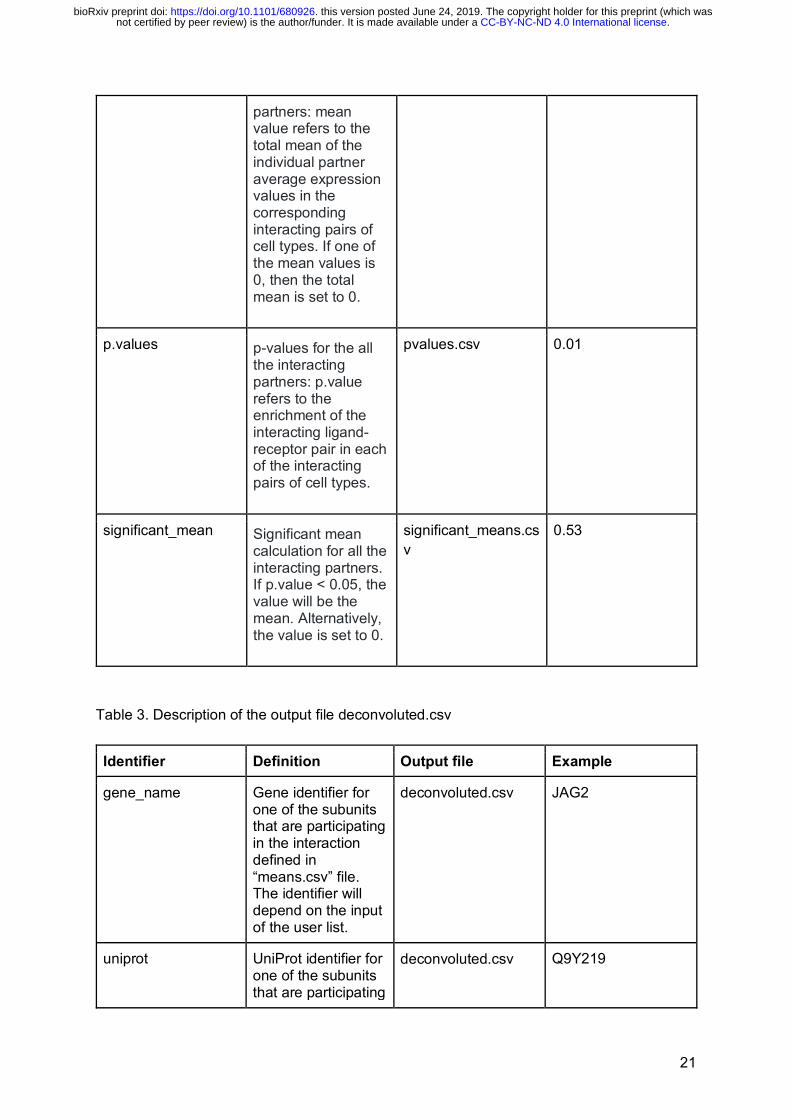
means Mean values for all the interacting
means.csv 0.53
.CC-BY-NC-ND 4.0 International licensenot certified by peer review) is the author/funder. It is made available under aThe copyright holder for this preprint (which wasthis version posted June 24, 2019. . https://doi.org/10.1101/680926doi: bioRxiv preprint
21
partners: mean value refers to the total mean of the individual partner average expression values in the corresponding interacting pairs of cell types. If one of the mean values is 0, then the total mean is set to 0.
p.values p-values for the all the interacting partners: p.value refers to the enrichment of the interacting ligand-receptor pair in each of the interacting pairs of cell types.
pvalues.csv 0.01
significant_mean Significant mean calculation for all the interacting partners. If p.value < 0.05, the value will be the mean. Alternatively, the value is set to 0.
significant_means.csv
0.53
Table 3. Description of the output file deconvoluted.csv
Identifier Definition Output file Example
gene_name Gene identifier for one of the subunits that are participating in the interaction defined in “means.csv” file. The identifier will depend on the input of the user list.
deconvoluted.csv JAG2
uniprot UniProt identifier for one of the subunits that are participating
deconvoluted.csv Q9Y219
.CC-BY-NC-ND 4.0 International licensenot certified by peer review) is the author/funder. It is made available under aThe copyright holder for this preprint (which wasthis version posted June 24, 2019. . https://doi.org/10.1101/680926doi: bioRxiv preprint

22
in the interaction defined in “means.csv” file.
is_complex True if the subunit is part of a complex. Single if it is not, complex if it is.
deconvoluted.csv FALSE
protein_name Protein name for one of the subunits that are participating in the interaction defined in “means.csv” file.
deconvoluted.csv JAG2_HUMAN
complex_name Complex name if the subunit is part of a complex. Empty if not.
deconvoluted.csv a10b1 complex
id_cp_interaction Unique CellPhoneDB identifier for each of the interactions stored in the database.
deconvoluted.csv CPI-SS0DB3F5A37
mean Mean expression of the corresponding gene in each cluster.
0.9
Supplementary information
Supplementary methods 5
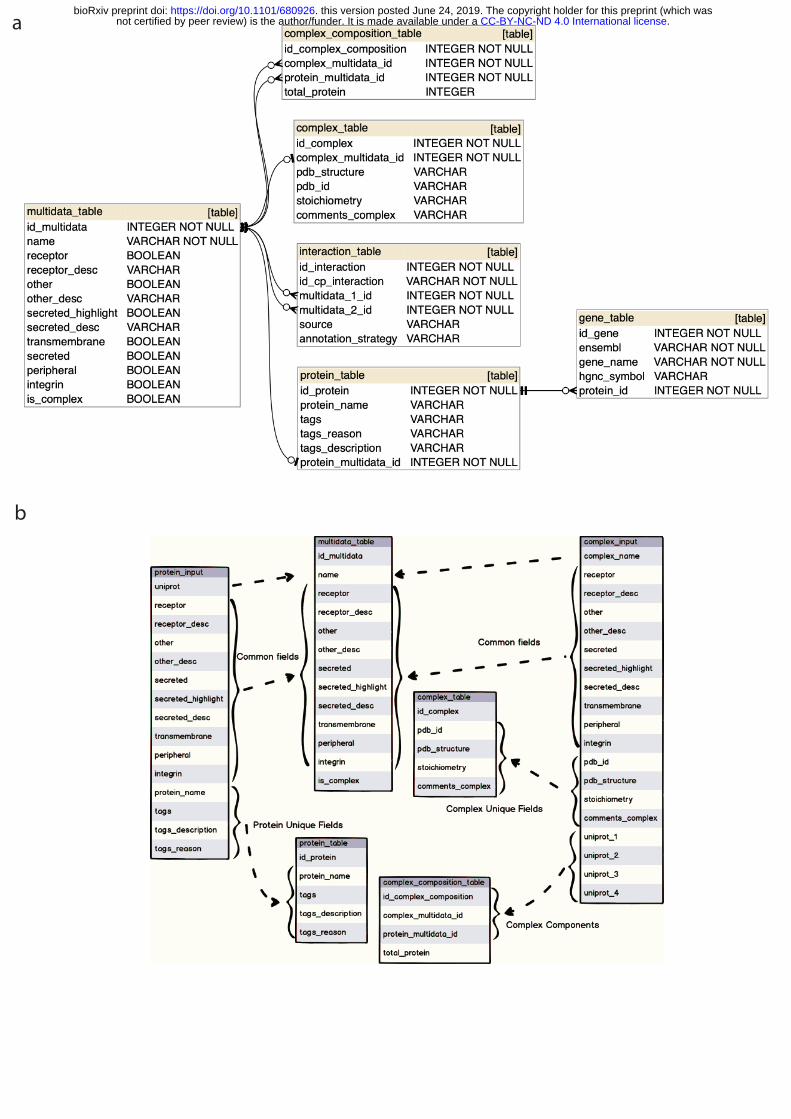
The database consists of 6 main tables: gene_table; protein_table; multidata_table; interaction_table; complex_table; complex_composition_table (Supplementary Figure 1). All tables have an incremental numeric unique identifier with the structure id_{table_name} 10 and one or more foreign keys, with structure {foreign_table_name}_id, to connect all tables.
1. gene_table
.CC-BY-NC-ND 4.0 International licensenot certified by peer review) is the author/funder. It is made available under aThe copyright holder for this preprint (which wasthis version posted June 24, 2019. . https://doi.org/10.1101/680926doi: bioRxiv preprint

23
This table stores all the information generated in the gene_input database input file. This includes the gene name (“gene_name”); the HUGO nomenclature committee symbol (HGNC) (“hgnc_symbol”) and ensembl identifier (“ensembl”). Importantly, only the gene and protein information of proteins considered in the “interactions_list” is stored in our database. 5 The gene table is related to the protein table via the protein_id - id_protein (one to many) foreign key.
2. multidata_table 10 This table stores the shared information between the protein_table and the complex_table and represents (in terms of database design and performance) the relations in the interaction_table. 15 All the information required in this table is obtained from the protein_input and complex_input input files. It stores the following fields: name (it corresponds to uniprot if the row is a protein or complex_name if row is a complex), transmembrane, peripheral, secreted, secreted_desc, secreted_highlight, receptor, receptor_desc, integrin, other and other_desc. is_complex column was added for internal optimization and indicates if the row is a complex. 20
3. protein_table This table stores the information obtained from the database input file protein_input. It contains the name of the protein (protein_name), tags, tags_reason and tags_description. The table is 25 related to multidata_table (1..0 - 1 relation) through the protein_multidata_id foreign key.
4. complex_table This table stores complex information from the database input file complex_input. It stores the 30 following fields: pdb_id, pdb_structure, stoichiometry, comments_complex. The table is related to multidata_table (1..0 - 1 relation) through the complex_multidata_id foreign key. All information about the complex components is stored in the complex_composition_table. 35
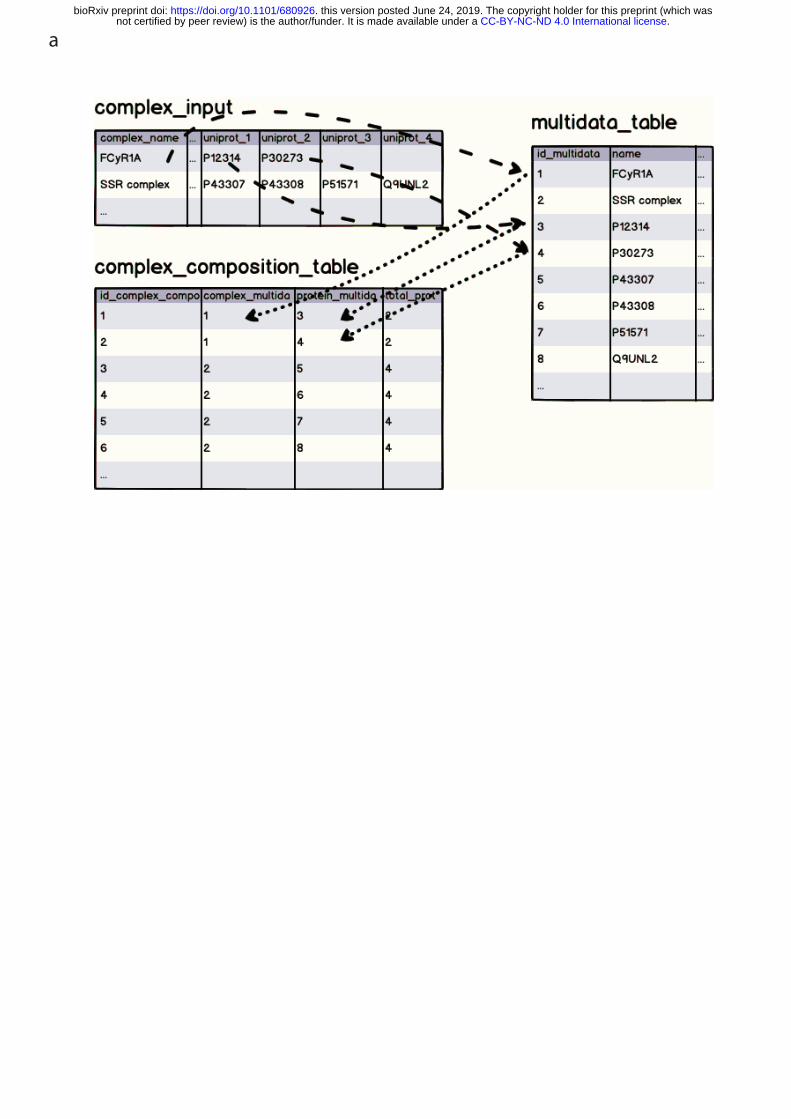
5. complex_composition_table This table stores the proteins that compose (uniprot_1 - uniprot_4) a complex. It is related to multidata through complex_multidata_id and to multidata_table through protein_multidata_id (* to 1 relations). We also created an additional column called total_protein (with number of 40 complex components) for internal optimization purposes. Supplementary Figure 2 represents an example of two complex_input rows with two and four components.
6. interaction_table 45 This table stores the interactions data from interaction_input file. It uses the following columns to represent the data: id_cp_interaction, annotation_strategy and source. To identify the interaction partners (partner_a and partner_b in interaction_input), the table is connected to
.CC-BY-NC-ND 4.0 International licensenot certified by peer review) is the author/funder. It is made available under aThe copyright holder for this preprint (which wasthis version posted June 24, 2019. . https://doi.org/10.1101/680926doi: bioRxiv preprint
24
multidata_table through the foreign key multidata_1_id and multidata_2_id respectively with 1 - 1..* relation. Since multidata_table stores both protein and complex data, it is not necessary to create additional columns to show if components partner_a and partner_b are simple or complex. Importantly, only genes and proteins involved in cell-cell communication are stored in our database (see the interaction_list section). 5
Supplementary figures Supplementary Figure 1. Diagram database structure. a) database schema, b) 10 protein_input/complex_input storage in the CellPhoneDB database tables. The multidata entity stores fields common to complex_input and protein_input. This makes it easier and faster for the user to perform interaction queries because interaction_table is only related to multidata_table. There is no need to check if the component is simple or complex to find the correct table. All non-common fields are stored in either protein_table or complex_table. 15 Complex fields are stored in complex_composition_table as it's typical in relational databases. The is_complex and total_protein field are created for optimization purposes. Supplementary Figure 2. Example of complex_input components stored in CellPhoneDB. a, 20 An example of two complex_input rows with two and four components.
.CC-BY-NC-ND 4.0 International licensenot certified by peer review) is the author/funder. It is made available under aThe copyright holder for this preprint (which wasthis version posted June 24, 2019. . https://doi.org/10.1101/680926doi: bioRxiv preprint

n = 1396n = 466 involvingprotein complexes
n = 878
n = 112
n = 978
.CC-BY-NC-ND 4.0 International licensenot certified by peer review) is the author/funder. It is made available under aThe copyright holder for this preprint (which wasthis version posted June 24, 2019. . https://doi.org/10.1101/680926doi: bioRxiv preprint
Receptor
Ligand
Minimum
( Sub. 1, Sub. 2 )
Sub.2
Sub.1
Random shuffle
Input scRNAseq
Null distribution of the mean(R1-L1) in cluster1-cluster2
p - value
Ranking basedon specificity
p - val
p - val
p - valR1 - L1
R2 - L2
R3 - L3
Observed mean (R1-L1)in cluster1-cluster2
a
scRNAseq input data:counts file: gene expression datameta file: cell type annotation
Large datasets can be subsampled using geometric sketching28.
Cells with the same annotation are pooled as a cluster. We derive enriched receptor–ligandinteractions between two cell types based on expression of a receptor by one cell type and a ligand by another cell type. For each gene in the cluster, the percentage of cells expressing the gene and the gene expression mean is calculated. Genes expressed by less than 10% of cells in the cluster are removed.
The member of the complex with the minimum average expression is considered for the subsequent statistical analysis.
We randomly permute the cluster labels of all cells 1,000 times and determine the mean of the average receptor expression level in a cluster and the average ligand expression level in the interacting cluster. For each receptor–ligand pair in each pairwise comparison between two cell types, this generates a null distribution.
By calculating the proportion of the means which are as or higher than the actual mean, we obtain a P value for the likelihood of cell-type specificity of a given receptor–ligand complex. In other words, if theobserved mean is in the top 5%, the interactionis assigned a P value of 0.05.
We rank receptor ligand pairs on their total number of significant p-values across the cell populations. Those with the least number of significant p-values are most likely to be biologically relevant.
We provide visualisation of the results using intuitive tables and plots.
.CC-BY-NC-ND 4.0 International licensenot certified by peer review) is the author/funder. It is made available under aThe copyright holder for this preprint (which wasthis version posted June 24, 2019. . https://doi.org/10.1101/680926doi: bioRxiv preprint
CD
8ILC
3C
D4
DC
1TregsE
pidS
3dM
ac1dM
ac2dN
K1
dNK
2dN
K3
dPV
1dP
V2
dS1
dS2
EndoL
EV
TE
ndoCD8ILC3CD4DC1TregsEpidS3dMac1dMac2dNK1dNK2dNK3dPV1dPV2dS1dS2EndoLEVTEndo
20 100
b
number of interactions
a
IL10 receptor_IL10FPR1_ANXA1
LGALS9_HAVCR2ADORA3_ENTPD1
ADORA2B_ENTPD1CD274_PDCD1
CLEC2D_KLRB1PVR_TIGIT
ACKR2_CCL4ACKR2_CCL3ACKR2_CCL5HLAG_LILRB1
OSMR_OSMEGFR_AREGKDR_VEGFAFLT1_VEGFAFLT1_VEGFB
CXCL12_CXCR4FGFR1_NCAM1
PLXNB1_SEMA4DCCR1_CCL5
CSF1R_CSF1EPHB2_EFNA5
XCR1_XCL2XCR1_XCL1
EV
T_dN
K1
EV
T_dN
K2
EV
T_dN
K3
EV
T_dM
ac1
EV
T_dM
ac2
EV
T_D
C1
EV
T_C
D8
EV
T_C
D4
EV
T_Tr
egs
End
o_dN
K1
End
o_dN
K2
End
o_dN
K3
End
o_dM
ac1
End
o_dM
ac2
End
o_D
C1
End
o_C
D8
End
o_C
D4
End
o_Tr
egs
dS2_
dNK
1dS
2_dN
K2
dS2_
dNK
3dS
2_dM
ac1
dS2_
dMac
2dS
2_D
C1
dS2_
CD
8dS
2_C
D4
dS2_
Treg
sdM
ac2_
dNK
1dM
ac2_
dNK
2dM
ac2_
dNK
3dM
ac2_
dMac
1dM
ac2_
dMac
2dM
ac2_
DC
1dM
ac2_
CD
8dM
ac2_
CD
4dM
ac2_
Treg
sD
C1_
dNK
1D
C1_
dNK
2D
C1_
dNK
3D
C1_
dMac
1D
C1_
dMac
2D
C1_
DC
1D
C1_
CD
8D
C1_
CD
4D
C1_
Treg
s
-log10(pvalue)0 1 2 >=3 -2 0 2 4Log2 mean
(Molecule 1, Molecule 2)
IL10 receptor_IL10FPR1_ANXA1
LGALS9_HAVCR2ADORA3_ENTPD1
ADORA2B_ENTPD1CD274_PDCD1
CLEC2D_KLRB1PVR_TIGIT
ACKR2_CCL4ACKR2_CCL3ACKR2_CCL5
HLA-G_LILRB1OSMR_OSM
EGFR_AREGKDR_VEGFAFLT1_VEGFAFLT1_VEGFB
CXCL12_CXCR4FGFR1_NCAM1
PLXNB1_SEMA4DCCR1_CCL5
CSF1R_CSF1EPHB2_EFNA5
XCR1_XCL2XCR1_XCL1
EVT|
dNK1
EVT|
dNK2
EVT|
dNK3
EVT|
dMac
1EV
T|dM
ac2
EVT|
DC
1EV
T|C
D8
EVT|
CD
4EV
T|Tr
egs
Endo
|dN
K1En
do|d
NK2
Endo
|dN
K3En
do|d
Mac
1En
do|d
Mac
2En
do|D
C1
Endo
|CD
8En
do|C
D4
Endo
|Tre
gsdS
2|dN
K1dS
2|dN
K2dS
2|dN
K3dS
2|dM
ac1
dS2|
dMac
2dS
2|D
C1
dS2|
CD
8dS
2|C
D4
dS2|
Treg
sdM
ac2|
dNK1
dMac
2|dN
K2dM
ac2|
dNK3
dMac
2|dM
ac1
dMac
2|dM
ac2
dMac
2|D
C1
dMac
2|C
D8
dMac
2|C
D4
dMac
2|Tr
egs
DC
1|dN
K1D
C1|
dNK2
DC
1|dN
K3D
C1|
dMac
1D
C1|
dMac
2D
C1|
DC
1D
C1|
CD
8D
C1|
CD
4D
C1|
Treg
s
CD
8ILC
3C
D4
DC
1TregsE
pidS
3dM
ac1dM
ac2dN
K1
dNK
2dN
K3
dPV
1dP
V2
dS1
dS2
EndoL
EV
TE
ndo
CD8ILC3CD4DC1TregsEpidS3dMac1dMac2dNK1dNK2dNK3dPV1dPV2dS1dS2EndoLEVTEndo
c d
-log10(pvalue)0 1 2 >=3 Log2 mean
(Molecule 1, Molecule 2)
-2 0 2 4 number of interactions
20 100
e
0
1
2
3
0
1
2
3
01234
log tr
ansfo
rmed
no
rmali
sed
coun
tslog
tran
sform
ed
norm
alise
d co
unts
log tr
ansfo
rmed
no
rmali
sed
coun
ts
IL6R
IL6ST
IL6
Hofbauer cells
Fibroblast 2
IL6
IL6R
IL6ST
IL6
IL6 receptor
IL6 receptor
Placenta
EVTVCT
SCTF1 F2 HB M3
Endo
EVTVCT
SCTF1 F2 HB M3
Endo
EVTVCT
SCTF1 F2 HB M3
Endo
CellPhoneDB v1.0
CellPhoneDB v2.0 with subsampling
.CC-BY-NC-ND 4.0 International licensenot certified by peer review) is the author/funder. It is made available under aThe copyright holder for this preprint (which wasthis version posted June 24, 2019. . https://doi.org/10.1101/680926doi: bioRxiv preprint

External API
CellPhoneDB_curated
user
gene_input protein_input
complex_input interaction_input
.CC-BY-NC-ND 4.0 International licensenot certified by peer review) is the author/funder. It is made available under aThe copyright holder for this preprint (which wasthis version posted June 24, 2019. . https://doi.org/10.1101/680926doi: bioRxiv preprint
a
b
c
d
.CC-BY-NC-ND 4.0 International licensenot certified by peer review) is the author/funder. It is made available under aThe copyright holder for this preprint (which wasthis version posted June 24, 2019. . https://doi.org/10.1101/680926doi: bioRxiv preprint
a
b
.CC-BY-NC-ND 4.0 International licensenot certified by peer review) is the author/funder. It is made available under aThe copyright holder for this preprint (which wasthis version posted June 24, 2019. . https://doi.org/10.1101/680926doi: bioRxiv preprint
a.CC-BY-NC-ND 4.0 International licensenot certified by peer review) is the author/funder. It is made available under a
The copyright holder for this preprint (which wasthis version posted June 24, 2019. . https://doi.org/10.1101/680926doi: bioRxiv preprint