Cell proliferation and migration during early … · and migration during early development of a...
14
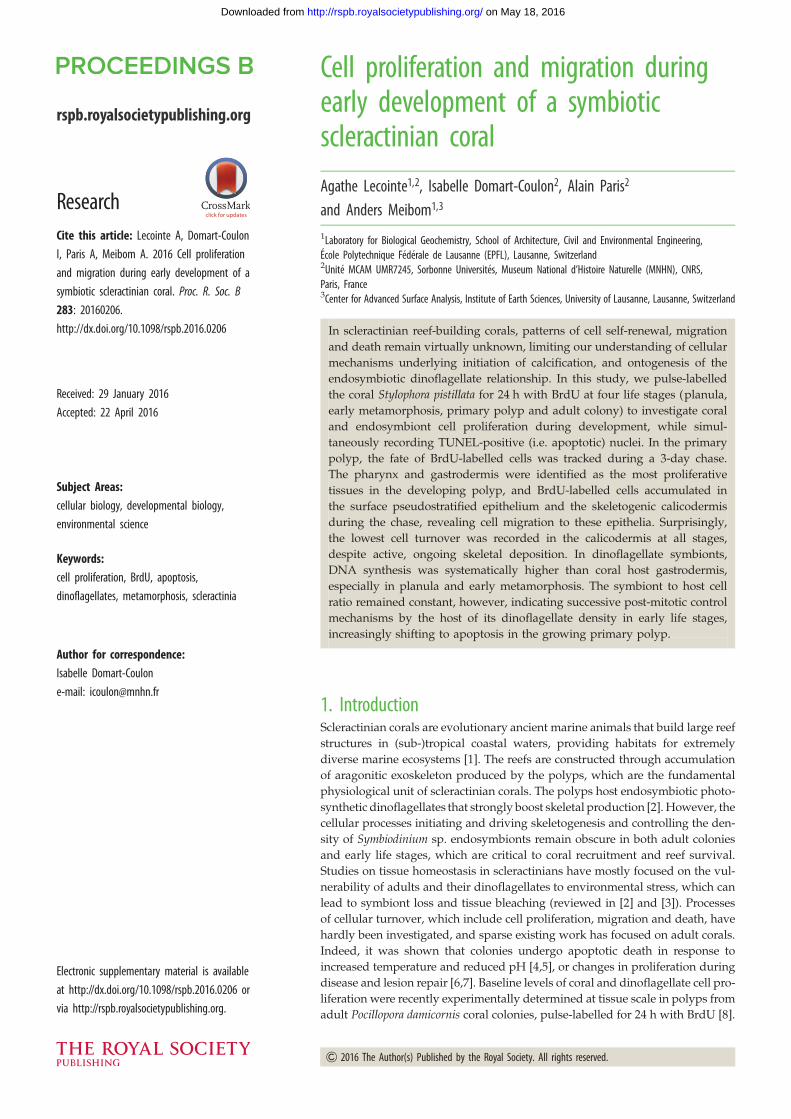
rspb.royalsocietypublishing.org Research Cite this article: Lecointe A, Domart-Coulon I, Paris A, Meibom A. 2016 Cell proliferation and migration during early development of a symbiotic scleractinian coral. Proc. R. Soc. B 283: 20160206. http://dx.doi.org/10.1098/rspb.2016.0206 Received: 29 January 2016 Accepted: 22 April 2016 Subject Areas: cellular biology, developmental biology, environmental science Keywords: cell proliferation, BrdU, apoptosis, dinoflagellates, metamorphosis, scleractinia Author for correspondence: Isabelle Domart-Coulon e-mail: [email protected] Electronic supplementary material is available at http://dx.doi.org/10.1098/rspb.2016.0206 or via http://rspb.royalsocietypublishing.org. Cell proliferation and migration during early development of a symbiotic scleractinian coral Agathe Lecointe 1,2 , Isabelle Domart-Coulon 2 , Alain Paris 2 and Anders Meibom 1,3 1 Laboratory for Biological Geochemistry, School of Architecture, Civil and Environmental Engineering, E ´ cole Polytechnique Fe ´de ´rale de Lausanne (EPFL), Lausanne, Switzerland 2 Unite ´ MCAM UMR7245, Sorbonne Universite ´s, Museum National d’Histoire Naturelle (MNHN), CNRS, Paris, France 3 Center for Advanced Surface Analysis, Institute of Earth Sciences, University of Lausanne, Lausanne, Switzerland In scleractinian reef-building corals, patterns of cell self-renewal, migration and death remain virtually unknown, limiting our understanding of cellular mechanisms underlying initiation of calcification, and ontogenesis of the endosymbiotic dinoflagellate relationship. In this study, we pulse-labelled the coral Stylophora pistillata for 24 h with BrdU at four life stages (planula, early metamorphosis, primary polyp and adult colony) to investigate coral and endosymbiont cell proliferation during development, while simul- taneously recording TUNEL-positive (i.e. apoptotic) nuclei. In the primary polyp, the fate of BrdU-labelled cells was tracked during a 3-day chase. The pharynx and gastrodermis were identified as the most proliferative tissues in the developing polyp, and BrdU-labelled cells accumulated in the surface pseudostratified epithelium and the skeletogenic calicodermis during the chase, revealing cell migration to these epithelia. Surprisingly, the lowest cell turnover was recorded in the calicodermis at all stages, despite active, ongoing skeletal deposition. In dinoflagellate symbionts, DNA synthesis was systematically higher than coral host gastrodermis, especially in planula and early metamorphosis. The symbiont to host cell ratio remained constant, however, indicating successive post-mitotic control mechanisms by the host of its dinoflagellate density in early life stages, increasingly shifting to apoptosis in the growing primary polyp. 1. Introduction Scleractinian corals are evolutionary ancient marine animals that build large reef structures in (sub-)tropical coastal waters, providing habitats for extremely diverse marine ecosystems [1]. The reefs are constructed through accumulation of aragonitic exoskeleton produced by the polyps, which are the fundamental physiological unit of scleractinian corals. The polyps host endosymbiotic photo- synthetic dinoflagellates that strongly boost skeletal production [2]. However, the cellular processes initiating and driving skeletogenesis and controlling the den- sity of Symbiodinium sp. endosymbionts remain obscure in both adult colonies and early life stages, which are critical to coral recruitment and reef survival. Studies on tissue homeostasis in scleractinians have mostly focused on the vul- nerability of adults and their dinoflagellates to environmental stress, which can lead to symbiont loss and tissue bleaching (reviewed in [2] and [3]). Processes of cellular turnover, which include cell proliferation, migration and death, have hardly been investigated, and sparse existing work has focused on adult corals. Indeed, it was shown that colonies undergo apoptotic death in response to increased temperature and reduced pH [4,5], or changes in proliferation during disease and lesion repair [6,7]. Baseline levels of coral and dinoflagellate cell pro- liferation were recently experimentally determined at tissue scale in polyps from adult Pocillopora damicornis coral colonies, pulse-labelled for 24 h with BrdU [8]. & 2016 The Author(s) Published by the Royal Society. All rights reserved. on May 18, 2016 http://rspb.royalsocietypublishing.org/ Downloaded from
Transcript of Cell proliferation and migration during early … · and migration during early development of a...
rspb.royalsocietypublishing.org
ResearchCite this article: Lecointe A, Domart-Coulon
I, Paris A, Meibom A. 2016 Cell proliferation
and migration during early development of a
symbiotic scleractinian coral. Proc. R. Soc. B
283: 20160206.
http://dx.doi.org/10.1098/rspb.2016.0206
Received: 29 January 2016
Accepted: 22 April 2016
Subject Areas:cellular biology, developmental biology,
environmental science
Keywords:cell proliferation, BrdU, apoptosis,
dinoflagellates, metamorphosis, scleractinia
Author for correspondence:Isabelle Domart-Coulon
e-mail: [email protected]
Electronic supplementary material is available
at http://dx.doi.org/10.1098/rspb.2016.0206 or
via http://rspb.royalsocietypublishing.org.
Cell proliferation and migration duringearly development of a symbioticscleractinian coral
Agathe Lecointe1,2, Isabelle Domart-Coulon2, Alain Paris2
and Anders Meibom1,3
1Laboratory for Biological Geochemistry, School of Architecture, Civil and Environmental Engineering,Ecole Polytechnique Federale de Lausanne (EPFL), Lausanne, Switzerland2Unite MCAM UMR7245, Sorbonne Universites, Museum National d’Histoire Naturelle (MNHN), CNRS,Paris, France3Center for Advanced Surface Analysis, Institute of Earth Sciences, University of Lausanne, Lausanne, Switzerland
In scleractinian reef-building corals, patterns of cell self-renewal, migration
and death remain virtually unknown, limiting our understanding of cellular
mechanisms underlying initiation of calcification, and ontogenesis of the
endosymbiotic dinoflagellate relationship. In this study, we pulse-labelled
the coral Stylophora pistillata for 24 h with BrdU at four life stages (planula,
early metamorphosis, primary polyp and adult colony) to investigate coral
and endosymbiont cell proliferation during development, while simul-
taneously recording TUNEL-positive (i.e. apoptotic) nuclei. In the primary
polyp, the fate of BrdU-labelled cells was tracked during a 3-day chase.
The pharynx and gastrodermis were identified as the most proliferative
tissues in the developing polyp, and BrdU-labelled cells accumulated in
the surface pseudostratified epithelium and the skeletogenic calicodermis
during the chase, revealing cell migration to these epithelia. Surprisingly,
the lowest cell turnover was recorded in the calicodermis at all stages,
despite active, ongoing skeletal deposition. In dinoflagellate symbionts,
DNA synthesis was systematically higher than coral host gastrodermis,
especially in planula and early metamorphosis. The symbiont to host cell
ratio remained constant, however, indicating successive post-mitotic control
mechanisms by the host of its dinoflagellate density in early life stages,
increasingly shifting to apoptosis in the growing primary polyp.
1. IntroductionScleractinian corals are evolutionary ancient marine animals that build large reef
structures in (sub-)tropical coastal waters, providing habitats for extremely
diverse marine ecosystems [1]. The reefs are constructed through accumulation
of aragonitic exoskeleton produced by the polyps, which are the fundamental
physiological unit of scleractinian corals. The polyps host endosymbiotic photo-
synthetic dinoflagellates that strongly boost skeletal production [2]. However, the
cellular processes initiating and driving skeletogenesis and controlling the den-
sity of Symbiodinium sp. endosymbionts remain obscure in both adult colonies
and early life stages, which are critical to coral recruitment and reef survival.
Studies on tissue homeostasis in scleractinians have mostly focused on the vul-
nerability of adults and their dinoflagellates to environmental stress, which can
lead to symbiont loss and tissue bleaching (reviewed in [2] and [3]). Processes
of cellular turnover, which include cell proliferation, migration and death, have
hardly been investigated, and sparse existing work has focused on adult corals.
Indeed, it was shown that colonies undergo apoptotic death in response to
increased temperature and reduced pH [4,5], or changes in proliferation during
disease and lesion repair [6,7]. Baseline levels of coral and dinoflagellate cell pro-
liferation were recently experimentally determined at tissue scale in polyps from
adult Pocillopora damicornis coral colonies, pulse-labelled for 24 h with BrdU [8].
& 2016 The Author(s) Published by the Royal Society. All rights reserved.
on May 18, 2016http://rspb.royalsocietypublishing.org/Downloaded from
However, early life stages offer the unique opportunity to
investigate the ontogeny of morphogenetic processes in each
specialized coral tissue, particularly with respect to the skel-
eton-forming calicodermis, and the host regulation of its
Symbiodinium endosymbiont density.
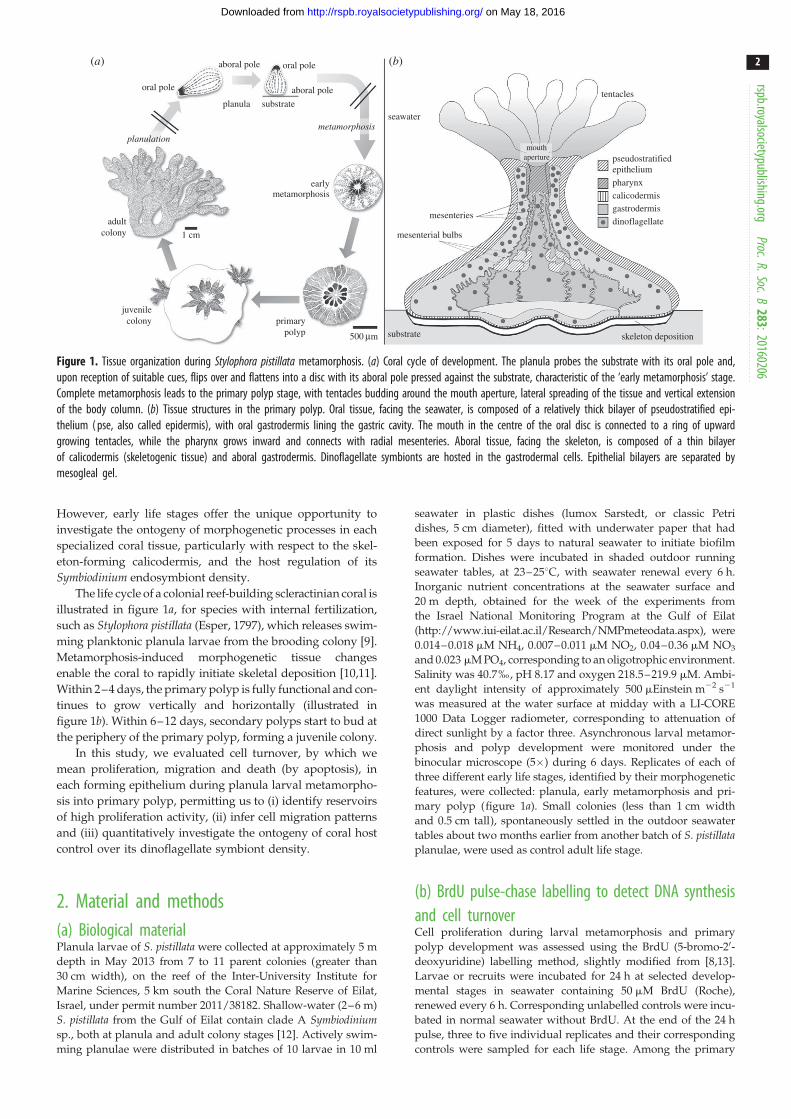
The life cycle of a colonial reef-building scleractinian coral is
illustrated in figure 1a, for species with internal fertilization,
such as Stylophora pistillata (Esper, 1797), which releases swim-
ming planktonic planula larvae from the brooding colony [9].
Metamorphosis-induced morphogenetic tissue changes
enable the coral to rapidly initiate skeletal deposition [10,11].
Within 2–4 days, the primary polyp is fully functional and con-
tinues to grow vertically and horizontally (illustrated in
figure 1b). Within 6–12 days, secondary polyps start to bud at
the periphery of the primary polyp, forming a juvenile colony.
In this study, we evaluated cell turnover, by which we
mean proliferation, migration and death (by apoptosis), in
each forming epithelium during planula larval metamorpho-
sis into primary polyp, permitting us to (i) identify reservoirs
of high proliferation activity, (ii) infer cell migration patterns
and (iii) quantitatively investigate the ontogeny of coral host
control over its dinoflagellate symbiont density.
2. Material and methods(a) Biological materialPlanula larvae of S. pistillata were collected at approximately 5 m
depth in May 2013 from 7 to 11 parent colonies (greater than
30 cm width), on the reef of the Inter-University Institute for
Marine Sciences, 5 km south the Coral Nature Reserve of Eilat,
Israel, under permit number 2011/38182. Shallow-water (2–6 m)
S. pistillata from the Gulf of Eilat contain clade A Symbiodiniumsp., both at planula and adult colony stages [12]. Actively swim-
ming planulae were distributed in batches of 10 larvae in 10 ml
seawater in plastic dishes (lumox Sarstedt, or classic Petri
dishes, 5 cm diameter), fitted with underwater paper that had
been exposed for 5 days to natural seawater to initiate biofilm
formation. Dishes were incubated in shaded outdoor running
seawater tables, at 23–258C, with seawater renewal every 6 h.
Inorganic nutrient concentrations at the seawater surface and
20 m depth, obtained for the week of the experiments from
the Israel National Monitoring Program at the Gulf of Eilat
(http://www.iui-eilat.ac.il/Research/NMPmeteodata.aspx), were
0.014–0.018 mM NH4, 0.007–0.011 mM NO2, 0.04–0.36 mM NO3
and 0.023 mM PO4, corresponding to an oligotrophic environment.
Salinity was 40.7‰, pH 8.17 and oxygen 218.5–219.9 mM. Ambi-
ent daylight intensity of approximately 500 mEinstein m22 s21
was measured at the water surface at midday with a LI-CORE
1000 Data Logger radiometer, corresponding to attenuation of
direct sunlight by a factor three. Asynchronous larval metamor-
phosis and polyp development were monitored under the
binocular microscope (5�) during 6 days. Replicates of each of
three different early life stages, identified by their morphogenetic
features, were collected: planula, early metamorphosis and pri-
mary polyp (figure 1a). Small colonies (less than 1 cm width
and 0.5 cm tall), spontaneously settled in the outdoor seawater
tables about two months earlier from another batch of S. pistillataplanulae, were used as control adult life stage.
(b) BrdU pulse-chase labelling to detect DNA synthesisand cell turnoverCell proliferation during larval metamorphosis and primary
polyp development was assessed using the BrdU (5-bromo-20-
deoxyuridine) labelling method, slightly modified from [8,13].
Larvae or recruits were incubated for 24 h at selected develop-
mental stages in seawater containing 50 mM BrdU (Roche),
renewed every 6 h. Corresponding unlabelled controls were incu-
bated in normal seawater without BrdU. At the end of the 24 h
pulse, three to five individual replicates and their corresponding
controls were sampled for each life stage. Among the primary
oral pole
planulation
oral poleaboral pole
aboral pole
planula substrateseawater
tentacles
pseudostratifiedepithelium
pharynxcalicodermisgastrodermisdinoflagellate
mouthaperture
earlymetamorphosis
mesenteries
mesenterial bulbs
skeleton deposition
adultcolony
juvenilecolony primary
polyp 500 mm substrate
1 cm
metamorphosis
(b)(a)
Figure 1. Tissue organization during Stylophora pistillata metamorphosis. (a) Coral cycle of development. The planula probes the substrate with its oral pole and,upon reception of suitable cues, flips over and flattens into a disc with its aboral pole pressed against the substrate, characteristic of the ‘early metamorphosis’ stage.Complete metamorphosis leads to the primary polyp stage, with tentacles budding around the mouth aperture, lateral spreading of the tissue and vertical extensionof the body column. (b) Tissue structures in the primary polyp. Oral tissue, facing the seawater, is composed of a relatively thick bilayer of pseudostratified epi-thelium ( pse, also called epidermis), with oral gastrodermis lining the gastric cavity. The mouth in the centre of the oral disc is connected to a ring of upwardgrowing tentacles, while the pharynx grows inward and connects with radial mesenteries. Aboral tissue, facing the skeleton, is composed of a thin bilayerof calicodermis (skeletogenic tissue) and aboral gastrodermis. Dinoflagellate symbionts are hosted in the gastrodermal cells. Epithelial bilayers are separated bymesogleal gel.
rspb.royalsocietypublishing.orgProc.R.Soc.B
283:20160206
2
on May 18, 2016http://rspb.royalsocietypublishing.org/Downloaded from
polyps pulse-labelled with BrdU for 24 h, a few individuals were
allowed to further grow in running seawater for a chase period of
48 h (two replicates; the third was lost) or 64 h (three replicates).
(c) Serial tissue sectioningAt the end of the BrdU pulse or the chase, samples were fixed
overnight at 48C and prepared for serial sectioning following
procedures detailed by Lecointe et al. [8]. Unicryl (EMS)-
embedded samples were cut into semi-thin sections (1 mm
thick) with a 358 diamond knife (Diatome) on an Ultracut micro-
tome, at the MNHN PtME platform of electron microscopy
(Paris). Serial sets of sections, obtained at three separate depths
in each replicate, were used for (i) histological staining with tolui-
dine blue-basic fuschin (EMS) for identification and orientation
in the larval/polyp structure, (ii) BrdU immunolocalization
and (iii) apoptosis detection by terminal transferase-mediated
dUTP nick end labelling (TUNEL) assay.
(d) Immunolocalization of BrdU-labelled nucleiThe BrdU-labelling index measures the proportion of cell nuclei
having incorporated BrdU in their newly synthesized DNA
during the 24 h pulse. BrdU was immunodetected in tissue
sections with primary anti-BrdU mouse antibody (Roche) and
Alexa-594-labelled secondary goat anti-mouse antibody (Invitro-
gen), and nuclei were counterstained with DAPI (Invitrogen),
following [8]. Sections were observed on a wide-field fluorescence
microscope (Olympus XM10 slide scanner) at the EPFL PT-
BIOP platform (Lausanne) using DAPI (Ex 377/50 nm, Em 440/
40 nm), and CY3 filters (Ex 560/25 nm, Em 607/36 nm) at
spatial lateral resolution of approximately 0.5 mm. A total of
four to eight sections were imaged for each of three to five biologi-
cal replicates per life stage, and analysed with IMAGEJ software
(v. 1.49) using the cell counter plug-in to manually count BrdU-
labelled nuclei among DAPI-counterstained total nuclei (for
method, see electronic supplementary material, figure S1).
Labelled nuclei were not detected in control tissue unexposed
to BrdU (one negative control examined per life stage). Totals of
345–64 810 nuclei were counted per tissue type (depending on
section orientation).
Dilution of BrdU labelling intensity was quantified during
the 3 days chase in seawater. Dilution is caused by de novo syn-
thesis of unlabelled DNA, through entry of cycling cells into S
phase and division. An intensity drop by a factor of two can
thus be attributed to one cell division. During the chase exper-
iment, the fluorescent signal intensity of labelled nuclei was
measured for BrdU and DAPI, background was substracted and
the CY3/DAPI signal intensity ratios were compared (n ¼ 30–60
nuclei per tissue type, per chase time-point).
(e) Tunel assay for detection of apoptotic cell nucleiApoptosis was evaluated in the same biological samples pre-
viously analysed for BrdU labelling, using serial sections at
similar depths in the tissue. Control samples not exposed to
BrdU were also assessed for apoptosis (one control per life
stage). Apoptosis is characterized by formation of DNA breaks
(nick), and the TUNEL reaction uses the enzyme terminal
deoxynucleotidyl transferase (TdT) to fill these gaps with fluor-
escein (FITC)-labelled dUTP. The TUNEL assay was performed
for 1 h at 378C according to kit instructions (in situ cell death
detection—fluorescein, Roche). For negative controls, TdT
enzyme was omitted from the reactive solution. For positive
controls, sections were pre-incubated with recombinant
DNAse I (3 U ml21, Ambion) for 10 min at room temperature.
Treated sections were mounted with Prolong Gold Antifade
reagent with DAPI (Invitrogen) and observed on a wide-field
fluorescence microscope (Olympus XM10 slide scanner,
PT-BIOP, EPFL), using DAPI (Ex 377/50 nm, Em 440/40 nm)
and FITC filters (Ex 485/20 nm, Em 525/30 nm), at spatial
lateral resolution of approximately 0.3 mm. The proportion of
TUNEL-positive cell nuclei was calculated from acquired
images, using the counter cell plugin from IMAGEJ software. For
each life stage, three biological replicates were assessed, with
one to four sections imaged per replicate, and totals of 657 to
8219 nuclei counted per tissue type (depending on section
orientation).
( f ) Mitotic index and abundance of dinoflagellatesFor the endosymbiotic dinoflagellates, the mitotic index was cal-
culated as the ratio of the number of dinoflagellate doublets
(undergoing cytokinesis) to single dinoflagellate cells [14], in
toluidine blue-stained sections of three replicates for each life
stage (two to eight sections per replicate and 1200–2000 dinofla-
gellates counted per life stage). Results are presented as the
mean+1 s.d. of doublet-to-single dinoflagellate ratio, for three
biological replicates per life stage.
Dinoflagellate abundance (i.e. the number of symbiont nuclei
relative to coral cell nuclei within the gastrodermal host
tissue) was calculated using DAPI-stained nuclei counts pre-
viously obtained for assessment of the BrdU-labelling index
(electronic supplementary material, table SI). Results are
presented as mean+1 s.d. for three to five biological replicates
per life stage.
(g) Statistical analysesFluorescence images, acquired from BrdU and TUNEL assays in
semi-thin sections at three different depths in each replicate
sample, allow visualization of labelled or unlabelled nuclei
according to tissue type. The data follow a binomial distribution
with uneven variance and were statistically analysed using the
generalized linear model (GLM) using the binomial family and
logit link function in R software v. 3.2.0. Significance was
assessed at a ¼ 0.05 threshold p-value. Quantitative data for
BrdU and TUNEL labelling are presented as boxplots, also
reporting the means (as a cross) and outliers (detected outside
the 1.5� inter-quartile range). The CY3/DAPI signal intensity
ratio does not follow a normal distribution, as cells are not syn-
chronous and the quantity of BrdU incorporated into the DNA
is time-dependent (during the 24 h pulse, a cell ending the
S-phase will incorporate less BrdU than a cell that is just starting
DNA replication). Therefore, non-parametric Kruskal–Wallis
tests were used, followed by pairwise Wilcoxon’s test when
significant. For dinoflagellate mitotic index and abundance,
the normality of residues and homoscedasticity of data
allowed application of one-way ANOVA followed by Tukey
HSD tests.
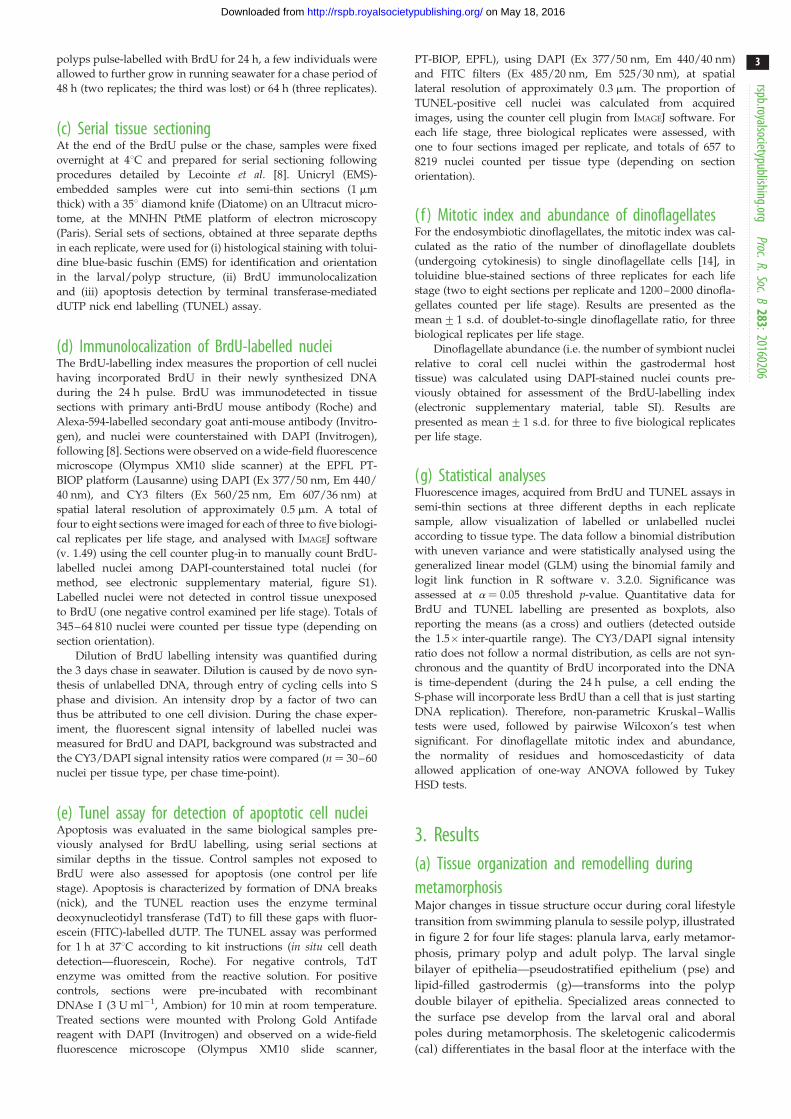
3. Results(a) Tissue organization and remodelling duringmetamorphosisMajor changes in tissue structure occur during coral lifestyle
transition from swimming planula to sessile polyp, illustrated
in figure 2 for four life stages: planula larva, early metamor-
phosis, primary polyp and adult polyp. The larval single
bilayer of epithelia—pseudostratified epithelium (pse) and
lipid-filled gastrodermis (g)—transforms into the polyp
double bilayer of epithelia. Specialized areas connected to
the surface pse develop from the larval oral and aboral
poles during metamorphosis. The skeletogenic calicodermis
(cal) differentiates in the basal floor at the interface with the
rspb.royalsocietypublishing.orgProc.R.Soc.B
283:20160206
3
on May 18, 2016http://rspb.royalsocietypublishing.org/Downloaded from
substrate, and the pharynx (ph) forms by inward invagina-
tion of the pse, just below the oral disc. Tentacles grow
upward from the oral disc (figure 1b; electronic supplemen-
tary material, figure S1; not visible in figure 2 in the
sections selected), but were not studied here because they
retracted upon fixation, and thus were hard to distinguish
from inner mesenterial bulbs (or cnidoglandular bands
[15]), which were therefore also not included in this study
(figure 1b).
The inner gastrodermis, lining the digestive cavity, forms
a continuous epithelium from oral to aboral pole in the larva,
and connects the oral disc with the basal floor in the
polyp (figures 1b and 2a–d). The gastrodermis contains intra-
cellular symbiotic dinoflagellates, which are more abundant
in oral compared with aboral areas (figure 1b). Mesenteries,
already present in this species at the planula stage, are
radial inward-growing tissue folds attached below the phar-
ynx and composed of gastrodermis and a thin layer of pse,
forming radial partitions of the gastric cavity. In the polyp,
these mesenteries connect the pharynx to the edges of the
basal floor (figure 1b and figure 2a–d).
(b) Coral cell proliferation and apoptosisThe spatial distribution of dividing cells, in the S phase of
DNA synthesis (and thus labelled with BrdU during
the 24 h pulse), is illustrated for each tissue structure and
developmental stage in figure 2e–h, and electronic sup-
plementary material, figure S1b–e, where BrdU is
immunodetected (in red) among the DAPI-counterstained
nuclei (in blue). Labelled nuclei were not detected in control
tissue unexposed to BrdU (data not shown). Cell proliferation
was found to be spatially and temporally highly hetero-
geneous, with scattered distribution of BrdU-positive nuclei,
at densities depending on cell type and coral life stage.
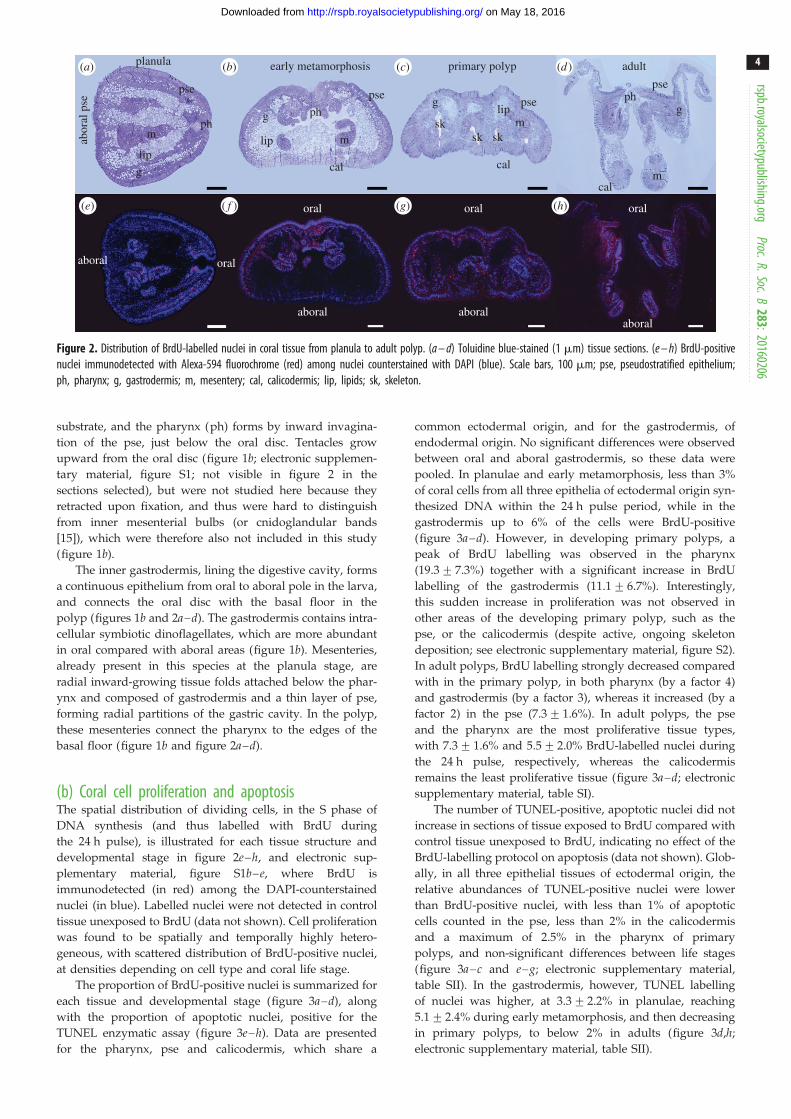
The proportion of BrdU-positive nuclei is summarized for
each tissue and developmental stage (figure 3a–d), along
with the proportion of apoptotic nuclei, positive for the
TUNEL enzymatic assay (figure 3e–h). Data are presented
for the pharynx, pse and calicodermis, which share a
common ectodermal origin, and for the gastrodermis, of
endodermal origin. No significant differences were observed
between oral and aboral gastrodermis, so these data were
pooled. In planulae and early metamorphosis, less than 3%
of coral cells from all three epithelia of ectodermal origin syn-
thesized DNA within the 24 h pulse period, while in the
gastrodermis up to 6% of the cells were BrdU-positive
(figure 3a–d). However, in developing primary polyps, a
peak of BrdU labelling was observed in the pharynx
(19.3+7.3%) together with a significant increase in BrdU
labelling of the gastrodermis (11.1+ 6.7%). Interestingly,
this sudden increase in proliferation was not observed in
other areas of the developing primary polyp, such as the
pse, or the calicodermis (despite active, ongoing skeleton
deposition; see electronic supplementary material, figure S2).
In adult polyps, BrdU labelling strongly decreased compared
with in the primary polyp, in both pharynx (by a factor 4)
and gastrodermis (by a factor 3), whereas it increased (by a
factor 2) in the pse (7.3+1.6%). In adult polyps, the pse
and the pharynx are the most proliferative tissue types,
with 7.3+ 1.6% and 5.5+2.0% BrdU-labelled nuclei during
the 24 h pulse, respectively, whereas the calicodermis
remains the least proliferative tissue (figure 3a–d; electronic
supplementary material, table SI).
The number of TUNEL-positive, apoptotic nuclei did not
increase in sections of tissue exposed to BrdU compared with
control tissue unexposed to BrdU, indicating no effect of the
BrdU-labelling protocol on apoptosis (data not shown). Glob-
ally, in all three epithelial tissues of ectodermal origin, the
relative abundances of TUNEL-positive nuclei were lower
than BrdU-positive nuclei, with less than 1% of apoptotic
cells counted in the pse, less than 2% in the calicodermis
and a maximum of 2.5% in the pharynx of primary
polyps, and non-significant differences between life stages
(figure 3a–c and e–g; electronic supplementary material,
table SII). In the gastrodermis, however, TUNEL labelling
of nuclei was higher, at 3.3+2.2% in planulae, reaching
5.1+2.4% during early metamorphosis, and then decreasing
in primary polyps, to below 2% in adults (figure 3d,h;
electronic supplementary material, table SII).
planula early metamorphosis primary polyp adultab
oral
pse
aboral
aboral
oral
oral
aboral
oral
aboral
oral
pse psepse
pse
ph sksk sk
cal cal
cal
phph
m m
m
mg
gg
g
liplip
lip
(b)(a) (c) (d )
(e) (g) (h)( f )
Figure 2. Distribution of BrdU-labelled nuclei in coral tissue from planula to adult polyp. (a – d) Toluidine blue-stained (1 mm) tissue sections. (e – h) BrdU-positivenuclei immunodetected with Alexa-594 fluorochrome (red) among nuclei counterstained with DAPI (blue). Scale bars, 100 mm; pse, pseudostratified epithelium;ph, pharynx; g, gastrodermis; m, mesentery; cal, calicodermis; lip, lipids; sk, skeleton.
rspb.royalsocietypublishing.orgProc.R.Soc.B
283:20160206
4
on May 18, 2016http://rspb.royalsocietypublishing.org/Downloaded from
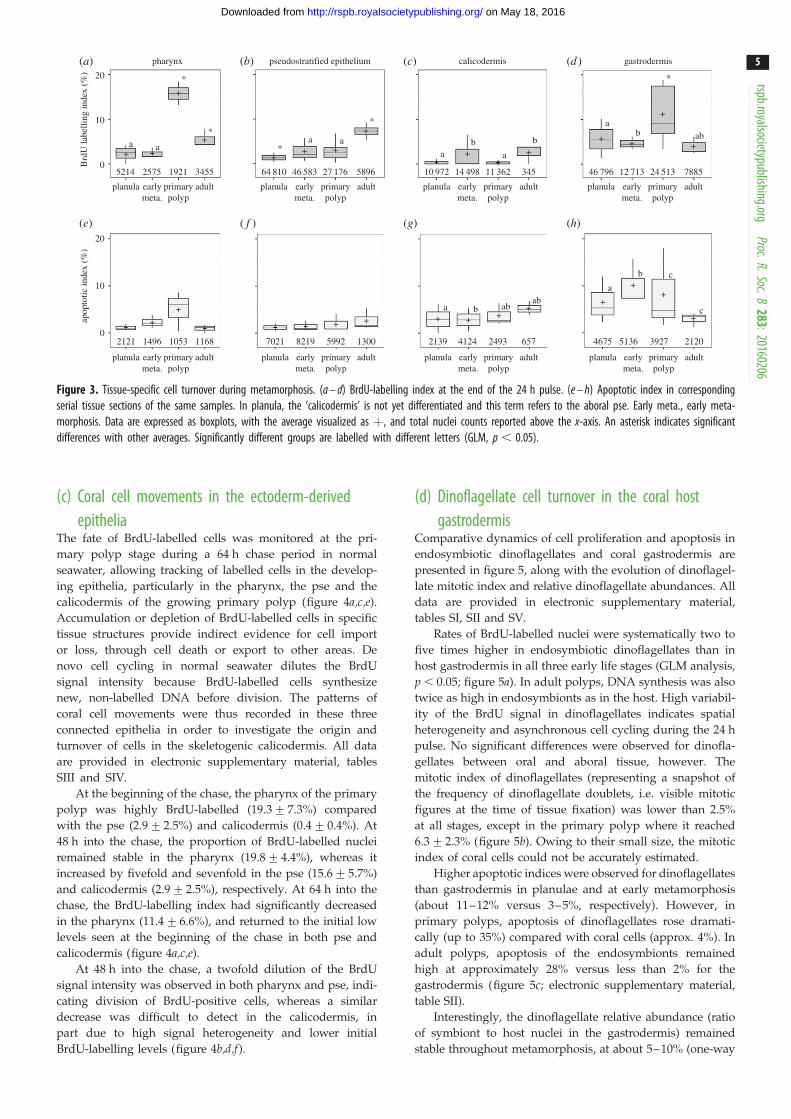
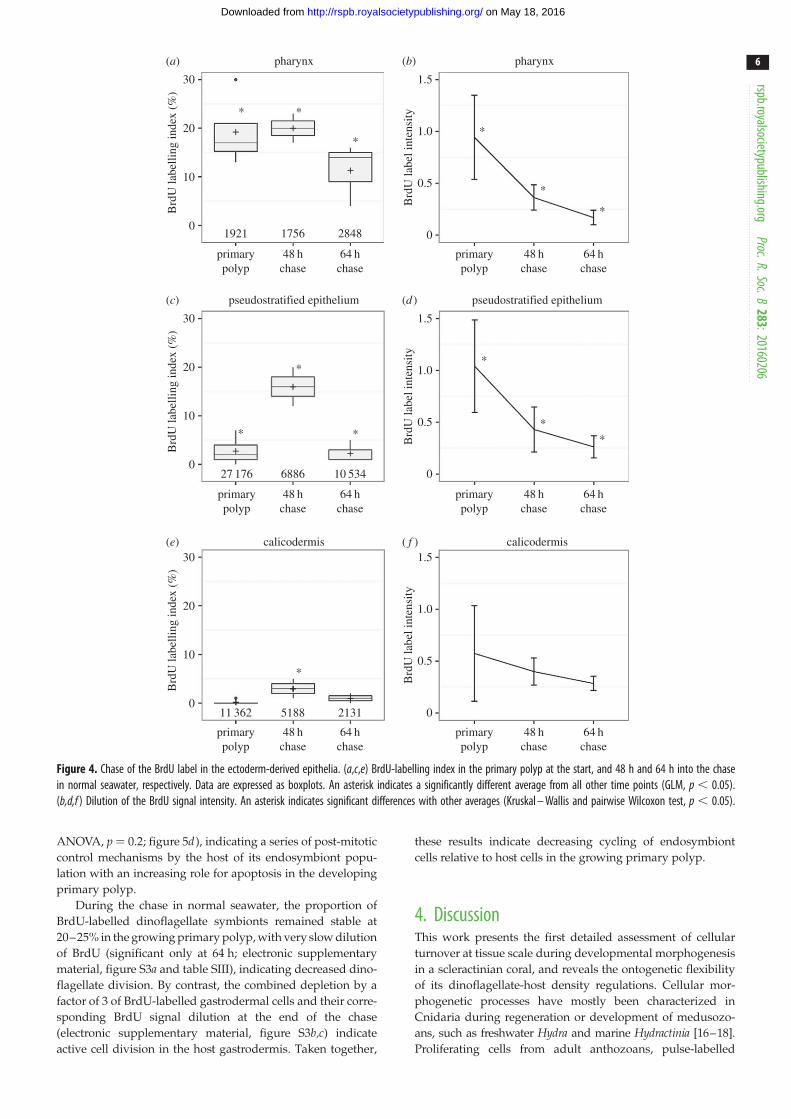
(c) Coral cell movements in the ectoderm-derivedepithelia
The fate of BrdU-labelled cells was monitored at the pri-
mary polyp stage during a 64 h chase period in normal
seawater, allowing tracking of labelled cells in the develop-
ing epithelia, particularly in the pharynx, the pse and the
calicodermis of the growing primary polyp (figure 4a,c,e).
Accumulation or depletion of BrdU-labelled cells in specific
tissue structures provide indirect evidence for cell import
or loss, through cell death or export to other areas. De
novo cell cycling in normal seawater dilutes the BrdU
signal intensity because BrdU-labelled cells synthesize
new, non-labelled DNA before division. The patterns of
coral cell movements were thus recorded in these three
connected epithelia in order to investigate the origin and
turnover of cells in the skeletogenic calicodermis. All data
are provided in electronic supplementary material, tables
SIII and SIV.
At the beginning of the chase, the pharynx of the primary
polyp was highly BrdU-labelled (19.3+ 7.3%) compared
with the pse (2.9+2.5%) and calicodermis (0.4+0.4%). At
48 h into the chase, the proportion of BrdU-labelled nuclei
remained stable in the pharynx (19.8+ 4.4%), whereas it
increased by fivefold and sevenfold in the pse (15.6+5.7%)
and calicodermis (2.9+ 2.5%), respectively. At 64 h into the
chase, the BrdU-labelling index had significantly decreased
in the pharynx (11.4+6.6%), and returned to the initial low
levels seen at the beginning of the chase in both pse and
calicodermis (figure 4a,c,e).
At 48 h into the chase, a twofold dilution of the BrdU
signal intensity was observed in both pharynx and pse, indi-
cating division of BrdU-positive cells, whereas a similar
decrease was difficult to detect in the calicodermis, in
part due to high signal heterogeneity and lower initial
BrdU-labelling levels (figure 4b,d,f ).
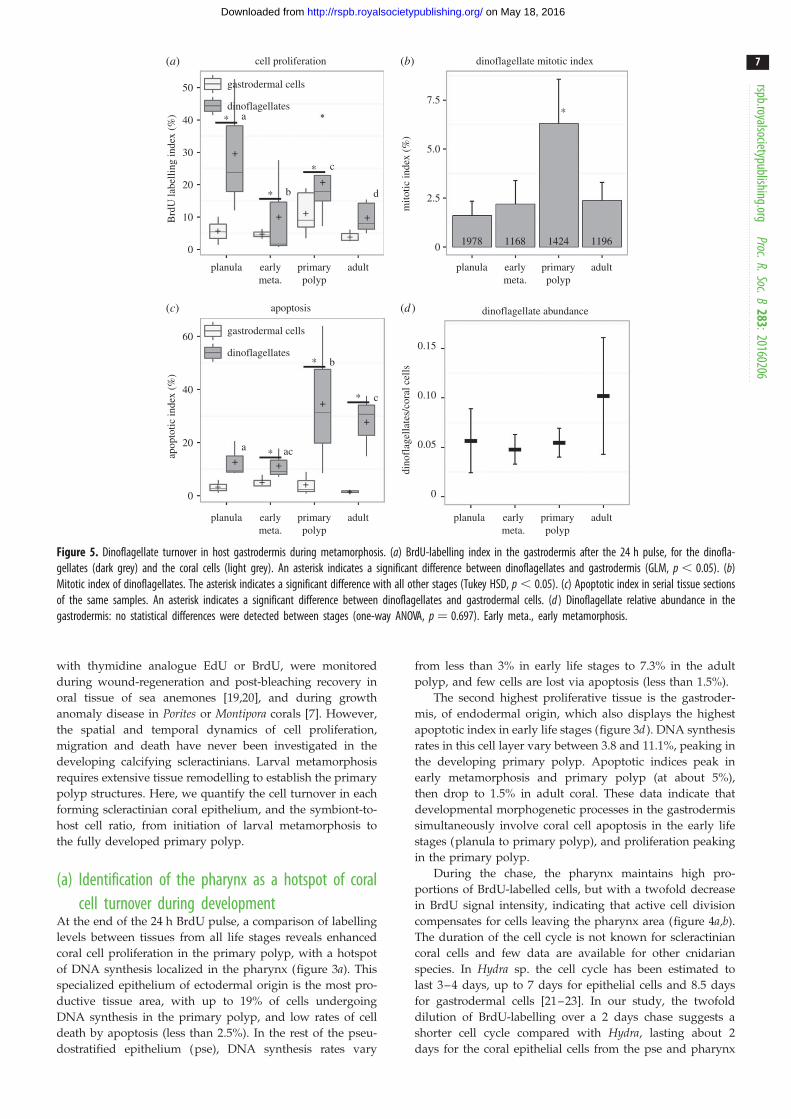
(d) Dinoflagellate cell turnover in the coral hostgastrodermis
Comparative dynamics of cell proliferation and apoptosis in
endosymbiotic dinoflagellates and coral gastrodermis are
presented in figure 5, along with the evolution of dinoflagel-
late mitotic index and relative dinoflagellate abundances. All
data are provided in electronic supplementary material,
tables SI, SII and SV.
Rates of BrdU-labelled nuclei were systematically two to
five times higher in endosymbiotic dinoflagellates than in
host gastrodermis in all three early life stages (GLM analysis,
p , 0.05; figure 5a). In adult polyps, DNA synthesis was also
twice as high in endosymbionts as in the host. High variabil-
ity of the BrdU signal in dinoflagellates indicates spatial
heterogeneity and asynchronous cell cycling during the 24 h
pulse. No significant differences were observed for dinofla-
gellates between oral and aboral tissue, however. The
mitotic index of dinoflagellates (representing a snapshot of
the frequency of dinoflagellate doublets, i.e. visible mitotic
figures at the time of tissue fixation) was lower than 2.5%
at all stages, except in the primary polyp where it reached
6.3+2.3% (figure 5b). Owing to their small size, the mitotic
index of coral cells could not be accurately estimated.
Higher apoptotic indices were observed for dinoflagellates
than gastrodermis in planulae and at early metamorphosis
(about 11–12% versus 3–5%, respectively). However, in
primary polyps, apoptosis of dinoflagellates rose dramati-
cally (up to 35%) compared with coral cells (approx. 4%). In
adult polyps, apoptosis of the endosymbionts remained
high at approximately 28% versus less than 2% for the
gastrodermis (figure 5c; electronic supplementary material,
table SII).
Interestingly, the dinoflagellate relative abundance (ratio
of symbiont to host nuclei in the gastrodermis) remained
stable throughout metamorphosis, at about 5–10% (one-way
20
pharynx pseudostratified epithelium calicodermis gastrodermis
10
Brd
U la
belli
ng in
dex
(%)
apop
totic
inde
x (%
)
0
20
10
0
planula earlymeta.
primarypolyp
adult planula earlymeta.
primarypolyp
adult planula earlymeta.
primarypolyp
adult planula earlymeta.
primarypolyp
adult
planula earlymeta.
primarypolyp
adult planula earlymeta.
primarypolyp
adult planula earlymeta.
primarypolyp
adult planula earlymeta.
primarypolyp
adult
a
*
*
*
*
+
+
+ + + ++
+
++
+++
+
+ + +
+
++
+
+ + +
+
*
a
a b abab
b c
a
c
a a
a a
b bb
aab
5214 2575 1921 3455
2121 1496 1053 1168 7021 8219 5992 1300 2139 4124 2493 657
64 810 46 583 27 176 5896 10 972 345 46 796 12 713 24 513 788511 36214 498
4675 5136 3927 2120
(e) (g) (h)( f )
(b)(a) (c) (d )
Figure 3. Tissue-specific cell turnover during metamorphosis. (a – d) BrdU-labelling index at the end of the 24 h pulse. (e – h) Apoptotic index in correspondingserial tissue sections of the same samples. In planula, the ‘calicodermis’ is not yet differentiated and this term refers to the aboral pse. Early meta., early meta-morphosis. Data are expressed as boxplots, with the average visualized as þ, and total nuclei counts reported above the x-axis. An asterisk indicates significantdifferences with other averages. Significantly different groups are labelled with different letters (GLM, p , 0.05).
rspb.royalsocietypublishing.orgProc.R.Soc.B
283:20160206
5
on May 18, 2016http://rspb.royalsocietypublishing.org/Downloaded from
ANOVA, p ¼ 0.2; figure 5d ), indicating a series of post-mitotic
control mechanisms by the host of its endosymbiont popu-
lation with an increasing role for apoptosis in the developing
primary polyp.
During the chase in normal seawater, the proportion of
BrdU-labelled dinoflagellate symbionts remained stable at
20–25% in the growing primary polyp, with very slow dilution
of BrdU (significant only at 64 h; electronic supplementary
material, figure S3a and table SIII), indicating decreased dino-
flagellate division. By contrast, the combined depletion by a
factor of 3 of BrdU-labelled gastrodermal cells and their corre-
sponding BrdU signal dilution at the end of the chase
(electronic supplementary material, figure S3b,c) indicate
active cell division in the host gastrodermis. Taken together,
these results indicate decreasing cycling of endosymbiont
cells relative to host cells in the growing primary polyp.
4. DiscussionThis work presents the first detailed assessment of cellular
turnover at tissue scale during developmental morphogenesis
in a scleractinian coral, and reveals the ontogenetic flexibility
of its dinoflagellate-host density regulations. Cellular mor-
phogenetic processes have mostly been characterized in
Cnidaria during regeneration or development of medusozo-
ans, such as freshwater Hydra and marine Hydractinia [16–18].
Proliferating cells from adult anthozoans, pulse-labelled
30
pharynx pharynx
pseudostratified epithelium pseudostratified epithelium
calicodermis calicodermis
1.5
1.0
0.5
0
20*
+ +
+
+
+
+
*
*
*
*
*
*
***
*
*
*
10
01921
primarypolyp
48 hchase
primarypolyp
48 hchase
64 hchase
64 hchase
primarypolyp
48 hchase
primarypolyp
48 hchase
64 hchase
64 hchase
primarypolyp
48 hchase
primarypolyp
48 hchase
64 hchase
64 hchase
1756 2848
27 176 6886 10 534
11 362 5188 2131
Brd
U la
belli
ng in
dex
(%)
30
20
10
0
Brd
U la
belli
ng in
dex
(%)
30
20
10
0
Brd
U la
belli
ng in
dex
(%)
Brd
U la
bel i
nten
sity
1.5
1.0
0.5
0
Brd
U la
bel i
nten
sity
1.5
1.0
0.5
0
Brd
U la
bel i
nten
sity
(e) ( f )
(b)(a)
(c) (d )
Figure 4. Chase of the BrdU label in the ectoderm-derived epithelia. (a,c,e) BrdU-labelling index in the primary polyp at the start, and 48 h and 64 h into the chasein normal seawater, respectively. Data are expressed as boxplots. An asterisk indicates a significantly different average from all other time points (GLM, p , 0.05).(b,d,f ) Dilution of the BrdU signal intensity. An asterisk indicates significant differences with other averages (Kruskal – Wallis and pairwise Wilcoxon test, p , 0.05).
rspb.royalsocietypublishing.orgProc.R.Soc.B
283:20160206
6
on May 18, 2016http://rspb.royalsocietypublishing.org/Downloaded from
with thymidine analogue EdU or BrdU, were monitored
during wound-regeneration and post-bleaching recovery in
oral tissue of sea anemones [19,20], and during growth
anomaly disease in Porites or Montipora corals [7]. However,
the spatial and temporal dynamics of cell proliferation,
migration and death have never been investigated in the
developing calcifying scleractinians. Larval metamorphosis
requires extensive tissue remodelling to establish the primary
polyp structures. Here, we quantify the cell turnover in each
forming scleractinian coral epithelium, and the symbiont-to-
host cell ratio, from initiation of larval metamorphosis to
the fully developed primary polyp.
(a) Identification of the pharynx as a hotspot of coralcell turnover during development
At the end of the 24 h BrdU pulse, a comparison of labelling
levels between tissues from all life stages reveals enhanced
coral cell proliferation in the primary polyp, with a hotspot
of DNA synthesis localized in the pharynx (figure 3a). This
specialized epithelium of ectodermal origin is the most pro-
ductive tissue area, with up to 19% of cells undergoing
DNA synthesis in the primary polyp, and low rates of cell
death by apoptosis (less than 2.5%). In the rest of the pseu-
dostratified epithelium (pse), DNA synthesis rates vary
from less than 3% in early life stages to 7.3% in the adult
polyp, and few cells are lost via apoptosis (less than 1.5%).
The second highest proliferative tissue is the gastroder-
mis, of endodermal origin, which also displays the highest
apoptotic index in early life stages (figure 3d ). DNA synthesis
rates in this cell layer vary between 3.8 and 11.1%, peaking in
the developing primary polyp. Apoptotic indices peak in
early metamorphosis and primary polyp (at about 5%),
then drop to 1.5% in adult coral. These data indicate that
developmental morphogenetic processes in the gastrodermis
simultaneously involve coral cell apoptosis in the early life
stages (planula to primary polyp), and proliferation peaking
in the primary polyp.
During the chase, the pharynx maintains high pro-
portions of BrdU-labelled cells, but with a twofold decrease
in BrdU signal intensity, indicating that active cell division
compensates for cells leaving the pharynx area (figure 4a,b).
The duration of the cell cycle is not known for scleractinian
coral cells and few data are available for other cnidarian
species. In Hydra sp. the cell cycle has been estimated to
last 3–4 days, up to 7 days for epithelial cells and 8.5 days
for gastrodermal cells [21–23]. In our study, the twofold
dilution of BrdU-labelling over a 2 days chase suggests a
shorter cell cycle compared with Hydra, lasting about 2
days for the coral epithelial cells from the pse and pharynx
50
40
30
Brd
U la
belli
ng in
dex
(%)
mito
tic in
dex
(%)
apop
totic
inde
x (%
)
20
10
7.5
5.0
2.5
1978 1168 1424 11960
dino
flag
ella
tes/
cora
l cel
ls
0.15
0.10
0.05
0
0
planula earlymeta.
primarypolyp
adult planula earlymeta.
primarypolyp
adult
planula earlymeta.
primarypolyp
adult planula earlymeta.
primarypolyp
adult
60
40
20
0
gastrodermal cells
cell proliferation dinoflagellate mitotic index
apoptosis dinoflagellate abundance
*dinoflagellates
gastrodermal cells
dinoflagellates
*
*
*
a
c
d
b*
*+
+ +
+++
*a ac
+
c
b
+
+ +
+ +
+
+
+
(b)(a)
(c) (d )
Figure 5. Dinoflagellate turnover in host gastrodermis during metamorphosis. (a) BrdU-labelling index in the gastrodermis after the 24 h pulse, for the dinofla-gellates (dark grey) and the coral cells (light grey). An asterisk indicates a significant difference between dinoflagellates and gastrodermis (GLM, p , 0.05). (b)Mitotic index of dinoflagellates. The asterisk indicates a significant difference with all other stages (Tukey HSD, p , 0.05). (c) Apoptotic index in serial tissue sectionsof the same samples. An asterisk indicates a significant difference between dinoflagellates and gastrodermal cells. (d ) Dinoflagellate relative abundance in thegastrodermis: no statistical differences were detected between stages (one-way ANOVA, p ¼ 0.697). Early meta., early metamorphosis.
rspb.royalsocietypublishing.orgProc.R.Soc.B
283:20160206
7
on May 18, 2016http://rspb.royalsocietypublishing.org/Downloaded from

areas. Further flow cytometry experiments would shed more
light on cell cycling times in scleractinian corals. In this study,
we show that BrdU-labelled cells accumulate in the pse of the
oral tissue and also in the calicodermis of the aboral tissue
(figure 4c–f ). Taken together, these results reveal cell move-
ments, migrating away from the pharynx to the pse and
calicodermis. Additional influx of cells to these tissue layers
from the gastrodermis is also possible, as this epithelium is
the second most proliferative tissue in the primary polyp.
These results are consistent with our earlier findings in
another scleractinian species, in which the pse (including
the pharynx area) was also observed to be the most prolifera-
tive tissue in adult polyps, followed by the gastrodermis [8].
Spatial patterns of cell division observed in S. pistillata are
similar to patterns reported for another anthozoan, the sea
anemone Nematostella vectensis, where scattered cell division
is observed along the entire body, with a hotspot of DNA
synthesis identified in the pharynx [19,24]. More restricted
proliferation patterns are present in hydrozoans. For example,
in the freshwater Hydra polyp, proliferating cells are restricted
to the body column, in which there is constant renewal of
cells and migration to the apical and basal end of the polyp
[16,22]. In the marine Clytia hemisphaerica, cell division of
interstitial i-cells occurs in the epithelium at the tentacle
base, from which cells migrate and differentiate into mature
nematocysts mounted at the tip of tentacles [25].
(b) Cells in the skeletogenic calicodermis are non-cycling despite rapid growth of early life stages
The calicodermis appears to be essentially a non-proliferative
epithelium (less than 2.5% of BrdU-positive cells), with non-
cycling, terminally differentiated cells that are, however,
actively producing skeleton (electronic supplementary
material, figure S2). Cellular control of the coral biominerali-
zation process has been proposed to involve highly localized
proliferation or metabolic activity in the calicodermis [26].
Here, we demonstrate that active skeletal accretion is not
associated with locally increased cellular proliferation in the
overlying calicodermis. Moreover, our chase results indicate
influx into the calicodermis of labelled cells from more prolif-
erative reservoirs, primarily the pharynx and gastrodermis of
the developing polyp. The exact migration pathway and
number of divisions, from precursor cell until differentiated
calicoblast, remains to be established. However, the BrdU
signal intensity in calicoblast nuclei during the chase is
lower by a factor of 2 to 4 compared with nuclei in more pro-
liferative areas, which suggests one to two divisions during
cell migration to the calicodermis. Correspondingly large
standard deviations of the BrdU signal intensity in the calico-
dermis (figure 4f ) indicate asynchronous cycling of the
incoming cells. Migration may occur via displacement of epi-
thelial cells in the pse, as in the Hydra body column [22], or
through the mesenteries that connect the pharynx to the
polyp basal floor [15,27].
The longevity of cells in quiescent calicodermis remains
unclear. The calicodermis of the developing primary polyp is
characterized by low rates of cell death via apoptosis (less
than 3% TUNEL-positive nuclei). However, the transient
accumulation, observed at 2 days into the chase, of BrdU-
labelled cells imported from more proliferative reservoirs is
followed by return to the initial low level at 64 h (figure 4c),
indicating cell loss via a pathway different from apoptotic cell
death. Future experiments with autophagy markers would
shed more light on these processes; autophagy is known to
be an important process in vertebrate development [28].
(c) Differential control of symbiont population by thehost cells, depending on life stage
Constant dinoflagellate-to-gastrodermal cell ratio during meta-
morphosis indicates that the symbiont population is controlled
by the host from the earliest life stages. In adult corals, it is
known that a steady-state symbiont/host cell ratio is main-
tained through processes involving inorganic nutrient
limitation (pre-mitotic control) and expulsion or cell death
(post-mitotic control via autophagy or apoptosis) [2,28,29].
The dinoflagellate-to-gastrodermal cell ratio we observed
through metamorphosis and development of S. pistillata was
in the range 0.05–0.10 (figure 5d), with high variability in
adult polyps reflecting high spatial heterogeneity of dinoflagel-
late abundance at colony level. This ratio is lower than the 0.15
ratio observed in adult Acropora millepora corals, but far above
the ratio of bleached corals (0.005) [30]. The mitotic index we
observed at all life stages is in agreement with values reported
in adult scleractinian corals, typically being around or slightly
below 5% [2]. However, the BrdU-labelling index was consist-
ently higher for dinoflagellates compared with coral host
(figure 5a), indicating that, early in development, the cell cycling
activity of the endosymbionts surpasses that of the host cells.
During our experiments, inorganic nutrient concentrations
in Eilat seawater were low, corresponding to an oligotrophic
environment, and thus could not be responsible for the
observed high Symbiodinium proliferation rates. The stability
of dinoflagellate-to-gastrodermal cell ratio (figure 5d), despite
higher DNA synthesis rates of endosymbionts (figure 5a),
implies host regulation via post-mitotic control mechanisms.
In planulae and during early metamorphosis, our results
show that apoptosis is not the main endosymbiont regulation
process, but that programmed cell death becomes essential
for symbiont density regulation in the primary polyp and, to
a lesser degree, in adult polyps (figure 5c). In planulae of S. pis-tillata, degradation of dinoflagellates has been reported [29] as
well as release of symbionts into the water column [9]. Auto-
phagy might also be involved in host regulation of the
dinoflagellate population at early life stages, as it is known to
be involved in adult coral bleaching [30]. Pre-mitotic control
by host of dinoflagellate proliferation may be established
only at the adult stage, when nutrient limitation and recycling
mechanisms in the coral holobiont become fully developed [2].
5. ConclusionThis study has clearly identified the pharynx and gastroder-
mis as the most proliferative areas in the developing
scleractinian polyp. Coral skeletal deposition does not
involve proliferation of cells in the calicodermis, even
during rapidly growing early life stages. Furthermore, our
observations reveal an ontogenic succession of post-mitotic
control mechanisms of the endosymbiotic dinoflagellate
population density during host early development.
Data accessibility. The supporting datasets are summarized in the elec-tronic supplementary material, tables SI–SV, and have beenuploaded in the Dryad repository under the accession numberhttp://dx.doi.org/10.5061/dryad.d9v45.
rspb.royalsocietypublishing.orgProc.R.Soc.B
283:20160206
8
on May 18, 2016http://rspb.royalsocietypublishing.org/Downloaded from

Authors’ contributions. A.L., I.D.-C. and A.M. designed the experiment. A.L.carried out the experiments. A.P. and A.L. statistically analysed the data.All authors contributed to drafting and editing the manuscript.
Competing interests. We have no competing interests.
Funding. A.L. was funded by ERC Advanced grant no. 246749 ‘BIO-CARB’ to A.M. Field labelling experiments, conducted at themarine station of the Inter-University Institute in Eilat, Israel, werefunded through European ASSEMBLE call 6 programme
CORALCELLPROLIF to I.D.-C., with additional grants from theMNHN programmes ATM ‘Biomineralizations’ and ‘Formes’.
Acknowledgements. The PT-BIOP platform at EPFL Lausanne is acknowl-edged for access to and help with fluorescence microscopy. The PtMEplatform at MNHN is acknowledged for access to microtomeand scanning electron microscope (electronic supplementarymaterial, figure S2). We thank Shakib Djediat and Nicolas Rabet fordiscussions and Morgane Buet for drawing figure 1.
References
1. Stolarski J, Kitahara MV, Miller DJ, Cairns SD, MazurM, Meibom A. 2011 The ancient evolutionaryorigins of Scleractinia revealed by azooxanthellatecorals. BMC Evol. Biol. 11, 316. (doi:10.1186/1471-2148-11-316)
2. Davy SK, Allemand D, Weis VM. 2012 Cell biology ofCnidarian-dinoflagellate symbiosis. Microbiol. Mol.Biol. Rev. 76, 229 – 261. (doi:10.1128/MMBR.05014-11)
3. Falkowski PG, Dubinsky Z, Muscatine L, McCloskey L.1993 Population control in symbiotic corals.BioScience 43, 606 – 611. (doi:10.2307/1312147)
4. Pernice M, Dunn SR, Miard T, Dufour S, Dove S,Hoegh-Guldberg O. 2011 Regulation of apoptoticmediators reveals dynamic responses to thermalstress in the reef building coral Acropora millepora.PLoS ONE 6, e16095. (doi:10.1371/journal.pone.0016095)
5. Kvitt H et al. 2015 Breakdown of coral colonial formunder reduced pH conditions is initiated in polypsand mediated through apoptosis. Proc. Natl Acad.Sci. USA 112, 2082 – 2086. (doi:10.1073/pnas.1419621112)
6. D’Angelo C, Smith EG, Oswald F, Burt J, Tchernov D,Wiedenmann J. 2012 Locally accelerated growth ispart of the innate immune response and repairmechanisms in reef-building corals as detected bygreen fluorescent protein (GFP)-like pigments. CoralReefs 31, 1045 – 1056. (doi:10.1007/s00338-012-0926-8)
7. Yasuda N, Hidaka M. 2012 Cellular kinetics ingrowth anomalies of the scleractinian corals Poritesaustraliensis and Montipora informis. Dis. Aquat.Organ. 102, 1 – 11. (doi:10.3354/dao02530)
8. Lecointe A, Cohen S, Geze M, Djediat C, Meibom A,Domart-Coulon I. 2013 Scleractinian coral cellproliferation is reduced in primary culture ofsuspended multicellular aggregates compared topolyps. Cytotechnology 65, 705 – 724. (doi:10.1007/s10616-013-9562-6)
9. Rinkevich B, Loya Y. 1979 The reproduction of theRed Sea coral Stylophora pistillata. II.Synchronization in breeding and seasonality ofplanulae shedding. Mar. Ecol. Prog. Ser. 1,145 – 152. (doi:10.3354/meps001145)
10. Vandermeulen JH, Watabe N. 1973 Studies on reefcorals. I. Skeleton formation by newly settled
planula larva of Pocillopora damicornis. Mar. Biol.23, 47 – 57. (doi:10.1007/BF00394111)
11. Gilis M, Meibom A, Domart-Coulon I, Grauby O,Stolarski J, Baronnet A. 2014 Biomineralization innewly settled recruits of the scleractinian coralPocillopora damicornis. J. Morphol. 275,1349 – 1365. (doi:10.1002/jmor.20307)
12. Byler KA, Carmi-Veal M, Fine M, Goulet TL. 2013Multiple symbiont acquisition strategies as anadaptive mechanism in the coral Stylophorapistillata. PLoS ONE 8, e59596. (doi:10.1371/journal.pone.0059596)
13. Santos SR, Toyoshima J, Kinzie RAIII. 2009 Spatialand temporal dynamics of symbiotic dinoflagellates(Symbiodinium: Dinophyta) in the perforate coralMontipora capitata. Galaxea J. Coral Reef Stud. 11,139 – 147. (doi:10.3755/galaxea.11.139)
14. Wilkerson FP, Kobayashi D, Muscatine L. 1988Mitotic index and size of symbiotic algae inCaribbean Reef corals. Coral Reefs 7, 29 – 36.(doi:10.1007/BF00301979)
15. Peters EC. 2016 Anatomy. In Diseases of coral (edsCM Woodley, CA Downs, AW Bruckner, JW Porter,SB Galloway), pp. 85 – 107. New York, NY: JohnWiley & Sons, Inc.
16. David CN, Campbell RD. 1972 Cell cycle kinetics anddevelopment of Hydra Attenuata I. Epithelial cells.J. Cell Sci. 11, 557 – 568.
17. Plickert G, Kroiher M, Munck A. 1988 Cellproliferation and early differentiation duringembryonic development and metamorphosis ofHydractinia echinata. Development 103, 795 – 803.
18. Chera S, Ghila L, Dobretz K, Wenger Y, Bauer C,Buzgariu W, Buzgariu W, Martinou J-C, Galliot B.2009 Apoptotic cells provide an unexpected sourceof Wnt3 signaling to drive Hydra head regeneration.Dev. Cell. 17, 279 – 289. (doi:10.1016/j.devcel.2009.07.014)
19. Passamaneck YJ, Martindale MQ. 2012 Cellproliferation is necessary for the regeneration of oralstructures in the anthozoan cnidarian Nematostellavectensis. BMC Dev. Biol. 12, 34. (doi:10.1186/1471-213X-12-34)
20. Fransolet D, Roberty S, Herman A-C, Tonk L, Hoegh-Guldberg O, Plumier J-C. 2013 Increased cellproliferation and mucocyte density in the seaanemone Aiptasia pallida recovering from bleaching.
PLoS ONE 8, e65015. (doi:10.1371/journal.pone.0065015)
21. Bosch TC, David CN. 1984 Growth regulation inHydra: relationship between epithelial cell cyclelength and growth rate. Dev. Biol. 104, 161 – 171.(doi:10.1016/0012-1606(84)90045-9)
22. Holstein TW, Hobmayer E, David CN. 1991 Pattern ofepithelial cell cycling in Hydra. Dev. Biol.148, 602 – 611. (doi:10.1016/0012-1606(91)90277-A)
23. Govindasamy N, Murthy S, Ghanekar Y. 2014 Slow-cycling stem cells in Hydra contribute to headregeneration. Biol Open 3, 1236 – 1244. (doi:10.1242/bio.201410512).
24. Singer II. 1971 Tentacular and oral-disc regenerationin the sea anemone, Aiptasia diaphana.3. Autoradiographic analysis of patterns of tritiatedthymidine uptake. J. Embryol. Exp. Morphol. 26,253 – 270.
25. Denker E, Manuel M, Leclere L, Le Guyader H, RabetN. 2008 Ordered progression of nematogenesis fromstem cells through differentiation stages in thetentacle bulb of Clytia hemisphaerica (Hydrozoa,Cnidaria). Dev. Biol. 315, 99 – 113. (doi:10.1016/j.ydbio.2007.12.023)
26. Tambutte E, Allemand D, Zoccola D, Meibom A,Lotto S, Caminiti N, Tambutte S. 2007 Observationsof the tissue-skeleton interface in the scleractiniancoral Stylophora pistillata. Coral Reefs 26, 517 – 529.(doi:10.1007/s00338-007-0263-5)
27. Seipel K, Schmid V. 2006 Mesodermal anatomies incnidarian polyps and medusae. Int. J. Dev. Biol. 50,589. (doi:10.1387/ijdb.062150ks)
28. Aburto MR, Hurle JM, Varela-Nieto I, Magarinos M.2012 Autophagy during vertebratedevelopment. Cells 1, 428 – 448. (doi:10.3390/cells1030428)
29. Titlyanov EA, Titlyanova TV, Loya Y, Yamazato K.1998 Degradation and proliferation of zooxanthellaein planulae of the hermatypic coral Stylophorapistillata. Mar. Biol. 130, 471 – 477. (doi:10.1007/s002270050267)
30. Dunn SR, Schnitzler CE, Weis VM. 2007 Apoptosisand autophagy as mechanisms of dinoflagellatesymbiont release during cnidarian bleaching: everywhich way you lose. Proc. R. Soc. B 274,3079 – 3085. (doi:10.1098/rspb.2007.0711)
rspb.royalsocietypublishing.orgProc.R.Soc.B
283:20160206
9
on May 18, 2016http://rspb.royalsocietypublishing.org/Downloaded from
Data Supplement - Lecointe et al 2016 prsb Published 18 May 2016.DOI: 10.1098/rspb.2016.0206
• Figure S1 - Imaging method for quantification of BrdU-labeled nuclei immunodetected in the
coral tissue layers. (A) Toluidine blue semi-thin section (1µm) of S. pistillata adult polyp. (B-E)
BrdU is detected with Alexa-594 (red) colocalized with DAPI-stained nuclei (blue) in (B) the
corresponding serial transverse section from the same adult polyp , (C) longitudinal section
from a primary polyp, oriented through the highly labeled pharynx area (cell layers are
outlined in white). (D-E) Magnified view highlighting in (D) the pharynx with (a) unlabeled
nuclei (b) BrdU-labeled nuclei, and in (E) the gastrodermis with (c) a dinoflagellate cell with
unlabeled nuclei (d) a dinoflagellate cell with BrdU labeled nuclei. t: tentacle, gc: gastric
cavity, pse: pseudostratified epithelium, og: oral gastrodermis, ag: aboral gastrodermis, cal:
calicodermis, sk: decalcified skeleton. Alexa-594 labeling which does not co-localize to nuclei
is considered an artefact (* in skeletal space)
• Figure S2 - Skeleton deposition during metamorphosis. (A) Scanning electron micrograph of
skeleton already deposited by Stylophora pistillata at the ‘early metamorphosis’ stage. (B)
Magnified view of a growing septa.
• Figure S3 - Chase of the BrdU labeling in the gastrodermis (A) BrdU-labeling index in the
primary polyp at the start, 48 h, and 64 h into the chase in normal seawater. Data are
expressed as boxplots (c.f. M&M in main text) for the dinoflagellates (dark gray) and the
gastrodermal coral cells (light gray). A star indicates statistical difference between
gastrodermal cells and dinoflagellates (glm, p-value<0.05). (B) Dilution of BrdU signal
intensity for the gastrodermal coral cells and (C) for the dinoflagellates. A star indicates a
statistical difference between two consecutive time points (Kruskal-Wallis and pairwise
Wilcoxon test, p-value<0.05
• Supplementary data tables I, II, II, IV, V - Detailed data for each end point assay.
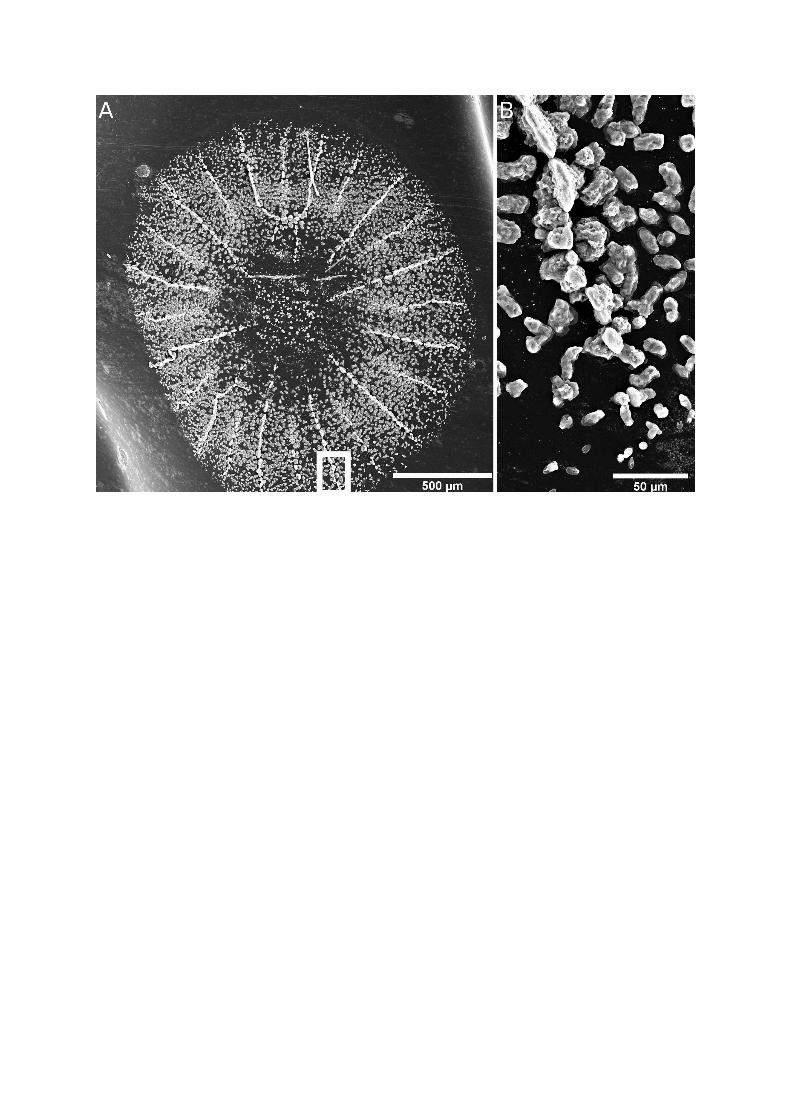
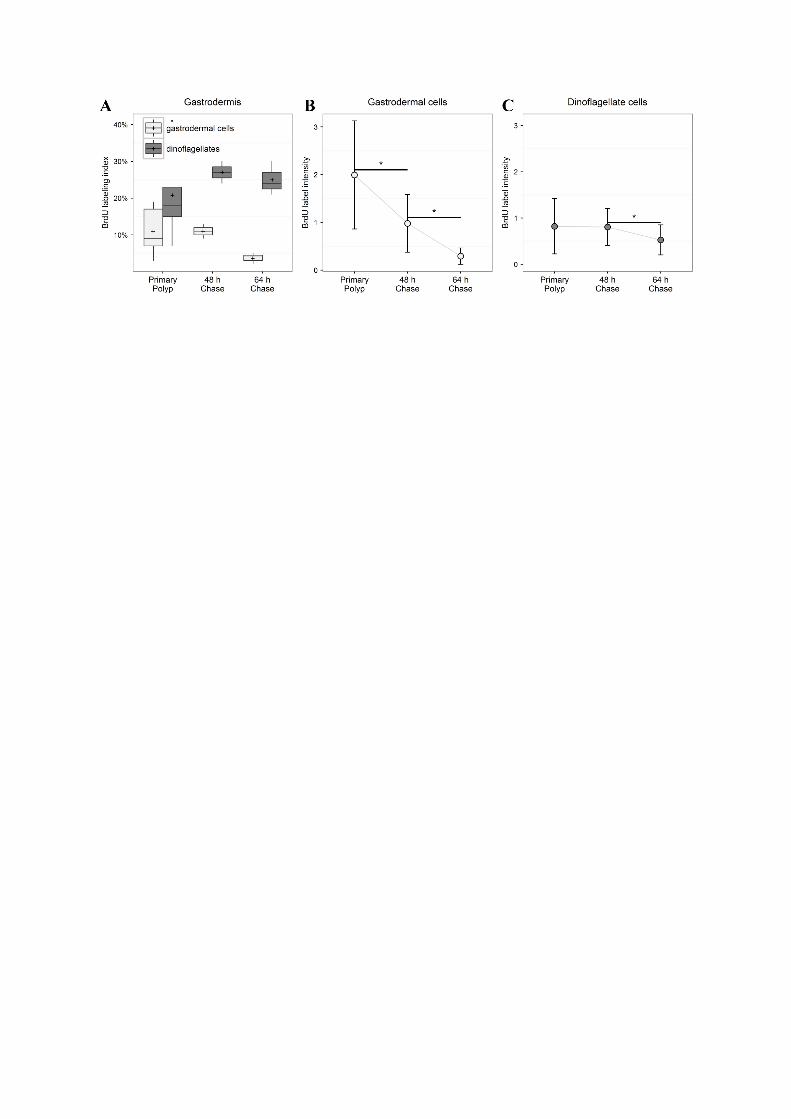
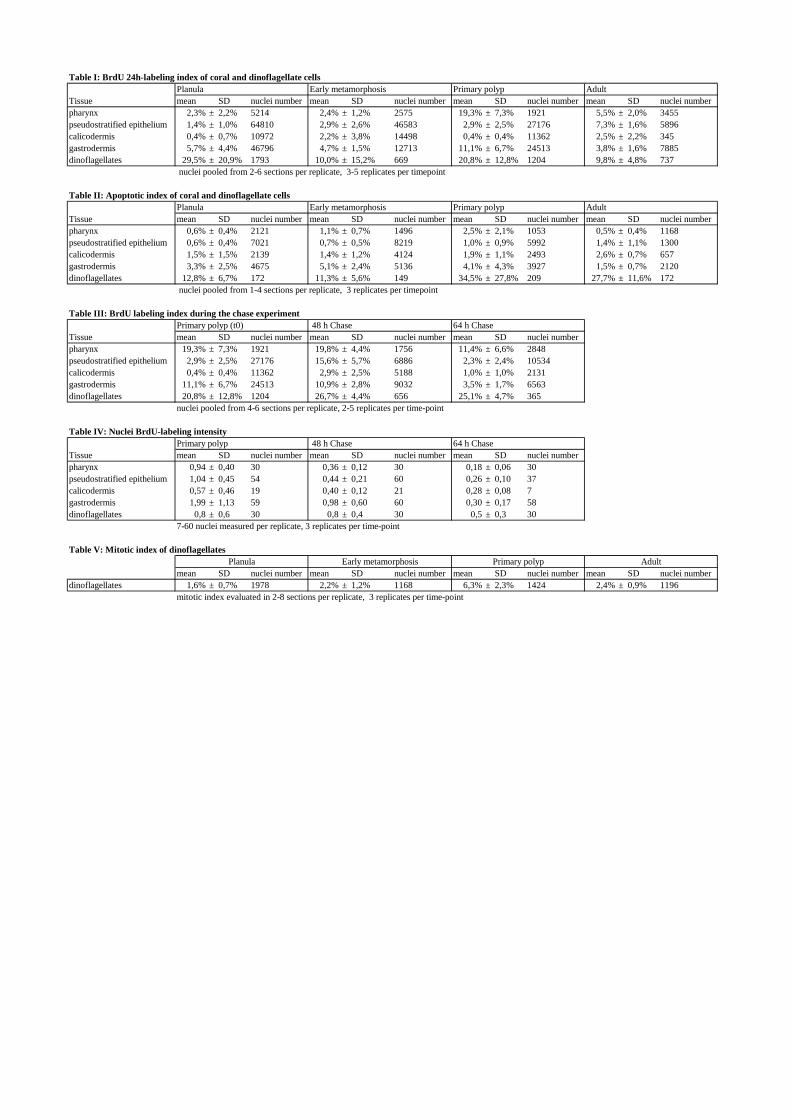
Table I: BrdU 24h-labeling index of coral and dinoflagellate cells
Tissue mean SD nuclei number mean SD nuclei number mean SD nuclei number mean SD nuclei numberpharynx 2,3% ± 2,2% 5214 2,4% ± 1,2% 2575 19,3% ± 7,3% 1921 5,5%± 2,0% 3455pseudostratified epithelium 1,4% ± 1,0% 64810 2,9% ± 2,6% 46583 2,9% ± 2,5% 27176 7,3% ± 1,6% 5896calicodermis 0,4% ± 0,7% 10972 2,2% ± 3,8% 14498 0,4% ± 0,4% 11362 2,5% ± 2,2% 345gastrodermis 5,7% ± 4,4% 46796 4,7% ± 1,5% 12713 11,1% ± 6,7% 24513 3,8% ± 1,6% 7885dinoflagellates 29,5% ± 20,9% 1793 10,0% ± 15,2% 669 20,8% ± 12,8% 1204 9,8% ± 4,8% 737
nuclei pooled from 2-6 sections per replicate, 3-5 replicates per timepoint
Table II: Apoptotic index of coral and dinoflagellate cells
Tissue mean SD nuclei number mean SD nuclei number mean SD nuclei number mean SD nuclei numberpharynx 0,6% ± 0,4% 2121 1,1% ± 0,7% 1496 2,5% ± 2,1% 1053 0,5% ±0,4% 1168pseudostratified epithelium 0,6% ± 0,4% 7021 0,7% ± 0,5% 8219 1,0% ± 0,9% 5992 1,4% ± 1,1% 1300calicodermis 1,5% ± 1,5% 2139 1,4% ± 1,2% 4124 1,9% ± 1,1% 2493 2,6% ± 0,7% 657gastrodermis 3,3% ± 2,5% 4675 5,1% ± 2,4% 5136 4,1% ± 4,3% 3927 1,5% ± 0,7% 2120dinoflagellates 12,8% ± 6,7% 172 11,3% ± 5,6% 149 34,5% ± 27,8% 209 27,7% ± 11,6% 172
nuclei pooled from 1-4 sections per replicate, 3 replicates per timepoint
Table III: BrdU labeling index during the chase experimentPrimary polyp (t0) 48 h Chase 64 h Chase
Tissue mean SD nuclei number mean SD nuclei number mean SD nuclei numberpharynx 19,3% ± 7,3% 1921 19,8% ± 4,4% 1756 11,4% ± 6,6% 2848pseudostratified epithelium 2,9% ± 2,5% 27176 15,6% ± 5,7% 6886 2,3% ± 2,4% 10534calicodermis 0,4% ± 0,4% 11362 2,9% ± 2,5% 5188 1,0% ± 1,0% 2131gastrodermis 11,1% ± 6,7% 24513 10,9% ± 2,8% 9032 3,5% ± 1,7% 6563dinoflagellates 20,8% ± 12,8% 1204 26,7% ± 4,4% 656 25,1% ± 4,7% 365
nuclei pooled from 4-6 sections per replicate, 2-5 replicates per time-point
Table IV: Nuclei BrdU-labeling intensityPrimary polyp 48 h Chase 64 h Chase
Tissue mean SD nuclei number mean SD nuclei number mean SD nuclei numberpharynx 0,94 ± 0,40 30 0,36 ± 0,12 30 0,18 ± 0,06 30pseudostratified epithelium 1,04 ± 0,45 54 0,44 ± 0,21 60 0,26 ± 0,10 37calicodermis 0,57 ± 0,46 19 0,40 ± 0,12 21 0,28 ± 0,08 7gastrodermis 1,99 ± 1,13 59 0,98 ± 0,60 60 0,30 ± 0,17 58dinoflagellates 0,8 ± 0,6 30 0,8 ± 0,4 30 0,5 ± 0,3 30
7-60 nuclei measured per replicate, 3 replicates per time-point
Table V: Mitotic index of dinoflagellates
mean SD nuclei number mean SD nuclei number mean SD nuclei number mean SD nuclei numberdinoflagellates 1,6% ± 0,7% 1978 2,2% ± 1,2% 1168 6,3% ± 2,3% 1424 2,4% ± 0,9% 1196
mitotic index evaluated in 2-8 sections per replicate, 3 replicates per time-point
Planula Early metamorphosis Primary polyp Adult
Planula Early metamorphosis Primary polyp Adult
Planula Early metamorphosis Primary polyp Adult