CD8 functionally distinct subset developmentally MAIT cell ... · 11/14/2018 · Joana Diasa,...
10
The CD4 - CD8 - MAIT cell subpopulation is a functionally distinct subset developmentally related to the main CD8 + MAIT cell pool Joana Dias a , Caroline Boulouis a,1 , Jean-Baptiste Gorin a,1 , Robin H. G. A. van den Biggelaar a,b,1 , Kerri G. Lal a,c,d , Anna Gibbs e , Liyen Loh f,g , Muhammad Yaaseen Gulam h , Wan Rong Sia h , Sudipto Bari i , William Y. K. Hwang i,j,k , Douglas F. Nixon f,l , Son Nguyen m , Michael R. Betts m , Marcus Buggert a,m , Michael A. Eller c,d , Kristina Broliden e , Annelie Tjernlund e , Johan K. Sandberg a,2,3 , and Edwin Leeansyah a,h,2,3 a Department of Medicine, Center for Infectious Medicine, Karolinska Institutet, Karolinska University Hospital Huddinge, 14186 Stockholm, Sweden; b Department of Infectious Diseases and Immunology, Universiteit Utrecht, 3584CL Utrecht, The Netherlands; c US Military HIV Research Program, Walter Reed Army Institute of Research, Silver Spring, MD 20910; d Department of Retrovirology, Henry M. Jackson Foundation for the Advancement of Military Medicine, Bethesda, MD 20817; e Unit of Infectious Diseases, Department of Medicine Solna, Center for Molecular Medicine, Karolinska Institutet, Karolinska University Hospital Solna, 171 76 Stockholm, Sweden; f Division of Experimental Medicine, Department of Medicine, University of California, San Francisco, CA 94110; g Department of Microbiology and Immunology, University of Melbourne, Parkville, VIC 3010, Australia; h Program in Emerging Infectious Diseases, Duke-National University of Singapore Medical School, 169587 Singapore; i Department of Hematology, Singapore General Hospital, 169608 Singapore; j Division of Medical Sciences, National Cancer Centre Singapore, 16910 Singapore; k Program in Cancer and Stem Cell Biology, Duke-National University of Singapore Medical School, 16958 Singapore; l Department of Microbiology, Immunology, and Tropical Medicine, George Washington University, Washington, DC 20052; and m Department of Microbiology, Perelman School of Medicine, University of Pennsylvania, Philadelphia, PA 19104 Edited by Philippa Marrack, National Jewish Health, Denver, CO, and approved October 19, 2018 (received for review July 17, 2018) Mucosa-associated invariant T (MAIT) cells are unconventional innate-like T cells that recognize microbial riboflavin metabolites presented by the MHC class I-like protein MR1. Human MAIT cells predominantly express the CD8α coreceptor (CD8 + ), with a smaller subset lacking both CD4 and CD8 (double-negative, DN). However, it is unclear if these two MAIT cell subpopulations distinguished by CD8α represent functionally distinct subsets. Here, we show that the two MAIT cell subsets express divergent transcriptional programs and distinct patterns of classic T cell transcription factors. Further- more, CD8 + MAIT cells have higher levels of receptors for IL-12 and IL-18, as well as of the activating receptors CD2, CD9, and NKG2D, and display superior functionality following stimulation with riboflavin-autotrophic as well as riboflavin-auxotrophic bacterial strains. DN MAIT cells display higher RORγt/T-bet ratio, and express less IFN-γ and more IL-17. Furthermore, the DN subset displays en- richment of an apoptosis gene signature and higher propensity for activation-induced apoptosis. During development in human fetal tissues, DN MAIT cells are more mature and accumulate over gesta- tional time with reciprocal contraction of the CD8 + subset. Analysis of the T cell receptor repertoire reveals higher diversity in CD8 + MAIT cells than in DN MAIT cells. Finally, chronic T cell receptor stim- ulation of CD8 + MAIT cells in an in vitro culture system supports the accumulation and maintenance of the DN subpopulation. These find- ings define human CD8 + and DN MAIT cells as functionally distinct subsets and indicate a derivative developmental relationship. MAIT cells | MR1 | CD8 | apoptosis | functional heterogeneity H uman mucosa-associated invariant T (MAIT) cells are un- conventional T cells defined by their semi-invariant T cell receptor (TCR) containing the invariant Vα7.2 segment coupled with Jα12, 20, or 33, and limited β-chain diversity (1–5). MAIT cells are highly abundant in peripheral blood, mucosal tissues, and the liver (5–7). They express high levels of the NK cell-associated re- ceptors CD161 and IL-18Rα, and tissue-homing chemokine re- ceptors including CCR5, CCR6, CXCR6, as well as α4β7 (5–9). MAIT cells recognize antigens derived from the riboflavin bio- synthetic pathway produced by a wide range of microbes and pre- sented by the MHC class-I related (MR1) protein (10, 11). Following activation, MAIT cells rapidly produce cytokines—in- cluding IFN-γ, TNF, IL-17, and IL-22 (6, 9, 12, 13)—and mediate cytolytic activity against infected cells (14–16), leading to the con- trol of various bacterial infections in the settings of human in- fectious diseases and in animal models (reviewed in ref. 17). Innate cytokines, such as IL-12 and IL-18, can activate some functions in MAIT cells in an MR1-independent fashion (18, 19), and enhance MAIT cells’ TCR-dependent activation (20, 21). MR1-independent responses are likely important for the involvement of MAIT cells in viral infections (22–28), and in diseases driven by aberrant cytokine release caused by bacterial exotoxins (29, 30). MAIT cells develop in the thymus, positively selected by MR1- expressing CD4 + CD8 + (double-positive, DP) thymocytes (5, 7, Significance Mucosa-associated invariant T (MAIT) cells are unconventional innate-like T cells recognizing microbial riboflavin metabolites presented by the monomorphic MR1 molecule. Here, we show that the CD8 + CD4 - and CD8 - CD4 - subpopulations of human MAIT cells represent transcriptionally and phenotypically discrete subsets with distinct functional profiles. Furthermore, T cell re- ceptor repertoire analysis, as well as MAIT cell data based on human fetal tissues, umbilical cord blood, and culture systems indicate that the CD8 - CD4 - subset may derive from the main CD8 + CD4 - MAIT cell pool. Thus, MAIT cells, a major antimicrobial effector T cell population in humans, segregate into two func- tionally distinct but developmentally related subsets separated by the expression of CD8. This functional difference may have significant implications in infectious and inflammatory diseases. Author contributions: J.D., J.K.S., and E.L. designed research; J.D., C.B., J.-B.G., R.H.G.A.v.d.B., K.G.L., A.G., L.L., M.Y.G., W.R.S., S.B., S.N., M.B., and E.L. performed research; S.B., W.Y.K.H., D.F.N., M.R.B., M.A.E., K.B., and A.T. contributed new reagents/analytic tools; J.D., C.B., J.-B.G., R.H.G.A.v.d.B., K.G.L., S.N., M.B., and E.L. analyzed data; W.Y.K.H., D.F.N., M.R.B., M.A.E., K.B., A.T., J.K.S., and E.L. supervised the work; and J.D., J.K.S., and E.L. wrote the paper. The authors declare no conflict of interest. This article is a PNAS Direct Submission. This open access article is distributed under Creative Commons Attribution-NonCommercial- NoDerivatives License 4.0 (CC BY-NC-ND). Data deposition: The data reported in this paper have been deposited in the Gene Ex- pression Omnibus (GEO) database, https://www.ncbi.nlm.nih.gov/geo (accession no. GSE120847). 1 C.B., J.-B.G., and R.H.G.A.v.d.B. contributed equally to this work. 2 J.K.S. and E.L. contributed equally to this work. 3 To whom correspondence may be addressed. Email: [email protected] or edwin. [email protected]. This article contains supporting information online at www.pnas.org/lookup/suppl/doi:10. 1073/pnas.1812273115/-/DCSupplemental. www.pnas.org/cgi/doi/10.1073/pnas.1812273115 PNAS Latest Articles | 1 of 10 IMMUNOLOGY AND INFLAMMATION
Transcript of CD8 functionally distinct subset developmentally MAIT cell ... · 11/14/2018 · Joana Diasa,...

The CD4−CD8− MAIT cell subpopulation is afunctionally distinct subset developmentallyrelated to the main CD8+ MAIT cell poolJoana Diasa, Caroline Boulouisa,1, Jean-Baptiste Gorina,1, Robin H. G. A. van den Biggelaara,b,1, Kerri G. Lala,c,d,Anna Gibbse, Liyen Lohf,g, Muhammad Yaaseen Gulamh, Wan Rong Siah, Sudipto Barii, William Y. K. Hwangi,j,k,Douglas F. Nixonf,l, Son Nguyenm, Michael R. Bettsm, Marcus Buggerta,m, Michael A. Ellerc,d, Kristina Brolidene,Annelie Tjernlunde, Johan K. Sandberga,2,3, and Edwin Leeansyaha,h,2,3
aDepartment of Medicine, Center for Infectious Medicine, Karolinska Institutet, Karolinska University Hospital Huddinge, 14186 Stockholm, Sweden;bDepartment of Infectious Diseases and Immunology, Universiteit Utrecht, 3584CL Utrecht, The Netherlands; cUS Military HIV Research Program, WalterReed Army Institute of Research, Silver Spring, MD 20910; dDepartment of Retrovirology, Henry M. Jackson Foundation for the Advancement of MilitaryMedicine, Bethesda, MD 20817; eUnit of Infectious Diseases, Department of Medicine Solna, Center for Molecular Medicine, Karolinska Institutet, KarolinskaUniversity Hospital Solna, 171 76 Stockholm, Sweden; fDivision of Experimental Medicine, Department of Medicine, University of California, San Francisco,CA 94110; gDepartment of Microbiology and Immunology, University of Melbourne, Parkville, VIC 3010, Australia; hProgram in Emerging InfectiousDiseases, Duke-National University of Singapore Medical School, 169587 Singapore; iDepartment of Hematology, Singapore General Hospital, 169608Singapore; jDivision of Medical Sciences, National Cancer Centre Singapore, 16910 Singapore; kProgram in Cancer and Stem Cell Biology, Duke-NationalUniversity of Singapore Medical School, 16958 Singapore; lDepartment of Microbiology, Immunology, and Tropical Medicine, George WashingtonUniversity, Washington, DC 20052; and mDepartment of Microbiology, Perelman School of Medicine, University of Pennsylvania, Philadelphia, PA 19104
Edited by Philippa Marrack, National Jewish Health, Denver, CO, and approved October 19, 2018 (received for review July 17, 2018)
Mucosa-associated invariant T (MAIT) cells are unconventionalinnate-like T cells that recognize microbial riboflavin metabolitespresented by the MHC class I-like protein MR1. Human MAIT cellspredominantly express the CD8α coreceptor (CD8+), with a smallersubset lacking both CD4 and CD8 (double-negative, DN). However, itis unclear if these two MAIT cell subpopulations distinguished byCD8α represent functionally distinct subsets. Here, we show thatthe twoMAIT cell subsets express divergent transcriptional programsand distinct patterns of classic T cell transcription factors. Further-more, CD8+ MAIT cells have higher levels of receptors for IL-12 andIL-18, as well as of the activating receptors CD2, CD9, and NKG2D,and display superior functionality following stimulation withriboflavin-autotrophic as well as riboflavin-auxotrophic bacterialstrains. DN MAIT cells display higher RORγt/T-bet ratio, and expressless IFN-γ and more IL-17. Furthermore, the DN subset displays en-richment of an apoptosis gene signature and higher propensity foractivation-induced apoptosis. During development in human fetaltissues, DN MAIT cells are more mature and accumulate over gesta-tional time with reciprocal contraction of the CD8+ subset. Analysisof the T cell receptor repertoire reveals higher diversity in CD8+
MAIT cells than in DN MAIT cells. Finally, chronic T cell receptor stim-ulation of CD8+ MAIT cells in an in vitro culture system supports theaccumulation and maintenance of the DN subpopulation. These find-ings define human CD8+ and DN MAIT cells as functionally distinctsubsets and indicate a derivative developmental relationship.
MAIT cells | MR1 | CD8 | apoptosis | functional heterogeneity
Human mucosa-associated invariant T (MAIT) cells are un-conventional T cells defined by their semi-invariant T cell
receptor (TCR) containing the invariant Vα7.2 segment coupledwith Jα12, 20, or 33, and limited β-chain diversity (1–5). MAIT cellsare highly abundant in peripheral blood, mucosal tissues, and theliver (5–7). They express high levels of the NK cell-associated re-ceptors CD161 and IL-18Rα, and tissue-homing chemokine re-ceptors including CCR5, CCR6, CXCR6, as well as α4β7 (5–9).MAIT cells recognize antigens derived from the riboflavin bio-synthetic pathway produced by a wide range of microbes and pre-sented by the MHC class-I related (MR1) protein (10, 11).Following activation, MAIT cells rapidly produce cytokines—in-cluding IFN-γ, TNF, IL-17, and IL-22 (6, 9, 12, 13)—and mediatecytolytic activity against infected cells (14–16), leading to the con-trol of various bacterial infections in the settings of human in-fectious diseases and in animal models (reviewed in ref. 17). Innate
cytokines, such as IL-12 and IL-18, can activate some functions inMAIT cells in an MR1-independent fashion (18, 19), and enhanceMAIT cells’ TCR-dependent activation (20, 21). MR1-independentresponses are likely important for the involvement of MAIT cells inviral infections (22–28), and in diseases driven by aberrant cytokinerelease caused by bacterial exotoxins (29, 30).MAIT cells develop in the thymus, positively selected by MR1-
expressing CD4+CD8+ (double-positive, DP) thymocytes (5, 7,
Significance
Mucosa-associated invariant T (MAIT) cells are unconventionalinnate-like T cells recognizing microbial riboflavin metabolitespresented by the monomorphic MR1 molecule. Here, we showthat the CD8+CD4− and CD8−CD4− subpopulations of humanMAIT cells represent transcriptionally and phenotypically discretesubsets with distinct functional profiles. Furthermore, T cell re-ceptor repertoire analysis, as well as MAIT cell data based onhuman fetal tissues, umbilical cord blood, and culture systemsindicate that the CD8−CD4− subset may derive from the mainCD8+CD4− MAIT cell pool. Thus, MAIT cells, a major antimicrobialeffector T cell population in humans, segregate into two func-tionally distinct but developmentally related subsets separatedby the expression of CD8. This functional difference may havesignificant implications in infectious and inflammatory diseases.
Author contributions: J.D., J.K.S., and E.L. designed research; J.D., C.B., J.-B.G., R.H.G.A.v.d.B.,K.G.L., A.G., L.L., M.Y.G., W.R.S., S.B., S.N., M.B., and E.L. performed research; S.B., W.Y.K.H.,D.F.N., M.R.B., M.A.E., K.B., and A.T. contributed new reagents/analytic tools; J.D., C.B., J.-B.G.,R.H.G.A.v.d.B., K.G.L., S.N., M.B., and E.L. analyzed data; W.Y.K.H., D.F.N., M.R.B., M.A.E., K.B.,A.T., J.K.S., and E.L. supervised the work; and J.D., J.K.S., and E.L. wrote the paper.
The authors declare no conflict of interest.
This article is a PNAS Direct Submission.
This open access article is distributed under Creative Commons Attribution-NonCommercial-NoDerivatives License 4.0 (CC BY-NC-ND).
Data deposition: The data reported in this paper have been deposited in the Gene Ex-pression Omnibus (GEO) database, https://www.ncbi.nlm.nih.gov/geo (accession no.GSE120847).1C.B., J.-B.G., and R.H.G.A.v.d.B. contributed equally to this work.2J.K.S. and E.L. contributed equally to this work.3To whom correspondence may be addressed. Email: [email protected] or [email protected].
This article contains supporting information online at www.pnas.org/lookup/suppl/doi:10.1073/pnas.1812273115/-/DCSupplemental.
www.pnas.org/cgi/doi/10.1073/pnas.1812273115 PNAS Latest Articles | 1 of 10
IMMUNOLO
GYAND
INFLAMMATION
31, 32). In the thymus of both mice and humans, three stages ofMAIT cells have been identified: stage 1 cells, predominantly DPand CD4+CD8− (CD4+); stage 2 cells, predominantly DP, CD4+,and CD4−CD8+ (CD8+); and stage 3 cells, predominantly CD8+ andCD4−CD8− [double negative (DN)], and less abundant than theother two stages (33). In the circulation of healthy adults, MAIT cellsare predominantly CD8+ with a smaller DN subset (4, 7, 33). Thus,the DN MAIT cells are relatively rare in the thymus but moreabundant in the peripheral blood of healthy adults. There is currentlya paucity of information concerning the immunobiology of the CD8+
and DN MAIT cell subsets. Here, we investigated in detail thephenotypic, transcriptional, and functional differences between CD8+
and DN MAIT cells using human samples from peripheral blood,mucosal tissues, and fetal tissues. Our data indicate that the CD8+
and DN MAIT cells represent functionally distinct subsets, and sug-gest that DN MAIT cells may be derived from the main CD8+
MAIT cell pool.
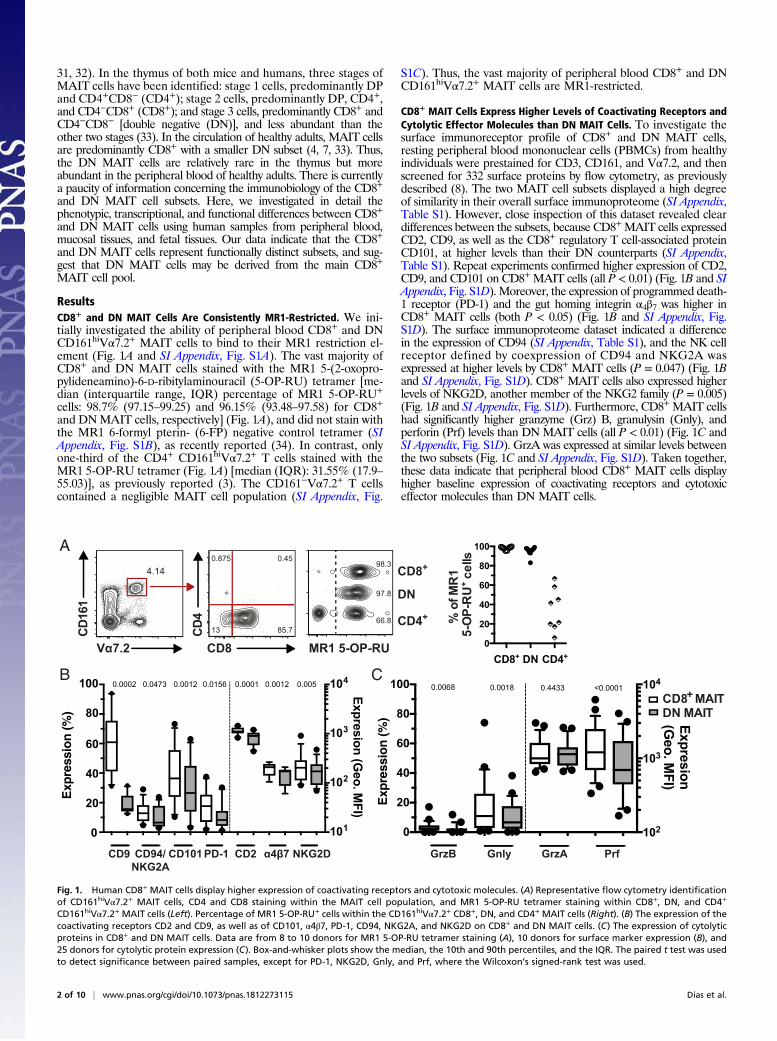
ResultsCD8+ and DN MAIT Cells Are Consistently MR1-Restricted. We ini-tially investigated the ability of peripheral blood CD8+ and DNCD161hiVα7.2+ MAIT cells to bind to their MR1 restriction el-ement (Fig. 1A and SI Appendix, Fig. S1A). The vast majority ofCD8+ and DN MAIT cells stained with the MR1 5-(2-oxopro-pylideneamino)-6-D-ribitylaminouracil (5-OP-RU) tetramer [me-dian (interquartile range, IQR) percentage of MR1 5-OP-RU+
cells: 98.7% (97.15–99.25) and 96.15% (93.48–97.58) for CD8+
and DNMAIT cells, respectively] (Fig. 1A), and did not stain withthe MR1 6-formyl pterin- (6-FP) negative control tetramer (SIAppendix, Fig. S1B), as recently reported (34). In contrast, onlyone-third of the CD4+ CD161hiVα7.2+ T cells stained with theMR1 5-OP-RU tetramer (Fig. 1A) [median (IQR): 31.55% (17.9–55.03)], as previously reported (3). The CD161−Vα7.2+ T cellscontained a negligible MAIT cell population (SI Appendix, Fig.
S1C). Thus, the vast majority of peripheral blood CD8+ and DNCD161hiVα7.2+ MAIT cells are MR1-restricted.
CD8+ MAIT Cells Express Higher Levels of Coactivating Receptors andCytolytic Effector Molecules than DN MAIT Cells. To investigate thesurface immunoreceptor profile of CD8+ and DN MAIT cells,resting peripheral blood mononuclear cells (PBMCs) from healthyindividuals were prestained for CD3, CD161, and Vα7.2, and thenscreened for 332 surface proteins by flow cytometry, as previouslydescribed (8). The two MAIT cell subsets displayed a high degreeof similarity in their overall surface immunoproteome (SI Appendix,Table S1). However, close inspection of this dataset revealed cleardifferences between the subsets, because CD8+MAIT cells expressedCD2, CD9, as well as the CD8+ regulatory T cell-associated proteinCD101, at higher levels than their DN counterparts (SI Appendix,Table S1). Repeat experiments confirmed higher expression of CD2,CD9, and CD101 on CD8+ MAIT cells (all P < 0.01) (Fig. 1B and SIAppendix, Fig. S1D). Moreover, the expression of programmed death-1 receptor (PD-1) and the gut homing integrin α4β7 was higher inCD8+ MAIT cells (both P < 0.05) (Fig. 1B and SI Appendix, Fig.S1D). The surface immunoproteome dataset indicated a differencein the expression of CD94 (SI Appendix, Table S1), and the NK cellreceptor defined by coexpression of CD94 and NKG2A wasexpressed at higher levels by CD8+ MAIT cells (P = 0.047) (Fig. 1Band SI Appendix, Fig. S1D). CD8+ MAIT cells also expressed higherlevels of NKG2D, another member of the NKG2 family (P = 0.005)(Fig. 1B and SI Appendix, Fig. S1D). Furthermore, CD8+ MAIT cellshad significantly higher granzyme (Grz) B, granulysin (Gnly), andperforin (Prf) levels than DN MAIT cells (all P < 0.01) (Fig. 1C andSI Appendix, Fig. S1D). GrzA was expressed at similar levels betweenthe two subsets (Fig. 1C and SI Appendix, Fig. S1D). Taken together,these data indicate that peripheral blood CD8+ MAIT cells displayhigher baseline expression of coactivating receptors and cytotoxiceffector molecules than DN MAIT cells.
A
Vα7.2 CD8
CD16
1
CD4
4.140.875 0.45
85.713
MR1 5-OP-RU
CD8+
DN
98.3
CD8+ DN CD4+0
20
40
60
80
100
% o
f MR
1 5 -
OP-
RU
+ cel
ls
97.8
66.8 CD4+
B C
CD9 CD94/NKG2A
CD101 PD-1 CD2 α4β7
0
20
40
60
80
100
102
103
104
Exp
ress
ion
(%) Expresion
(Geo. M
FI)
0.0068 0.0018 0.4433 <0.0001
0
20
40
60
80
100
101
102
103
104
Exp
ress
ion
(%)
Expresion (Geo. M
FI )
NKG2D GrzB Gnly GrzA Prf
0.01560.0473 0.0012 0.00010.0002 0.0012 0.005
DN MAITCD8+ MAIT
Fig. 1. Human CD8+ MAIT cells display higher expression of coactivating receptors and cytotoxic molecules. (A) Representative flow cytometry identificationof CD161hiVα7.2+ MAIT cells, CD4 and CD8 staining within the MAIT cell population, and MR1 5-OP-RU tetramer staining within CD8+, DN, and CD4+
CD161hiVα7.2+ MAIT cells (Left). Percentage of MR1 5-OP-RU+ cells within the CD161hiVα7.2+ CD8+, DN, and CD4+ MAIT cells (Right). (B) The expression of thecoactivating receptors CD2 and CD9, as well as of CD101, α4β7, PD-1, CD94, NKG2A, and NKG2D on CD8+ and DN MAIT cells. (C) The expression of cytolyticproteins in CD8+ and DN MAIT cells. Data are from 8 to 10 donors for MR1 5-OP-RU tetramer staining (A), 10 donors for surface marker expression (B), and25 donors for cytolytic protein expression (C). Box-and-whisker plots show the median, the 10th and 90th percentiles, and the IQR. The paired t test was usedto detect significance between paired samples, except for PD-1, NKG2D, Gnly, and Prf, where the Wilcoxon’s signed-rank test was used.
2 of 10 | www.pnas.org/cgi/doi/10.1073/pnas.1812273115 Dias et al.

CD8+ and DN MAIT Cell Subpopulations Display Distinct TranscriptionalProfiles.Next, we investigated the intracellular expression of severaltranscription factors in CD8+ and DN MAIT cells from peripheralblood (16), including promyelocytic leukemia zinc finger protein(PLZF), T box transcription factor 21 (TBX21 or T-bet), eome-sodermin (Eomes), retinoid-related orphan receptor (ROR) γt,and Helios (Fig. 2 A and B). Circulating CD8+ MAIT cellsexpressed significantly lower levels of PLZF and higher levels of T-bet and Eomes compared with the DN subset (all P < 0.01) (Fig.2A). Expression of RORγt and Helios was not significantly dif-ferent (P = 0.12 and P = 0.17, respectively) (SI Appendix, Fig.S2A). Interestingly, the modest differences observed in peripheralblood MAIT cells were more pronounced in mucosal MAIT cellsisolated from the endometrium (Fig. 2B) (12). Here, the expres-sion levels of PLZF, RORγt, and Helios were significantly higherin DN MAIT cells, whereas T-bet expression was higher in theCD8+ subset (all P < 0.05) (Fig. 2B). There was no difference inEomes expression between endometrial CD8+ and DNMAIT cells(P = 0.43) (SI Appendix, Fig. S2B). Together, these data indicate
that CD8+ and DNMAIT cells display distinct transcription factorexpression patterns, particularly in genital mucosal tissue.To assess if the marked differences between CD8+ and DN
MAIT cells were also reflected at the gene expression level, theirtargeted transcriptomic signatures were explored in a selected setof 85 genes of interest using the Fluidigm Biomark platform (SIAppendix, Table S2). First, CD8α gene expression was consider-ably higher in the CD8+ MAIT cells than in the DN MAIT cells(Fig. 2C), demonstrating that the absence of CD8 on the cellsurface of DN MAIT cells was not a mere surface down-regulation. Second, killer cell lectin-like receptor subfamily D1(KLRD1, or CD94) and KLRK1 (NKG2D) genes were morehighly expressed in CD8+ MAIT cells (Fig. 2C), in line with theimmunoproteome dataset (Fig. 1B and SI Appendix, Table S1). Inaddition, the expression of genes encoding the NK cell granuleprotein 7 (Nkg7), the C-C motif chemokine ligand 5 (Ccl5), andthe IL-12 receptor β2 subunit (Il12rb2) was higher in CD8+
MAIT cells (Fig. 2C). Third, compared with DN MAIT cells, theCD8+ MAIT cell subset displayed modestly lower expression ofgenes encoding the first apoptosis signal receptor (Fas), and the
A
PLZF T-bet Helios
FMOCD8+
DN
EomesPLZF T-bet
0
50
100
150
200 0.0264
DNCD8+0
1000
2000
3000 0.0088
DNCD8+0
250
500
750 0.0025
DNCD8+0
500
1000
1500 0.0312
DNCD8+0
100
200
300 0.0081
0
500
1000
1500 0.0012
0
500
1000
1500
2000
2500 0.0002
DNCD8+ DNCD8+ DNCD8+
Blood Endometrium
Expr
essi
on (G
eo. M
FI)
BCL2
BIRC3
CCL3CCL4
CCL5
CCR7CD160
CD226
CD244
CD8
CRTAM(CD355)EOMES
FAS
GZMA
GZMK
HLADRA
ICOS IFNG
IKZF2
IL12RB2
IL18RAP
IL21R
KIR3DL1.KIR3DS1
KLRC1
KLRD1
LAIR1
LAMP1(CD107)
MIR155(MIR155HG)
MTHFD2
NCR1
NCR3
NFKBIA
NKG7SLAMF7
STX11
TESPA1
TIGIT TNF
TNFSF10
0
1
2
3
-2 0 2
-------------------------------------------------------------------------------------------------------------------------------< FDR = 0.1
-lo
g10
(Pva
lue)
log2(FoldChange)
upregulated in CD8+ MAIT cellsupregulated in DN MAIT cells
KLRK1.KLRC4.KLRK1
−5log2(FoldChange)
−log
10(P
valu
e)
8
6
4
2
0
0 5
upregulated in CD8+ MAIT cellsupregulated in DN MAIT cells
B
C DPLZF T-bet Eomes PLZF T-bet Helios
Fig. 2. CD8+ and DN MAIT cells express different levels of critical transcription factors. Representative example and geometric MFI of the staining intensity of(A) PLZF, T-bet, and Eomes in peripheral blood CD8+ and DN MAIT cells, and (B) PLZF, T-bet, RORγt, and Helios in endometrium-derived CD8+ and DNMAIT cells. The fluorescence minus one (FMO) control is included as control. (C and D) Volcano plots showing fold-changes in the expression of individualgenes in CD8+ MAIT cells compared with DN MAIT cells as a function of their P values, as determined by Fluidigm Biomark (C) or RNAseq (D). Dotted linerepresents filtering criteria of FDR = 0.1 (C). Filtering criteria for green, red, and orange data points are P < 0.05 and absolute log2(fold-change) > 2; P < 0.05;absolute log2(fold-change) > 2, respectively (D). Data are from 16 (A), 8 (B), 9 (C), and 4 (D) donors (seven donors for Helios in B). Lines in the graphs representindividual donors. The paired t test was used to detect significant differences between paired samples, except for PLZF (A) and Helios (B), where theWilcoxon’s signed-rank test was used.
Dias et al. PNAS Latest Articles | 3 of 10
IMMUNOLO
GYAND
INFLAMMATION

bifunctional methylenetetrahydrofolate dehydrogenase/cyclo-hydrolase (MTHFD2) involved in folate metabolism (Fig. 2C).Based on the initial indications of differential gene-expression
patterns, CD8+ and DN peripheral blood MAIT cell subsetswere again sorted from new donors for whole-genome tran-scriptional analysis using RNA sequencing (RNAseq). Weidentified a core signature of 598 genes that were differentiallyexpressed between CD8+ and DN MAIT cells, with 214 up-regulated in CD8+ MAIT cells, including the CD8α and CD8βgenes, and 384 genes up-regulated in the DN MAIT cells (Fig.2D and SI Appendix, Table S3). t-Distributed stochastic neighborembedding (t-SNE) analysis supported that CD8+ and DNMAIT cells represent distinct populations based on their dif-ferential transcriptome pattern (SI Appendix, Fig. S2C). Alto-gether, these data demonstrate that peripheral blood CD8+ andDN MAIT cells have distinct transcriptional signatures.
Differential Functional Profile of the Two MAIT Cell Subsets. To ex-plore whether these phenotypic and transcriptomic differencestranslate into differential functional capacity, their responsive-ness to Escherichia coli and phorbol myristate acetate (PMA)/ionomycin in vitro stimulations was examined. Sorted CD8+ andDN MAIT cells were stimulated with autologous E. coli-fedmonocytes or with PMA/ionomycin (35), and intracellularlystained for the cytokines IFN-γ, TNF, and IL-17, as well as forthe cytolytic protein GrzB (Fig. 3 A and B and SI Appendix, Fig.S3A). CD8+ MAIT cells responded to both E. coli- and PMA/ionomycin-mediated stimulations with significantly higher pro-duction of IFN-γ and TNF than the DN MAIT cells (all P <0.05) (Fig. 3 A and B). GrzB production was also higher in CD8+MAIT cells upon E. coli-mediated stimulation (P = 0.0156) (Fig.3 A and B). Levels of IFN-γ and TNF expression as determinedby the geometric mean fluorescence intensity (MFI) by PMA/ionomycin-stimulated CD8+ MAIT cells were higher, as well asof GrzB expression by E. coli-stimulated CD8+ MAIT cellscompared with their DN counterparts (SI Appendix, Fig. S3B). Incontrast, DN MAIT cells expressed slightly higher levels of IL-17 than the CD8+ MAIT cells in response to PMA/ionomycinstimulation (P = 0.0363) (Fig. 3B). Both CD8+ and DNMAIT cells responded to E. coli in a predominantly MR1-dependent manner, as determined by MR1-blocking (SI Ap-pendix, Fig. S3C). Quantification of these cytokines and cytolyticmolecules in the supernatant of PMA/ionomycin-stimulated MAITcells (Fig. 3C) revealed a similar pattern as the intracellular staining(Fig. 3B). Specifically, CD8+ MAIT cells produced significantlyhigher levels of IFN-γ and TNF, and lower levels of IL-17, com-pared with DN MAIT cells (Fig. 3C).To determine if the functional differences between MAIT cell
subsets were MR1-dependent, we utilized the RibA-deficient E.coli strain BSV18 unable to synthesize riboflavin (SI Appendix,Fig. S3D) (36, 37). We confirmed the lack of MR1-dependentstimulation of MAIT cells by the BSV18 strain, in contrast to itsriboflavin biosynthesis-competent congenic strain 1100-2 (SI Ap-pendix, Fig. S3 E and F). Because BSV18 did not induce signifi-cant CD8 down-regulation (SI Appendix, Fig. S3G), we measuredcytokine production to this bacterial strain by CD8+ and DNMAIT cells after stimulation of PBMC cultures. CD8+ MAITcells expressed significantly higher levels of IFN-γ and GrzB fol-lowing BSV18-mediated stimulation (both P < 0.05) (Fig. 3D).There were no differences in the TNF and IL-17 levels (SI Ap-pendix, Fig. S3H); however, these cytokines were expressed atmuch lower levels than usually observed, likely due to the lack ofMR1-presented antigens (8). Because IL-12 and IL-18 productionby antigen-presenting cells (APCs) is involved in MR1-independentactivation of MAIT cells (19), we next determined the expression ofIL-12R and IL-18R on MAIT cell subsets. The DN subset hadsignificantly lower IL-12R and IL-18R levels (Fig. 3E), in line withthe transcriptome data (Fig. 2C). Consistent with this finding, CD8+
MAIT cells produced slightly more IFN-γ and GrzB than DNMAIT cells following IL-12+IL-18 stimulation (SI Appendix,Fig. S3I). The lower responses of the DN subset following
MR1-independent E. coli BSV18 stimulation may thus be partlycaused by the lower response to IL-12 and IL-18. Taken to-gether, these data indicate that peripheral blood CD8+ MAITcells respond more strongly in terms of IFN-γ, TNF, and GrzBproduction to TCR-dependent and -independent, as well as tomitogen-mediated stimulations. This is consistent with their higherbasal expression of IL-12R, IL-18R (Fig. 3E), coactivating re-ceptors, and cytotoxic molecules (Fig. 1 B and C), and the classiceffector transcription factors Eomes and T-bet (Fig. 2 A and B).
DN MAIT Cells Have Higher Levels of a Proapoptotic Signature thanCD8+ MAIT Cells. We next revisited the RNAseq data and per-formed gene set enrichment analysis (GSEA) of the transcriptsdifferentially expressed between MAIT cell subsets. The GSEAanalysis using the Reactome database revealed an enrichment ofan apoptosis gene signature in DN MAIT cells (Fig. 4A). To ex-tend these findings, we next evaluated the apoptosis propensity ofthe two MAIT cell subsets in vitro. Upon stimulation of FACS-sorted CD8+ and DN MAIT cells with E. coli-fed monocytes orPMA/ionomycin, DNMAIT cells were significantly more prone toapoptosis than CD8+ MAIT cells, as measured by the percentageof FLICA+ cells after stimulation (both P < 0.05) (Fig. 4B).Following E. coli-mediated stimulation, the increase in apopto-sis was predominantly MR1-dependent in both subsets, as the
0
5
10
15
20
25 0.0313
0
5
10
15
20
25 0.0156
0.0
0.2
0.4
0.6
0.8
1.0 0.2188
0
20
40
60
80
100 0.0156
0
20
40
60
80
100 0.0078
20
40
60
80
100 0.0490
1
2
3
4
5 0.0363
10
20 0.0742
E. coli DH5α
PMA+Ionomycin
A
DNCD8+
B
010203040506070 0.0195
020406080
100 0.0039
0
50
100
150
200
250
IL-1
2R (G
eo. M
FI) 0.0074
0
200
400
600
IL-1
8R (G
eo. M
FI) 0.0047
D EE. coli BSV18
0.1250
TN
F (p
g/m
L)
IL-1
7 (p
g/m
L)
Grz
B (p
g/m
L)
0
3
4
5 0.0156
IFNγ
(pg
/mL
)
0.0156 0.0469
PMA+IonomycinC
IFNγ
(% o
f MA
IT c
ells
)
TNF
(% o
f MA
IT c
ells
)
IL-1
7(%
of M
AIT
cel
ls)
Grz
B(%
of M
AIT
cel
ls)
IFNγ
(% o
f MA
IT c
ells
)
TNF
(% o
f MA
IT c
ells
)
IL-1
7(%
of M
AIT
cel
ls)
Grz
B(%
of M
AIT
cel
ls)
0 0.0 0
5
4
3
2
1
0
5
4
3
2
1
0
4
3
2
1
0
DNCD8+ DNCD8+ DNCD8+
DNCD8+ DNCD8+ DNCD8+ DNCD8+
DNCD8+ DNCD8+ DNCD8+ DNCD8+
IFNγ
(% o
f MA
IT c
ells
)
Grz
B
(% o
f MA
IT c
ells
)
DNCD8+ DNCD8+ DNCD8+ DNCD8+
Fig. 3. DNMAIT cells display less functional capacity following bacterial andmitogenic stimulation than CD8+ MAIT cells. Percentage of FACS-sortedCD8+ and DN MAIT cells expressing IFN-γ, TNF, IL-17, and GrzB after stimu-lation with (A) E. coli for 24 h (n = 7) and (B) PMA/ionomycin for 6 h (n = 10).(C) Concentration of IFN-γ, TNF, IL-17, and GrzB after stimulation with PMA/ionomycin for 6 h (n = 4–7). (D) Expression of IFN-γ and GrzB by MAIT cellswithin bulk PBMC culture in the presence of RibA− E. coli BSV18 (n = 9). (E)Expression levels (geometric MFI) of IL-12R and IL-18R in resting CD8+ andDN MAIT cells (n = 9). Lines in the graphs represent individual donors. TheWilcoxon’s signed-rank test was used to detect significant differences be-tween paired samples, except for IFN-γ, TNF, and IL-17 in the PMA/ionomycinstimulation where the paired t test was used.
4 of 10 | www.pnas.org/cgi/doi/10.1073/pnas.1812273115 Dias et al.

percentage of FLICA+ MAIT cells decreased upon MR1 blocking(both P < 0.05) (SI Appendix, Fig. S4A).We next investigated the baseline expression of the antiapoptotic
protein Bcl-2 and the proapoptotic Bcl-2 associated X, apoptosisregulator (Bax). Resting DN MAIT cells had higher frequencyof Bax+Bcl-2lo cells (P = 0.03) (Fig. 4C), and the Bax+Bcl-2lo
phenotype was linked to profoundly higher levels of active caspase3 in DN MAIT cells (P = 0.03) (Fig. 4D). Altogether, these dataindicate that DN MAIT cells are more prone to apoptosis, con-sistent with their higher Bax/Bcl-2 ratio and PLZF expression. Theformer determines cell survival or death following an apoptoticstimulus, and the latter was previously associated with the higherapoptotic propensity of MAIT and invariant natural killer T(iNKT) cells (38, 39). In light of these results, we evaluatedwhether the lower functionality of DN MAIT cells (Fig. 3 A–D)was due to the higher proportion of apoptotic cells in this subset.When the functional readouts were assessed in nonapoptotic(DCM−FLICA−) MAIT cells, the nonapoptotic DN MAIT cellsstill produced less IFN-γ and TNF than the CD8+ MAIT cells(both P < 0.05) (SI Appendix, Fig. S4B).
DN MAIT Cells Display a More Mature Phenotype During Human FetalDevelopment and a Restricted TCR Repertoire in Adult PeripheralBlood. Given that DN MAIT cells in mice are detected pre-dominantly during the later stages of thymic development (33),and that fetal human CD8αα MAIT cells may be derived fromCD8αβ MAIT cells in a stepwise manner (13), we hypothesizedthat DN MAIT cells may derive from CD8+ MAIT cells in vivo.To examine this, we revisited our data on the CD8+ and DNMAIT cell subsets from second trimester human fetal spleens(13). The levels of DN MAIT cells in fetal spleens increasedfivefold over gestational weeks 19–24, while the levels of CD8+
MAIT cells remained constant (Fig. 5A). To exclude contami-nating non-MAIT cells within the CD4+ CD161hiVα7.2+ cellpopulation, we gated on CD4− MAIT cells only and found that
the size of the fetal splenic DNMAIT cell compartment similarlyincreased, with a respective decrease of CD8+ MAIT cell levelsover developmental time (Fig. 5A). DN MAIT cells in the fetalspleen expressed higher levels of the activation marker CD25, aswell as of PLZF (both P < 0.01) (Fig. 5B and SI Appendix, Fig.S5A). This pattern is consistent with the higher PLZF expressionin DN MAIT cells from adult peripheral blood and endometrialtissues (Fig. 2 A and B). Fetal DN MAIT cells expressed lowerlevels of CD62L and CCR7, as well as higher levels of CD45ROand IL-18R (all P < 0.05) (Fig. 5B and SI Appendix, Fig. S5A),indicative of a more mature phenotype.To study this in more detail, MAIT cells were next charac-
terized using the MR1 5-OP-RU tetramer in term umbilical cordblood (UCB). Among UCB MR1 5-OP-RU+ Vα7.2+ MAITcells, the DN subset was only present in the more mature stage 3CD27+CD161hi MAIT cell population, but not among the lessmature stage 2 CD27+CD161−/dim cells (Fig. 5C) (33). Expres-sion of PLZF and IL-18R primarily occurred in the CD161hi
(stage 3) UCB MAIT cells consistent with a mature phenotype(13, 33) (SI Appendix, Fig. S5B). Accordingly, UCB DN MAITcells expressed higher PLZF and IL-18R levels than their CD8+
counterparts (Fig. 5D). Altogether, these data indicate that DNMAIT cells increase in proportion during gestation, occur mostlyin the stage 3 MAIT cell population, and are more mature thanfetal CD8+ MAIT cells.We next investigated the repertoire of TCR Vβ segments
expressed by adult peripheral blood CD8+ and DN MAIT cells(Fig. 5E). CD8+ MAIT cells expressed a more diverse Vβ rep-ertoire than DN MAIT cells (P = 0.0002) [median (IQR) of thenumber of Vβ segments: 19.0 (16.5–21.5) and 11.0 (7.0–12.0) byCD8+ and DN MAIT cells, respectively] (Fig. 5 E and F). Im-portantly, the vast majority of Vβ segments expressed by DNMAIT cells was also expressed by the CD8+ subset, but not viceversa (Fig. 5E). This pattern was consistent in each donor in-dividually (SI Appendix, Fig. S5C). Finally, we analyzed the TCR
A
0
20
40
60
80
100 0.0078
0
20
40
60
80 0.0156
FL
ICA
+
(% o
f M
AIT
cel
l su
bse
t)
FL
ICA
+
(% o
f M
AIT
ce l
l su
bse
t)
DNCD8+ DNCD8+
CD8
E. coli
Unstim.
PMA+
FLICA
BE. coli PMA+ionomycin
CD8
CD8
DN
DN
DN
0.54
10.8
0.0
54.6
11.9
53.0
C
NES = 1.7p = 0.02
0.30
0.25
0.20
0.15
0.10
0.05
0.00
Enr
ichm
ent s
core
(ES
)
DN MAIT cells CD8+ MAIT cells
D
Bax
Active Caspase 3
DN MAIT
93.5
1.07
0
20
40
60
80
100
Act
ive
Cas
pase
3+
(% o
f DN
MA
IT c
ells
)
0.03
Bax-
Bcl-2+Bax+
Bcl-2lo
Bax-Bcl-2+
Bax+Bcl-2lo
Bax
Bcl-2
14.4
84.7
0.42
99.2
CD8+ MAIT DN MAIT
0
10
20
30
40
50
Bax
+ Bcl
-2lo
(% o
f MA
IT c
ell s
ubse
t)
0.03
DNCD8+
Ion.
Fig. 4. DN MAIT cells are more prone to apoptosis than CD8+ MAIT cells. (A) Gene-set enrichment summary plot for CD8+ MAIT cell versus DN MAIT celldifferentially expressed ranked genes and a defined set of genes associated with an apoptosis signature. (B) Representative example of FLICA expression inFACS-sorted CD8+ and DN MAIT cells in the absence of stimulation, or after E. coli- or PMA/ionomycin-mediated stimulations (Left). Summary data with thepercentage of stimulated CD8+ and DN MAIT cells expressing FLICA (Right). (C) Representative FACS plots and the frequency of Bax and Bcl-2 expression inresting CD8+ and DN MAIT cells. (D) Representative FACS plot and expression of active caspase 3 in Bax+Bcl-2lo (red gate) DN MAIT cells. Data are from seven(A), eight (B; E. coli), seven (B; PMA/ionomycin), and six (C and D) donors. Lines in the graphs represent individual donors. The Wilcoxon’s signed-rank test wasused to detect significant differences between paired samples. NES, normalized enrichment score.
Dias et al. PNAS Latest Articles | 5 of 10
IMMUNOLO
GYAND
INFLAMMATION

transcripts within the RNAseq data from the sorted CD8+ andDNMAIT cell subsets (Fig. 5G). In the four donors analyzed, theCD8+ MAIT cell subset had a broader TCR diversity as assessedby the number of discrete TCR-α– and -β–chain clones detected(Fig. 5G). Both TCR chains displayed an overlap in clone se-quences between CD8+ and DN MAIT subsets (SI Appendix, Fig.S5D), illustrating that there is a shared repertoire between the twosubsets. Taken together, these observations support the notionthat the DN MAIT cell subset may derive from the larger andmore diverse CD8+ MAIT cell subpopulation.
Derivation of DN MAIT Cells from CD8+ MAIT Cells in Vitro. Theobservation of CD8 down-regulation on MAIT cells followingMR1-dependent stimulation with E. coli (SI Appendix, Fig. S6A),prompted us to investigate if activation may trigger the generationof the DNMAIT cell subset. MR1-blocking during stimulation withE. coli DH5α prevented CD8 down-regulation (Fig. 6A). Furtherexperiments using the riboflavin autotroph E. coli 1100-2 alsoshowed strong CD8 down-regulation, which did not occur whenMAIT cells were stimulated with its riboflavin auxotroph congenicstrain BSV18 (Fig. 6B and SI Appendix, Fig. S3G). In addition,stimulation with IL-12 and IL-18 did not lead to CD8 down-regulation (SI Appendix, Fig. S6B). Taken together, these data
suggest that CD8 down-regulation by MAIT cells requires MR1presentation of metabolite antigens to the MAIT cell TCR.Next, we examined if DN MAIT cells can be derived from
CD8+ MAIT cells in vitro. To mimic MR1-restricted antigenpresentation, FACS-sorted MR1 5-OP-RU+ Vα7.2+ CD161hi
CD8+ MAIT cells were cultured in an APC-free system in thepresence of immobilized Vα7.2 and CD28 mAbs. The down-regulation of CD8 and the appearance of DN MAIT cells wererapid and persisted throughout the 7-d culture (Fig. 6C). This wasin contrast to TCR Vα7.2 down-regulation, which was transient(SI Appendix, Fig. S6C), indicating that CD8 down-regulation wasnot directly linked to the internalization of the TCR complex. Theexpansion of DNMAIT cells was independent of proliferation (SIAppendix, Fig. S6C), and appeared to be followed by apoptosis ofthe DN MAIT cell subset, as measured by active caspase 3 ex-pression (Fig. 6D and SI Appendix, Fig. S6D). MAIT cells main-taining CD8 expression had negligible active caspase 3 expression(Fig. 6D and SI Appendix, Fig. S6D), consistent with our obser-vation that CD8+ MAIT cells were far less prone to apoptosis(Fig. 4). Applying a similar experimental approach to FACS-sorted DN MAIT cells did not lead to the appearance of CD8+
MAIT cells in cultures (SI Appendix, Fig. S6E). Taken together,our data support a model where DN MAIT cells can be derived
DN MAITCD8+ MAIT
CD8+
DN
E7.15.187.23172013.1213.2
CD8+ DN
7.1317165.12013.113.68212
23121.311221413.247.2918
Vβ segment Vβ segment
0
5
10
15
20
25
V u
sag
e ( n
um
be r
of
exp
ress
ed s
egm
ents
) 0.0002F
Vα7.2
MR1
5-O
P-RU
CD4- MAIT cells
CD8
CD16
1
0.0128
C
CD27
DN CD8
1000
19.6 80.441.3
58.7
Stage 2
Stage 3
Stage 3Stage 2
Stage 2
Stage 3
D
CD8+ DNCD8+ DN0
20
40
60
DN
MA
IT c
ells
(% o
f UC
B M
AIT
cel
ls)
0.03
0
100
200
300
400
PLZF
(Geo
. MFI
of
UC
B M
AIT
ce l
ls) 0.06
0
20
40
60
80
100
IL-1
8R(%
of M
AIT
cel
l sub
set) 0.02
18 20 22 240
5
10
1580
90
100
Gestational age (weeks)
MA
IT c
ell s
ubse
ts(%
of C
D4-
MA
IT c
ells
)
0.58150.0230
-0.58910.0208
r =
r =p =
p =
18 20 22 240
0.01
0.1
0.4
Gestational age (weeks)
MA
IT c
ell s
ubse
ts
(% o
f T c
ells
)
0.52050.0467
0.032080.9096
r =
r =p =
p =0
20
40
60
80
100
102
103
104
Exp
ress
ion
(%) Expresion
(Geo. M
FI)
<0.0001
0.0321 0.01560.0039
CD62L CD45RO IL-18RCCR7
<0.0001
PLZF
0.0078
CD25
A B
CD8+ DN TCR
seq
uenc
e di
vers
ity(n
umbe
r of c
lone
s)
TCRα TCRβ
CD8+
DN
G
0
200
400
600
Fig. 5. Fetal DN MAIT cells express a more mature phenotype and adult DN MAIT cells express a more restricted TCR repertoire than their CD8+ counterparts.(A) Correlations between the fetal gestational age and the levels of fetal splenic CD8+ and DN MAIT cells as a proportion of T cells (Left) and of CD4−
MAIT cells (Right). (B) Expression of CD62L, CD45RO, CCR7, IL-18Rα, CD25, and PLZF in fetal splenic CD8+ and DN MAIT cells. Percentage of cells expressingeach of these markers, except for PLZF for which the geometric MFI of the staining is shown. (C) Representative example of the identification of stage 2 andstage 3 MAIT cells from UCB and their CD8 expression, and the percentage of DN MAIT cells within each developmental stage. (D) PLZF and IL-18R expressionby CD8+ and DN UCB MAIT cells. (E) Median percentage of adult circulating CD8+ and DN MAIT cells expressing each TCR Vβ segment. (F) Number of TCR Vβsegments expressed by adult circulating CD8+ and DN MAIT cells. (G) TCR-α and TCR-β sequence diversity of CD8+ and DN MAIT cells as determined by RNAsequencing. Data are from 15 donors (A); 11 (B; CD62L and CD45RO), 9 (B; CCR7), 7 (B; IL-18R), 8 (B; CD25), and 12 (B; PLZF) donors (B); 6 donors (C and D); 16–19 (E; CD8+ MAIT) and 14–17 (E; DN MAIT) donors (E); 9 (F; CD8+ MAIT) and 7 (F; DN MAIT) donors (F); and 4 donors (G). The box-and-whisker plots show themedian, the 10th and 90th percentiles, and the IQR. Correlations were calculated using the Spearman’s test. The Wilcoxon’s signed-rank test was used todetect differences between paired samples for IL-18R, CCR7, CD25 (B) and in C, and the paired t test was used for the remainder (B and D). The unpaired t testwas used to detect significant differences between unpaired samples (F).
6 of 10 | www.pnas.org/cgi/doi/10.1073/pnas.1812273115 Dias et al.

from CD8+ MAIT cells as a consequence of TCR-mediatedactivation.
DiscussionMAIT cells are unconventional T cells with an important andunique role in antimicrobial immune responses. In healthyadults, MAIT cells are predominantly CD8+ with a smaller DNsubset. The phenotypic and functional characteristics of thesetwo MAIT cell subsets, as well as the relationship between them,has not been thoroughly investigated. Here, we report that CD8+and DNMAIT cells display distinct transcriptional programs andfunctional characteristics, and we outline their developmentalrelationship. CD8+ MAIT cells respond more strongly in termsof IFN-γ, TNF, and GrzB production, consistent with theirhigher basal expression of IL-12R, IL-18R, coactivating recep-tors, cytotoxic molecules, and the transcription factors Eomesand T-bet. Interestingly, DN MAIT cells produce more IL-17 upon stimulation, consistent with their higher RORγt ex-pression. Moreover, DN MAIT cells display higher propensityfor apoptosis, consistent with the enrichment of an apoptosisgene signature. The fetal MAIT cell compartment changesduring gestation with expansion of the DN subset and contrac-tion of the CD8+ subset. In addition, the CD8+ MAIT cell poolcan give rise to the DN subset in vitro, whereas the oppositeprocess does not occur. Altogether, these findings support amodel where DN and CD8+ MAIT cells represent functionallydistinct subsets, and the DN MAIT cells are derived from CD8+MAIT cells (Fig. 7).The higher levels in CD8+ MAIT cells of the activating re-
ceptors CD2 and CD9, the transcription factors T-bet andEomes, as well as the cytotoxic proteins GrzB, Gnly, and Prf, ledus to hypothesize that this subset would be superior in their ca-pacity to respond to stimuli. Indeed, peripheral blood CD8+
MAIT cells stimulated with a riboflavin synthesis-competent E.coli strain, or with PMA/ionomycin, produced higher levels ofIFN-γ, TNF, and GrzB than their CD8− counterparts. Interest-ingly, CD8+ MAIT cells maintained their superior functional ca-pacity when stimulated with riboflavin synthesis-incompetent E.coli, and this was likely in part due to higher levels of IL-12R andIL-18R. This distinct responsiveness of CD8+ and DNMAIT cellsmay have implications in the overall MAIT cell response to mi-crobes, including those that do not synthesize riboflavin. Given thehigher responsiveness of peripheral blood CD8+ MAIT cells, itwould be beneficial to have highly functional CD8+ MAIT cellsstrategically located at sites where the likelihood of microbialencounter is higher. Notably, MAIT cells in the rectal mucosareportedly express higher levels of activation and proinflammatorygenes than circulating MAIT cells, with tissue localization influ-encing their functional repertoire (40), and mucosal CD8+MAIT cells express higher levels of these genes than their negativecounterparts (20). Jo et al. (41) showed that CD8+ MAIT cellswere the main producers of IFN-γ within the hepatic MAIT cellcompartment in response to TLR8 agonist stimulation.The basis for higher production of IFN-γ, TNF, and GrzB in
CD8+ MAIT cells is unclear. However, it is possible that theCD8 molecule stabilizes and enhances the interaction betweenthe MAIT cell TCR and the MR1–antigen complex, leading tostronger responses, similar to conventional MHC-restrictedCD8+ T cells (42, 43). Consistent with this hypothesis, Kuriokaet al. (44) showed that blocking CD8 with mAb led to decreasedMAIT cell responses against E. coli. CD8-blocking in conven-tional CD8+ T cells similarly decrease their proliferative capac-ity, whereas the killing efficiency and IL-2 production are lessaffected (45). However, our data show that CD8+ MAIT cells arestill functionally superior to DN MAIT cells when stimulatedwith an MR1-independent riboflavin auxotrophic E. coli strain or
C
A
0
20
40
60
80
100
CD8
exp
ress
ion
(% o
f CD4
- MAI
T ce
lls)
*** **NS
0
200
400
600
800
CD8
exp
ress
ion
(Geo
. MFI
o f C
D4- M
AIT
cells
)
** ***NS
E. coliIgG2a
Anti-MR1
---
++-
+-+
---
++-
+-+
0
20
40
60
80
100
CD8
exp
ress
ion
(% o
f CD4
- MAI
T c e
lls) ** **
NS
0
200
400
600
800
CD8
exp
ress
ion
( Geo
. MFI
of C
D4- M
AIT
cells
)
* **
NS
1100-2
1100-2
B SV18
N il E . coli
B SV18
Nil E . col i
B
D0D3D7
1.76 1.55
77.319.3
16.6 0.52
58.024.9
73.0 0.54
12.014.5CD8
CD8Ca
spas
e 3
D
Days in culture
% M
AIT
cel
ls s
ubse
t
Day 0 Day 3 Day 7
0 1 2 3 4 5 6 70
20
40
60
80
100
DNCD8+
Fig. 6. DN MAIT cells derived from CD8+ MAIT cells in vitro. (A) CD8 expression as percentage (Left) and geometric MFI (Right) in unstimulated and E. coliDH5α-stimulated MAIT cells in the presence of anti-MR1 mAb or isotype control (n = 15). (B) CD8 expression as percentage (Left) and geometric MFI (Right) inunstimulated and riboflavin autotroph E. coli 1100-2− or riboflavin auxotroph E. coli BSV18-stimulated MAIT cells (n = 11). (C) Representative histogram ofCD8 expression (Left) and percentage of CD8+ and DN MAIT cell subsets (Right), and (D) representative FACS plots of active caspase 3 expression, during invitro culture of FACS-sorted MAIT cells in the presence of immobilized Vα7.2 and CD28 mAb. The box-and-whisker plots show the median, the 10th and 90thpercentiles, and the IQR. The lines and error bars represent mean and SE. The Friedman test followed by Dunn’s post hoc test was used to detect significantdifferences between multiple, paired samples (A and B). *P < 0.05, **P < 0.01, ***P < 0.001. NS, not significant.
Dias et al. PNAS Latest Articles | 7 of 10
IMMUNOLO
GYAND
INFLAMMATION

PMA/ionomycin. Altogether, while CD8 binding to MR1 mayinfluence CD8+ MAIT cell effector functions, other cell-intrinsicor context-dependent mechanisms may also be involved. Ofnote, higher functional capacity of CD8+ MAIT cells hasbeen previously reported following stimulation of PBMCswith Helicobacter pylori (46) and PMA/ionomycin (47). How-ever, down-regulation of CD8 following stimulation wasnot considered, suggesting that the DN MAIT cells assessedin those studies may represent a mixture of bona fide DNcells and CD8+ MAIT cells that down-regulated CD8 uponactivation.The mechanism underlying the higher IL-17 production by
DN MAIT cells following PMA/ionomycin stimulation is un-clear, especially because RORγt expression in CD8+ and DNperipheral blood MAIT cell subsets is similar. This pattern,however, is consistent with higher IL-17 production by endo-metrial MAIT cells compared with peripheral blood MAIT cells,despite their similar levels of RORγt expression (12). Recentstudies reported that IL-7R–, IL-23R–, and STAT3-dependentsignaling are important for IL-17 production by MAIT cells (48–50), and thus warrant further investigation in the context of in-creased IL-17 production by DN MAIT cells. The functionaldifferences between CD8+ and DN MAIT cells are reminiscentof those of subsets of iNKT cells. The circulating iNKT cellpopulation in healthy adults is comprised of CD4+ and DN cells,as well as a minor population of CD8+ cells (51). AlthoughiNKT cells are able to produce both Th1 (IFN-γ and TNF) andTh2 (IL-4, IL-5, and IL-13) cytokines (51, 52), functional dif-ferences between the subsets have also been reported, withCD4+ NKT cells being the highest producers of Th2 cytokines(51, 52) and DN NKT cells secreting high levels of Th1 cytokinesand IL-17 (52).MAIT cells express the invariant TCR Vα7.2 segment coupled
to the Jα33, Jα12, or Jα20 segments (2–4). However, the Vβsegment usage in total MAIT cells is more diverse (2–4). Thepresent results indicate that DN MAIT cells express a morelimited set of Vβ segments than CD8+ MAIT cells. Interestingly,the Vβ repertoire of DN MAIT cells is a limited subrepertoireof the CD8+ MAIT cell Vβ repertoire. Furthermore, analysisof TCR transcripts revealed higher TCR sequence diversity inCD8+ MAIT cells than in DN MAIT cells. These findings, to-gether with the observation that CD8 is down-regulated fromthe surface upon stimulation, support the notion that DN MAITcells may represent a subset of CD8+ MAIT cells that respondedin vivo, and subsequently down-regulated CD8. We previouslyshowed that fetal CD8αα MAIT cells may be derived fromCD8αβ MAIT cells in a stepwise manner in vivo (CD8αβhi →CD8αβlo → CD8αα) (13). Walker et al. (53) previously alsosuggested that adult peripheral blood CD161++ CD8αα T cells
derive from CD161++ CD8αβ T cells. In the present study, furtheranalysis of cells from fetal tissues revealed that fetal DNMAIT cells were more mature than CD8+ MAIT cells, as evalu-ated by their higher expression of CD45RO and IL-18R, andlower expression of CD62L and CCR7, and expanded during thegestational period, with a corresponding contraction of CD8+MAIT cells. Moreover, cord blood DN MAIT cells were maturestage 3 CD27+ CD161hi MAIT cells. Interestingly, a recent studyshowed that DN MAIT cells are rare in the thymus but moreabundant in UCB and even more so in adult peripheral blood(33). Altogether, these findings are consistent with the model wepropose, whereby the DN MAIT cells appear later during devel-opment, potentially following in vivo activation of CD8+MAIT cells (Fig. 7). Future studies using wild-derived mousemodels, such as the CAST/EIJ mice, which have higher MAIT cellfrequency than common inbred strains (54), will be critical tofurther understand the developmental relationship between CD8+and DN MAIT cells and the precise mechanisms by which DNMAIT cells are generated in vivo.The DN MAIT cells stained at higher levels with FLICA, a
reagent labeling cells undergoing caspase-mediated cell deathfollowing bacterial or mitogen stimulation. This indicates thatDN MAIT cells are more prone to apoptosis than CD8+ MAITcells, which is consistent with recent findings (44). This patternwas also in agreement with the enrichment of an apoptosistranscriptional signature, the higher expression levels of Bax inrelation to Bcl-2, as well as of PLZF, in the DN MAIT cells (39).Furthermore, when sorted CD8+ MAIT cells were stimulated viatheir TCR in vitro, the induced DN MAIT cell population de-veloped high expression of activated caspase 3. Because viableDN MAIT cells negative for both FLICA and DCM still hadlower functionality than the corresponding CD8+ MAIT cells,the overall lower functionality of DN MAIT cells was likely notcaused by lower viability of the DN MAIT cells. Interestingly, astudy on chronic hepatitis C virus (HCV) infection showed thatthe levels of peripheral blood CD8+ MAIT cells were lower inHCV-infected patients compared with healthy controls, but nodifferences in the levels of DN MAIT cells were detected (24).Similarly, our data indicated that the CD8+ MAIT cells declinedduring aging and senescence in adult peripheral blood, whereasthe DN MAIT cell population remained constant (SI Appendix,Fig. S6F). These observations support a model where DN MAITcells may be generated from the CD8+ MAIT cell populationduring steady state or infection at a similar rate at which DNMAITcells die. Over time, this would result in contraction of the CD8+MAIT cell population, while the DN MAIT cell compartmentremains constant.In summary, we show marked functional differences between
CD8+ and DN MAIT cells, and propose a model where theapoptosis-prone DN MAIT cells may derive from the mainCD8+ MAIT cell population (Fig. 7). The realization that CD8+and DN MAIT cells have distinct functional characteristics willbe important for the continued study and understanding ofMAIT cells in immune protection of the human host.
Materials and MethodsHuman Samples. Peripheral blood was obtained from healthy individuals atthe Blood Transfusion Clinic at the Karolinska University Hospital Huddinge,Sweden. Apheresis samples used for targeted transcriptomic work werecollected under protocols (RV229B/WR#1368) with ethical approval providedby the Human Subjects Protection Branch, Walter Reed Army Institute ofResearch. Uterine tissue samples were collected from women subjected tohysterectomy for nonmalignant and noninflammatory conditions at the StGöran Hospital in Stockholm, Sweden. Diagnosis of human papillomavirus(HPV) infection was performed by the PapilloCheck HPV genotyping test(Greiner Bio-One) at the accredited microbiology laboratory service at theKarolinska University Hospital in Stockholm, Sweden. Umbilical cord bloodsamples were obtained through the Singapore Cord Blood Bank, from do-nated units failing to meet the criteria for public clinical banking. Fetalspleens were from second trimester elective abortions from The San Fran-cisco General Hospital Women’s Options Center. Written informed consentwas obtained from all donors and ethical approval was obtained from the
Fig. 7. Properties and relationship of the main MAIT cell subsets.
8 of 10 | www.pnas.org/cgi/doi/10.1073/pnas.1812273115 Dias et al.

Regional Ethics Review Board in Stockholm, the Institutional Review Boardsof National University of Singapore and Singapore General Hospital, theResearch Advisory Ethics Committee of the Singapore Cord Blood Bank, andthe Institutional Review Board and the Committee on Human Subjects Re-search at the University of California, San Francisco.
Blood and Tissue Processing. PBMCs were isolated by standard Ficoll-Hypaquedensity gradient separation (Lymphoprep; Axis-Shield). After isolation,PBMCs were cryopreserved until further use, or immediately used for Vα7.2+
and MAIT cell purification or activation assays. Vα7.2+ cells were isolatedfrom PBMCs by positive selection, using anti-Vα7.2 APC-conjugated mAb(Biolegend) and magnetic-activated cell sorting (MACS) anti-APC microbe-ads, according to the manufacturer’s instructions. Purified Vα7.2+ cells wererested overnight in RPMI-1640 medium supplemented with 25 mM Hepes,2 mM L-glutamine (all from Thermo Fisher Scientific), 10% FBS (Sigma-Aldrich), 50 μg/mL gentamicin (Life Technologies), and 100 μg/mL normo-cin (InvivoGen; complete medium). Vα7.2+ cells were subsequently FACS-sorted with CD161 and Vα7.2 mAbs to isolate pure CD8+ and DN MAIT cellpopulations. In selected experiments, MAIT cells were FACS-sorted directlyfrom PBMCs using the MR1 5-OP-RU tetramers or the CD161 and Vα7.2mAbs. Monocytes were negatively selected from peripheral blood using theRosetteSep human monocyte enrichment mixture (Stemcell Technologies),as per the manufacturer’s instructions, and rested for 48 h at 37 °C/5% CO2
in complete medium before use in activation assays. UCB mononuclear cellswere freshly isolated by density gradient centrifugation (Ficoll-HistopaquePremium; GE Healthcare) as previously described (55). The CD34+ hemato-poietic stem and progenitor cells were removed using column-free magneticbeads according to the manufacturer’s instructions (EasySep Human CordCD34 Positive Selection Mixture; Stemcell Technologies). CD34-depleted UCBmononuclear cells were cryopreserved for further use in 90% (vol/vol) autol-ogous plasmawith 10% (vol/vol) DMSO (Sigma Aldrich) (55). The endometriumsamples were maintained in ice-cold RPMI-1640 medium supplemented with50 μg/mL gentamicin and 2.5 μg/mL fungizone (both from Life Technologies),and processed within 24 h after the hysterectomy, as previously described (12).Fetal spleens were collected into cold RPMI medium supplemented with 10%FCS, 25 mM Hepes, 100 U/mL penicillin, 100 μg/mL streptomycin, and 2 mML-glutamine and maintained on ice. The spleens were processed as previouslydescribed (13).
Bacterial Culture. The E. coli strains 1100-2 and BSV18 were obtained fromthe Coli Genetic Stock Center, Yale University; the DH5α strain was obtainedfrom New England Biolabs, and the D21 strain was a gift from Peter Berg-man, Karolinska Institutet, Stockholm, Sweden. All E. coli strains were grownovernight at 37 °C in Luria (lysogeny) broth (LB), as described previously(56), and supplemented with 20 μg/mL riboflavin (Sigma-Aldrich) for theBSV18 cultures. In selected experiments, bacteria were grown overnight at37 °C in Riboflavin Assay Medium (RAM; BD Biosciences) in the presence of3 μg/mL riboflavin dissolved in acetonitrile (Honeywell), or in solvent controlalone. Turbidity was measured at 600-nm absorbance using a microplatereader (Infinite M200; Tecan).
MAIT Cell Functional Assays. MAIT cells within bulk PBMCs were activatedusing formaldehyde-fixed E. coli strains as indicated, or a combination of IL-12 and IL-18 (10 ng/mL and 100 ng/mL, respectively; PeproTech) for 24 h, aspreviously described (16, 35). FACS-sorted CD8+ and DN MAIT cells wererested overnight at 37 °C/5% CO2 in complete medium. MAIT cells were thenstimulated for 6 h with PMA/ionomycin or for 24 h with formaldehyde-fixedE. coli (strain D21)-fed monocytes (ratio E. coli CFU: monocyte of 30:1 andratio MAIT cell: monocyte of 1:1) and in the presence of 1.25 μg/mL anti-CD28 mAb (L293; BD Biosciences), and 20 μg/mL MR1 blocking mAb (26.5;Biolegend) or IgG2a isotype control (ctrl) (MOPC-173; Biolegend), as de-scribed previously (35). E. coli was mildly fixed in formaldehyde as previouslydescribed (56). In all activation assays, monensin (Golgi Stop; BD Biosciences)and brefeldin (Golgi Plug; BD Biosciences) were added for the last 6 h ofincubation. In selected experiments, MAIT cells were stimulated with PMA/ionomycin for 24 h in the absence of protein transport inhibitors. Cytokinesin the supernatants were quantified using the LEGENDplex kit (Biolegend),as per the manufacturer’s instructions. Apoptosis in activated MAIT cells wasassessed by using the FLICA reagent (Vybrant FAM Poly Caspases Assay Kit;Thermo Fisher Scientific) as previously described (35), or by staining usingantiactive caspase 3 mAb (SI Appendix, Table S4). In the derivative experi-ments, FACS-sorted CD8+ and DN MAIT cells prestained with 1.25 μM CTV(Thermo Fisher Scientific) were incubated for up to 7 d in culture plates thathad been precoated with 10 μg/mL Vα7.2 mAb (3C10; Biolegend) andCD28 mAb (CD28.2; Biolegend).
Flow Cytometry. Cell surface and intracellular staining for cytokines, cytotoxicmolecules, transcription factors, and staining using the LEGENDScreen kit(Biolegend) were performed as previously described (56). Staining with theMR1 5-OP-RU and MR1 6-FP tetramers conjugated with PE were performedfor 40 min at room temperature (10) before proceeding to the surfacestaining with other mAbs (SI Appendix, Table S4). Samples were acquired onan LSRFortessa flow cytometer (BD Biosciences) equipped with 355-, 405-,488-, 561, and 639-nm lasers. FACS-sorting was performed on FACSAriaIII orFACSAria Fusion equipped with 355-, 405-, 488-, 561-, and 640-nm lasers, orFACSMelody equipped with 405-, 488-, and 640-nm lasers (all BD Biosci-ences). Single-stained polystyrene beads (BD Biosciences) and the compen-sation platform in FACSDiva v. 8.0.1 (BD Biosciences) or FlowJo software v.9.9 (TreeStar) were used for compensation.
Gene-Expression Analysis. CD8+ and DN MAIT cells were FACS-sorted at100 cells per well into 96-well plates containing a reverse-transcriptionpreamplification reaction mix, which contains 0.2× assay mix [85 pre-selected primers and probes (SI Appendix, Table S2); Thermo Fisher Scien-tific], SuperScript III platinum Taq (Thermo Fisher Scientific), and SUPERase-InRNase Inhibitor (Thermo Fisher Scientific). The reverse-transcription reactionwas performed as 1 cycle of 15 min at 50 °C followed by 2 min at 95 °C, andpreamplification was 16 cycles of 95 °C for 15 s, and 60 °C for 4 min. cDNAproduced following this step was diluted 1:5 in DNA suspension buffer(Teknova). Diluted cDNA was combined with TaqMan Universal PCR Mastermix (Thermo Fisher Scientific) and further diluted with 20× GE sampleloading reagent (Fluidigm), and loaded into one side of a primed, 96.96Dynamic Array chip (Fluidigm). Experimental assays (20× assay mixes ofTaqMan primers and probes) were diluted 1:1 with 2× assay loading buffer(Fluidigm), and loaded onto the other side of the chip. The chip was loadedinto an IFC Controller (Fluidigm) to fill the chip matrix with sample and as-say, and then transferred to Biomark (Fluidigm) for thermocycling andfluorescence acquisition using the GE 96 × 96 standard v1 program. Forquality control, qPCR amplification curves were first validated using geneexpression Fluidigm Biomark real-time PCR analysis software (Fluidigm).
RNA Sequencing. CD8+ and DN MAIT cells from peripheral blood (2000 cellsper subset) were sorted using a FACSAriaII (BD Biosciences) directly into lysisbuffer provided with the SMART-Seq v4 Ultra Low Input RNA Kit (Takara),and then snap frozen. RNAseq libraries were prepared using the SMART-Seqv4 Ultra Low Input RNA Kit according to the manufacturer’s instructions.Briefly, 3′ SMART-Seq CDS (oligo-dt) primers were hybridized to the poly(A)tail of all of the mRNA and reverse-transcribed with the SMARTScribe RTenzyme. cDNA was preamplified using SeqAmp DNA polymerase and fro-zen. Amplified material was purified using Agencourt AMPure XP beads(Beckman). cDNA quantity was assessed on a Qubit 3.0 (Thermo) and frag-ment size evaluated on a 2100 BioAnalyzer (Agilent). The PCR products werenext indexed using the Nextera XT DNA Library Prep Kit (Illumina) accordingto the manufacturer’s instructions. Briefly, products were tagmented usingthe Amplicon tagment mix containing Tn5 transposase, and indexed usingNextera index 1 (i7) and index 2 (i5) primers. The libraries were againcleaned-up with Agencourt AMPure XP beads, pooled, quantified, and se-quenced across 75 bp using a paired-end strategy with a 150-cycle high-output flow cell on a NextSeq 550 (Illumina). Three biological replicateswere sequenced per experiment.
RNAseq Analysis. Fastq files from three sequencing runs were concatenatedand aligned using STAR 2.5.2a and hg38 to generate a final unique pairedmapped read depth ranging from 8 million to 13.6 million reads per sample.The aligned files were normalized using Deseq2. Differentially expressedgenes on normalized RNAseq counts between bulk CD8+ and DN MAIT cellswere assessed using a t test (P < 0.05) with the R limma package (v3.28.21).Normalized RNAseq counts from sorted CD8+ and DN MAIT cells were sub-jected to GSEA using Broad Institute software (software.broadinstitute.org/gsea/index.jsp). The TCR data were extracted from the RNAseq dataset usingthe MiXCR software (https://mixcr.readthedocs.io/en/master/index.html).
Data Availability. The sequence datasets have been deposited in the GeneExpression Omnibus with the accession no. GSE120847.
Statistical Analyses. In gene-expression analyses, volcano plots representinggene expression fold-change and P value (Wilcoxon signed rank test) wereperformed in R. The P values were corrected for multiple comparisons usingthe Benjamini and Hochberg (57) false-discovery rate (FDR) method andselected genes were filtered based on a FDR < 0.1. The remaining statisticalanalyses were performed using Prism software v6 (GraphPad). The paired
Dias et al. PNAS Latest Articles | 9 of 10
IMMUNOLO
GYAND
INFLAMMATION
t test or Wilcoxon’s signed-rank test, and the unpaired t test were used asappropriate to detect significant differences between paired and unpairedsamples, respectively. The Friedman test followed by Dunn’s multiple com-parison test was used to determine significance across multiple, pairedsamples. The Spearman’s rank correlation was used for correlation analyses.Two-sided P < 0.05 were considered significant.
ACKNOWLEDGMENTS. We thank Åsa-Lena Dackland and Dr. Iyadh Douagi(Karolinska Institutet) and Charles K. L. Lou and Charlene S. F. Foong (Singa-pore Health Services) for their technical assistance with FACS-sorting exper-iments; and Dohoon Kim (Walter Reed Army Institute of Research) forassisting in Fluidigm Biomark gene-expression analyses. The MR1 tetramer
technology was developed jointly by Dr. James McCluskey, Dr. Jamie Rossjohn,and Dr. David Fairlie; and the material was produced by the NIH Tetramer CoreFacility as permitted to be distributed by the University of Melbourne. This re-search was supported by Swedish Research Council Grant 2015-00174; MarieSkłodowska Curie Actions; Cofund; Project INCA 600398; the Jonas SöderquistFoundation for Virology and Immunology; the Erik and Edith Fernström Foun-dation for Medical Research; the Swedish Society of Medicine (E.L.); and SwedishResearch Council Grant 2016-03052, Swedish Cancer Society Grant CAN 2017/777, and National Institutes of Health Grant R01DK108350 (to J.K.S.). J.D. wassupported by Fundação para a Ciência e a Tecnologia Doctoral Fellowship SFRH/BD/85290/2012, cofunded by the Programa Operacional Potencial Humano-Quadro de Referência Estratégico Nacional and the European Social Fund.
1. Fergusson JR, et al. (2014) CD161 defines a transcriptional and functional phenotypeacross distinct human T cell lineages. Cell Rep 9:1075–1088.
2. Lepore M, et al. (2014) Parallel T-cell cloning and deep sequencing of humanMAIT cells reveal stable oligoclonal TCRβ repertoire. Nat Commun 5:3866, and cor-rection (2014) 5:4493.
3. Reantragoon R, et al. (2013) Antigen-loaded MR1 tetramers define T cell receptorheterogeneity in mucosal-associated invariant T cells. J Exp Med 210:2305–2320.
4. Tilloy F, et al. (1999) An invariant T cell receptor alpha chain defines a novel TAP-independent major histocompatibility complex class Ib-restricted alpha/beta T cellsubpopulation in mammals. J Exp Med 189:1907–1921.
5. Treiner E, et al. (2003) Selection of evolutionarily conserved mucosal-associated in-variant T cells by MR1. Nature 422:164–169.
6. Dusseaux M, et al. (2011) Human MAIT cells are xenobiotic-resistant, tissue-targeted,CD161hi IL-17-secreting T cells. Blood 117:1250–1259.
7. Martin E, et al. (2009) Stepwise development of MAIT cells in mouse and human. PLoSBiol 7:e54.
8. Dias J, Leeansyah E, Sandberg JK (2017) Multiple layers of heterogeneity and subsetdiversity in human MAIT cell responses to distinct microorganisms and to innate cy-tokines. Proc Natl Acad Sci USA 114:E5434–E5443.
9. Le Bourhis L, et al. (2010) Antimicrobial activity of mucosal-associated invariant T cells.Nat Immunol 11:701–708, and correction (2010) 11:969.
10. Corbett AJ, et al. (2014) T-cell activation by transitory neo-antigens derived fromdistinct microbial pathways. Nature 509:361–365.
11. Kjer-Nielsen L, et al. (2012) MR1 presents microbial vitamin B metabolites toMAIT cells. Nature 491:717–723.
12. Gibbs A, et al. (2017) MAIT cells reside in the female genital mucosa and are biasedtowards IL-17 and IL-22 production in response to bacterial stimulation. MucosalImmunol 10:35–45.
13. Leeansyah E, Loh L, Nixon DF, Sandberg JK (2014) Acquisition of innate-like microbialreactivity in mucosal tissues during human fetal MAIT-cell development. Nat Commun5:3143.
14. Kurioka A, et al. (2015) MAIT cells are licensed through granzyme exchange to killbacterially sensitized targets. Mucosal Immunol 8:429–440.
15. Le Bourhis L, et al. (2013) MAIT cells detect and efficiently lyse bacterially-infectedepithelial cells. PLoS Pathog 9:e1003681.
16. Leeansyah E, et al. (2015) Arming of MAIT cell cytolytic antimicrobial activity is in-duced by IL-7 and defective in HIV-1 infection. PLoS Pathog 11:e1005072.
17. Salou M, Franciszkiewicz K, Lantz O (2017) MAIT cells in infectious diseases. Curr OpinImmunol 48:7–14.
18. Loh L, et al. (2016) Human mucosal-associated invariant T cells contribute to antiviralinfluenza immunity via IL-18-dependent activation. Proc Natl Acad Sci USA 113:10133–10138.
19. Ussher JE, et al. (2014) CD161++ CD8+ T cells, including the MAIT cell subset, arespecifically activated by IL-12+IL-18 in a TCR-independent manner. Eur J Immunol 44:195–203.
20. Slichter CK, et al. (2016) Distinct activation thresholds of human conventional andinnate-like memory T cells. JCI Insight 1:e86292.
21. Ussher JE, et al. (2016) TLR signaling in human antigen-presenting cells regulatesMR1-dependent activation of MAIT cells. Eur J Immunol 46:1600–1614.
22. Beudeker BJB, et al. (2017) Mucosal‐associated invariant T-cell frequency and functionin blood and liver of HCV mono- and HCV/HIV co-infected patients with advancedfibrosis. Liver Int 38:458–468.
23. Boeijen LLM, et al. (2017) Mucosal-associated invariant T cells are more activated inchronic hepatitis B, but not depleted in blood: Reversal by antiviral therapy. J InfectDis 216:969–976.
24. Bolte FJ, et al. (2017) Intra-hepatic depletion of mucosal-associated invariant T cells inhepatitis C virus-induced liver inflammation. Gastroenterology 153:1392–1403.e2.
25. Cosgrove C, et al. (2013) Early and nonreversible decrease of CD161++/MAIT cells inHIV infection. Blood 121:951–961.
26. Hengst J, et al. (2016) Nonreversible MAIT cell-dysfunction in chronic hepatitis C virusinfection despite successful interferon-free therapy. Eur J Immunol 46:2204–2210.
27. Leeansyah E, et al. (2013) Activation, exhaustion, and persistent decline of the anti-microbial MR1-restricted MAIT-cell population in chronic HIV-1 infection. Blood 121:1124–1135.
28. van Wilgenburg B, et al.; STOP-HCV consortium (2016) MAIT cells are activated duringhuman viral infections. Nat Commun 7:11653.
29. Sandberg JK, Norrby-Teglund A, Leeansyah E (2017) Bacterial deception of MAIT cellsin a cloud of superantigen and cytokines. PLoS Biol 15:e2003167.
30. Shaler CR, et al. (2017) MAIT cells launch a rapid, robust and distinct hyper-inflammatory response to bacterial superantigens and quickly acquire an anergicphenotype that impedes their cognate antimicrobial function: Defining a novelmechanism of superantigen-induced immunopathology and immunosuppression.PLoS Biol 15:e2001930.
31. Gold MC, et al. (2013) Human thymic MR1-restricted MAIT cells are innate pathogen-reactive effectors that adapt following thymic egress. Mucosal Immunol 6:35–44.
32. Seach N, et al. (2013) Double-positive thymocytes select mucosal-associated invariantT cells. J Immunol 191:6002–6009.
33. Koay HF, et al. (2016) A three-stage intrathymic development pathway for themucosal-associated invariant T cell lineage. Nat Immunol 17:1300–1311.
34. Gherardin NA, et al. (2018) Human blood MAIT cell subsets defined using MR1 tetramers.Immunol Cell Biol 96:507–525.
35. Dias J, Sobkowiak MJ, Sandberg JK, Leeansyah E (2016) HumanMAIT-cell responses toEscherichia coli: Activation, cytokine production, proliferation, and cytotoxicity.J Leukoc Biol 100:233–240.
36. Bandrin SV, Rabinovich PM, Stepanov AI (1983) [3 linkage groups of the genes ofriboflavin biosynthesis in Escherichia coli]. Genetika 19:1419–1425. Russian.
37. Bennett MS, Trivedi S, Iyer AS, Hale JS, Leung DT (2017) Human mucosal-associatedinvariant T (MAIT) cells possess capacity for B cell help. J Leukoc Biol 102:1261–1269.
38. Oltvai ZN, Milliman CL, Korsmeyer SJ (1993) Bcl-2 heterodimerizes in vivo with aconserved homolog, Bax, that accelerates programmed cell death. Cell 74:609–619.
39. Gérart S, et al. (2013) Human iNKT and MAIT cells exhibit a PLZF-dependent proa-poptotic propensity that is counterbalanced by XIAP. Blood 121:614–623.
40. Dias J, et al. (2018) Factors influencing functional heterogeneity in human mucosa-associated invariant T cells. Front Immunol 9:1602.
41. Jo J, et al. (2014) Toll-like receptor 8 agonist and bacteria trigger potent activation ofinnate immune cells in human liver. PLoS Pathog 10:e1004210.
42. Norment AM, Salter RD, Parham P, Engelhard VH, Littman DR (1988) Cell-cell adhe-sion mediated by CD8 and MHC class I molecules. Nature 336:79–81.
43. Salter RD, et al. (1990) A binding site for the T-cell co-receptor CD8 on the alpha3 domain of HLA-A2. Nature 345:41–46.
44. Kurioka A, et al. (2017) Shared and distinct phenotypes and functions of humanCD161++ Vα7.2+ T cell subsets. Front Immunol 8:1031.
45. Caveno J, Zhang Y, Motyka B, Teh SJ, Teh HS (1999) Functional similarity and dif-ferences between selection-independent CD4-CD8- alphabeta T cells and positivelyselected CD8 T cells expressing the same TCR and the induction of anergy in CD4-CD8-alphabeta T cells in antigen-expressing mice. J Immunol 163:1222–1229.
46. Booth JS, et al. (2015) Mucosal-associated invariant T cells in the human gastric mu-cosa and blood: Role in Helicobacter pylori infection. Front Immunol 6:466.
47. Brozova J, Karlova I, Novak J (2016) Analysis of the phenotype and function of thesubpopulations of mucosal-associated invariant T Cells. Scand J Immunol 84:245–251.
48. Guggino G, et al. (2017) IL-17 polarization of MAIT cells is derived from the activationof two different pathways. Eur J Immunol 47:2002–2003.
49. Willing A, Jäger J, Reinhardt S, Kursawe N, Friese MA (2018) Production of IL-17 byMAIT cells is increased in multiple sclerosis and is associated with IL-7 receptor ex-pression. J Immunol 200:974–982.
50. Wilson RP, et al. (2015) STAT3 is a critical cell-intrinsic regulator of human un-conventional T cell numbers and function. J Exp Med 212:855–864.
51. Chan AC, et al. (2013) Ex-vivo analysis of human natural killer T cells demonstratesheterogeneity between tissues and within established CD4(+) and CD4(-) subsets. ClinExp Immunol 172:129–137.
52. O’Reilly V, et al. (2011) Distinct and overlapping effector functions of expanded hu-man CD4+, CD8α+ and CD4-CD8α- invariant natural killer T cells. PLoS One 6:e28648.
53. Walker LJ, et al. (2012) Human MAIT and CD8αα cells develop from a pool of type-17 precommitted CD8+ T cells. Blood 119:422–433.
54. Cui Y, et al. (2015) Mucosal-associated invariant T cell-rich congenic mouse strainallows functional evaluation. J Clin Invest 125:4171–4185.
55. Chu PP, et al. (2012) Intercellular cytosolic transfer correlates with mesenchymalstromal cell rescue of umbilical cord blood cell viability during ex vivo expansion.Cytotherapy 14:1064–1079.
56. Dias J, Sandberg JK, Leeansyah E (2017) Extensive phenotypic analysis, transcriptionfactor profiling, and effector cytokine production of human MAIT cells by flow cy-tometry. Methods Mol Biol 1514:241–256.
57. Benjamini Y, Hochberg C (1995) Controlling the false discovery rate: A practical andpowerful approach to multiple testing. J R Stat Soc B 57:289–300.
10 of 10 | www.pnas.org/cgi/doi/10.1073/pnas.1812273115 Dias et al.