CCQM-K109 High Polarity Analytes in Biological Matrix ...Determination of Urea and Uric Acid in...
143
Page 1 of 143 CCQM-K109 High Polarity Analytes in Biological Matrix: Determination of Urea and Uric Acid in Human Serum Key Comparison Track A Final Report July 2018 Coordinating institute: Qinde Liu, Hong Liu, Yizhao Chen, Sharon Yong, Hui Ling Teo, Lingkai Wong and Tang Lin Teo Health Sciences Authority (HSA), Singapore With contributions from: Veronica Vamathevan National Measurement Institute, Australia (NMIA) Eliane C. P. do Rego, Wagner Wollinger, Jane L. N. Fernandes, Tania M. Monteiro, Bruno C. Garrido and Fernando M. Violante Instituto Nacional de Metrologia, Qualidade e Tecnologia (INMETRO), Brazil Lian Hua Shi, Hai Hong He, Can Quan, Bei Xu, Hong Mei Li, Xin Hua Dai and Ya Juan He National Institute of Metrology (NIM), China Man-fung Lo and Yiu-chung Yip Government Laboratory, Hong Kong (GLHK), Hong Kong SAR, China Julie Cabillic and Vincent Delatour Laboratoire National de Métrologie et d'Essais (LNE), France Rüdiger Ohlendorf and Andre Henrion Physikalisch-Technische Bundesanstalt (PTB), Germany Migaku Kawaguchi National Metrology Institute of Japan (NMIJ), Japan Dukjin Kang and Hwashim Lee Korea Research Institute of Standards and Science (KRISS), Republic of Korea Mariana Arce Osuna, Victor Serrano and Claudia Marcela Salazar Arzate Centro Nacional de Metrologia (CENAM), Mexico Anatoliy Krylov and E. Lopushanskaya D.I. Mendeleyev Institute for Metrology (VNIIM), Russian Federation Jintana Nammoonnoy National Institute of Metrology Thailand (NIMT), Thailand
Transcript of CCQM-K109 High Polarity Analytes in Biological Matrix ...Determination of Urea and Uric Acid in...

Page 1 of 143
CCQM-K109
High Polarity Analytes in Biological Matrix: Determination of Urea and Uric Acid in Human Serum
Key Comparison
Track A
Final Report July 2018
Coordinating institute: Qinde Liu, Hong Liu, Yizhao Chen, Sharon Yong, Hui Ling Teo, Lingkai Wong and Tang Lin Teo Health Sciences Authority (HSA), Singapore With contributions from: Veronica Vamathevan National Measurement Institute, Australia (NMIA) Eliane C. P. do Rego, Wagner Wollinger, Jane L. N. Fernandes, Tania M. Monteiro, Bruno C. Garrido and Fernando M. Violante Instituto Nacional de Metrologia, Qualidade e Tecnologia (INMETRO), Brazil Lian Hua Shi, Hai Hong He, Can Quan, Bei Xu, Hong Mei Li, Xin Hua Dai and Ya Juan He National Institute of Metrology (NIM), China Man-fung Lo and Yiu-chung Yip Government Laboratory, Hong Kong (GLHK), Hong Kong SAR, China Julie Cabillic and Vincent Delatour Laboratoire National de Métrologie et d'Essais (LNE), France Rüdiger Ohlendorf and Andre Henrion Physikalisch-Technische Bundesanstalt (PTB), Germany Migaku Kawaguchi National Metrology Institute of Japan (NMIJ), Japan Dukjin Kang and Hwashim Lee Korea Research Institute of Standards and Science (KRISS), Republic of Korea Mariana Arce Osuna, Victor Serrano and Claudia Marcela Salazar Arzate Centro Nacional de Metrologia (CENAM), Mexico Anatoliy Krylov and E. Lopushanskaya D.I. Mendeleyev Institute for Metrology (VNIIM), Russian Federation Jintana Nammoonnoy National Institute of Metrology Thailand (NIMT), Thailand

Page 2 of 143
Ahmet Ceyhan Gören, Simay Gündüz and Hasibe Yilmaz TÜBİTAK Ulusal Metroloji Enstitüsü (UME), Turkey, (TÜBİTAK UME), Turkey Christopher Mussell and John Warren LGC, United Kingdom Jeanita S. Pritchett, Katrice Lippa, Michael A. Nelson, Blaza Toman, Lorna T. Sniegoski and David Duewer National Institute of Standards and Technology (NIST), United States of America

Page 3 of 143
TABLE OF CONTENTS
1. INTRODUCTION ............................................................................................................... 6
2. OBJECTIVES .................................................................................................................... 6
3. MEASURANDS ................................................................................................................. 7
4. THE COMPARISON MATERIALS ..................................................................................... 7
4.1. Homogeneity Studies ........................................................................................................ 8
4.2. Stability Studies ................................................................................................................11
5. SCHEDULE ......................................................................................................................15
6. INSTRUCTIONS TO PARTICIPATING INSTITUTES .......................................................15
7. REGISTRATION, SAMPLE RECEIPT AND REPORT SUBMISSION ...............................16
8. REPORTING OF RESULTS .............................................................................................18
9. RESULTS SUBMITTED BY PARTICIPATING INSTITUTES ............................................18
10. SUMMARY OF TECHNICAL INFORMATION ............................................................ 10-27
11. DISCUSSION OF RESULTS ............................................................................................39
11.1. Urea .................................................................................................................................39
11.2. Uric Acid ...........................................................................................................................39
12. EVALUATION OF RESULTS FOR KCRVs ......................................................................43
13. DEGREES OF EQUIVALENCE (DOE) CALCULATION ...................................................52
14. POLARITY vs LOG(KCRV) PLOT ....................................................................................64
15. CORE COMPETENCY AND HOW FAR DOES THE LIGHT SHINE? ...............................64
16. USE OF REPORT ............................................................................................................65
17. ACKNOWLEDGEMENT ...................................................................................................65
APPENDIX A: STUDY PROTOCOL .........................................................................................66
APPENDIX B: SUMMARY OF PARTICIPATING INSTITUTES’ UNCERTAINTY ESTIMATION APPROACHES ..................................................................................................71
NMIA .....................................................................................................................................71 INMETRO .............................................................................................................................74 NIM .......................................................................................................................................76 GLHK ....................................................................................................................................77 LNE .......................................................................................................................................79 PTB .......................................................................................................................................79 NMIJ .....................................................................................................................................88 KRISS ...................................................................................................................................89 CENAM .................................................................................................................................90 VNIIM ....................................................................................................................................92 HSA ......................................................................................................................................93 NIMT .....................................................................................................................................97 UME .................................................................................................................................... 100 LGC .................................................................................................................................... 101 NIST ................................................................................................................................... 103
APPENDIX C: WEIGHTED MEDIAN ANALYSIS ................................................................... 105 Uric acid (serum I) ............................................................................................................... 105 Uric acid (serum II) .............................................................................................................. 106 Urea (serum I) ..................................................................................................................... 107 Urea (serum II) .................................................................................................................... 108 References ......................................................................................................................... 108 Example OpenBUGS code .................................................................................................. 109 Example OpenBUGS output ............................................................................................... 110
APPENDIX D: COMPARISON OF DEGREE OF EQUIVALENCE ESTIMATES .................... 111

Page 4 of 143
APPENDIX E: CORE COMPETENCY TABLES ..................................................................... 115 NMIA (Urea) ........................................................................................................................ 115 NMIA (Uric acid) .................................................................................................................. 117 NIM (Urea & Uric acid) ........................................................................................................ 120 GLHK (Urea) ....................................................................................................................... 121 GLHK (Uric Acid) ................................................................................................................ 122 LNE (Urea & Uric acid) ........................................................................................................ 123 PTB (Urea) .......................................................................................................................... 124 PTB (Uric acid) .................................................................................................................... 125 NMIJ (Urea) ........................................................................................................................ 126 NMIJ (Uric acid) .................................................................................................................. 127 KRISS (Urea & Uric acid) .................................................................................................... 128 CENAM (Urea) .................................................................................................................... 130 CENAM (Uric acid) .............................................................................................................. 131 VNIIM (Urea & Uric acid) ..................................................................................................... 132 HSA (Urea) ......................................................................................................................... 133 HSA (Uric acid) ................................................................................................................... 135 NIMT (Urea & Uric acid) ...................................................................................................... 137 UME (Urea) ......................................................................................................................... 138 UME (Uric acid) ................................................................................................................... 139 LGC (Urea) ......................................................................................................................... 140 NIST (Urea)......................................................................................................................... 141 NIST (Uric acid) .................................................................................................................. 142
TABLE OF FIGURES
Figure 1: Information on the measurands ................................................................................... 7 Figure 2: Homogeneity assessment of urea (Serum I) ............................................................... 8 Figure 3: Homogeneity assessment of urea (Serum II) .............................................................. 9 Figure 4: Homogeneity assessment of uric acid (Serum I) ........................................................10 Figure 5: Homogeneity assessment of uric acid (Serum II) .......................................................11 Figure 6: Stability assessment of urea (Serum I) .......................................................................12 Figure 7: Stability assessment of urea (Serum II) ......................................................................12 Figure 8: Stability assessment of uric acid (Serum I) .................................................................13 Figure 9: Stability assessment of uric acid (Serum II) ................................................................13 Figure 10: Reported results for urea (Serum I) ..........................................................................20 Figure 11: Reported results for urea (Serum II) .........................................................................22 Figure 12: Reported results for uric acid (Serum I) ....................................................................24 Figure 13: Reported results for uric acid (Serum II) ...................................................................26 Figure 14: Reported results for urea (Serum I) relative to the KCRV .........................................48 Figure 15: Reported results for urea (Serum II) relative to the KCRV ........................................49 Figure 16: Reported results for uric acid (Serum I) relative to the KCRV ...................................50 Figure 17: Reported results for uric acid (Serum II) relative to the KCRV ..................................51 Figure 18: Degrees of equivalence, Di ± U(Di), for urea (Serum I) .............................................53 Figure 19: Relative degrees of equivalence, %Di ± U(%Di), for urea (Serum I)..........................54 Figure 20: Degrees of equivalence, Di ± U(Di), for urea (Serum II) ............................................56 Figure 21: Relative degrees of equivalence, %Di ± U(%Di), for urea (Serum II) ........................57 Figure 22: Degrees of equivalence, Di ± U(Di), for uric acid (Serum I) .......................................59 Figure 23: Relative degrees of equivalence, %Di ± U(%Di), for uric acid (Serum I) ...................60 Figure 24: Degrees of equivalence, Di ± U(Di), for uric acid (Serum I) .......................................62 Figure 22: Relative degrees of equivalence, %Di ± U(%Di), for uric acid (Serum II) ..................63 Figure 26: Polarity vs log(KCRV) for OAWG KC of clinical analytes in serum/plasma. ..............64

Page 5 of 143
TABLE OF TABLES
Table 1: Summary of ANOVA for urea (Serum I) ........................................................................ 8 Table 2: Summary of ANOVA for urea (Serum II) ....................................................................... 9 Table 3: Summary of ANOVA for uric acid (Serum I).................................................................10 Table 4: Summary of ANOVA for uric acid (Serum II)................................................................11 Table 5: Summary of statistics from stability study on urea and uric acid* .................................14 Table 6: Schedule for the comparison .......................................................................................15 Table 7: Information on participating NMIs/DIs, contacts and sample receipts ..........................17 Table 8: Summary of results for urea (Serum I).........................................................................19 Table 9: Summary of results for urea (Serum II) ........................................................................21 Table 10: Summary of results for uric acid (Serum I).................................................................23 Table 11: Summary of results for uric acid (Serum II)................................................................25 Table 12: Summary of sample size and pre-treatment for urea ........................................... 10-27 Table 13: Summary of sample size and pre-treatment for uric acid ..................................... 10-29 Table 14: Summary of analytical techniques for the measurement of urea ................................31 Table 15: Summary of analytical techniques for uric acid ..........................................................34 Table 16: Type of calibration, method of quantification, calibrants and internal standards used for measurement of urea ..................................................................................................37 Table 17: Type of calibration, method of quantification, calibrants and internal standards used for measurement of uric acid ............................................................................................38 Table 18: VNIIM original and revised data for uric acid in Serum I* ...........................................40 Table 19: CENAM’s original and revised data for uric acid in Serum I .......................................41 Table 20: CENAM’s original and revised data for uric acid in Serum II ......................................41 Table 21: KRISS’s original and revised data for uric acid in Serum I .........................................42 Table 22: Original and revised data for uric acid in Serum II from KRISS ..................................42 Table 23: Candidate KCRVs and uncertainties for urea in Serum I & II .....................................46 Table 24: Candidate KCRVs and uncertainties for uric acid in Serum I & II ...............................46 Table 25: Degrees of equivalence for urea (Serum I) ................................................................52 Table 26: Degrees of equivalence for urea (Serum II) ...............................................................55 Table 27: Degrees of equivalence for uric acid (Serum I) ..........................................................58 Table 28: Degrees of equivalence for uric acid (Serum II). ........................................................61

Page 6 of 143
INTRODUCTION 1.
Urea serves an important role in the metabolism of nitrogen-containing compounds by
humans and is the main nitrogen-containing substance in the urine of humans. The
cycling and excretion of urea by the kidneys are vital parts of mammalian metabolism that
remove unwanted waste from the body. High concentration of urea in the blood could be
a symptom of kidney or renal failure. Likewise, uric acid is a product of the metabolic
breakdown of purine nucleotides, and it is a normal component of urine. High blood
concentrations of uric acid can lead to gout and are associated with other medical
conditions including diabetes and the formation of kidney stones.
The OAWG has agreed on a list of Track A key comparisons to assess the core
competencies of National Metrology Institutes/Designated Institutes (NMIs/DIs) for the
delivery of measurement services to their customers. One of the Track A comparisons
discussed and agreed upon under the matrix category was “Polar Organic in Biological
Matrix”. In the OAWG meeting in November 2013 in Pretoria, South Africa, the meeting
discussed the possible analytes and biological materials in this comparison, which could
best cover current and future CMCs. The Health Sciences Authority (HSA), Singapore
suggested urea and uric acid in human serum as a possible comparison for this category
and presented a proposal at the meeting in April 2014 at BIPM. After considering the
services offered by the NMIs/DIs1 and that this would be the first Track A comparison for
biological materials, the OAWG agreed on the HSA’s proposal for urea and uric acid in
human serum as an appropriate comparison for this matrix category in April 2014. A key
comparison and a parallel pilot study were thus organised.
OBJECTIVES 2.
The comparison aimed to enable participating NMIs/DIs to demonstrate their competence
in the determination of high polarity organic compounds in a biological matrix. As a model
system for this comparison, two polar clinical biomarkers: urea and uric acid, in human
serum were chosen.
1 NMIs with existing CMCs for both urea and uric acid include KRISS (frozen human serum and
lyophilised human serum), PTB (blood serum), and NIST (human serum). NIM, China has a CMC for uric acid in human serum.

Page 7 of 143
MEASURANDS 3.
Urea CAS Number: 57-13-6
MW: 60.06 g/mol pKOW: 2.12
Uric acid CAS Number: 69-93-2
MW: 168.11 g/mol pKOW: 2.663
Figure 1: Information on the measurands
THE COMPARISON MATERIALS 4.
The comparison materials were frozen human sera. An experienced commercial human
blood products supplier (Solomon Park Research Laboratories, Kirkland, WA, USA) was
engaged by HSA to prepare the materials. Two pools of human serum materials with two
different concentration levels of urea and uric acid were prepared, and pre-packed in 260
vials containing 1 mL of serum each.
The mass fractions of urea and uric acid in the comparison materials were in the range of
100 to 2,000 and 10 to 165 mg/kg, respectively. One of the concentration levels is within
the normal biological range while the other is higher than normal range. The concentration
levels are within the range of existing CMC claims for these types of analytes in the BIPM
KCDB.
2 A.C. Moffat, M.D. Osselton, B. Widdap. Clarke’s Analysis of Drugs and Poisons. Pharm. Press,
Vol 2, 1690. 3 S.G. Machatha, S.H. Yalkowsky. Comparison of the octanol/water partition coefficients
calculated by ClogP®, ACDlogP and KowWin® to experimentally determined values, 294 (2005), 185.

Page 8 of 143
4.1. Homogeneity Studies
The homogeneity of the comparison materials was assessed by gas chromatography-
isotope dilution mass spectrometry (GC-IDMS). A sample size of 0.10 g was taken for the
study. Eleven vials were randomly and stratifically selected, and two subsamples were
taken from each vial. Using ANOVA at 95% level of confidence, both materials were
found to be sufficiently homogeneous. The plots showing the normalised concentrations
of urea and uric acid in two subsamples taken from 11 vials are given in Figures 2 to 5.
Summaries of the ANOVA for the homogeneity study are also given in Tables 1 to 4.
Figure 2: Homogeneity assessment of urea (Serum I)
Results are from two subsamples taken from 11 vials.
Table 1: Summary of ANOVA for urea (Serum I)
Source of variance SS DF MS F p-Value Fcritical
Between vials 9.46 10 0.946 1.12 42.5% 2.85
Within vials 9.29 11 0.844
Total 18.8 21 0.893
0.99
0.992
0.994
0.996
0.998
1
1.002
1.004
1.006
1.008
1.01
0 1 2 3 4 5 6 7 8 9 10 11 12
No
rmal
ized
Co
nce
ntr
atio
n
Bottle Number
Norm
alis
ed C
oncentr
ation

Page 9 of 143
Figure 3: Homogeneity assessment of urea (Serum II)
Results are from two subsamples taken from 11 vials.
Table 2: Summary of ANOVA for urea (Serum II)
Source of variance SS DF MS F p-Value Fcritical
Between vials 1.09 10 0.109 1.47 26.9% 2.85
Within vials 0.817 11 0.0743
Total 1.91 21 0.0908
0.99
0.992
0.994
0.996
0.998
1
1.002
1.004
1.006
1.008
1.01
0 1 2 3 4 5 6 7 8 9 10 11 12
No
rmal
ized
Co
nce
ntr
atio
n
Bottle Number
Norm
alis
ed C
oncentr
ation

Page 10 of 143
Figure 4: Homogeneity assessment of uric acid (Serum I)
Results are from two subsamples taken from 11 vials.
Table 3: Summary of ANOVA for uric acid (Serum I)
Source of variance SS DF MS F p-Value Fcritical
Between vials 0.486 9 0.0540 0.777 64.2% 3.02
Within vials 0.695 10 0.0695
Total 1.18 19 0.0621
0.95
0.96
0.97
0.98
0.99
1.00
1.01
1.02
1.03
1.04
1.05
0 1 2 3 4 5 6 7 8 9 10 11
No
rma
lise
d C
on
cen
tra
tio
n
Bottle

Page 11 of 143
Figure 5: Homogeneity assessment of uric acid (Serum II)
Results are from two subsamples taken from 11 vials.
Table 4: Summary of ANOVA for uric acid (Serum II)
Source of variance SS DF MS F p-Value Fcritical
Between vials 0.0606 10 0.00606 0.411 91.4% 2.85
Within vials 0.162 11 0.0147
Total 0.223 21 0.0106
The relative standard uncertainties of inhomogeneity were found to be below 0.04% and
0.18% for urea and uric acid (for both concentration levels), respectively.
4.2. Stability Studies
The stability of the comparison materials at -70 °C was assessed using GC-IDMS and
liquid chromatography-isotope dilution mass spectrometry (LC-IDMS) for urea and uric
acid, respectively. The same sample size as described in the homogeneity studies was
also used. The study was carried out on four occasions over a period of about 230 days
using classical design. On each occasion of the stability study, two vials were randomly
selected, and two subsamples were taken from each vial.
The plots showing the normalised concentrations of urea and uric acid over the period of
study are given in Figures 6 to 9. The effect of exposure time on the stability of the
0.95
0.96
0.97
0.98
0.99
1.00
1.01
1.02
1.03
1.04
1.05
0 1 2 3 4 5 6 7 8 9 10 11 12
No
rma
lise
d C
on
cen
tra
tio
n
Bottle

Page 12 of 143
measurands was determined by fitting linear regression lines to the data set. The slope
(b) was tested for statistical significance using Student’s t test at 95% confidence level,
where the t value was calculating by dividing b by its standard deviation s(b) and
compared against the critical t value. The statistical results given in Table 5 indicated that
no significant trend at 95% confidence level was detected.
Figure 6: Stability assessment of urea (Serum I)
Results are from two subsamples taken from two vials on four occasions.
Figure 7: Stability assessment of urea (Serum II)
Results are from two subsamples taken from two vials on four occasions.
Norm
alis
ed C
oncentr
ation
N
orm
alis
ed C
oncentr
ation

Page 13 of 143
Figure 8: Stability assessment of uric acid (Serum I)
Results are from two subsamples taken from two vials on four occasions.
Figure 9: Stability assessment of uric acid (Serum II)
Results are from two subsamples taken from two vials on four occasions.
Norm
alis
ed C
oncentr
ation
N
orm
alis
ed C
oncentr
ation

Page 14 of 143
Table 5: Summary of statistics from stability study on urea and uric acid*
Descriptions Urea Uric acid
Serum I Serum II Serum I Serum II
Slope of the regression line (b) 0.0081 -0.0005 0.0020 -0.0007
Intercept of the regression line
(b0)
1484.4 335.9 136.0 39.22
Variance of the points (s2) 2.073 0.627 0.952 0.022
Standard deviation of the
points (s) 1.440 0.792 0.976 0.148
Uncertainty of slope [s(b)] 0.0082 0.0046 0.0055 0.0009
Calculated t ()(bs
b)
0.99 0.11 0.35 0.87
Critical t factor (t0.95,n-2) 4.30 4.30 4.30 4.30
* Samples held at -70 °C for about 230 days
The relative standard uncertainties of instability were estimated to be below 0.21% and
0.46% for urea and uric acid (for both concentration levels), respectively.
The comparison samples were dispatched in dry ice to ensure their stability. The stability
of the comparison samples under the conditions of analysis, i.e. at room temperature (18
to 25 C), were not investigated. However, the participating institutes were requested to
analyse the materials immediately after they had thawed.

Page 15 of 143
SCHEDULE 5.
Table 6: Schedule for the comparison
Date Event
July 2015 Call for participation
February 2016 Distribution of study sample
September 2016 Deadline for submission of results
October 2016 Presentation of preliminary results at the OAWG meeting
February 2017 Preliminary Report
April 2017 2nd Presentation of results
September 2017 Draft A Report
March 2018 Draft B Report
July 2018 Final Report
INSTRUCTIONS TO PARTICIPATING INSTITUTES 6.
In the Study Protocol (Appendix A), the participating institutes were pre-notified that
comparison materials were tested non-reactive/negative for hepatitis B surface antigen
(HbsAg), human immunodeficiency (HIV) 1 and 2 antibodies, and hepatitis C virus (HCV)
by the supplier before distribution. However, the materials should be handled as
biohazards materials capable of transmitting infectious diseases.
Upon receipt, the comparison materials should be immediately stored at a temperature
below – 60 oC before measurement. The materials should be used immediately after they
are thawed, as measurements on vials which have been previously thawed and opened,
have not been conducted.
Each participating NMI/DI was provided with three vials of serum sample for each
concentration level and measurand that it registered for, i.e. a NMI/DI would receive a
total of 12 vials if it registered for both urea and uric acid. The participating NMIs/DIs
could use one of the three vials as a practice sample and should report the results for the
remaining two vials. At least two subsamples should be taken from each vial. The
participating NMIs/DIs were free to decide on the number of times that each subsample
was to be measured. Before sampling, the material should be allowed to thaw and warm
to room temperature (18 – 25 oC), and homogenised by gentle swirling and inversing the
vial several times. The subsamples taken from the same vial should be measured on the
same day. The recommended minimum subsample size was 0.10 g.

Page 16 of 143
The participating NMIs/DIs were requested to use their own methods for the
determination. Metrologically traceable certified reference materials (CRMs) should be
used as calibration standards.
REGISTRATION, SAMPLE RECEIPT AND REPORT SUBMISSION 7.
A total of 15 NMIs/DIs registered to participate in the measurement of both urea and uric
acid in the key comparison. Each participating NMI/DI was provided with three vials of
comparison materials for each concentration level of each measurand, i.e. a total of 12
vials were provided. One of the three vials could be used as a practice sample, while the
remaining two vials had to be used for reporting.
All the participating NMIs/DIs received the comparison materials intact and they were not
exposed to temperature above -60 C during transportation. Information on participating
NMIs/DIs, contacts and sample receipts are summarised in Table 7. Upon request,
CENAM was provided with two additional vials of Serum I for uric acid measurement as
all the earlier provided comparison materials were used up due to technical issues.

Page 17 of 143
Table 7: Information on participating NMIs/DIs, contacts and sample receipts
No. Participating Institutes Economy Contact Person Sample
Receipt Date
1 NMIA National Measurement Institute Australia
Australia Veronica Vamathevan
1 Mar 2016
2 INMETRO Instituto Nacional de Metrologia, Qualidade e Tecnologia
Brazil Eliane C. P. do Rego
16 Mar 2016
3 NIM National Institute of Metrology
China Can Quan 3 Mar 2016
4 GLHK Government Laboratory, Hong Kong
Hong Kong SAR, China
Man-fung Lo 1 Mar 2016
5 LNE Laboratoire National de Métrologie et d'Essais
France Julie Cabillic / Vincent Delatour
1 Mar 2016
6 PTB Physikalisch-Technische Bundesanstalt
Germany Rüdiger Ohlendorf and Andre Henrion
2 Mar 2016
7 NMIJ National Metrology Institute of Japan
Japan Migaku Kawaguchi
2 Mar 2016
8 KRISS Korea Research Institute of Standards and Science
Republic of Korea
Hwashim Lee 1 Mar 2016
9 CENAM Centro Nacional de Metrologia
Mexico Mariana Arce Osuna
4 Mar 2016
10 VNIIM D.I. Mendeleyev Institute for Metrology
Russian Federation
Anatoliy Krylov 28 Mar 2016
11 HSA Health Sciences Authority
Singapore Tang Lin Teo / Qinde Liu
Not applicable
12 NIMT National Institute of Metrology Thailand
Thailand Jintana Nammoonnoy
1 Mar 2016
13 UME TÜBİTAK Ulusal Metroloji Enstitüsü
Turkey Ahmet Ceyhan Gören
3 Mar 2016
14 LGC
United Kingdom
Christopher Mussell / John
Warren
1 Mar 2016
15 NIST National Institute of Standards and Technology
United States of America
Katrice Lippa 4 Mar 2016

Page 18 of 143
REPORTING OF RESULTS 8.
The participating institutes were requested to report their results based on at least four
subsamples (two subsamples from each vial) for each level. The results were to be
reported in the unit of mg/kg and should include standard and expanded uncertainties
(95% level of confidence) for the mean of the replicate determinations. Information on
measurement procedure, calibration standard, internal standard, quality control material,
calculation of the results, and estimation of measurement uncertainty had to be provided
as well.
RESULTS SUBMITTED BY PARTICIPATING INSTITUTES 9.
For urea and uric acid in both Serum I and II comparison materials, 15 and 14 results
were received, respectively. Table 8 and

Page 19 of 143
Table 9 summarise the results for urea in Serum I and Serum II.

Page 20 of 143
Table 8: Summary of results for urea (Serum I)
NMI/DI Mean of Bottle
1 (mg/kg) Mean of Bottle
2 (mg/kg)
Overall mean of results (mg/kg)
Total no. of subsamples for
calculation of the overall mean
Combined standard
uncertainty (mg/kg)
Coverage factor, k (95%
confidence level)
Expanded uncertainty at approximately 95%
confidence level (mg/kg)
NMIA 1473 1464 1469 8 10 1.97 20
INMETRO 1363 1434 1399 4 131 2 262
NIM 1475 1485 1481 8 16 2 32
GLHK 1516 1512 1514 9 22 2 44
LNE 1477 1468 1473 6 14 2 28
PTB 1487.3 1486.0 1486.7 6 7.5 2.0 15.0
NMIJ 1477 1473 1475 # 5 2 10
KRISS 1600.9 1607.5 1604.2 4 13.0 2.26 29.3
CENAM 1480.7 1490.8 1485.7 4 9.8 2 19.6
VNIIM 1506 1502 1504 6 37.6 2 75
HSA 1476.9 1477.5 1477 8 12.2 2 24
NIMT 1466 1446 1456 6 16 2.10 33
UME 1609.535 1618.622 1614.079 6 15.954 2 31.908
LGC 1552 1554 1553 6 10 2.571 26
NIST 1499.6 1515.6 1505.8 4 18.4 2 36.8
# Indicated as “Bottle × Sample prep. × Analysis = 2 × 3 × 3”

Page 21 of 143
Figure 10: Reported results for urea (Serum I)
Bars represent standard uncertainties. INMETRO’s result (blue diamond) was obtained using spectroscopic method (HPLC-DAD) rather than IDMS.

Page 22 of 143
Table 9: Summary of results for urea (Serum II)
NMI/DI
Mean of Bottle 1 (mg/kg)
Mean of Bottle 2 (mg/kg)
Overall mean of results (mg/kg)
Total no. of subsamples for
calculation of the overall mean
Combined standard
uncertainty (mg/kg)
Coverage factor, k (95%
confidence level)
Expanded uncertainty at approximately 95%
confidence level (mg/kg)
NMIA 327.2 329.5 328.4 8 2.6 1.97 5.1
INMETRO 306 298 302 4 28 2 56
NIM 334.6 334.9 334.8 8 4.0 2 8.0
GLHK 329.8 331.3 330.6 8 4.8 2 9.7
LNE 330 343 337 6 8 2 16
PTB 334.3 334.1 334.2 6 1.7 2.0 3.4
NMIJ 333.6 333.8 333.7 # 1.9 2 3.7
KRISS 335.9 337.8 336.9 4 2.5 2.31 5.7
CENAM 339.9 337.0 338.4 4 3.86 2 7.7
VNIIM 336.2 336.47 336 6 5.04 2 10
HSA 334.15 332.59 333.4 8 2.72 2 5.4
NIMT 331.9 329.8 329.0 6 6.1 2.13 13
UME 357.872 355.569 356.72 6 3.526 2 7.052
LGC 342.8 342.8 342.8 6 2.5 2.571 6.4
NIST 331.5 332.4 331.8 4 4.4 2 8.8
# Indicated as “Bottle × Sample prep. × Analysis = 2 × 3 × 3”

Page 23 of 143
Figure 11: Reported results for urea (Serum II)
Bars represent standard uncertainties. INMETRO’s result (blue diamond) was obtained using spectroscopic method (HPLC-DAD) rather than IDMS.

Page 24 of 143
Table 10: Summary of results for uric acid (Serum I)
NMI/DI
Mean of Bottle 1 (mg/kg)
Mean of Bottle 2 (mg/kg)
Overall mean of results (mg/kg)
Total no. of subsamples for
calculation of the overall mean
Combined standard
uncertainty (mg/kg)
Coverage factor, k (95%
confidence level)
Expanded uncertainty at approximately 95%
confidence level (mg/kg)
NMIA 137.4 135.9 136.4 12 2 2.05 4.1
INMETRO 162 142 152 4 10 2 21
NIM 137.0 136.1 136.5 6 1.5 2 3.0
LNE 137.4 135.3 136.4 6 1.4 2 2.8
PTB 134.18 134.86 134.52 6 0.72 2.03 1.5
GLHK 136.0 136.4 136.2 9 2.5 2 5.0
NMIJ 137.8 138.9 138.3 # 0.9 2 1.9
KRISS* 145.9 146.7 146.4 6 1.5 3.18 4.9
KRISSa 139.2 140.9 140.0 6 0.7 2.12 1.4
CENAM 149.82 150.87 150.42 4 5.95 2 11.91
CENAM-1a 133.9 9 1.65 2 3.3
CENAM-2a 139.9 4 1.3 2 2.6
VNIIM 122.19 125.36 123.8 6 3.34 2 6.7
VNIIMb 129.79 133.16 131.5 6 3.34 2 6.7
HSA 136.8 136.81 136.8 8 1.41 2 2.8
NIMT 135.0 134.9 134.6 8 1.5 2.16 3.2
UME 148.706 148.355 148.530 6 2.105 2 4.211
NIST 135.5 136.2 135.8 4 1.7 2 3.4
# Indicated as “Bottle × Sample prep. × Analysis = 2 × 3 × 6”; * Mean of Bottle 3: 146.6 mg/kg;
Mean of Bottle 3: 140.0 mg/kg;
a Investigational study, result not used in analysis;
b Re-calculated value, not used in analysis

Page 25 of 143
Figure 12: Reported results for uric acid (Serum I)
Bars represent standard uncertainties. INMETRO’s result (blue diamond) was obtained using standard addition with LC-MS/MS. The results from re-calculation and investigation (yellow boxes) by VNIIM and KRISS are included for information, as are CENAM’s 1
st (yellow box) and 2
nd (purple box) investigational results.

Page 26 of 143
Table 11: Summary of results for uric acid (Serum II)
NMI/DI
Mean of Bottle 1 (mg/kg)
Mean of Bottle 2 (mg/kg)
Overall mean of results (mg/kg)
Total no. of subsamples for
calculation of the overall mean
Combined standard
uncertainty (mg/kg)
Coverage factor, k (95%
confidence level)
Expanded uncertainty at approximately 95%
confidence level (mg/kg)
NMIA 39.4 39.2 39.2 12 0.6 2.03 1.2
INMETRO 43 43 43 4 3 2 5
NIM 39.6 39.78 39.67 5 0.65 2 1.3
LNE 39.1 40.0 39.6 6 0.61 2 1.2
PTB 39.36 39.38 39.37 6 0.20 2.0 0.41
GLHK 38.6 39.0 38.8 10 0.8 2 1.6
NMIJ 39.38 39.37 39.37 # 0.17 2 0.34
KRISS* 42.4 42.3 42.3 6 0.5 2.57 1.4
KRISSa 40.2 40.5 40.3 6 0.2 2.12 0.4
CENAM 45.14 45.36 45.25 4 0.68 2 1.37
CENAM-1a 38.7 9 0.60 2 1.2
CENAM-2a 40.3 4 0.57 2 1.1
VNIIM 38.94 39.01 39.0 6 1.01 2 2.0
HSA 39.281 39.306 39.29 8 0.407 2 0.81
NIMT 38.76 38.35 38.66 6 0.52 2.04 1.07
UME 40.150 39.731 39.940 6 0.566 2 1.132
NIST 38.9 39.2 39.1 4 0.5 2 1.0
# Indicated as “Bottle × Sample prep. × Analysis = 2 × 3 × 6”; * Mean of Bottle 3: 42.3 mg/kg;
Mean of Bottle 3: 40.1 mg/kg;
a Investigational study, result not used in analysis

Page 27 of 143
Figure 13: Reported results for uric acid (Serum II) Bars represent standard uncertainties. INMETRO’s result (blue diamond) was obtained using standard addition with LC-MS/MS. The result from investigation (yellow box) by
KRISS is included for information, as are CENAM’s 1st (yellow box) and 2
nd (purple box) investigational results.

Page 10-28 of 143
SUMMARY OF TECHNICAL INFORMATION 10.
The following Tables summarise the technical information provided in the Report of
Results Forms from participating NMIs/DIs. The participating institutes’ measurement
uncertainty statements are provided in Appendix B.
Table 12: Summary of sample size and pre-treatment for urea
NMI/DI Sample Size (g) Pre-treatment
NMIA 0.1 g Protein precipitation with 3 mL ethanol followed by derivatisation with 0.3 mol/L malonaldehyde bis(dimethylacetal) in the presence of hydrochloric acid. Derivatised samples were cleaned-up using HILIC HPLC using an amino phase (Alltech
Alltima, 4.6 × 250 mm, 5 m) and an acetonitrile/water mobile phase. A fraction containing the 2-hydroxypyrimidine derivative of urea was collected for analysis.
INMETRO 0.1 g Protein precipitation with 2.5 volumes acetonitrile, centrifugation.
NIM 0.2 mL Protein precipitation was used. After spiking the labeled 13C,15N2-Urea as internal stand, the sample was added acetonitrile for protein precipitation. The mixture was shaken gently for 30 min using an orbital shaker, and was centrifuged at 8000 rpm for 15min. The upper supernatant was dried under nitrogen at 40℃, and the residue was diluted with a mobile phase to a urea concentration of ~ 10 mg/kg, and was filtered with a 0.22µm filter for LC/MS.
GLHK 0.1 g Appropriate amount isotopic internal standard solution was gravimetrically added to the sample. Acetonitrile was added for protein precipitation. The sample was then centrifuged, filtered and dried under gentle nitrogen flow. 2 mmol/L NH4OH solution was added for reconstitution.
LNE 0.1 g Add 3 mL ethanol. Precipitation of proteins was done by intensive shaking with vortex mixer. Centrifugation 10°C, 10 min, 2800 g for phase separation.
PTB 0.25 g Protein precipitation with ethanol
NMIJ 0.1 g Protein precipitation
KRISS >0.1 g Precipitation of protein with acetonitrile corresponding to 10 times of sample volume – Centrifugation – Drying of supernatant – Dissolving with water - Filtration with 0.2 μm filter – Analysis by LC/MS/MS.
CENAM 0.3 g Protein precipitation
VNIIM 0.1 g Protein precipitation by acetonitrile

Page 10-29 of 143
HSA 0.1 g Protein precipitation was used for clean-up. The details are as follows: After spiking the isotope labelled internal standard solution, the sample was vortexed, and allowed to equilibrate at ambient temperature for 2 h. Acetonitrile (3 fold of aqueous volume) was then added for protein precipitation. The sample was vortexed vigorously and centrifuged for 5 min at 4000 rpm. The supernatant was filtered through 0.22 µm syringe filter. For LC-MS/MS analysis, the filtrate was diluted to approximately 2000 ng/g with acetonitrile.
NIMT 0.1 g Ethanol was used for protein precipitation
UME 0.1 g Protein precipitation with acetonitrile, sample dilution, vortex, centrifuge, filtration
LGC 0.2 g Protein precipitation with 10 mL of 10 mmol/L ammonium acetate solution: acetonitrile (10:90 v/v) followed by centrifugation.
NIST 0.09297 g – 0.09730 g (Serum I) & 0.32316 g – 0.32506 g (Serum II)
Solid phase extraction: Sep-Pak Vac RC (500 mg) C18 cartridges

Page 10-30 of 143
Table 13: Summary of sample size and pre-treatment for uric acid
NMI/DI Sample Size (g) Pre-treatment
NMIA 0.1 g Protein precipitation using 200 mL acetonitrile. Sample extracts were cleaned-up using reversed-phase HPLC (Grace Platinum C18-EPS, 4.6 × 250 mm, 5 mm, acetonitrile/0.2% acetic acid (aqueous) mobile phase). A fraction containing uric acid was collected for analysis.
INMETRO 0.1 g Protein precipitation with 2.5 volumes acetonitrile, centrifugation.
NIM 0.2 mL Protein precipitation was used. After spiking the labeled 13C,15N2-Urea as internal stand, the sample was added acetonitrile for protein precipitation. The mixture was shaken gently for 30 min using an orbital shaker, and was centrifuged at 8000 rpm for 15 min. The upper supernatant was dried under
nitrogen at 40℃, and the residue was diluted with a mobile phase to a uric acid concentration of ~ 10 mg/kg, and was filtered with a 0.22 µm filter for LC/MS.
GLHK 0.1 g Appropriate amount isotopic internal standard solution was gravimetrically added to the sample. Acetonitrile was added for protein precipitation. The sample was then centrifuged, filtered and dried under gentle nitrogen flow. 2 mmol/L NH4OH solution was added for reconstitution.
LNE 0.1 g Add of acetonitrile. Precipitation of proteins was done by intensive shaking with vortex mixer. Centrifugation 10°C, 5 min, 1700 g for phase separation
PTB 0.25 g Ion exchange chromatography, AG1-X2 resin
NMIJ 0.1 g Protein precipitation
KRISS >0.1 g 1. The sample clean-up was carried out by the protein precipitation with acetonitrile and followed by a heating at 60°C for 2 hours. 2. After centrifugation, the supernatant was lyophilized with a speed-vac and then reconstituted with 1 mmol/L NH4OH. 3. The sample was purified with 0.2 µm membrane for next LC-MRM analysis
CENAM 0.3 g (Serum I) 0.2 g (Serum II)
Liquid-liquid, protein precipitation
VNIIM 0.1 g Protein precipitation by acetonitrile
HSA 0.1 – 0.15 g
SPE was used for clean-up. The details are as follows: After spiking the isotope labelled internal standards, the sample was vortexed, and allowed to equilibrate at ambient temperature for 2 h. The sample was then vortexed, and SPE was conducted using Waters Oasis MAX cartridge (30 µm, 1 cc, 30 mg). The eluent was dried under nitrogen at 45 °C, and was then reconstituted with 2 mmol/L ammonia solution (concentration about 500 ng/g) for LC-MS/MS analysis.
NIMT 0.1 g Acetonitrile was used for protein precipitation

Page 10-31 of 143
NMI/DI Sample Size (g) Pre-treatment
UME 0.1 g Protein precipitation with acetonitrile, sample dilution, vortex, centrifuge, filtration
NIST 0.14735 g – 0.15777 g (Serum I) & 0.45288 g – 0.46282 g (Serum II)
Solid phase extraction: Bio-Rad Poly-Pre prefilled chromatography columns, AG 1-X8 resin, 100-200 Mesh, chloride form, 0.8 X 4 cm.

Page 32 of 143
Table 14: Summary of analytical techniques for the measurement of urea
NMI/DI Analytical Technique Chromatographic Conditions
Ion/MRM monitored
NMIA GC-HRMS (EI)
Injection mode: PTV Constant Temperature Split at 250 °C, injection volume: 1 µL, carrier gas: helium, column: Agilent J&W VF-17MS (0.25 mm × 30 m, 0.25 µm), carrier flow rate: 0.8 mL/min
Temperature program: 75 °C hold for 6 minutes, ramp at 5 °C/min to 120 oC, ramp at 30 °C/min to 325 °C, hold for 5 minutes
153.04787 / 156.04529
INMETRO HPLC-DAD Column: Luna C18(2) column (250 mm × 4.6 mm, 5 µm) Temperature: 25 ºC. Flow rate of 1.0 mL/min LC run mode: isocratic mode
Mobile phase: water : methanol (90:10, v/v).
-
NIM LC-MS (ESI+)
Column: Agilent Zorbax SB-CN (4.6 mm × 250 mm × 5 µm); Flow rate : 0.5 mL/ min
Mobile phase: 50:50 (Methanol: H2O with 0.1% formic acid)
Temperature: Room temperature
61.1 / 64.1
GLHK GC-MS (EI) Column: DB-5MS (30 m × 0.25 mm, 0.25 µm)
Temperature Programme: 70 °C for 1 min, then 10 °C/min to 150 °C and then 10 °C/min to 240 °C and hold at temperature for 1 min. (Injection Mode: Split)
153 / 158
LNE GC-MS (EI) Column: DB-5 MS, (30 m × 0.25 mm × 0.25 µm) ; Oven : 70°C 10°C/min to 150°C followed by 20°C/min to 240°C. Inlet : 300°C, split, Flow rate: 1.3 mL/min
153 / 156
PTB GC-MS (EI) Column: OPTIMA-5-MS 5%Phenyl-95%Methylpolysiloxane (30 m × 0.25 mm)
Temperature programme: 60°, 1 min …10°/min →100°, 0 min ... 20°/min →150°, 0 min … 40°/min →250°, 5min
Injector: splitless. Injection volume: 1 µl
153.0484 / 156.0458
NMIJ GC-MS (EI) Column: DB-5MS (30 m × 0.25 mm × 0.25 μm).
Mobile phase: He (1 mL/min).
Oven: 60 °C (hold 1 min) → 15 °C/min → 300 °C (hold 3 min). Injection: split (50:1)
153 / 156

Page 33 of 143
KRISS LC-MS (ESI+)
Column: Thermo Hypersil Gold AQ (150 mm × 4 mm, 5 μm).
Mobile phase: Water 100%.; Column temperature: Room temp.
LC run mode: Isocratic. Flow rate: 0.7 mL/min. Injection mode: full loop mode
61.1 → 44.1,
63.1 → 45.1
CENAM GC-MS (EI)
Column: HP-1MS (30 m × 320 µm × 0.25 µm)
Flow: 2 mL/min. Run: 70 °C for 1 min; 10 °C/min to 150°C;
Post run: 240 °C for 5 min.
168 / 171
VNIIM LC-MS/MS (ESI+)
Column: Kinetex HILIC (2.6 μm × 150 mm × 4.6 mm).
Mobile phase A: Water +5 mmol Ammonium acetate + 0.1% acetic acid - 10%.
Mobile phase B: Acetonitrile - 90%. isocratic
61.1 → 44.1,
64.1 → 47.1
HSA LC-MS/MS
(ESI+) & GC-MS (EI)
LC-MS/MS conditions:
Column: Agilent RX-SIL (2.1 mm × 150 mm, 5 µm). Mobile phase A: 0.1% formic acid in water (v/v). Mobile phase B: 0.1 formic acid in acetonitrile (v/v). Binary setting: 95% mobile phase B (isocratic, post wash with 40% mobile phase B after each injection). Injection volume: 10 µL. Flow rate: 0.5 mL/min.
GC-MS conditions:
Column: Agilent DB-5MS (30 m, 0.25 µm, 0.25 mm). Oven programme: 80 °C for 1 min, then 10 °C/min to 120 °C for 2 min. Inlet temperature: 250 °C. Transfer line: 270 °C. Inject volume: 1 µL
LC-MS/MS:
61→44, 64→46
GC-MS:
153 / 156
NIMT LC-MS/MS (ESI+)
Column: Zorbax RX-Sil Narrow-bore (2.1 m × 150 mm × 5 µm)
Mobile Phase: Isocratic, 90% of MeOH (0.1% formic acid) and 10% of H2O (0.1% formic acid). Flow rate: 0.4 mL/min. Injection Volume: 5 µL
61.00 → 44.05,
64.00 → 46.05
UME LC-HRMS (ESI+)
Column: Synergy Max (150 mm × 2 mm × 5 µm).
Mobile phase 10 mmol/L ammonium acetate (aq) : Acetonitrile, 30:70 Flow rate: 0.250 mL/min, column temperature: 30 °C. Injection volume: 2 µL.
61.0406 / 63.0346
LGC LC-MS/MS
(ESI+)
Column: SeQuant ZIC-HILIC (5 µm × 150 mm × 2.1 mm, 200Å).
Mobile phase: 10 mmol/L ammonium acetate solution and acetonitrile.
Column temperature: 30 ºC. Injection volume: 20 µL
61.2 → 44.5,
64.2 → 46.5

Page 34 of 143
NIST GC-MS (EI)
Column: DB-5 MS (30 m × 0.25 mm × 0.25 µm);
Injector temperature: 220 °C, MS source: 230 °C, MS quad: 150 °C, Auxiliary heater: 200 °C, Column pressure: 18.7 psi (constant pressure), and the initial flow rate 1.6 mL/min.
The temperature program was 80 °C (initial temperature), 1 min (hold time), 7 °C/min (heating rate), to 120 °C, 30 °C/min to 250 °C (final temperature), 1 min (hold time). The EMV was set to the tune voltage. The amount injected was 1 µL. The split injection mode was used with a split ratio of 25:1.
168 / 170

Page 35 of 143
Table 15: Summary of analytical techniques for uric acid
NMI/DI Analytical Technique Chromatographic Conditions
Ion/MRM monitored
NMIA GC-MS/MS (EI)
Injection mode: Split mode at 250 °C, injection volume: 1 µL, carrier gas: helium
Column: Agilent J&W DB-5MS (0.25 mm × 30 m, 0.25 µm)
Carrier flow rate: 0.8 mL/min. Temperature program: 120 °C hold for 2 minutes, ramp at 5 °C/min to 180 °C, ramp at 20 °C/min to 300 °C, ramp at 60 °C/min to 320 °C, hold for 5 minutes
456→367,
458→369
INMETRO LC-MS/MS Column: HILIC column (100 mm × 2.1 mm, 1.7 µm). Temp: 25 ºC.
Flow rate: 0.3 mL/min
Mobile phase A: Acetic acid pH=3.0; B: acetonitrile
Gradient ranging from 50% to 90%B.
167 → 124
NIM LC-MS (ESI-) Column: ACQUITY UPLC BEH C18 (2.1 mm × 150 mm, 1.7 µm)
Mobile phase: 20 mmol/L NH4OAc pH 4.6. Flow rate: 0.2 mL/min. Temperature: Room temperature. Injection volume: 5µL
167.1/ 169.1
GLHK LC-MS (ESI+)
Column: SIELC Obelisc R (150 mm × 2.1 mm, 5µm)
Mobile Phase: (A) 0.1% formic acid in water; (B) Acetonitrile
Mobile Phase Programme:
Time (min) Flow Rate (mL/min) %A %B
0 0.2 98 2
6.5 0.2 98 2
6.6 0.5 30 70
11.5 0.5 30 70
11.6 0.2 98 2
18.5 0.2 98 2
169 → 141,
171 → 143
LNE LC-MS (ESI-) Column: C18. Mobile phase: A: 95% water/ 5% Acetonitrile; B: Acetonitrile; C: 5 mmol/L ammonium acetate + 0.05% Formic acid.
Flow rate: 0.2 mL/min. 1% A and 99% C
167/ 169

Page 36 of 143
NMI/DI Analytical Technique Chromatographic Conditions
Ion/MRM monitored
PTB GC-MS (EI) Column: OPTIMA-5-MS 5%Phenyl-95%Methylpolysiloxane (30 m × 0.25 mm) Temp. programme: 80°C,1min…15°/min followed by 300°C, 5min. Injector: splitless, Injection volume: 1 µL
567.3038/ 569.2979
NMIJ LC-MS/MS (ESI-)
Column: HILIC COSMOSIL (2.0 mm × 150 mm)
Mobile phase: 10 mmol/L ammonium acetate/ acetonitrile (60/40).
Flow rate: 0.2 mL/min. Column temp.: 40 ℃
167/96, 169/97
KRISS LC-MS (ESI+)
Column: ACQUITY UPLC HSS C18 (2.5 mm × 100 mm, 1.8 µm). Isocratic elution with a mobile phase [20 mmol/L ammonium acetate in water/MeOH (v/v, 10/90)]. Flow rate: 0.2 mL/min.
Temp. of LC run: room temp. Injection mode: full loop mode
168.9 → 141.0,
170.9 → 143.0
CENAM LC-MS (ESI+) Column: Waters Xterra RP18 (3.0 mm × 250 mm, 5µm). Mobile phase: ammonium acetate 20 mmol/L flow: 0.45 mL/min. Room temperature: 20°C
169/ 171
VNIIM LC-MS/MS (ESI-)
Column: Discovery HS F5 (150 mm × 4.6mm, 5 µm)
Mobile phase A: Water + 0.05% Acetic Acid - 10%.
Mobile phase B: Acetonitrile - 90% isocratic.
167.1→ 124,
167.1→ 125
HSA LC-MS/MS (ESI-) & GC-MS (EI)
LC-MS/MS conditions:
Column: Agilent Zorbax SB-Aq (2.1 mm × 100 mm, 3.5 µm)
Mobile phase A: 5 mmol/L ammonium formate with 0.05% formic acid in water (v/v). Mobile phase B: acetonitrile.
Binary setting: 2% mobile phase B (isocratic, post wash with 90% mobile phase B after each injection).
Injection volume: 10 µL. Flow rate: 0.3 mL/min.
GC-MS conditions:
Column: Agilent DB-5MS (30 m, 0.25 µm, 0.25 mm).
Oven programme: 200 °C for 1 min, then 30 °C/min to 280 °C for 6.3 min. Inlet temperature: 280 °C. Transfer line: 270 °C. Inject volume: 1 µL.
LC-MS/MS:
167 → 124,
169 → 125
GC-MS:
567.3/ 569.3

Page 37 of 143
NMI/DI Analytical Technique Chromatographic Conditions
Ion/MRM monitored
NIMT LC-MS/MS
(ESI-)
Column: Inertsil® ODS-SP (2.1 mm × 150 mm, 5 µm).
Mobile Phase: Isocratic, 10% of MeOH (0.1% formic acid) and 90% of H2O (0.1% formic acid). Flow rate: 0.2 mL/min. Injection Volume: 5 µL.
166.89 →123.95,
168.83 →124.95
UME LC-HRMS (ESI+)
Column: Synergy Max (150 mm × 2 mm, 5 µm)
Mobile phase:10 mmol/L ammonium acetate (aq) Acetonitrile (30:70). Flow rate: 0.250 mL/min, column temperature: 30 °C. Injection volume was 2 µL.
169.0356/ 171.0294
NIST GC-MS (EI)
Column: DB-5 MS (30 m × 0.25 mm × 0.25 µm); Injector temperature was 280 °C, the MS source 200 °C, the MS quad 200°C, the auxiliary heater 280 °C, the column pressure 18.7 psi (constant pressure), and the initial flow rate 1.6 mL/min. Spilt ratio: 25:1.
The temperature program was 200 °C (initial temperature), 1 min (hold time), 16 °C/min (heating rate), to 300 °C, (final temperature), 2 min (hold time), for a total time of 9.25 min.
567/ 569

Page 38 of 143
Table 16: Type of calibration, method of quantification, calibrants and internal standards used for measurement of urea
NMI/DI Type of Calibration Method of Quantification Calibrants Internal Standards
NMIA Isotope dilution Single-point calibration / Bracketing calibration
NMIJ CRM 6006-a 13C,15N2-Urea
INMETRO Standard addition - NIST SRM 912a -
NIM Isotope dilution Single-point calibration GBW09201 13C,15N2-Urea
GLHK Isotope dilution Bracketing calibration NIST SRM 912a 13C,15N218O-Urea
LNE Isotope dilution Multi-level calibration NIST SRM 912a 13C,15N2-Urea
PTB Isotope dilution Single-point calibration NIST SRM 912a 13C,15N2-Urea
NMIJ Isotope dilution Bracketing calibration NMIJ CRM 6006-a 13C,15N2-Urea
KRISS Isotope dilution Single-point calibration NIST SRM 912a 13C,15N2-Urea
CENAM Isotope dilution Single-point calibration NMIJ CRM 6006-a 13C,15N2-Urea
VNIIM Isotope dilution Single-point calibration NIST SRM 912a 13C,15N2-Urea
HSA Isotope dilution Multi-level calibration NIST SRM 912a 13C,18O-Urea
LGC Isotope dilution Single-point calibration / Bracketing calibration / Multi-level calibration
NIST 13C,15N2-Urea
NIMT Isotope dilution Single-point calibration NIST SRM 912a 13C,15N2-Urea
UME Isotope dilution Multi-level calibration Sigma Aldrich, purity assessed with mass balance via TGA/DSC and LC-MS. Capability demonstrated in the
K55 series.
13C,15N2-Urea
NIST Isotope dilution Multi-level calibration NIST SRM 912a 13C,15N2-Urea

Page 39 of 143
Table 17: Type of calibration, method of quantification, calibrants and internal standards used for measurement of uric acid
NMI/DI Type of Calibration Method of Quantification Calibrants Internal Standards
NMIA Isotope dilution Single-point calibration Bracketing calibration
NIST SRM 913b 1,3-15N2-Uric acid
INMETRO Standard addition - NIST SRM 913b -
NIM Isotope dilution Single-point calibration GBW09202 1,3-15N2-Uric acid
GLHK Isotope dilution Bracketing calibration NIST SRM 913b 1,3-15N2-Uric acid
LNE Isotope dilution Multi-level calibration NIST SRM 913b 1,3-15N2-Uric acid
PTB Isotope dilution Single-point calibration NIST SRM 913a 1,3-15N2-Uric acid
NMIJ Isotope dilution Bracketing calibration NMIJ CRM 6008-a 1,3-15N2-Uric acid
KRISS Isotope dilution Single-point calibration NIST SRM 913b 1,3-15N2-Uric acid
CENAM Isotope dilution Single-point calibration NMIJ CRM 6008-a 1,3-15N2-Uric acid
VNIIM Isotope dilution Single-point calibration NIST SRM 913b 1,3-15N2-Uric acid
HSA Isotope dilution Multi-level calibration NIST SRM 913a 1,3-15N2-Uric acid
NIMT Isotope dilution Single-point calibration NIST SRM 913b 1,3-15N2-Uric acid
UME Isotope dilution Multi-level calibration Sigma Aldrich, purity assessed with mass balance via TGA/DSC and LC-MS.
Capability demonstrated in the K55 series.
1,3-15N2-Uric acid
NIST Isotope dilution Multi-level calibration NIST SRM 913a 1,3-15N2-Uric acid

Page 40 of 143
DISCUSSION OF RESULTS 11.
11.1. Urea
The result set for urea had an overall relative standard deviation (RSD) of 3.7 % and
3.3 % relative to the arithmetic mean for all 15 participating institutes of the key
comparison for Serum I and II, respectively.
The lowest results from INMETRO were obtained using spectroscopy rather than IDMS.
The higher results from LGC, KRISS and UME were discussed. During the meeting in
October 2016, LGC shared that they achieved excellent precision for both pools of serum
and excellent agreement with the NIST serum SRM but one of their results for Serum I
was higher than the main set of results. They could not determine a reason for this.
The results from UME for both serum pools were high, but no further comments were
provided by UME for these observations.
Following the meeting in April 2017, KRISS acknowledged that the comparison materials
were not treated in accordance with the Study Protocol. The results were reported from
measurements of aliquoted comparison materials, which had been subjected to more
than one round of freeze-thaw cycle. Following a precedence in CCQM-K102, KRISS
agreed that the results on urea would not be included for the calculation of the KCRV.
11.2. Uric Acid
The result set for uric acid had an overall RSD of 5.5 % and 4.8 % relative to the
arithmetic mean for all 14 participating institutes of the key comparison for Serum I and II,
respectively.
For INMETRO, results for both Serum I and II were high and these were obtained using
standard addition technique rather than IDMS.
The result for Serum I from UME was significantly higher, but no comment was provided
on this by UME.
VNIIM’s result for Serum I was 9.2 % lower than the main set of data4. Following the
meeting in October 2016, VNIIM informed HSA regarding a calculation error, leading to
the low reported result for this serum pool. Hence, this result would not be included in the
4 Relative to the median for uric acid in Serum I given in Table 24.

Page 41 of 143
calculation of the KCRV. The Table below summarises VNIIM’s original reported and
corrected results.
Table 18: VNIIM original and revised data for uric acid in Serum I*
Original data Revised data
Mean of results of Bottle 1 (mg/kg) 122.19 129.79
Mean of results of Bottle 2 (mg/kg) 125.36 133.16
Overall mean of results (mg/kg) 123.8 131.5
* No change to VNIIM’s other results.
During the meeting in October 2016, CENAM shared its problems with the calibrant and
solubility, as well as difficulties in optimising the equilibration. After the meeting, CENAM
was provided with additional samples for a re-measurement using their GC-IDMS method
(LC-IDMS was employed during the comparison). During the meeting in April 2017,
CENAM presented the results of its investigation. The GC-IDMS5 results agreed well with
the majority of the reported results. After the meeting in April 2017, CENAM was provided
with further samples for a re-measurement using the GC-IDMS method6 and confirmed
the findings of its first investigation. CENAM agreed to exclude its results for uric acid in
the calculation of the KCRV for both Serum I and II. The Tables below summarises
CENAM’s original reported results and those from the investigative studies.
5 Re-measurement was not conducted using LC-IDMS.
6 The investigative study was conducted at NIST as the Analyst who performed the original work
was under secondment.

Page 42 of 143
Table 19: CENAM’s original and revised data for uric acid in Serum I
Method
Overall mean
(mg/kg)
Total no. of
subsamples
for calculation
of the overall
mean
Combined
standard
uncertainty
(mg/kg)
Coverage
factor, k (95%
confidence
level)
Expanded
uncertainty at
approximately 95%
confidence level
(mg/kg)
LC-IDMSa 150.42 4 5.95 2 11.91
GC-IDMSb 133.9 9 1.65 2 3.3
GC-IDMSc 139.9 4 1.3 2 2.6
a Employed for CCQM-K109 b Obtained using GC-IDMS method during 1
st post comparison investigative study
c Obtained using GC-IDMS method during 2nd
post comparison investigative study. Measurements were made at NIST by CENAM analyst.
Table 20: CENAM’s original and revised data for uric acid in Serum II
Method
Overall mean
(mg/kg)
Total no. of
subsamples
for calculation
of the overall
mean
Combined
standard
uncertainty
(mg/kg)
Coverage
factor, k (95%
confidence
level)
Expanded
uncertainty at
approximately 95%
confidence level
(mg/kg)
LC-IDMSa 45.25 4 0.68 2 1.37
GC-IDMSb 38.7 9 0.60 2 1.2
GC-IDMSc 40.3 4 0.57 2 1.1
a Employed for CCQM-K109 b Obtained using GC-IDMS method during 1
st post comparison investigative study
c Obtained using GC-IDMS method during 2nd
post comparison investigative study. Measurements were made at NIST by CENAM analyst.
During the meeting in October 2016, KRISS shared that they had applied a 2 h
equilibration time at 60°C after protein precipitation and attributed their high results for uric
acid to improved extraction efficiency at elevated temperatures. Following the meeting,
HSA conducted a parallel investigation with KRISS. The investigation by HSA confirmed
that heating did not significantly affect the uric acid results. KRISS also confirmed this in
their investigative study using additional samples provided. The high results for uric acid
were attributed to the degradation of the standard solutions, which were stored at room
temperature. Hence, KRISS agreed that their results on uric acid would not be included
for the calculation of the KCRVs. The Table below summarises KRISS’s original reported
results and the corrected results from the investigative studies.

Page 43 of 143
Table 21: KRISS’s original and revised data for uric acid in Serum I
Original data Revised data
Mean of results of Bottle 1 (mg/kg) 145.9 139.2
Mean of results of Bottle 2 (mg/kg) 146.7 140.9
Mean of results of Bottle 3 (mg/kg) 146.6 140.0
Overall mean of results (mg/kg) 146.4 140.0
Total no. of subsamples for calculation of the overall mean
6 6
Combined standard uncertainty (mg/kg) 1.5 0.7
Coverage factor, k (95% confidence level) 3.18 2.12
Expanded uncertainty at approximately 95% confidence level (mg/kg)
4.9 1.4
Table 22: Original and revised data for uric acid in Serum II from KRISS
Original data Revised data
Mean of results of Bottle 1 (mg/kg) 42.4 40.2
Mean of results of Bottle 2 (mg/kg) 42.3 40.5
Mean of results of Bottle 3 (mg/kg) 42.3 40.1
Overall mean of results (mg/kg) 42.3 40.3
Total no. of subsamples for calculation of the overall mean
6 6
Combined standard uncertainty (mg/kg) 0.5 0.2
Coverage factor, k (95% confidence level) 2.57 2.12
Expanded uncertainty at approximately 95% confidence level (mg/kg)
1.4 0.4

Page 44 of 143
EVALUATION OF RESULTS FOR KCRVs 12.
The OAWG agreed that the Key Comparison Reference Value (KCRV) and associated
uncertainty would be determined from results of NMIs/DIs that participate in the key
comparison using IDMS methods that are valid and have demonstrated metrological
traceability. All participants used appropriate traceable calibrants except for UME who
used materials from a commercial source and carried out an in-house purity assessment.
INMETRO used non-IDMS methods and thus none of its results were considered for
inclusion in KCRV calculations. The results of VNIIM, LGC, CENAM and KRISS were
reviewed as described in the section on Discussion of Results.
For urea (both Serum I and II), the KCRVs were calculated from results of all NMIs/DIs
except for INMETRO and KRISS. For uric acid (Serum I), the KCRV was calculated from
results of all NMIs/DIs except for VNIIM, INMETRO, KRISS and CENAM. For uric acid
(Serum II), the KCRV was calculated from results of all NMIs/DIs except for INMETRO,
KRISS and CENAM. In all cases, the participating institutes chose to withdraw their
results from the KCRV calculation following their further investigation. The RSDs of the 13
results included in the KCRV calculations for urea in Serum I and Serum II were 2.8 %
and 2.2 %, rather than the 3.7 % and 3.3 % of all 15 participants. The RSDs of the 10 and
11 results included in the calculations for uric acid were 2.9 % and 1.0 % rather than the
5.5 % and 4.8 % of all 14 participants.
Potential candidate KCRVs were presented at the meeting in April 2017. In the meeting,
although the reported measurement uncertainties were regarded as generally valid it was
agreed that the median was an appropriate estimator of consensus given potential non-
technical “outliers” (values distant from the majority) and apparent lack of excess
variance. In accordance with CCQM guidance7, the normality-adjusted median absolute
median (MADE) was regarded as an appropriate estimator for the uncertainty of these
medians.
Recognising that use of the uncertainty-ignoring median and MADE estimators can lead to
underestimation of the KCRV uncertainties, at the meeting in September 2017 it was
suggested that HSA work with NIST to evaluate the results with an estimator that is
robust, uses the reported measurement uncertainties, and accommodates excess
variance when present. While the DerSimmonian-Laird weighted mean uses uncertainties
7 CCQM/13-22. Guidance note: Estimation of a consensus KCRV and associated Degrees of Equivalence,
11-Apr-2013. http:\\www.bipm.org/cc/CCQM/Allowed/19/CCQM13-22_Consensus_KCRV_v10.pdf

Page 45 of 143
and accommodates excess variance, it is not robust to outliers. None of the estimators
described in the current CCQM guidance document address all three issues.
However, a random effects model that is robust, uses the reported measurement
uncertainties, and accommodates excess variance has recently been fully characterised.8
This method differs from the usual random effects model in that it models laboratory
effects as following the double exponential (Laplacian) distribution rather than the normal
(Gaussian) distribution:
𝑋𝑖 = µ + 𝜆𝑖 + 𝐸𝑖
where i indexes the participating laboratories, Xi are the lab means, µ is the consensus
value, 𝜆𝑖 are the laboratory effects distributed as Laplacian with mean 0 and variance 𝜎𝜆2,
and 𝐸𝑖 are the lab specific measurement errors distributed as Gaussian with mean 0 and
variance 𝑢𝑖2. The 𝜎𝜆
2 parameter directly estimates excess variance. The µ estimate
provided by this model can be regarded as a weighted median.
Unlike the closed-form estimators described in the CCQM guidance document, these
Laplacian weighted median results are evaluated via Markov Chain Monte Carlo (MCMC)
resampling. Rather than producing single analytic location and uncertainty estimates,
MCMC techniques generate large numbers of realisations (draws) of the model
parameters. With a suitably large number of draws (typically a few tens of thousands), the
likely value of a parameter can be estimated as the arithmetic mean of the draws, the
standard uncertainty of this mean as the standard deviation of the draws, and the
expanded uncertainty as the 95% credible interval between the 2.5th percentile and the
97.5th percentiles of the draws. When the distribution of a model parameter is
approximately symmetrical about its mean, the expanded uncertainty can be estimated as
one-half of the interval between these two percentiles.
8 Rukhin A, Possolo A, (2011) Laplace random effects models for interlaboratory studies. Computational
Statistics and Data Analysis 55, 1815 – 1825. https:\\doi.org\10.1016/j.csda.2010.11.016

Page 46 of 143
Table 23 lists candidate KCRV values for urea in Serum I and Serum II as estimated with
the 1) arithmetic mean and standard deviation (non-robust, uncertainty-ignoring), 2)
median and MADE (robust, uncertainty-ignoring), and 3) Laplacian weighted median
(robust, uncertainty-using). Table 24 similarly lists the candidate values for uric acid.
Appendix C details the Laplacian weighted median results and an example of the
computer code used to calculate the weighted medians and associated parameters of
interest.

Page 47 of 143
Table 23: Candidate KCRVs and uncertainties for urea in Serum I & II
Urea
Serum I Serum II
Number of results (N) used to calculate KCRV 13 13
Approach 1 (Arithmetic Mean):
Arithmetic mean (mg/kg) 1,500 335.9
Standard deviation, SD (mg/kg) 42.4 7.37
Standard uncertainty, SD/N (mg/kg) 12 2.0
Approach 2 (Median):
Median (mg/kg) 1,485.7 334.20
Median absolute deviation, MAD (mg/kg) 16.7 2.80
1.483×MAD, MADe (mg/kg) 24.8 4.15
Standard uncertainty, 1.25×MADe/N (mg/kg) 8.6 1.4
Approach 3 (Laplacian Weighted Median):
Weighted median (mg/kg) 1,486.0 334.7
Standard uncertainty (mg/kg) 9.0 1.8
Table 24: Candidate KCRVs and uncertainties for uric acid in Serum I & II
Uric Acid
Serum I Serum II
Number of results (N) used to calculate KCRV 10 11
Approach 1 (Arithmetic Mean):
Arithmetic mean (mg/kg) 137.4 39.27
Standard deviation, SD (mg/kg) 4.06 0.38
Standard uncertainty, SD/N (mg/kg) 1.3 0.11
Approach 2 (Median):
Median (mg/kg) 136.40 39.29
Median absolute deviation, MAD (mg/kg) 0.500 0.290
1.483×MAD, MADe (mg/kg) 0.742 0.430
Standard uncertainty, 1.25×MADe/N (mg/kg) 0.29 0.16
Approach 3 (Laplacian Weighted Median):
Weighted median (mg/kg) 136.50 39.39
Standard uncertainty (mg/kg) 0.98 0.11

Page 48 of 143
The median and weighted median results agree well for urea and uric acid in both Serum
I and Serum II. This suggests that the weighted median location values are as appropriate
as the simple medians.
The MADE-based relative uncertainties for the medians are, as expected, slightly smaller
than the uncertainties associated with weighted medians for urea in Serum I
(100×8.6/1485.7 = 0.58 % vs. 100×9.0/1486.0 = 0.61 %) and Serum II (100×1.4/334.2 =
0.42 % vs. 100×1.8/334.7 = 0.54 %). For uric acid in Serum I, the MADE-based relative
uncertainty (100×0.29/136.40 = 0.21 %) is considerably smaller than that of the weighted
median (100×0.98/136.50 = 0.72 %), while for uric acid in Serum II, the MADE-based
relative uncertainty (100×0.16/39.29 = 0.41 %) is somewhat larger than that of the
weighted median (100×0.11/39.39 = 0.28 %). Regardless of this one reversal, since the
uncertainty of a weighted median explicitly includes the reported measurement
uncertainties and accounts for potential “dark” uncertainty, it may be less prone to
underestimation than is MADE.
Recognising the need for clarity on the choice of estimators, weighted medians are used
as the KCRVs for all four measurands for the following considerations:
the OAWG regards the reported measurement uncertainties as mostly credible,
the measurement distributions are potentially somewhat non-normal,
the measurement distribution for at least one of the measurands contains an
influential value (potential outlier) that cannot be excluded on technical grounds,
and
the Laplacian weighted median has been well-characterised in an appropriate
peer-reviewed publication.
The following Figures display the reported measurement values and uncertainties relative
to the weighted medians and their standard uncertainties.

Page 49 of 143
Figure 14: Reported results for urea (Serum I) relative to the KCRV
The KCRV (solid red line) with a value of 1,486.0 mg/kg was calculated from the weighted median of 13 results and has a standard uncertainty of 9.0 mg/kg (red dotted line). Bars represent standard uncertainties. The results represented by blue diamonds are not included in the calculation of the KCRV.
1,250
1,300
1,350
1,400
1,450
1,500
1,550
1,600
1,650M
ass
Frac
tio
n (
mg
/kg)

Page 50 of 143
Figure 15: Reported results for urea (Serum II) relative to the KCRV
The KCRV (solid red line) with a value of 334.7 mg/kg was calculated from the weighted median of 13 results and has a standard uncertainty of 1.8 mg/kg. Bars represent standard uncertainties. The results represented by blue diamonds are not included in the calculation of the KCRV.
270
280
290
300
310
320
330
340
350
360
370M
ass
Frac
tio
n (
mg
/kg)

Page 51 of 143
Figure 16: Reported results for uric acid (Serum I) relative to the KCRV
The KCRV (solid red line) with a value of 136.50 mg/kg was calculated from the weighted median of 10 results and has a standard uncertainty of 0.98 mg/kg. Bars represent standard uncertainties. The results represented by blue diamonds are not included in the calculation of the KCRV.
115
120
125
130
135
140
145
150
155
160
165M
ass
Frac
tio
n (
mg
/kg)

Page 52 of 143
Figure 17: Reported results for uric acid (Serum II) relative to the KCRV
The KCRV (solid red line) with a value of 39.39 mg/kg was calculated from the weighted median of 11 results and has a standard uncertainty of 0.11 mg/kg. Bars represent standard uncertainties. The results represented by blue diamonds are not included in the calculation of the KCRV.
37
38
39
40
41
42
43
44
45
46
47M
ass
Frac
tio
n (
mg
/kg)

Page 53 of 143
DEGREES OF EQUIVALENCE (DOE) CALCULATION 13.
The degrees of equivalence (Di) for each participating NMI/DI is defined as
𝐷𝑖 = 𝑋𝑖 − 𝑋KCRV
where Xi is the result reported by participant i and XKCRV is the KCRV. With the KCRVs
estimated using any Monte Carlo technique, these Di and their 95 % level of confidence
expanded uncertainties, U(Di), can readily be estimated along with the KCRV. The
distributions of the Di as estimated along with the weighted medians were examined and
determined to be essentially symmetric, allowing the U(Di) to be estimated as the half-
width of the interval between the 2.5th and 97.5th percentiles of the MC draws. See
Appendix C for an example of the code and its summary output. Appendix D compares
the Di ± U(Di) for the median and weighted median candidate KCRVs.
The percentage relative Di, %Di, were calculated as:
%𝐷𝑖 = 100 × 𝐷𝑖/ 𝑋KCRV.
The expanded uncertainties for these %Di, U(%Di), were calculated as:
𝑈(%𝐷𝑖) = 100 × 𝑈(𝐷𝑖 )/ 𝑋KCRV.
The following Tables and Figures summarise the CCQM-K109 Di (mg/kg) and %Di (%)
estimates for the four measurands.
Table 25: Degrees of equivalence for urea (Serum I)
The KCRV is 1,486.0 mg/kg, standard uncertainty 9.0 mg/kg, and relative standard uncertainty 0.61 %
NMI/DI Di (mg/kg) U(Di) (mg/kg) Di/ U(Di) %Di (%) %U(Di) (%)
NMIA -16.85 26.76 -0.63 -1.13% 1.80%
INMETRO* -88.71 260.40 -0.34 -5.97% 17.52%
NIM -4.81 36.56 -0.13 -0.32% 2.46%
GLHK 27.79 47.40 0.59 1.87% 3.19%
LNE -13.07 33.08 -0.40 -0.88% 2.23%
PTB 0.91 23.58 0.04 0.06% 1.59%
NMIJ -10.97 20.74 -0.53 -0.74% 1.40%
KRISS* 118.20 31.88 3.71 7.95% 2.15%
CENAM -0.04 26.86 0.00 0.00% 1.81%
VNIIM 18.28 78.88 0.23 1.23% 5.31%
HSA -9.02 30.28 -0.30 -0.61% 2.04%
NIMT -29.75 37.20 -0.80 -2.00% 2.50%
UME 128.40 36.74 3.49 8.64% 2.47%
LGC 66.97 26.98 2.48 4.51% 1.82%
NIST 20.13 41.10 0.49 1.35% 2.77%
* The measurement result reported by this institute was not used to estimate the KCRV.

Page 54 of 143
Figure 18: Degrees of equivalence, Di ± U(Di), for urea (Serum I)
Bars represent 95 % expanded uncertainties. The results represented by blue diamonds are not included in the calculation of the KCRV.
-380
-330
-280
-230
-180
-130
-80
-30
20
70
120
170
Di(m
g/k
g)

Page 55 of 143
Figure 19: Relative degrees of equivalence, %Di ± U(%Di), for urea (Serum I)
Bars represent 95 % expanded uncertainties. The results represented by blue diamonds are not included in the calculation of the KCRV.
-28%
-24%
-20%
-16%
-12%
-8%
-4%
0%
4%
8%
12%
16%
%D
i (%
)

Page 56 of 143
Table 26: Degrees of equivalence for urea (Serum II) The KCRV is 334.7 mg/kg, standard uncertainty 1.8 mg/kg, and relative standard uncertainty 0.54 %
NMI/DI Di U(Di) Di/ U(Di) %Di (%) %U(Di) (%)
NMIA -6.26 6.33 -0.99 -1.87% 1.89%
INMETRO* -33.06 55.62 -0.59 -9.88% 16.62%
NIM 0.15 8.70 0.02 0.04% 2.60%
GLHK -4.14 10.24 -0.40 -1.24% 3.06%
LNE 2.24 16.34 0.14 0.67% 4.88%
PTB -0.45 4.95 -0.09 -0.13% 1.48%
NMIJ -1.00 5.25 -0.19 -0.30% 1.57%
KRISS* 2.21 6.13 0.36 0.66% 1.83%
CENAM 3.80 8.55 0.44 1.14% 2.55%
VNIIM 1.35 10.87 0.12 0.40% 3.25%
HSA -1.30 6.52 -0.20 -0.39% 1.95%
NIMT -5.61 12.89 -0.44 -1.68% 3.85%
UME 22.09 7.91 2.79 6.60% 2.36%
LGC 8.09 6.18 1.31 2.42% 1.85%
NIST -2.82 9.58 -0.29 -0.84% 2.86%
* The measurement result reported by this institute was not used to estimate the KCRV.

Page 57 of 143
Figure 20: Degrees of equivalence, Di ± U(Di), for urea (Serum II)
Bars represent 95 % expanded uncertainties. The results represented by blue diamonds are not included in the calculation of the KCRV.
-100
-90
-80
-70
-60
-50
-40
-30
-20
-10
0
10
20
30
40D
i(m
g/k
g)

Page 58 of 143
Figure 21: Relative degrees of equivalence, %Di ± U(%Di), for urea (Serum II)
Bars represent 95 % expanded uncertainties. The results represented by blue diamonds are not included in the calculation of the KCRV.
-32%
-28%
-24%
-20%
-16%
-12%
-8%
-4%
0%
4%
8%
12%
%D
i (%
)

Page 59 of 143
Table 27: Degrees of equivalence for uric acid (Serum I) The KCRV is 136.50 mg/kg, standard uncertainty 0.98 mg/kg, and relative standard uncertainty 0.72 %
NMI/DI Di U(Di) Di/ U(Di) %Di (%) %U(Di) (%)
NMIA -0.12 4.45 -0.03 -0.09 3.26
INMETRO* 15.48 20.26 0.76 11.34 14.84
NIM -0.03 3.56 -0.01 -0.02 2.61
GLHK -0.34 5.39 -0.06 -0.25 3.95
LNE -0.10 3.44 -0.03 -0.07 2.52
PTB -2.02 2.41 -0.84 -1.48 1.77
NMIJ 1.78 2.66 0.67 1.30 1.95
KRISS* 9.89 3.61 2.74 7.25 2.64
CENAM* 13.9 12.01 1.16 10.18 8.80
VNIIM* -12.74 6.98 -1.82 -9.33 5.11
HSA 0.28 3.42 0.08 0.21 2.51
NIMT -1.93 3.61 -0.53 -1.41 2.64
UME 12.04 4.61 2.61 8.82 3.38
NIST -0.72 3.89 -0.19 -0.53 2.85
* The measurement result reported by this institute was not used to estimate the KCRV.

Page 60 of 143
Figure 22: Degrees of equivalence, Di ± U(Di), for uric acid (Serum I)
Bars represent 95 % expanded uncertainties. The results represented by blue diamonds are not included in the calculation of the KCRV.

Page 61 of 143
Figure 23: Relative degrees of equivalence, %Di ± U(%Di), for uric acid (Serum I)
Bars represent 95 % expanded uncertainties. The results represented by blue diamonds are not included in the calculation of the KCRV.
-20%
-16%
-12%
-8%
-4%
0%
4%
8%
12%
16%
20%
24%
28%
32%
%D
i(%
)

Page 62 of 143
Table 28: Degrees of equivalence for uric acid (Serum II). The KCRV is 39.39 mg/kg, standard uncertainty 0.11 mg/kg, and relative standard uncertainty 0.28 %
NMI/DI Di U(Di) Di/ U(Di) %Di (%) %U(Di) (%)
NMIA -0.18 1.21 -0.15 -0.46% 3.07%
INMETRO* 3.67 6.06 0.61 9.32% 15.38%
NIM 0.28 1.31 0.21 0.71% 3.33%
GLHK -0.59 1.62 -0.36 -1.50% 4.11%
LNE 0.20 1.25 0.16 0.51% 3.17%
PTB -0.02 0.46 -0.04 -0.05% 1.17%
NMIJ -0.02 0.4 -0.05 -0.05% 1.02%
KRISS* 2.92 1.03 2.84 7.41% 2.61%
CENAM* 5.88 1.37 4.3 14.93% 3.48%
VNIIM -0.39 2.01 -0.19 -0.99% 5.10%
HSA -0.1 0.85 -0.12 -0.25% 2.16%
NIMT -0.73 1.06 -0.69 -1.85% 2.69%
UME 0.55 1.16 0.48 1.40% 2.94%
NIST -0.28 1.02 -0.28 -0.71% 2.59%
* The measurement result reported by this institute was not used to estimate the KCRV.

Page 63 of 143
Figure 24: Degrees of equivalence, Di ± U(Di), for uric acid (Serum II)
Bars represent 95 % expanded uncertainties. The results represented by blue diamonds are not included in the calculation of the KCRV.
-4
-2
0
2
4
6
8
10
12
Di(m
g/k
g)

Page 64 of 143
Figure 25: Relative degrees of equivalence, %Di ± U(%Di), for uric acid (Serum II)
Bars represent 95 % expanded uncertainties. The results represented by blue diamonds are not included in the calculation of the KCRV.
-8%
-4%
0%
4%
8%
12%
16%
20%
24%
28%
%D
i(%
)

Page 65 of 143
POLARITY vs LOG(KCRV) PLOT 14.
The polarities and concentrations of the analytes in this key comparison are plotted in the
Figure below. Both urea and uric acid are represented in the upper right quadrant,
together with analytes of high polarity and concentration ranges.
Figure 26: Polarity vs log(KCRV) for OAWG KC of clinical analytes in serum/plasma.
The blue dots are sourced from: A revised model for core competency key comparisons in organic analysis supporting and assessing all calibration and accuracy control CMCs; Steven Westwood, Ralf Joseph & Robert Wielgosz, BIPM, April 2017. The purple and red dots show the polarity and
log(KCRV) for urea and uric acid in this comparison.
CORE COMPETENCY AND HOW FAR DOES THE LIGHT SHINE? 15.
This comparison enables participating NMIs/DIs to demonstrate their measurement
capabilities in the determination of analytes with molecular mass of 50 to 500 g/mol,
having the polarity pKOW > 2 in the range of 10 to 2,000 mg/kg in a biological matrix such
as human serum, blood and urine.
Through this comparison, majority of the participating institutes in CCQM-K109
demonstrated their capabilities in the measurement of the clinical markers in the biological
matrix using IDMS. The Core Competency Tables of the participating NMIs/DIs are
presented in Appendix E.

Page 66 of 143
USE OF REPORT 16.
This report is intended to be used as an internal reference for the participating NMIs/DIs
and CCQM OAWG. Its content shall not be disclosed to other parties or used for other
purposes.
ACKNOWLEDGEMENT 17.
The Coordinators of this comparison would like to express their sincere thanks to all the
participating institutes for their contributions, as well as for the support of Dr. Lindsey
Mackay, Chair, CCQM OAWG and Dr. Della Sin, Chair, CCQM KCWG. The Coordinators
would also like to express their special thanks to Drs. Blaza Toman, Michael Nelson and
David Duewer from NIST for their advice and contributions to the evaluation of the results.

Page 67 of 143
APPENDIX A: STUDY PROTOCOL 18.
Background
The OAWG has agreed on a list of Track A key comparisons to assess the core
competencies of National Metrology Institutes/Designated Institutes (NMIs/DIs) for the
delivery of measurement services to their customers. One of the Track A comparisons
discussed and agreed upon under the matrix category was “Polar Organic in Biological
Matrix”. In the OAWG meeting in November 2013 in Pretoria, South Africa, the meeting
discussed the possible analytes and biological materials in this comparison which could
best cover current and future CMCs. The Health Sciences Authority (HSA), Singapore
suggested urea and uric acid in human serum as a possible comparison for this category
and would present a proposal at the meeting in April 2014 in BIPM. At the April 2014
OAWG meeting, a proposal was presented by HSA. After considering the services offered
by the NMIs/DIs and that this being the first Track A comparison for biological materials,
the OAWG agreed on the HSA’s proposal on urea and uric acid in human serum as an
appropriate comparison for this matrix category. A key comparison and a parallel pilot
study will be organised.
Objectives
The comparison aims to enable participating NMIs/DIs to demonstrate their competence
in the determination of high polarity organic compounds in a biological matrix. As a model
system for this comparison, two polar clinical biomarkers: urea and uric acid, in human
serum are chosen.
Preparation of the Comparison Materials
The comparison materials are frozen human sera. An experienced commercial human
blood products supplier (Solomon Park Research Laboratories, Kirkland, WA, USA) was
engaged by the Health Sciences Authority (HSA) to prepare the materials. Two pools of
human serum materials with two different concentration levels of urea and uric acid were
prepared, and pre-packed in 260 vials containing 1 mL of serum each.
The homogeneity of the comparison materials was assessed by gas chromatography-
isotope dilution mass spectrometry (GC-IDMS). A sample size of 0.10 g was used in the
assessment of homogeneity for both urea and uric acid. Eleven bottles were randomly
and stratifically selected, and two subsamples were taken from each bottle. Using ANOVA
at 95 % level of confidence, both materials were found to be sufficiently homogeneous.

Page 68 of 143
The relative standard uncertainties9 of inhomogeneity were found to be below 0.04 % and
0.18 % for urea and uric acid (for both concentration levels), respectively.
The stability of the comparison materials at – 70 oC was assessed using the GC-IDMS
and liquid chromatography-isotope dilution mass spectrometry (LC-IDMS) for urea and
uric acid, respectively. The same sample size as described in the homogeneity testing
was also used. The testing was carried out on four occasions over a period of about 230
days using classical design. For each occasion of the stability testing, two bottles were
randomly selected, and two subsamples were taken from each bottle. Using Student’s t-
test at 95 % level of confidence, no significant instability of the comparison materials was
observed. The relative standard uncertainties of instability were estimated to be below
0.21 % and 0.46 % for urea and uric acid (for both concentration levels), respectively.
A study on the effect of different equilibration times (2 h to 29.5 h) on the measurement
results of urea and uric acid for serum materials containing a high and low level of lipid
was carried out. The results showed that equilibration times do not have a significant
effect on the measurement results of urea and uric acid for serum materials with either
high or low level of lipid.
The Measurands
The mass fractions of urea and uric acid in the comparison materials are in the range of
100 to 2,000 and 10 to 165 mg/kg, respectively. One of the concentration levels is within
the normal biological range while the other is higher than normal range. The concentration
levels are within the range of existing CMC claims in the BIPM KCDB.
Registration
Interested institutes should complete the Registration Form and return to HSA before the
deadline and an email will be sent to confirm the registration. The institutes may choose
to register for one or both the measurands. Potential DIs that are nominated by their
respective NMIs are welcome to participate in the pilot study.
9 As the between-bottle mean squares were found to be smaller than the within-bottle mean squares, the uncertainties for
inhomogeneity were estimated using the following equation:
√𝑀𝑆𝑤
𝑛√
2
𝑣𝑀𝑆𝑤
4
where MSw is the within-bottle mean square, n is the number of observations, vMSw is the number of degrees of freedom

Page 69 of 143
Instructions for Participating Institutes
The materials used for this comparison were tested non-reactive/negative for hepatitis B
surface antigen (HbsAg), human immunodeficiency (HIV) 1 and 2 antibodies, and
hepatitis C virus (HCV) by the supplier before distribution. However, the materials should
be handled as biohazards materials capable of transmitting infectious diseases.
The materials will be transported using dry ice. Upon receipt, the materials should be
immediately stored at a temperature below – 60 oC before measurement. The materials
should be used immediately after they are thawed, as measurements on vials which have
been previously thawed and opened, have not been conducted.
Each participating NMI/DI will receive three vials of serum sample for each concentration
level and measurand that it registers for, i.e. the NMI/DI will receive a total of 12 vials if it
registers for both urea and uric acid. The participating NMIs/DIs may use one of the three
vials as a practice sample and should report the results for the remaining two vials. At
least two subsamples should be taken from each vial. The participating NMIs/DIs may
decide on the number of times that each subsample is to be measured. Before sampling,
the material should be allowed to thaw and warm to room temperature (18 – 25 oC), and
homogenised by gentle swirling and inversing the vial several times. The subsamples
taken from the same vial should be measured on the same day. The recommended
minimum subsample size is 0.10 g.
The participating NMIs/DIs should use their own methods for the determination.
Metrologically traceable certified reference materials (CRMs) should be used as
calibration standards. CRMs of urea and uric acid are available from the National Institute
of Science and Technology (NIST), the National Metrology Institute of Japan (NMIJ), and
the National Institute of Metrology (NIM), China. Other sources of reference materials may
be used, provided that they are purity assessed adequately to demonstrate the
metrological traceability. It is recommended to use matrix CRMs as quality controls.
CRMs for urea and uric acid in human serum are available from the Korea Research
Institute of Standards and Science (KRISS), NIST, HSA and NIM, China. These CRMs
are listed in the following Table.10
10
The Appendix may not contain an exhaustive list of all CRMs that may be used as calibration standards and quality control materials in this comparison.
Page 70 of 143
CRMs of Urea
CRM Code Source of CRM
SRM 912a (clinical standard) NIST
CRM 6006-a NMIJ
GBW09201 NIM, China
CRMs of Uric Acid
CRM Code Source of CRM
SRM 913a NIST
CRM 6008-a NMIJ
GBW09202 NIM, China
Matrix CRMs Containing Urea and Uric Acid
CRM Code Matrix Type Source of CRM
SRM 909c Frozen Human Serum NIST
HRM-3002A Frozen Human Serum HSA
CRM 111-1-001 and CRM 111-01-002 Frozen Human Serum KRISS
CRM 111-1-003 and CRM 111-01-004 Lyophilized Human Serum KRISS
Matrix CRMs Containing Uric Acid
CRM Code Matrix Type Source of CRM
GBW09157 Frozen Human Serum NIM, China
GBW09169 Frozen Human Serum NIM, China
Internal Standards
Isotopic labelled urea is available from Cambridge Isotopes Laboratories, and isotopic
labelled uric acid is available from Sigma Aldrich and Cambridge Isotopes Laboratories.
Reporting of Results
A Report of Results Form will be provided to the participating NMIs/DIs for completion.
The participating NMIs/DIs are expected to report their results based on at least four
subsamples (two subsamples from each vial) for each level. The results should be
reported in the unit of mg/kg, and should include standard and expanded uncertainties (95
% level of confidence) for the mean of the replicate determinations. Information on the
measurement procedure, the calibration standard, the internal standard, the quality
control material, the calculation of the results, and the estimation of measurement
uncertainty should be included. The completed form should be sent to HSA on or before
the scheduled deadline. The submitted results will be considered as final.
Page 71 of 143
Evaluation of Results
Results of all participating NMIs/DIs will be evaluated against the key comparison
reference value (KCRV). The KCRV and associated uncertainty will be determined from
results of NMIs/DIs that participate in the key comparison using IDMS method with
demonstrated metrological traceability. However, other techniques may also be used for
comparison purposes. Results from NMIs/DIs that participated in the pilot study will not be
included in the calculation of the KCRV.
Core Competency and How Far Does the Light Shine?
This comparison enables participating NMIs/DIs to demonstrate their measurement
capabilities in the determination of analytes with molecular mass of 50 to 500 g/mol,
having the polarity pKOW > 2 in the range of 10 to 2,000 mg/kg in a biological matrix such
as human serum, blood and urine.
Schedule
Official call for participation: 13 July 2015
Deadline for registration: 1 December 2015
Distribution of comparison samples: by 29 February 2016
Deadline for submission of results: 1 September 2016
Coordinating Laboratory and Contact Person
Dr Tang Lin TEO & Dr Qinde LIU
Health Sciences Authority
Applied Sciences Group
Chemical Metrology Laboratory
1 Science Park Road
#01-05/06, The Capricorn
Singapore Science Park II
Singapore 117528
Tel:+65 6775 1605
Fax:+65 6775 1398
E-mail: [email protected]
Note: A potential DI may also register to participate in the CCQM pilot study upon a
written agreement from the NMI.

Page 72 of 143
APPENDIX B: SUMMARY OF PARTICIPATING INSTITUTES’ UNCERTAINTY 19.
ESTIMATION APPROACHES
NMIA
All masses and mass fractions used to calculate ωx were determined using balances
calibrated with metrological traceability to the SI unit of the kilogram through Australian
national standards for mass. Peak areas were determined from chromatographic traces
generated for characteristic ions corresponding to analytes and internal standards.
A standard uncertainty was estimated for all components in the measurement equation.
These were combined using derived sensitivity coefficients to estimate a combined
standard uncertainty in the reported result for each analyte in the study sample. The total
effective degrees of freedom was determined using the Welch-Satterthwaite equation to
calculate the appropriate coverage (k) factor to expand the combined standard
uncertainty to a 95% confidence interval for reporting. The method precision term was
calculated as the standard deviation of the mean of all the measurements used in the
calculation of the reference value.
To ensure that all likely sources of bias were accounted for in the final uncertainty budget
a trueness factor was also included. This factor was assigned a nominal value of one with
an uncertainty representing the potential magnitude of undetected bias due to factors
affecting the measured peak area ratios such as matrix interferences and matrix effects.
The magnitude of the standard uncertainty in the trueness factor was estimated as the
standard deviation of the various average analyte mass fractions determined in multiple
serum sub-samples analysed by the primary method of analysis and different
confirmatory methods of analysis used to assess bias due to matrix interferences/effects.
Urea Serum Pool I
Details\\PINS4VFI05\Home\vv1985\Profile\Desktop\CCQM-K109 Urea and Uric Acid in Human Serum\Uncertainty Budgets\Budgets\[Urea Pool I Uncertainty Budget.xlsm]GUM Budget
Project CCQM K109
Sample Name K109
Analyte Urea Pool I
Matrix Human Serum
Measurand Mass Fraction
Measurand Symbol Wx
Reporting units mg/kg

Page 73 of 143
Urea Serum Pool II
Uric Acid Serum Pool I
Summary of Contributions to Total Combined Measurement Uncertainty
Number Name of Component Symbol Units Value
Standard
Uncertainty
Relative
Standard
Uncertainty
Degrees of
Freedom
i Xi xi u(xi) u(xi)/xi (%) vi
1 Method Precision F(MP) dimensionless 1.0000 0.0016 0.161% 7.0
2 Method Trueness F(MT) dimensionless 1.0000 0.0030 0.302% 30.0
3 Standard Wz ng/g 995.6679 2.1023 0.211% 57.6
4 Moisture Content MC n/a 1.0000 0.0000 0.000% 1.0
5 Gravimetry Mx g 0.1013 0.00035 0.35% 100.0
6 Gravimetry My(SB) g 0.1406 0.00035 0.25% 100.0
7 Gravimetry Mz g 0.1456 0.00035 0.24% 100.0
8 Gravimetry My(CB) g 0.1423 0.00035 0.25% 100.0
9 Isotope Amount Ratio Rx,Rz mol/mol 335 14.6 4.36% 2.0
10 Isotope Amount Ratio Ry mol/mol 0.0077853 0.000333 4.28% 2.0
11 Blend Isotope Amount Ratio R(SB) mol/mol 1.1364 7.0
12 Blend Isotope Amount Ratio R(CB) mol/mol 1.0940 7.0
Details\\PINS4VFI05\Home\vv1985\Profile\Desktop\CCQM-K109 Urea and Uric Acid in Human Serum\Uncertainty Budgets\Budgets\[Urea Pool II Uncertainty Budget.xlsm]GUM Budget
Project CCQM K109
Sample Name K109
Analyte Urea Pool II
Matrix Human Serum
Measurand Mass Fraction
Measurand Symbol Wx
Reporting units mg/kg
Summary of Contributions to Total Combined Measurement Uncertainty
Number Name of Component Symbol Units Value
Standard
Uncertainty
Relative
Standard
Uncertainty
Degrees of
Freedom
i Xi xi u(xi) u(xi)/xi (%) vi
1 Method Precision F(MP) dimensionless 1.0000 0.0022 0.218% 7.0
2 Method Trueness F(MT) dimensionless 1.0000 0.0038 0.381% 30.0
3 Standard Wz ng/g 249.2115 0.5285 0.212% 58.6
4 Moisture Content MC n/a 1.0000 0.0000 0.000% 1.0
5 Gravimetry Mx g 0.1015 0.00035 0.34% 100.0
6 Gravimetry My(SB) g 0.1314 0.00035 0.27% 100.0
7 Gravimetry Mz g 0.1203 0.00035 0.29% 100.0
8 Gravimetry My(CB) g 0.1322 0.00035 0.26% 100.0
9 Isotope Amount Ratio Rx,Rz mol/mol 335 14.6 4.36% 2.0
10 Isotope Amount Ratio Ry mol/mol 0.0077853 0.0003331 4.28% 2.0
11 Blend Isotope Amount Ratio R(SB) mol/mol 1.1271 7.0
12 Blend Isotope Amount Ratio R(CB) mol/mol 1.0103 7.0
Details\\PINS4VFI05\Home\vv1985\Profile\Desktop\CCQM-K109 Urea and Uric Acid in Human Serum\Uncertainty Budgets\Budgets\[Uric Acid Pool I Uncertainty Budget.xlsm]GUM Budget
Project CCQM K109
Sample Name K109
Analyte Uric Acid Pool I
Matrix Human Serum
Measurand Mass Fraction
Measurand Symbol Wx
Reporting units mg/kg

Page 74 of 143
Uric Acid Serum Pool II
Summary of Contributions to Total Combined Measurement Uncertainty
Number Name of Component Symbol Units Value
Standard
Uncertainty
Relative
Standard
Uncertainty
Degrees of
Freedom
i Xi xi u(xi) u(xi)/xi (%) vi
1 Method Precision F(MP) dimensionless 1.0000 0.0022 0.220% 11.0
2 Method Trueness F(MT) dimensionless 1.0000 0.0063 0.629% 30.0
3 Standard Wz ng/g 100.5920 1.1225 1.12% 11.2
4 Moisture Content MC n/a 1.0000 0.0000 0.000% 1.0
5 Gravimetry Mx g 0.1014 0.00035 0.35% 100.0
6 Gravimetry My(SB) g 0.1337 0.00035 0.26% 100.0
7 Gravimetry Mz g 0.1342 0.00035 0.26% 100.0
8 Gravimetry My(CB) g 0.1339 0.00035 0.26% 100.0
9 Isotope Amount Ratio Rx,Rz mol/mol 4.8539 0.02543 0.52% 2.0
10 Isotope Amount Ratio Ry mol/mol 0.00766 0.00136 17.72% 2.0
11 Blend Isotope Amount Ratio R(SB) mol/mol 0.8490 11.0
12 Blend Isotope Amount Ratio R(CB) mol/mol 0.8245 11.0
Details\\PINS4VFI05\Home\vv1985\Profile\Desktop\CCQM-K109 Urea and Uric Acid in Human Serum\Uncertainty Budgets\Budgets\[Uric Acid Pool II Uncertainty Budget.xlsm]GUM Budget
Project CCQM K109
Sample Name K109
Analyte Uric Acid Pool II
Matrix Human Serum
Measurand Mass Fraction
Measurand Symbol Wx
Reporting units mg/kg
Summary of Contributions to Total Combined Measurement Uncertainty
Number Name of Component Symbol Units Value
Standard
Uncertainty
Relative
Standard
Uncertainty
Degrees of
Freedom
i Xi xi u(xi) u(xi)/xi (%) vi
1 Method Precision F(MP) dimensionless 1.0000 0.0021 0.206% 11.0
2 Method Trueness F(MT) dimensionless 1.0000 0.0074 0.740% 30.0
3 Standard Wz ng/g 30.0019 0.3348 1.12% 11.2
4 Moisture Content MC n/a 1.0000 0.0000 0.000% 1.0
5 Gravimetry Mx g 0.1016 0.00035 0.34% 100.0
6 Gravimetry My(SB) g 0.1188 0.00035 0.29% 100.0
7 Gravimetry Mz g 0.0984 0.00035 0.36% 100.0
8 Gravimetry My(CB) g 0.1155 0.00035 0.30% 100.0
9 Isotope Amount Ratio Rx,Rz mol/mol 4.7246 1.37025 29.00% 3.0
10 Isotope Amount Ratio Ry mol/mol 0.00397 0.00037 9.43% 3.0
11 Blend Isotope Amount Ratio R(SB) mol/mol 0.8593 11.0
12 Blend Isotope Amount Ratio R(CB) mol/mol 0.8379 11.0

Page 75 of 143
INMETRO
Uncertainty was firstly estimated for each set of 5 subsamples taken to produce one standard addition curve. The stated standard uncertainty was the highest standard uncertainty of the 4 results (2 results for each bottle). The repeatability of the four results was combined as a component as shown in the tables bellow.
The tables below show the components from the determination that presented the highest standard uncertainty.
Urea (STY-0049-001):
Component type u component
(mg/kg) relative contribution (%)
repeatability A 3.8 × 10⁻² 1.61 × 101
calibrant purity value B 5.0 × 10⁻⁴ 2.87 × 10⁻⁵
calibration curve A 8.6 × 10⁻² 0.84 × 10²
sample mass B 2.2 × 10⁻⁶ 5.55 × 10⁻¹⁰
mass after first sample dilution B 3.7 × 10⁻⁷ 1.58 × 10⁻¹¹
mass after second sample dilution
B 8.4 × 10⁻⁸ 8.00 × 10⁻¹³
aliquot from first dilution B 9.0 × 10⁻⁶ 9.29 × 10 -9
mass of standard solution added to the sample
B 2.4 × 10⁻⁶ 6.63 × 10⁻¹⁰
Standard mass B 8.6 × 10⁻⁶ 8.51 × 10⁻⁹
Standard solution mass B 3.8 × 10⁻⁸ 1.65 × 10⁻¹³
Urea (STY-0049-002):
Component type u component
(mg/kg) relative contribution (%)
repeatability A 4.0 × 10⁻² 1.85 × 101
calibrant purity value B 5.0 × 10⁻⁴ 2.94 × 10⁻⁵
calibration curve A 8.3 × 10⁻² 8.15 × 101
sample mass B 2.2 × 10⁻⁶ 5.69 × 10⁻¹⁰
mass after first sample dilution B 3.7 × 10⁻⁷ 1.58 × 10⁻¹¹
mass after second sample dilution
B 3.5 × 10⁻⁷ 1.40 × 10⁻¹¹
aliquot from first dilution B 4.2 × 10⁻⁶ 2.09 × 10 -9
mass of standard solution added to the sample
B 2.1 × 10⁻⁶ 5.37 × 10⁻¹⁰
standard mass B 8.6 × 10⁻⁶ 8.73 × 10⁻⁹
standard solution mass B 3.8 × 10⁻⁸ 1.70 × 10⁻¹³

Page 76 of 143
Uric acid (STY-0049-001):
Component type
u component
(mg/kg) relative contribution (%)
repeatability A 4.1 × 10⁻² 3.60 × 101
calibrant purity value B 1.0 × 10⁻³ 2.11 × 10⁻²
calibration curve A 5.5 × 10⁻² 6.37 × 101
sample mass B 2.7 × 10⁻³ 1.55 × 10⁻¹
mass after first sample dilution B 1.2 × 10⁻³ 2.85 × 10⁻²
mass after second sample
dilution
B 5.8 × 10⁻⁵ 6.96 × 10⁻⁵
aliquot from first dilution B 7.1 × 10⁻⁴ 1.05 × 10 -2
mass of standard solution added
to the sample
B 2.5 × 10⁻³ 1.35 × 10⁻¹
standard mass B 1.3 × 10⁻⁵ 3.73 × 10⁻⁶
standard solution mass B 4.7 × 10⁻⁶ 4.55 × 10⁻⁷
Uric acid (STY-0049-002):
Component type
u component
(mg/kg) relative contribution (%)
repeatability A 2.0 × 10⁻² 1.02 × 101
calibrant purity value B 1.0 × 10⁻³ 2.49 × 10⁻²
calibration curve A 6.0 × 10⁻² 8.93 × 101
sample mass B 2.5 × 10⁻³ 1.65 × 10⁻¹
mass after first sample dilution B 1.1 × 10⁻³ 3.23 × 10⁻²
mass after second sample
dilution
B 2.0 × 10⁻⁴ 1.03 × 10⁻³
aliquot from first dilution B 6.9 × 10⁻⁴ 1.17 × 10 -2
mass of standard solution added
to the sample
B 2.6 × 10⁻³ 1.64 × 10⁻¹
standard mass B 1.7 × 10⁻⁵ 7.2 × 10⁻⁶
standard solution mass B 4.2 × 10⁻⁶ 4.4 × 10⁻⁷
Duewer, D.L.; Parris, R.M.; White V, E.; May, W.E.; Elbaum, H. NIST Special Publication 1012. National Institute of Standards and Technology, 2004

Page 77 of 143
NIM
Uncertainty Information of Serum Urea from NIMC
Parameter STY-0049-001 STY-0049-002 Source of uncertainty
uw-sam 0.01% 0.01% Serum Sample weight
up 0.10% 0.10% Purity of calibrant
ucs 0.14% 0.14% Calibration solutions
ucb 0.02% 0.02% Calibration blends
ur-std 0.66% 0.66% Ratio area of Standard
ur-sam 0.72% 0.93% Ratio area of Sample
uIS 0.02% 0.02% Internal Standard spiked
into Sample
usam 0.43% 0.28% RSD of samples measured
uc 1.08% 1.19% combined uncertainty
k 2 2 Coverage factor
Urel 2.16% 2.38% Expanded uncertainty
Concentration ±combined
uncertainty(mg/kg) 1481±16 334.8±4.0
Uncertainty Information of Serum Uric Acid from NIMC
Parameter STY-0049-001 STY-0049-002 Source of uncertainty
uw-sam 0.01% 0.01% Serum Sample weight
up 0.15% 0.15% Purity of calibrant
ucs 0.22% 0.22% Calibration solutions
ucb 0.01% 0.01% Calibration blends
ur-std 0.42% 0.42% Ratio area of Standard
ur-sam 0.40% 0.65% Ratio area of Sample
uIS 0.02% 0.02% Internal Standard spiked into
Sample
usam 0.85% 1.41% RSD of samples measured
uc 1.07% 1.63% combined uncertainty
k 2 2 Coverage factor
Urel 2.14% 3.26% Expanded uncertainty
Concentration ±combined
uncertainty(mg/kg) 136.5±1. 5 39.67±0.65

Page 78 of 143
GLHK
Uncertainty budget of Urea in STY-0049-001 (Green Cap)
Urea
Value x
Standard uncertaint y
u(xi)
Relative standard
uncertainty u(xi)/xi
Contribution to total uc (%)
Uncertainty evaluation
cz (mg/kg) 508.97 5.101 0.01002 47.47 B
my (mg) 149.86 0.0375 0.00025 0.03 B
mx (mg) 101.43 0.0375 0.00037 0.06 B
myc (mg) 354.30 0.0375 0.00011 0.01 B
mzc (mg) 353.87 0.0375 0.00011 0.01 B
Rb 1.12 0.0041 0.00363 6.22 A
Rbc 1.09 0.0048 0.00442 9.16 A
Dis 1.96 0.0001 0.00006 0.00 B
R 1.00 0.0089 0.00885 37.04 A
Uncertainty budget of Urea in STY-0049-002 (Red Cap)
Urea
Value x
Standard uncertaint
y u(xi)
Relative standard
uncertainty u(xi)/xi
Contribution to total uc
(%)
Uncertainty evaluation
cz (mg/kg) 1000.57 10.419 0.01041 56.93 B
my (mg) 111.19 0.0375 0.00034 0.06 B
mx (mg) 100.50 0.0375 0.00037 0.07 B
myc (mg) 180.66 0.0375 0.00021 0.02 B
mzc (mg) 186.63 0.0375 0.00020 0.02 B
Rb 1.14 0.0039 0.00341 6.11 A
Rbc 1.12 0.0039 0.00347 6.27 A
Dis 3.31 0.0001 0.00002 0.00 B
R 1.00 0.0076 0.00762 30.52 A

Page 79 of 143
Uncertainty budget of Uric acid in STY-0049-001 (Green Cap)
Uric acid
Value x
Standard uncertaint
y u(xi)
Relative standard
uncertainty u(xi)/xi
Contribution to total uc
(%)
Uncertainty evaluation
cz (mg/kg) 136.88 1.787 0.01306 49.47 B
my (mg) 48.69 0.0375 0.00077 0.17 B
mx (mg) 99.31 0.0375 0.00038 0.04 B
myc (mg) 367.60 0.0375 0.00010 0.00 B
mzc (mg) 145.35 0.0375 0.00026 0.02 B
Rb 0.98 0.0059 0.00601 10.49 A
Rbc 0.96 0.0103 0.01074 32.73 A
Dis 4.98 0.0001 0.00001 0.00 B
R 1.00 0.0049 0.00494 7.08 A
Uncertainty budget of Uric acid in STY-0049-002 (Red Cap)
Uric acid
Value x
Standard uncertaint
y u(xi)
Relative standard
uncertainty u(xi)/xi
Contribution to total uc
(%)
Uncertainty evaluation
cz (mg/kg) 125.92 2.102 0.01669 63.83 B
my (mg) 38.96 0.0375 0.00096 0.21 B
mx (mg) 97.11 0.0375 0.00039 0.03 B
myc (mg) 205.38 0.0375 0.00018 0.01 B
mzc (mg) 160.12 0.0375 0.00023 0.01 B
Rb 1.01 0.0080 0.00793 14.39 A
Rbc 1.02 0.0092 0.00900 18.24 A
R 1.00 0.0038 0.00378 3.27 A

Page 80 of 143
LNE
Urea
Sample 1
Type
(A or B)
Final uncertainty budget (%)
Preparation of sample blends
(weighings)
B 1
Calibration model B 1
Preparation of calibration blends
(weighings)
B 4
Precision B 94
Sample 2
Type
(A or B)
Final uncertainty budget (%)
Preparation of sample blends
(weighings)
B 0.5
Calibration model B 0.5
Preparation of calibration blends
(weighings)
B 1
Precision B 98
Uric Acid
Sample 1
Type
(A or B)
Final uncertainty budget (%)
Preparation of sample blends
(weighings)
B 4
Calibration model B 21
Preparation of calibration blends
(weighings)
B 9
Precision B 76
Sample 2
Type
(A or B)
Final uncertainty budget (%)
Preparation of sample blends
(weighings)
B 3
Calibration model B 4
Preparation of calibration blends
(weighings)
B 10
Precision B 83
PTB
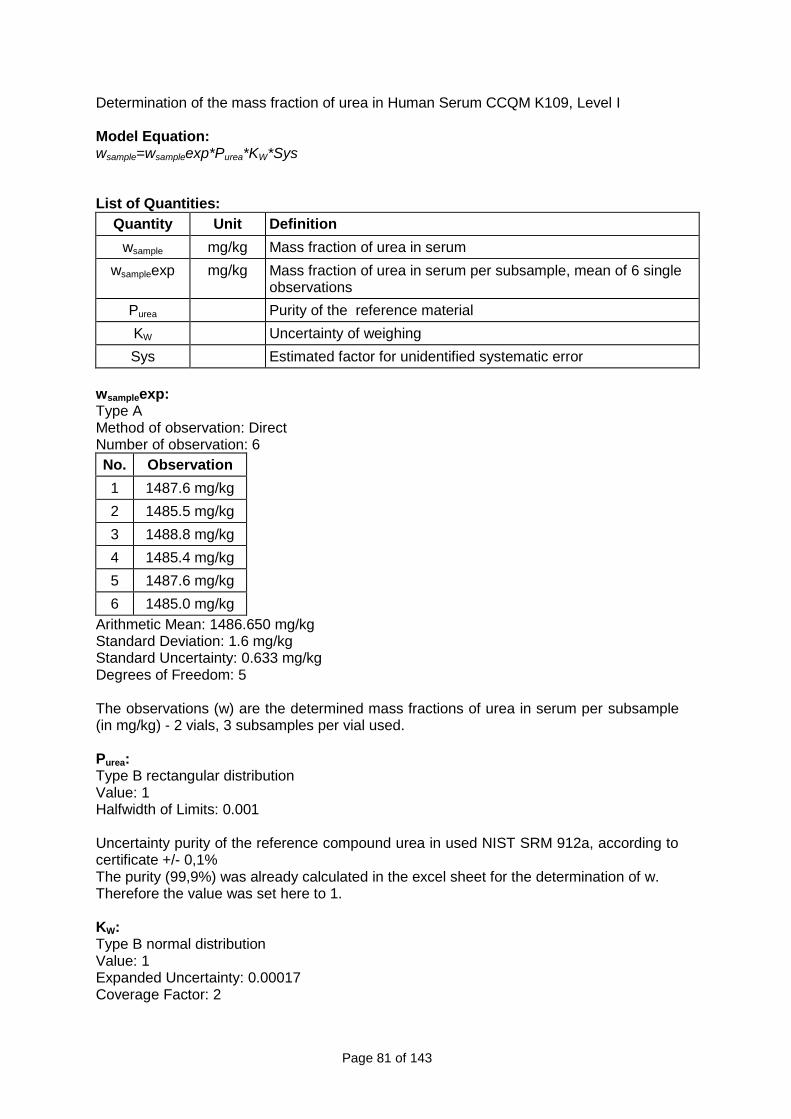
Page 81 of 143
Determination of the mass fraction of urea in Human Serum CCQM K109, Level I Model Equation: wsample=wsampleexp*Purea*KW*Sys List of Quantities:
Quantity Unit Definition
wsample mg/kg Mass fraction of urea in serum
wsampleexp mg/kg Mass fraction of urea in serum per subsample, mean of 6 single observations
Purea Purity of the reference material
KW Uncertainty of weighing
Sys Estimated factor for unidentified systematic error
wsampleexp: Type A Method of observation: Direct Number of observation: 6
No. Observation
1 1487.6 mg/kg
2 1485.5 mg/kg
3 1488.8 mg/kg
4 1485.4 mg/kg
5 1487.6 mg/kg
6 1485.0 mg/kg
Arithmetic Mean: 1486.650 mg/kg Standard Deviation: 1.6 mg/kg Standard Uncertainty: 0.633 mg/kg Degrees of Freedom: 5 The observations (w) are the determined mass fractions of urea in serum per subsample (in mg/kg) - 2 vials, 3 subsamples per vial used. Purea: Type B rectangular distribution Value: 1 Halfwidth of Limits: 0.001 Uncertainty purity of the reference compound urea in used NIST SRM 912a, according to certificate +/- 0,1% The purity (99,9%) was already calculated in the excel sheet for the determination of w. Therefore the value was set here to 1. KW: Type B normal distribution Value: 1 Expanded Uncertainty: 0.00017 Coverage Factor: 2

Page 82 of 143
Uncertainty of the microbalance MC 5 (Sartorius) calibration certificate dated 12.11.2015 U = 0,0008 mg + 1,20 * 10 E- 0 5 * m (w); = 0,017% (5 mg) Sys: Type B normal distribution Value: 1 Expanded Uncertainty: 0.01 Coverage Factor: 2 Unknown factor for systematic unidentified discrepancies including sample preparation and GC-MS interferences (estimated value = +/- 1,0 %). Uncertainty Budgets: wsample: Mass fraction of urea in serum
Quantity Value Standard Uncertainty
Distribution Sensitivity Coefficient
Uncertainty Contribution
Index
wsampleexp 1486.650 mg/kg
0.633 mg/kg normal 1.0 0.63 mg/kg 0.7 %
Purea 1.000000 577·10-6 rectangular 1500 0.86 mg/kg 1.3 %
KW 1.0000000 85.0·10-6 normal 1500 0.13 mg/kg 0.0 %
Sys 1.00000 5.00·10-3 normal 1500 7.4 mg/kg 98.0 %
wsample 1486.65 mg/kg
7.51 mg/kg
Results:
Quantity Value Expanded
Uncertainty Coverage
factor Coverage
wsample 1487 mg/kg 15 mg/kg 2.00 95% (t-table 95.45%)

Page 83 of 143
Determination of the mass fraction of urea in Human Serum CCQM K109, Level II Model Equation: wsample=wsampleexp*Purea*KW*Sys List of Quantities:
Quantity Unit Definition
wsample mg/kg Mass fraction of urea in serum
wsampleexp mg/kg Mass fraction of urea in serum per subsample, mean of 6 single observations
Purea Purity of the reference material
KW Uncertainty of weighing
Sys Estimated factor for unidentified systematic error
wsampleexp: Type A Method of observation: Direct Number of observation: 6
No. Observation
1 333.2 mg/kg
2 334.8 mg/kg
3 334.8 mg/kg
4 333.5 mg/kg
5 334.1 mg/kg
6 334.7 mg/kg
Arithmetic Mean: 334.183 mg/kg Standard Deviation: 0.70 mg/kg Standard Uncertainty: 0.287 mg/kg Degrees of Freedom: 5 The observations (w) are the determined mass fractions of urea in serum per subsample (in mg/kg) - 2 vials, 3 subsamples per vial used. Purea: Type B rectangular distribution Value: 1 Halfwidth of Limits: 0.001 Uncertainty purity of the reference compound urea in used NIST SRM 912a, according to certificate +/- 0,1% The purity (99,9%) was already calculated in the excel sheet for the determination of w. Therefore the value was set here to 1 . KW: Type B normal distribution Value: 1 Expanded Uncertainty: 0.00017 Coverage Factor: 2 Uncertainty of the microbalance MC 5 (Sartorius)

Page 84 of 143
calibration certificate dated 12.11.2015 U = 0,0008 mg + 1,20 * 10 E- 0 5 * m (w); = 0,017% (5 mg) Sys: Type B normal distribution Value: 1 Expanded Uncertainty: 0.01 Coverage Factor: 2 Unknown factor for systematic unidentified discrepancies including sample preparation and GC-MS interferences (estimated value = +/- 1,0 %). Uncertainty Budgets: wsample: Mass fraction of urea in serum
Quantity Value Standard Uncertainty
Distribution Sensitivity Coefficient
Uncertainty Contribution
Index
wsampleexp 334.183 mg/kg
0.287 mg/kg normal 1.0 0.29 mg/kg 2.8 %
Purea 1.000000 577·10-6 rectangular 330 0.19 mg/kg 1.3 %
KW 1.0000000 85.0·10-6 normal 330 0.028 mg/kg 0.0 %
Sys 1.00000 5.00·10-3 normal 330 1.7 mg/kg 95.9 %
wsample 334.18 mg/kg
1.71 mg/kg
Results:
Quantity Value Expanded
Uncertainty Coverage
factor Coverage
wsample 334.2 mg/kg 3.4 mg/kg 2.00 95% (t-table 95.45%)

Page 85 of 143
Determination of the mass fraction of uric acid in Human Serum CCQM K109, Level I Key comparison CCQM-K109 Model Equation: wsample=wsampleexp*Puricacid*KW*Sys List of Quantities:
Quantity Unit Definition
wsample mg/kg Mass fraction of uric acid in serum
wsampleexp mg/kg Mass fraction of uric acid in serum per subsample, mean of 6 single observations
Puricacid Purity of the reference material
KW Uncertainty of weighing
Sys Estimated factor for unidentified systematic error
wsampleexp: Type A Method of observation: Direct Number of observation: 6
No. Observation
1 134.39 mg/kg
2 134.12 mg/kg
3 134.02 mg/kg
4 134.43 mg/kg
5 134.40 mg/kg
6 135.75 mg/kg
Arithmetic Mean: 134.518 mg/kg Standard Deviation: 0.63 mg/kg Standard Uncertainty: 0.256 mg/kg Degrees of Freedom: 5 The observations (w) are the determined mass fractions of uric acid in serum per subsample (in mg/kg) - 2 vials, 3 subsamples per vial used. Puricacid: Type B rectangular distribution Value: 1 Halfwidth of Limits: 0.001 Uncertainty purity of the reference compound uric acid in used NIST SRM 913a, according to certificate +/- 0,1% The purity (99,6%) was already calculated in the excel sheet for the determination of w. Therefore the value was set here to 1 . KW: Type B normal distribution Value: 1 Expanded Uncertainty: 0.00017 Coverage Factor: 2 Uncertainty of the microbalance MC 5 (Sartorius) calibration certificate dated 12.11.2015

Page 86 of 143
U = 0,0008 mg + 1,20 * 10 E- 0 5 * m (w); = 0,017% (5 mg) Sys: Type B normal distribution Value: 1 Expanded Uncertainty: 0.01 Coverage Factor: 2 Unknown factor for systematic unidentified discrepancies including sample preparation and GC-MS interferences (estimated value = +/- 1,0 %). Uncertainty Budgets: wsample: Mass fraction of uric acid in serum
Quantity Value Standard Uncertainty
Distribution Sensitivity Coefficient
Uncertainty Contribution
Index
wsampleexp 134.518 mg/kg
0.256 mg/kg normal 1.0 0.26 mg/kg 12.5 %
Puricacid 1.000000 577·10-6 rectangular 130 0.078 mg/kg 1.2 %
KW 1.0000000 85.0·10-6 normal 130 0.011 mg/kg 0.0 %
Sys 1.00000 5.00·10-3 normal 130 0.67 mg/kg 86.3 %
wsample 134.518 mg/kg
0.724 mg/kg
Results:
Quantity Value Expanded
Uncertainty Coverage
factor Coverage
wsample 134.5 mg/kg 1.5 mg/kg 2.03 95% (t-table 95.45%)

Page 87 of 143
Determination of the mass fraction of uric acid in Human Serum CCQM K109, Level II Model Equation: wsample=wsampleexp*Puricacid*KW*Sys List of Quantities:
Quantity Unit Definition
wsample mg/kg Mass fraction of uric acid in serum
wsampleexp mg/kg Mass fraction of uric acid in serum per subsample, mean of 6 single observations
Puricacid Purity of the reference material
KW Uncertainty of weighing
Sys Estimated factor for unidentified systematic error
wsampleexp: Type A Method of observation: Direct Number of observation: 6
No. Observation
1 39.31 mg/kg
2 39.35 mg/kg
3 39.43 mg/kg
4 39.37 mg/kg
5 39.57 mg/kg
6 39.21 mg/kg
Arithmetic Mean: 39.3733 mg/kg Standard Deviation: 0.12 mg/kg Standard Uncertainty: 0.0494 mg/kg Degrees of Freedom: 5 The observations (w) are the determined mass fractions of uric acid in serum per subsample (in mg/kg) - 2 vials, 3 subsamples per vial used. Puricacid: Type B rectangular distribution Value: 1 Halfwidth of Limits: 0.001 Uncertainty purity of the reference compound uric acid in used NIST SRM 913a, according to certificate +/- 0,1% The purity (99,6%) was already calculated in the excel sheet for the determination of w. Therefore the value was set here to 1 . KW: Type B normal distribution Value: 1 Expanded Uncertainty: 0.00017 Coverage Factor: 2 Uncertainty of the microbalance MC 5 (Sartorius) calibration certificate dated 12.11.2015

Page 88 of 143
U = 0,0008 mg + 1,20 * 10 E- 0 5 * m (w); = 0,017% (5 mg) Sys: Type B normal distribution Value: 1 Expanded Uncertainty: 0.01 Coverage Factor: 2 Unknown factor for systematic unidentified discrepancies including sample preparation and GC-MS interferences (estimated value = +/- 1,0 %). Uncertainty Budgets: wsample: Mass fraction of uric acid in serum
Quantity Value Standard Uncertainty
Distribution Sensitivity Coefficient
Uncertainty Contribution
Index
wsampleexp 39.3733 mg/kg
0.0494 mg/kg normal 1.0 0.049 mg/kg 5.8 %
Puricacid 1.000000 577·10-6 rectangular 39 0.023 mg/kg 1.2 %
KW 1.0000000 85.0·10-6 normal 39 3.3·10-3 mg/kg 0.0 %
Sys 1.00000 5.00·10-3 normal 39 0.20 mg/kg 92.9 %
wsample 39.373 mg/kg
0.204 mg/kg
Results:
Quantity Value Expanded
Uncertainty Coverage
factor Coverage
wsample 39.37 mg/kg 0.41 mg/kg 2.00 95% (t-table 95.45%)

Page 89 of 143
NMIJ

Page 90 of 143
KRISS
Urea
STY-0049-001 STY-0049-002
Mean (mg/kg) 1604.2 336.9
Source of uncertainty
Systematic Unc.
Calibration standard mixture (Preparation of standard solution and calibration blends, Purity of standard compound)
11.2 2.3
Random Unc.
Measurement uncertainty (Measurement of isotope ratio of sample and standard solution, Weighing of sample and isotipe solution added to the sample for analysis)
6.4 0.8
Combined standard unc. 13.0 2.5
veff 9 8
k(95%) 2.26 2.31
Uexp (mg/kg) 29.3 5.7
Uexp (rel%) 1.8% 1.7%
Uric acid
STY-0049-001
Uric acid
Parameter Input Unit Standard uncertainty Degree of freedom Type of uncertainty Uncertainty contribution (%)
Mis-sol,spiked 0.1897 g 0.0001 ∞ Type B 0.04%
ARsample 0.9373 0.0175 5 Type A 0.77%
Ws 0.0715 g 0.0001 ∞ Type B 0.12%
ARstd 0.9476 0.0208 2 Type A 0.89%
146.374
1.05%
3
3.18
3.356%
STY-0049-002
Uric acid
Parameter Input Unit Standard uncertainty Degree of freedom Type of uncertainty Uncertainty contribution (%)
Mis-sol,spiked 0.0828 g 0.0001 ∞ Type B 0.10%
ARsample 0.9676 0.0125 5 Type A 0.54%
Ws 0.1089 g 0.0001 ∞ Type B 0.08%
ARstd 0.9476 0.0208 2 Type A 0.89%
42.335
1.24%
5
2.57
3.189%
Average (ng/g)
Combined uncertainty (%)
Effective degree of freedom
k (95% level of confidence)
Expanded uncertainty
Effective degree of freedom
k (95% level of confidence)
Expanded uncertainty
Combined uncertainty (%)
Average (ng/g)

Page 91 of 143
CENAM
Urea, Budget of the uncertainty:
Source Value units
uncertainty standard uncertainty
Mass of measurand for calibration solution
0.29447 g Experimental, repeatability and calibration
0.000080
Mass of labeled compound for calibration solution
0.29204 g Experimental, repeatability and calibration
0.000080
Sample mass 0.30408 g Experimental, repeatability and calibration
0.000050
Mass of labeled solution for sample
0.30339 g Experimental, repeatability and calibration
0.000044
Area ratio for calibration solution
1.0203 Experimental, repeatability 0.0011
Area ratio for sample 1.0126 Experimental, repeatability 0.0073
Mass fraction of measurand in calibration solution
0.3388 mg/g Experimental, weight repeatability and purity
0.0014
The expanded uncertainty was obtained by multiplying the combined standards uncertainty by k =2 for a 95 % confident level
Source Value units uncertainty standard uncertainty
Matematic model 0.33843
mg/g Experimental, repeatibility and calibration
0.00284
Reproducibility ---- mg/g Experimental, reproducibility
0.00145
Instrument performance
---- mg/g Experimental, repeatibility 0.00219
combined standards uncertainty
0.3866
U k: 2 0.77

Page 92 of 143
Uric acid, Budget of the uncertainty
Source Value units uncertainty standard
uncertainty
Mass of measurand
for calibration
solution
0.24987 g Experimental,
repeatability and
calibration
0.00006
Mass of labeled
compound for
calibration solution
0.25180 g Experimental,
repeatability and
calibration
0.00006
Sample mass 0.20088 g Experimental,
repeatability and
calibration
0.0000075
Mass of labeled
solution for sample
0.19710 g Experimental,
repeatability and
calibration
0.0000073
Area ratio for
calibration solution
0.99253 Experimental,
repeatability
0.0383
Area ratio for sample 1.00493 Experimental,
repeatability
0.002050
Mass fraction of
measurand in
calibration solution
0.1504 mg/g Experimental, weight
repeatability and purity
0.0058
The expanded uncertainty was obtained by multiplying the combined standards
uncertainty by k =2 for a 95 % confident level
Source Value units uncertainty standard
uncertainty
Matematic model 0.1504 mg/g Experimental, repeatability
and calibration
0.0058
Reproducibility ---- mg/g Experimental,
reproducibility
0.0010
Instrument
performance
---- mg/g Experimental, repeatability 0.00049
combined standards
uncertainty
0.00595
U k: 2 0.0119

Page 93 of 143
VNIIM
UREA
Source of uncertainty
u, %
Level 1 Level 2
mass of sample (m) 0,057 0,057
response factor (F) preparation of calibration solution
purity of reference standard RSD of F determination
1,98 0,82 0,1 1,80
1,02 0,82 0,1 0,60
mass of internal standard added to sample before extraction (mIS)
preparation of IS solution mass of IS solution added to sample
0,58 0,58 0,04
0,61 0,58 0,19
RSD of results, % 1,4 0,87
comb.std uncertainty 2,49 1,47
expanded uncertainty (k=2) 5,0 3,0
URIC ACID
Source of uncertainty
u, %
Level 1 Level 2
mass of sample (m) 0,057 0,057
response factor (F) preparation of calibration solution
purity of reference standard RSD of F determination
1,71 0,82 0,1 1,5
1,54 0,82 0,1 1,3
mass of internal standard added to sample before extraction (mIS)
preparation of IS solution mass of IS solution added to sample
0,58 0,58 0,08
0,61 0,58 0,19
RSD of results, % 2,0 1,98
comb.std uncertainty 2,7 2,6
expanded uncertainty (k=2) 5,4 5,2

Page 94 of 143
HSA
As CY does not contribute to the measurement uncertainty of CX, for the estimation of
uncertainty, considering RM = mRB + b, and let RM = RM´CY/CZ, Equation (1) is converted
to:
(2)
where RM = isotope mass ratio in sample blend CZ = concentration of urea or uric acid in the calibration standard solution A standard uncertainty was estimated for all components of the measurement in Equation
(2), which were then combined using respective derived sensitivity coefficients to estimate
a combined standard uncertainty in the reported result of urea or uric acid in human
serum sample. A coverage factor k with a value of 2 was used to expand the combined
standard uncertainty at a 95 % confidence interval. Possible sources of biases [method
precision (FP) and choice of using different ion pairs (FI)] were accounted for in the final
uncertainty budget with the use of the measurement equation:
(3)
The sensitivity coefficients of each component can be expressed as follows:
The standard uncertainty of each component was calculated as follows: (1) MY and MX: The standard uncertainty was calculated based on the calibration report using the standard weights calibrated by the National Metrology Centre, A*STAR. (2) FP: The pooled standard deviation of the mean of the LC-MS/MS and GC-MS results for each sample was used as the standard uncertainty of method precision. (3) FI: The standard deviation of mean of the difference of the results using two ion pairs divided by the square root of the number of samples (for insignificant difference using t-test) or the average of the difference of the results using two ion pairs divided by 2 (for significant difference using t-test). (4) CZ: The certified purity and uncertainty of NIST SRM 912a (for urea) and SRM 913a (for uric acid) in combination with the uncertainty of weighing for preparation of the calibration standard solutions. (5) RM' : Consider RM = RM'×CZ/CY, the conversion of equation RM = mRB + b leads to: RB = (CZ×RM') / (CY×m) - b/m Let m' = CZ/(CY×m) and b' = - b/m, we have: RB = m'RM' + b'
X
ZYMX
M
CMRC '
X
ZYMIPX
M
CMRFFC '
'' M
X
M
X
R
C
R
C
Y
X
Y
X
M
C
M
C
X
X
X
X
M
C
M
C
Z
X
Z
X
C
C
C
C
P
X
P
X
F
C
F
C
I
X
I
X
F
C
F
C

Page 95 of 143
The standard uncertainty of RM' was calculated using the following equation:
(4)
where
sy/x = standard deviation of the regression
RB = peak area ratio of sample blend
= average peak area ratio of calibration blends
n = number of calibration blends used for the linear regression plot
N = injection time for each sample
RMci = isotope mass ratio in calibration blends
= average isotope mass ratio in calibration blends
The combined standard uncertainty was calculated using the equation below:
(5)
where u = combined standard uncertainty ci = sensitivity coefficient of each component uxi = standard uncertainty of each component The full uncertainty budget is given in the Tables 1 – 5 below:
Table 1 Uncertainty budget of urea in Serum I.
x uxi uxi /x ci ci2 . uxi
2 Contribution
MX (g) 0.0973 0.000085
0.0872
% 15174 1.658 1.12%
MY (g) 0.0720 0.000085
0.1179
% 20522 3.032 2.05%
CZ
(mg/kg) 1927.9 5.4809
0.2843
% 0.77 17.636 11.90%
RM' 1.0236 0.007217
0.7051
% 1443.1 108.48 73.20%
FP
(mg/kg) 1477.2 4.1247
0.2792
% 1.00 17.013 11.48%
FI
(mg/kg) 1477.2 0.6066
0.0411
% 1.00 0.368 0.25%
n
i
McMci
BcBxyR
RRm
RR
nNs
mu
M
1
22
2
/
)('
11
'
1
BcR
McR
i
xii ucu22

Page 96 of 143
Table 2 Uncertainty budget of uric acid in Serum I.
x uxi uxi /x ci ci2 . uxi
2 Contribution
MX (g) 0.0989 0.000085
0.0858
% 1383.1 0.01377 0.69%
MY (g) 0.0668 0.000127
0.1905
% 2047.1 0.06789 3.42%
CZ
(mg/kg) 201.77 0.9949
0.4931
% 0.68 0.4550 22.91%
RM' 0.9831 0.007023
0.7144
% 139.15 0.9550 48.09%
FP
(mg/kg) 136.80 0.2905
0.2124
% 1.00 0.08441 4.25%
FI
(mg/kg) 136.80 0.6401
0.4679
% 1.00 0.4097 20.63%
Table 3 Uncertainty budget of urea in Serum II.
x uxi uxi /x ci ci2 . uxi
2 Contribution
MX (g) 0.0969 0.000085
0.0876
% 3441.2 0.08526 1.15%
MY (g) 0.0823 0.000085
0.1032
% 4052.6 0.1182 1.60%
CZ
(mg/kg) 1927.9 5.4809
0.2843
% 0.17 0.8982 12.12%
RM' 0.2033 0.001422
0.6997
% 1640.1 5.4402 73.40%
FP
(mg/kg) 333.37 0.9284
0.2785
% 1.00 0.8620 11.63%
FI
(mg/kg) 333.37 0.08723
0.0262
% 1.00 0.00761 0.10%

Page 97 of 143
Table 4 Uncertainty budget of uric acid in Serum II.
x uxi uxi /x ci ci2 . uxi
2 Contribution
MX (g) 0.1483 0.000127
0.0858
% 264.92 0.00114 0.69%
MY (g) 0.0729 0.000127
0.1745
% 538.73 0.00470 2.84%
CZ
(mg/kg) 201.77 0.9949
0.4931
% 0.19 0.03754 22.65%
RM' 0.3370 0.00246
0.7304
% 116.61 0.08236 49.70%
FP
(mg/kg) 39.294 0.08210
0.2089
% 1.00 0.00674 4.07%
FI
(mg/kg) 39.294 0.1824
0.4641
% 1.00 0.03325 20.06%

Page 98 of 143
NIMT
u(wz,c) is the standard uncertainty of the mass fraction of analyte in the calibration
solution used to prepare the calibration blend. The value was estimated from the certified
mass fraction value of matrix-matched calibration standard, masses weighed for
preparation of calibration standard and uncertainty using different standards (standard
comparison).
u(my), u(my,c), u(mx) and u(mz,c) are standard uncertainties of the masses. These values
were estimated from the bias and precision effect of the balance.
u(FP) is the standard uncertainty of the precision factor. This value was estimated from
standard deviation of the multiple IDMS results.
u(FE) is the standard uncertainty of the extraction efficiency factor which was estimated
from the extraction and protein precipitation
Note: For the uncertainty contributing to the R'B and R'B,C ,the precision in measuring the
isotope amount ratios of the analyte and the internal standard in the sample and
calibration blends was assumed to be incorporated in the overall method precision. The
effect of any biases on these ratios was assumed to be negligible as any systematic
biases should cancel out since the calibration blends and sample blends were exact-
matched for analyte concentration and isotope ratio. Other biases that may arise from
extractions are captured in other factors.
UREA STY-0049-001 (GREEN CAP)
Cx = 1456 mg/kg
u(x) = 16 mg/kg
u(x)/x = 1.08%
Veff (total) = 18.189
k = 2.10 (@ 95% confidence level)
U(x) = 33
% U(x) = 2.27 %
Measurement equation factors Values Uncertainties
x u(x) u(x)/(x)
Method Precision 1.0000 0.00791 0.791%
mzc 0.13626 0.000046 0.0335%
my 0.14002 0.000046 0.0326%
myc 0.14149 0.000046 0.0323%
mx 0.09806 0.000046 0.0466%
wz 998.0268 3.914423 0.3922%
R'b 0.7959 0.002489 0.3127%
R'bc 0.7434 0.001369 0.1842%
Extraction effects 1.000 0.0050 0.500%
222
,
,
22
,
,
22
,
, )()()()()()()()(
E
E
P
P
CZ
CZ
X
X
CY
CYY
CZ
CZ
x
x
F
Fu
F
Fu
m
mu
m
mu
m
mu
m
mu
w
wu
w
wu
Y

Page 99 of 143
URIC ACID STY-0049-001 (GREEN CAP)
Cx = 134.6 mg/kg
u(x) = 1.5 mg/kg
u(x)/x = 1.07 %
Veff (total) = 13.998
k = 2.16 (@ 95% confidence level)
U(x) = 3.2
% U(x) = 2.31 %
Measurement equation factors Values Uncertainties
x u(x) u(x)/(x)
Method Precision 1.0000 0.00471 0.471%
mzc 0.03940 0.000046 0.1159%
my 0.04147 0.000046 0.1101%
myc 0.04147 0.000046 0.1101%
mx 0.09926 0.000046 0.0460%
wz 99.8547 0.483411 0.4841%
R'b 0.9406 0.004655 0.4949%
R'bc 0.9364 0.003690 0.3940%
Extraction effects 1.000 0.0050 0.500%
UREA STY-0049-002 (RED CAP)
Cx = 329.0 mg/kg
u(x) = 6.1 mg/kg
u(x)/x = 1.85%
Veff (total) = 15.027
k = 2.13 (@ 95% confidence level)
U(x) = 13
% U(x) = 3.95%
Measurement equation factors Values Uncertainties
x u(x) u(x)/(x)
Method Precision 1.0000 0.01252 1.252%
mzc 0.03208 0.000046 0.1424%
my 0.03485 0.000046 0.1311%
myc 0.03442 0.000046 0.1327%
mx 0.09818 0.000046 0.0465%
wz 1000.0173 6.558208 0.6558%
R'b 0.9922 0.007584 0.7644%
R'bc 0.7394 0.005449 0.7370%
Extraction effects 1.000 0.0050 0.500%

Page 100 of 143
URIC ACID STY-0049-002 (RED CAP)
Cx = 38.66 mg/k
u(x) = 0.52 mg/kg
u(x)/x = 1.35%
Veff (total) = 31.234
k = 2.04 (@ 95% confidence level)
U(x) = 1.07
% U(x) = 2.74 %
Measurement equation factors Values Uncertainties
x u(x) u(x)/(x)
Method Precision 1.0000 0.00964 0.964%
mzc 0.03940 0.000046 0.1159%
my 0.04147 0.000046 0.1101%
myc 0.04147 0.000046 0.1101%
mx 0.09926 0.000046 0.0460%
wz 99.8547 0.528244 0.5290%
R'b 0.8843 0.003925 0.4439%
R'bc 1.0009 0.003384 0.3381%
Extraction effects 1.000 0.0050 0.500%

Page 101 of 143
UME
Uncertainty budget of Urea
Value u(x) u(x)/x
Weighing of sample (mg)
100 0.0001 1.45E-06
Weighing of IS (mg)
100 0.0002 1.71E-06
Native stock solution (mg/kg)
10000 0.0050 5.01E-07
Labelled stock solution (mg/kg)
2500 0.0367 1.47E-05
Intermediate precision
100 0.6853 6.85E-03
Recovery
253 0.0003 1.11E-06
Repeatability
1 0.0008 7.75E-04
Calibration graph
20 0.1416 7.08E-03
9.88E-03
Result (mg/kg) 356.720
Combined uncertainty
3.526
Expanded uncertainty
7.052
% Relative uncertainty
1.977
% Relative standard uncertainty 0.988
Uncertainty budget of Uric acid
Value u(x) u(x)/x
Weighing of sample (mg)
100 1.71E-04 1.71E-06
Weighing of IS (mg)
100 1.45E-04 1.45E-06
Native stock solution (mg/kg)
2500 4.01E-03 1.60E-06
Labelled stock solution (mg/kg)
200 2.94E-02 1.47E-04
Intermediate precision
100 3.78E-01 3.78E-03
Recovery
46 1.50E-03 3.26E-05
Repeatability
1 8.16E-03 8.16E-03
Calibration graph
1 0.0142 1.42E-02
1.68E-02
Result (mg/kg)
39.940
Combined uncertainty
0.566
Expanded uncertainty
1.132
% Relative uncertainty
2.835
% Relative standard uncertainty 1.418

Page 102 of 143
LGC
Calculation of Sample Blend Uncertainty
The standard and combined uncertainties were calculated in accordance with Eurachem
guidelines. The uncertainty calculated for a sample blend was determined by combining the
relative standard uncertainties as described in equation 1.
Equation 1:
2
'/'
'/'
22222
')'(
BCR
BR
BCR
BRu
ycm
ycmu
ym
ymu
zm
zmu
xm
xmu
zw
zwu
xw
xwu
Where:
u = Standard uncertainty
Calculation of Total Uncertainty for the Two Bottles
The combined uncertainty was calculated by combining the average blend standard
uncertainty (of the 6 aliquots) with the blend to blend variation as described in equation 2.
Equation 2 – Combined Uncertainty Equation
2var
2)'()( bwuwu XX
Where:
bvar = Blend to blend variation = standard deviation of the 6 aliquots mass fraction

Page 103 of 143
Figure 1 – Average Sample Blend Uncertainty Budget for 342.8 mg/kg Sample:
Figure 2 – Average Sample Blend Uncertainty Budget for 1553 mg/kg Sample:
The uncertainty budgets illustrated are average ones. The proportion of the measured ratios
will vary with the precision of the measurements.
The major contributions to the uncertainty budget are:
R’B/R’Bc = the precision of the measured isotope amount ratio
bvar = the standard deviation mean of the mass factions (blend to blend precision)
wz = the mass fraction of the analyte in the primary standard (the purity uncertainty being the
major component and the gravimetric preparation only a minor component).
Minor contributions to the uncertainty budget are:
mx, mz, my and myc = the uncertainty associated with gravimetric preparation of the blends

Page 104 of 143
NIST
Urea Results with Type A uncertainty
Set 1 Set 2
mg/kg mg/kg
Level 1
Value 𝑌1𝑗 1499.7 1511.8
Type A uncertainty
11.85 8.04
mg/kg mg/kg
Level 2
Value 𝑌2𝑗 329.23 334.4
Type A uncertainty
3.71 2.60
Complete Uncertainty Budget
Component Type Level 1 Level 2
uncertainty in %
uncertainty in %
Repeatability and calibration
A 0.48 0.68
Reference compound B 0.05 0.05
Isotope effects B 0.1 0.1
Weighing B 0.1 0.1
Undetected bias B 1 1
Total relative standard uncertainty if errors are additive
B 1.22 1.32
Summary of Results: For Level 1: value of urea is 1505.8, standard uncertainty = 18.4, expanded uncertainty (U)= 36.8 mg/kg, coverage factor (k=2) for 95% confidence interval. For Level 2: value of urea is 331.8, standard uncertainty = 4.4, expanded uncertainty (U) = 8.8 mg/kg, coverage factor (k=2) for 95% confidence interval.

Page 105 of 143
Uric acid
Results with Type A uncertainty
mg/kg
Level 1
Value 𝑌1 135.83
Type A uncertainty
1.01
mg/kg
Level 2
Value 𝑌2 39.08
Type A uncertainty
0.30
Complete Uncertainty Budget
Component Type Level 1 Level 2
uncertainty in %
uncertainty in %
Repeatability and calibration
A 0.74 0.76
Reference compound B 0.05 0.05
Isotope effects B 0.1 0.1
Weighing B 0.1 0.1
Undetected bias B 1 1
Total relative standard uncertainty if errors are additive
B 1.25 1.26
Summary of Results: For Level 1: value of uric acid is 135.8 mg/kg, standard uncertainty = 1.7 mg/kg, expanded uncertainty (U) = 3.39 mg/kg , coverage factor (k=2) for 95% confidence interval. For Level 2: value of uric acid is 39.1 mg/kg, standard uncertainty = 0.5 mg/kg, expanded uncertainty (U) = 1.0 mg/kg, coverage factor (k=2) for 95% confidence interval.

Page 106 of 143
APPENDIX C: WEIGHTED MEDIAN ANALYSIS 20.
Blaza Toman
December 20, 2017
The Laplace random effects model [1] is similar to the Gaussian random effects model [2],
the only difference being that the laboratory effects are assumed to come from a double
exponential (Laplacian) distribution rather than the normal (Gaussian). The result is that
the KCRV is a type of weighted median. The Laplace probability distribution has “fatter”
tails and so is more robust to outliers. The following results were obtained using Markov
Chain Monte Carlo (MCMC) methods programmed in OpenBUGS [3].
Of the results that could be considered possible outliers only UME did not withdraw their
results from the KCRV calculations, so the data was tested with and without their results
to assess the impact of this.
Uric acid (serum I)
With UME included in the weighted median calculation, the KCRV is 136.50 mg/kg with
standard uncertainty of 0.98 mg/kg, giving a relative standard uncertainty of 0.72 %.
Excluding UME, the KCRV is 136.00 mg/kg with standard uncertainty of 0.59 mg/kg,
giving a relative standard uncertainty of 0.43 %
Table C-1. Uric acid (serum I) DOE and expanded uncertainty
UME Included UME Excluded
NMI Di U(Di) Di/U(Di) NMI Di U(Di) Di/U(Di)
NMIA -0.12 4.45 -0.03 NMIA 0.40 4.16 0.10
INMETRO* 15.48 20.26 0.76 INMETRO* 16.14 20.16 0.80
NIM -0.03 3.56 -0.01 NIM 0.47 3.23 0.15
LNE -0.10 3.44 -0.03 LNE 0.41 3.07 0.13
PTB -2.02 2.41 -0.84 PTB -1.53 1.84 -0.83
GLHK -0.34 5.39 -0.06 GLHK 0.21 5.19 0.04
NMIJ 1.78 2.66 0.67 NMIJ 2.29 2.13 1.07
KRISS* 9.89 3.61 2.74 KRISS* 10.35 3.25 3.19
CENAM* 13.90 12.01 1.16 CENAM* 14.27 11.97 1.19
VNIIM* -12.74 6.98 -1.82 VNIIM* -12.19 6.76 -1.80
HSA 0.28 3.42 0.08 HSA 0.76 3.06 0.25
NIMT -1.93 3.61 -0.53 NIMT -1.43 3.21 -0.44
UME 12.04 4.61 2.61 UME* 12.49 4.35 2.87
NIST -0.72 3.89 -0.19 NIST -0.21 3.63 -0.06
*Excluded from KCRV calculation

Page 107 of 143
Uric acid (serum II)
With UME included in the weighted median calculation, the KCRV is 39.39 mg/kg with
standard uncertainty of 0.11 mg/kg, giving a relative standard uncertainty of 0.28 %.
Excluding UME, the KCRV is 39.32 mg/kg with standard uncertainty of 0.11 mg/kg, giving
a relative standard uncertainty of 0.28 %
Table C-2. Uric acid (serum II) DOE and expanded uncertainty
UME Included UME Excluded
NMI Di U(Di) Di/U(Di) NMI Di U(Di) Di/U(Di)
NMIA -0.18 1.21 -0.15 NMIA -0.12 1.22 -0.10
INMETRO* 3.67 6.06 0.61 INMETRO* 3.68 6.04 0.61
NIM 0.28 1.31 0.21 NIM 0.35 1.32 0.26
LNE 0.20 1.25 0.16 LNE 0.29 1.24 0.23
PTB -0.02 0.46 -0.04 PTB 0.05 0.46 0.11
GLHK -0.59 1.62 -0.36 GLHK -0.53 1.61 -0.33
NMIJ -0.02 0.40 -0.05 NMIJ 0.05 0.41 0.12
KRISS* 2.92 1.03 2.84 KRISS* 2.98 1.02 2.92
CENAM 5.88 1.37 4.30 CENAM 5.93 1.37 4.32
VNIIM -0.39 2.01 -0.19 VNIIM -0.31 2.01 -0.16
HSA -0.10 0.85 -0.12 HSA -0.03 0.84 -0.04
NIMT -0.73 1.06 -0.69 NIMT -0.65 1.05 -0.62
UME 0.55 1.16 0.48 UME* 0.62 1.16 0.53
NIST -0.28 1.02 -0.28 NIST -0.22 1.01 -0.22
*Excluded from KCRV calculation

Page 108 of 143
Urea (serum I)
With UME included in the weighted median calculation, the KCRV is 1486.0 mg/kg with
standard uncertainty of 9.03 mg/kg, giving a relative standard uncertainty of 0.61 %.
Excluding UME, the KCRV is 1483.0 mg/kg with standard uncertainty of 6.52 mg/kg,
giving a relative standard uncertainty of 0.44 %.
Table C-3. Urea (serum I) DOE and expanded uncertainty
UME Included UME Excluded
NMI Di U(Di) Di/U(Di) NMI Di U(Di) Di/U(Di)
NMIA -16.85 26.76 -0.63 NMIA -13.76 24.20 -0.57
INMETRO* -88.71 260.40 -0.34 INMETRO* -83.14 263.80 -0.32
NIM -4.81 36.56 -0.13 NIM -2.07 34.12 -0.06
GLHK 27.79 47.40 0.59 GLHK 31.27 45.70 0.68
LNE -13.07 33.08 -0.40 LNE -10.04 30.86 -0.33
PTB 0.91 23.58 0.04 PTB 3.83 20.14 0.19
NMIJ -10.97 20.74 -0.53 NMIJ -8.00 16.54 -0.48
KRISS* 118.20 31.88 3.71 KRISS* 121.40 29.20 4.16
CENAM -0.04 26.86 0.00 CENAM 2.93 23.48 0.12
VNIIM 18.28 78.88 0.23 VNIIM 21.14 76.28 0.28
HSA -9.02 30.28 -0.30 HSA -5.84 28.22 -0.21
NIMT -29.75 37.20 -0.80 NIMT -26.89 34.66 -0.78
UME 128.40 36.74 3.49 UME* 131.50 34.02 3.87
LGC 66.97 26.98 2.48 LGC 70.21 23.92 2.94
NIST 20.13 41.10 0.49 NIST 22.64 38.98 0.58
*Excluded from KCRV calculation

Page 109 of 143
Urea (serum II)
With UME included in the weighted median calculation, the KCRV is 334.7 mg/kg with
standard uncertainty of 1.81 mg/kg, giving a relative standard uncertainty of 0.54 %.
Excluding UME, the KCRV is 334.1 mg/kg with standard uncertainty of 1.29 mg/kg, giving
a relative standard uncertainty of 0.39 %.
Table C-4. Urea (serum II) DOE and expanded uncertainty
UME Included UME Excluded
NMI Di U(Di) Di/U(Di) NMI Di U(Di) Di/U(Di)
NMIA -6.26 6.33 -0.99 NMIA -5.67 5.85 -0.97
INMETRO* -33.06 55.62 -0.59 INMETRO* -31.94 56.38 -0.57
NIM 0.15 8.70 0.02 NIM 0.65 8.26 0.08
GLHK -4.14 10.24 -0.40 GLHK -3.47 9.92 -0.35
LNE 2.24 16.34 0.14 LNE 2.80 16.24 0.17
PTB -0.45 4.95 -0.09 PTB 0.10 4.31 0.02
NMIJ -1.00 5.25 -0.19 NMIJ -0.45 4.63 -0.10
KRISS* 2.21 6.13 0.36 KRISS* 2.81 5.64 0.50
CENAM 3.80 8.55 0.44 CENAM 4.34 8.09 0.54
VNIIM 1.35 10.87 0.12 VNIIM 1.90 10.40 0.18
HSA -1.30 6.52 -0.20 HSA -0.69 6.12 -0.11
NIMT -5.61 12.89 -0.44 NIMT -5.11 12.57 -0.41
UME 22.09 7.91 2.79 UME* 22.68 7.45 3.05
LGC 8.09 6.18 1.31 LGC 8.72 5.62 1.55
NIST -2.82 9.58 -0.29 NIST -2.37 9.20 -0.26
*Excluded from KCRV calculation
References
[1] Rukhin A, Possolo A, (2011) Computational Statistics and Data Analysis 55, 1815 – 1825.
[2] Toman B, Possolo A (2009) Accred Qual Assur 14:553-563.
[3] Lunn DJ, Spiegelhalter D, Thomas A, Best N (2009) Statistics in Medicine 28:3049–3082.

Page 110 of 143
Example OpenBUGS code
Double exponential (Laplace) random effects model with mu as the measurand. Data is from CCQM-K109 uric acid (Serum I). The posterior mean of mu is 136.5 with posterior standard deviation of 0.96. Compare this with median = 136.4 with standard uncertainty of 0.29. The sigbeta parameter estimates the “dark uncertainty” in standard deviation units. When the posterior distribution of this parameter is appreciably asymmetric, the median of the distribution may provide a more characteristic estimate than the mean. Here, the (1.508 ± 0.300) mg/kg estimate provided by the mean and standard deviation appears to adequately represent the distribution. The DoEi are degrees of equivalence for labs that are included in KCRV. The DoEo are the degrees of equivalence for the labs excluded from KCRV. # Model ModelBegin{ mu~dnorm(0,1.0E-6); beta~dgamma(1.0E-5,1.0E-5); sigbeta<-sqrt(1/beta) # # Participants included in the KCRV for(k in 1:Ni){delta[k]~ddexp(mu,beta); prec[k]<-1/pow(ui[k],2); xi[k]~dnorm(delta[k],prec[k]); pred[k]~dnorm(mu, prec[k]); DoEi[k]<-xi[k]-pred[k]} # # Participants excluded from the KCRV for(k in 1:No){preco[k]<-1/pow(uo[k],2); predo[k]~dnorm(mu, preco[k]); DoEo[k]<-xo[k]-predo[k]} }ModelEnd
# Inits list(beta=1)
# Data list(Ni=10, No=4) xi[] ui[] 136.4 2 #NMIA 136.5 1.5 #NIM 136.4 1.4 #LNE 134.52 0.72 #PTB 136.2 2.5 #GLHK 138.3 0.9 #NMIJ 136.8 1.41 #HAS 134.6 1.5 #NIMT 148.53 2.105 #UME 135.8 1.7 #NIST END xo[] uo[] 152 10 #INMETRO 146.4 1.5 #KRISS 150.42 5.95 #CENAM 123.8 3.34 #VNIIM END

Page 111 of 143
Example OpenBUGS output
mean sd MC_error val2.5pc median val97.5pc start sample
DoEi[1] -0.1192 2.206 0.009516 -4.473 -0.1098 4.196 20001 50000
DoEi[2] -0.03022 1.771 0.008393 -3.509 -0.02797 3.423 20001 50000
DoEi[3] -0.1285 1.686 0.007474 -3.441 -0.121 3.191 20001 50000
DoEi[4] -2.011 1.195 0.005769 -4.377 -2.002 0.3056 20001 50000
DoEi[5] -0.3335 2.665 0.01146 -5.525 -0.3252 4.913 20001 50000
DoEi[6] 1.772 1.307 0.006081 -0.8245 1.786 4.327 20001 50000
DoEi[7] 0.2803 1.692 0.008057 -3.098 0.2918 3.595 20001 50000
DoEi[8] -1.93 1.783 0.008895 -5.467 -1.929 1.569 20001 50000
DoEi[9] 11.99 2.301 0.01057 7.521 11.99 16.5 20001 50000
DoEi[10] -0.7257 1.947 0.009103 -4.562 -0.741 3.078 20001 50000
DoEo[1] 15.5 10.08 0.04702 -4.375 15.52 35.1 20001 50000
DoEo[2] 9.869 1.773 0.008449 6.387 9.867 13.34 20001 50000
DoEo[3] 13.84 6.019 0.02854 2.005 13.83 25.67 20001 50000
DoEo[4] -12.73 3.463 0.01393 -19.52 -12.72 -5.929 20001 50000
mu 136.5 0.9499 0.004784 134.7 136.5 138.4 20001 50000
sigbeta 1.508 0.3001 0.001401 1.02 1.473 2.202 20001 50000
Column 1 The model parameters of interest, as named in the model code. “mean” and “sd” The mean and standard deviation of the posterior distribution of the parameter. “MC error” The estimated uncertainty in the posterior mean due to finite number of recorded draws. “val2.5pc” The 2.5th percentile of the posterior distribution. “median” The 50th percentile of the posterior distribution. “val2.5pc” The 97.5th percentile of the posterior distribution. “start” The number of MCMC iterations used in the burn-in phase of the analysis. These results used a burn-in of 20000 iterations
with 10-fold thinning. “sample” The number of MCMC iterations used to estimate the parameters. These results are based on 50000 iterations with
20-fold thinning. The entire analysis, including burn-in, required less than 20 seconds on a 2013 laptop PC.

Page 112 of 143
APPENDIX D: COMPARISON OF DEGREE OF EQUIVALENCE ESTIMATES 21.
Figure D-1: Degrees of equivalence, Di ± U(Di), for urea (Serum I) This displays Di, ± (Di,i) for the median and weighted median estimators, with and without the UME results. The weighted median is called “Laplace” in the legend.

Page 113 of 143
Figure D-2: Degrees of equivalence, Di ± U(Di), for urea (Serum II) This displays Di, ± (Di,i) for the median and weighted median estimators, with and without the UME results. The weighted median is called “Laplace” in the legend.

Page 114 of 143
Figure D-3: Degrees of equivalence, Di ± U(Di), for uric acid (Serum I) This displays Di, ± (Di,i) for the median and weighted median estimators, with and without the UME results. The weighted median is called “Laplace” in the legend.

Page 115 of 143
Figure D-4: Degrees of equivalence, Di ± U(Di), for uric acid (Serum II) This displays Di, ± (Di,i) for the median and weighted median estimators. The weighted median is called “Laplace” in the legend.

Page 116 of 143
APPENDIX E: CORE COMPETENCY TABLES 22.
NMIA (Urea)
CCQM-K109 NMIA High Polarity Analytes in Biological Matrix: Determination of Urea and Uric Acid in Human Serum
Scope of Measurement: This comparison enables participating NMIs/DIs to demonstrate their measurement capabilities in the determination of analytes with molecular mass of 50 to 500 g/mol, having the polarity pKOW > 2 in the range of 10 to 2,000 mg/kg in a biological matrix such as human serum, blood and urine.
Competency
Tick, cross,
or “N/A”
Specific Information as Provided by NMI/DI
Competencies for Value-Assignment of Calibrant
Calibrant: Did you use a “highly-pure substance” or calibration solution?
Urea: Certified pure material, NMIJ 6006-a
Identity verification of analyte(s) in calibration material.#
N/A N/A
For calibrants which are a highly-pure substance: Value-Assignment / Purity Assessment method(s).#
N/A N/A
For calibrants which are a calibration solution: Value-assignment method(s).#
N/A N/A
Sample Analysis Competencies
Identification of analyte(s) in sample
- Chromatographic retention time - UPLC-MS/MS: a minimum of 2 MRM
transitions monitored - GC-MS/MS: a minimum of 2 MRM
transitions monitored - GC-HRMS: a minimum of 2 ions monitored
at a resolution of 1500 (5% valley)
Extraction of analyte(s) of interest from matrix
- protein precipitation with ethanol
Cleanup - separation of analyte(s) of interest from other interfering matrix components (if used)
- (1) HILIC HPLC clean-up of the 2-hydroxypyrimidine derivative of urea (2) reversed-phase HPLC clean-up of the camphanate derivative of urea

Page 117 of 143
Transformation - conversion of analyte(s) of interest to detectable/measurable form (if used)
- (1) derivatisation of urea with malonaldehyde bis(dimethylacetal) to its 2-hydroxypyrimidine derivative for analysis by HILIC UPLC-MS/MS (2) derivatisation of urea with malonaldehyde bis(dimethylacetal to its 2-hydroxypyrimidine derivative followed by further derivatisation with MSTFA for analysis by GC-HRMS (3) derivatisation of urea using camphanic chloride for analysis by reversed phase UPLC-MS/MS
Analytical system - (1) GC-HRMS (EI) (2) reversed-phase UPLC-MS/MS (ESI+) (3) HILIC UPLC-MS/MS (ESI+)
Calibration approach for value-assignment of analyte(s) in matrix
- double IDMS with single-point exact-matching calibration with bracketing
Verification method(s) for value-assignment of analyte(s) in sample (if used)
Comparison of results using independent analysis techniques (LC vs GC, alternative stationary phases differing in selectivity and polarity, reversed-phase vs HILIC, MS/MS vs HRMS): - (1) GC-HRMS (EI)
(2) reversed-phase UPLC-MS/MS (ESI+) (3) HILIC UPLC-MS/MS (ESI+)
Other (1) Stable isotope internal standard selection: Comparison of different internal standards (15N2-urea, 13C,15N2-urea, 13C,15N2,
18O-urea) (2) Isotopic equilibration for IDMS: Sample blends equilibrated for ~12 hours overnight (3) Control of uncertainty due to preparation and dilution of standard solutions for highly polar analytes: standards comparison of calibration solutions prepared in different solvents (methanol, ethanol) (4) Monitoring potential bias by analysis of matrix CRMs (HSA HRM-01, HRM-02, HRM-03, NIST SRM909c, SRM1950)

Page 118 of 143
NMIA (Uric acid)
CCQM-K109 NMIA High Polarity Analytes in Biological Matrix: Determination of Urea and Uric Acid in Human Serum
Scope of Measurement: This comparison enables participating NMIs/DIs to demonstrate their measurement capabilities in the determination of analytes with molecular mass of 50 to 500 g/mol, having the polarity pKOW > 2 in the range of 10 to 2,000 mg/kg in a biological matrix such as human serum, blood and urine.
Competency
Tick, cross,
or “N/A”
Specific Information as Provided by NMI/DI
Competencies for Value-Assignment of Calibrant
Calibrant: Did you use a “highly-pure substance” or calibration solution?
Uric acid: Certified pure material, NIST 913B
Identity verification of analyte(s) in calibration material.#
N/A N/A
For calibrants which are a highly-pure substance: Value-Assignment / Purity Assessment method(s).#
N/A N/A
For calibrants which are a calibration solution: Value-assignment method(s).#
N/A N/A
Sample Analysis Competencies
Identification of analyte(s) in sample
- Chromatographic retention time - UPLC-MS/MS: a minimum of 2 MRM
transitions monitored - GC-MS/MS: a minimum of 2 MRM
transitions monitored - GC-HRMS: a minimum of 2 ions monitored
at a resolution of 1500 (5% valley)
Extraction of analyte(s) of interest from matrix
- protein precipitation with acetonitrile
Cleanup - separation of analyte(s) of interest from other interfering matrix components (if used)
- reversed-phase HPLC fractionation clean-up of uric acid
Transformation - conversion of analyte(s) of interest to detectable/measurable form (if used)
- derivatisation with BSTFA/TMCS for analysis by GC-MS/MS and GC-HRMS
Analytical system - (1) GC-MS/MS (EI) (2) GC-HRMS (EI) (3) HILIC UPLC-MS/MS (ESI+, ESI-)
Calibration approach for value-assignment of analyte(s) in matrix
- double IDMS with single-point exact-matching calibration with bracketing

Page 119 of 143
Verification method(s) for value-assignment of analyte(s) in sample (if used)
Comparison of results using independent analysis techniques (LC vs GC, alternative stationary phases differing in selectivity and polarity, reversed-phase vs HILIC, MS/MS vs HRMS): - (1) GC-MS/MS (EI)
(2) GC-HRMS (EI) (3) HILIC UPLC-MS/MS (ESI+, ESI-)
Other (1) Isotopic equilibration for IDMS: Sample blends equilibrated for ~12 hours overnight (2) Control of uncertainty due to preparation, dilution and stability of standard solutions for highly polar analytes: standards comparison of multiple calibration solutions; stock solutions prepared using different sources of pure materials: NIST 913B and NMIJ 6008-a at multiple time points over a 2 month period; working calibration and internal standard solutions freshly prepared from stock solutions just prior to blend preparation (3) Monitoring potential bias by analysis of matrix CRMs (HSA HRM-01, HRM-02, HRM-03, NIST SRM909c, SRM1950)

Page 120 of 143
INMETRO (Urea & Uric acid)
CCQM-K109 INMETRO High Polarity Analytes in Biological Matrix: Determination of Urea and Uric Acid in Human Serum
Scope of Measurement: This comparison enables participating NMIs/DIs to demonstrate their measurement capabilities in the determination of analytes with molecular mass of 50 to 500 g/mol, having the polarity pKOW > 2 in the range of 10 to 2,000 mg/kg in a biological matrix such as human serum, blood and urine.
Competency Tick,
cross, or “N/A”
Specific Information as Provided by NMI/DI
Competencies for Value-Assignment of Calibrant
Calibrant: Did you use a “highly-pure substance” or calibration solution?
Highly-pure substances: NIST SRM 912a for urea and SRM 913b for uric acid
Identity verification of analyte(s) in calibration material.#
N/A
For calibrants which are a highly-pure substance: Value-Assignment / Purity Assessment method(s).#
N/A
For calibrants which are a calibration solution: Value-assignment method(s).#
N/A
Sample Analysis Competencies
Identification of analyte(s) in sample
Comparison of retention time with CRM, mass spectrum
Extraction of analyte(s) of interest from matrix
N/A
Cleanup - separation of analyte(s) of interest from other interfering matrix components (if used)
Protein precipitation with acetonitrile and separation by centrifugation
Transformation - conversion of analyte(s) of interest to detectable/measurable form (if used)
Derivatization of urea to produce 2-hydroxypyrimidine
Analytical system LC-MS/MS (uric acid) and HPLC-DAD(urea)
Calibration approach for value-assignment of analyte(s) in matrix
Standard addition with 5-point calibration
Verification method(s) for value-assignment of analyte(s) in sample (if used)
N/A
Other N/A

Page 121 of 143
NIM (Urea & Uric acid)
CCQM-K109 NIM High Polarity Analytes in Biological Matrix: Determination of Urea and Uric Acid in Human Serum
Scope of Measurement: This comparison enables participating NMIs/DIs to demonstrate their measurement capabilities in the determination of analytes with molecular mass of 50 to 500 g/mol, having the polarity pKOW > 2 in the range of 10 to 2,000 mg/kg in a biological matrix such as human serum, blood and urine.
Competency
Tick, cross,
or “N/A”
Specific Information as Provided by NMI/DI
Competencies for Value-Assignment of Calibrant
Calibrant: Did you use a “highly-pure substance” or calibration solution?
Pure substances of urea and uric acid from NIM were used as GBW09201 and GBW09202
Identity verification of analyte(s) in calibration material.#
Urea : HNMR, IR Uric acid: IR
For calibrants which are a highly-pure substance: Value-Assignment / Purity Assessment method(s).#
Urea: mass balance approach (LC-UV, Karl Fischer titration, DSC, HS-GC) Uric acid: mass balance approach (LC-UV, Karl Fischer titration, mass loss upon drying)
For calibrants which are a calibration solution: Value-assignment method(s).#
N/A
Sample Analysis Competencies
Identification of analyte(s) in sample LC retention time and SIM mode
Extraction of analyte(s) of interest from matrix
N/A
Cleanup - separation of analyte(s) of interest from other interfering matrix components (if used)
Protein precipitation using acetonitrile (4 mL acetonitrile per gram of serum)
Transformation - conversion of analyte(s) of interest to detectable/measurable form (if used)
N/A
Analytical system Single quadrupole LC-MS: Urea ESI positive, Uric acid ESI negative
Calibration approach for value-assignment of analyte(s) in matrix
IDMS, Single point calibration
Verification method(s) for value-assignment of analyte(s) in sample (if used)
Serum CRMs from NIM (GBW09157, GBW09169) and NIST (SRM 909c) were used as the quality control materials
Other N/A

Page 122 of 143
GLHK (Urea)
CCQM-K109 GLHK High Polarity Analytes in Biological Matrix: Determination of Urea and Uric Acid in Human Serum
Scope of Measurement: This comparison enables participating NMIs/DIs to demonstrate their measurement capabilities in the determination of analytes with molecular mass of 50 to 500 g/mol, having the polarity pKOW > 2 in the range of 10 to 2,000 mg/kg in a biological matrix such as human serum, blood and urine.
Competency Tick,
cross, or “N/A”
Specific Information as Provided by NMI/DI
Competencies for Value-Assignment of Calibrant
Calibrant: Did you use a “highly-pure substance” or calibration solution?
Pure Material Urea: NIST 912a
Identity verification of analyte(s) in calibration material.#
N/A
For calibrants which are a highly-pure substance: Value-Assignment / Purity Assessment method(s).#
N/A
For calibrants which are a calibration solution: Value-assignment method(s).#
N/A
Sample Analysis Competencies Identification of analyte(s) in sample Retention time and mass spec ion ratio
Extraction of analyte(s) of interest from matrix
Liquid/liquid extraction
Cleanup - separation of analyte(s) of interest from other interfering matrix components (if used)
Protein participation, filtration.
Transformation - conversion of analyte(s) of interest to detectable/measurable form (if used)
Derivatization
Analytical system GC-MS
Calibration approach for value-assignment of analyte(s) in matrix
a)Quantification mode: IDMS b)Calibration mode used: bracketing Verification method(s) for value-
assignment of analyte(s) in sample (if used)
Urea: Verified by LC-MS/MS measurement.
Other N/A

Page 123 of 143
GLHK (Uric Acid)
CCQM-K109 GLHK High Polarity Analytes in Biological Matrix: Determination of Urea and Uric Acid in Human Serum
Scope of Measurement: This comparison enables participating NMIs/DIs to demonstrate their measurement capabilities in the determination of analytes with molecular mass of 50 to 500 g/mol, having the polarity pKOW > 2 in the range of 10 to 2,000 mg/kg in a biological matrix such as human serum, blood and urine.
Competency Tick,
cross, or “N/A”
Specific Information as Provided by NMI/DI
Competencies for Value-Assignment of Calibrant
Calibrant: Did you use a “highly-pure substance” or calibration solution?
Pure Material Uric acid: NIST 913b
Identity verification of analyte(s) in calibration material.#
N/A
For calibrants which are a highly-pure substance: Value-Assignment / Purity Assessment method(s).#
N/A
For calibrants which are a calibration solution: Value-assignment method(s).#
N/A
Sample Analysis Competencies Identification of analyte(s) in sample Retention time and mass spec ion ratio
Extraction of analyte(s) of interest from matrix
Liquid/liquid extraction
Cleanup - separation of analyte(s) of interest from other interfering matrix components (if used)
Protein participation, filtration.
Transformation - conversion of analyte(s) of interest to detectable/measurable form (if used)
N/A
Analytical system Uric acid: LC-MS/MS
Calibration approach for value-assignment of analyte(s) in matrix
a)Quantification mode: IDMS b)Calibration mode used: bracketing
Verification method(s) for value- assignment of analyte(s) in sample (if used)
N/A
Other N/A

Page 124 of 143
LNE (Urea & Uric acid)
CCQM-K109 LNE High Polarity Analytes in Biological Matrix: Determination of Urea and Uric Acid in Human Serum
Scope of Measurement: This comparison enables participating NMIs/DIs to demonstrate their measurement capabilities in the determination of analytes with molecular mass of 50 to 500 g/mol, having the polarity pKOW > 2 in the range of 10 to 2,000 mg/kg in a biological matrix such as human serum, blood and urine.
Competency
Tick, cross,
or “N/A”
Specific Information as Provided by NMI/DI
Competencies for Value-Assignment of Calibrant
Calibrant: Did you use a “highly-pure substance” or calibration solution?
Highly pure substance Urea : SRM NIST 912a Uric acid : SRM NIST 913b
Identity verification of analyte(s) in calibration material.#
Mass spectrum, abundance of characteristics ions, comparison with the bibliography
For calibrants which are a highly-pure substance: Value-Assignment / Purity Assessment method(s).#
Urea : SRM NIST 912a Uric acid : SRM NIST 913b
For calibrants which are a calibration solution: Value-assignment method(s).#
N/A
Sample Analysis Competencies
Identification of analyte(s) in sample Retention time, specific ions
Extraction of analyte(s) of interest from matrix
N/A
Cleanup - separation of analyte(s) of interest from other interfering matrix components (if used)
Precipitation of proteins
Transformation - conversion of analyte(s) of interest to detectable/measurable form (if used)
Uric acid : N/A Urea : derivatization
Analytical system Uric acid : LC-MS/MS Urea : GC-MS
Calibration approach for value-assignment of analyte(s) in matrix
a) IDMS b) 5-point calibration curve
Verification method(s) for value-assignment of analyte(s) in sample (if used)
N/A
Other N/A

Page 125 of 143
PTB (Urea)
CCQM-K109 PTB High Polarity Analytes in Biological Matrix: Determination of Urea and Uric Acid in Human Serum
Scope of Measurement: This comparison enables participating NMIs/DIs to demonstrate their measurement capabilities in the determination of analytes with molecular mass of 50 to 500 g/mol, having the polarity pKOW > 2 in the range of 10 to 2,000 mg/kg in a biological matrix such as human serum, blood and urine.
Competency Tick,
cross, or “N/A”
Specific Information as Provided by NMI/DI
Competencies for Value-Assignment of Calibrant
Calibrant: Did you use a “highly-pure substance” or calibration solution?
Pure material from NIST: SRM 912a
Identity verification of analyte(s) in calibration material.#
N/A
For calibrants which are a highly-pure substance: Value-Assignment / Purity Assessment method(s).#
N/A
For calibrants which are a calibration solution: Value-assignment method(s).#
N/A
Sample Analysis Competencies Identification of analyte(s) in sample Retention time, mass spec ion ratios
Extraction of analyte(s) of interest from matrix
N/A
Cleanup - separation of analyte(s) of interest from other interfering matrix components (if used)
Protein precipitation
Transformation - conversion of analyte(s) of interest to detectable/measurable form (if used)
Derivatization
Analytical system GC-MS
Calibration approach for value-assignment of analyte(s) in matrix
IDMS with single-point calibration
Verification method(s) for value- assignment of analyte(s) in sample (if used)
N/A
Other N/A

Page 126 of 143
PTB (Uric acid)
CCQM-K109 PTB High Polarity Analytes in Biological Matrix: Determination of Urea and Uric Acid in Human Serum
Scope of Measurement: This comparison enables participating NMIs/DIs to demonstrate their measurement capabilities in the determination of analytes with molecular mass of 50 to 500 g/mol, having the polarity pKOW > 2 in the range of 10 to 2,000 mg/kg in a biological matrix such as human serum, blood and urine.
Competency
Tick, cross,
or “N/A”
Specific Information as Provided by NMI/DI
Competencies for Value-Assignment of Calibrant
Calibrant: Did you use a “highly-pure substance” or calibration solution?
Pure material from NIST: SRM 913a
Identity verification of analyte(s) in calibration material.#
N/A
For calibrants which are a highly-pure substance: Value-Assignment / Purity Assessment method(s).#
N/A
For calibrants which are a calibration solution: Value-assignment method(s).#
N/A
Sample Analysis Competencies Identification of analyte(s) in sample Retention time, mass spec ion ratios
Extraction of analyte(s) of interest from matrix
N/A
Cleanup - separation of analyte(s) of interest from other interfering matrix components (if used)
Ion exchange chromatography
Transformation - conversion of analyte(s) of interest to detectable/measurable form (if used)
Derivatization
Analytical system GC-MS
Calibration approach for value-assignment of analyte(s) in matrix
IDMS with single-point calibration
Verification method(s) for value-assignment of analyte(s) in sample (if used)
N/A
Other N/A

Page 127 of 143
NMIJ (Urea)
CCQM-K109 NMIJ High Polarity Analytes in Biological Matrix: Determination of Urea and Uric Acid in Human Serum
Scope of Measurement: This comparison enables participating NMIs/DIs to demonstrate their measurement capabilities in the determination of analytes with molecular mass of 50 to 500 g/mol, having the polarity pKOW > 2 in the range of 10 to 2,000 mg/kg in a biological matrix such as human serum, blood and urine.
Competency
Tick, cross,
or “N/A”
Specific Information as Provided by NMI/DI
Competencies for Value-Assignment of Calibrant
Calibrant: Did you use a “highly-pure substance” or calibration solution?
NMIJ CRM 6006-a
Identity verification of analyte(s) in calibration material.#
IR
For calibrants which are a highly-pure substance: Value-Assignment / Purity Assessment method(s).#
Acidimetric titration Kjeldahl method
For calibrants which are a calibration solution: Value-assignment method(s).#
N/A
Sample Analysis Competencies
Identification of analyte(s) in sample
Retention time, mass spec ion ratios
Extraction of analyte(s) of interest from matrix
N/A
Cleanup - separation of analyte(s) of interest from other interfering matrix components (if used)
Protein precipitation
Transformation - conversion of analyte(s) of interest to detectable/measurable form (if used)
Derivatization (MDBMA/BSTFA)
Analytical system GC-MS
Calibration approach for value-assignment of analyte(s) in matrix
a) IDMS b) bracketing calibration
Verification method(s) for value-assignment of analyte(s) in sample (if used)
NIST SRM 909c
Other N/A

Page 128 of 143
NMIJ (Uric acid)
CCQM-K109 NMIJ High Polarity Analytes in Biological Matrix: Determination of Urea and Uric Acid in Human Serum
Scope of Measurement: This comparison enables participating NMIs/DIs to demonstrate their measurement capabilities in the determination of analytes with molecular mass of 50 to 500 g/mol, having the polarity pKOW > 2 in the range of 10 to 2,000 mg/kg in a biological matrix such as human serum, blood and urine.
Competency
Tick, cross,
or “N/A”
Specific Information as Provided by NMI/DI
Competencies for Value-Assignment of Calibrant
Calibrant: Did you use a “highly-pure substance” or calibration solution?
NMIJ CRM 6008-a
Identity verification of analyte(s) in calibration material.#
MS
For calibrants which are a highly-pure substance: Value-Assignment / Purity Assessment method(s).#
Acidimetric titration Kjeldahl method
For calibrants which are a calibration solution: Value-assignment method(s).#
N/A
Sample Analysis Competencies
Identification of analyte(s) in sample
Retention time, mass spec ion ratios
Extraction of analyte(s) of interest from matrix
N/A
Cleanup - separation of analyte(s) of interest from other interfering matrix components (if used)
Protein precipitation
Transformation - conversion of analyte(s) of interest to detectable/measurable form (if used)
N/A
Analytical system LC-MS/MS
Calibration approach for value-assignment of analyte(s) in matrix
a) IDMS b) bracketing calibration
Verification method(s) for value-assignment of analyte(s) in sample (if used)
NIST SRM 909c
Other N/A

Page 129 of 143
KRISS (Urea & Uric acid)
CCQM-K109 KRISS High Polarity Analytes in Biological Matrix: Determination of Urea and Uric Acid in Human Serum
Scope of Measurement: This comparison enables participating NMIs/DIs to demonstrate their measurement capabilities in the determination of analytes with molecular mass of 50 to 500 g/mol, having the polarity pKOW > 2 in the range of 10 to 2,000 mg/kg in a biological matrix such as human serum, blood and urine.
Competency
Tick, cross,
or “N/A”
Specific Information as Provided by NMI/DI
Competencies for Value-Assignment of Calibrant
Calibrant: Did you use a “highly-pure substance” or calibration solution?
SRM 912a and SRM 913b obtained from NIST were used for the calibration solutions of urea and uric acid, respectively. Each calibration solution was gravimetrially prepared for next ID LC-MRM analysis. In particular, the calibration solution of uric acid was stored at – 20 degree before use.
Identity verification of analyte(s) in calibration material.#
Both of urea and uric acid were verified using a LC-ESI-MS
For calibrants which are a highly-pure substance: Value-Assignment / Purity Assessment method(s).#
N/A
For calibrants which are a calibration solution: Value-assignment method(s).#
X For uric acid, results for both Serum I & II were high due to the degradation of the standard solutions, which were stored at room temperature.
Sample Analysis Competencies
Identification of analyte(s) in sample The identification of each analyte in the sample was carried out by examining both of retention time in UPLC separation and MS/MS spectra, compared to that of calibration solutions (NIST SRM 912a and 913b)
Extraction of analyte(s) of interest from matrix
Prior to LC-MRM analysis, depletion of serum proteins was carried out by precipitation with acetonitrile for uric acid,
Cleanup - separation of analyte(s) of interest from other interfering matrix components (if used)
Protein precipitation were carried out by the treatment of acetonitrile and followed by filtration with 0.2-
Transformation - conversion of analyte(s) of interest to detectable/measurable form (if used)
N/A
Analytical system For MRM analyses of each analyte, LC-ESI-MS/MS was used in positive ion mode
Calibration approach for value-assignment of analyte(s) in matrix
ID-MS with exact matching single-point calibration
Verification method(s) for value-assignment of analyte(s) in sample
The method for value-assignment of urea and uric acid was verified using KRISS

Page 130 of 143
(if used) CRM 111-1-001 and -002
Other The quality control of KRISS CRMs used for this K109 was previously verified using a NIST SRM 909b
X For urea (both Serum I & II), the comparison materials were not treated in accordance with the Study Protocol, i.e. they had been subjected to more than one round of freeze-thaw cycle.
The results for urea (Serum I) and uric acid (Serum I & II) are not consistent with the KCRVs as the 95% confidence intervals for the DoEs do not cross zero.

Page 131 of 143
CENAM (Urea)
CCQM-K109 CENAM High Polarity Analytes in Biological Matrix: Determination of Urea and Uric Acid in Human Serum
Scope of Measurement: This comparison enables participating NMIs/DIs to demonstrate their measurement capabilities in the determination of analytes with molecular mass of 50 to 500 g/mol, having the polarity pKOW > 2 in the range of 10 to 2,000 mg/kg in a biological matrix such as human serum, blood and urine.
Competency
Tick, cross,
or “N/A”
Specific Information as Provided by NMI/DI
Competencies for Value-Assignment of Calibrant
Calibrant: Did you use a “highly-pure substance” or calibration solution?
Highly pure substance: Urea, CRM-6006a National Metrology Institute of Japan (NMIJ)
Identity verification of analyte(s) in calibration material.#
N/A
For calibrants which are a highly-pure substance: Value-Assignment / Purity Assessment method(s).#
N/A
For calibrants which are a calibration solution: Value-assignment method(s).#
N/A
Sample Analysis Competencies
Identification of analyte(s) in sample Retention time and mass spec ion ratios, ions 168 for urea and ions 171 for 13C,15N2-Urea.
Extraction of analyte(s) of interest from matrix
N/A
Cleanup - separation of analyte(s) of interest from other interfering matrix components (if used)
Protein precipitation.
Transformation - conversion of analyte(s) of interest to detectable/measurable form (if used)
Derivatization: derivatized to O-trimethylsilyl-2-hydroxypyrimidine
Analytical system GC-MS.
Calibration approach for value-assignment of analyte(s) in matrix
IDMS single-point calibration.
Verification method(s) for value-assignment of analyte(s) in sample (if used)
SRM 909c was used as control RM.
Other N/A

Page 132 of 143
CENAM (Uric acid)
CCQM-K109 CENAM High Polarity Analytes in Biological Matrix: Determination of Urea and Uric Acid in Human Serum
Scope of Measurement: This comparison enables participating NMIs/DIs to demonstrate their measurement capabilities in the determination of analytes with molecular mass of 50 to 500 g/mol, having the polarity pKOW > 2 in the range of 10 to 2,000 mg/kg in a biological matrix such as human serum, blood and urine.
Competency
Tick, cross,
or “N/A”
Specific Information as Provided by NMI/DI
Competencies for Value-Assignment of Calibrant
Calibrant: Did you use a “highly-pure substance” or calibration solution?
Highly pure substance: Uric acid, CRM-6008a National Metrology Institute of Japan (NMIJ)
Identity verification of analyte(s) in calibration material.#
Ion Mass: 169, Retention time
For calibrants which are a highly-pure substance: Value-Assignment / Purity Assessment method(s).#
N/A
For calibrants which are a calibration solution: Value-assignment method(s).#
N/A
Sample Analysis Competencies
Identification of analyte(s) in sample Retention time and mass spec ion ratios, ions 169 for uric acid and ions 171 for 1,3-15N2-Uric acid
Extraction of analyte(s) of interest from matrix
N/A
Cleanup - separation of analyte(s) of interest from other interfering matrix components (if used)
Liquid- Liquid, Protein precipitation.
Transformation - conversion of analyte(s) of interest to detectable/measurable form (if used)
N/A
Analytical system X LC-MS. The LC-IDMS results were high due to unspecified reasons. After two rounds of investigation using GC-IDMS, the results agreed well with the majority of the reported results.
Calibration approach for value-assignment of analyte(s) in matrix
IDMS single-point calibration.
Verification method(s) for value-assignment of analyte(s) in sample (if used)
SRM 909c was used as control of Reference Material.
Other N/A
The results for uric acid (Serum I & II) are not consistent with the KCRVs as the 95% confidence intervals for the DoEs do not cross zero.

Page 133 of 143
VNIIM (Urea & Uric acid)
CCQM-K109 VNIIM High Polarity Analytes in Biological Matrix: Determination of Urea and Uric Acid in Human Serum
Scope of Measurement: This comparison enables participating NMIs/DIs to demonstrate their measurement capabilities in the determination of analytes with molecular mass of 50 to 500 g/mol, having the polarity pKOW > 2 in the range of 10 to 2,000 mg/kg in a biological matrix such as human serum, blood and urine.
Competency
Tick, cross,
or “N/A”
Specific Information as Provided by NMI/DI
Competencies for Value-Assignment of Calibrant
Calibrant: Did you use a “highly-pure substance” or calibration solution?
pure material: urea - SRM 912a from NIST; uric acid - SRM 913b from NIST
Identity verification of analyte(s) in calibration material.#
LC/MS
For calibrants which are a highly-pure substance: Value-Assignment / Purity Assessment method(s).#
N/A
For calibrants which are a calibration solution: Value-assignment method(s).#
N/A
Sample Analysis Competencies
Identification of analyte(s) in sample Retention time, mass spec ion ratios
Extraction of analyte(s) of interest from matrix
Protein precipitation
Cleanup - separation of analyte(s) of interest from other interfering matrix components (if used)
N/A
Transformation - conversion of analyte(s) of interest to detectable/measurable form (if used)
N/A
Analytical system LC-MS/MS
Calibration approach for value-assignment of analyte(s) in matrix
a) IDMS b) single-point calibration
Verification method(s) for value-assignment of analyte(s) in sample (if used)
N/A
Other N/A
The result for uric acid (Serum I) is not consistent with the KCRV as the 95% confidence interval for the DoE does not cross zero. No specific competency was identified as the reason.

Page 134 of 143
HSA (Urea)
CCQM-K109 HSA High Polarity Analytes in Biological Matrix: Determination of Urea and Uric Acid in Human Serum
Scope of Measurement: This comparison enables participating NMIs/DIs to demonstrate their measurement capabilities in the determination of analytes with molecular mass of 50 to 500 g/mol, having the polarity pKOW > 2 in the range of 10 to 2,000 mg/kg in a biological matrix such as human serum, blood and urine.
Competency
Tick, cross,
or “N/A”
Specific Information as Provided by NMI/DI
Competencies for Value-Assignment of Calibrant
Calibrant: Did you use a “highly-pure substance” or calibration solution?
Highly-pure urea CRM (SRM 912a) from NIST was used as the calibration standard.
Identity verification of analyte(s) in calibration material.#
LC-MS/MS was used to verify the [M+H]+ ion and the corresponding daughter ions.
For calibrants which are a highly-pure substance: Value-Assignment / Purity Assessment method(s).#
N/A Urea CRM was used as calibrant.
For calibrants which are a calibration solution: Value-assignment method(s).#
N/A
Sample Analysis Competencies
Identification of analyte(s) in sample The analytes in the samples were identified against pure urea CRM (SRM 912a) by comparing their MRM transitions and retention times on the LC-MS/MS.
Extraction of analyte(s) of interest from matrix
N/A
Cleanup - separation of analyte(s) of interest from other interfering matrix components (if used)
Protein precipitation was used for clean-up. The details are as follows: After spiking the isotope labelled internal standard solution, the sample was vortexed, and allowed to equilibrate at ambient temperature for 2 h. Acetonitrile (3 fold of aqueous volume) was then added for protein precipitation. The sample was vortexed vigorously and centrifuged for 5 min at 4000 rpm. The supernatant was filtered through 0.22 µm syringe filter. For LC-MS/MS analysis, the filtrate was diluted to approximately 2000 ng/g with acetonitrile.

Page 135 of 143
Transformation - conversion of analyte(s) of interest to detectable/measurable form (if used)
Two-step derivatisation was used for GC-MS
measurement. The details are as follows:
After centrifugation and filtration through 0.22 µm syringe filter, the filtrate containing about 3 µg of urea was added 30 µL of freshly prepared 1,1,3,3-tetramethoxypropane solution (0.3 mol/L) and 60 µL of hydrochloric acid (6.9 mol/L). The mixture was vortexed and allowed to react for 1 h at room temperature. The solution was then evaporated to dryness under nitrogen at 45
C. The residue was reconstituted with 50 µL of N-methyl-N-(trimethylsilyl)trifluoroacetamide and heated
at 60 C for 1 h to complete the derivatisation. After cooling down to ambient temperature, the sample was ready for GC-MS analysis.
Analytical system LC-MS/MS and GC-MS were used. The
averages of results obtained from LC-MS/MS
and GC-MS were reported.
Calibration approach for value-assignment of analyte(s) in matrix
Four-point calibration curve IDMS method
was used.
Verification method(s) for value-assignment of analyte(s) in sample (if used)
Human serum CRMs for urea from NIST
(SRM 909c) and HSA (HRM-3002A, level 3)
were used as quality control materials, which
were measured in parallel with the
comparison samples. The obtained values
agreed well within the uncertainties of the
certified values of the CRMs.
Other N/A

Page 136 of 143
HSA (Uric acid)
CCQM-K109 HSA High Polarity Analytes in Biological Matrix: Determination of Urea and Uric Acid in Human Serum
Scope of Measurement: This comparison enables participating NMIs/DIs to demonstrate their measurement capabilities in the determination of analytes with molecular mass of 50 to 500 g/mol, having the polarity pKOW > 2 in the range of 10 to 2,000 mg/kg in a biological matrix such as human serum, blood and urine.
Competency
Tick, cross,
or “N/A”
Specific Information as Provided by NMI/DI
Competencies for Value-Assignment of Calibrant
Calibrant: Did you use a “highly-pure substance” or calibration solution?
Highly-pure uric acid CRM (SRM 913a) from NIST was used as the calibration standard.
Identity verification of analyte(s) in calibration material.#
LC-MS/MS was used to verify the [M-H]- ion and the corresponding daughter ions.
For calibrants which are a highly-pure substance: Value-Assignment / Purity Assessment method(s).#
N/A Uric acid CRM was used as calibrant.
For calibrants which are a calibration solution: Value-assignment method(s).#
N/A
Sample Analysis Competencies
Identification of analyte(s) in sample
The analytes in the samples were identified against pure uric acid CRM (SRM 913a) by comparing their MRM transitions and retention times on the LC-MS/MS.
Extraction of analyte(s) of interest from matrix
N/A
Cleanup - separation of analyte(s) of interest from other interfering matrix components (if used)
SPE was used for clean-up. The details are
as follows:
After spiking the isotope labelled internal standards, the sample was vortexed, and allowed to equilibrate at ambient temperature for 2 h. The sample was then vortexed, and SPE was conducted using Waters Oasis MAX cartridge (30 µm, 1 cc, 30 mg). The eluent was dried under nitrogen at 45 oC, and was then reconstituted with 2 mmol/L ammonia solution (concentration about 500 ng/g) for LC-MS/MS analysis.

Page 137 of 143
Transformation - conversion of analyte(s) of interest to detectable/measurable form (if used)
For GC-MS analysis. Derivatisation was
conducted. The details are as follows:
The eluent from SPE was dried under nitrogen at 45 oC, and N-(tert-butyldimethylsilyl)-N-methyltrifluoroacetamide (MTBSTFA) solution in acetonitrile (50% v/v) was added. The uric acid concentration was kept at approximately 45 µg/g. The solution was then vortexed and heated at 60 oC for 16 h. After cooling down, After cooling down to ambient temperature, the sample was ready for GC-MS analysis.
Analytical system LC-MS/MS and GC-MS were used. The
averages of results obtained from LC-MS/MS
and GC-MS were reported.
Calibration approach for value-assignment of analyte(s) in matrix
Four-point calibration curve IDMS method
was used.
Verification method(s) for value-assignment of analyte(s) in sample (if used)
Human serum CRMs for uric acid from NIST
(SRM 909c) and HSA (HRM-3002A, level 3)
were used as the quality control materials,
which were measured in parallel with the
comparison samples. The obtained values
agreed well within the uncertainties of the
certified values of the CRMs.
Other N/A

Page 138 of 143
NIMT (Urea & Uric acid)
CCQM-K109 NIMT High Polarity Analytes in Biological Matrix: Determination of Urea and Uric Acid in Human Serum
Scope of Measurement: This comparison enables participating NMIs/DIs to demonstrate their measurement capabilities in the determination of analytes with molecular mass of 50 to 500 g/mol, having the polarity pKOW > 2 in the range of 10 to 2,000 mg/kg in a biological matrix such as human serum, blood and urine.
Competency
Tick, cross,
or “N/A”
Specific Information as Provided by NMI/DI
Competencies for Value-Assignment of Calibrant
Calibrant: Did you use a “highly-pure substance” or calibration solution?
NIST SRM912a Urea and NIST SRM913b Uric Acid
Identity verification of analyte(s) in calibration material.#
LC-MS/MS
For calibrants which are a highly-pure substance: Value-Assignment / Purity Assessment method(s).#
N/A
For calibrants which are a calibration solution: Value-assignment method(s).#
Gravimetric
Sample Analysis Competencies
Identification of analyte(s) in sample The analytes in the samples were identified against SRM912a Urea and SRM913b Uric Acid standards by comparing their retention times and m/z of LC-MS/MS
Extraction of analyte(s) of interest from matrix
N/A
Cleanup - separation of analyte(s) of interest from other interfering matrix components (if used)
Protein precipitation using Acetonitrile for uric acid and Ethanol for urea.
Transformation - conversion of analyte(s) of interest to detectable/measurable form (if used)
N/A
Analytical system LC-MS/MS
Calibration approach for value-assignment of analyte(s) in matrix
a) IDMS b) Exact matching double IDMS using one
point calibration
Verification method(s) for value-assignment of analyte(s) in sample (if used)
N/A
Other N/A

Page 139 of 143
UME (Urea)
CCQM-K109 UME High Polarity Analytes in Biological Matrix: Determination of Urea and Uric Acid in Human Serum
Scope of Measurement: This comparison enables participating NMIs/DIs to demonstrate their measurement capabilities in the determination of analytes with molecular mass of 50 to 500 g/mol, having the polarity pKOW > 2 in the range of 10 to 2,000 mg/kg in a biological matrix such as human serum, blood and urine.
Competency
Tick, cross,
or “N/A”
Specific Information as Provided by NMI/DI
Competencies for Value-Assignment of Calibrant
Calibrant: Did you use a “highly-pure substance” or calibration solution?
Highly pure substance Urea, Sigma Aldrich, 33247
Identity verification of analyte(s) in calibration material.#
HPLC-MS
For calibrants which are a highly-pure substance: Value-Assignment / Purity Assessment method(s).#
The purity assessment was done by TUBITAK UME with mass balance approach by TGA/DSC and LC-MS. Urea, (99.80 ± 0.05) %
For calibrants which are a calibration solution: Value-assignment method(s).#
N/A
Sample Analysis Competencies
Identification of analyte(s) in sample
Retention time Parent/ Product Ion
Extraction of analyte(s) of interest from matrix
Protein precipitation with acetonitrile, sample dilution, vortex, centrifuge, filtration
Cleanup - separation of analyte(s) of interest from other interfering matrix components (if used)
N/A
Transformation - conversion of analyte(s) of interest to detectable/measurable form (if used)
N/A
Analytical system LC-HRMS
Calibration approach for value-assignment of analyte(s) in matrix
a)Quantification mode used: IDMS b) Calibration mode used :5-point calibration
curve
Verification method(s) for value-assignment of analyte(s) in sample (if used)
N/A
Other N/A
The results for urea (Serum I & II) are not consistent with the KCRVs as the 95% confidence intervals for the DoEs do not cross zero. No specific competency was identified as the reason.

Page 140 of 143
UME (Uric acid)
CCQM-K109 UME High Polarity Analytes in Biological Matrix: Determination of Urea and Uric Acid in Human Serum
Scope of Measurement: This comparison enables participating NMIs/DIs to demonstrate their measurement capabilities in the determination of analytes with molecular mass of 50 to 500 g/mol, having the polarity pKOW > 2 in the range of 10 to 2,000 mg/kg in a biological matrix such as human serum, blood and urine.
Competency
Tick, cross,
or “N/A”
Specific Information as Provided by NMI/DI
Competencies for Value-Assignment of Calibrant
Calibrant: Did you use a “highly-pure substance” or calibration solution?
Highly pure substance Uric Acid, Sigma, U2625
Identity verification of analyte(s) in calibration material.#
HPLC-MS
For calibrants which are a highly-pure substance: Value-Assignment / Purity Assessment method(s).#
The purity assessment was done by TUBITAK UME with mass balance approach by TGA/DSC and LC-MS. Uric Acid, (99.82 ± 0.04) %
For calibrants which are a calibration solution: Value-assignment method(s).#
N/A
Sample Analysis Competencies
Identification of analyte(s) in sample
Retention time Parent/ Product Ion
Extraction of analyte(s) of interest from matrix
Protein precipitation with acetonitrile, sample dilution, vortex, centrifuge, filtration
Cleanup - separation of analyte(s) of interest from other interfering matrix components (if used)
N/A
Transformation - conversion of analyte(s) of interest to detectable/measurable form (if used)
N/A
Analytical system LC-HRMS
Calibration approach for value-assignment of analyte(s) in matrix
a)Quantification mode used: IDMS b) Calibration mode used :5-point calibration
curve
Verification method(s) for value-assignment of analyte(s) in sample (if used)
N/A
Other N/A
The result for uric acid (Serum I) is not consistent with the KCRV as the 95% confidence interval for the DoE does not cross zero. No specific competency was identified as the reason.

Page 141 of 143
LGC (Urea)
CCQM-K109 LGC High Polarity Analytes in Biological Matrix: Determination of Urea and Uric Acid in Human Serum
Scope of Measurement: This comparison enables participating NMIs/DIs to demonstrate their measurement capabilities in the determination of analytes with molecular mass of 50 to 500 g/mol, having the polarity pKOW > 2 in the range of 10 to 2,000 mg/kg in a biological matrix such as human serum, blood and urine.
Competency
Tick, cross,
or “N/A”
Specific Information as Provided by NMI/DI
Competencies for Value-Assignment of Calibrant
Calibrant: Did you use a “highly-pure substance” or calibration solution?
NIST SRM 912a
Identity verification of analyte(s) in calibration material.#
High Resolution Accurate Mass (HRAM) spectrometry was used, but not intentionally for the purpose of identity verification.
For calibrants which are a highly-pure substance: Value-Assignment / Purity Assessment method(s).#
N/A
For calibrants which are a calibration solution: Value-assignment method(s).#
N/A
Sample Analysis Competencies
Identification of analyte(s) in sample Retention time, single SRM transition, HRAM of intact urea.
Extraction of analyte(s) of interest from matrix
Protein precipitation via acetonitrile solution extraction
Cleanup - separation of analyte(s) of interest from other interfering matrix components (if used)
Protein precipitation via acetonitrile solution extraction
Transformation - conversion of analyte(s) of interest to detectable/measurable form (if used)
N/A
Analytical system LC-MS/MS
Calibration approach for value-assignment of analyte(s) in matrix
Linear calibration –IDMS used initially followed by exact matching –IDMS. EM-IDMS used for results submitted. Each sample blend was analysed five times with an associated calibration blend injected before and after each injection.
Verification method(s) for value-assignment of analyte(s) in sample (if used)
HRAM – of intact molecule using same LC system as for SRM analysis
Other N/A
The results for urea (Serum I & II) are not consistent with the KCRVs as the 95% confidence intervals for the DoEs do not cross zero. No specific competency was identified as the reason.

Page 142 of 143
NIST (Urea)
CCQM-K109 NIST High Polarity Analytes in Biological Matrix: Determination of Urea and Uric Acid in Human Serum
Scope of Measurement: This comparison enables participating NMIs/DIs to demonstrate their measurement capabilities in the determination of analytes with molecular mass of 50 to 500 g/mol, having the polarity pKOW > 2 in the range of 10 to 2,000 mg/kg in a biological matrix such as human serum, blood and urine.
Competency
Tick, cross,
or “N/A”
Specific Information as Provided by NMI/DI
Competencies for Value-Assignment of Calibrant
Calibrant: Did you use a “highly-pure substance” or calibration solution?
Highly pure substance (NIST SRM 912a Urea)
Identity verification of analyte(s) in calibration material.#
1H- and 13C-NMR, MS, melting point
For calibrants which are a highly-pure substance: Value-Assignment / Purity Assessment method(s).#
DSC; mass balance including Karl Fischer Titration, UV Spectroscopy
For calibrants which are a calibration solution: Value-assignment method(s).#
N/A
Sample Analysis Competencies
Identification of analyte(s) in sample
GC-MS (SIM mode), calibrant vs. sample
Extraction of analyte(s) of interest from matrix
Precipitation followed by SPE
Cleanup - separation of analyte(s) of interest from other interfering matrix components (if used)
SPE
Transformation - conversion of analyte(s) of interest to detectable/measurable form (if used)
Derivatisation (1,1,3,3-tetramethoxypropane
and
N-methyl-N-trimethylsilyltrifluroacetamide)
Analytical system GC-MS (SIM mode)
Calibration approach for value-assignment of analyte(s) in matrix
a) ID-MS: Urea-O18 b) calibration mode used:6-point calibration
curve
Verification method(s) for value-assignment of analyte(s) in sample (if used)
NIST SRM 909c used as a control.
Other N/A

Page 143 of 143
NIST (Uric acid)
CCQM-K109 NIST High Polarity Analytes in Biological Matrix: Determination of Urea and Uric Acid in Human Serum
Scope of Measurement: This comparison enables participating NMIs/DIs to demonstrate their measurement capabilities in the determination of analytes with molecular mass of 50 to 500 g/mol, having the polarity pKOW > 2 in the range of 10 to 2,000 mg/kg in a biological matrix such as human serum, blood and urine.
Competency
Tick, cross,
or “N/A”
Specific Information as Provided by NMI/DI
Competencies for Value-Assignment of Calibrant
Calibrant: Did you use a “highly-pure substance” or calibration solution?
Highly pure substance (NIST SRM 913a Uric Acid)
Identity verification of analyte(s) in calibration material.#
MS
For calibrants which are a highly-pure substance: Value-Assignment / Purity Assessment method(s).#
Mass balance, including mass loss upon drying, ashing, and DSC.
For calibrants which are a calibration solution: Value-assignment method(s).#
N/A
Sample Analysis Competencies
Identification of analyte(s) in sample
GC-MS (SIM mode), calibrant vs. sample
Extraction of analyte(s) of interest from matrix
N/A
Cleanup - separation of analyte(s) of interest from other interfering matrix components (if used)
SPE
Transformation - conversion of analyte(s) of interest to detectable/measurable form (if used)
Derivatisation (N-methyl-N-(tert-butyldimethylsilyl)trifluoroacetamide)
Analytical system GC-MS (SIM mode; EI)
Calibration approach for value-assignment of analyte(s) in matrix
a) ID-MS: 1,3-15N2-Uric acid b) 5-point calibration curve
Verification method(s) for value-assignment of analyte(s) in sample (if used)
NIST SRM 909c used as a control
Other N/A


![CCQM-K95 “Mid-Polarity Analytes in Food Matrix: Mid ...Student’s t-test (t0.95, n-2) 4.303 4.303 Critical value of b1 [t0.95, n-2 × s(b1)] 0.2778 0.0705 The stability of the study](https://static.fdocuments.in/doc/165x107/60024d24a33d4821413ec089/ccqm-k95-aoemid-polarity-analytes-in-food-matrix-mid-studentas-t-test-t095.jpg)


