CBE16 - Advanced Strategies to Predict Digital Marketing ROI
34
ADVANCED STRATEGIES TO PREDICT DIGITAL MARKETING ROI Better marketing investments to generate more revenue Angelsmith Digital ROI Success System™
Transcript of CBE16 - Advanced Strategies to Predict Digital Marketing ROI

ADVANCED STRATEGIES
TO PREDICT DIGITAL MARKETING ROI
Better marketing investments to generate more revenue
Angelsmith Digital ROI Success System™

HELLO!
SARAH PEARSONDirector of Marketing
Hess Collection Email:
[email protected] LinkedIn:
https://www.linkedin.com/in/sarah-pearson-2296a87
CARIN OLIVERChief Innovation Officer
Angelsmith Email:
[email protected] LinkedIn:
https://www.linkedin.com/in/carinoliver
ERIC OLIVERPresident
Angelsmith Email:
[email protected] LinkedIn:
https://www.linkedin.com/in/thecosmonaut

HOUSEKEEPING » Ask questions! » Angelsmith Digital ROI
Success System™ Workbook » Dropbox » End at 9:00am + QA » Questions?
Email: [email protected]

ALL WORK AND NO PLAY…
» Prizes! » Hess Collection Wine » Ohm Coffee
ADVENTURES IN DIGITAL MARKETING
» Historic, traditional brand » Rooted in the three tier system » Embarked on digital journey
in late 2015 » New website » Earned social media » Influencer activation » Digital advertising
» General brand awareness » Products » Tasting room traffic
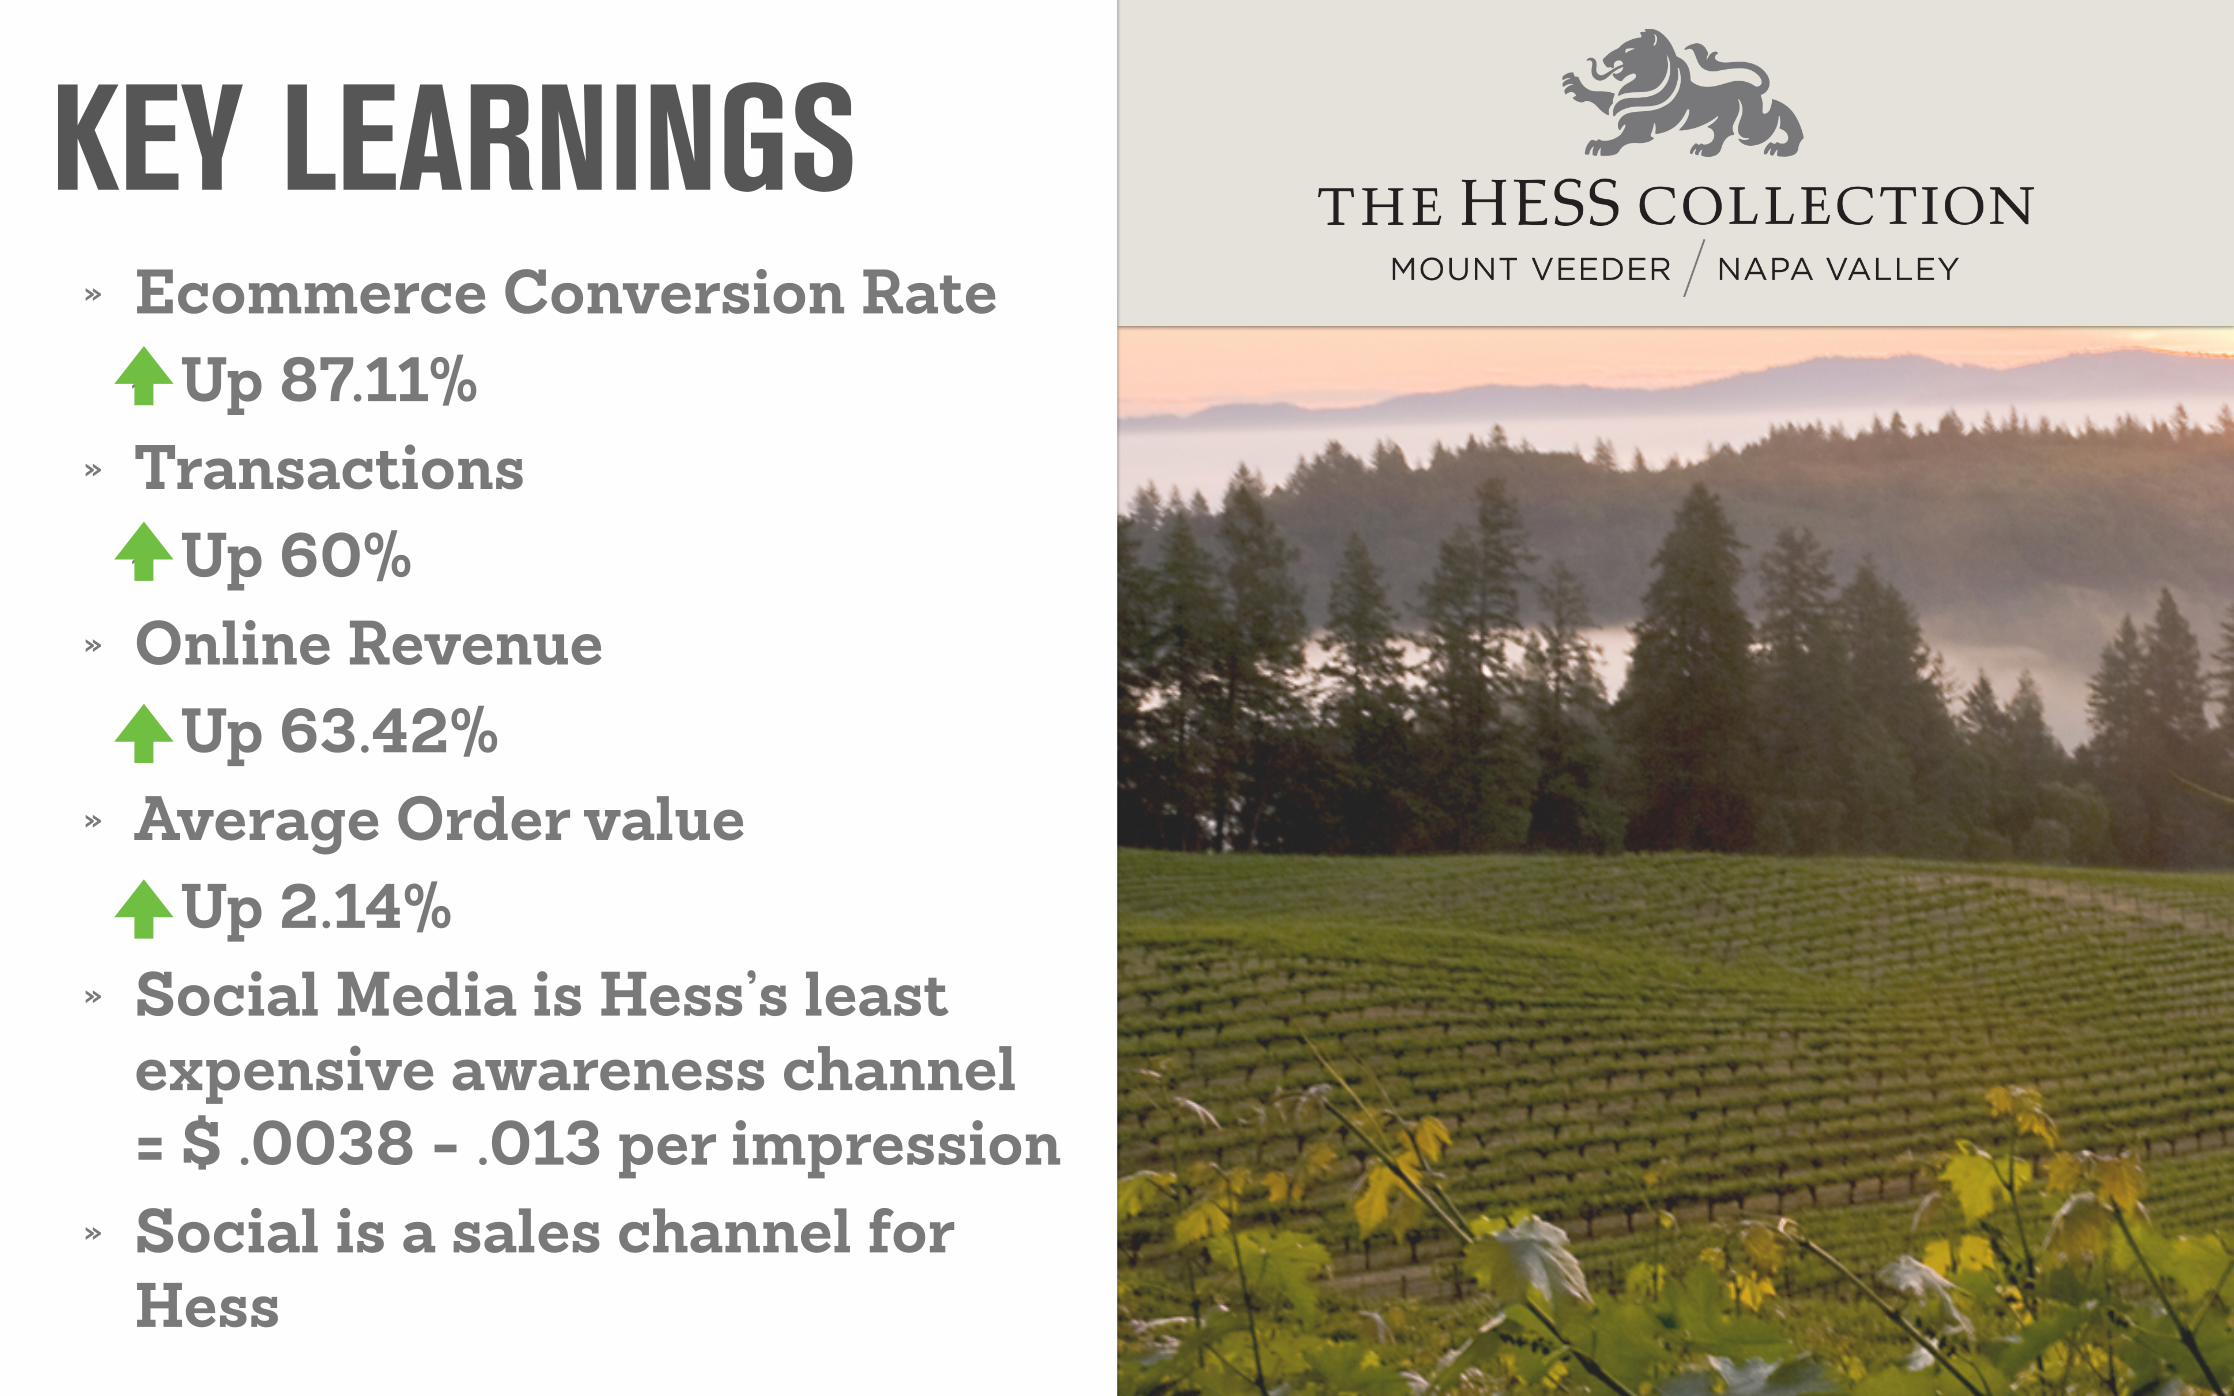
KEY LEARNINGS » Ecommerce Conversion Rate
» Up 87.11% » Transactions
» Up 60% » Online Revenue
» Up 63.42% » Average Order value
» Up 2.14% » Social Media is Hess’s least
expensive awareness channel = $ .0038 - .013 per impression
» Social is a sales channel for Hess

WHAT'S THE PROBLEM?
» Allocating digital marketing budgets is challenging. EVERYONE struggles with this.
» Different ways to calculate returns on investment.

WHAT'S THE SOLUTION?
» We can improve marketing budget returns with: » A deeper understanding of
how different channels contribute to the sale
» Industry benchmarks & trends
» Digital platform changes » Consumer behavior » Advanced attribution and
detailed measurement
ABOUT ANGELSMITH Multi-disciplinary marketing agency.
Specialize in delivering business outcomes for wine, restaurant, beer, spirits, and other categories through SEO, advertising, web
development, social media and email marketing.

OVERVIEW - WHAT WE’RE COVERING
» Core Concepts » Your business goals » ROI vs. ROAS » GI, COGS, & AGI » Customer value » Sales conversion rates » Sales lag time
» Evaluating Channels » Organic Search » Social » Paid Search » Email » Referral/Influencer Activation
» Projecting ROI Revenue » Develop ROI-based budgets

MATH AHEAD

CORE CONCEPTS
ANNUAL REVENUE GOALS » How much revenue do you want to generate
in the next 12 months from your digital investment? » Helpful examples:
» “Earn $82,000 monthly revenue from Acme Artisan product” » “Generate $8 million annual revenue” » “Realize $60K from Facebook”
» Less helpful examples: » “More sales” » “As many sales as possible” » “Facebook sales”

RETURN ON INVESTMENT (ROI) VS. RETURN ON AD SPEND (ROAS)
ROI measures the profit generated by ads relative to the cost of those ads. It measures how ads contribute to an organization’s bottom line.
ROI = (gross income - cost of goods sold - ad spend) x 100 / ad spend Example: ($20,000 - $10,000 - $5000) x 100 / $5,000 = 100% ROI
ROAS measures gross revenue generated for every dollar spent on advertising. It gauges the effectiveness of online advertising campaigns.
ROAS = gross income x 100 / ad spend Example: $20,000 x 100 / $5000 = 400% ROAS

GI, COGS, & AGI » GI (Gross Income):
Total revenue » COGS (Cost of Goods Sold):
all of the costs that you need to spend in order to produce your product.
» AGI (Adjusted Gross Income):The gross income (GI) minus the cost of goods sold (COGS). In essence, the profit.
» Example: » $10,000 (GI) - $3500
(COGS) = $6500 (AGI)

AVERAGE TRANSACTION REVENUE VS. AVERAGE TRANSACTION VALUE
Average Transaction Revenue: The average gross income (GI) per transaction that you can expect to generate from each sales occasion.
Example: If you average 2.5 products per sale at $20 each, your average transaction revenue is $50.
Average Transaction Value: The average adjusted gross income (AGI) per transaction that you can expect to generate from each sales occasion. This is the profit the organization will receive.
Example: If you average 2.5 products per sale at $20 each and the COGS per product is $10, your average transaction value is $25.

ANNUAL & LIFETIME CUSTOMER VALUE Annual Customer Value: The average AGI of a single sale times the average number of annual occasions.
Example: $10 AGI X 3 annual occasions = $30 annual customer value
Lifetime Customer Value: The average AGI of a single sale times the average number of annual occasions times the average length of the customer relationship.
Example: $10 AGI X 3 annual occasions X 2 years
= $60 lifetime customer value
Average length in a wine club is 28 months* *Silicon Valley Bank 2015 Tasting Room Survey

SALES CONVERSION RATES
» Basic: Number of people who come to your website divided by the number of people who purchase
» Advanced: Number of people who land on your sales pages divided by the number of people who purchase
WHY CALCULATE DIFFERENTLY?
» Your site may fill many roles in your customer’s path to purchase
» If you have a sales generation campaign directed at that site you’re going to want to strip out the lookie loos to get a better idea of how your campaign is working

THE IMPORTANCE OF DIFFERENTIATING

POP QUIZ If a lead doesn’t convert right away, should you:
A) Assume your marketing isn’t working?
B) Assume your product sucks? C)Blame your advertising
agency? D) Panic and run? E) Assume that your sales have
a lag time?
CHECK OUT THE BIG BRAIN ON BRAD!

SALES LAG TIME » The lag time for sales is how
long it takes for your customer to make a purchase from when they first clicked through to your website.
» We use the Google Analytics Ecommerce > Time to Purchase report, which counts the number of days from the first campaign referral to conversion.
BE AWARE, NOT SCARED, OF LAG TIME.

EXAMPLE OF LAG TIME
EVALUATING CHANNELS

ORGANIC SEARCH » Spend: The total spent on ranking for this keyword
(content, on-site optimization, etc.). » Impressions: The total number of impressions you
expect to receive from a #1 ranking. Use SEOBook.com or moz.com
» Average Click Through Rate: The average % of people who click through. Start with benchmark (22.5%), and add your actual numbers later (get from Google Search Console).
» Average Conversion Rate: Average number of people who purchase via this keyword. Start with benchmark 1%, add your actual numbers later (get from Google Analytics landing page performance).
» Average Transaction Revenue: Get from Google Analytics. Once you have campaign data, be sure to tailor to landing page (get from Google Analytics landing page performance)..
» Average COGS: Get from CFO/bookkeeper. » Annual AGI: The average AGI of a single sale times the
average number of annual occasions (get from CFO/bookkeeper).
» Lifetime AGI: The average AGI of a single sale times the average number of annual occasions (get from CFO/bookkeeper).
STEP NAME VALUE NOTES
A Keyword The keyword you will be optimizing for.
B Spend The total spent on ranking for this keyword
C Impressions The total number of impressions you expect to receive from a #1 ranking. Use SEOBook.com or moz.com
D Avg. Clickthrough Rate The average % of people who click through. Benchmark 22.5%. Get actual numbers from Google Search Console.
E Projected Traffic C x D = The total number of people who should arrive at your site if you rank #1 for this keyword.
F Avg. Conversion Rate Average number of people who purchase via this keyword. Benchmark 1%. Get actual numberst from Google Analytics landing page performance..
G Avg. Transaction Revenue Get from Google Analytics. Once you have campaign data, be sure to tailor to landing page (get from Google Analytics landing page performance)..
H Projected Gross Income E x F x G = The total amount of gross income you should generate from this keyword.
I ROAS H Return On Ad Spend (gross revenue generated for every dollar spent on marketing.) in dollars. This is equal to the Projected Gross Income.
J ROAS % ( I / B ) x 100 = Return On Ad Spend in percent
K Average COGS Average cost of goods sold for an average transaction. Get from CFO/bookkeeper.
L Projected COGS E x F x K = These are all the COGS associated with the goods sold as a result of this keyword.
M Projected AGI H - L = The total transaction revenue minus the total COGS. This is your “profit” for the campaign..
N ROI M - B = Return On Investment (profit generated by the keyword relative to the cost of they keyword) in dollars.
O ROI % ( N / B ) x 100 = Return On Investment (profit generated by the keyword relative to the cost of they keyword) in percent.
P Average Annual AGI The AGI you expect to generate over the course of a year. This is L multiplied by the average number of transactions a customer has with you in a year.
Q Projected Annual Value E x F x P = The AGI of the entire campaign over a year.
R Annual ROI Q - B = Return On Investment (profit generated by the keyword relative to the cost of they keyword) for the year in dollars.
S Annual ROI % ( R / B ) = Return On Investment (profit generated by the keyword relative to the cost of they keyword) for the year in percent.
T Projected Lifetime AGI The AGI you expect to generate over the lifetime of the customer. This is L multiplied by the average number of transactions a customer has with you.
U Projected Lifetime Value F x G x T = The AGI of the entire campaign over the lifetime of all customers generated by the campaign..
V Lifetime ROI U - B = Return On Investment (profit generated by the keyword relative to the cost of they keyword) for the lifetime of the customer in dollars.
W Annual ROI % ( W / B ) = Return On Investment (profit generated by the keyword relative to the cost of they keyword) for the year in percent.

SOCIAL » Spend: The total spent on advertising this post or
keyword. » Projected Traffic: The total number of visitors you
expect to receive this post/ad. You’re defining this number in Facebook as part of the campaign setup.
» Average Conversion Rate: Average number of people who purchase via this post/ad. Start with benchmark 2.4%, add your actual numbers later (get from Facebook reporting).
» Average Transaction Revenue: Get from Facebook reporting. Once you have campaign data, be sure to tailor to landing page (get from Facebook reporting).
» Average COGS: Get from CFO/bookkeeper. » Annual AGI: The average AGI of a single sale times
the average number of annual occasions (get from CFO/bookkeeper).
» Lifetime AGI: The average AGI of a single sale times the average number of annual occasions (get from CFO/bookkeeper).
STEP NAME VALUE NOTES
A Keyword The keyword, segment, or post you will be advertising.
B Spend The total spent on advertising this keyword.
C Projected Traffic The total number of visitors you expect to receive this post/ad. You’re defining this number in Facebook as part of the campaign setup.
D Avg. Conversion Rate Average number of people who purchase via this post/ad. Benchmark 2.4%. Add your actual numbers later (get from Facebook reporting).
E Avg. Transaction Revenue Get from Facebook reporting. Once you have campaign data, be sure to tailor to landing page (get from Facebook reporting).
F Projected Gross Income C x D x E = The total amount of gross income you should generate from this keyword.
G ROAS F Return On Ad Spend (gross revenue generated for every dollar spent on marketing.) in dollars. This is equal to the Projected Gross Income.
H ROAS % ( G / B ) x 100 = Return On Ad Spend in percent
I Average COGS Average cost of goods sold for an average transaction. Get from CFO/bookkeeper.
J Projected COGS C x D x I = These are all the COGS associated with the goods sold as a result of this keyword.
K Projected AGI F - J = The total transaction revenue minus the total COGS. This is your “profit” for the campaign..
L ROI K - B = Return On Investment (profit generated by the keyword relative to the cost of they keyword) in dollars.
M ROI % ( L / B ) x 100 = Return On Investment (profit generated by the keyword relative to the cost of they keyword) in percent.
N Average Annual AGI The AGI you expect to generate over the course of a year. This is L multiplied by the average number of transactions a customer has with you in a year.
O Projected Annual Value C x D x N = The AGI of the entire campaign over a year.
P Annual ROI O - B = Return On Investment (profit generated by the keyword relative to the cost of they keyword) for the year in dollars.
Q Annual ROI % ( P / B ) = Return On Investment (profit generated by the keyword relative to the cost of they keyword) for the year in percent.
R Projected Lifetime AGI The AGI you expect to generate over the lifetime of the customer. This is L multiplied by the average number of transactions a customer has with you.
S Projected Lifetime Value C x D x R = The AGI of the entire campaign over the lifetime of all customers generated by the campaign..
T Lifetime ROI S- B = Return On Investment (profit generated by the keyword relative to the cost of they keyword) for the lifetime of the customer in dollars.
U Annual ROI % ( T / B ) = Return On Investment (profit generated by the keyword relative to the cost of they keyword) for the year in percent.

SOCIAL » The Facebook tracking pixel is
code that you put on every page of your site to track the actions taken by consumers who originate from the network.
THE PIXEL CAN TRACK » Leads » Sales » Email sign ups » Video views
(on your site, not on an external site) » View Content » Search on your site » Add To Cart » Add To Wishlist » Initiate Checkout » Add Payment Info » Completes Registration

FB PIXEL VS. GOOGLE ANALYTICS TRACKING
Analytics will show traffic that originated from Facebook, but it loses the attribution when someone leaves and then comes back to take an action. If you remember that your consumer has a lag time before the sale, then you would be selling yourself short by just looking at Google Analytics.
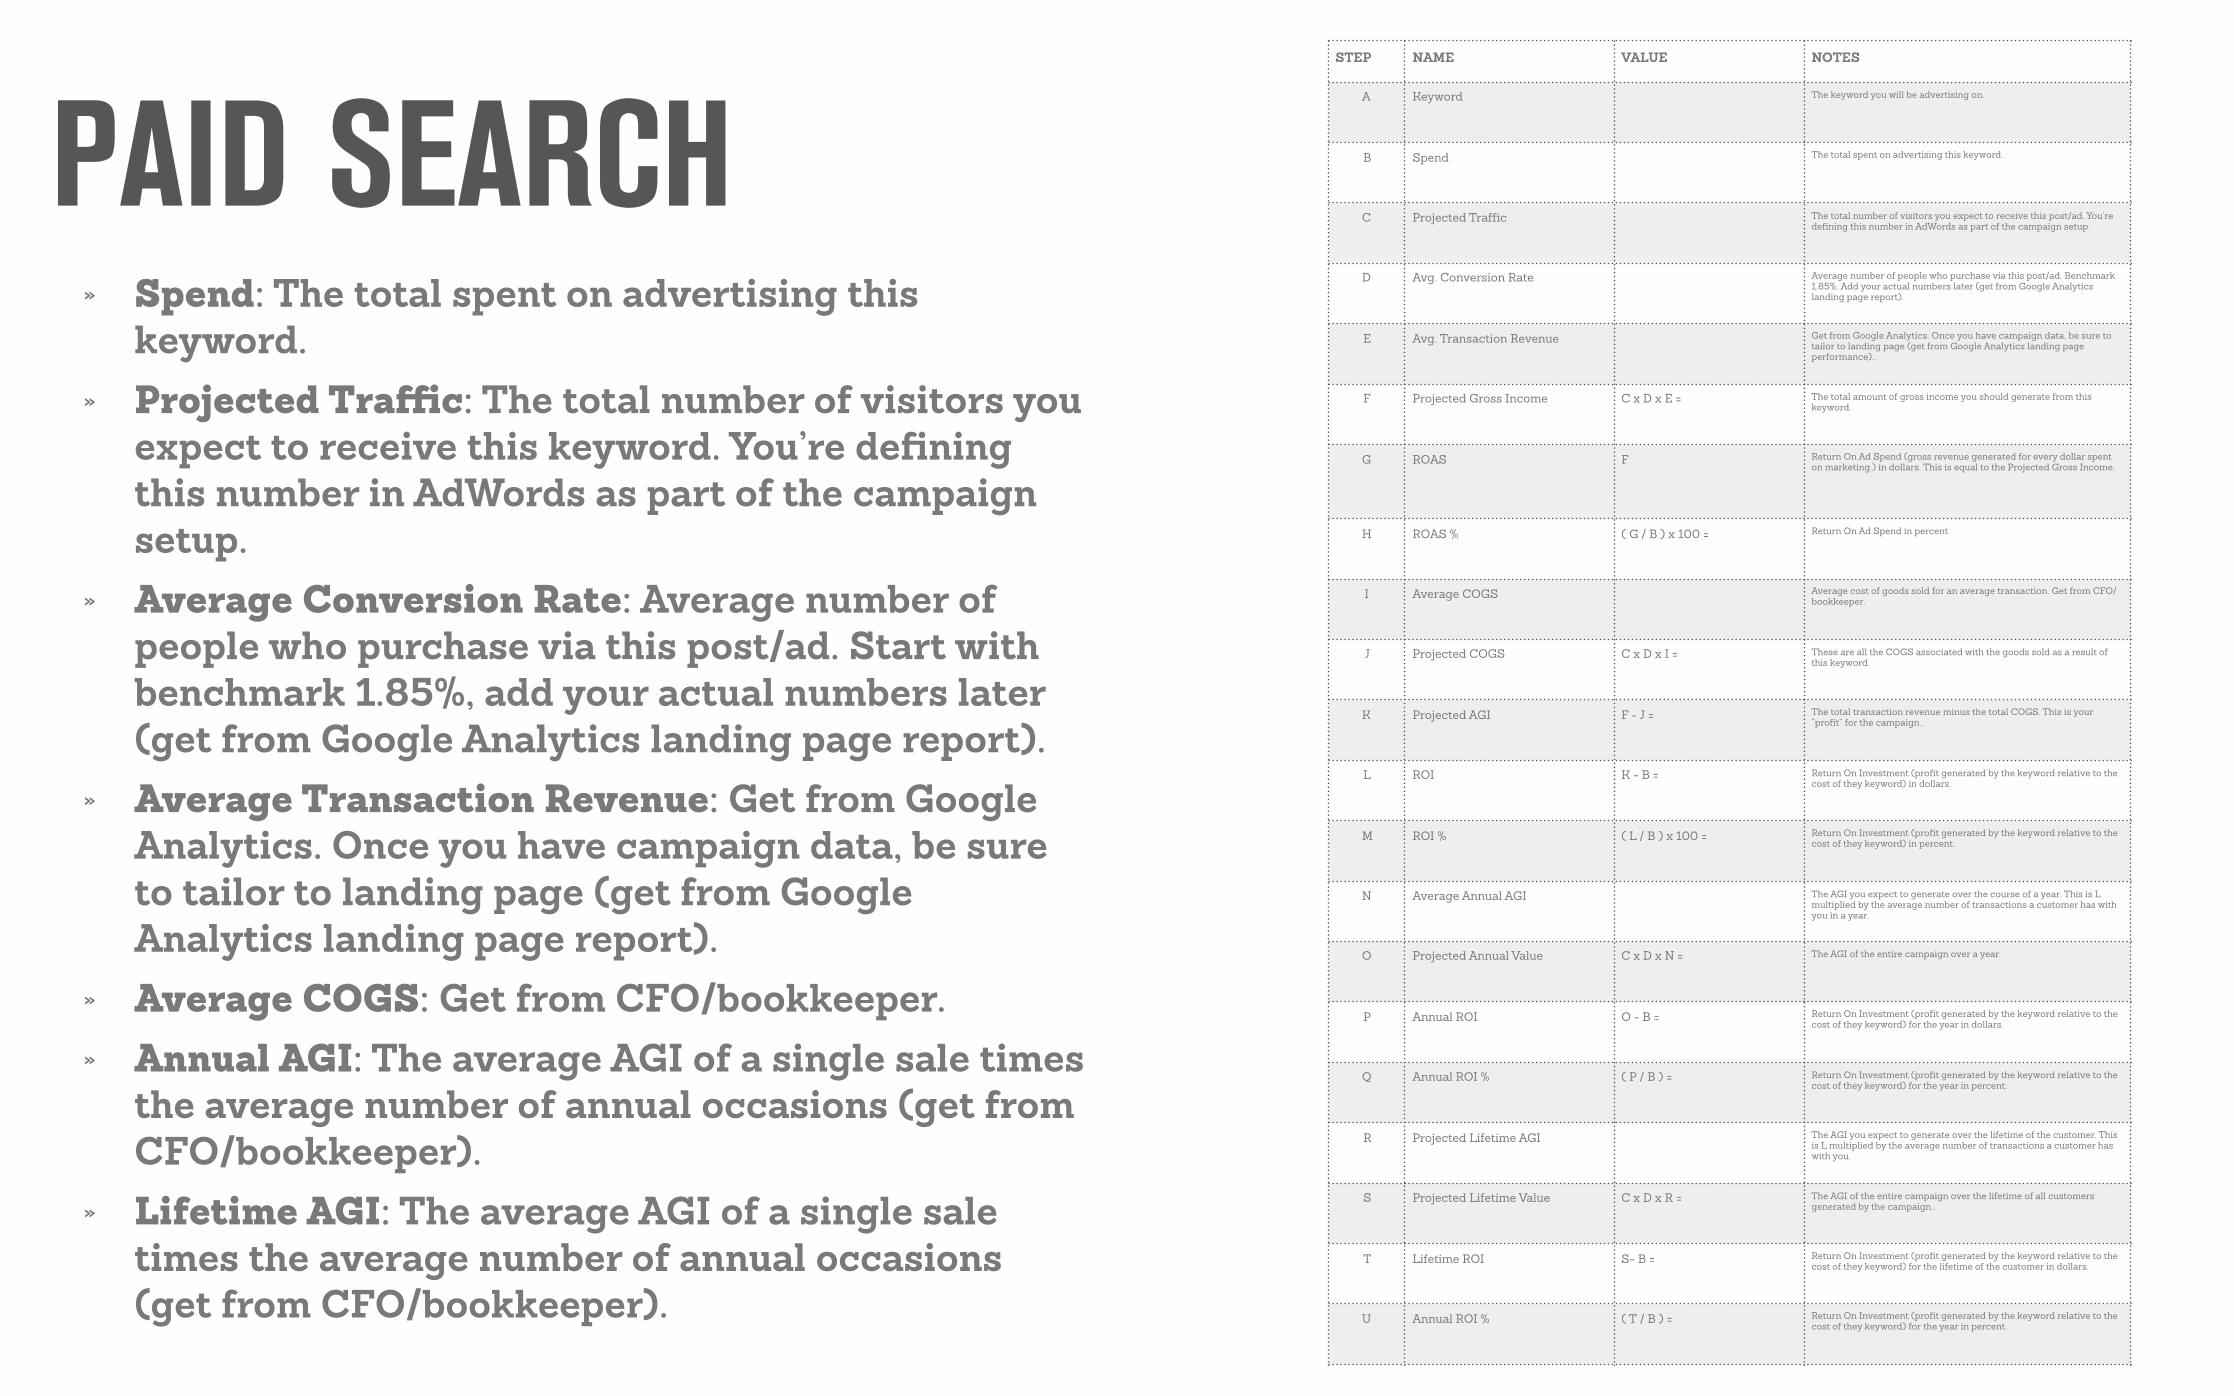
PAID SEARCH » Spend: The total spent on advertising this
keyword. » Projected Traffic: The total number of visitors you
expect to receive this keyword. You’re defining this number in AdWords as part of the campaign setup.
» Average Conversion Rate: Average number of people who purchase via this post/ad. Start with benchmark 1.85%, add your actual numbers later (get from Google Analytics landing page report).
» Average Transaction Revenue: Get from Google Analytics. Once you have campaign data, be sure to tailor to landing page (get from Google Analytics landing page report).
» Average COGS: Get from CFO/bookkeeper. » Annual AGI: The average AGI of a single sale times
the average number of annual occasions (get from CFO/bookkeeper).
» Lifetime AGI: The average AGI of a single sale times the average number of annual occasions (get from CFO/bookkeeper).
STEP NAME VALUE NOTES
A Keyword The keyword you will be advertising on.
B Spend The total spent on advertising this keyword.
C Projected Traffic The total number of visitors you expect to receive this post/ad. You’re defining this number in AdWords as part of the campaign setup.
D Avg. Conversion Rate Average number of people who purchase via this post/ad. Benchmark 1.85%. Add your actual numbers later (get from Google Analytics landing page report).
E Avg. Transaction Revenue Get from Google Analytics. Once you have campaign data, be sure to tailor to landing page (get from Google Analytics landing page performance)..
F Projected Gross Income C x D x E = The total amount of gross income you should generate from this keyword.
G ROAS F Return On Ad Spend (gross revenue generated for every dollar spent on marketing.) in dollars. This is equal to the Projected Gross Income.
H ROAS % ( G / B ) x 100 = Return On Ad Spend in percent
I Average COGS Average cost of goods sold for an average transaction. Get from CFO/bookkeeper.
J Projected COGS C x D x I = These are all the COGS associated with the goods sold as a result of this keyword.
K Projected AGI F - J = The total transaction revenue minus the total COGS. This is your “profit” for the campaign..
L ROI K - B = Return On Investment (profit generated by the keyword relative to the cost of they keyword) in dollars.
M ROI % ( L / B ) x 100 = Return On Investment (profit generated by the keyword relative to the cost of they keyword) in percent.
N Average Annual AGI The AGI you expect to generate over the course of a year. This is L multiplied by the average number of transactions a customer has with you in a year.
O Projected Annual Value C x D x N = The AGI of the entire campaign over a year.
P Annual ROI O - B = Return On Investment (profit generated by the keyword relative to the cost of they keyword) for the year in dollars.
Q Annual ROI % ( P / B ) = Return On Investment (profit generated by the keyword relative to the cost of they keyword) for the year in percent.
R Projected Lifetime AGI The AGI you expect to generate over the lifetime of the customer. This is L multiplied by the average number of transactions a customer has with you.
S Projected Lifetime Value C x D x R = The AGI of the entire campaign over the lifetime of all customers generated by the campaign..
T Lifetime ROI S- B = Return On Investment (profit generated by the keyword relative to the cost of they keyword) for the lifetime of the customer in dollars.
U Annual ROI % ( T / B ) = Return On Investment (profit generated by the keyword relative to the cost of they keyword) for the year in percent.

EMAIL » Cost: The total it costs you to send to this list. » Recipients: The total number of people who will receive
your email. Get from your email service provider (ESP). » Average Open Rate: The average % of people who will
open your email. Start with benchmark (30%), and add your actual numbers later (get from your ESP).
» Average Clickthrough Rate: The average % of people who will click through once they’ve opened your email. Start with benchmark (7.5%), and add your actual numbers later (get from your ESP).
» Average Conversion Rate: Average number of people who purchase via this keyword. Start with benchmark 3%, add your actual numbers later (get from Google Analytics landing page performance).
» Average Transaction Revenue: Get from Google Analytics. Once you have campaign data, be sure to tailor to landing page (get from Google Analytics landing page performance)..
» Average COGS: Get from CFO/bookkeeper. » Annual AGI: The average AGI of a single sale times the
average number of annual occasions (get from CFO/bookkeeper).
» Lifetime AGI: The average AGI of a single sale times the average number of annual occasions (get from CFO/bookkeeper).
STEP NAME VALUE NOTES
A Campaign The email campaign you’re sending
B Cost The total it costs you to send to this list.
C Impressions The total number of people who will receive your email. Get from your email service provider (ESP).
D Average Open Rate The average % of people who will open your email. Start with benchmark (30%), and add your actual numbers later (get from your ESP).
E Avg. Clickthrough Rate The average % of people who will click through once they’ve opened your email. Benchmark (7.5%), Add your actual numbers later (get from your ESP).
F Projected Traffic C x D x E = The total number of people who should arrive at your site from this email.
G Avg. Conversion Rate Average number of people who purchase via this keyword. Benchmark 3%. Get actual numbers from Google Analytics landing page performance..
H Avg. Transaction Revenue Get from Google Analytics. Once you have campaign data, be sure to tailor to landing page (get from Google Analytics landing page performance)..
I Projected Gross Income F x G x H = The total amount of gross income you should generate from this campaign.
J ROAS I Return On Ad Spend (gross revenue generated for every dollar spent on marketing.) in dollars. This is equal to the Projected Gross Income.
K ROAS % ( J / B ) x 100 = Return On Ad Spend in percent
L Average COGS Average cost of goods sold for an average transaction. Get from CFO/bookkeeper.
M Projected COGS F x G x L = These are all the COGS associated with the goods sold as a result of this keyword.
N Projected AGI I - M = The total transaction revenue minus the total COGS. This is your “profit” for the campaign..
O ROI N - B = Return On Investment (profit generated by the keyword relative to the cost of they keyword) in dollars.
P ROI % ( O / B ) x 100 = Return On Investment (profit generated by the keyword relative to the cost of they keyword) in percent.
Q Average Annual AGI The AGI you expect to generate over the course of a year. This is L multiplied by the average number of transactions a customer has with you in a year.
R Projected Annual Value E x F x Q = The AGI of the entire campaign over a year.
S Annual ROI R - B = Return On Investment (profit generated by the keyword relative to the cost of they keyword) for the year in dollars.
T Annual ROI % ( S / B ) = Return On Investment (profit generated by the keyword relative to the cost of they keyword) for the year in percent.
U Projected Lifetime AGI The AGI you expect to generate over the lifetime of the customer. This is L multiplied by the average number of transactions a customer has with you.
V Projected Lifetime Value E x F x U = The AGI of the entire campaign over the lifetime of all customers generated by the campaign..
W Lifetime ROI V- B = Return On Investment (profit generated by the keyword relative to the cost of they keyword) for the lifetime of the customer in dollars.
X Annual ROI % ( W / B ) = Return On Investment (profit generated by the keyword relative to the cost of they keyword) for the year in percent.
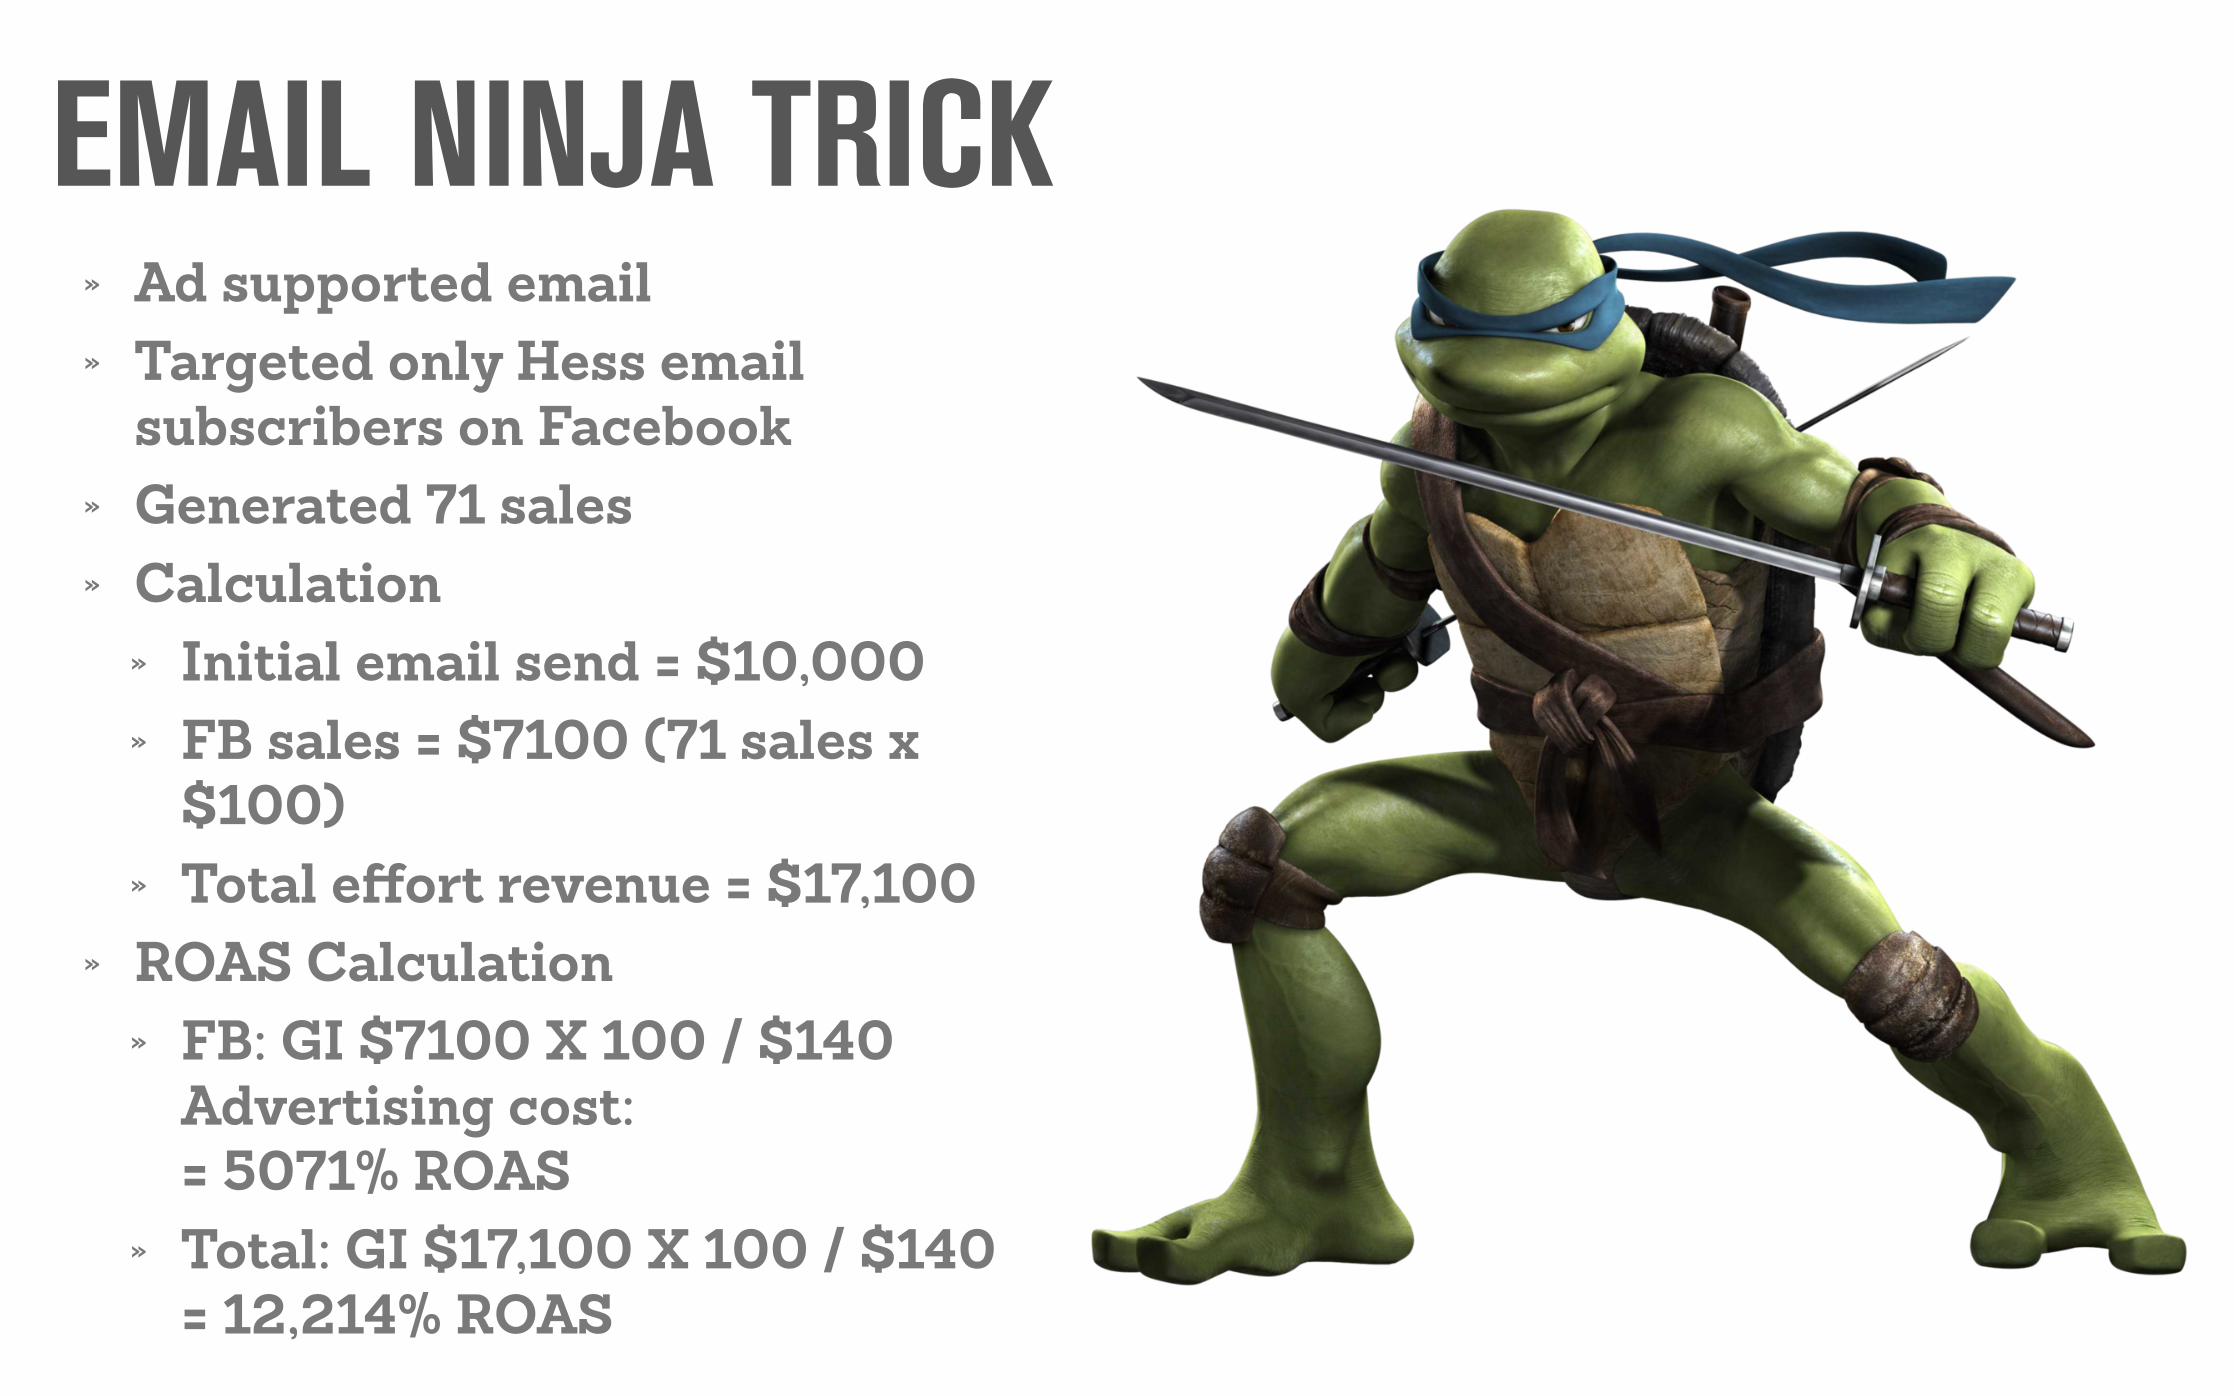
EMAIL NINJA TRICK » Ad supported email » Targeted only Hess email
subscribers on Facebook » Generated 71 sales » Calculation
» Initial email send = $10,000 » FB sales = $7100 (71 sales x
$100) » Total effort revenue = $17,100
» ROAS Calculation » FB: GI $7100 X 100 / $140
Advertising cost: = 5071% ROAS
» Total: GI $17,100 X 100 / $140 = 12,214% ROAS

REFERRALS / INFLUENCER ACTIVATION
» 3rd-party implied endorsements from influencers are super valuable.

REFERRALS » Spend: The total spend for the content. » Traffic: The total site traffic of the partner. Get this from
them (buyer beware!) or a 3rd-party service. » Readership %: The average % of people who will read the
article. Start with benchmark (15%). Test between 10-20% » Average Clickthrough Rate: The average % of people who
will click through once they’ve read the article. Start with benchmark (10%), and add your actual numbers later (get from Google Analytics referral report).
» Average Conversion Rate: Average number of people who purchase via this keyword. Start with benchmark 5%, add your actual numbers later (get from Google Analytics referral report).
» Average Transaction Revenue: Get from Google Analytics. Once you have campaign data, be sure to tailor to actual referrer (get from Google Analytics referral report).
» Average COGS: Get from CFO/bookkeeper. » Annual AGI: The average AGI of a single sale times the
average number of annual occasions (get from CFO/bookkeeper).
» Lifetime AGI: The average AGI of a single sale times the average number of annual occasions (get from CFO/bookkeeper).
STEP NAME VALUE NOTES
A Campaign The email campaign you’re sending
B Spend The total spend for the content.
C Traffic The total site traffic of the partner. Get this from them (buyer beware!) or a 3rd-party service.
D Readership % The average % of people who will read the article. Start with benchmark (15%). Test between 10-20%
E Avg. Clickthrough Rate The average % of people who will click through once they’ve read the article. Benchmark (10%),. Add actual numbers from Google Analytics referral report
F Projected Traffic C x D x E = The total number of people who should arrive at your site from this email.
G Avg. Conversion Rate Average number of people who purchase via this keyword. Benchmark 5%. Get actual numbers from Google Analytics referral report..
H Avg. Transaction Revenue Get from Google Analytics. Once you have campaign data, be sure to tailor to actual referrer (get from Google Analytics referral report).
I Projected Gross Income F x G x H = The total amount of gross income you should generate from this campaign.
J ROAS I Return On Ad Spend (gross revenue generated for every dollar spent on marketing.) in dollars. This is equal to the Projected Gross Income.
K ROAS % ( J / B ) x 100 = Return On Ad Spend in percent
L Average COGS Average cost of goods sold for an average transaction. Get from CFO/bookkeeper.
M Projected COGS F x G x L = These are all the COGS associated with the goods sold as a result of this keyword.
N Projected AGI I - M = The total transaction revenue minus the total COGS. This is your “profit” for the campaign..
O ROI N - B = Return On Investment (profit generated by the keyword relative to the cost of they keyword) in dollars.
P ROI % ( O / B ) x 100 = Return On Investment (profit generated by the keyword relative to the cost of they keyword) in percent.
Q Average Annual AGI The AGI from a single customer you expect to generate over the course of a year. L multiplied by the average number of yearly customer transactions..
R Projected Annual Value F x G x Q = The AGI of the entire campaign over a year.
S Annual ROI R - B = Return On Investment (profit generated by the keyword relative to the cost of they keyword) for the year in dollars.
T Annual ROI % ( S / B ) = Return On Investment (profit generated by the keyword relative to the cost of they keyword) for the year in percent.
U Projected Lifetime AGI The AGI you expect to generate over the lifetime of the customer. This is L multiplied by the average number of transactions a customer has with you.
V Projected Lifetime Value F x G x U = The AGI of the entire campaign over the lifetime of all customers generated by the campaign..
W Lifetime ROI V- B = Return On Investment (profit generated by the keyword relative to the cost of they keyword) for the lifetime of the customer in dollars.
X Annual ROI % ( W / B ) = Return On Investment (profit generated by the keyword relative to the cost of they keyword) for the year in percent.

KEY TAKEAWAYS Different customers have different values.
Work with your accounting team to create calculations that work for your company
Test, test, test. And then test again. Different channels are going to deliver different results
for different efforts Different customers have different values
Multi-channel efforts perform best Define measurement up front Install and analyze tracking
Relentlessly focus on marketing that will grow your business

THANK YOU! Questions? Carin [email protected](415)228-0850 ext. 796