CATTLENOMICS Derrell S. Peel Agricultural Economics Oklahoma State University.
41
CATTLENOMICS Derrell S. Peel Agricultural Economics Oklahoma State University
-
Upload
georgiana-goodwin -
Category
Documents
-
view
219 -
download
0
Transcript of CATTLENOMICS Derrell S. Peel Agricultural Economics Oklahoma State University.

CATTLENOMICS
Derrell S. Peel
Agricultural Economics
Oklahoma State University
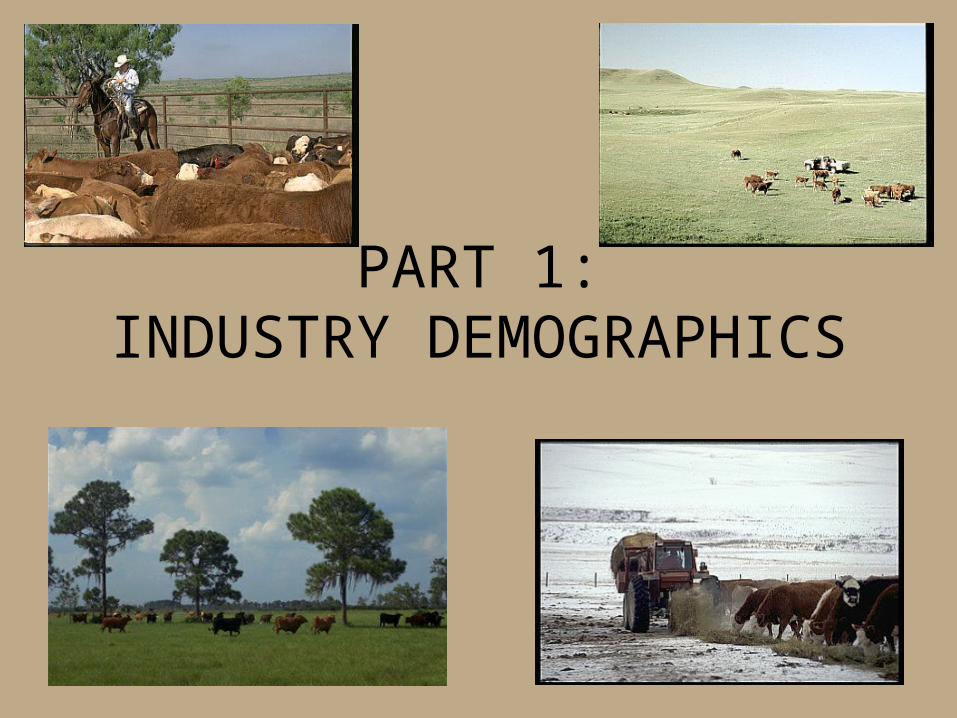
PART 1:INDUSTRY DEMOGRAPHICS
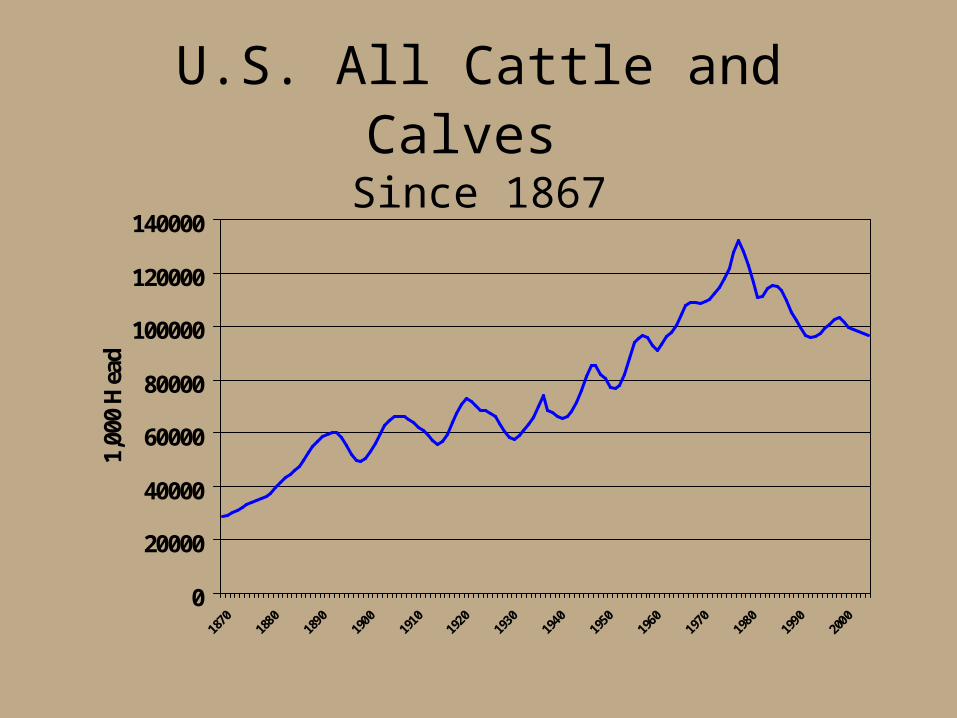
U.S. All Cattle and Calves Since 1867
0
20000
40000
60000
80000
100000
120000
140000
1870
1880
1890
1900
1910
1920
1930
1940
1950
1960
1970
1980
1990
2000
1,00
0 H
ead

TOTAL CATTLE INVENTORY BY CYCLEU.S., January 1
60
70
80
90
100
110
120
130
140
1 2 3 4 5 6 7 8 9 10 11 12 13
Mil. Head
1938-49
1949-58
1958-67
1967-79
1979-90
1990-02
C-N-4002/11/02

Oklahoma All Cattle and Calves Since 1867
0
1000
2000
3000
4000
5000
6000
7000
1000
Hea
d

January 1, 2002 (1,000 Head)All Cattle and Calves Cattle on Feed
• 1 TX 13,600
• 2 KS 6,600
• 3 NE 6,400
• 4 CA 5,200
• 5 OK 5,200
• 6 MO 4,350
• 7 SD 3,950
• 8 IA 3,550
• 9 WI 3,300
• 10 CO 3,050
• 1 TX 2,890
• 2 KS 2,530
• 3 NE 2,370
• 4 CO 1,210
• 5 IA 955
• 6 CA 480
• 7 OK 365
• 8 SD 355
• 9 ID 335
• 10 AZ 305
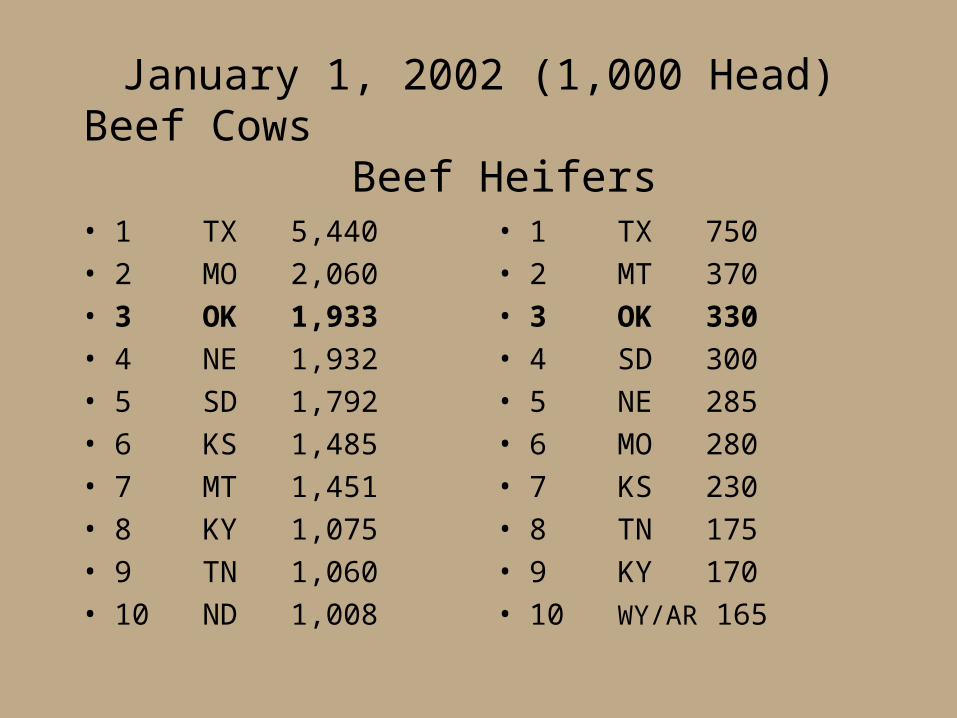
January 1, 2002 (1,000 Head)Beef Cows Beef Heifers
• 1 TX 5,440
• 2 MO 2,060
• 3 OK 1,933
• 4 NE 1,932
• 5 SD 1,792
• 6 KS 1,485
• 7 MT 1,451
• 8 KY 1,075
• 9 TN 1,060
• 10 ND 1,008
• 1 TX 750
• 2 MT 370
• 3 OK 330
• 4 SD 300
• 5 NE 285
• 6 MO 280
• 7 KS 230
• 8 TN 175
• 9 KY 170
• 10 WY/AR 165
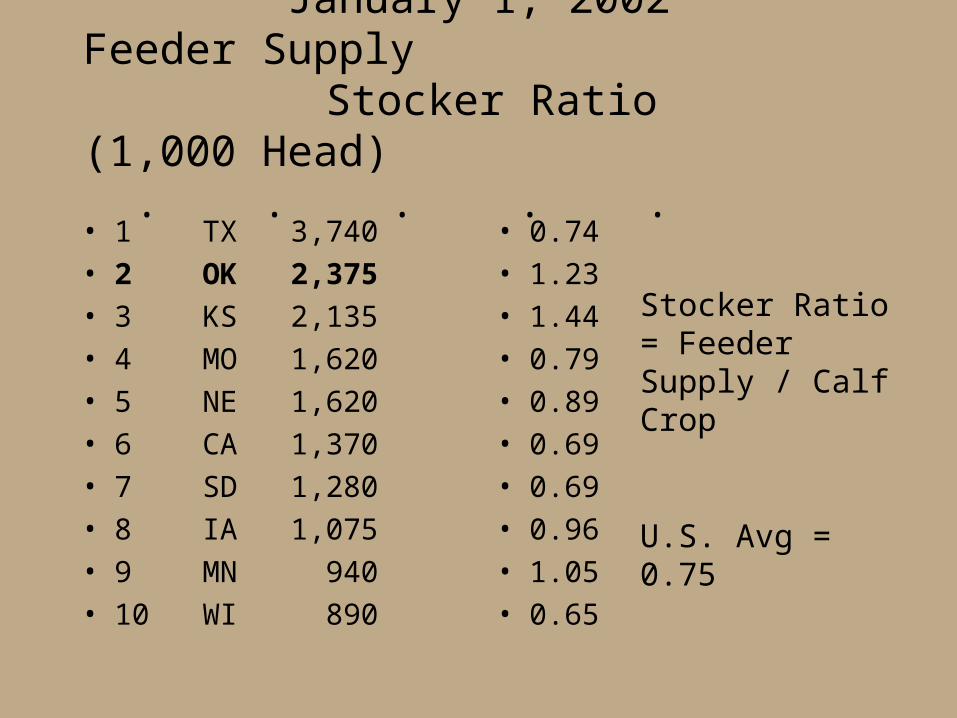
January 1, 2002Feeder Supply Stocker Ratio
(1,000 Head) . . . . .
• 1 TX 3,740
• 2 OK 2,375
• 3 KS 2,135
• 4 MO 1,620
• 5 NE 1,620
• 6 CA 1,370
• 7 SD 1,280
• 8 IA 1,075
• 9 MN 940
• 10 WI 890
• 0.74
• 1.23
• 1.44
• 0.79
• 0.89
• 0.69
• 0.69
• 0.96
• 1.05
• 0.65
Stocker Ratio = Feeder Supply / Calf Crop
U.S. Avg = 0.75

U.S. Average Stocker Ratio,January 1, 2002
0.68
0.7
0.72
0.74
0.76
0.78
0.8
0.82
0.84
1991 1992 1993 1994 1995 1996 1997 1998 1999 2000 2001 2002
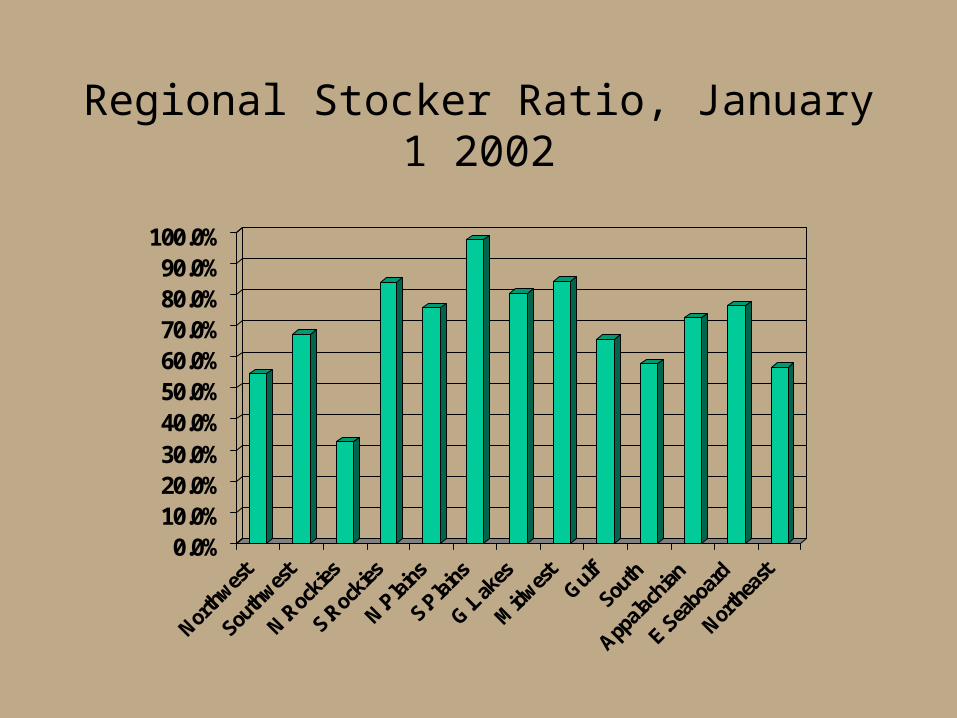
Regional Stocker Ratio, January 1 2002
0.0%10.0%20.0%30.0%40.0%50.0%60.0%70.0%80.0%90.0%
100.0%
North
west
South
west
N.Roc
kies
S.Roc
kies
N.Plai
ns
S.Plai
ns
G.Lak
es
Midw
est
Gulf
South
Appala
chian
E.Sea
boar
d
North
east
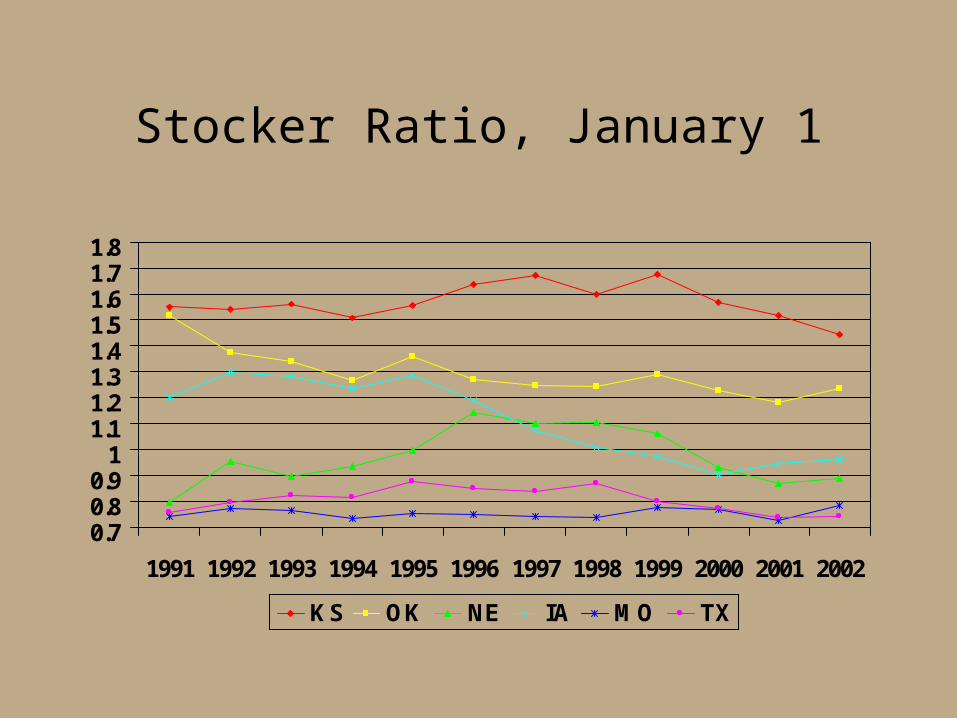
Stocker Ratio, January 1
0.70.80.9
11.11.21.31.41.51.61.71.8
1991 1992 1993 1994 1995 1996 1997 1998 1999 2000 2001 2002
KS OK NE IA MO TX
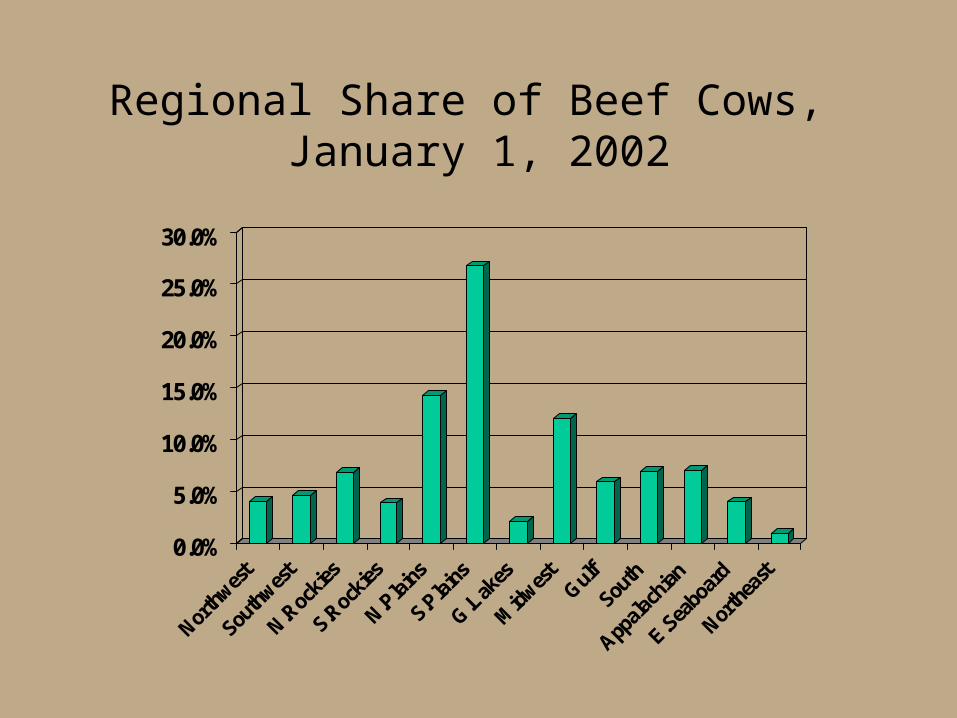
Regional Share of Beef Cows, January 1, 2002
0.0%
5.0%
10.0%
15.0%
20.0%
25.0%
30.0%
North
west
South
west
N.Roc
kies
S.Roc
kies
N.Plai
ns
S.Plai
ns
G.Lak
es
Midw
est
Gulf
South
Appala
chian
E.Sea
boar
d
North
east

Beef Heifer Retention Rate
15.0%
15.5%
16.0%
16.5%
17.0%
17.5%
18.0%
18.5%
1991 1992 1993 1994 1995 1996 1997 1998 1999 2000 2001 2002
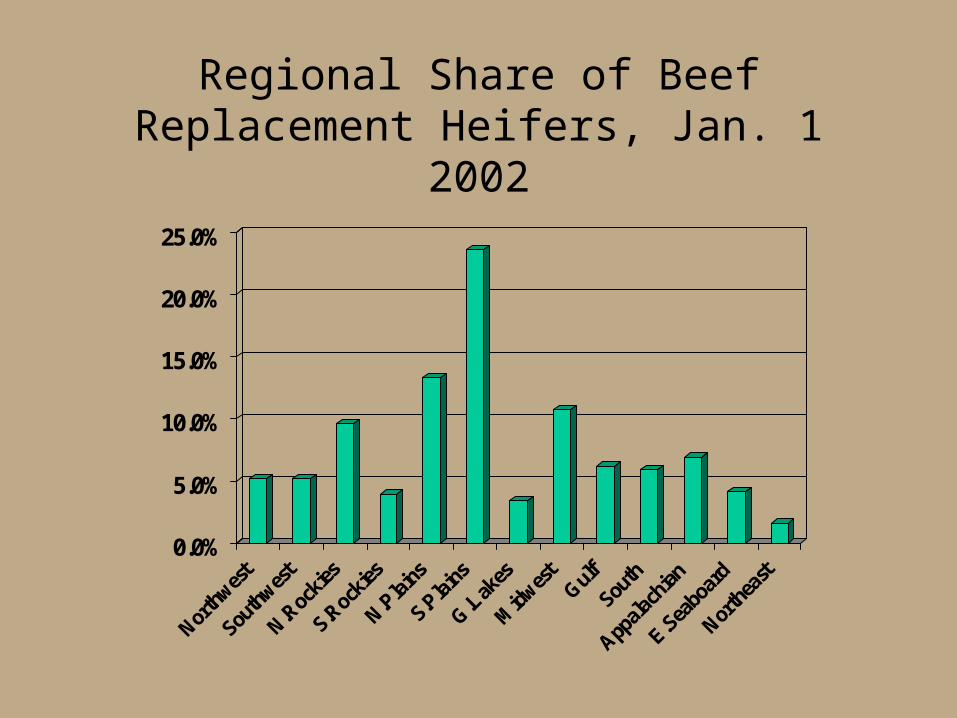
Regional Share of Beef Replacement Heifers, Jan. 1 2002
0.0%
5.0%
10.0%
15.0%
20.0%
25.0%
North
west
South
west
N.Roc
kies
S.Roc
kies
N.Plai
ns
S.Plai
ns
G.Lak
es
Midw
est
Gulf
South
Appala
chian
E.Sea
boar
d
North
east
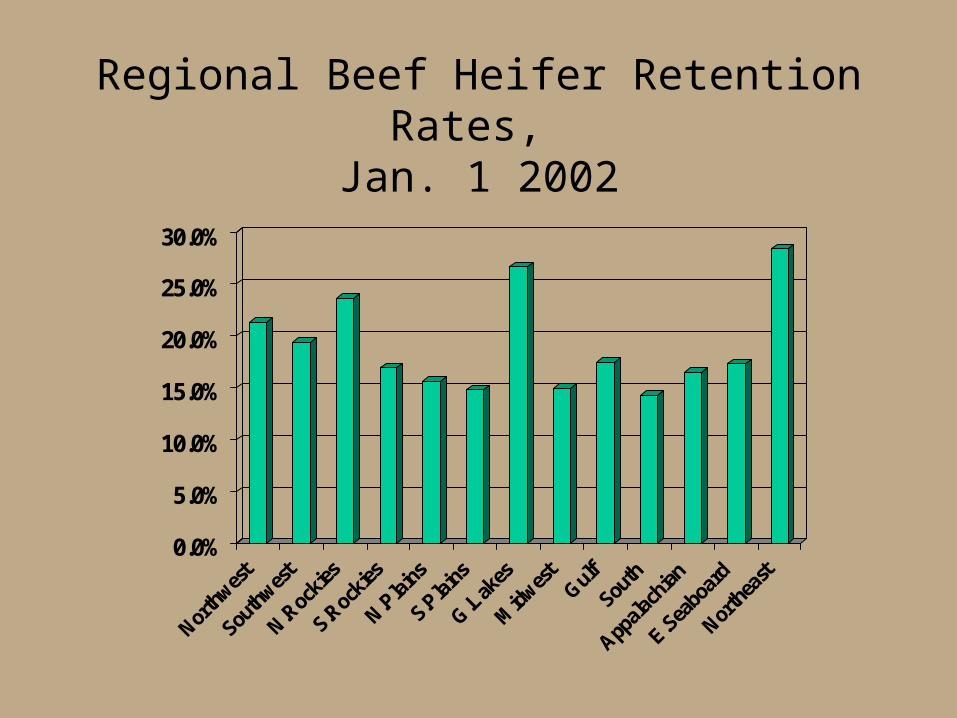
Regional Beef Heifer Retention Rates, Jan. 1 2002
0.0%
5.0%
10.0%
15.0%
20.0%
25.0%
30.0%
North
west
South
west
N.Roc
kies
S.Roc
kies
N.Plai
ns
S.Plai
ns
G.Lak
es
Midw
est
Gulf
South
Appala
chian
E.Sea
boar
d
North
east

Beef Heifer Retention Rate
12.0%
14.0%
16.0%
18.0%
20.0%
22.0%
24.0%
26.0%
1991 1992 1993 1994 1995 1996 1997 1998 1999 2000 2001 2002
U.S. N Rockies S Plains N Plains South Appa
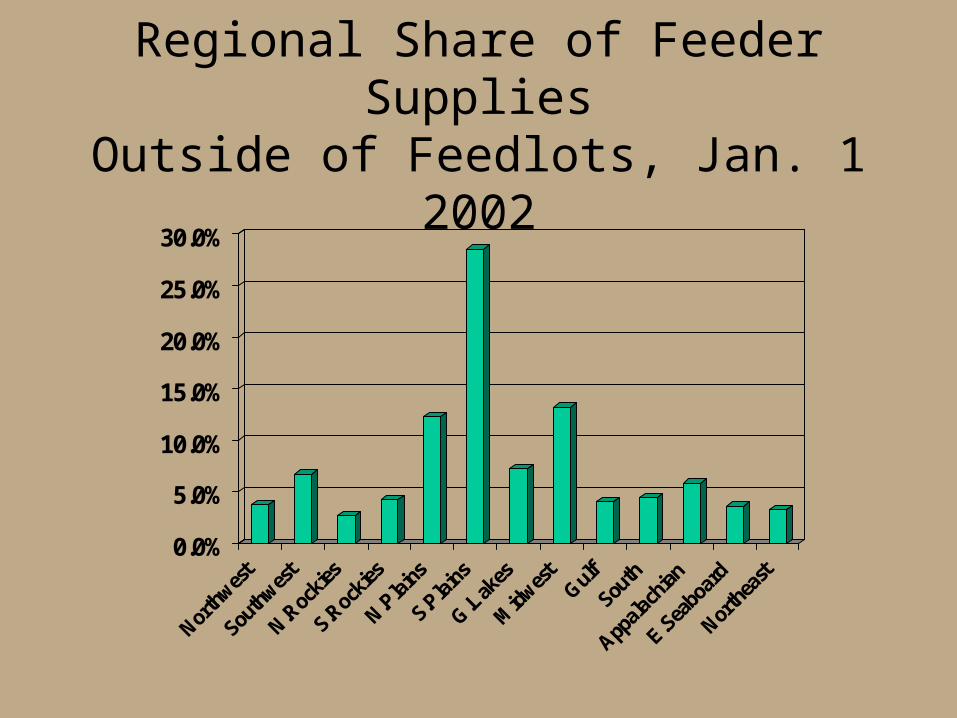
Regional Share of Feeder SuppliesOutside of Feedlots, Jan. 1 2002
0.0%
5.0%
10.0%
15.0%
20.0%
25.0%
30.0%
North
west
South
west
N.Roc
kies
S.Roc
kies
N.Plai
ns
S.Plai
ns
G.Lak
es
Midw
est
Gulf
South
Appala
chian
E.Sea
boar
d
North
east

Southern Plains Feeder Share
27.0%
27.5%
28.0%
28.5%
29.0%
29.5%
30.0%
1991 1992 1993 1994 1995 1996 1997 1998 1999 2000 2001 2002

Regional Feeder Share
10.0%
11.0%
12.0%
13.0%
14.0%
15.0%
16.0%
1991 1992 1993 1994 1995 1996 1997 1998 1999 2000 2001 2002
Midwest N Plains

PART 2:PRICE RELATIONSHIPS

Feeder and Fed Steer Prices,1992-2001
50
60
70
80
90
100
110
120
1992 1993 1994 1995 1996 1997 1998 1999 2000 2001
425 lb625 lb775 lbFed
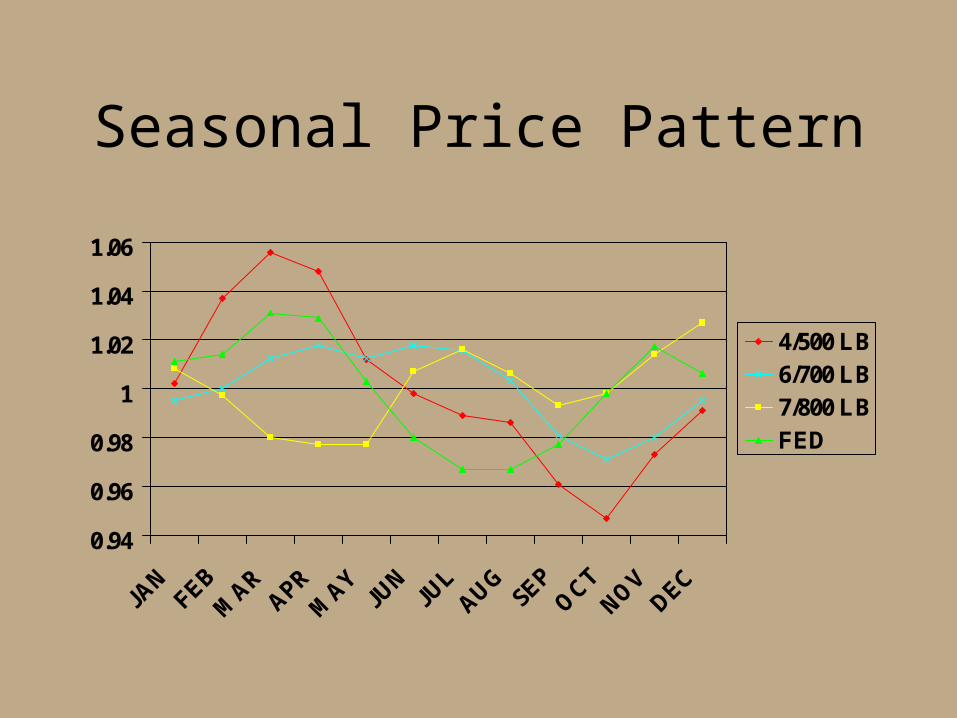
Seasonal Price Pattern
0.94
0.96
0.98
1
1.02
1.04
1.06
JAN
FEBM
ARAPR
MAY
JUN
JUL
AUGSEP
OCT
NOV
DEC
4/500 LB6/700 LB7/800 LBFED
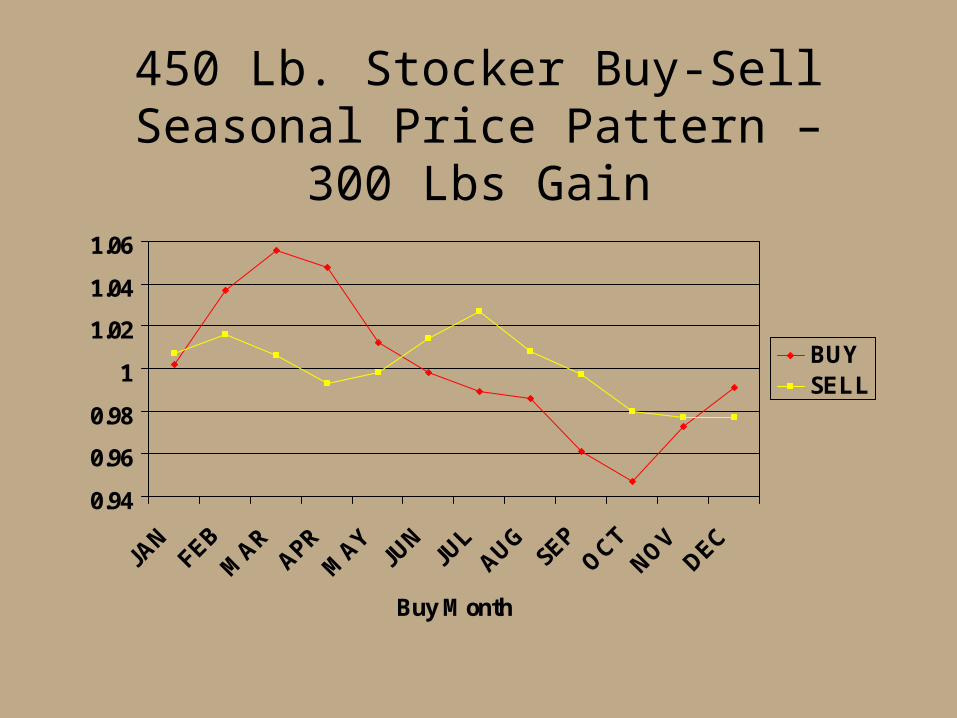
450 Lb. Stocker Buy-Sell Seasonal Price Pattern – 300 Lbs Gain
0.94
0.96
0.98
1
1.02
1.04
1.06
JAN
FEBM
ARAPR
MAY
JUN
JUL
AUGSEP
OCT
NOV
DEC
Buy Month
BUYSELL
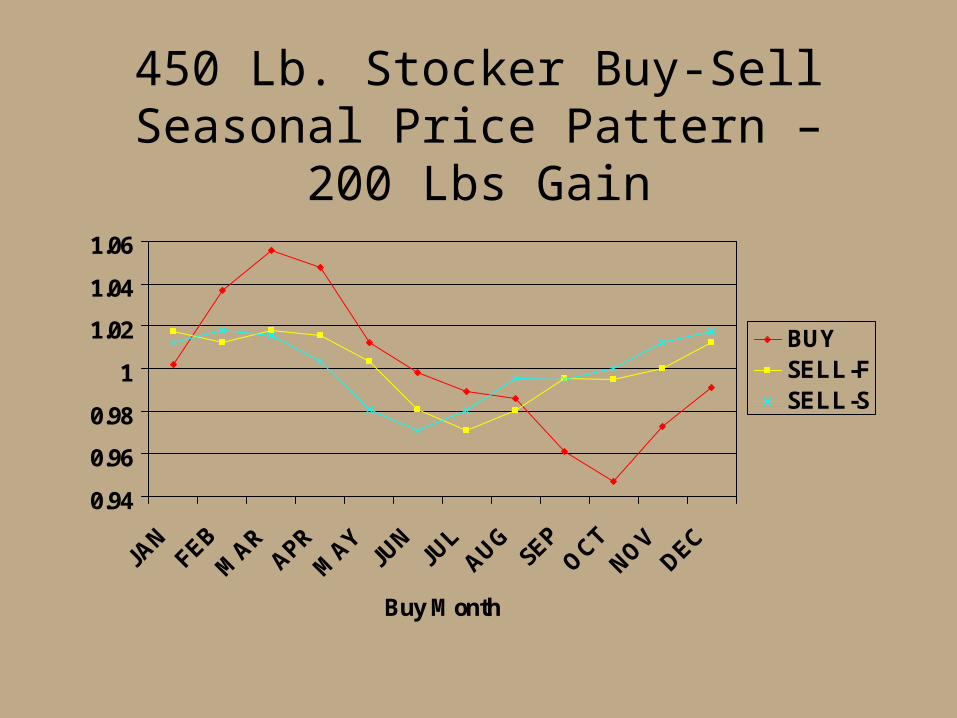
450 Lb. Stocker Buy-Sell Seasonal Price Pattern – 200 Lbs Gain
0.94
0.96
0.98
1
1.02
1.04
1.06
JAN
FEBM
ARAPR
MAY
JUN
JUL
AUGSEP
OCT
NOV
DEC
Buy Month
BUYSELL-FSELL-S
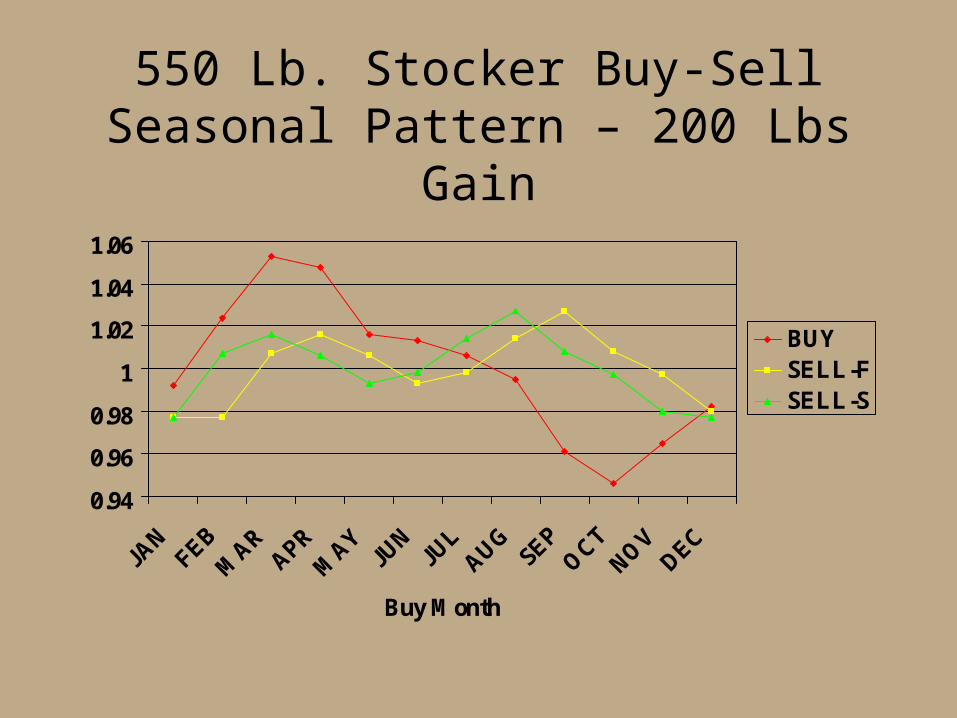
550 Lb. Stocker Buy-Sell Seasonal Pattern – 200 Lbs Gain
0.94
0.96
0.98
1
1.02
1.04
1.06
JAN
FEBM
ARAPR
MAY
JUN
JUL
AUGSEP
OCT
NOV
DEC
Buy Month
BUYSELL-FSELL-S

Feedlot Buy-Sell Seasonal Price Pattern
0.960.970.980.99
11.011.021.031.04
JAN
FEBM
ARAPR
MAY
JUN
JUL
AUGSEP
OCT
NOV
DEC
Buy Month
BUYSELL

Steer-Heifer Price Relationship

Steer-Heifer Price RelationshipOKC, 1992-2001
• (Steer – Heifer)• $/cwt by weight
– 375 15.47– 425 13.61– 475 11.79– 525 9.77– 575 8.16– 625 6.81 – 675 5.83– 725 5.39– 775 5.27
• Heifer Price as % of Steer Price– 375 84.6– 425 85.5– 475 86.5– 525 88.2– 575 88.8– 625 90.1 – 675 92.1– 725 93.6– 775 93.9

Steer-Heifer Price Relationship
0.8
0.82
0.84
0.86
0.88
0.9
0.92
0.94
0.96
375 425 475 525 575 625 675 725 775
Animal Weight
Hei
fer
Pri
ce a
s %
of
Stee
r P
rice
AVG+1 SD-1 SD

Seasonal Steer-Heifer Price Patterns
82%
84%
86%
88%
90%
92%
94%
96%
JAN
FE
B
MA
R
AP
R
MA
Y
JUN
JUL
AU
G
SEP
OC
T
NO
V
DE
C
425 LB725 LB
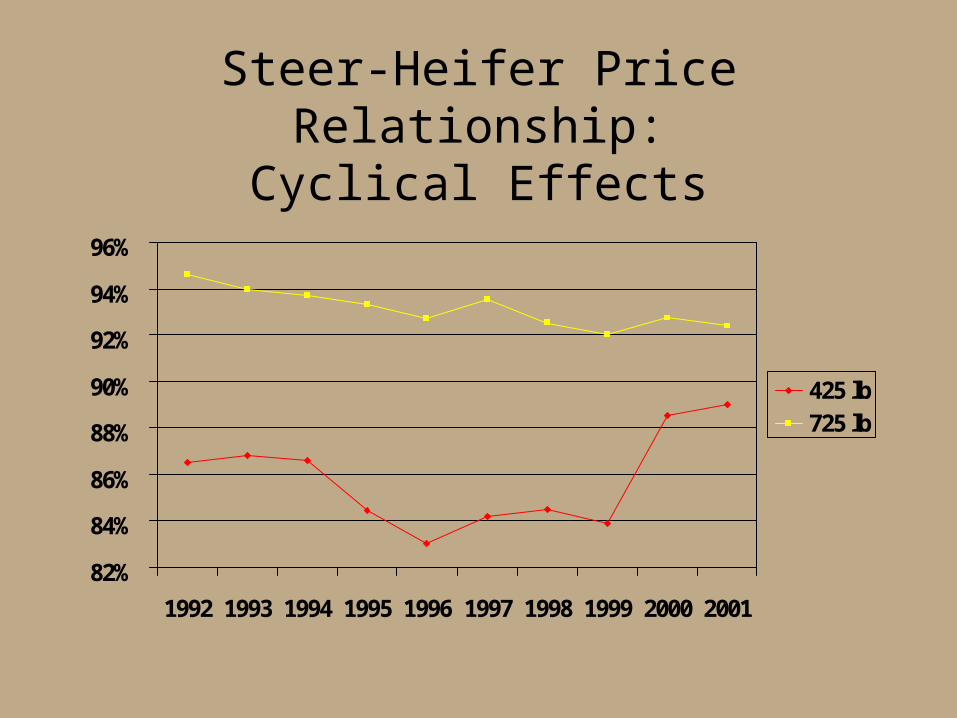
Steer-Heifer Price Relationship:Cyclical Effects
82%
84%
86%
88%
90%
92%
94%
96%
1992 1993 1994 1995 1996 1997 1998 1999 2000 2001
425 lb725 lb
Price-Weight Relationships
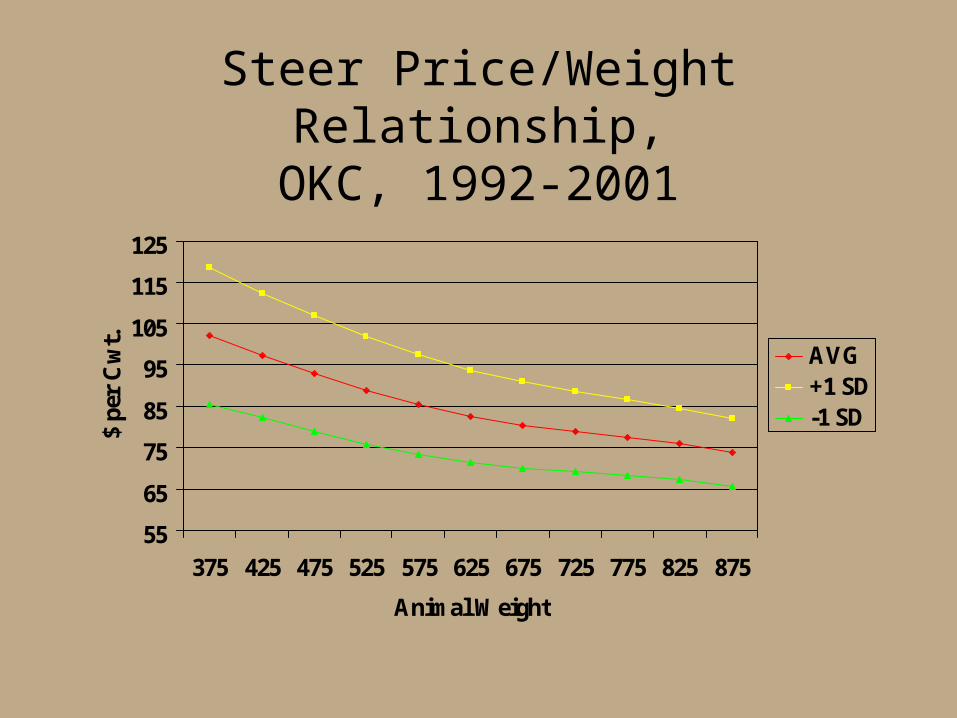
Steer Price/Weight Relationship,OKC, 1992-2001
55
65
75
85
95
105
115
125
375 425 475 525 575 625 675 725 775 825 875
Animal Weight
$ pe
r C
wt.
AVG+1 SD-1 SD

Steer Price/Weight Relationship:Cyclical Effects
55
65
75
85
95
105
115
125
375 425 475 525 575 625 675 725 775 825 875
Animal Weight
$ pe
r C
wt.
AVG+1 SD-1 SD2001199919951996

Steer Price/Weight Relationship:Seasonal Effects
55
65
75
85
95
105
115
125
375 425 475 525 575 625 675 725 775 825 875
Animal Weight
$ pe
r C
wt.
AVG+1 SD-1 SDMAROCT
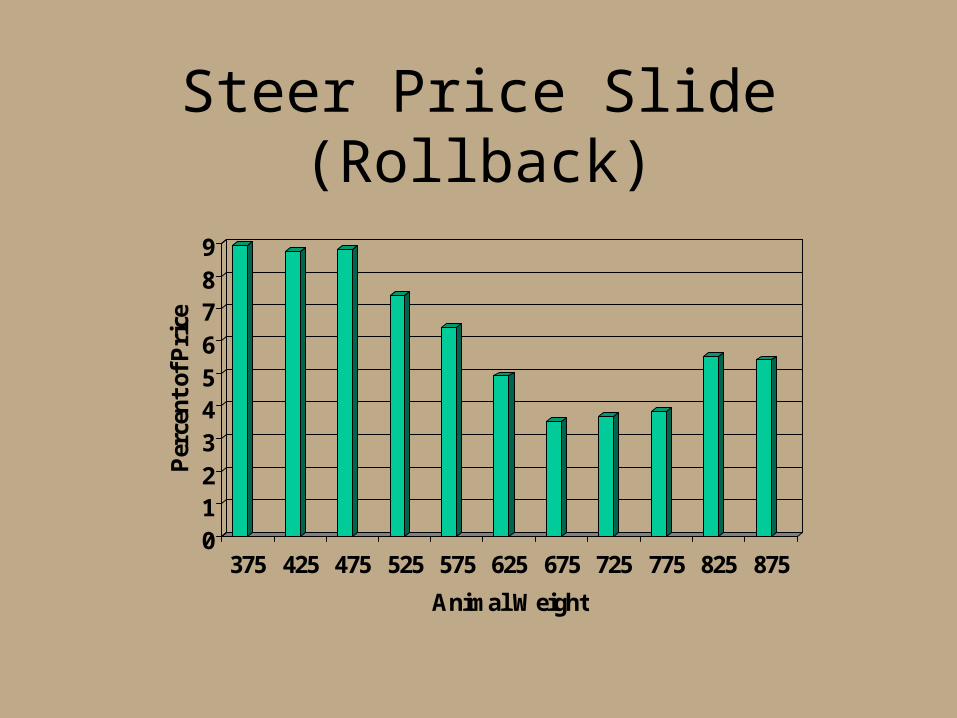
Steer Price Slide (Rollback)
0123456789
Per
cent
of P
rice
375 425 475 525 575 625 675 725 775 825 875
Animal Weight

Working Price Slide
• Price Adjustment Factor (PAF) as % of Price
– up to 500 lbs 8.8
– 500-550 lbs 7.4
– 550-600 lbs 6.4
– 600-650 lbs 4.9
– 650-800 lbs 3.7
– > 800 lbs 5.4
• (PAF/100) x Price ($/cwt) = Price Adjustment ($/cwt)
• Example:Base weight = 450 lbs
Base price = 105 $/cwt
Actual weight = 480 lbs
Price slide = (105*0.088)=9.24
Sale price: 105- (9.24*
(480-450)/100) = 102.23

Value of Gain,1992 - 2001
46485052545658606264
Cen
ts/l
b G
ain
375 425 475 525 575 625
Beginning Weight
50 lbs gain200 lbs gain
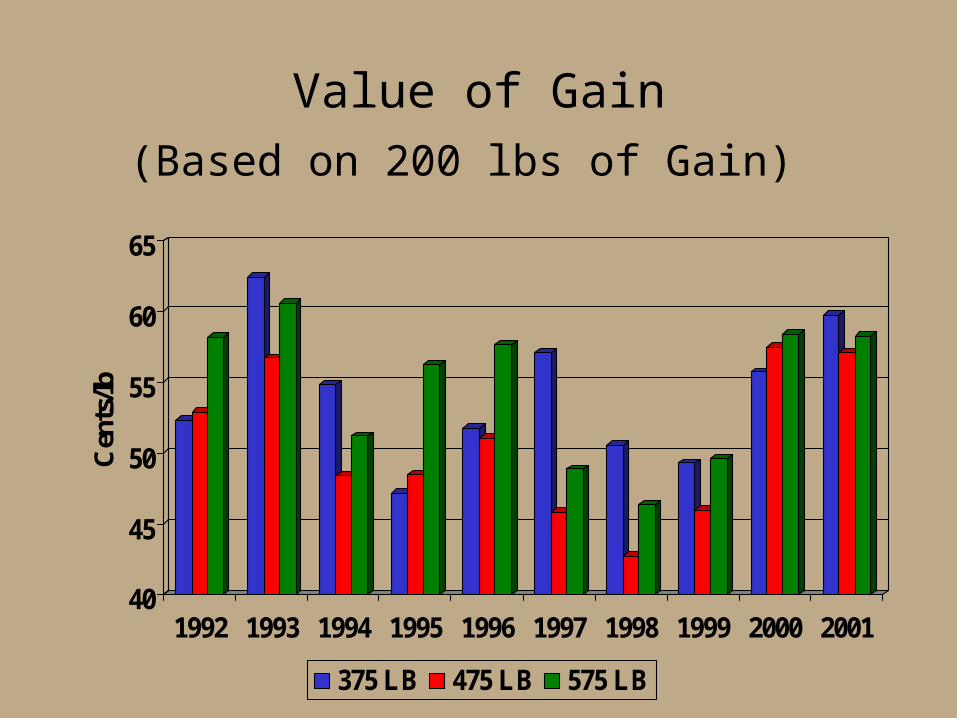
Value of Gain
(Based on 200 lbs of Gain)
40
45
50
55
60
65
Cen
ts/lb
1992 1993 1994 1995 1996 1997 1998 1999 2000 2001
375 LB 475 LB 575 LB