Casino Tax Policy - Spectrum Gaming Group
38
e By Michael Pollock Managing Director Presented to: NATIONAL TAX ASSOCIATION 103rd ANNUAL CONFERENCE ON TAXATION November 18-20, 2010 Hyatt Regency McCormick Place, Chicago Casino Tax Policy: Identifying the issues that will determine the optimal rate
Transcript of Casino Tax Policy - Spectrum Gaming Group
e
BByy MMiicchhaaeell PPoolllloocckk
MMaannaaggiinngg DDiirreeccttoorr
PPrreesseenntteedd ttoo:: NNAATTIIOONNAALL TTAAXX AASSSSOOCCIIAATTIIOONN
110033rrdd AANNNNUUAALL CCOONNFFEERREENNCCEE OONN TTAAXXAATTIIOONN
NNoovveemmbbeerr 1188--2200,, 22001100
HHyyaatttt RReeggeennccyy MMccCCoorrmmiicckk PPllaaccee,, CChhiiccaaggoo
Casino Tax Policy: Identifying the issues that will determine the optimal rate
Casino tax policy
Page 2 of 38
Contents
ABSTRACT ................................................................................................................................. 4
TAX RATES: POLITICAL CONSIDERATIONS TEND TO DRIVE PROCESS ..................................... 5
ECONOMIC CONSIDERATIONS ........................................................................................................ 10
Atlantic City case study: regression analysis ......................................................................12
Employment: critical factor ................................................................................................23
Case study: Atlantic City hub vs. East Coast spokes ............................................................25
Massachusetts case study .................................................................................................30
CONCLUSION ........................................................................................................................... 35
ABOUT THIS REPORT ............................................................................................................... 37

Casino tax policy
Page 3 of 38
Table of figures Figure 1: Capital investment in Atlantic City: 1978-2009 _______________________________________________ 7
Figure 2: Effective tax rates by state ______________________________________________________________ 8
Figure 3: Regression analysis: room nights to gaming revenue, 1978 through 2009 _________________________ 12
Figure 4: California slot units and average daily drive-in visitors from southern California to Las Vegas _________ 13
Figure 5: Visitors from California as percentage of total Las Vegas visitation ______________________________ 14
Figure 6: Annual Las Vegas visitation statistics _____________________________________________________ 14
Figure 7: Las Vegas Strip properties opened since 2000 _______________________________________________ 15
Figure 8: GGR for Las Vegas Strip, Reno-Sparks, and Laughlin NV - 2000 to 2009 ___________________________ 15
Figure 9: Hypothetical casino, basic assumptions ___________________________________________________ 16
Figure 10: Hypothetical casino: no rooms, no new competition _________________________________________ 16
Figure 11: Hypothetical casino, no rooms, new entry in market ________________________________________ 16
Figure 12: Hypothetical casino: new entry, new hotel ________________________________________________ 17
Figure 13: Multiple scenarios of rooms, GGR per night _______________________________________________ 17
Figure 14: Multiple scenarios, tax rate vs. GGR _____________________________________________________ 19
Figure 15: Multiple IRR scenarios, incremental GGR and tax rate _______________________________________ 20
Figure 16: Multiple IRR scenarios: construction cost and tax rate _______________________________________ 20
Figure 19: Casino jobs vs. gaming-revenue tax rate __________________________________________________ 24
Figure 20: Jobs per casino vs. gaming-revenue tax rate _______________________________________________ 25
Figure 21: Employment and employee compensation in Atlantic City casinos ______________________________ 26
Figure 22: Employment and Direct Payroll for New Jersey casino industry (2009)___________________________ 28
Figure 23: Estimated employment levels at regional casinos (non New Jersey) _____________________________ 28
Figure 24: Atlantic City casino industry, in-state spending on goods and services ___________________________ 29
Figure 25: Local and State Government Revenue per year in Massachusetts ______________________________ 32
Figure 26: Changes in revenue for Massachusetts per casino __________________________________________ 33

Casino tax policy
Page 4 of 38
Abstract
This paper examines the process by which state Legislatures and others determine tax
rates for casino operations. The research demonstrates that such policies, largely based on
political and related considerations, fall short of determining an optimal rate. Rather, tax
considerations should be based on a broader, more encompassing definition that would
examine and project tax revenue from all potential sources. The following report – through case
studies, interviews, regression analyses and related studies – shows that the highest rate is not
likely to be the best rate and could be counter-productive.

Casino tax policy
Page 5 of 38
Tax rates: Political considerations tend to drive process
The legalization of casino gambling is arguably one of the most critical public policy
decisions that state lawmakers will make during their tenure. Such legislation authorizes an
entirely new industry that offers a wide range of potential impacts. While lawmakers will pay
close attention to many facets of the proposed legislation – from the number of casinos to their
locations and licensing requirements – few lawmakers pay close attention to what is arguably
the most essential aspect of gaming legislation: the tax rate on gross gaming revenue.
The tax rate on gaming is the most vital public policy decision that legislators will make,
as it offers implications in a variety of areas, including:
• Level and type of capital investment
• Employment
• Tourism enhancement
• Demographic and geographic appeal of a casino
The tax rate will help determine the type of business model that casino operators will
pursue, yet it is rarely given the proper level of scrutiny. If anything, decisions related to the tax
rate are often based on political considerations. In some cases, the importance of the rate as an
engine that will guide long-term policy is simply misunderstood.
The evidence for that can be found in the overall trend dating back 30 years, in which
rates started out in the single digits and then rose consistently, reaching effective tax rates of
more than 72 percent.
This conclusion is bolstered by a variety of anecdotal evidence as well. For example,
when Maryland voters approved a referendum to legalize casinos in 2008, we met shortly
thereafter with officials from the Maryland Lottery who were beginning the process of
authorizing the casinos, based on a statute that established an effective tax rate of about 70
percent.
The officials were concerned that they were not sensing significant interest from
potential bidders for the proposed five licenses, with the likelihood of one license receiving no

Casino tax policy
Page 6 of 38
interest at all. Our comment was: “The first thing you should do is re-examine the proposed tax
rate.” After a lengthy pause, the officials responded: “What is the second thing we should do?”
Two years earlier, we held a similar conversation with a Pennsylvania legislator and
endeavored to point out that, even though there appeared to be a healthy bidding process
underway, the proposed casinos in Pennsylvania would be relatively small, based on the
proposed 55 percent tax rate.
The legislator responded with a shrug. The message was simply not getting through.
We fully appreciate the importance of political considerations in such decisions, and
note that such considerations have been a critical factor in gaming legislation for more than 30
years.
For example, New Jersey was the first state outside Nevada to legalize casinos, with
voters approving a November 1976 referendum to authorize casinos in Atlantic City. The
enabling legislation, the Casino Control Act, was approved eight months later, and the first
casino opened in May 1978. The tax rate in New Jersey was set at 8 percent, which today is the
second lowest in the nation (behind Nevada)1.
In researching this paper, we asked Steven P. Perskie – who was a member of the state
Assembly in 1976 and 1977, and is widely hailed as the architect of the Casino Control Act – to
provide the thought processes that guided the decision to set the rate at 8 percent. He
responded with the following written comment:
“In researching the drafting of the bill introduced in 1976, after the referendum passed,
we found that the highest (combined) tax on gross revenues was 7.5 percent (in Nevada). For
principally political reasons, we therefore set the initial rate for New Jersey at 8 percent. We
assumed that this would inoculate us from any argument in either direction (that the tax was
too high or too low), and indeed we never had to defend that decision. We didn't, at that time,
1 New Jersey also imposes a 1.25 percent reinvestment obligation, which offers casinos a below-market return. We
normally calculate the effective overall rate in New Jersey at 8.4 percent.

Casino tax policy
Page 7 of 38
make any effort to calculate the revenue estimates for the state, as we had no idea (and, as
experience would show, we had no idea) what we would be dealing with2.”
So, New Jersey is hailed as a low-tax haven that has helped attract significant capital
investment over the years. The following table shows the level of investment in the casino
industry, by the casino industry, in Atlantic City since casino gaming began in 1978. Please note,
this table shows actual, or nominal, amounts by year, as well as the amounts adjusted for
inflation via the Producer Price Index – to illustrate the approximate value, in today’s dollars, of
30+ years of capital investment by the casino industry.
Figure 1: Capital investment in Atlantic City: 1978-2009
Year ended Annual Amount (Nominal
$)
Cumulative Amount
(Nominal $) Annual Amount (Real $)
Cumulative Amount
(Real $)
1978 $52.6 $52.6 $106.8 $106.8
1979 $422.2 $474.8 $820.4 $927.2
1980 $386.9 $861.7 $708.8 $1,636.0
1981 $713.7 $1,575.4 $1,249.0 $2,884.9
1982 $131.2 $1,706.6 $227.0 $3,111.9
1983 $199.8 $1,906.4 $343.1 $3,455.0
1984 $602.5 $2,508.9 $1,020.0 $4,475.0
1985 $547.6 $3,056.5 $929.8 $5,404.8
1986 $182.6 $3,239.1 $315.6 $5,720.4
1987 $526.1 $3,765.2 $895.4 $6,615.7
1988 $361.6 $4,126.8 $600.6 $7,216.4
1989 $298.4 $4,425.2 $479.9 $7,696.3
1990 $1,074.6 $5,499.8 $1,683.9 $9,380.2
1991 $125.7 $5,625.5 $196.7 $9,576.9
1992 $136.4 $5,761.9 $212.5 $9,789.4
1993 $198.1 $5,960.1 $305.3 $10,094.7
1994 $246.4 $6,206.4 $375.9 $10,470.7
1995 $276.2 $6,482.6 $409.6 $10,880.3
1996 $541.3 $7,023.9 $786.5 $11,666.8
1997 $587.6 $7,611.5 $854.3 $12,521.1
1998 $269.0 $7,880.5 $399.8 $12,920.9
1999 $200.2 $8,080.7 $295.3 $13,216.2
2000 $203.1 $8,283.8 $284.9 $13,501.1
2001 $334.0 $8,617.8 $463.6 $13,964.8
2002 $462.3 $9,080.2 $656.1 $14,620.8
2003 $1,464.3 $10,544.4 $1,975.3 $16,596.1
2004 $551.0 $11,095.4 $695.9 $17,292.0
2005 $499.5 $11,595.0 $577.5 $17,869.5
2006 $792.7 $12,387.7 $858.5 $18,728.0
2007 $963.3 $13,351.0 $967.2 $19,695.2
2008 $651.3 $14,002.3 $543.2 $20,238.4
2009 $85.8 $14,088.1 $85.8 $20,324.2
1980-1989 $3,950.4 $4,425.2 $6,769.1 $7,696.3
1990-1999 $3,655.5 $8,080.7 $5,519.9 $13,216.2
2000-2009 $6,007.4 $14,088.1 $7,108.0 $20,324.2
Source: New Jersey Casino Control Commission
2 Email from Steven Perskie, sent Aug. 6, 2010

Casino tax policy
Page 8 of 38
Perskie’s comment makes clear that the 8 percent tax rate was based on political, not
economic concerns. He wanted the legislation to be “inoculated” against criticism. This
essentially means that, if New Jersey had established casinos later in the process, the rate
would have been higher.
The following chart shows that the rates in various states have drifted higher over the
years, and we suggest similar political considerations were likely at play:
Figure 2: Effective tax rates by state
Effective tax rate Year gaming was established
Nevada 6.80% 1931
New Jersey 8.40% 1978
Iowa 24.00% 1991
Colorado 20.00% 1991
Illinois 50.00% 1991
Iowa 23.20% 1991
Mississippi 12.00% 1992
Rhode Island 72.70% 1992
Louisiana 21.50% 1993
Missouri 21.00% 1994
West Virginia 56.70% 1994
Indiana 40.00% 1995
Delaware 56.90% 1995
Michigan 24.00% 1999
New Mexico 46.00% 1999
New York 65.00% 2004
Oklahoma 41.80% 2005
Maine 49.10% 2005
Florida 50.00% 2006
Pennsylvania 55.00% 2007
Kansas 25.00% 2009
Source: State gaming regulatory agencies, American Gaming Association
Notably, this trend is not universal. Kansas, as well as Massachusetts (with a proposed
tax rate of 25 percent) and Ohio (with a proposed rate of 33 percent) are coming in much lower
than other states that have joined the gaming fraternity in recent years.
Note also that the recent decision by certain slots-only states to add table games –
notably West Virginia, Delaware and Pennsylvania – was accompanied by significant reductions
Casino tax policy
Page 9 of 38
in the tax rate on tables, a move that recognizes that labor-intensive table games operate
under different profit margins and would not work under tax rates exceeding 40 percent.
Still, despite such examples, decisions regarding the tax rate are still made without a
complete understanding of the policy implications, and are still guided by political
considerations.
One further example occurred recently in Indiana, when Spectrum performed a study
for the Casino Association of Indiana as to the impending effects of increased competition from
neighboring states, particularly Ohio – where voters approved a referendum in 2009
authorizing full-service casinos in Columbus, Cleveland, Cincinnati and Toledo.
Our report recommended, among other things, that Indiana legislators consider revising
their existing tax system for riverboat casinos to encourage capital investment. The present
system, adopted in 2002, incorporates a graduated tax rate in which the first $25 million in
annual GGR is taxed at 15 percent, and the rate rises to the point where GGR over $600 million
(a point never reached in the state) would be taxed at 40 percent, a bracket that was added in
20073.
We suggested that such a system guides policy decisions by operators in everything
from marketing strategies to capital investment, and such decisions are not always in the best
interest of the state. As an alternative, we suggested that the state consider a system that
allows reductions in tax rates in certain instances as an incentive for capital investment “by
requiring that operators who seek to participate in any incentives must develop plans as to how
they intend to invest in their properties, or otherwise advance public policy in Indiana.
Regulators could be empowered to approve such plans.
“Indiana lawmakers should consider and measure the impact of any potential incentives
based on some broad parameters that could include:
• Will incentives cannibalize, protect or grow existing tax revenues?
3 Indiana Business Review, Spring 2009, “The Two-Sided Coin: Casino Gaming and Casino Tax Revenue in Indiana,”
by Jim Landers, PhD
Casino tax policy
Page 10 of 38
• Will incentives lead to additional capital investment in Indiana?
• Would such incentives increase employment, promote tourism or advance other
policy goals?
“Wherever possible and practical, the burden should be on participating casino
operators to demonstrate that incentives would create employment in their region, make them
more attractive –– and ultimately help to ensure their success in an increasingly competitive
environment4.”
The suggestion was never discussed by Indiana lawmakers, and we were quietly advised
that such a suggestion was simply politically untenable – even though Indiana would almost
inevitably face a significant competitive threat, leading to a decline in revenue, under the
present system.
This report will endeavor to make clear that decisions with respect to tax rates should
be based on complete economic considerations.
Economic Considerations
The goal in establishing an optimal gaming tax rate for any state would be to optimize
revenue from all sources. In other words, a casino that employs more people would generate
more tax revenue than one that would not. This would be true regardless of whether the state
has a personal income tax. For example, casino employees tend to live within relative close
proximity of the casino, thus their overall personal spending would tend to be concentrated in
those areas, which creates its own ripple effect by inducing further spending.
We also note that an optimal tax rate would be one that maximizes capital investment
in a property, rather than one that chokes off capital investment. Capital investment, in our
experience, is the lynchpin to generating revenue – for both the operator and the public sector.
4 “Analyzing Potential Challenges, Opportunities Facing Indiana’s Casino Industry,” October 19, 2009, p. 8

Casino tax policy
Page 11 of 38
Capital investment essentially determines the level, type and quality of amenities that
can be added. Over time, in market after market, we have seen that a casino property that adds
amenities – particularly hotel rooms - can help achieve certain results:
� It helps grow the market, and not simply cannibalize business from competitors.
� It helps other area businesses by increasing the frequency of visitation, as well as the
average length of stay. In turn, this helps generate further investment in such
businesses, either through expansions and improvements or by attracting entirely
new business development.
� It prods both competitors and other businesses to invest more capital in their
projects to ensure their attractiveness and viability.
� It can help the local economy in other ways, by helping to attract new market
segments.
� It creates new sources of revenue, including room fees – which are then used to
market the area, thus generating more overnight visitation.
� It helps make a market more attractive to visitors, and thus makes a market less
vulnerable to competition from other markets.
� It generates additional revenue for the public sector in areas ranging from property
taxes to sales taxes.
The phenomenon of effectively using hotel rooms and other non-gaming attractions has
the ability to increase operating margins and improve a market’s competitive position, which
has been proven in various regions, and among different types of properties.
One of the more vivid examples of this can be found in Atlantic City, which exhibited
growth in annual gaming revenue every year from its inception in 1978 through 2006, although
it has declined significantly in the three subsequent years and will decline further in 2010.

Casino tax policy
Page 12 of 38
Atlantic City case study: regression analysis
Atlantic City is an interesting case study in that it has also shown a significant increase in hotel
rooms during that time, going from barely 500 casino hotel rooms in1978 to more than 17,000
as of the end of 2009. We performed a regression analysis that examined the relationship
between occupied room nights and gross gaming revenue from 1978 through 2009:
Figure 3: Regression analysis: room nights to gaming revenue, 1978 through 2009
Source: New Jersey Division of Taxation, Casino Control Commission
Note the close correlation as evidenced by the R2 value of 0.9268. If we eliminate the
last three years (and their revenue declines), the R2 increases to 0.9646, an almost perfect
correlation.
This regression analysis would seem to indicate that each occupied room night in a
casino hotel generates about $920 in GGR. That number has to be interpreted carefully. It does
not mean that the occupants of each room spend that much on the casino floor.
Based on our experience, we interpret that to mean that capital investments in hotel
rooms help justify further capital investment in other amenities, from restaurants to retail to
$-
$1,000
$2,000
$3,000
$4,000
$5,000
$6,000
- 1,000 2,000 3,000 4,000 5,000 6,000
ga
min
g r
ev
en
ue
(in
mil
lio
ns)
Occupied room nights (in thousands)

Casino tax policy
Page 13 of 38
entertainment venues. Collectively, that capital investment helps attract more visitors – beyond
those who stay overnight in casino hotels – who then spend more over time.
We also offer the example of the Las Vegas casino industry, which has managed to
leverage its enormous base of capital to thrive, despite the legalization and dramatic expansion
of gaming across the border in its largest feeder market – California.
The following chart shows that, despite a 250 percent increase in the number California
slot machines over the last decade, the drive-in business from southern California to Las Vegas
has remained steady.
Figure 4: California slot units and average daily drive-in visitors from southern
California to Las Vegas
Sources: Las Vegas Convention and Visitors Authority, from average daily automobile traffic on Interstate I-15 at Nevada-California border;
Casino City’s Indian Gaming Industry Report, Spectrum estimates. * LVCVA changed methodology for counting cars
The growth in automobile traffic from southern California to Las Vegas has leveled off
but remains high. As the following chart shows, the percentage of visitors who drive in from
southern California has held steady, albeit at a lower level than it was prior to the expansion of
California casinos.
19
,13
7
25
,19
6
40
,88
3
45
,00
0 54
,47
9
60
,44
0
62
,95
4
65
,72
5
67
,67
2
68
,00
0
35,608
32,696
37,868 38,074 38,799 39,649 40,383 39,80837,686
39,199
0
5,000
10,000
15,000
20,000
25,000
30,000
35,000
40,000
45,000
0
10,000
20,000
30,000
40,000
50,000
60,000
70,000
80,000
2000 2001 2002* 2003 2004 2005 2006 2007 2008 2009N
o. c
ars
No
. Ca
lifo
rnia
slo
ts
No. slots at California casinos No. cars visiting Las Vegas from Southern California

Casino tax policy
Page 14 of 38
Figure 5: Visitors from California as percentage of total Las Vegas visitation
Source: Las Vegas Convention and Visitors Authority data, Spectrum Gaming Group estimates
Note, however, that — as the following table demonstrates — overall visitation to Las
Vegas has increased, thus demonstrating that Las Vegas is simply less dependent on California:
Figure 6: Annual Las Vegas visitation statistics
2003 2004 2005 2006 2007 2008 2009
Avg. visits in past 5 years 6.5 6.5 6.3 6.2 6.3 6.8 6.3
Avg. visits in past year 1.7 1.8 1.7 1.7 1.8 1.8 1.7
No. visitors (millions) 35.5 37.4 38.6 38.9 39.2 37.5 36.4
No. first-time visitors (millions) 3.6 3.9 4.1 4.3 7.5 6.0 6.2
Source: Las Vegas Convention and Visitors Authority
Clearly, capital investment has allowed the Las Vegas casino industry to diversify its
customer base and grow, despite the significant expansion of competition within the heart of
its largest feeder market.
The list of major Las Vegas Strip properties that opened in the last decade, and that are
expected to open, is listed in the following table.
42
% 46
%
47
%
46
%
45
%
42
%
41
%
41
%
40
%
44
%
41
%
41
%
40
%
39
%
34
%
34
%
35
%
32
%
33
%
34
%
33
%
34
%
29
% 34
%
31
%
33
%
32
%
31
%
33
%3
5%
0%
10%
20%
30%
40%
50%
19
80
19
81
19
82
19
83
19
84
19
85
19
86
19
87
19
88
19
89
19
90
19
91
19
92
19
93
19
94
19
95
19
96
19
97
19
98
19
99
20
00
20
01
20
02
20
03
20
04
20
05
20
06
20
07
20
08
20
09

Casino tax policy
Page 15 of 38
Figure 7: Las Vegas Strip properties opened since 2000
Property Opening
date
Est. capital
investment
($M)
No. Hotel
rooms
Retail
sq. feet
Convention
sq. feet
Casino
sq. feet
Aladdin 8/18/2000 $1,300 2,567 475,000 100,000 100,000
Palms 11/15/2001 $265 703 N/A 31,000 95,000
Wynn 4/28/2005 $2,700 2,716 74,000 223,000 111,000
Venetian Palazzo 12/30/2007 $1,800 3,068 400,000 450,000 105,000
Wynn Encore 12/22/2008 $2,100 2,034 40,000 50,000 72,000
MGM CityCenter Dec. 2009 $8,500 5,900 500,000 300,000 150,000
Cosmopolitan Dec. 2010 $3.900 2,995 300,000 150,000 100,000
Fontainebleau est. 2015 $2,900 3,889 180,000 275,000 95,000
Echelon Resort Suspended
Source: Spectrum Gaming Group research
The Nevada gaming market has also demonstrated what can happen in the absence of
significant capital investment.
While the number of slots in California has increased by over 255 percent (an increase
of 48,000 machines) between 2000 and 2009, GGR has grown for the casinos on the Las Vegas
Strip during the same time period. However, the casinos in the Reno-Sparks area of Nevada, as
well as in Laughlin, have declined over the last decade. We believe that this is a direct result of
substantial capital investment in new projects/products on the Las Vegas Strip, as compared to
the absence of new projects, and absence of significant capital investment, in both the Reno-
Sparks area and in Laughlin, NV.
The following table shows GGR results for each of these Nevada markets for all casinos
that generate at least $1 million GGR annually in their respective markets.
Figure 8: GGR for Las Vegas Strip, Reno-Sparks, and Laughlin NV - 2000 to 2009
($M) 2009 2000 Variance
Las Vegas Strip $5,330.2 $4,683.7 $646.5 13.8%
Reno-Sparks, NV $758.7 $997.9 ($239.2) -24.0%
Laughlin, NV $531.5 $547.0 ($15.5) -2.8%
Source: Nevada Gaming Abstract reports from Nevada Gaming Control Board
As these examples demonstrate, capital investment can help grow revenue, while it can
also be a defensive measure. To illustrate, we have developed a hypothetical model to show

Casino tax policy
Page 16 of 38
how capital investment can act as both a tool for growth and defense against new competition,
while helping generate tax revenue.
The following model, by design, focuses only on GGR and its attendant tax. However, we
should point out that such investments would also generate incremental employment and
related taxes. And, as shown in the Atlantic City regression model earlier, investment in hotel
rooms (the core element of our hypothetical model) is also likely to spur additional investment
in other amenities. In this model, we rely on the following assumptions for a casino that does
not presently have a hotel:
Figure 9: Hypothetical casino, basic assumptions
units GGR (in millions) Daily GGR per unit
Slots
1,500 $127.5 $233
Tables
45 $22.5 $1,370
Assuming an existing tax rate of 25 percent (and GGR growth at 2 percent annually), we
have developed the following seven-year projections for how this casino would operate absent
competition in its market:
Figure 10: Hypothetical casino: no rooms, no new competition
($'s in Millions) 2011 2012 2013 2014 2015 2016 2017
GGR base (w/o rooms or
new entry) $150.0 $153.0 $156.1 $159.2 $162.4 $165.6 $168.9
Cumulative GGR
$303.0 $459.1 $618.2 $780.6 $946.2 $1,115.1
Tax revenue at 25% rate $37.5 $38.3 $39.0 $39.8 $40.6 $41.4 $42.2
Cumulative tax revenue
$75.8 $114.8 $154.6 $195.2 $236.6 $278.8
Under this scenario, we project that the state would collect nearly $279 million in tax
revenue over that seven-year period. If a competitor enters the market in the third year of this
range (our model assumes a competitor would open in a neighboring state) and erodes this
hypothetical casino’s revenue by 10 percent, it would result in the following:
Figure 11: Hypothetical casino, no rooms, new entry in market
($'s in Millions) 2011 2012 2013 2014 2015 2016 2017
GGR base (with new entry
in the market) $150.0 $153.0 $140.5 $143.3 $146.1 $149.1 $152.0
Cumulative GGR
$303.0 $443.5 $586.7 $732.8 $881.9 $1,033.9
Tax revenue at 25% rate $37.5 $38.3 $35.1 $35.8 $36.5 $37.3 $38.0
Cumulative tax revenue
$75.8 $110.9 $146.7 $183.2 $220.5 $258.5
Casino tax policy
Page 17 of 38
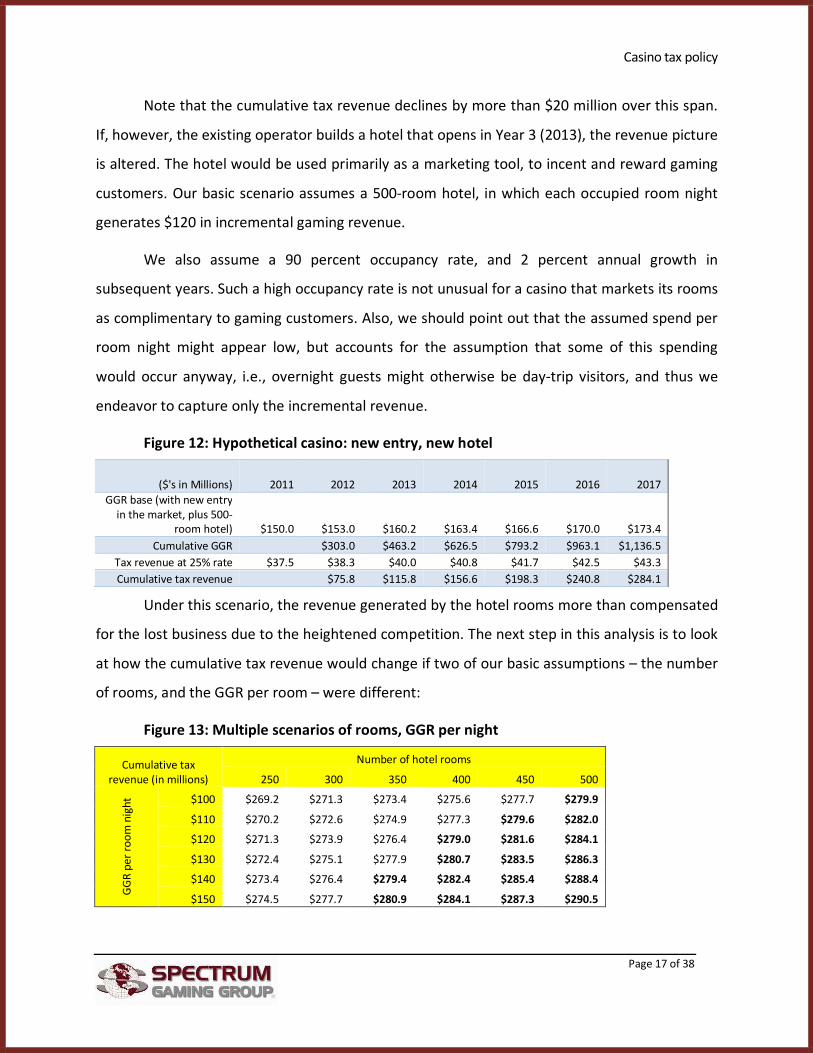
Note that the cumulative tax revenue declines by more than $20 million over this span.
If, however, the existing operator builds a hotel that opens in Year 3 (2013), the revenue picture
is altered. The hotel would be used primarily as a marketing tool, to incent and reward gaming
customers. Our basic scenario assumes a 500-room hotel, in which each occupied room night
generates $120 in incremental gaming revenue.
We also assume a 90 percent occupancy rate, and 2 percent annual growth in
subsequent years. Such a high occupancy rate is not unusual for a casino that markets its rooms
as complimentary to gaming customers. Also, we should point out that the assumed spend per
room night might appear low, but accounts for the assumption that some of this spending
would occur anyway, i.e., overnight guests might otherwise be day-trip visitors, and thus we
endeavor to capture only the incremental revenue.
Figure 12: Hypothetical casino: new entry, new hotel
($'s in Millions) 2011 2012 2013 2014 2015 2016 2017
GGR base (with new entry
in the market, plus 500-
room hotel) $150.0 $153.0 $160.2 $163.4 $166.6 $170.0 $173.4
Cumulative GGR
$303.0 $463.2 $626.5 $793.2 $963.1 $1,136.5
Tax revenue at 25% rate $37.5 $38.3 $40.0 $40.8 $41.7 $42.5 $43.3
Cumulative tax revenue
$75.8 $115.8 $156.6 $198.3 $240.8 $284.1
Under this scenario, the revenue generated by the hotel rooms more than compensated
for the lost business due to the heightened competition. The next step in this analysis is to look
at how the cumulative tax revenue would change if two of our basic assumptions – the number
of rooms, and the GGR per room – were different:
Figure 13: Multiple scenarios of rooms, GGR per night
Cumulative tax
revenue (in millions)
Number of hotel rooms
250 300 350 400 450 500
GG
R p
er
roo
m n
igh
t $100 $269.2 $271.3 $273.4 $275.6 $277.7 $279.9
$110 $270.2 $272.6 $274.9 $277.3 $279.6 $282.0
$120 $271.3 $273.9 $276.4 $279.0 $281.6 $284.1
$130 $272.4 $275.1 $277.9 $280.7 $283.5 $286.3
$140 $273.4 $276.4 $279.4 $282.4 $285.4 $288.4
$150 $274.5 $277.7 $280.9 $284.1 $287.3 $290.5
Casino tax policy
Page 18 of 38
The cells in bold represent those scenarios in which the incremental tax revenue more
than makes up for the loss due to out-of-state competition. Clearly, the more rooms and the
higher value per room night equate to a better opportunity for the state. We can assume a
higher value per room night if the host property is sufficiently desirable with a variety of
amenities that could attract more affluent gaming customers.
This begs the next question: What incentives would an operator have to build additional
amenities – or create a sufficiently attractive property in the first place – in order to protect
these tax revenues?
This is where the tax rate comes in to full focus. Operators that are considering initial or
subsequent capital investments in gaming properties will examine a variety of factors, but will
likely examine a range of potential scenarios through the prism of an economic model.
Operators would potentially use such a model to determine feasibility if the NPV – the
present value of future cash flows, discounted by an appropriate rate – is positive, or if the IRR
(the expected return when the NPV is zero) exceeds the weighted average cost of capital
(“WACC”), which we are using as an appropriate rate. Some operators may calculate this
“hurdle rate” (or discount rate5) as a minimum required rate that they impose on potential
projects, rather than a WACC, but the results would be the same.
The WACC would, regardless of market conditions, be affected by the ratio of debt to
equity financing, and would be affected by the level of risk. Because equity investors assume a
greater level of risk (bondholders are ahead of stockholders, for example, in the event of
liquidation, among other factors), equity should be considered a more expensive form of
financing.
So, the WACC would increase if a project relies more on equity financing, and would
increase if risk increases (translating into a required increase in return to compensate investors
for that enhanced risk).
5 Discount rate equates to the rate of return required to take on the risk of operating the business.
Casino tax policy
Page 19 of 38
It should be no surprise that the tax rate – which is based on top-line gaming revenue
and must be paid regardless of whether a property is profitable or not – is a critical factor in
determining the viability of projects, or the potential return on investment in such projects.
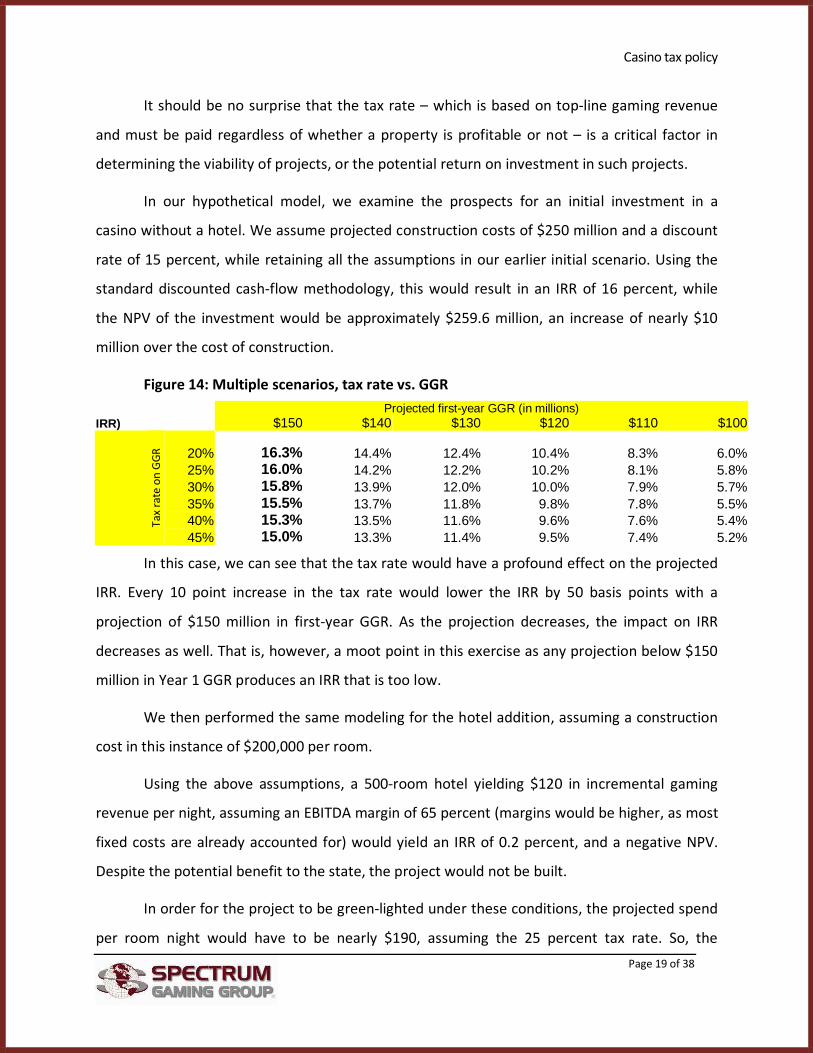
In our hypothetical model, we examine the prospects for an initial investment in a
casino without a hotel. We assume projected construction costs of $250 million and a discount
rate of 15 percent, while retaining all the assumptions in our earlier initial scenario. Using the
standard discounted cash-flow methodology, this would result in an IRR of 16 percent, while
the NPV of the investment would be approximately $259.6 million, an increase of nearly $10
million over the cost of construction.
Figure 14: Multiple scenarios, tax rate vs. GGR
IRR) Projected first-year GGR (in millions)
$150 $140 $130 $120 $110 $100
Ta
x ra
te o
n G
GR
20% 16.3% 14.4% 12.4% 10.4% 8.3% 6.0% 25% 16.0% 14.2% 12.2% 10.2% 8.1% 5.8% 30% 15.8% 13.9% 12.0% 10.0% 7.9% 5.7% 35% 15.5% 13.7% 11.8% 9.8% 7.8% 5.5% 40% 15.3% 13.5% 11.6% 9.6% 7.6% 5.4% 45% 15.0% 13.3% 11.4% 9.5% 7.4% 5.2%
In this case, we can see that the tax rate would have a profound effect on the projected
IRR. Every 10 point increase in the tax rate would lower the IRR by 50 basis points with a
projection of $150 million in first-year GGR. As the projection decreases, the impact on IRR
decreases as well. That is, however, a moot point in this exercise as any projection below $150
million in Year 1 GGR produces an IRR that is too low.
We then performed the same modeling for the hotel addition, assuming a construction
cost in this instance of $200,000 per room.
Using the above assumptions, a 500-room hotel yielding $120 in incremental gaming
revenue per night, assuming an EBITDA margin of 65 percent (margins would be higher, as most
fixed costs are already accounted for) would yield an IRR of 0.2 percent, and a negative NPV.
Despite the potential benefit to the state, the project would not be built.
In order for the project to be green-lighted under these conditions, the projected spend
per room night would have to be nearly $190, assuming the 25 percent tax rate. So, the

Casino tax policy
Page 20 of 38
property’s ability to remain whole, based on the new construction, faces a significantly higher
hurdle.
If, however, the new addition was able to meet this standard, the cumulative benefit to
the state would be $295 million, making the state better off than it would have been absent the
in-state competition.
Of course, a higher projection of GGR per room would be more difficult to achieve.
In the following table, we have isolated two of the key assumptions in this model - the
tax rate and the projected GGR per room night – to see the effect on the potential IRR:
Figure 15: Multiple IRR scenarios, incremental GGR and tax rate
IRR Projected incremental GGR per occupied room night
$ 120 $ 145 $ 170 $ 195 $ 220 $ 245
Ta
x ra
te o
n G
GR
25% 3.8% 8.2% 12.2% 15.8% 19.1% 22.3% 24% 4.1% 8.5% 12.5% 16.1% 19.5% 22.7% 23% 4.4% 8.8% 12.8% 16.5% 19.9% 23.1% 22% 4.7% 9.2% 13.2% 16.8% 20.3% 23.5% 21% 5.0% 9.5% 13.5% 17.2% 20.6% 23.9% 20% 5.3% 9.8% 13.8% 17.5% 21.0% 24.3%
Here, we see that the tax rate is an important factor, in which a 5 percent drop in the
tax rate adds between 1.5 percent and 2 percent to the IRR. There is more sensitivity, however,
to the spend per room night. In this model, the project is not feasible at any tax rate for a spend
of $170 per room night, while the project is feasible at each of these rates once the spend is
estimated to be $195.
We also examined the sensitivity of the IRR to the projected construction cost per room
night, based on differing tax rates:
Figure 16: Multiple IRR scenarios: construction cost and tax rate
IRR Projected construction cost per room (in thousands)
$ 240 $ 230 $ 220 $ 210 $ 200 $ 190
Ta
x ra
te o
n G
GR
25% 10.3% 11.4% 12.5% 13.7% 15.0% 16.4% 24% 10.6% 11.7% 12.8% 14.1% 15.4% 16.8% 23% 11.0% 12.0% 13.2% 14.4% 15.7% 17.1% 22% 11.3% 12.4% 13.5% 14.7% 16.1% 17.5% 21% 11.6% 12.7% 13.8% 15.1% 16.4% 17.8% 20% 11.9% 13.0% 14.2% 15.4% 16.8% 18.2%

Casino tax policy
Page 21 of 38
Every $10,000 decrease in the cost per room adds between 1.1 percent and 1.4 percent
to the IRR.
Many factors could impact the potential IRR of a project, from the potential EBITDA to
the projected construction cost and the cost of capital, but this exercise clearly demonstrates
that tax rates – while they are often determined by a purely political calculus – play a material,
meaningful role in decisions by managers as to how best to deploy available capital.
Just as important, tax rates are a key determinant in establishing what type of business
model a casino operator will adopt.
In effect, the gaming industry has long been evolving into two basic types of casinos:
destination resorts (which we term hub properties) and convenience-based local casinos (which
we term spoke properties).
A hub property is characterized by a greater array of amenities and a wider geographic
appeal. A spoke property has less capital investment, and is characterized by being dependent
on its nearby market, usually within 50 miles or a one-hour drive. Spoke properties tend to be
granted some level of geographic protection by their host states, while hubs are more likely to
be developed in markets with other hub properties, creating a level of critical mass.
Hubs, by necessity, require lower tax rates to justify this greater capital investment.
Spokes, by contrast, are often characterized by significantly higher tax rates.
To be sure, some markets defy such neat descriptions, and might be best characterized
as hybrid hubs or hybrid spokes. Connecticut, which has a duopoly of two tribal casinos, might
be characterized as a hybrid hub, since no other competitors can enter that state. Dover Downs
in Delaware might be considered a hybrid spoke, since it offers a hotel and other amenities, yet
enjoys the geographic protection of a spoke, while it is still burdened by relatively high tax
rates.
The question that policymakers must ask themselves is: Do we want to authorize hubs
or spokes?

Casino tax policy
Page 22 of 38
On one hand, spokes tend to be attractive options because they warrant higher tax
rates, but also because many spokes tend to be the sites of existing or former race tracks
(which are termed “racinos,” once they offer both pari-mutuel wagering and gaming).
The related question is: Which model is more likely to advance public policy? We
suggest that destination resorts (“hubs”) will meet that critical goal on a variety of fronts:
• Destinations generate greater capital investment, which translates into more
construction jobs.
• Because they deploy a much greater level of capital, destinations are better
positioned to attract third-party retailers, restaurateurs and other attractions that
can be leveraged to create a more enjoyable visitor experience.
• Destinations operate under a different business model that is designed to attract a
wider variety of adults, reaching more affluent adults and targeting a much broader
geographic area.
• Destinations are more likely to withstand competition from other states.
• Perhaps most important, destinations will employ far more individuals.
From the standpoint of the public sector – which relies on the tax revenue generated by
casinos – the difference between hubs and spokes should be considered on at least two levels:
• How much tax revenue would be generated from all sources, direct and indirect?
• Which will generate the most gaming revenue?
In our experience, few state officials consider either of these questions, and even more
rarely do any consider both. Yet, we note that both must be considered.
On a basic level, it makes intuitive sense that – all else being equal – a more attractive
property with more amenities will outperform a similarly situated property that lacks such
attractions. More adults will visit, while the frequency of visitation and the length of stay would
also increase.

Casino tax policy
Page 23 of 38
However, we note that few states consider revenue generation from multiple sources,
including the benefits to the public sector from greater employment opportunities. The next
section of this report illustrates the relationship between tax rates and employment.
Employment: critical factor
The employment factor – and the taxes and increased economic activity generated by
employees – should be paramount when policymakers are considering tax rates. By definition, a
well-capitalized property with multiple amenities will employ more people than a smaller,
convenience-based property with fewer amenities.
Intuitively, the relationship between capital investment and employment is clear and
comprehensible. Hotel rooms, restaurants and retail space create demands for a variety of
service jobs. Less clear but no less significant, however, is the relationship between tax rates
and capital investment, which in turn creates a clear nexus between tax rates and employment
–– as evidenced in these charts.
Capital investment is also essential in delineating the differences between hubs and
spokes. Gaming customers cannot reasonably be expected to bypass a relatively convenient
spoke property to visit a more distant, less convenient spoke property in the absence of some
catalyst. Depending on various factors, such as the nature of the trip, the amount of available
time and the demographics of the customer, many adults would be expected to bypass a
relatively convenient spoke property for a more attractive resort destination. As noted earlier,
that has proven to be the case in core hub markets, most notably Las Vegas.
Casino tax policy
Page 24 of 38
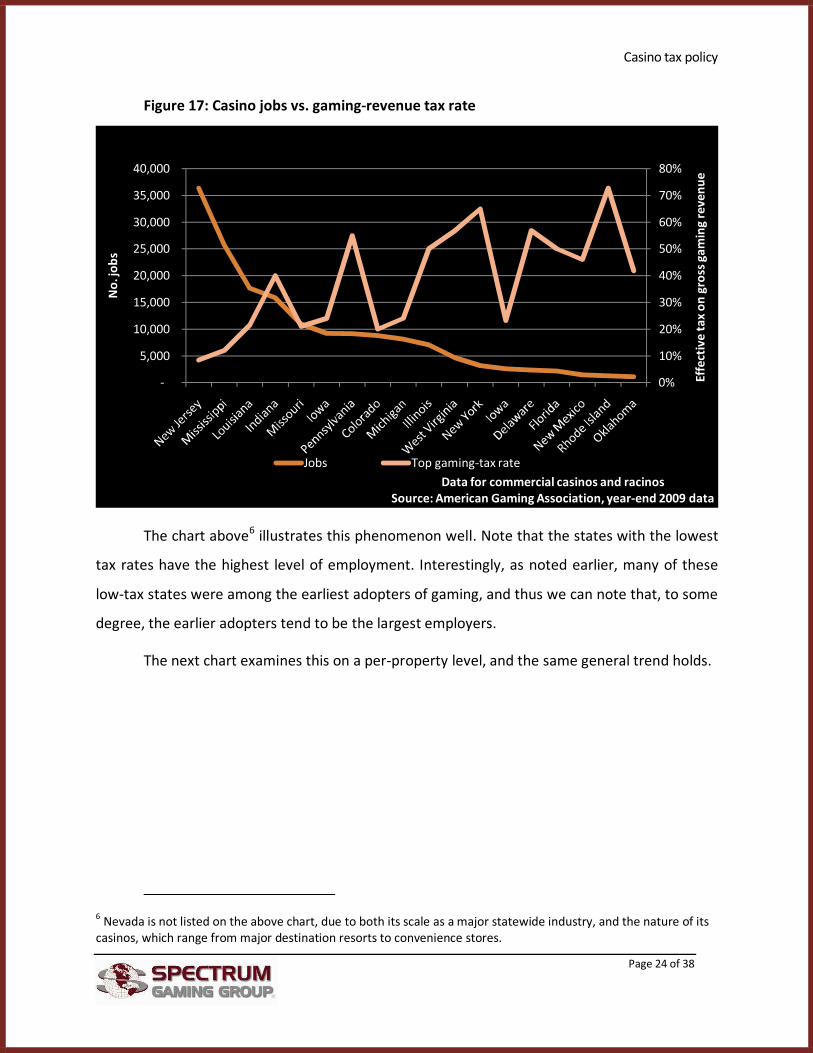
Figure 17: Casino jobs vs. gaming-revenue tax rate
The chart above6 illustrates this phenomenon well. Note that the states with the lowest
tax rates have the highest level of employment. Interestingly, as noted earlier, many of these
low-tax states were among the earliest adopters of gaming, and thus we can note that, to some
degree, the earlier adopters tend to be the largest employers.
The next chart examines this on a per-property level, and the same general trend holds.
6 Nevada is not listed on the above chart, due to both its scale as a major statewide industry, and the nature of its
casinos, which range from major destination resorts to convenience stores.
0%
10%
20%
30%
40%
50%
60%
70%
80%
-
5,000
10,000
15,000
20,000
25,000
30,000
35,000
40,000
Eff
ect
ive
ta
x o
n g
ross
ga
min
g r
ev
en
ue
No
. jo
bs
Data for commercial casinos and racinos
Source: American Gaming Association, year-end 2009 data
Jobs Top gaming-tax rate

Casino tax policy
Page 25 of 38
Figure 18: Jobs per casino vs. gaming-revenue tax rate
Case study: Atlantic City hub vs. East Coast spokes
The casino industries in New Jersey and other states in the region offer a clear view of
the contrasts between tax rates, and between hubs and spokes. As noted earlier, Atlantic City
casinos pay an 8 percent tax on gross gaming revenue, plus an additional 1.25 percent
reinvestment obligation. As noted earlier, because they receive a below-market return on that
reinvestment, our models assume a tax rate of 8.4 percent, while the top rate in Pennsylvania is
55 percent, and ranges even higher in Delaware and New York.
One area where this marked difference in tax rates is highly pronounced is in
employment. A report issued earlier this year by the Rutgers University Center for Urban Policy
Research indicates that direct and indirect employment related to Atlantic City casinos is
responsible for more than 101,000 jobs in 2008, with a collective payroll of more than $4.2
0%
10%
20%
30%
40%
50%
60%
70%
80%
-
500
1,000
1,500
2,000
2,500
3,000
3,500
Ne
w J
ers
ey
Mic
hig
an
Ind
ian
a
We
st V
irg
inia
Pe
nn
sylv
an
ia
De
law
are
Rh
od
e Is
lan
d
Eff
ect
ive
ta
x o
n g
ross
ga
min
g r
ev
en
ue
Av
era
ge
No
. jo
bs
pe
r ca
sin
o
Data for commercial casinos and racinos
Source: American Gaming Association, year-end 2009 data
Average No. jobs per casino Top gaming-tax rate

Casino tax policy
Page 26 of 38
billion.7 If we apply this same ratio (39,799 direct jobs to a total impact of 101,000 overall jobs)
to 2009, we can reasonably infer that the Atlantic City casino industry ultimately generated
more than 95,000 jobs, despite the effects of the economic recession and the difficult times
facing the industry.
Figure 19: Employment and employee compensation in Atlantic City casinos
($M, except Avg.)
2006-08
Avg. 2008 2007 2006
Total Employees 39,779
41,211 42,994
% of Total
Compensation and %
of Total
Compensation and %
of Total
Compensation and %
of Total
Salaries & Wages 54.4% $957.0 53.8% $975.0 54.7% $981.8 54.6%
Gratuities (estimated) 14.0% $247.5 13.9% $251.6 14.1% $253.3 14.1%
NJ Employer Unemployment Tax 1.1% $19.7 1.1% $19.4 1.1% $18.7 1.0%
NJ Employer Disability Insurance 0.3% $4.8 0.3% $5.2 0.3% $5.2 0.3%
NJ Personal State Income Tax
Withheld 1.8% $33.1 1.9% $31.5 1.8% $31.3 1.7%
Employer FICA/Medicare 5.6% $96.5 5.4% $100.5 5.6% $101.9 5.7%
Employer Federal Unemployment
Tax 0.1% $2.3 0.1% $2.4 0.1% $2.7 0.2%
Benefit Package 22.7% $416.4 23.4% $396.0 22.2% $402.3 22.4%
Total Compensation 100.0% $1,777.2 100.0% $1,781.6 100.0% $1,797.0 100.0%
Avg. per Employee $44,676 $43,232 $41,797
Source: Center for Urban Policy Research, Edward J. Bloustein School of Planning and Public Policy, Rutgers University; Casino
Association of New Jersey
If we apply the 2006-08 average, as indicated in the above table, to 2009 direct wages
paid by the Atlantic City casino industry – which reported a payroll of $948.9 million – this
translates into more than $1.7 billion in total compensation provided to direct employees. This,
in turn, would imply gratuities of $245.0 million, various employment related taxes of $154.7
million, and benefits valued at $395.6 million for direct employees of the New Jersey casino
industry in 2009.
The US Bureau of Economic Analysis publishes multiplier data that estimates total
change in employment in all industries (from specific changes to one industry). For the
amusement, gambling, and recreation industry in New Jersey, the multiplier figure is 1.44.8
Furthermore, the US Bureau of Economic Analysis estimates total dollar change in earnings paid
7 “The Contribution of the Casino Hotel Industry to New Jersey’s Economy,” May 2010, Rutgers Project Team,
Center for Urban Policy Research, Edward J. Bloustein School of Planning and Public Policy, Rutgers University.
8 US Bureau of Economic Analysis, Regional Input-Output Modeling System (RIMS II), 2006

Casino tax policy
Page 27 of 38
to households for all industries for earning changes in the subject industry; for the amusement,
gambling, and recreation industry in New Jersey, the multiplier figure is 1.90.9
With that in mind, we project that total employment (direct and indirect) generated by
the Atlantic City casino industry was 54,150 in 2009, while wages and other related
compensation, such as gratuities, taxes, and benefits, (direct and indirect) exceeded $3.3
billion.
The nature of employment in the casino industry varies from market to market,
depending in large measure on factors ranging from:
• Tax rates
• Type of gaming offered (slots, tables, poker, simulcasting, other)
• Variety and type of amenities
• Number of hotel rooms
• Level of capital investment
Those differences are illustrated in the following two figures, by comparing Atlantic City
casinos to the regional casinos within a three-hour drive of Atlantic City.
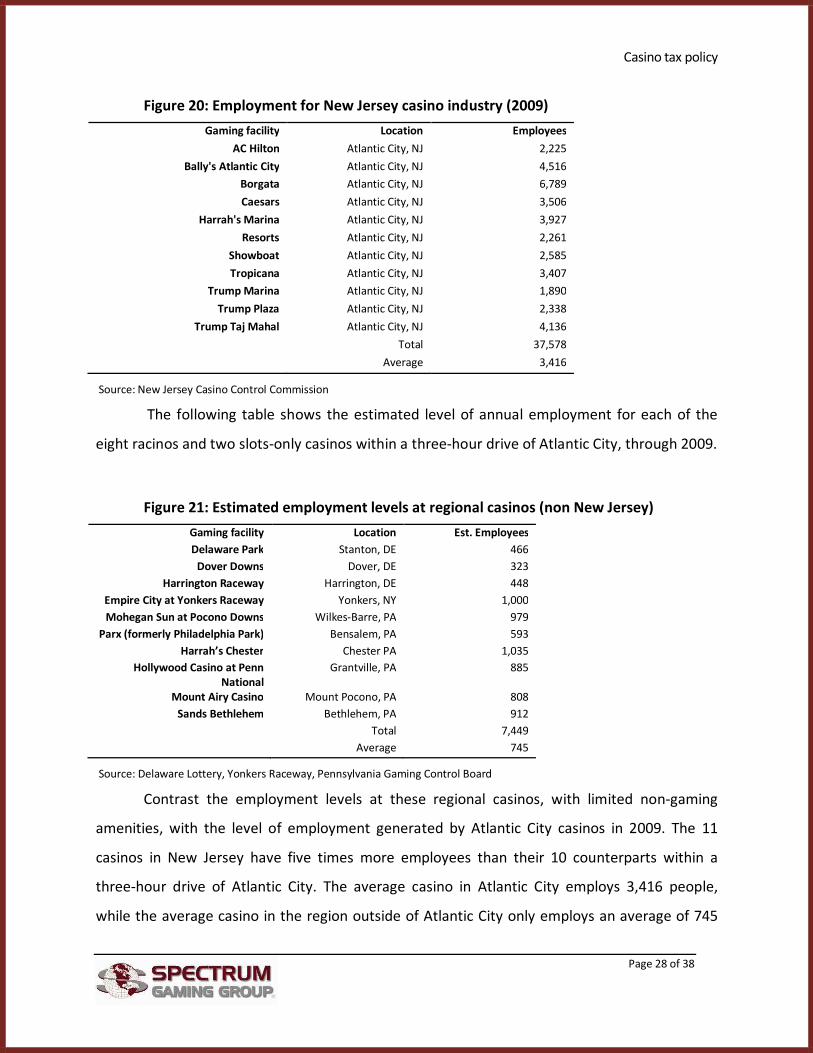
The following figure shows employment by casino for each casino within the New Jersey
casino industry for year ended 2009, along with a total and average per casino figure.
9 US Bureau of Economic Analysis, Regional Input-Output Modeling System (RIMS II), 2006
Casino tax policy
Page 28 of 38
Figure 20: Employment for New Jersey casino industry (2009)
Gaming facility Location Employees
AC Hilton Atlantic City, NJ 2,225
Bally's Atlantic City Atlantic City, NJ 4,516
Borgata Atlantic City, NJ 6,789
Caesars Atlantic City, NJ 3,506
Harrah's Marina Atlantic City, NJ 3,927
Resorts Atlantic City, NJ 2,261
Showboat Atlantic City, NJ 2,585
Tropicana Atlantic City, NJ 3,407
Trump Marina Atlantic City, NJ 1,890
Trump Plaza Atlantic City, NJ 2,338
Trump Taj Mahal Atlantic City, NJ 4,136
Total 37,578
Average 3,416
Source: New Jersey Casino Control Commission
The following table shows the estimated level of annual employment for each of the
eight racinos and two slots-only casinos within a three-hour drive of Atlantic City, through 2009.
Figure 21: Estimated employment levels at regional casinos (non New Jersey)
Gaming facility Location Est. Employees
Delaware Park Stanton, DE 466
Dover Downs Dover, DE 323
Harrington Raceway Harrington, DE 448
Empire City at Yonkers Raceway Yonkers, NY 1,000
Mohegan Sun at Pocono Downs Wilkes-Barre, PA 979
Parx (formerly Philadelphia Park) Bensalem, PA 593
Harrah’s Chester Chester PA 1,035
Hollywood Casino at Penn
National
Grantville, PA 885
Mount Airy Casino Mount Pocono, PA 808
Sands Bethlehem Bethlehem, PA 912
Total 7,449
Average 745
Source: Delaware Lottery, Yonkers Raceway, Pennsylvania Gaming Control Board
Contrast the employment levels at these regional casinos, with limited non-gaming
amenities, with the level of employment generated by Atlantic City casinos in 2009. The 11
casinos in New Jersey have five times more employees than their 10 counterparts within a
three-hour drive of Atlantic City. The average casino in Atlantic City employs 3,416 people,
while the average casino in the region outside of Atlantic City only employs an average of 745
Casino tax policy
Page 29 of 38
people – meaning the average casino in Atlantic City employs 2,671 more people than the
average regional casino.
We note that the above reported levels of employment for these other casinos were
before they added table games in Delaware and Pennsylvania. It must be noted, however, that
Delaware and Pennsylvania – as well as West Virginia – lowered their tax rates for table games,
a move that effectively bolsters our core contention that higher employment levels demand
more reasonable tax structures. Because table games are more labor intensive, they cannot
operate profitably under gaming revenue tax rates in excess of 40 percent.
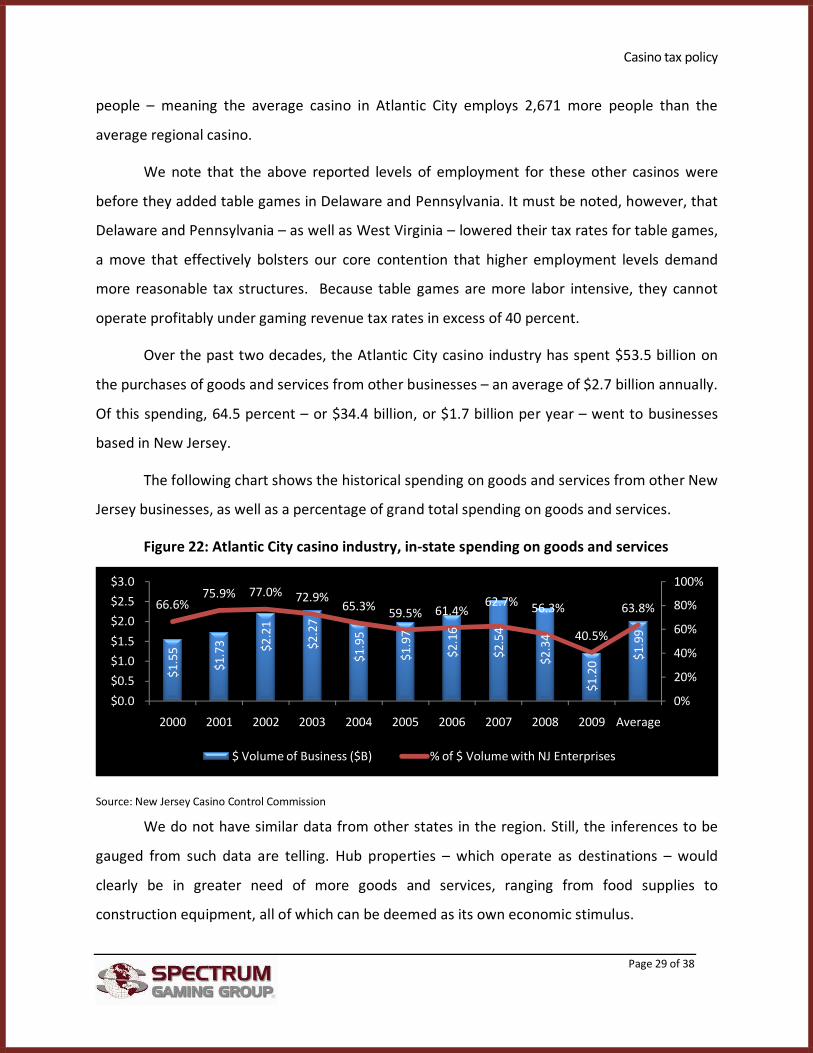
Over the past two decades, the Atlantic City casino industry has spent $53.5 billion on
the purchases of goods and services from other businesses – an average of $2.7 billion annually.
Of this spending, 64.5 percent – or $34.4 billion, or $1.7 billion per year – went to businesses
based in New Jersey.
The following chart shows the historical spending on goods and services from other New
Jersey businesses, as well as a percentage of grand total spending on goods and services.
Figure 22: Atlantic City casino industry, in-state spending on goods and services
Source: New Jersey Casino Control Commission
We do not have similar data from other states in the region. Still, the inferences to be
gauged from such data are telling. Hub properties – which operate as destinations – would
clearly be in greater need of more goods and services, ranging from food supplies to
construction equipment, all of which can be deemed as its own economic stimulus.
$1
.55
$1
.73
$2
.21
$2
.27
$1
.95
$1
.97
$2
.16
$2
.54
$2
.34
$1
.20
$1
.99
66.6%75.9% 77.0% 72.9%
65.3%59.5% 61.4%
62.7%56.3%
40.5%
63.8%
0%
20%
40%
60%
80%
100%
$0.0
$0.5
$1.0
$1.5
$2.0
$2.5
$3.0
2000 2001 2002 2003 2004 2005 2006 2007 2008 2009 Average
$ Volume of Business ($B) % of $ Volume with NJ Enterprises

Casino tax policy
Page 30 of 38
Massachusetts case study
Spectrum Gaming Group was engaged in early 2008, by the Commonwealth of
Massachusetts – namely the Executive Office of Housing and Economic Development, the
Department of Business & Technology, the Office of Business Development and the
Massachusetts Office of Travel and Tourism – to provide “comprehensive and comprehensible
analysis that includes a variety of questions that interested parties may have in connection with
the Governor’s proposed resort casinos initiative.”
We then performed a detailed study that, among other things, analyzed and projected
the economic and fiscal impacts of having up to three casino destinations in Massachusetts,
each in a different region. Some of our research and findings are detailed here, which largely
reflects much of the original language in our 2008 report. Each casino, according to the
proposed legislation, would be situated in one of three regions:
• Region 1 - Suffolk, Middlesex and Essex counties
• Region 2 - Norfolk, Bristol, Plymouth, Nantucket, Dukes and Barnstable counties
• Region 3 - Worcester, Hampshire, Hampden, Franklin and Berkshire counties
The proposed legislation that we studied at the time assumed a tax rate of 27 percent
on gross gaming revenue, and a license fee of $200 million.
This analysis included the use of modeling software developed by Regional Economic
Models Inc., which is based in Amherst, Mass. The REMI model is robust, and uses a variety of
variables based on economic, demographic, industry and other data to develop outputs.
We developed a number of assumptions in using this model. For example, our scenarios
assume that 50 percent of the employment base at casinos would not compete with jobs at
those of existing industries, as there are no casinos now in Massachusetts. This makes sense
intuitively, as many of the casino jobs have counterparts at existing industries, ranging from
housekeeping to accounting, while many are clearly unique to this industry. At the same time,
we cross-checked this assumption with those of other economic models, such as RIMS II, an

Casino tax policy
Page 31 of 38
input/output model that was developed by the Bureau of Economic Analysis in the U.S.
Department of Commerce.
The REMI model generated an employment multiplier of about 1.5, depending on the
scenario, which means that every job created in the casino industry generates 0.5 indirect and
induced jobs in other industries. Such jobs would be the result of new employment from
suppliers to the gaming industry, as well as jobs created by the new spending power of
employees. This is clearly in line with a range of RIMS II models that we have used and analyzed
in urban, suburban and rural markets throughout the United States.
Other input assumptions were:
• The licensing fee is assumed to be $200 million, to be renewed every 10 years,
resulting in an amortized $20 million annual cost.
• The hotel tax rate is 5.7 percent for the state, while in such areas as Boston,
Worcester, Cambridge and Springfield hotels are charged an additional 2.75 percent
to pay off convention center bonds. Boston has an additional 4 percent add-on to
hotel rooms. The sales tax rate is 5 percent, with exemptions for food and clothing.
For personal income tax, we assume the effective rate is 4.7 percent, which is lower
than the state rate but projects some anticipated level of deduction. The income tax
in the model is based on total personal income generated.
• The property tax rate used in Region 1 (limited to Suffolk County in this model) is
$25.92 per $1,000 of assessed value. For the other regions, this ratio was averaged
based on differing tax rates, which amounted to $12.36 in Region 2 and $18.48 in
Region 3.
• We assumed the assessed value of each casino is $800 million, which we
conservatively suggest would be a reasonable net increase in the value of existing
property, i.e., not all of the capital investment would be an increase to the assessed
valuation of an existing property.
• Staffing for each property is 4,377 positions.

Casino tax policy
Page 32 of 38
• The property tax credit is based on an assumed $500 million in gaming revenue per
property, assuming 2.5 percent for public health mitigation and an additional 2.5
percent for other mitigation funding. This leaves 22 percent (27 percent minus these
allocations) which would be split 50-50 between property tax relief and
transportation funding.
• For purposes of our analysis, we assume that none of the government’s share of
revenue will be used to mitigate any negative impact to the Massachusetts Lottery,
as explained in more detail elsewhere in the report.
For each of three properties, we assumed a 90 percent occupancy rate for the hotel,
and $92.50 in cash revenue per occupied room night. This is a reasonable set of assumptions
for a casino hotel, which would likely operate under a business model that offers
complimentary or reduced–rate rooms to gaming customers to generate occupancy and
gaming revenue year-round. We will adjust this assumption in some subsequent scenarios.
While the occupancy rate may seem high and the cash revenue per occupied room night
might seem low, we are basing this on a casino hotel model, rather than a hotel model. This
means that occupancy rates can be inflated by using hotel rooms as marketing tools to reward
gaming customers and encourage incremental casino revenue. Such a policy, based on
complimentary or reduced-rate room nights, has the concomitant effect of lowering cash
revenue per room night. With those assumptions in mind, our first scenario resulted in the
following fiscal impacts:
Figure 23: Local and State Government Revenue per year in Massachusetts
Tax / Fee Massachusetts Region 1 Region 2 Region 3 Total Local & State Licensing fee $60,000,000 $ - $ - $ - $60,000,000 Operational Fee $405,000,000 $ - $ - $ - $405,000,000 Hotel tax (Direct) $15,405,000 $2,430,769 $2,430,769 $2,430,769 $22,697,308 Income tax (Direct) $16,930,879 $ - $ - $ - $16,930,879 Income tax (Indirect and Induced) $22,361,121
$22,361,121 Sales tax (Direct) $31,269,231 $ - $ - $ - $31,269,231 Property Tax (Direct) $20,736,000 $9,888,000 $14,784,000 $45,408,000 TOTAL (Direct) $528,605,110 $23,166,769 $0 $17,214,769 $581,305,418 TOTAL (Direct, Indirect and Induced)) $550,966,231 $603,666,539

Casino tax policy
Page 33 of 38
This scenario would generate a direct total of $581.3 million for government at all levels
in Massachusetts, plus an additional $22.3 million from income taxes generated by the indirect
and induced employment. Those totals do not reflect projected net increases to government
budgets, as it also includes an estimated $165 million in property tax relief that would be
distributed to Massachusetts residents, an obligation suggested in the proposed legislation. The
total net benefit to the public sector and taxpayers equates to about 40 percent of all projected
gaming revenue.
That is an important point that must be underscored in this analysis: Any analysis of the
economic benefits of gaming must take into consideration tax revenue from all sources, not just
the gaming tax.
We then performed a sensitivity analysis to determine the relationship between
government funding and the success of each casino. The following table shows the difference in
the amount of revenue (net of property tax relief payments) that would be generated for the
Commonwealth from each casino, based on changes in two important factors:
• The level of annual gaming revenue per casino.
• The ratio of casino revenue to overall net revenue.
Figure 24: Changes in revenue for Massachusetts per casino
Gam
ing
reve
nue
as
pct
. of
tota
l net
rev
enu
e
Annual gaming revenue per destination casino
$ 500,000,000 $ 475,000,000 $ 450,000,000 $ 425,000,000 $ 400,000,000 $ 375,000,000
65% $121,242,299 $116,464,395 $111,686,491 $106,908,587 $102,130,683 $97,352,779
60% $122,538,805 $117,696,076 $112,853,347 $108,010,618 $103,167,888 $98,325,159
55% $124,071,040 $119,151,699 $114,232,358 $109,313,017 $104,393,676 $99,474,335
50% $125,909,722 $120,898,447 $115,887,172 $110,875,897 $105,864,622 $100,853,347
45% $128,156,999 $123,033,361 $117,909,722 $112,786,083 $107,662,444 $102,538,805
The table shows that each $25 million decline in gaming revenue results in a decline of
about $4.8 million in annual revenue for state government. This is less than $6.75 million, which
would be the direct decline in tax revenue based on 27 percent of gross gaming revenue. This
softened impact can be attributed to the assumption that a decline in gaming revenue would
not lead to a significant decline in employment levels or hotel occupancy, both of which are
sources of tax revenue for the Commonwealth.

Casino tax policy
Page 34 of 38
Note also, however, that state revenue increases markedly, albeit at a lesser rate, as
gaming declines as a percentage of overall net revenue. As that percentage declines, it means
more overall revenue (the same gaming dollars equate to a relatively lower percentage of a
greater revenue base), so the state’s share increases as more dollars are spent in restaurants,
hotel rooms and other areas.
Casino tax policy
Page 35 of 38
Conclusion
The Massachusetts case study offers a vivid illustration as to how an effective tax policy
that is designed to encourage capital investment can better serve the public interest than a tax
policy that is simply focused on the highest rate.
Certain conclusions from the Massachusetts model need to be underscored. One is that
the public sector has a clear, abiding interest in promoting non-gaming revenue. The other is
that the projected tax revenue from all sources is an estimated 40 percent in this scenario,
even though the tax rate on gaming revenue is only 27 percent.
That second point is even more dramatic when you consider that a smaller facility at a
higher tax rate would likely attract fewer adults visiting less frequently, so the gaming revenue
itself would be smaller. Such subtle yet crucial points are often ignored or lost in public debates
regarding tax rates.
The final question that this report will address is: What is the ideal tax rate? Indeed, that
is a central question that offers no easy answer. One inference from this study may be that the
lowest tax rate – similar to Nevada or New Jersey – is the best tax rate, and single digit rates
should always be in effect. That would be a misguided conclusion, and one that we suggest is
not supportable in most instances.
Each situation requires its own careful analysis, and the factors that may be used to
guide tax policy are varied. Such factors may include:
• The demographics of the market
• The presence of an existing tourism infrastructure
• The potential to develop or increase convention and meeting business
• Other public policies, such as a desire to limit hours of operation, the sale of
alcoholic beverages or the offering of credit

Casino tax policy
Page 36 of 38
The latter points are certainly important, as they would play a role in investment
decisions that operators would make. The easiest answer to the question of what is an optimal
tax policy is that states must examine these and all other relevant factors, and then view
gaming from the standpoint of an investor or operator.
What is the tax rate that would maintain or advance all relevant public policies and still
attract a sufficient amount of capital investment? That would be the ideal rate.
Casino tax policy
Page 37 of 38
About This Report
This report was prepared by Spectrum Gaming Group, an independent research and
professional services firm founded in 1993 that serves private- and public-sector clients
worldwide. Our principals have backgrounds in operations, economic analysis, law
enforcement, regulation and journalism.
Spectrum holds no beneficial interest in any casino operating companies or gaming
equipment manufacturers or suppliers. We employ only senior-level executives and associates
who have earned reputations for honesty, integrity and the highest standards of professional
conduct. Our work is never influenced by the interests of past or potentially future clients.
Each Spectrum project is customized to our client’s specific requirements and developed
from the ground up. Our findings, conclusions and recommendations are based solely on our
research, analysis and experience. Our mandate is not to tell clients what they want to hear; we
tell them what they need to know. We will not accept, and have never accepted, engagements
that seek a preferred result.
Recent private-sector clients include Harrah’s Entertainment, Wynn Resorts, Morgan
Stanley, the Pokagon Band of Potawatomi Indians, and the Seneca Nation of Indians. Recent
public-sector clients include the Massachusetts Office of Housing and Economic Development,
the Connecticut Division of Special Revenue, Broward County (FL), the West Virginia Lottery
Commission, the New Jersey Casino Reinvestment Development Authority, the Atlantic City
Convention and Visitors Authority, the Singapore Ministry of Home Affairs, Rostov Oblast
(Russia) and the Puerto Rico Tourism Company.
We maintain a network of leading experts in all disciplines relating to the gaming
industry, and we do this through our offices in Atlantic City, Bangkok, Guangzhou, Harrisburg,
Hong Kong, Las Vegas, Macau, Manila and Tokyo.
Michael Pollock, principal author, is a managing director of Spectrum who oversees a
broad portfolio of Spectrum services, including policy and impact studies for country, state and
local governments, and feasibility and market studies for private-sector clients.
Pollock began analyzing the casino industry in 1978 and served as spokesman for the
New Jersey Casino Control Commission from 1991 through 1996. He was a close advisor to the
chairman, and oversaw the Office of Legislative Liaison. During this period of rapid
deregulation, his charge was to maintain public confidence in the integrity of the regulatory
system.

Casino tax policy
Page 38 of 38
Pollock is the author of the award-winning book, Hostage to Fortune: Atlantic City and
Casino Gambling, published by the Center for Analysis of Public Issues in Princeton. This book
examines the impact of casinos on Atlantic City and New Jersey. He has testified before the
International Tribunal at the Hague and the U.S. Senate Select Committee on Indian Gaming,
and has been a featured speaker at the Congressional Gaming Caucus, a group of U.S. House of
Representatives members from gaming jurisdictions. He has also testified before several
legislative committees in the United States.
Pollock has won 20 journalism awards, and is the former editorial page editor of The
Press of Atlantic City. Pollock is often cited by national media outlets, including The New York
Times, Star-Ledger, BBC, ABC News and National Public Radio.
He earned his MBA, with high honors, from Rutgers University, and has served as a
member of the adjunct faculty of both Rutgers University and Richard Stockton College of New
Jersey.
Key contributors to this report were Spectrum professionals Shawn McCloud and Bill
LaPenta, both of whom have extensive experience in financial analysis.