Cashless and Cashy: the Yin-Yang of Digital Delivery
34
Cashless and Cashy: the Yin-Yang of Digital Delivery Evidence from Agent Networks in Peru Xavier Faz and Pablo Garcia Arabehety September 30 th , 2014.
-
Upload
cgap -
Category
Economy & Finance
-
view
588 -
download
0
Transcript of Cashless and Cashy: the Yin-Yang of Digital Delivery
Cashless and Cashy:
the Yin-Yang of Digital DeliveryEvidence from Agent Networks in Peru
Xavier Faz and Pablo Garcia Arabehety
September 30th, 2014.

Cashless and Cashy: the Yin-Yang of Digital Delivery
Evidence from agent networks in Peru
Content
• Key messages from Peru
• Three defining market trends:
1. Cashy Aggregation
2. Simplicity
3. Low Break-Even Point
• Insights beyond Peru
• Annex
2

Introduction
• Large scale agent networks make delivery easier for financial service providers by eliminating the need to create their own infrastructure in order to reach wider geographies.
• For remote and lower income customers, these more proximate agents are their points of access to a richer portfolio of financial services at lower costs.
• New banking models (mobile banking, agent banking) that have high potential for financial inclusion, largely depend on the ability of these agents to provide extended coverage, including reaching rural areas.
• Several factors affect the possibility of this happening: the degree of service aggregation, the volume of cash-based services offered, the complexity of transactions, as well as operational cost structures.
• This study presents insights from characterizing five agent networks in Peru, with more than 26,000 agents in total. It presents some findings on how these factors impact the ability of networks to gain scale and coverage. The four main types of networks identified are: Bank-Centric, MNO-Centric, Provider-Agnostic and Transactional-Shop.
3

Key Messages from Peru
1. Aggregation drives agent revenue: the more services offered (bill
payments, branchless banking, etc.) the larger the transactional pool
that can be processed. Highly aggregated portfolios display up to 8x
differentials in agent revenue.
2. Cashy transactions are a fundamental factor contributing to the
viability of agents. In Peru, cash-based over the counter
transactions (such as bill payments) represent a significantly large
transaction pool, ranging from 40% to 90% of a network’s total
income.
3. Simpler transactions display increased agent density per
locality and network scale. Complex transactions (such as some
banking transactions) involve more expensive infrastructure and
procedures, thus setting a higher bar for the number of agents that
can reach the amount of transactions necessary to break-even.
4

Continued - Key Messages from Peru
4. Beyond simplicity, each network’s business model features, such
as liquidity management duties, affect also the operational cost
structure and thus agent’s point of break-even (BEP) in terms of
amount of transactions. In Peru, low BEPs explain agent density
and thus proximity both in rural and urban settings. Business
models studied range from 3500 to 150 monthly transactions for
BEP.
5. However, there are trade-offs and while simpler transactions provide
lower break-even points and thus denser networks, their financial
inclusion potential is more limited.
6. Overall, the Peruvian sweet spot for network density, scale and
thus access is located, surprisingly from some perspectives, at the
intersection of high aggregation of services, including cashy
transactions, low break-even points and simple transactions.
5

The Peruvian Sweet Spot
The Peruvian sweet spot for scale and density in agent networks lies at the intersection of the three core market trends identified.
This rather counter-intuitive finding, has also some trade-offs, as will be explained in the following pages.
6
1. High Aggregation, particularly
Cashy
2. Simple trans-
actions
3. Low Break-Even Point (BEP)

1. Cashy Aggregation7
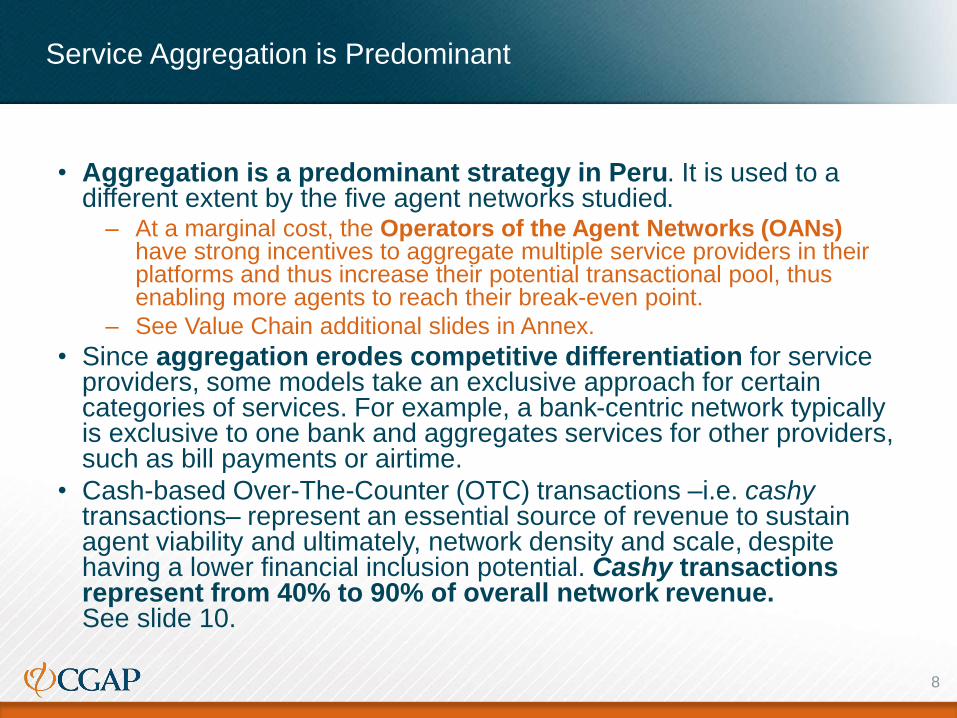
Service Aggregation is Predominant
• Aggregation is a predominant strategy in Peru. It is used to a different extent by the five agent networks studied.
– At a marginal cost, the Operators of the Agent Networks (OANs) have strong incentives to aggregate multiple service providers in their platforms and thus increase their potential transactional pool, thus enabling more agents to reach their break-even point.
– See Value Chain additional slides in Annex.
• Since aggregation erodes competitive differentiation for service providers, some models take an exclusive approach for certain categories of services. For example, a bank-centric network typically is exclusive to one bank and aggregates services for other providers, such as bill payments or airtime.
• Cash-based Over-The-Counter (OTC) transactions –i.e. cashytransactions– represent an essential source of revenue to sustain agent viability and ultimately, network density and scale, despite having a lower financial inclusion potential. Cashy transactions represent from 40% to 90% of overall network revenue. See slide 10.
8

Models by Portfolio, Exclusive vs. Aggregated Services
See Annex for more specific characterization of the different models
9
Trx-Shop Bank-Centric Provider-Agnostic MNO-Centric
Agent
revenue34x 8x 3x x
Exclusive Aggregator Exclusive Aggregator Exclusive Aggregator Exclusive Aggregator
Branchless
Banking
Airtime
Bill
Payments
Remittances
Indirectly through
bank deposits
Some networks are “tiered”, not all
agents offer the complete portfolio

Cashy Transactions’ Contribution
Per model, 2013.
10
Bill Payment &
Airtime40%
Withdrawal30%
Deposit18%
Remittance<1%Zero
12%
Atrx -Account based46%
Ctrx - Cash based54%
Airtime89%
Bill payment
7%
Zero: Loyalty
program4%
Airtime4%
Bill Payment
60%
Deposit18%
Withdrawal16%
Zero: Balance,
ACH2%
Bank Centric
Revenue
Specialized
Revenue
Provider-Agnostic-B
Trx
Provider-Agnostic-M
Revenue
2. Simplicity
11
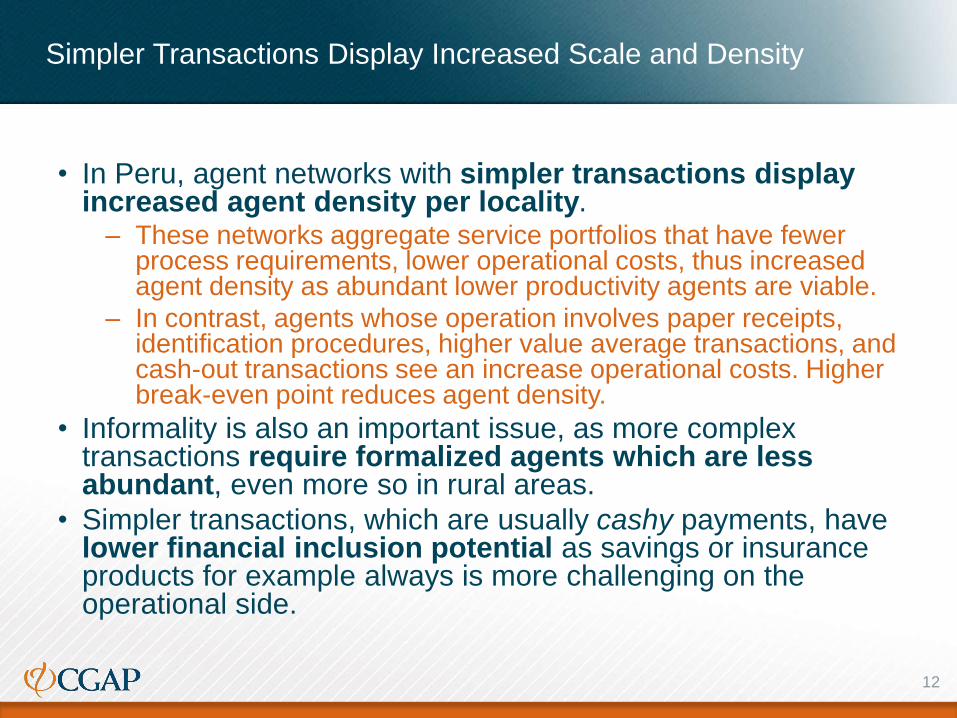
Simpler Transactions Display Increased Scale and Density
• In Peru, agent networks with simpler transactions display increased agent density per locality.
– These networks aggregate service portfolios that have fewer process requirements, lower operational costs, thus increased agent density as abundant lower productivity agents are viable.
– In contrast, agents whose operation involves paper receipts, identification procedures, higher value average transactions, and cash-out transactions see an increase operational costs. Higher break-even point reduces agent density.
• Informality is also an important issue, as more complex transactions require formalized agents which are less abundant, even more so in rural areas.
• Simpler transactions, which are usually cashy payments, have lower financial inclusion potential as savings or insurance products for example always is more challenging on the operational side.
12
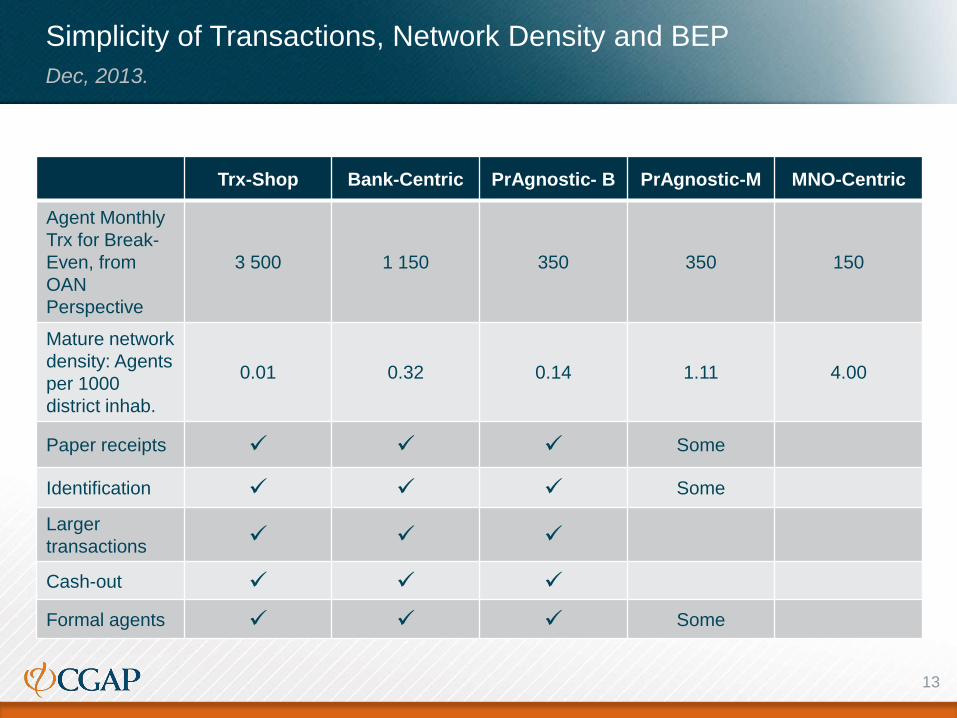
Simplicity of Transactions, Network Density and BEP
Dec, 2013.
13
Trx-Shop Bank-Centric PrAgnostic- B PrAgnostic-M MNO-Centric
Agent Monthly
Trx for Break-
Even, from
OAN
Perspective
3 500 1 150 350 350 150
Mature network
density: Agents
per 1000
district inhab.
0.01 0.32 0.14 1.11 4.00
Paper receipts Some
Identification Some
Larger
transactions
Cash-out
Formal agents Some

3. Low Break-Even Point14
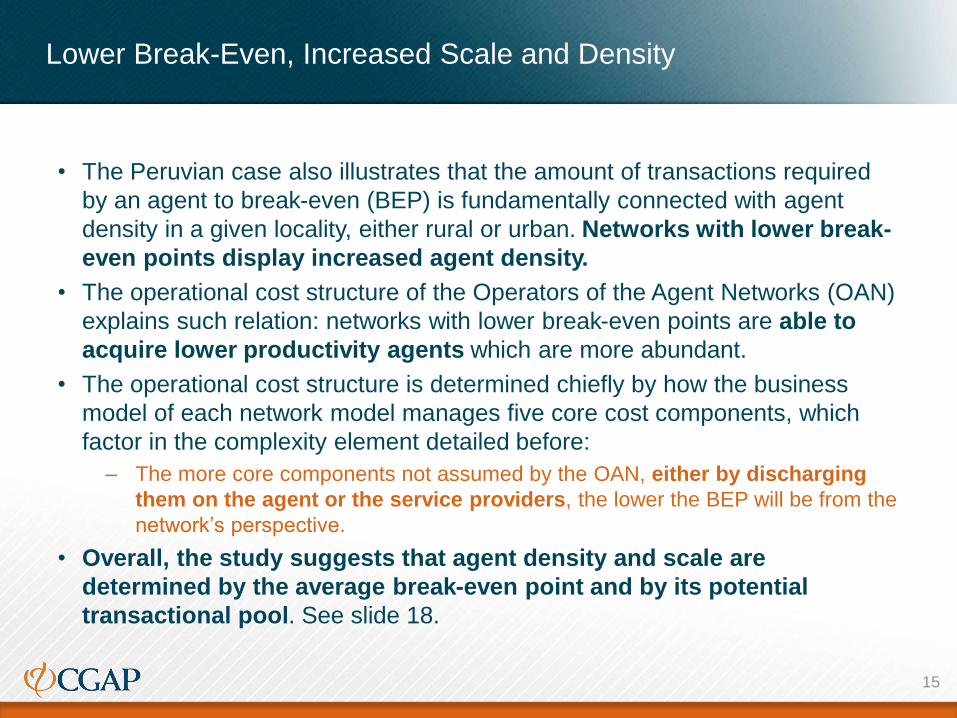
Lower Break-Even, Increased Scale and Density
• The Peruvian case also illustrates that the amount of transactions required
by an agent to break-even (BEP) is fundamentally connected with agent
density in a given locality, either rural or urban. Networks with lower break-
even points display increased agent density.
• The operational cost structure of the Operators of the Agent Networks (OAN)
explains such relation: networks with lower break-even points are able to
acquire lower productivity agents which are more abundant.
• The operational cost structure is determined chiefly by how the business
model of each network model manages five core cost components, which
factor in the complexity element detailed before:
– The more core components not assumed by the OAN, either by discharging
them on the agent or the service providers, the lower the BEP will be from the
network’s perspective.
• Overall, the study suggests that agent density and scale are
determined by the average break-even point and by its potential
transactional pool. See slide 18.
15
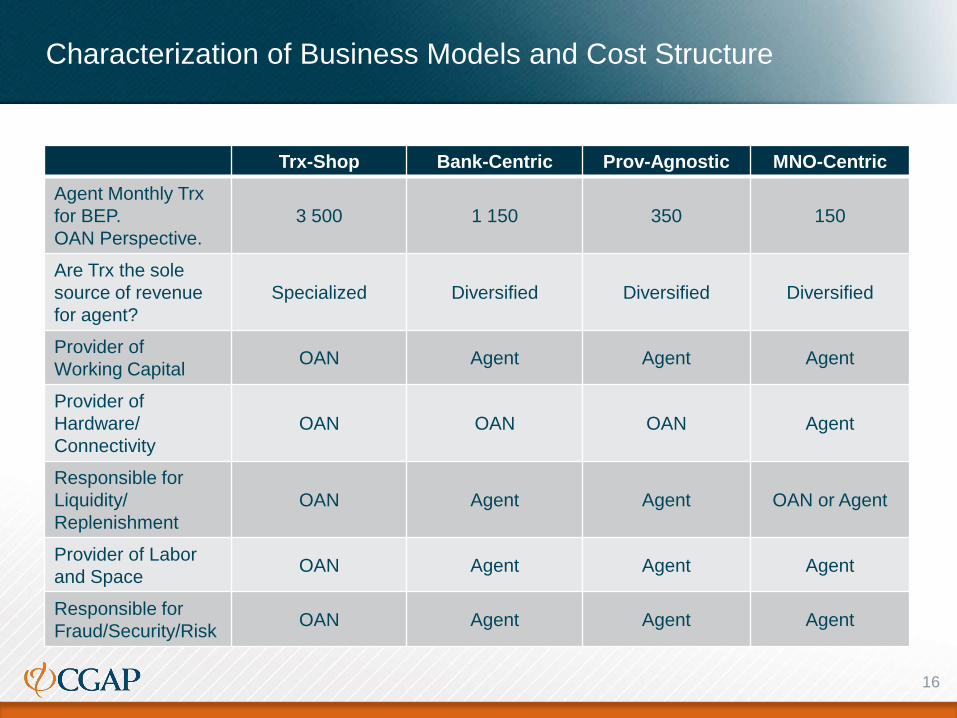
Characterization of Business Models and Cost Structure
16
Trx-Shop Bank-Centric Prov-Agnostic MNO-Centric
Agent Monthly Trx
for BEP.
OAN Perspective.
3 500 1 150 350 150
Are Trx the sole
source of revenue
for agent?
Specialized Diversified Diversified Diversified
Provider of
Working CapitalOAN Agent Agent Agent
Provider of
Hardware/
Connectivity
OAN OAN OAN Agent
Responsible for
Liquidity/
Replenishment
OAN Agent Agent OAN or Agent
Provider of Labor
and SpaceOAN Agent Agent Agent
Responsible for
Fraud/Security/RiskOAN Agent Agent Agent

Insights beyond Peru17

Map: Network Density, Scale and Simplicity. Can you have it all?
Dec 2013. See Annex for methodology and definitions
18
Transactional-Shop, 34 agents
Bank-Centric, 5,692 agents
MNO-Centric, 6,190 agents
Provider-Agnostic-B, 1,375 agents
Provider-Agnostic-M, 13,147 agents
100
500
2,500
0.01 0.02 0.03 0.06 0.13 0.25 0.50 1.00 2.00 4.00 8.00
Bre
ak-E
ven
Po
int,
trx
/mo
, lo
g5 s
cale
.
Mature Density: agents per 1000 district inhabitants, log2 scale.
High density network,
large scale. Low
aggregation, low
agent revenue. Basic
Trx.
High aggregation and
high agent revenue.
Complex transactions
processed.
Higher aggregation of cashy
Trx, and more complex
transactions while keeping
operational costs low.
Intermediate agent revenue.
Model requires many
Trx per agent. Only
very productive agents
can thrive. Density
very low, and agent
revenue very high.

Peru’s Growth Path Story: Further into the sweet spot?
The Peruvian experience in the development of agent networks illustrates the
following sequence:
1. Critical mass, technology and two origins: by mid 2000s, as mobiles
began to be widely adopted, two kinds of service providers had
transactions pools with a sufficient critical mass to make agents reach
their break even point and thus become viable: banks with bill payments
and MNOs with airtime top-ups. Either directly or through third parties,
banks and MNOs started operating parallel agent networks. Both of these
critical transactional pools were cashy (Ctrx).
2. Aggregation and convergence of service portfolios: Operators of
agent networks began aggregating services leveraging the possibility to
do so at marginal costs, increasing returns. This aggregation process is
making agent networks with different origins (airtime, Provider-Agnostic-M
vs. bill payments, Provider-Agnostic-B) converge towards similar service
portfolios. As of 2013, for example, the 5 models surveyed process some
form of bill payments.
19

Continued - Peru’s Growth Path Story: Further into the sweet spot?
3. Competition across agent networks: This ongoing convergence
process shifts the competition for the acquisition of agents away from
product differentiation (a strategy more feasible for a few leading banks
for example) and more towards operational efficiency and large
transactional pools. From a financial inclusion perspective, the Provider-
Agnostic OAN models, get the spotlight as they are providing an
intermediate position between agent availability and the processing of
more complex transactions with financial inclusion potential.
20

The Peruvian Sweet Spot revisited
The convergence
trends identified
raise the question
about how efficient
aggregators can
become in order to
process
transactions with
more financial
inclusion potential
while keeping
BEPs low.
21
High Aggregation
Simple Trx.
Low Break-
Even Point (BEP) •MNO-Centric
•Bank-Centric•Specialized
•Provider-Agnostic-B
•Provider-Agnostic-M
• Potential super-aggregator?
Convergence
trends
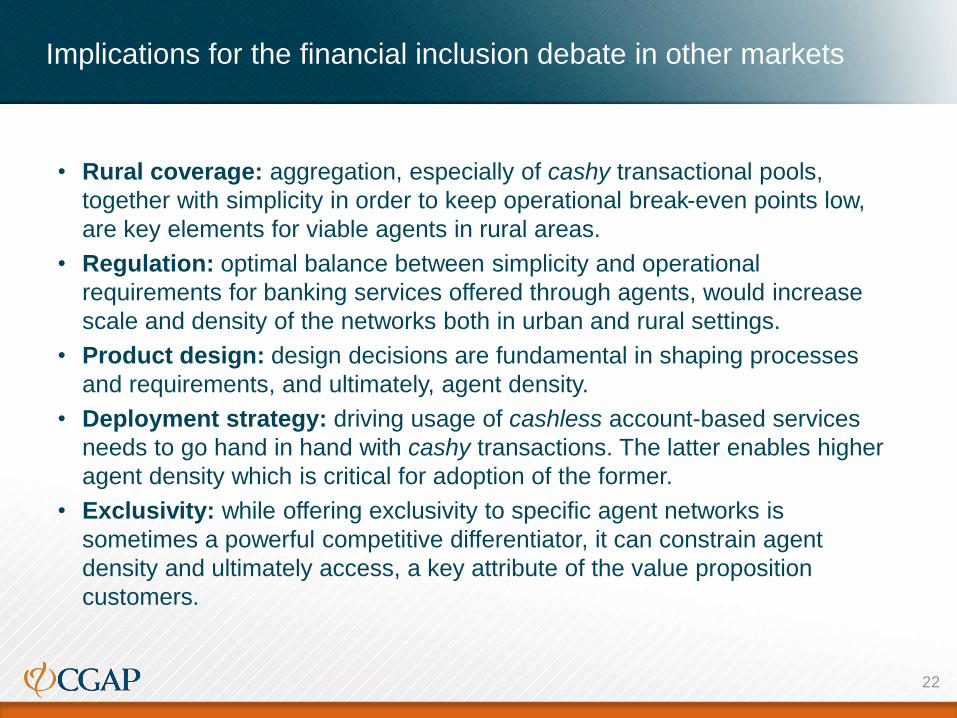
Implications for the financial inclusion debate in other markets
• Rural coverage: aggregation, especially of cashy transactional pools,
together with simplicity in order to keep operational break-even points low,
are key elements for viable agents in rural areas.
• Regulation: optimal balance between simplicity and operational
requirements for banking services offered through agents, would increase
scale and density of the networks both in urban and rural settings.
• Product design: design decisions are fundamental in shaping processes
and requirements, and ultimately, agent density.
• Deployment strategy: driving usage of cashless account-based services
needs to go hand in hand with cashy transactions. The latter enables higher
agent density which is critical for adoption of the former.
• Exclusivity: while offering exclusivity to specific agent networks is
sometimes a powerful competitive differentiator, it can constrain agent
density and ultimately access, a key attribute of the value proposition
customers.
22

Continued - Implications for the financial inclusion debate…
• Interoperability: aggregation from third party agent networks can be an
easier alternative to interoperability as it enables over the counter
transactions between platforms but it that does not require interconnection at
the service provider level.
• Model potential: even mature agent networks are likely to benefit by further
aggregating large payout flows, such as Government to Person payments
(G2P), payroll services, among others.
• Tiered agents: both for operational and regulatory purposes the idea of
establishing tiers of agent, which is already being implemented by some
operators, can be useful to enable network density and scale across distinct
geographical areas.
23
Acknowledgments
• We are very thankful to the following companies for their support and
contributions, which among other institutions and organizations, made this
research project possible: Banco de Crédito del Perú, Fullcarga, Globokas,
Hermes-Multifácil and Movilway.
• We are also very thankful to all CGAP staff and consultants, who provided
feedback during the research process, especially to Peter Zetterli and to
Jacobo Menajovsky who helped with outlier treatment, as well as Peru’s SBS
–Superintendencia de Banca y Seguros- and the IFC office in Peru for their
collaboration and support.
24

AnnexFramework, methodology and further details.
25

Model Benchmark
Dec 2013, selected variables. Estimates are marked with *
26
Model Benchmark Trx-Shop Bank-Centric MNO-Centric ProvAgnostic-B ProvAgnostic-M
1.1 POAs 34 5,692 6,190 1,375 13,147
1.2 Inhabitants in area of operation 5,713,518 22,575,750 1,778,336 20,472,774 23,000,000*
1.3 Urban agents (vs. Rural) 100% 91% 91% 85% 90%
1.4 Mature agent density (POAs per
1000 district Inhab.)0.01 0.32 4.00 0.14 1.11
1.5 Mature agent density (Inhab. Per
POA)77,150 3,150 250 7,300 900
1.6 Mature agent density Urban (Inhab.
Per POA)77,150 2,900 200 10,200 850
1.7 Mature agent density Rural (Inhab.
Per POA)#N/A 3,400 300 4,250 2,550
1.8 Terminal type: mobile, POS, PC POS, PC POS PC, Mobile POS POS, PC, Mobile
1.9 Years of operations 4 8 4 6 9
1.10 Transacted volume, monthy average
2013 (USD)$9,952,675 $508,197,448 $4,919,095 $24,750,000* $20,719,916
1.11 Transactions, monthly average 2013 192,899 14,896,960 2,310,305 825,000* 6,051,005
1.12 Transactions per agent, monthly
average 20135,674 2,617 373 600* 460
1.13 Transaction value, average 2013
(USD)$51.60 $34.11 $2.13 $30.00* $3.42
1.14 Agent revenue, monthly average
2013 (USD)$1,176.59 $291.67 $35.76 $158.00* $42.94
1.15 Agent break-even monthly
transactions – BEP3,500 1,150 150 350* 350
1.16 Transactions CAGR 2011-13 23.2% 22.7% 25.1% 95.1% 25.13%
1.17 Churn rate, 2013 0.5% 17.7% 3.0% 1.8% 3%
1.18 Agent distribution per Trx q (Top
20% POAs/Bottom 20% POAs)4.76 9.22 20.60 #N/A #N/A
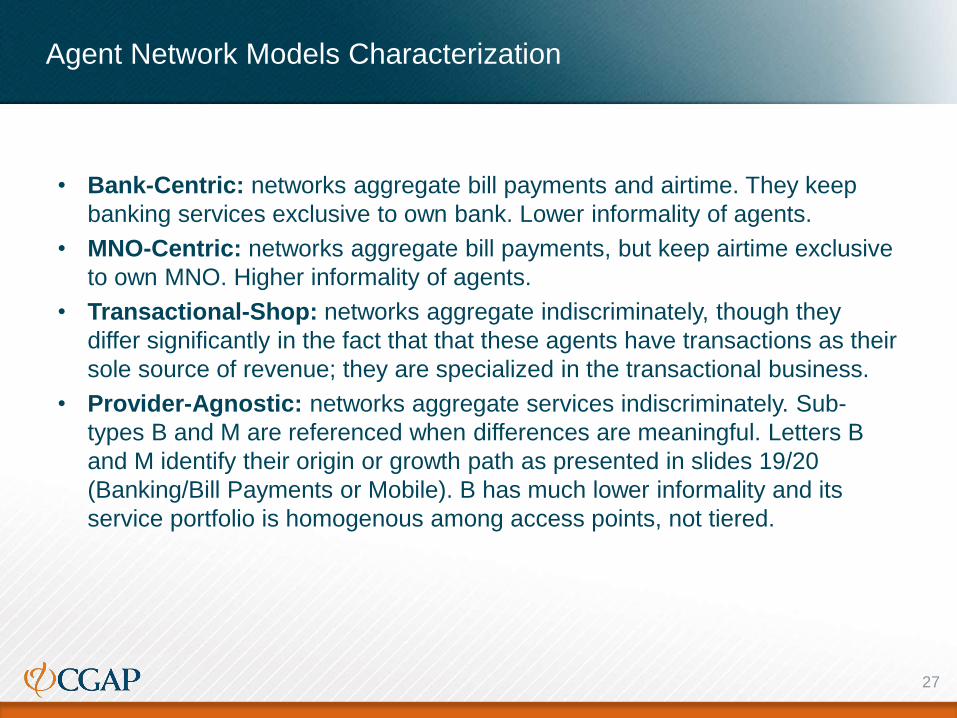
Agent Network Models Characterization
27
• Bank-Centric: networks aggregate bill payments and airtime. They keep
banking services exclusive to own bank. Lower informality of agents.
• MNO-Centric: networks aggregate bill payments, but keep airtime exclusive
to own MNO. Higher informality of agents.
• Transactional-Shop: networks aggregate indiscriminately, though they
differ significantly in the fact that that these agents have transactions as their
sole source of revenue; they are specialized in the transactional business.
• Provider-Agnostic: networks aggregate services indiscriminately. Sub-
types B and M are referenced when differences are meaningful. Letters B
and M identify their origin or growth path as presented in slides 19/20
(Banking/Bill Payments or Mobile). B has much lower informality and its
service portfolio is homogenous among access points, not tiered.
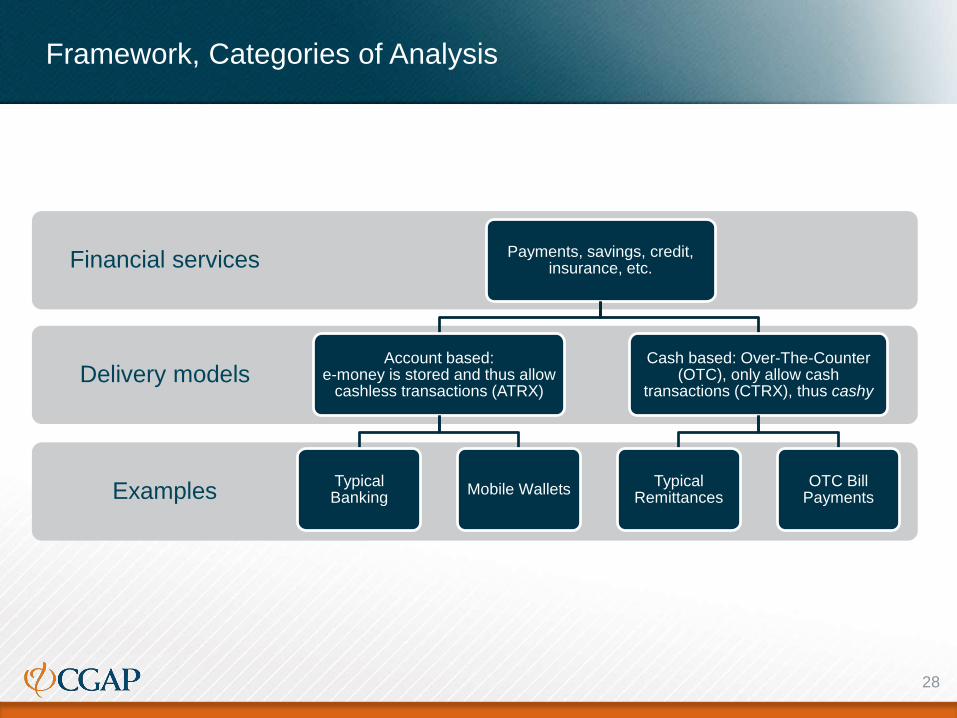
Framework, Categories of Analysis
28
Examples
Delivery models
Financial services Payments, savings, credit, insurance, etc.
Account based: e-money is stored and thus allow
cashless transactions (ATRX)
Typical Banking
Mobile Wallets
Cash based: Over-The-Counter (OTC), only allow cash
transactions (CTRX), thus cashy
Typical Remittances
OTC Bill Payments

Framework, Value Chain
Three link-levels in the agent networks’ value chain:
1.Service Provider (SP): Offers services to customers who interact through the agent network’s points of
access, mostly through cash-in and cash-out services. Service providers can be
banks, telecommunications companies, public utilities, or remittances companies,
among others.
2.Operator of the Agent Network (OAN): Runs a cash collection service that enables cash-in and sometimes cash-out services
on behalf of the SPs in large number of agents. The OAN also acquires these agents.
In some cases OANs also run a technological platform that enables the customers to
interact with the SPs at the points of access, often in real-time. When the technological
platform is run by the OAN aggregation of multiple SPs increases revenue at marginal
costs.
3.Agents or Points of Access (POAs): Physical stores that process mostly cash transactions on behalf of SPs, and manage
this cash according to OAN rules. To perform these transactions POAs use connected
terminals such as PCs, mobile phones or other POS specific devices, which are
usually provided by the OANs.
29

Framework, Transaction types
• Transaction types for agents (see definitions in following slide):
• ATRX: Account based Transactions
• CTRX: Cash based Transactions
• Transaction classification:
1. Airtime: CTRX
2. Bill payments: CTRX
3. Remittances: CTRX
4. Deposits: ATRX
5. Withdrawals: ATRX
6. Zero, do not affect liquidity (Transfers, balance inquiry, etc.): ATRX
30

Basic Glossary and Definitions
• Account-based transactions, ATRX: transactions made over the counter
aimed at managing e-money stored in an account, such as cash-in or cash-
out, and thus enabling also cashless transactions.
• Mature network density: number of agents per 1000 district inhabitants.
Maturity is defined as a cap on the 20th percentile of the distribution of
agents in order to conservatively exclude outliers. See specific slide in
annex for further details.
• Cash based transactions, CTRX: transactions can only be performed
using cash over the counter, thus cashy. There is no possibility of storing e-
money for later use.
• Agent Break-Even Point, BEP: the quantity of monthly transactions that an
agent must process in order not to run at a loss from the OAN perspective.
31
Methodology, scope and comparability
• Qualitative model characterization from detailed quantitative
operational data provided by five agent networks.
• Unstructured interviews with network managers.
• Only transactional revenue is considered, financial revenues of
OANs are not taken into account.
• Secondary transactional market is not included, where OANs
interconnect their SPs with other OANs through their own platforms.
• The methodology and indicators have been designed to be
replicable across regions and continents.
• Rural districts are defined as districts bearing less than 24900
inhabitants. Less than 5 districts over +1800 were arbitrarily tagged
as urban given their metropolitan location..
32

Outlier treatment for mature network density at district level
33

Advancing financial inclusion to improve the lives of the poor
www.cgap.org