Cash Assistance and Monthly Cycles in Substance Abuse Carlos Dobkin (UC Santa Cruz) and Steve Puller...
40
Cash Assistance and Monthly Cycles in Substance Abuse Carlos Dobkin (UC Santa Cruz) and Steve Puller (Texas A&M)
-
Upload
ashlynn-kingsbury -
Category
Documents
-
view
216 -
download
0
Transcript of Cash Assistance and Monthly Cycles in Substance Abuse Carlos Dobkin (UC Santa Cruz) and Steve Puller...

Cash Assistance and Monthly Cycles in Substance Abuse
Carlos Dobkin (UC Santa Cruz)
and
Steve Puller (Texas A&M)

Figure 1: Drug Related Hospital Admissions (California 1994-2000)
0
5,000
10,000
15,000
20,000
25,000
30,000
1 2 3 4 5 6 7 8 9 10 11 12 13 14 15 16 17 18 19 20 21 22 23 24 25 26 27 28
Day of Month
Adm
issi
ons
with
a m
entio
n of
Alc
ohol
0
2,000
4,000
6,000
8,000
10,000
12,000
14,000
Adm
issi
ons
with
a m
entio
n of
Coc
aine
, Her
oin
or
Am
phet
amin
e
Alcohol
Cocaine, Heroin or Amphetamine
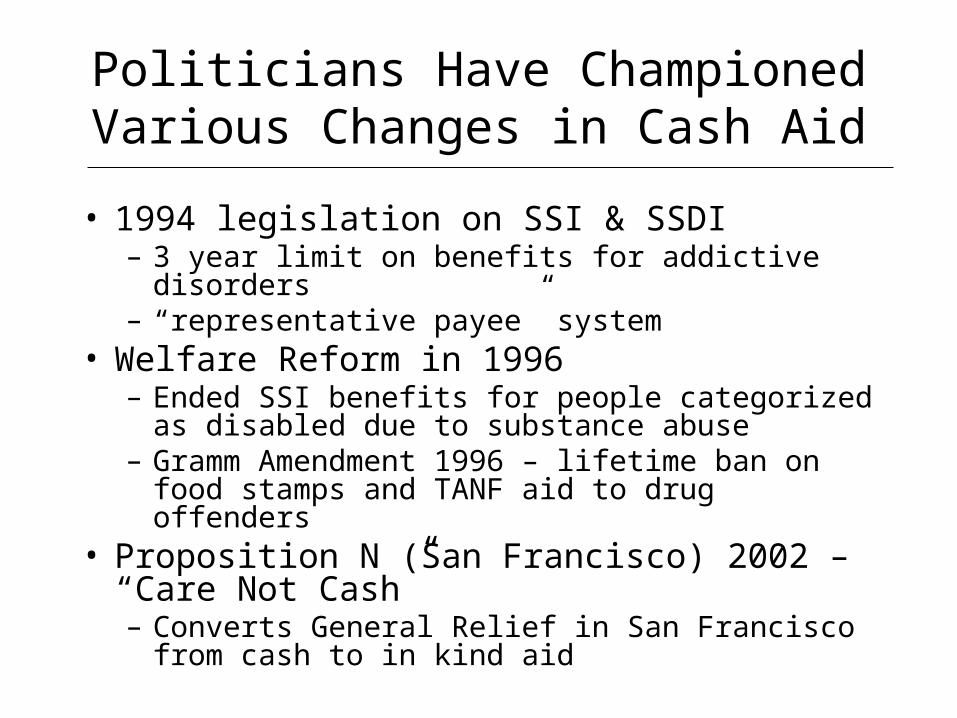
Politicians Have Championed Various Changes in Cash Aid
• 1994 legislation on SSI & SSDI– 3 year limit on benefits for addictive disorders– “representative payee” system
• Welfare Reform in 1996 – Ended SSI benefits for people categorized as disabled
due to substance abuse– Gramm Amendment 1996 – lifetime ban on food
stamps and TANF aid to drug offenders• Proposition N (San Francisco) 2002 – “Care Not
Cash”– Converts General Relief in San Francisco from cash to
in kind aid

Literature on Cycles in Drug Consumption
• Monthly pattern in deaths (Phillips 1999)– 14% more substance abuse deaths in first vs. last week
of month
• Monthly pattern in psychiatric admissions (Halpern & Mechem 2001)– Psychiatric admissions for substance abuse 14% higher
first week (vs. 6% for non-substance abuse)
• Cocaine use among disabled vets (Shaner 1995)– 105 male vets on disability with history of
schizophrenia & cocaine use
– Highest cocaine concentration in body during first 3 days of month

Contributions of This Paper
1) Document the monthly cycle in hospital admissions by substance
2) Determine which government programs are driving the monthly cycle in admissions
3) Assess whether alternate disbursal regimes can smooth the monthly cycle
4) Test if cash aid affects the level of admissions or just the timing of admissions

Data
• California Hospital Discharge Data 1994-2000– Census of hospitalizations
– Includes patient demographics, cause of hospitalization (ICD-9 codes) and treatment provided
• Medi-Cal Eligibility Data 1994-2000– Linked to hospital data
– Includes eligibility for welfare and Supplemental Security Income (SSI) for Aged, Blind, or Disabled
– Does not include General Relief
– Proxy for Social Security Disability Insurance (DI)

Figure 2: Monthly Cycle in Drug Related Hospital Admissions by Drug Type (California 1994-2000)
0
1,000
2,000
3,000
4,000
5,000
6,000
7,000
1 2 3 4 5 6 7 8 9 10 11 12 13 14 15 16 17 18 19 20 21 22 23 24 25 26 27 28
Day of Admission
Her
oin
an
d C
oca
ine
0
500
1,000
1,500
2,000
2,500
3,000
3,500
4,000
4,500
Am
pht
am
ine
Cocaine
Heroin
Amphetamine
Cycle by Type of Drug
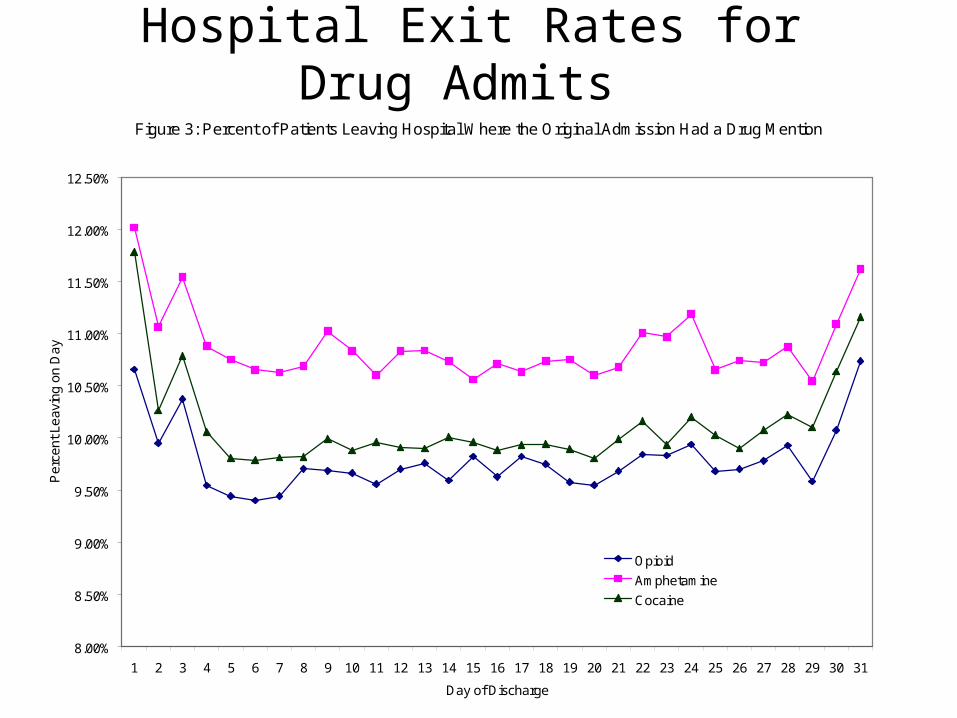
Figure 3: Percent of Patients Leaving Hospital Where the Original Admission Had a Drug Mention
8.00%
8.50%
9.00%
9.50%
10.00%
10.50%
11.00%
11.50%
12.00%
12.50%
1 2 3 4 5 6 7 8 9 10 11 12 13 14 15 16 17 18 19 20 21 22 23 24 25 26 27 28 29 30 31
Day of Discharge
Pe
rce
nt L
ea
vin
g o
n D
ay
Opioid
Amphetamine
Cocaine
Hospital Exit Rates for Drug Admits

Possible Causes of the Cycle• Monthly Paychecks• Supplemental Security Income (SSI/SSP)
– For low income aged, blind or disabled – 5 month waiting period for disabled– Approximately 1 Million recipients state-wide, two-thirds disabled– Benefits average about $600/month for individuals ($1100/month couples)– Checks arrive on the 1st (or last previous business day if on weekend)
• Social Security Disability Insurance (DI)– Replacement rate varies with income– Eligible for Medicare after 2 years– Aid arrives 3rd of month
• Welfare – Largest of the programs with 2 million recipients statewide– Benefits about $550/month in 1997– Checks typically arrive on the first but there is a little variation by county
• General Relief– County program for indigent adults (varies by county typically ~ $250 per month)
• Unemployment Insurance – Paid bi-weekly
• Workers’ Compensation– Some benefits paid bi-weekly
• Supply side factors?
Carlos Dobkin
Fill in details on the rest of the programs
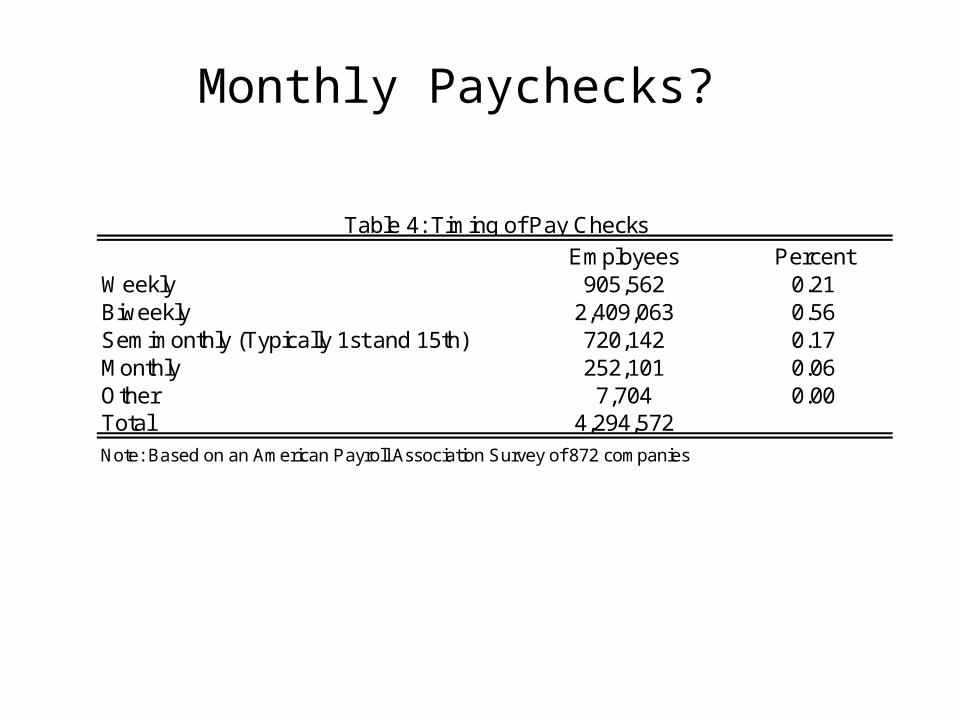
Employees PercentWeekly 905,562 0.21Biweekly 2,409,063 0.56Semimonthly (Typically 1st and 15th) 720,142 0.17Monthly 252,101 0.06Other 7,704 0.00Total 4,294,572
Note: Based on an American Payroll Association Survey of 872 companies
Table 4: Timing of Pay Checks
Monthly Paychecks?

Alcohol Cocaine Herion AmphetamineCounts of Admissions
Welfare 18,476 11,783 9,112 15,233 SSI Aged 10,824 186 837 53 SSI Blind 1,792 409 449 176
SSI Disabled 147,415 44,084 49,284 22,969 Other 592,267 100,185 120,899 78,437
Admissions Per Month per 10K Enrollees Welfare 0.98 0.63 0.48 0.81 SSI Aged 3.81 0.07 0.29 0.02 SSI Blind 8.49 1.94 2.13 0.83
SSI Disabled 24.79 7.41 8.29 3.86
Table 3: Hospital Admissions 1994-2000 by Drug and Program
Drug Admissions By Aid Program

Figure 4: Hospital Admissions With a Mention of Cocaine, Heroin or Amphetamine by Program
0
500
1,000
1,500
2,000
2,500
3,000
3,500
4,000
4,500
1 2 3 4 5 6 7 8 9 10 11 12 13 14 15 16 17 18 19 20 21 22 23 24 25 26 27 28
Day of Admission
SS
I and
Wel
fare
0
1,000
2,000
3,000
4,000
5,000
6,000
7,000
8,000
9,000
10,000
Non
Wel
fare
non
SS
I
Welfare
SSI
Not on SSI or Welfare
Monthly Drug Cycle for Welfare, SSI

Figure 5: Hospital Admissions by Insurance Type for Cocaine, Heroin and Amphetamine for People Receiving Neither Welfare nor SSI
0
500
1,000
1,500
2,000
2,500
3,000
3,500
1 2 3 4 5 6 7 8 9 10 11 12 13 14 15 16 17 18 19 20 21 22 23 24 25 26 27 28
Day of Admission
Pri
vate
Insu
ran
ce
0
200
400
600
800
1,000
1,200
1,400
1,600
1,800
Se
lf P
ay,
Co
un
ty In
dig
en
t, M
ed
i-C
al a
nd
Me
dic
are
Private
Self Pay
County Indigent
Medi-Cal
Medicare
Monthly Drug Cycle for Non-Welfare, Non-SSI

Exit Rates for Welfare, SSI Drug AdmitsFigure 8: Proportion of Patients With Cocaine, Heroin or Amphetamine Admission Leaving the Hospital
For Home
0
0.05
0.1
0.15
0.2
0.25
1 2 3 4 5 6 7 8 9 10 11 12 13 14 15 16 17 18 19 20 21 22 23 24 25 26 27 28 29 30 31
Day of Discharge
Pro
port
ion
of W
elfa
re P
atie
nts
Exi
ting
Hos
pita
l
0
0.02
0.04
0.06
0.08
0.1
0.12
Pro
port
ion
of S
SI
and
Non
Wel
fare
Non
SS
I A
dmis
sion
E
xitin
g H
ospi
tal
Welfare
SSI
Not on SSI or Welfare
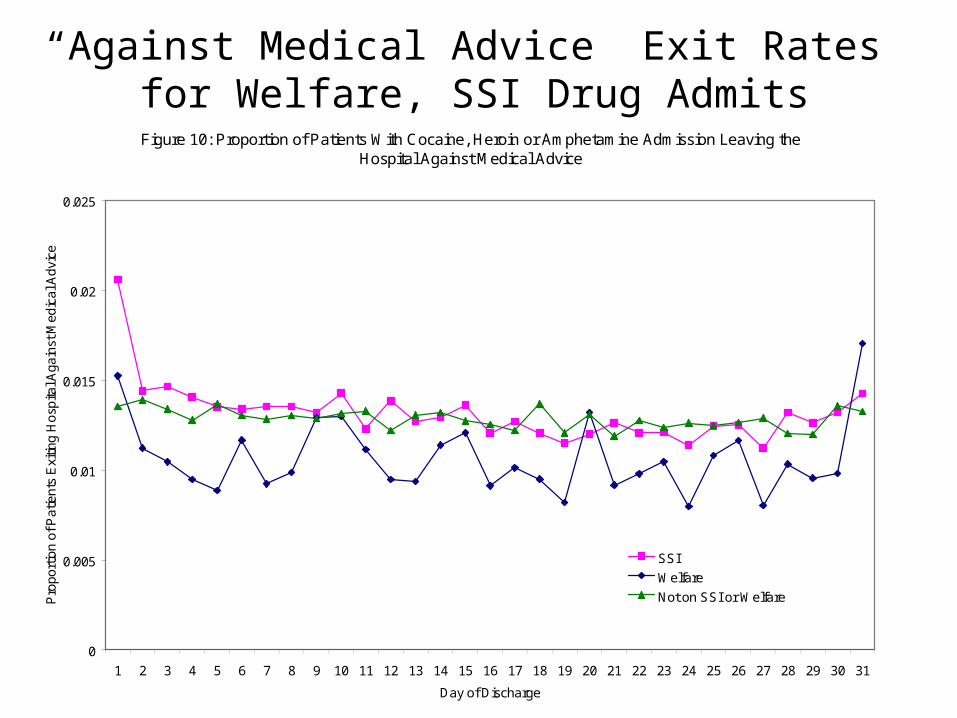
Figure 10: Proportion of Patients With Cocaine, Heroin or Amphetamine Admission Leaving the Hospital Against Medical Advice
0
0.005
0.01
0.015
0.02
0.025
1 2 3 4 5 6 7 8 9 10 11 12 13 14 15 16 17 18 19 20 21 22 23 24 25 26 27 28 29 30 31
Day of Discharge
Pro
port
ion
of P
atie
nts
Exi
ting
Hos
pita
l Aga
inst
Med
ical
Adv
ice
SSI
Welfare
Not on SSI or Welfare
“Against Medical Advice” Exit Rates for Welfare, SSI Drug Admits
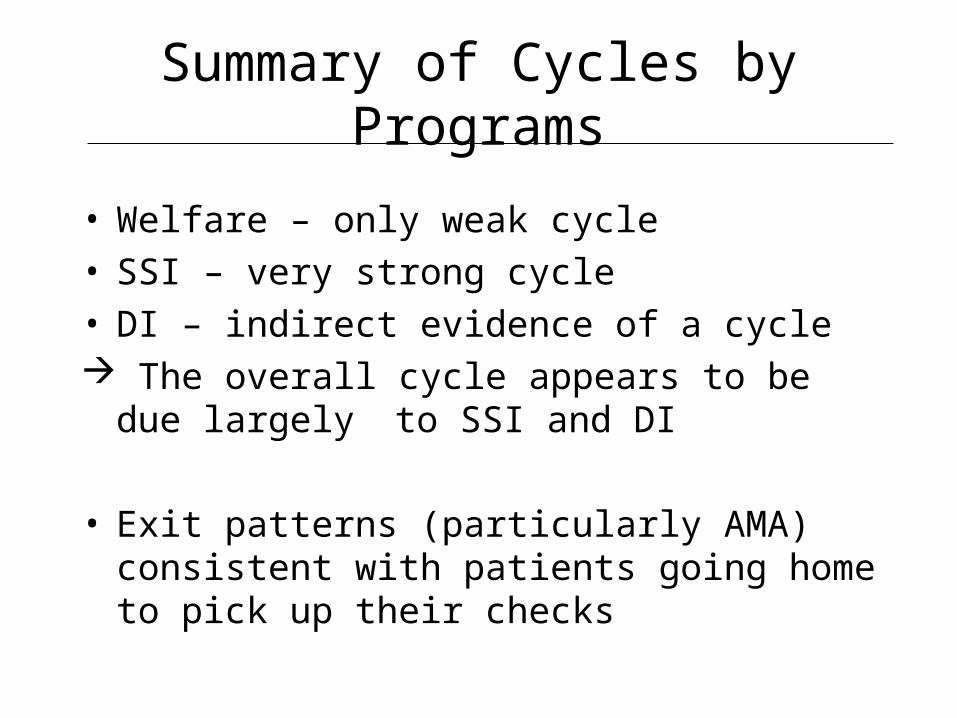
Summary of Cycles by Programs
• Welfare – only weak cycle• SSI – very strong cycle • DI – indirect evidence of a cycle The overall cycle appears to be due largely to
SSI and DI
• Exit patterns (particularly AMA) consistent with patients going home to pick up their checks
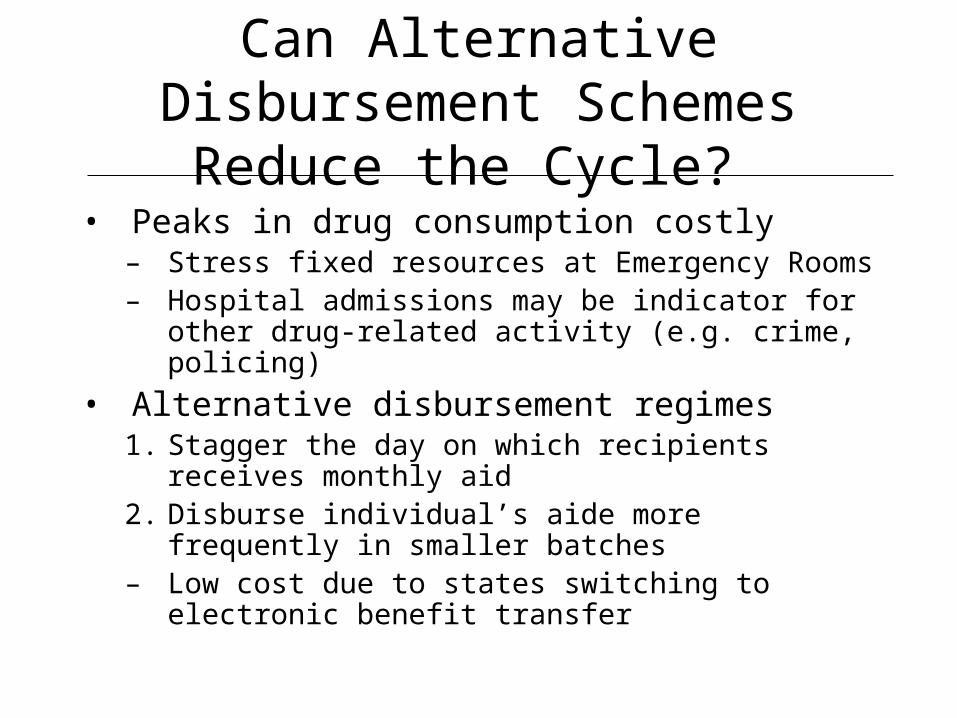
Can Alternative Disbursement Schemes Reduce the Cycle?
• Peaks in drug consumption costly– Stress fixed resources at Emergency Rooms– Hospital admissions may be indicator for other drug-
related activity (e.g. crime, policing)
• Alternative disbursement regimes1. Stagger the day on which recipients receives monthly
aid2. Disburse individual’s aide more frequently in smaller
batches– Low cost due to states switching to electronic benefit
transfer

Empirical Evidence on Alternative Disbursement Regimes
• Los Angeles County disbursement of welfare– Pre June 1997: Day 1– Post June 1997: Staggered Days 1-10 based on case
number (recipients could pick up at issuance outlet after designated day)
– Effect: • Individuals still have “fat wallets”, but everybody doesn’t
have them at the same time
• Question– Does aggregate cycle change?– Keep in mind
• Welfare recipients show relatively small cycle• Welfare reform may create other changes pre and post
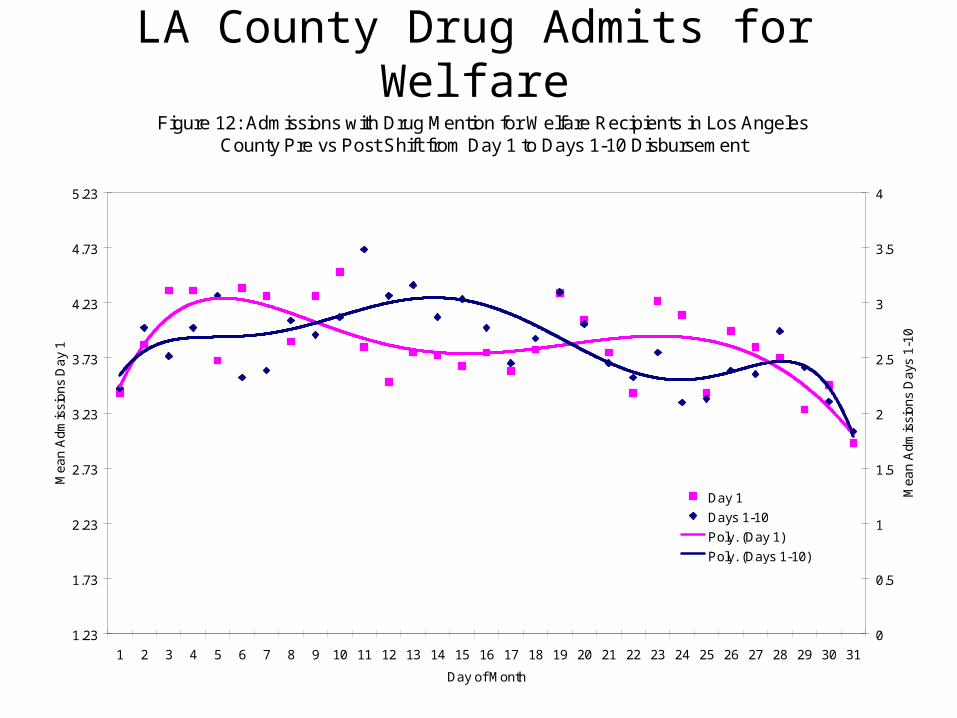
Figure 12: Admissions with Drug Mention for Welfare Recipients in Los Angeles County Pre vs Post Shift from Day 1 to Days 1-10 Disbursement
1.23
1.73
2.23
2.73
3.23
3.73
4.23
4.73
5.23
1 2 3 4 5 6 7 8 9 10 11 12 13 14 15 16 17 18 19 20 21 22 23 24 25 26 27 28 29 30 31
Day of Month
Mea
n A
dmis
sion
s D
ay 1
0
0.5
1
1.5
2
2.5
3
3.5
4
Mea
n A
dmis
sion
s D
ays
1-10
Day 1
Days 1-10
Poly. (Day 1)
Poly. (Days 1-10)
LA County Drug Admits for Welfare

Figure 14: Admissions with No Drug Mention for Welfare Recipients in Los Angeles County Pre vs Post Shift from Day 1 to Days 1-10 Disbursement
1.49
3.49
5.49
7.49
9.49
11.49
13.49
15.49
1 2 3 4 5 6 7 8 9 10 11 12 13 14 15 16 17 18 19 20 21 22 23 24 25 26 27 28 29 30 31
Day of Month
Me
an
Ad
mis
sio
ns
Da
y 1
0
2
4
6
8
10
12
14
Me
an
Ad
mis
sio
ns
Da
ys 1
-10
Day 1
Days 1-10
Poly. (Day 1)
Poly. (Days 1-10)
LA County Non-drug Admits for Welfare

“Regression Adjusted” Cycle
A d m its D ay o fM o n th D u m , D ay o fM o n th D u m * P reJu n e9 7 , D ay o fW eek D u m
M o n th D u m , Y earD u m H o lid ay D u mt t t t
t t t
f
t
( ,
, , )
D ay o f M o n th D u m m ies = { D ay 1 , D ay 2 - 9 , D ay 1 0 - 1 7 , D ay 1 8 - 2 5 , D ay 2 6 - 3 1 }
H o lid ay D u m m ies = { N ew Y ears , Ju ly 4 , T h x g iv in g , X m as, F u llM o o n }
PostDay
PostDay
eDay
eDay
oH92
1710Pr
92
Pr1710:
Model:

Coef Std err Coef Std err Coef Std err
Day1 2.53 (0.32)** 1.06 (0.25)** 6.96 (0.62)**Day2-9 2.86 (0.30)** 1.25 (0.24)** 7.29 (0.57)**Day10-17 3.14 (0.30)** 1.31 (0.24)** 7.57 (0.57)**Day18-25 2.70 (0.29)** 1.12 (0.24)** 7.53 (0.57)**Day26-31 2.55 (0.30)** 1.34 (0.25)** 7.39 (0.59)**Pre97*Day2-9 0.49 (0.25)* 0.25 (0.20) 0.69 (0.45)Pre97*Day10-17 -0.14 (0.24) 0.14 (0.20) 0.28 (0.45)Pre97*Day18-25 0.39 (0.23) 0.45 (0.20)* -0.12 (0.45)Pre97*Day26-31 0.23 (0.26) 0.08 (0.21) 0.04 (0.50)Estimated Coefficient of Day10-17 / Day2-9
Before 0.90 0.97 0.98After 1.10 1.05 1.04
Pvalue for Test of Equality 0.01 0.54 0.3
Observations 2191 2191 2191R-squared 0.78 0.69 0.91
Table 5: Welfare Recipients in Los Angeles County Pre and Post Change from Day 1 to Day 1-10 Disbursement
Notes: All admissions for 1994-1999 by recipients of welfare (AFDC/TANF) in Los Angeles county. Dummy variables for holidays are equal to 1 for the holiday and the following day. Model is estimated by least squares with White standard errors (* significant at 5%; ** significant at 1%). Dependent Variable: Daily count of admissions as a primary or secondary diagnosis. regression include month dummies, year dummies.
Drug Mentions Alcohol Mentions Non-drug Other Conditions

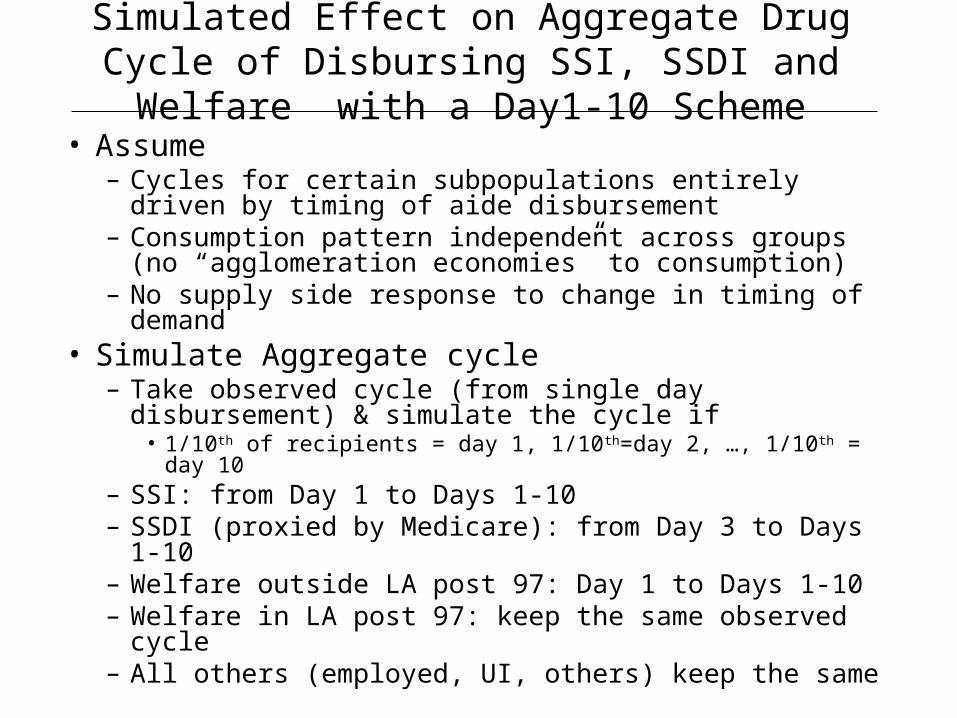
Simulated Effect on Aggregate Drug Cycle of Disbursing SSI, SSDI and Welfare with a Day1-10 Scheme
• Assume– Cycles for certain subpopulations entirely driven by timing
of aide disbursement– Consumption pattern independent across groups (no
“agglomeration economies” to consumption)– No supply side response to change in timing of demand
• Simulate Aggregate cycle– Take observed cycle (from single day disbursement) &
simulate the cycle if• 1/10th of recipients = day 1, 1/10th=day 2, …, 1/10th = day 10
– SSI: from Day 1 to Days 1-10– SSDI (proxied by Medicare): from Day 3 to Days 1-10– Welfare outside LA post 97: Day 1 to Days 1-10– Welfare in LA post 97: keep the same observed cycle– All others (employed, UI, others) keep the same

Figure 15: Simulated Monthly Drug Cycle When SSI, SSDI, and Welfare Are Disbursed Days 1-10
0
50
100
150
200
250
1 2 3 4 5 6 7 8 9 10 11 12 13 14 15 16 17 18 19 20 21 22 23 24 25 26 27 28 29 30 31
Day of Month
Dru
g A
dmis
sion
s
Actual
Day 1-10 For SSI, SSDI, Welfare

Do the Programs Increase Drug Use?
• Anecdotal evidence of a drug cycle from clinicians is taken to suggest that aid increases level of drug use
• Problem with simple comparisons: unobserved determinants of drug use correlated with cash aid eligibility
• Approach: focus on “SSI transitioners”– 5 month waiting period
– Analyze 1 month window around eligibility
– Our data has about 2500 admissions for patients transitioning from other Medi-Cal to SSI
• Large increase in cash aide
• No systematic difference in unobservables (hopefully)

Drug Cycle – SSI Transitioners1 Month Window
0.00
0.10
0.20
0.30
0.40
0.50
0.60
1 2 3 4 5 6 7 8 9 10 11 12 13 14 15 16 17 18 19 20 21 22 23 24 25 26 27 28 29 30 31
Day of Month
Mea
n A
dm
issi
on
s
Just Transitioned On
Mean - Just On
About To Transition On
Mean - About To Go On

Conclusions
• Monthly cycles in admissions and exits is evidence that aid disbursement affects timing of drug consumption– “fat wallets” aggravate impulse control problems
• SSI and SSDI are primary contributors to cycle– Targeted changes in disbursement can smooth
– Staggered vs. individual smoothing
– Appears it should be low cost intervention
• (Limited) evidence that aid affects timing but not levels
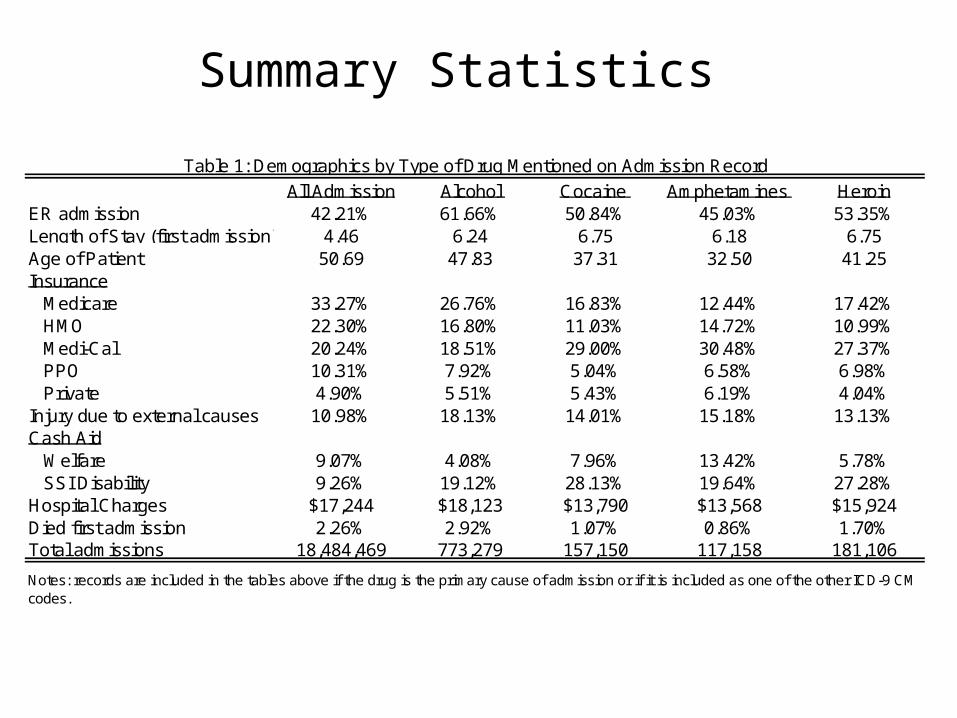
All Admission Alcohol Cocaine Amphetamines HeroinER admission 42.21% 61.66% 50.84% 45.03% 53.35%Length of Stay (first admission) 4.46 6.24 6.75 6.18 6.75Age of Patient 50.69 47.83 37.31 32.50 41.25Insurance Medicare 33.27% 26.76% 16.83% 12.44% 17.42% HMO 22.30% 16.80% 11.03% 14.72% 10.99% Medi-Cal 20.24% 18.51% 29.00% 30.48% 27.37% PPO 10.31% 7.92% 5.04% 6.58% 6.98% Private 4.90% 5.51% 5.43% 6.19% 4.04%Injury due to external causes 10.98% 18.13% 14.01% 15.18% 13.13%Cash Aid Welfare 9.07% 4.08% 7.96% 13.42% 5.78% SSI Disability 9.26% 19.12% 28.13% 19.64% 27.28%Hospital Charges $17,244 $18,123 $13,790 $13,568 $15,924Died first admission 2.26% 2.92% 1.07% 0.86% 1.70%Total admissions 18,484,469 773,279 157,150 117,158 181,106
Table 1: Demographics by Type of Drug Mentioned on Admission Record
Notes: records are included in the tables above if the drug is the primary cause of admission or if it is included as one of the other ICD-9 CM codes.
Summary Statistics
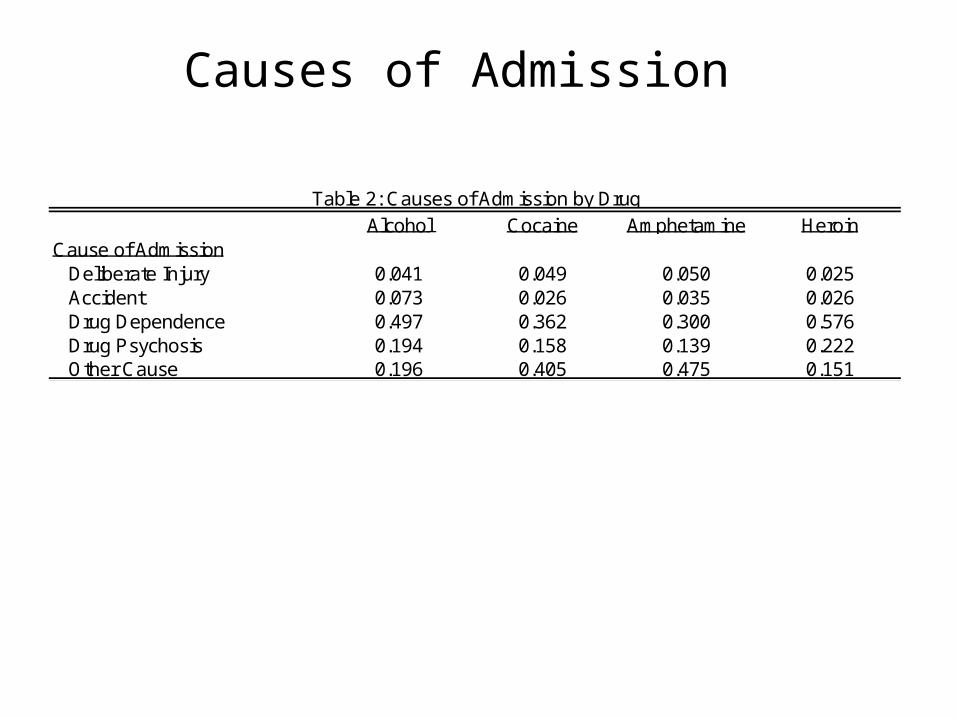
Alcohol Cocaine Amphetamine HeroinCause of Admission Deliberate Injury 0.041 0.049 0.050 0.025 Accident 0.073 0.026 0.035 0.026 Drug Dependence 0.497 0.362 0.300 0.576 Drug Psychosis 0.194 0.158 0.139 0.222 Other Cause 0.196 0.405 0.475 0.151
Table 2: Causes of Admission by Drug
Causes of Admission

Figure 6: Hospital Admissions With a Mention of Alcohol by Program
0
1,000
2,000
3,000
4,000
5,000
6,000
1 2 3 4 5 6 7 8 9 10 11 12 13 14 15 16 17 18 19 20 21 22 23 24 25 26 27 28
Day of Admission
SS
I and
Wel
fare
0
5,000
10,000
15,000
20,000
25,000
Non
Wel
fare
non
SS
I
Welfare
SSI
Not on SSI or Welfare
Monthly Alcohol Cycle for Welfare, SSI

Figure 7: Hospital Admissions by Insurance Type With a Mention of Alcohol for People Receiving Neither Welfare nor SSI
0
1,000
2,000
3,000
4,000
5,000
6,000
7,000
8,000
1 2 3 4 5 6 7 8 9 10 11 12 13 14 15 16 17 18 19 20 21 22 23 24 25 26 27 28
Day of Admission
Sef
l Pay
, Med
icar
e, P
rivat
e
0
500
1,000
1,500
2,000
2,500
Med
i-Cal
, Cou
nty
Indi
gent
Private
Self Pay
Medicare
County Indigent
Medi-Cal
Monthly Alcohol Cycle for Non-Welfare, Non-SSI

Figure 9: Proportion of Patients Not Receiving Welfare or SSI With Cocaine, Heroin or Amphetamine Admission Leaving the Hospital For Home
0
0.02
0.04
0.06
0.08
0.1
0.12
0.14
0.16
1 2 3 4 5 6 7 8 9 10 11 12 13 14 15 16 17 18 19 20 21 22 23 24 25 26 27 28 29 30 31
Day of Discharge
Pro
port
ion
of P
atie
nts
Exi
ting
Hos
pita
l
Medicare
Medi-Cal
Self Pay
Private
County Indigent
Exit Rates for non-Welfare, non-SSI Drug Admits

Figure 16: Counts of Recipients of SSI and Welfare
0
100,000
200,000
300,000
400,000
500,000
600,000
700,000
800,000
900,000
1992
-10
1993
-04
1993
-10
1994
-04
1994
-10
1995
-04
1995
-10
1996
-04
1996
-10
1997
-04
1997
-10
1998
-04
1998
-10
1999
-04
1999
-10
2000
-04
2000
-10
2001
-04
2001
-10
2002
-04
2002
-10
2003
-04
2003
-10
2004
-04
2004
-10
Month
SS
I Age
d, B
lind
and
Dis
able
d
0
500,000
1,000,000
1,500,000
2,000,000
2,500,000
3,000,000
Wel
fare
SSI Aged
SSI Blind
SSI Disability
Welfare
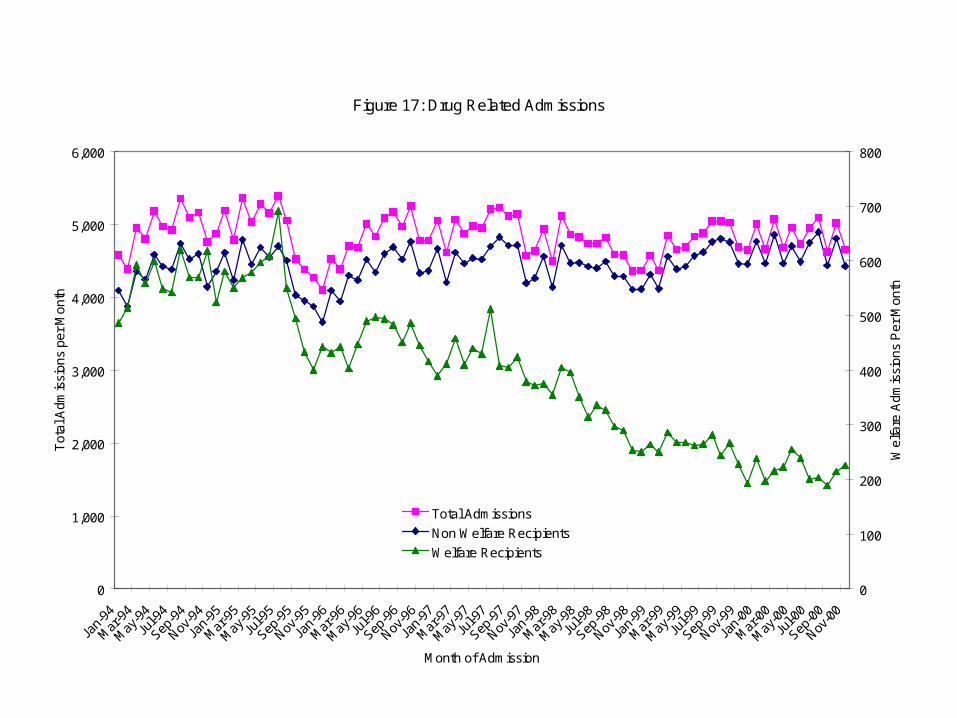
Figure 17: Drug Related Admissions
0
1,000
2,000
3,000
4,000
5,000
6,000
Jan-
94
Mar
-94
May
-94
Jul-9
4
Sep-9
4
Nov-9
4
Jan-
95
Mar
-95
May
-95
Jul-9
5
Sep-9
5
Nov-9
5
Jan-
96
Mar
-96
May
-96
Jul-9
6
Sep-9
6
Nov-9
6
Jan-
97
Mar
-97
May
-97
Jul-9
7
Sep-9
7
Nov-9
7
Jan-
98
Mar
-98
May
-98
Jul-9
8
Sep-9
8
Nov-9
8
Jan-
99
Mar
-99
May
-99
Jul-9
9
Sep-9
9
Nov-9
9
Jan-
00
Mar
-00
May
-00
Jul-0
0
Sep-0
0
Nov-0
0
Month of Admission
Tot
al A
dmis
sion
s pe
r M
onth
0
100
200
300
400
500
600
700
800
Wel
fare
Adm
issi
ons
Per
Mon
th
Total Admissions
Non Welfare Recipients
Welfare Recipients

Figure 18: Alcohol Related Admissions
0
2,000
4,000
6,000
8,000
10,000
12,000
Jan-
94
Mar
-94
May
-94
Jul-9
4
Sep-9
4
Nov-9
4
Jan-
95
Mar
-95
May
-95
Jul-9
5
Sep-9
5
Nov-9
5
Jan-
96
Mar
-96
May
-96
Jul-9
6
Sep-9
6
Nov-9
6
Jan-
97
Mar
-97
May
-97
Jul-9
7
Sep-9
7
Nov-9
7
Jan-
98
Mar
-98
May
-98
Jul-9
8
Sep-9
8
Nov-9
8
Jan-
99
Mar
-99
May
-99
Jul-9
9
Sep-9
9
Nov-9
9
Jan-
00
Mar
-00
May
-00
Jul-0
0
Sep-0
0
Nov-0
0
Month of Admission
Tot
al A
dmis
sion
s pe
r M
onth
0
50
100
150
200
250
300
350
Wel
fare
Adm
issi
ons
Per
Mon
th
Total Admissions
Non Welfare Recipients
Welfare Recipients

Basic Demographics of CA in 1996
Source: Urban Institute, 1998

Figure 11: Proportion of Patients Not Receiving Welfare or SSI With Cocaine, Heroin or Amphetamine Admission Leaving the Hospital For Home Against Medical Advice
0
0.005
0.01
0.015
0.02
0.025
1 2 3 4 5 6 7 8 9 10 11 12 13 14 15 16 17 18 19 20 21 22 23 24 25 26 27 28 29 30 31
Day of Discharge
Pro
port
ion
of P
atie
nts
Exi
ting
Hos
pita
l Aga
inst
Med
ical
Adv
ice
Medicare
Medi-Cal
Self Pay
Private
County Indigent
AMA Exit Rates for non-Welfare, non-SSI Drug Admits

Figure 13: Admissions with Alcohol Mention Welfare Recipients in Los Angeles County Pre vs Post Shift from Day 1 to Days 1-10 Disbursement
0.41
0.91
1.41
1.91
2.41
2.91
3.41
3.91
4.41
1 2 3 4 5 6 7 8 9 10 11 12 13 14 15 16 17 18 19 20 21 22 23 24 25 26 27 28 29 30 31
Day of Month
Mea
n A
dmis
sio
ns D
ay
1
0
0.5
1
1.5
2
2.5
3
3.5
4
Mea
n A
dmis
sio
ns D
ays
1-1
0
Day 1
Days 1-10
Poly. (Day 1)
Poly. (Days 1-10)
LA County Alcohol Admits for Welfare

Causes of Monthly Drug Cycles Are Unknown
• “Fat wallets” early in the month could have a number of causes– Monthly pay checks (but not bi-weekly)– Federal transfers (SSI, SSDI)– State transfers (AFDC/TANF, Food Stamps, UI)– Local transfers (General Relief)
• Specific early month holidays?– New Year’s or July 4th
• Supply side causes?