Case Study of Using Life Cycle Impact Assessment in ...
8
Abstract—Environmental impact assessment (EIA) and strategic environmental assessment (SEA) are procedural tools for environmental management that identify, predict, evaluate and mitigate the environmental impact of development proposals or policies. Life cycle impact assessment (LCIA) is a common analytical tool for environmental management. The use of the LCIA for the preparation of EIA and SEA reports clearly shows the causal linkage for hazard–pathway–receptor–damage and better determines the significance of the impact. Firstly, the use of the LCIA for EIA and SEA is studies. Eco-indicator 99, IMPACT 2002+ and ReCiPe are the LCIA tools used in this study. Finally, a Taiwanese naphtha cracking plant is used as the example for an EIA and the Taiwanese solid waste policy as the case study for a SEA, in order to demonstrate the use of the proposed methodology. Index Terms—Environmental impact assessment, strategic environmental assessment, life cycle impact assessment. I. INTRODUCTION An environmental impact assessment (EIA) is an environmental management plan for which scientific, objective and comprehensive surveys, forecasting, analysis and evaluations are conducted prior to project implementation, in order to determine the degree and scope of the potential impact of development activity or government policy on the environment, society, economy, culture and ecology of an area, and the public explanation and review of the plan. In Taiwan, development projects for which there is concern of an adverse impact on the environment must submit an environmental impact statement for the phase-I EIA and forward this environmental impact statement to a competent authority, for review. The developer must produce an environmental impact assessment report for the phase-II EIA, for those circumstances in which the result of the review of the environmental impact statement show concerns for a significant impact on the environment. The results of the review of environmental impact statements or environmental impact assessment reports are classified into three categories: Conditional approval, phase-II EIA, or rejection of the development plan [1]. In Taiwan, environmental impact statements and environmental impact assessment reports must evaluate the impact on the following environmental aspects: Manuscript received November 15, 2014; revised January 13, 2015. K. F. R. Liu, S. Y. Chiu and P. C. Yeh are with the Department of Safety, Health and Environmental Engineering, Ming Chi University of Technology, New Taipei City, Taiwan 24301, ROC (e-mail: [email protected]). J. Y. Kuo is with the Department of Science and Information Engineering, National Taipei University of Technology, Taipei, Taiwan 10608, ROC (e-mail: [email protected]). 1) Physical and chemical environment Topography, geology and soil Water Climate and air quality Noise Vibration Odor Waste Excavation Coverage Energy Radiation 2) Ecology Terrestrial Aquatic Endangered species Ecosystems 3) Landscape & Recreation Scenic beauty Recreation 4) Society & Economy Land Use Social environment Transportation Economic welfare Social relationships 5) Culture Educational, scientific Historic, monumental Cultural A strategic environmental assessment (SEA) is a systematic process for evaluating the environmental consequences of proposed policies, plans or programs of initiatives, in order to ensure they are fully included and appropriately addressed at the earliest appropriate stage of decision making and are given a similar level of importance to economic and social considerations [2]. In Taiwan, the SEA and EIA procedures are very similar. However, the impact considered in SEA reports is more extensive, as follows: 1) Assimilative capacity of the environment Air Water Soil Waste Noise Non-ionizing radiation 2) Natural ecology and landscape Terrestrial ecosystems Aquatic ecosystems Ecology of the landscape & habitat Case Study of Using Life Cycle Impact Assessment in Environmental Impact Assessment Kevin Fong-Rey Liu, Si-Yu Chiu, Po-Chung Yeh, and Jong-Yih Kuo International Journal of Environmental Science and Development, Vol. 6, No. 11, November 2015 849 DOI: 10.7763/IJESD.2015.V6.711
Transcript of Case Study of Using Life Cycle Impact Assessment in ...

Abstract—Environmental impact assessment (EIA) and
strategic environmental assessment (SEA) are procedural tools
for environmental management that identify, predict, evaluate
and mitigate the environmental impact of development
proposals or policies. Life cycle impact assessment (LCIA) is a
common analytical tool for environmental management. The
use of the LCIA for the preparation of EIA and SEA reports
clearly shows the causal linkage for
hazard–pathway–receptor–damage and better determines the
significance of the impact. Firstly, the use of the LCIA for EIA
and SEA is studies. Eco-indicator 99, IMPACT 2002+ and
ReCiPe are the LCIA tools used in this study. Finally, a
Taiwanese naphtha cracking plant is used as the example for an
EIA and the Taiwanese solid waste policy as the case study for a
SEA, in order to demonstrate the use of the proposed
methodology.
Index Terms—Environmental impact assessment, strategic
environmental assessment, life cycle impact assessment.
I. INTRODUCTION
An environmental impact assessment (EIA) is an
environmental management plan for which scientific,
objective and comprehensive surveys, forecasting, analysis
and evaluations are conducted prior to project
implementation, in order to determine the degree and scope
of the potential impact of development activity or
government policy on the environment, society, economy,
culture and ecology of an area, and the public explanation and
review of the plan. In Taiwan, development projects for
which there is concern of an adverse impact on the
environment must submit an environmental impact statement
for the phase-I EIA and forward this environmental impact
statement to a competent authority, for review. The developer
must produce an environmental impact assessment report for
the phase-II EIA, for those circumstances in which the result
of the review of the environmental impact statement show
concerns for a significant impact on the environment. The
results of the review of environmental impact statements or
environmental impact assessment reports are classified into
three categories: Conditional approval, phase-II EIA, or
rejection of the development plan [1].
In Taiwan, environmental impact statements and
environmental impact assessment reports must evaluate the
impact on the following environmental aspects:
Manuscript received November 15, 2014; revised January 13, 2015. K. F. R. Liu, S. Y. Chiu and P. C. Yeh are with the Department of Safety,
Health and Environmental Engineering, Ming Chi University of
Technology, New Taipei City, Taiwan 24301, ROC (e-mail: [email protected]).
J. Y. Kuo is with the Department of Science and Information Engineering,
National Taipei University of Technology, Taipei, Taiwan 10608, ROC
(e-mail: [email protected]).
1) Physical and chemical environment
Topography, geology and soil
Water
Climate and air quality
Noise
Vibration
Odor
Waste
Excavation
Coverage
Energy
Radiation
2) Ecology
Terrestrial
Aquatic
Endangered species
Ecosystems
3) Landscape & Recreation
Scenic beauty
Recreation
4) Society & Economy
Land Use
Social environment
Transportation
Economic welfare
Social relationships
5) Culture
Educational, scientific
Historic, monumental
Cultural
A strategic environmental assessment (SEA) is a
systematic process for evaluating the environmental
consequences of proposed policies, plans or programs of
initiatives, in order to ensure they are fully included and
appropriately addressed at the earliest appropriate stage of
decision making and are given a similar level of importance
to economic and social considerations [2].
In Taiwan, the SEA and EIA procedures are very similar.
However, the impact considered in SEA reports is more
extensive, as follows:
1) Assimilative capacity of the environment
Air
Water
Soil
Waste
Noise
Non-ionizing radiation
2) Natural ecology and landscape
Terrestrial ecosystems
Aquatic ecosystems
Ecology of the landscape & habitat
Case Study of Using Life Cycle Impact Assessment
in Environmental Impact Assessment
Kevin Fong-Rey Liu, Si-Yu Chiu, Po-Chung Yeh, and Jong-Yih Kuo
International Journal of Environmental Science and Development, Vol. 6, No. 11, November 2015
849DOI: 10.7763/IJESD.2015.V6.711
3) Human Health and Safety
Toxic or harmful substances
Risk of ionizing radiation
Risk of chemical substances
4) Land resource
Characteristics of land resources
Mineral resource & debris
Land use
Landscape
5) Water resources
Distribution of water use
Water crowding effect
Water resources
6) Cultural assets
7) International environmental regulations as defined by
the following:
The Montreal Protocol
The Framework Convention on Climate Change
The Basel Convention
The Washington Convention
The Convention on Biological Diversity
The Ramsar Convention on Wetlands
The Stockholm Convention
The Rotterdam Convention
8) Society & Economy
Population & Industry
Transportation
Energy use
Economic benefits
Public facilities & community development
Public opinion & social acceptance
EIAs and SEAs are procedural tools for environmental
management that identify, predict, evaluate and mitigate the
environmental impact of development proposals or policies.
Many analytical tools improve the analysis of environmental
impact in EIA or SEA reports, such as a life cycle assessment
(LCA). A life cycle impact assessment (LCIA) is one of steps
in a LCA that takes account of the causal relationships
between environmental hazards and damage. Using a LCIA
to produce EIA and SEA reports extends the focus of the
reports from regulatory compliance for environmental
impact, to determining the significance of the environmental
impact [3].
II. METHODS AND MATERIALS
A. Life Cycle Impact Assessment
A life-cycle assessment assesses the environmental impact
that is associated with all of the stages of a product's life,
from raw material extraction through material processing,
manufacture, distribution, use, repair and maintenance, and
disposal or recycling. According to the ISO 14040 [4] and
14044 [5] standards, a Life Cycle Assessment has four
distinct phases. The first phase is the 'Goal and scope', which
requires an explicit statement of the goal and scope of the
study. It establishes the context of the study and explains how
and to whom the results are to be communicated. The second
phase is a ‘Life cycle inventory (LCI)’, which involves the
creation of an inventory of the flows from and to nature for a
product system. Inventory flows include inputs of water,
energy and raw materials, and releases to air, land and water.
The third phase is a ‘Life cycle impact assessment (LCIA)’,
which evaluates the significance of any potential
environmental impact, based on the results for the LCI flow.
A classical LCIA involves selection of the following
mandatory elements: impact categories, category indicators
and characterization models. In the classification stage, the
inventory parameters are categorized and assigned to specific
impact categories. In the impact measurement stage, the
categorized LCI flows are characterized into common
equivalence units, using one of many possible LCIA
methodologies. These are then summed to provide a total
overall impact. The last phase is ‘Interpretation’, which is a
systematic technique that identifies, quantifies, checks and
evaluates information from the results of the life cycle
inventory and/or the life cycle impact assessment. The results
of the inventory analysis and the impact assessment are
summarized during the interpretation phase.
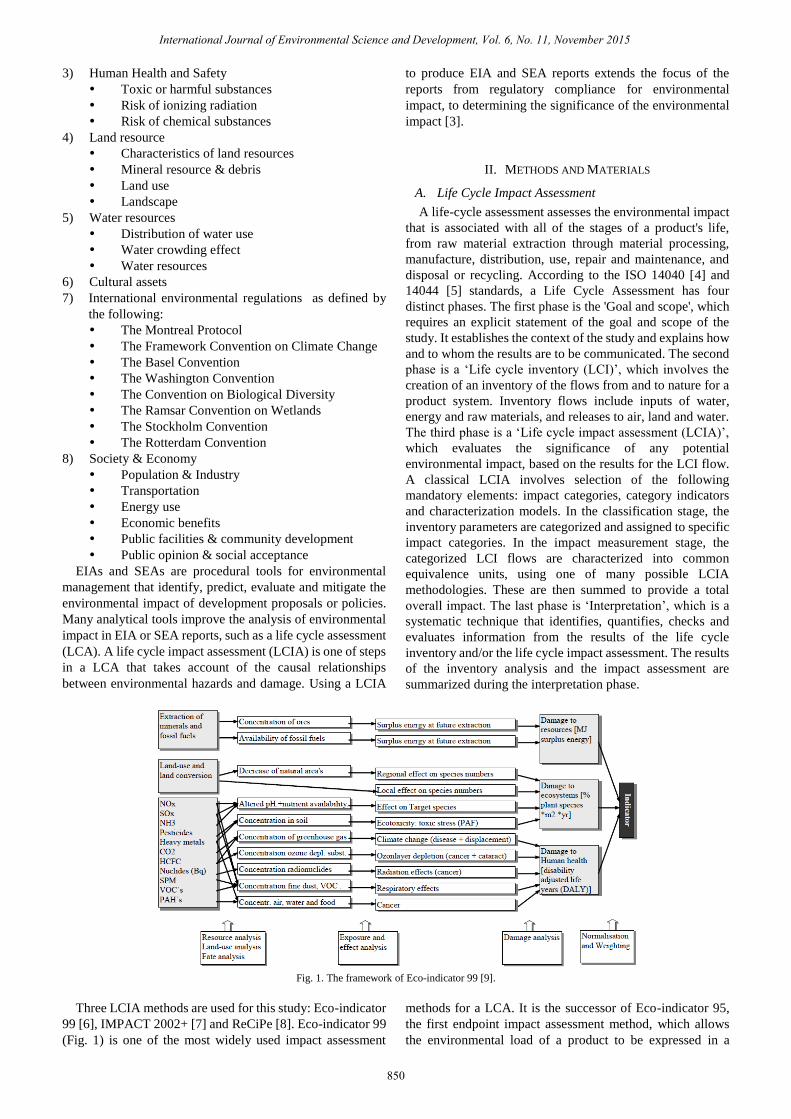
Fig. 1. The framework of Eco-indicator 99 [9].
Three LCIA methods are used for this study: Eco-indicator
99 [6], IMPACT 2002+ [7] and ReCiPe [8]. Eco-indicator 99
(Fig. 1) is one of the most widely used impact assessment
methods for a LCA. It is the successor of Eco-indicator 95,
the first endpoint impact assessment method, which allows
the environmental load of a product to be expressed in a
International Journal of Environmental Science and Development, Vol. 6, No. 11, November 2015
850

single score. The Life Cycle Impact Assessment
methodology, IMPACT 2002+ (Fig. 2), suggests a feasible
implementation of a combined midpoint/damage approach.
These combinations link all types of Life Cycle Inventory
(LCI) results, the elementary flows and other interventions,
throughout the 14 midpoint categories, which are summed
into four damage categories. ReCiPe (Fig. 3) is a fusion of
these two methodologies, taking the midpoint indicators from
CML and the endpoint indicators from Ecoindicator.
Fig. 2. The framework of IMPACT 2002+ [7].
Fig. 3. The framework of ReCiPe [9].
B. Case Study (1)
Fig. 4. The case study (1): A naphtha cracking plant in Taiwan.
TABLE I: THE INVENTORY DATA FOR CASE STUDY (1)
Category Inventory Item BE AE Unit
Resource Water 1.261E+02 1.736E+02 Mton
Air Total Suspended Particulate(TSP) 3.340E+00 4.320E+00 kton
particulate matter (PM10) 1.690E+00 2.160E+00 kton
Sulfur oxide(SOx) 1.600E+01 1.979E+01 kton
Nitrogen oxide(NOx) 1.962E+01 2.388E+01 kton
Volatile organic
compounds(VOCs) 4.300E+00 5.390E+00 kton
Carbon dioxide 6.757E+01 7.815E+01 Mton
Butadiene 1.355E+03 1.723E+03 kg
Benzene 3.969E+02 5.046E+02 kg
Ethylene oxide 2.634E+02 3.349E+02 kg
Formaldehyde 4.006E+02 5.093E+02 kg
Ethene, chloro- 2.799E+02 3.558E+02 kg
Ethene, trichloro- 9.820E+00 1.249E+01 kg
Acetaldehyde 6.256E+01 7.953E+01 kg
Acrylonitrile 6.622E+02 8.418E+02 kg
Methane, tetrachloro-, CFC-10 1.151E+01 1.463E+01 kg
Chloroform 1.340E+00 1.700E+00 kg
Ethyl acrylate 3.750E+01 4.767E+01 kg
Benzene, ethyl- 4.774E+01 6.069E+01 kg
Ethane, 1,2-dichloro- 8.890E+01 1.130E+02 kg
Naphthalene 1.921E+01 2.442E+01 kg
Benzene, 1,4-dichloro- 1.099E+02 1.398E+02 kg
Propylene oxide 4.353E+02 5.535E+02 kg
Styrene 1.247E+03 1.586E+03 kg
Vinyl acetate 8.377E+01 1.065E+02 kg
Acrolein 5.872E+01 7.465E+01 kg
Methane, monochloro-, R-40 1.776E+02 2.258E+02 kg
Methanol 7.024E+02 8.930E+02 kg
Carbon disulfide 1.140E+01 1.449E+01 kg
Hexane 7.280E+02 9.255E+02 kg
t-Butyl methyl ether 5.268E+01 6.697E+01 kg
Xylene 9.603E+02 1.221E+03 kg
Methyl methacrylate 3.073E+02 3.907E+02 kg
Ethane, chloro- 4.792E+01 6.093E+01 kg
Methyl ethyl ketone 1.079E+02 1.372E+02 kg
Toluene 1.310E+02 1.665E+02 kg
Benzene, chloro- 1.010E+02 1.284E+02 kg
Dimethyl formamide 1.530E+00 1.950E+00 kg
Water Wastewater 6.862E+01 1.111E+02 Mton
suspended solids 8.400E-01 1.360E+00 kton
Chloride 1.240E+00 2.000E+00 Mton
Fluoride 8.715E+01 1.412E+02 ton
Sulfate 1.900E-01 3.100E-01 Mton
Sulfide 1.850E+00 3.000E+00 ton
Chlorine 6.180E+00 1.000E+01 ton
Biochemical oxygen demand 3.637E+02 5.891E+02 ton
Chemical oxygen demand 2.240E+00 3.630E+00 kton
Ammonia, as N 1.022E+02 1.656E+02 ton
Nitrate 4.783E+02 7.747E+02 ton
Nitrite 1.320E+00 2.130E+00 kton
Phosphate 6.860E+00 1.111E+01 ton
Phosphorus, TOTAL 1.510E+01 2.445E+01 ton
Oils, unspecified 4.117E+01 6.669E+01 ton
Cyanide 6.200E-01 1.000E+00 ton
Phenols, unspecified 1.240E+00 2.000E+00 ton
Arsenic 1.098E+01 1.778E+01 ton
cadmium 9.600E-01 1.560E+00 ton
Chromium 8.230E+00 1.334E+01 ton
Copper 3.430E+00 5.560E+00 ton
Mercury 7.000E-02 1.100E-01 ton
Nickel 6.180E+00 1.000E+01 ton
Lead 1.304E+01 2.112E+01 ton
Selenium 1.029E+01 1.667E+01 ton
Zinc 1.098E+01 1.778E+01 ton
Iron 6.180E+00 1.000E+01 ton
Manganese 3.430E+00 5.560E+00 ton
Waste Incineration waste in incineration 1.532E+05 1.541E+05 ton
Landfill waste in incineration 5.253E+04 9.009E+04 ton
waste to recycling 1.893E+06 3.910E+06 ton
Sludge 3.095E+05 0.000E+00 ton
Coal ash 1.175E+06 0.000E+00 ton
Note: BE: before the expansion; AE: after the expansion.
The case study is a naphtha cracking plant that is located in
Yunlin County, in Taiwan, as shown in Fig. 4. It is in an
International Journal of Environmental Science and Development, Vol. 6, No. 11, November 2015
851

offshore industrial zone, with a total area of 2,603 hectares.
Currently, as alternative BE (before expansion), 61 factories
have an annual output of 6,221 tons. In response to market
demand, the company proposes an expansion plan
(alternative AE, after expansion) that will increase the
number of factories to 77 and increase production to 8,174
tons per year, which is an increase of 31.4%. However, the
expansion plan will also increase its emissions of TSP from
3,340 to 4,323 tons per year, SO2 from 16,000 to 19,788 tons
per year, NO2 from 19,622 to 23,881 tons per year, VOC
from 4,302 to 5,389 tons per year and waste-water from
188,000 to 304,500 tons per day. Its inventory flows,
including inputs of water, energy and raw materials and
releases to air, land, and water, are detailed in Table I.
C. Case Study (2)
Biomass Energy Center
Fig. 5. The case study (2): 20 biomass energy centers in Taiwan.
TABLE II: THE INVENTORY DATA FOR CASE STUDY (2)
Category Inventory Item Z A B Unit
Products Electricity 1.877E+09 1.708E+09 3.017E+09 kWh
Bio-coal
1.042E+06
ton
Resources Water 2.256E+06 1.615E+06 2.652E+06 m3
Fuels Diesel, at refinery/l/US 2.097E+06 3.606E+08 3.497E+08 L
Electricity Electricity 4.769E+05 2.775E+08 1.252E+09 kWh
Air Sulfur oxides 3.430E+06 6.011E+05 4.591E+05 kg
Nitrogen oxides 6.429E+06 1.213E+06 5.916E+06 kg
TSP 3.834E+06 1.068E+05 1.298E+05 kg
Arsenic 1.130E+02 1.300E+01 4.600E+00 kg
Cadmium 2.930E+01 2.900E+01 2.950E+01 kg
Chromium 2.420E+02 1.360E+02 3.620E+01 kg
Lead 5.410E+02 6.100E+01 9.220E+02 kg
Dioxin,
1,2,3,7,8,9-hexachlorodibenzo- 1.000E-03 6.430E-05 5.120E-04 kg
Carbon monoxide 2.150E+04 1.910E+04 2.910E+04 kg
Carbon dioxide 3.660E+05 3.030E+05 3.410E+05 ton
Water Suspended solids, unspecified
2.910E+04
kg
BOD5, Biological Oxygen
Demand 2.910E+04
kg
COD, Chemical Oxygen
Demand 9.690E+04
kg
Chloride
4.840E+02
kg
Arsenic
4.840E+02
kg
Cadmium
2.910E+01
kg
Chromium
1.940E+03
kg
Lead
9.690E+02
kg
Waste Waste, inorganic
5.893E+04 8.880E+05 ton
Fly ash 2.711E+04
ton
Note: Z: zero alternative; A: alternative (A); B: alternative (B).
In Taiwan, about 3.5 million tons of biomass garbage is
generated each year, with a potential energy of more than 100
tons of natural coal. At present, a total of 24 incineration
plants are in operation and their power generation efficiency
is only 20%, which is much lower than 35% for coal-fired
plants. The current incineration of solid waste is the reference
point, zero alternative (Z). Two policy alternatives, (A) and
(B), are proposed, to improve the efficiency of power
generation and thereby allow the integration of energy and
resource, sustainable recycling, energy saving and carbon
reduction. Alternative (A) transforms the current incineration
plants into 20 biomass energy centers (Fig. 5) by using new
waste and biomass energy utilization technologies.
Alternative (B) transforms the current incineration plants by
integrating refuse derived fuel plants (RDF) and RDF
burning power plants. Their inventory flows, including inputs
of water, energy and raw materials and releases to air, land
and water, are detailed in Table II.
III. RESULTS
A. LCIA for EIA: Case Study (1)
TABLE III: THE USE OF LCIA TOOLS FOR EIA EVALUATION ITEMS
EIA Evaluation Item Eco-indicator99 IMPACT 2002+ ReCiPe
(A) Physical and chemical
Topography, geology &
soil
Acidification/
Eutrophication
Terrestrial
acid/nutri
Terrestrial acidification
Minerals Mineral extraction Metal depletion
Water Acidification/
Eutrophication
Aquatic
acidification
Climate and air quality Ozone layer Ozone layer
depletion
Ozone depletion
Respiratory organics Respiratory
organics
Photochemical oxidant
formation
Respiratory inorganics Respiratory
inorganics
Particulate matter formation
Climate change Global warming Climate change Human Health
Noise
Vibration
Odor
Waste
Excavation
Coverage
Energy Fossil fuels Non-renewable
energy
Fossil depletion
Radiation Radiation Ionizing radiation Ionising radiation
(B) Ecology Climate change Ecosystems
Terrestrial Ecotoxicity Terrestrial
ecotoxicity
Terrestrial ecotoxicity
Aquatic Ecotoxicity Aquatic
ecotoxicity
Freshwater ecotoxicity
Endangered
Ecosystem Acidification/
Eutrophication
Aquatic
eutrophication
Freshwater eutrophication
(C) Landscape &
Recreation
Scenic beauty
Recreation
(D) Society & Economy
Land Use Land use Land occupation Urban land occupation
Agricultural land occupation
Natural land transformation
Social environment
Transportation
Economic level
Social relationships
(E) Culture
Educational, scientific
Historic, monumental
Cultural
Note: Z: zero alternative; A: alternative (A); B: alternative (B).
In Taiwan, evaluation items for an EIA are: (1) physical
and chemical, including topography-geology-soil, water,
climate and air quality, noise, vibration, odor, waste,
excavation, coverage, energy and radiation; (2) ecology,
including terrestrial, aquatic, endangered and ecosystem; (3)
landscape & recreation, including scenic beauty and
recreation; (4) society & economy, including land use, social
environment, transportation, economic level and social
International Journal of Environmental Science and Development, Vol. 6, No. 11, November 2015
852
relationships; (5) culture, including educational, scientific,
historic, monumental and cultural. Table III summarizes the
use of the three LCIA methods, Eco-indicator 99, IMPACT
2002+ and ReCiPe, to assess evaluation items in the EIA.
Some items are not evaluated by the three LCIA methods
such as noise, vibration, odor, waste, excavation, coverage,
endangered, scenic beauty, recreation, social environment,
transportation, economic level, social relationships,
educational, scientific, historic, monumental and cultural.
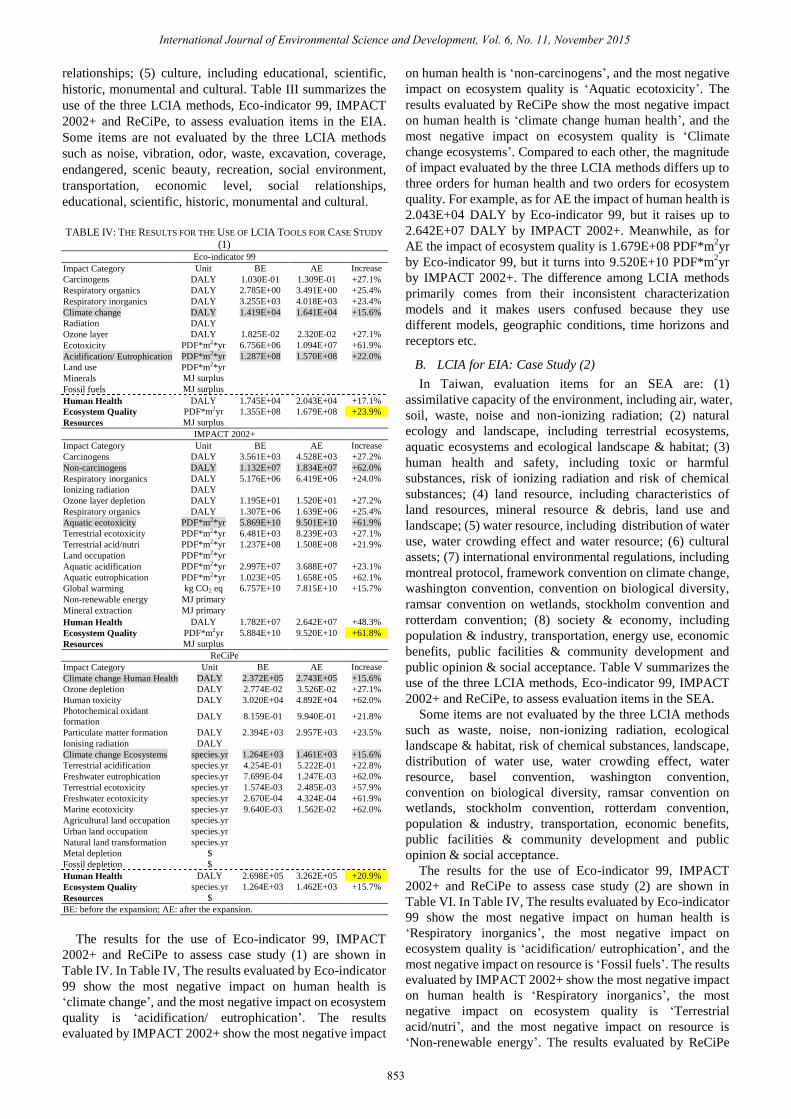
TABLE IV: THE RESULTS FOR THE USE OF LCIA TOOLS FOR CASE STUDY
(1) Eco-indicator 99
Impact Category Unit BE AE Increase
Carcinogens DALY 1.030E-01 1.309E-01 +27.1%
Respiratory organics DALY 2.785E+00 3.491E+00 +25.4%
Respiratory inorganics DALY 3.255E+03 4.018E+03 +23.4%
Climate change DALY 1.419E+04 1.641E+04 +15.6%
Radiation DALY
Ozone layer DALY 1.825E-02 2.320E-02 +27.1%
Ecotoxicity PDF*m2*yr 6.756E+06 1.094E+07 +61.9%
Acidification/ Eutrophication PDF*m2*yr 1.287E+08 1.570E+08 +22.0%
Land use PDF*m2*yr
Minerals MJ surplus
Fossil fuels MJ surplus
Human Health DALY 1.745E+04 2.043E+04 +17.1%
Ecosystem Quality PDF*m2yr 1.355E+08 1.679E+08 +23.9%
Resources MJ surplus
IMPACT 2002+
Impact Category Unit BE AE Increase
Carcinogens DALY 3.561E+03 4.528E+03 +27.2%
Non-carcinogens DALY 1.132E+07 1.834E+07 +62.0%
Respiratory inorganics DALY 5.176E+06 6.419E+06 +24.0%
Ionizing radiation DALY
Ozone layer depletion DALY 1.195E+01 1.520E+01 +27.2%
Respiratory organics DALY 1.307E+06 1.639E+06 +25.4%
Aquatic ecotoxicity PDF*m2*yr 5.869E+10 9.501E+10 +61.9%
Terrestrial ecotoxicity PDF*m2*yr 6.481E+03 8.239E+03 +27.1%
Terrestrial acid/nutri PDF*m2*yr 1.237E+08 1.508E+08 +21.9%
Land occupation PDF*m2*yr
Aquatic acidification PDF*m2*yr 2.997E+07 3.688E+07 +23.1%
Aquatic eutrophication PDF*m2*yr 1.023E+05 1.658E+05 +62.1%
Global warming kg CO2 eq 6.757E+10 7.815E+10 +15.7%
Non-renewable energy MJ primary
Mineral extraction MJ primary
Human Health DALY 1.782E+07 2.642E+07 +48.3%
Ecosystem Quality PDF*m2yr 5.884E+10 9.520E+10 +61.8%
Resources MJ surplus
ReCiPe
Impact Category Unit BE AE Increase
Climate change Human Health DALY 2.372E+05 2.743E+05 +15.6%
Ozone depletion DALY 2.774E-02 3.526E-02 +27.1%
Human toxicity DALY 3.020E+04 4.892E+04 +62.0%
Photochemical oxidant
formation DALY 8.159E-01 9.940E-01 +21.8%
Particulate matter formation DALY 2.394E+03 2.957E+03 +23.5%
Ionising radiation DALY
Climate change Ecosystems species.yr 1.264E+03 1.461E+03 +15.6%
Terrestrial acidification species.yr 4.254E-01 5.222E-01 +22.8%
Freshwater eutrophication species.yr 7.699E-04 1.247E-03 +62.0%
Terrestrial ecotoxicity species.yr 1.574E-03 2.485E-03 +57.9%
Freshwater ecotoxicity species.yr 2.670E-04 4.324E-04 +61.9%
Marine ecotoxicity species.yr 9.640E-03 1.562E-02 +62.0%
Agricultural land occupation species.yr
Urban land occupation species.yr
Natural land transformation species.yr
Metal depletion $
Fossil depletion $
Human Health DALY 2.698E+05 3.262E+05 +20.9%
Ecosystem Quality species.yr 1.264E+03 1.462E+03 +15.7%
Resources $
BE: before the expansion; AE: after the expansion.
The results for the use of Eco-indicator 99, IMPACT
2002+ and ReCiPe to assess case study (1) are shown in
Table IV. In Table IV, The results evaluated by Eco-indicator
99 show the most negative impact on human health is
‘climate change’, and the most negative impact on ecosystem
quality is ‘acidification/ eutrophication’. The results
evaluated by IMPACT 2002+ show the most negative impact
on human health is ‘non-carcinogens’, and the most negative
impact on ecosystem quality is ‘Aquatic ecotoxicity’. The
results evaluated by ReCiPe show the most negative impact
on human health is ‘climate change human health’, and the
most negative impact on ecosystem quality is ‘Climate
change ecosystems’. Compared to each other, the magnitude
of impact evaluated by the three LCIA methods differs up to
three orders for human health and two orders for ecosystem
quality. For example, as for AE the impact of human health is
2.043E+04 DALY by Eco-indicator 99, but it raises up to
2.642E+07 DALY by IMPACT 2002+. Meanwhile, as for
AE the impact of ecosystem quality is 1.679E+08 PDF*m2yr
by Eco-indicator 99, but it turns into 9.520E+10 PDF*m2yr
by IMPACT 2002+. The difference among LCIA methods
primarily comes from their inconsistent characterization
models and it makes users confused because they use
different models, geographic conditions, time horizons and
receptors etc.
B. LCIA for EIA: Case Study (2)
In Taiwan, evaluation items for an SEA are: (1)
assimilative capacity of the environment, including air, water,
soil, waste, noise and non-ionizing radiation; (2) natural
ecology and landscape, including terrestrial ecosystems,
aquatic ecosystems and ecological landscape & habitat; (3)
human health and safety, including toxic or harmful
substances, risk of ionizing radiation and risk of chemical
substances; (4) land resource, including characteristics of
land resources, mineral resource & debris, land use and
landscape; (5) water resource, including distribution of water
use, water crowding effect and water resource; (6) cultural
assets; (7) international environmental regulations, including
montreal protocol, framework convention on climate change,
washington convention, convention on biological diversity,
ramsar convention on wetlands, stockholm convention and
rotterdam convention; (8) society & economy, including
population & industry, transportation, energy use, economic
benefits, public facilities & community development and
public opinion & social acceptance. Table V summarizes the
use of the three LCIA methods, Eco-indicator 99, IMPACT
2002+ and ReCiPe, to assess evaluation items in the SEA.
Some items are not evaluated by the three LCIA methods
such as waste, noise, non-ionizing radiation, ecological
landscape & habitat, risk of chemical substances, landscape,
distribution of water use, water crowding effect, water
resource, basel convention, washington convention,
convention on biological diversity, ramsar convention on
wetlands, stockholm convention, rotterdam convention,
population & industry, transportation, economic benefits,
public facilities & community development and public
opinion & social acceptance.
The results for the use of Eco-indicator 99, IMPACT
2002+ and ReCiPe to assess case study (2) are shown in
Table VI. In Table IV, The results evaluated by Eco-indicator
99 show the most negative impact on human health is
‘Respiratory inorganics’, the most negative impact on
ecosystem quality is ‘acidification/ eutrophication’, and the
most negative impact on resource is ‘Fossil fuels’. The results
evaluated by IMPACT 2002+ show the most negative impact
on human health is ‘Respiratory inorganics’, the most
negative impact on ecosystem quality is ‘Terrestrial
acid/nutri’, and the most negative impact on resource is
‘Non-renewable energy’. The results evaluated by ReCiPe
International Journal of Environmental Science and Development, Vol. 6, No. 11, November 2015
853

show the most negative impact on human health is ‘Human
toxicity’, and the most negative impact on ecosystem quality
is ‘Terrestrial acidification’. Compared to each other, the
magnitude of impact evaluated by the three LCIA methods
differs up to three orders for human health, eight orders for
ecosystem quality and one order for resource. For example,
as for A the impact of human health is 8.575E+01 DALY by
IMPACT 2002+, but it raises up to 1.404E+04 DALY by
ReCiPe. Meanwhile, as for A the impact of ecosystem quality
is -3.139E+00 PDF*m2yr by ReCiPe, but it turns into
-5.161E+08 PDF*m2yr by IMPACT 2002+. The impact of
resource is -1.331E+09 MJ surplus by Eco-indicator 99, but it
turns into -2.042E+10 MJ surplus by IMPACT 2002+. The
difference among LCIA methods primarily comes from their
inconsistent characterization models and it makes users
confused because they use different models, geographic
conditions, time horizons and receptors etc.
TABLE V: THE USE OF LCIA METHODS FOR SEA EVALUATION ITEMS
SEA Evaluation Item Eco-indicator99 IMPACT 2002+ ReCiPe
(A) Assimilative capacity
of the environment
Air Climate change Global warming Climate change
Human Health
Ozone layer Ozone layer
depletion
Ozone depletion
Photochemical
oxidant
formation
Particulate matter
formation
Water Acidification/
Eutrophication
Aquatic acidification
Aquatic
eutrophication
Freshwater
eutrophication
Soil Acidification/
Eutrophication
Terrestrial acid/nutri Terrestrial
acidification
Waste
Noise
Non-ionizing radiation
(B) Natural ecology and
landscape
Ecotoxicity Terrestrial
ecotoxicity
Terrestrial
ecotoxicity
Terrestrial ecosystems Climate change
Ecosystems
Ecotoxicity Aquatic ecotoxicity Freshwater
ecotoxicity
Aquatic ecosystems Marine
ecotoxicity
Ecological landscape
& habitat
(C) Human Health and
Safety
Carcinogens Carcinogens Human toxicity
Toxic or harmful
substances
Non-carcinogens
Respiratory
organics
Respiratory organics
Respiratory
inorganics
Respiratory
inorganics
Risk of ionizing
radiation
Radiation Ionizing radiation Ionising radiation
Risk of chemical
substances
(D) Land resource Land use Land occupation Agricultural land
occupation
Characteristics of land
resources
Urban land
occupation
Natural land
transformation
Mineral resource &
debris
Minerals Mineral extraction Metal depletion
Land use Land use Land occupation Agricultural land
occupation
Landscape
(E) Water resource
9) Distribution of water
use
10) Water crowding effect
11) Water resource
(F) Cultural assets
(G) International
environmental regulations
Ozone layer Ozone layer
depletion
Ozone depletion
Montreal Protocol Climate change Global warming Climate change
Human Health
Framework
Convention on Climate
Change
Climate change
Ecosystems
Basel Convention
Washington
Convention
Convention on
Biological Diversity
Ramsar Convention on
Wetlands
Stockholm
Convention
Rotterdam Convention
(H) Society & Economy
Population & Industry
Transportation
Energy use Fossil fuels Non-renewable
energy
Fossil depletion
Economic benefits
Public facilities &
community development
Public opinion &
social acceptance
IV. DISCUSSION AND CONCLUSION
TABLE VI: THE RESULTS FOR THE USE OF LCIA TOOLS FOR CASE STUDY
(2)
Eco-indicator 99
Impact Category Unit Z A B
Carcinogens DALY 5.192E+00 -3.504E+02 2.845E+01
Respiratory organics DALY -7.221E-02 5.937E-01 8.646E-01
Respiratory inorganics DALY 6.606E+02 1.668E+02 6.427E+02
Climate change DALY -4.950E+01 -6.602E+01 -1.425E+01
Radiation DALY -7.322E-02 -1.879E+00 -6.885E-02
Ozone layer DALY -2.943E-03 -6.816E-02 -2.726E-03
Ecotoxicity PDF*m2yr 1.902E+06 -8.061E+06 2.927E+06
Acidification/
Eutrophication PDF*m2yr 3.685E+07 9.063E+06 3.802E+07
Land use PDF*m2yr 0.000E+00 -9.779E+06 0.000E+00
Minerals MJ surplus -2.318E+05 -9.950E+05 -2.179E+05
Fossil fuels MJ surplus -4.512E+08 -1.330E+09 8.387E+08
Human Health DALY 6.161E+02 -2.510E+02 6.577E+02
Ecosystem Quality PDF*m2yr 3.876E+07 -8.777E+06 4.094E+07
Resources MJ surplus -4.514E+08 -1.331E+09 8.385E+08
IMPACT 2002+
Impact Category Unit Z A B
Carcinogens DALY -2.594E-01 -1.551E+01 3.909E-01
Non-carcinogens DALY 3.108E+00 -2.925E+01 2.135E+02
Respiratory inorganics DALY 1.094E+03 1.643E+02 6.456E+02
Ionizing radiation DALY -7.438E-02 -1.879E+00 -6.995E-02
Ozone layer depletion DALY -3.118E-03 -6.915E-02 -2.885E-03
Respiratory organics DALY -7.221E-02 5.929E-01 8.638E-01
Aquatic ecotoxicity PDF*m2*yr 1.458E+05 -5.026E+08 2.569E+07
Terrestrial ecotoxicity PDF*m2*yr -4.938E+05 -1.273E+07 -4.922E+05
Terrestrial acid/nutri PDF*m2*yr 3.682E+07 9.055E+06 3.798E+07
Land occupation PDF*m2*yr 0.000E+00 -9.779E+06 0.000E+00
Aquatic acidification PDF*m2*yr
Aquatic eutrophication PDF*m2*yr
Global warming kg CO2 eq -2.134E+08 -1.546E+08 -6.672E+07
Non-renewable energy MJ primary -5.769E+09 -2.042E+10 1.076E+10
Mineral extraction MJ primary -2.318E+05 -9.950E+05 -2.179E+05
Human Health DALY 1.052E+03 8.575E+01 8.463E+02
Ecosystem Quality PDF*m2yr 3.647E+07 -5.161E+08 6.318E+07
Resources MJ surplus -5.769E+09 -2.042E+10 1.076E+10
ReCiPe
Impact Category Unit Z A B
Climate change Human
Health DALY -7.517E+02 -5.896E+02 -2.575E+02
Ozone depletion DALY -4.945E-03 -1.626E-01 -4.574E-03
Human toxicity DALY 3.436E+02 1.452E+04 6.755E+04
Photochemical oxidant
formation DALY 2.391E-01 8.751E-02 2.872E-01
Particulate matter
formation DALY 4.748E+02 1.154E+02 4.285E+02
International Journal of Environmental Science and Development, Vol. 6, No. 11, November 2015
854
International Journal of Environmental Science and Development, Vol. 6, No. 11, November 2015
855
Ionising radiation DALY -5.926E-02 -1.478E+00 -5.573E-02
Climate change
Ecosystems species.yr -4.004E+00 -3.138E+00 -1.372E+00
Terrestrial acidification species.yr 1.004E-01 2.784E-02 8.359E-02
Freshwater eutrophication species.yr -7.506E-05 -2.507E-03 -7.059E-05
Terrestrial ecotoxicity species.yr -2.864E-03 -2.441E-02 -1.356E-03
Freshwater ecotoxicity species.yr 5.396E-07 -3.816E-04 1.017E-03
Marine ecotoxicity species.yr 5.518E-05 -8.725E-04 1.794E-02
Agricultural land
occupation species.yr 0.000E+00 0.000E+00 0.000E+00
Urban land occupation species.yr 0.000E+00 0.000E+00 0.000E+00
Natural land
transformation species.yr 0.000E+00 0.000E+00 0.000E+00
Metal depletion $ -4.596E+04 -5.210E+05 -4.323E+04
Fossil depletion $ -2.163E+09 -7.831E+09 4.139E+09
Human Health DALY 6.682E+01 1.404E+04 6.772E+04
Ecosystem Quality species.yr -3.907E+00 -3.139E+00 -1.271E+00
Resources $ -2.163E+09 -7.831E+09 4.139E+09
Note: Z: zero alternative; A: alternative (A); B: alternative (B).
This study demonstrates the use of LCIA to assess impact
in an EIA and a SEA. However, inconsistency in the results
for impact using Eco-indicator 99, IMPACT 2002+ and
ReCiPe arise partially because they use different models,
geographic conditions, time horizons and receptors.
For case study (1), Table IV shows that the rates of
increase in both the quality of the ecosystem and human
health are less than 23.9% if Eco-indicator 99 and ReCiPe are
used, but these values increase to more than 48.3%, if
IMPACT 2002+ is used. The rate of increase in the quality of
the ecosystem is greater than that for human health, if
Eco-indicator 99 and IMPACT 2002+ are used, but the rate is
less if ReCiPe is used.
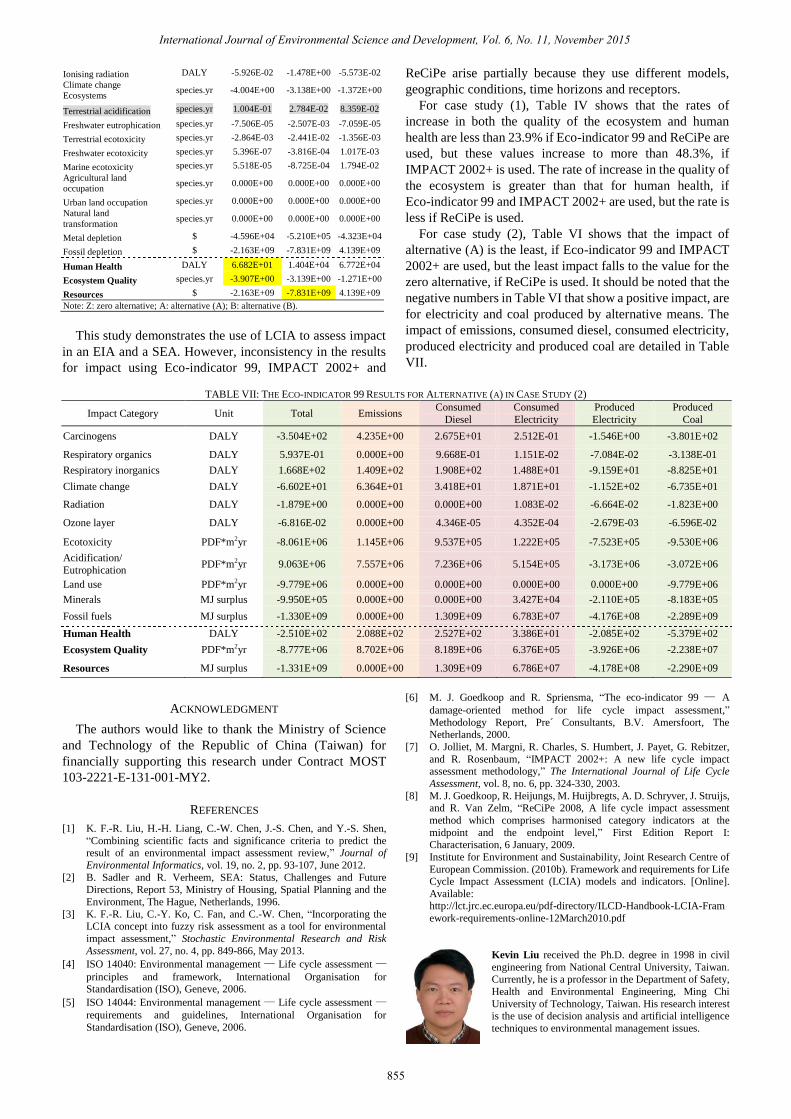
For case study (2), Table VI shows that the impact of
alternative (A) is the least, if Eco-indicator 99 and IMPACT
2002+ are used, but the least impact falls to the value for the
zero alternative, if ReCiPe is used. It should be noted that the
negative numbers in Table VI that show a positive impact, are
for electricity and coal produced by alternative means. The
impact of emissions, consumed diesel, consumed electricity,
produced electricity and produced coal are detailed in Table
VII.
TABLE VII: THE ECO-INDICATOR 99 RESULTS FOR ALTERNATIVE (A) IN CASE STUDY (2)
Impact Category Unit Total Emissions Consumed
Diesel
Consumed
Electricity
Produced
Electricity
Produced
Coal
Carcinogens DALY -3.504E+02 4.235E+00 2.675E+01 2.512E-01 -1.546E+00 -3.801E+02
Respiratory organics DALY 5.937E-01 0.000E+00 9.668E-01 1.151E-02 -7.084E-02 -3.138E-01
Respiratory inorganics DALY 1.668E+02 1.409E+02 1.908E+02 1.488E+01 -9.159E+01 -8.825E+01
Climate change DALY -6.602E+01 6.364E+01 3.418E+01 1.871E+01 -1.152E+02 -6.735E+01
Radiation DALY -1.879E+00 0.000E+00 0.000E+00 1.083E-02 -6.664E-02 -1.823E+00
Ozone layer DALY -6.816E-02 0.000E+00 4.346E-05 4.352E-04 -2.679E-03 -6.596E-02
Ecotoxicity PDF*m2yr -8.061E+06 1.145E+06 9.537E+05 1.222E+05 -7.523E+05 -9.530E+06
Acidification/
Eutrophication PDF*m2yr 9.063E+06 7.557E+06 7.236E+06 5.154E+05 -3.173E+06 -3.072E+06
Land use PDF*m2yr -9.779E+06 0.000E+00 0.000E+00 0.000E+00 0.000E+00 -9.779E+06
Minerals MJ surplus -9.950E+05 0.000E+00 0.000E+00 3.427E+04 -2.110E+05 -8.183E+05
Fossil fuels MJ surplus -1.330E+09 0.000E+00 1.309E+09 6.783E+07 -4.176E+08 -2.289E+09
Human Health DALY -2.510E+02 2.088E+02 2.527E+02 3.386E+01 -2.085E+02 -5.379E+02
Ecosystem Quality PDF*m2yr -8.777E+06 8.702E+06 8.189E+06 6.376E+05 -3.926E+06 -2.238E+07
Resources MJ surplus -1.331E+09 0.000E+00 1.309E+09 6.786E+07 -4.178E+08 -2.290E+09
ACKNOWLEDGMENT
The authors would like to thank the Ministry of Science
and Technology of the Republic of China (Taiwan) for
financially supporting this research under Contract MOST
103-2221-E-131-001-MY2.
REFERENCES
[1] K. F.-R. Liu, H.-H. Liang, C.-W. Chen, J.-S. Chen, and Y.-S. Shen,
“Combining scientific facts and significance criteria to predict the result of an environmental impact assessment review,” Journal of
Environmental Informatics, vol. 19, no. 2, pp. 93-107, June 2012.
[2] B. Sadler and R. Verheem, SEA: Status, Challenges and Future Directions, Report 53, Ministry of Housing, Spatial Planning and the
Environment, The Hague, Netherlands, 1996.
[3] K. F.-R. Liu, C.-Y. Ko, C. Fan, and C.-W. Chen, “Incorporating the LCIA concept into fuzzy risk assessment as a tool for environmental
impact assessment,” Stochastic Environmental Research and Risk
Assessment, vol. 27, no. 4, pp. 849-866, May 2013.
[4] ISO 14040: Environmental management — Life cycle assessment —
principles and framework, International Organisation for Standardisation (ISO), Geneve, 2006.
[5] ISO 14044: Environmental management — Life cycle assessment —
requirements and guidelines, International Organisation for
Standardisation (ISO), Geneve, 2006.
[6] M. J. Goedkoop and R. Spriensma, “The eco-indicator 99 — A
damage-oriented method for life cycle impact assessment,”
Methodology Report, Pre ́ Consultants, B.V. Amersfoort, The Netherlands, 2000.
[7] O. Jolliet, M. Margni, R. Charles, S. Humbert, J. Payet, G. Rebitzer,
and R. Rosenbaum, “IMPACT 2002+: A new life cycle impact assessment methodology,” The International Journal of Life Cycle
Assessment, vol. 8, no. 6, pp. 324-330, 2003.
[8] M. J. Goedkoop, R. Heijungs, M. Huijbregts, A. D. Schryver, J. Struijs, and R. Van Zelm, “ReCiPe 2008, A life cycle impact assessment
method which comprises harmonised category indicators at the
midpoint and the endpoint level,” First Edition Report I: Characterisation, 6 January, 2009.
[9] Institute for Environment and Sustainability, Joint Research Centre of
European Commission. (2010b). Framework and requirements for Life Cycle Impact Assessment (LCIA) models and indicators. [Online].
Available: http://lct.jrc.ec.europa.eu/pdf-directory/ILCD-Handbook-LCIA-Fram
ework-requirements-online-12March2010.pdf
Kevin Liu received the Ph.D. degree in 1998 in civil
engineering from National Central University, Taiwan. Currently, he is a professor in the Department of Safety,
Health and Environmental Engineering, Ming Chi
University of Technology, Taiwan. His research interest is the use of decision analysis and artificial intelligence
techniques to environmental management issues.
International Journal of Environmental Science and Development, Vol. 6, No. 11, November 2015
856
Si-Yu Chiu received the master degree in 2011 in the
Department of Safety, Health and Environmental
Engineering, Ming Chi University of Technology, Taiwan. She currently works for an environmental
management company. Her research interest is the
uncertainty analysis in LCA.
Po-Chung Yeh received the master degree in 2013 in the Department of Safety, Health and Environmental
Engineering, Ming Chi University of Technology,
Taiwan. He currently works for an environmental engineering company. He research interest is the
application of GIS and LIA to SEA.
Jong-Yih Kuo received the Ph.D. degree in 1998,
computer science and information engineering from
National Central University, Taiwan. Currently, he is an associate professor in the Department of Computer
Science and Information Engineering, National Taipei
University of Technology, Taiwan. His research interest is agent-base software engineering, intelligent
agent system, agent system development, web-base
application, machine learning and fuzzy theory.