CASE STUDY: CrossMedia Research Haircare category in...
26
CASE STUDY: CrossMedia Research Haircare category in Malaysia
Transcript of CASE STUDY: CrossMedia Research Haircare category in...

CASE STUDY: CrossMedia Research
Haircare category in Malaysia
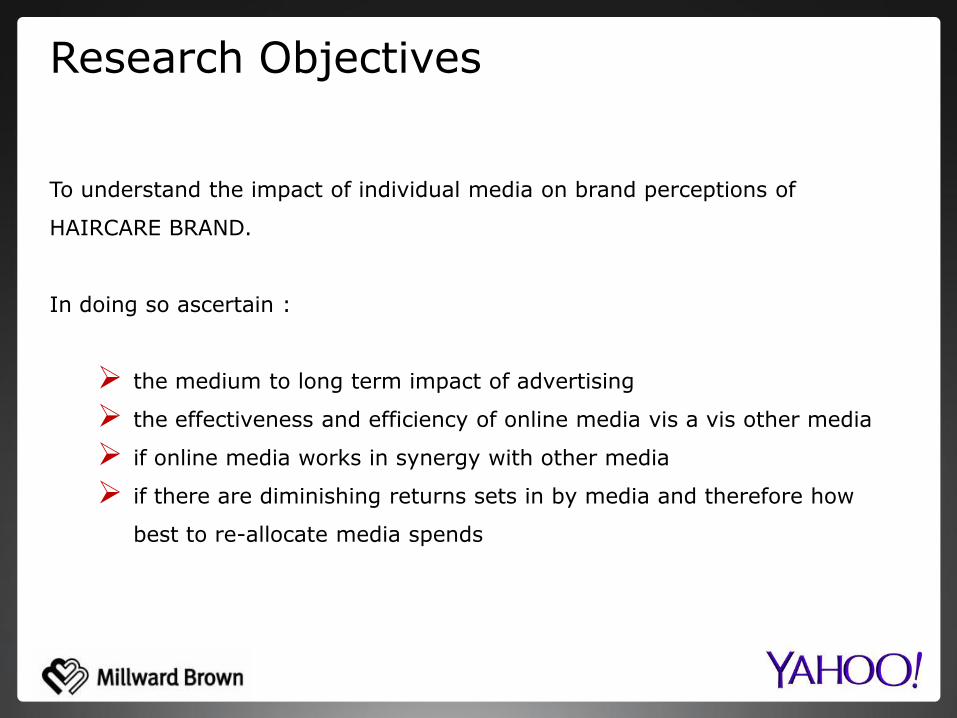
Research Objectives
To understand the impact of individual media on brand perceptions of
HAIRCARE BRAND.
In doing so ascertain :
the medium to long term impact of advertising
the effectiveness and efficiency of online media vis a vis other media
if online media works in synergy with other media
if there are diminishing returns sets in by media and therefore how
best to re-allocate media spends

Research Specifics
• CAWI Methodology • Pre-wave
Sample: 400 interviews (200 online, 200 offline)
Malaysia – Johor Bahru, Kuala Lumpur, Penang
Females Age 15+ Users and choosers of
Shampoo Age and race quotas set
based on city-wise distributions
Pre-wave Post-wave
• CAWI Methodology • Post-wave
Sample: 1000 interviews (500 online, 500 offline)
Malaysia – Johor Bahru, Kuala Lumpur, Penang
Females Age 15+ Users and choosers of
Shampoo Age and race quotas set
based on city-wise distributions
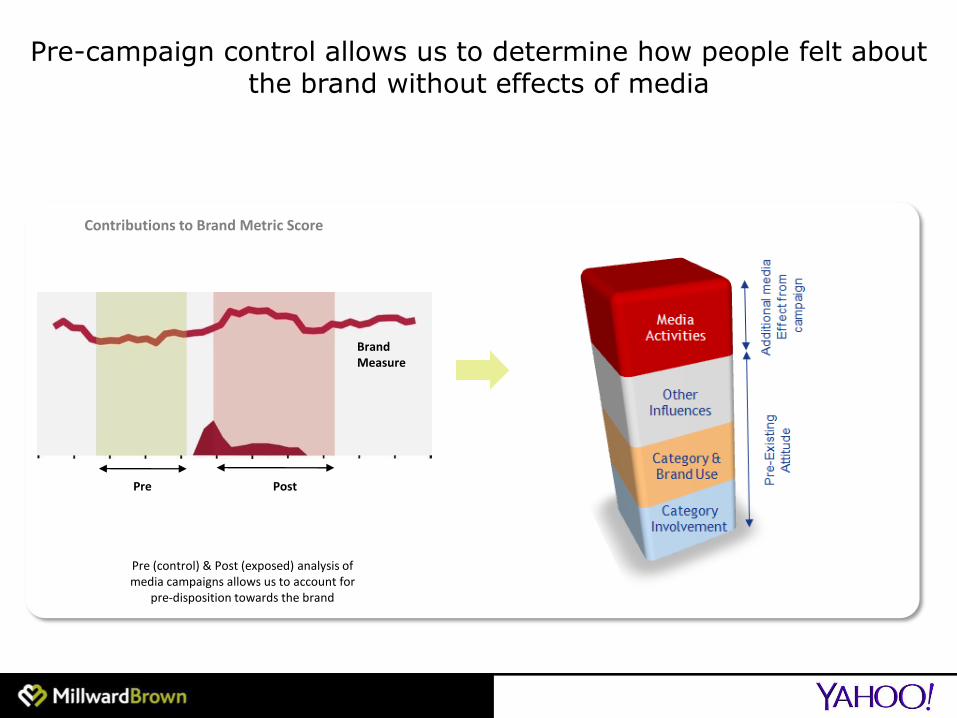
Pre-campaign control allows us to determine how people felt about the brand without effects of media
Contributions to Brand Metric Score
Pre (control) & Post (exposed) analysis of media campaigns allows us to account for
pre-disposition towards the brand
Pre Post
Brand Measure

We can then determine the impact of exposure to the different media channels on uplifts in brand metrics.
We use calculations of each respondent’s probability of exposure to all the different elements of the media campaign (based on detailed media consumption questions). If we are measuring digital media, we would use cookies to capture actual exposure data. We then analyse variations in brand metric scores against media exposure levels for each respondent.
Using this information, we are able to determine which media had the most influence on any observed uplifts and quantify the return for money spent.
Estimate respondents’ exposure to campaign media
Saw ads In NO media
Saw ads in all digital, press
And TV
Saw ads in press and TV
Calculate shift in metric due to media exposure
Uplift in
Consideration
8.0
4.3
0.8
TV
Digital
For illustration only

How we estimate contributions:
The contributions that different factors make to the end of campaign position are derived using a statistically valid modeling technique called multivariate regression.
We build a model based on the respondent level data from the whole survey period to estimate how much each factor contributes to respondents’ brand metric scores
From the model we can then estimate the “end of campaign” contribution from each factor
Campaign
Explaining CrossMedia Research results Core results represent the “End of Campaign Position”
Week: 1 2 4 3 6 5 7 8 9 10 11
Brand Metric Score
Metric building over campaign
period
CrossMedia Contributions
12 13 Consideration
(Top 2 boxes)
1.2%
56.0%
3.4%

The campaign includes 3 media channels – TV, online and print
TV
Print Online

March April May June July August Sept
FTA
Astro
Magazine
Digital
Variant TVC (30s)
Local TVC (30s)
Detailed media plan
Display
Pre-wave In-campaign-wave
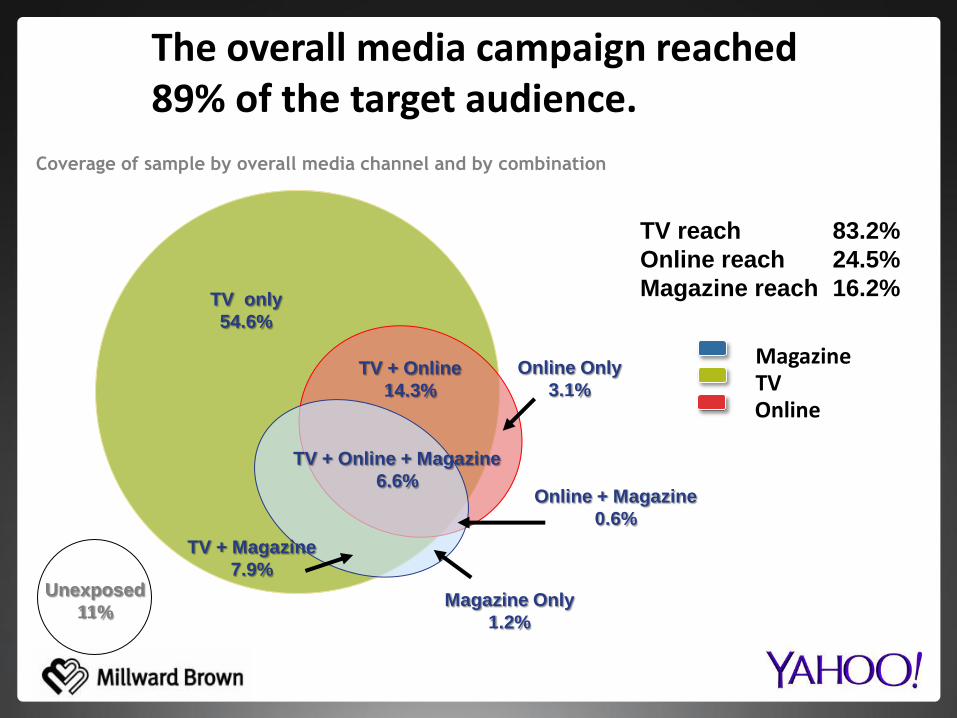
The overall media campaign reached 89% of the target audience.
Online Only
3.1%
TV + Online
14.3%
Magazine TV Online
Coverage of sample by overall media channel and by combination
TV only
54.6%
Magazine Only
1.2%
TV + Online + Magazine
6.6% Online + Magazine
0.6%
TV + Magazine
7.9% Unexposed
11%
TV reach 83.2%
Online reach 24.5%
Magazine reach 16.2%

Key
Metric
Purchase Consideration

Purchase Consideration
60.6%
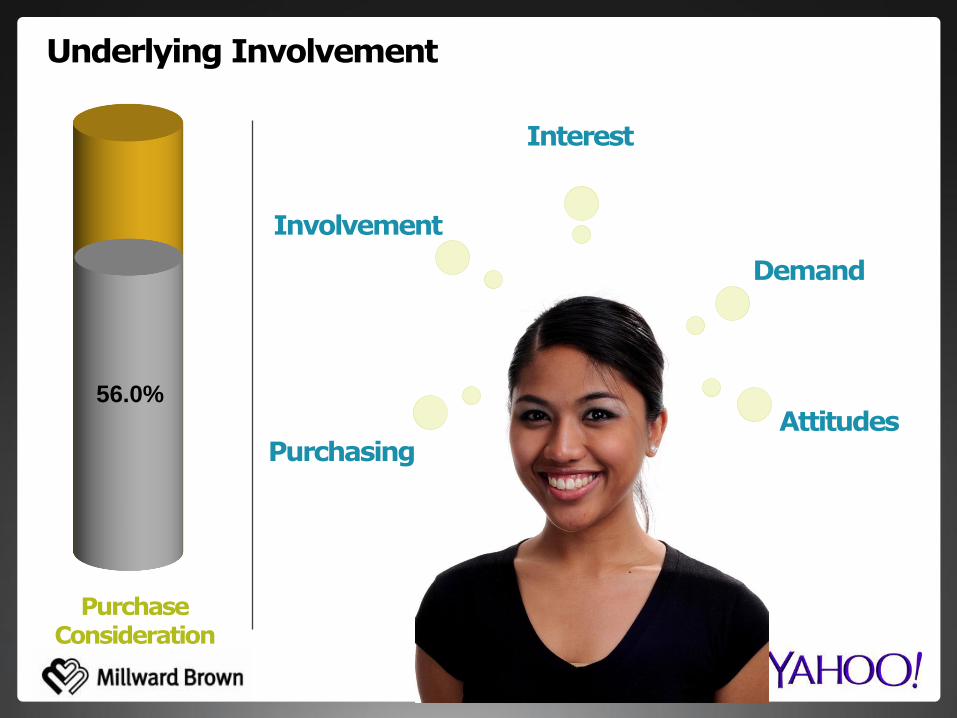
Underlying Involvement
Interest
Attitudes
Demand
Involvement
Purchasing
Purchase Consideration
56.0%

Ongoing Influences
Word of Mouth
Previous Campaigns
PR 1.2%
Purchase Consideration
56.0%

Campaign Input
Online
Purchase Consideration
TV
1.2%
3.4%
56.0%
Magazine

Campaign Contribution
Baseline
Ongoing Influence
1 2 3 4
51.0% 56.0% 51.8%
57.3%
4.5% 1.2% 3.0%
3.3% 4.6% 3.4% 2.7%
4.2%
Presence (Av. of 3 metrics)
Functional Image
(Av. of 5 metrics)
Campaign Performance Overview
Purchase Consideration (Av. of 3 metrics)
60.1% 64.8% End of campaign value: 57.6% 60.6%
Emotive Image (Av. of 4 metrics)
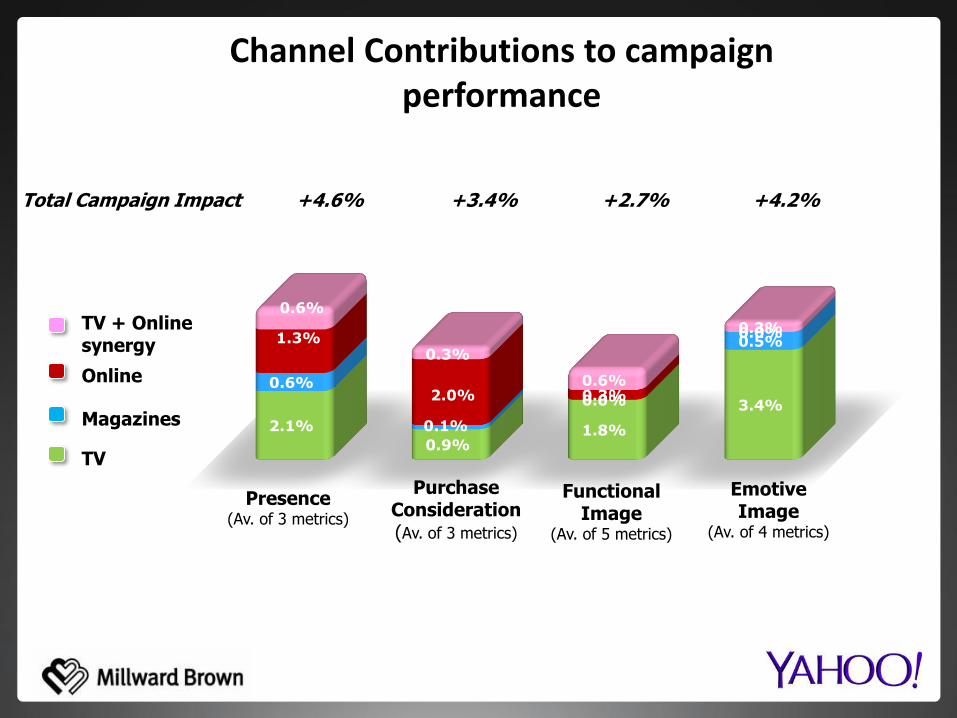
Channel Contributions to campaign performance
2.1%
0.9% 1.8%
3.4%
0.6%
0.1%
0.0%
0.5% 1.3%
2.0% 0.3%
0.0%
0.6%
0.3%
0.6%
0.3%
Online
TV
Magazines
TV + Online synergy
Presence (Av. of 3 metrics)
Functional Image
(Av. of 5 metrics)
Purchase Consideration (Av. of 3 metrics)
Emotive Image
(Av. of 4 metrics)
+4.6% +4.2% Total Campaign Impact +2.7% +3.4%
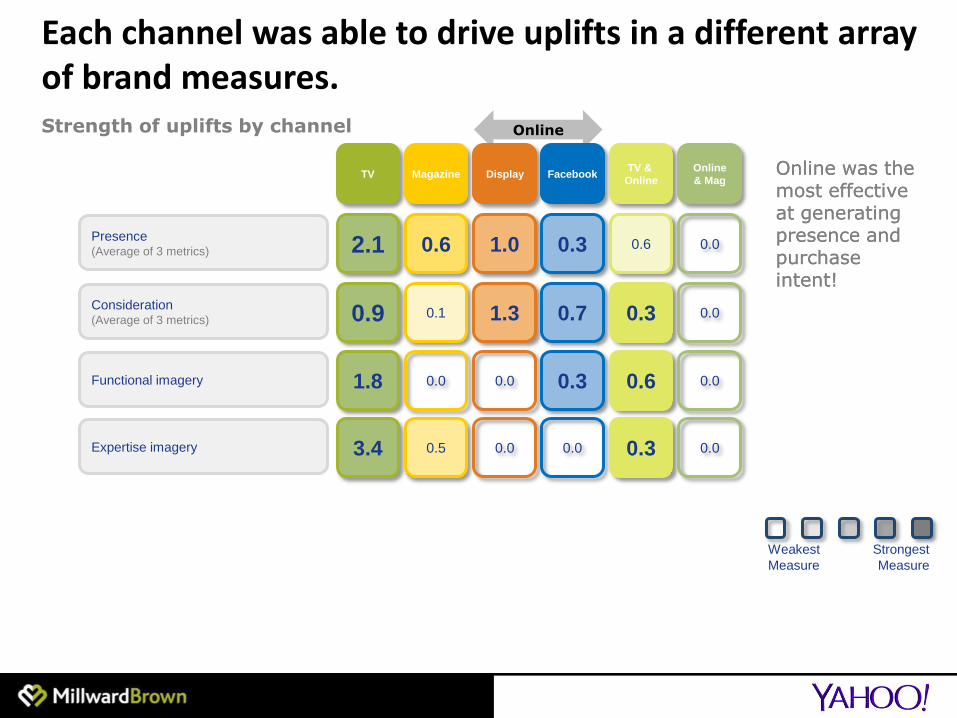
Each channel was able to drive uplifts in a different array of brand measures. Strength of uplifts by channel
Strongest
Measure
Weakest
Measure
Online was the most effective at generating presence and purchase intent!
Online
Online was the most effective at generating presence and purchase intent!
TV Magazine Display Facebook TV &
Online
Online
& Mag
2.1 0.6 1.0 0.3 0.6 0.0
0.9 0.1 1.3 0.7 0.3 0.0
1.8 0.0 0.0 0.3 0.6 0.0
Presence (Average of 3 metrics)
Consideration (Average of 3 metrics)
Functional imagery
3.4 0.5 0.0 0.0 0.3 0.0 Expertise imagery

Media efficiencies

Bulk of the media investments were for TV, and an equal portion for magazine and online.
78%
11% 11%
Proportion of overall campaign spend by channel...
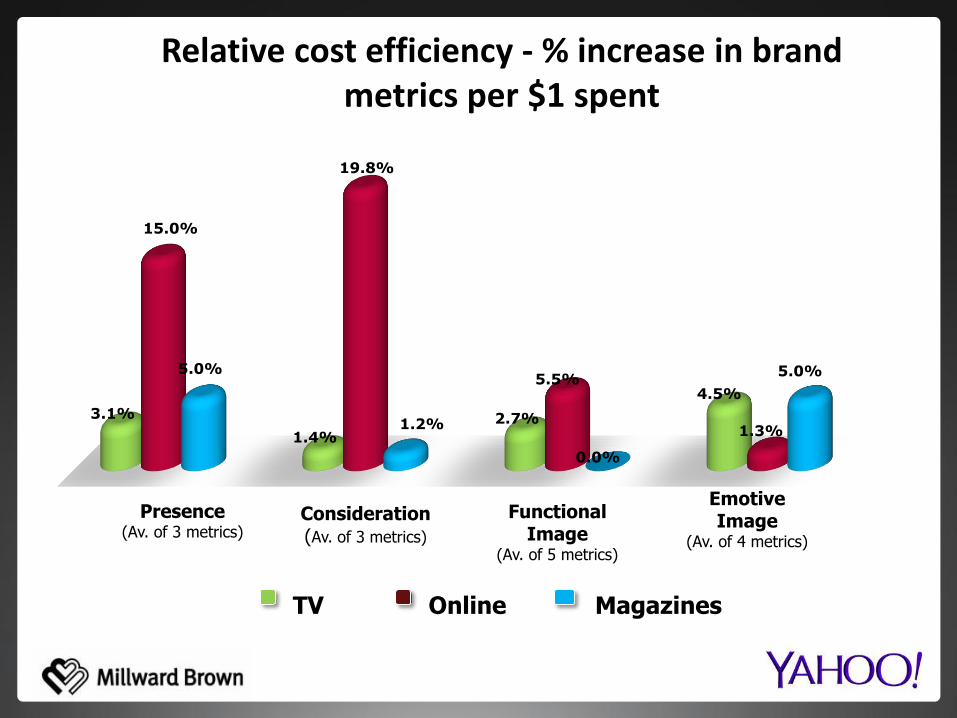
Relative cost efficiency - % increase in brand metrics per $1 spent
3.1%
1.4%
2.7%
4.5%
15.0%
19.8%
5.5%
1.3%
5.0%
1.2%
0.0%
5.0%
Online TV Magazines
Presence (Av. of 3 metrics)
Functional Image
(Av. of 5 metrics)
Consideration (Av. of 3 metrics)
Emotive Image
(Av. of 4 metrics)

Optimising Media spends to
maximise Brand metrics

Estimate effective frequency ceiling for each media/metric
Identify proportion of each media’s GRP’s that are unproductive
Calculate a weekly relative cost for productive GRP’s by week
Step 1
Step 2
Step 3
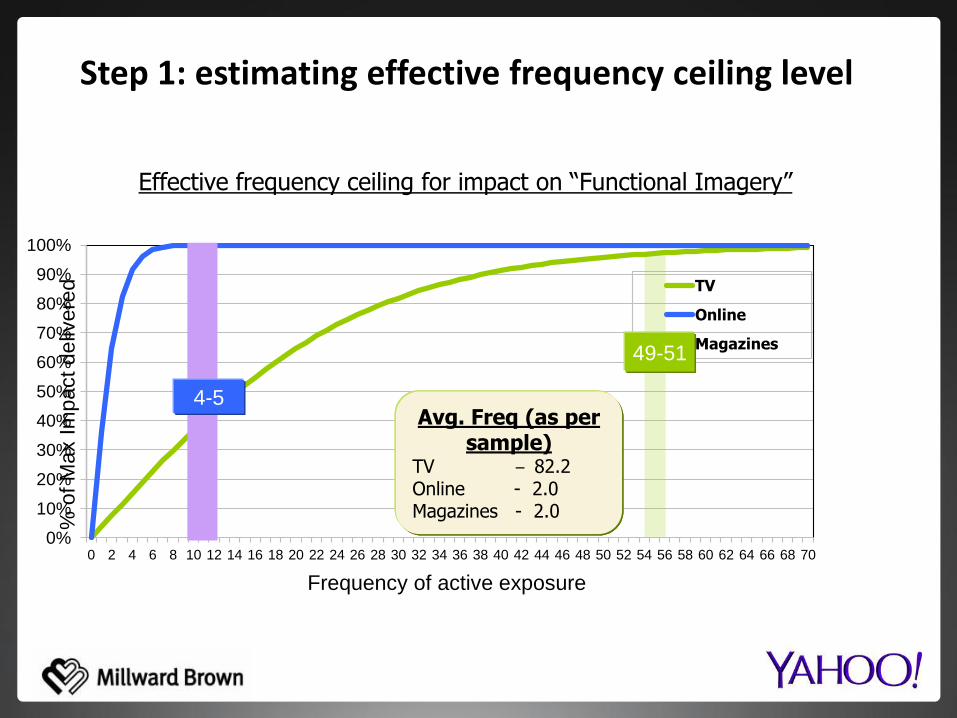
Step 1: estimating effective frequency ceiling level
0%
10%
20%
30%
40%
50%
60%
70%
80%
90%
100%
0 2 4 6 8 10 12 14 16 18 20 22 24 26 28 30 32 34 36 38 40 42 44 46 48 50 52 54 56 58 60 62 64 66 68 70
TV
Online
Magazines
4-5
% o
f M
ax I
mpact
deliv
ere
d
49-51
Frequency of active exposure
Avg. Freq (as per sample)
TV – 82.2 Online - 2.0 Magazines - 2.0
Effective frequency ceiling for impact on “Functional Imagery”

Step 2: Proportion of weekly TV GRP’s that are un-productive in driving “Functional Imagery”
0%
10%
20%
30%
40%
50%
60%
70%
80%
1 2 3 4 5 6 7 8 9 10 11 12 13 14 15
% audience over frequency ceiling
% GRPs non productive
Weeks
To drive Functional Imagery 63% of the GRPs would have been sufficient
From week 13 on, over 50% of TV GRP’s are unproductive

Step 3: relative cost index of productive GRP’s by week
0
50
100
150
200
250
300
350
400
450
1 2 3 4 5 6 7 8 9 10 11 12 13 14 15
TV - Relative Cost Index for productive GRP's
Weeks
As one would expect, as diminishing returns starts to set in the GRPs get
lesser and lesser productive

Four silver bullets: Recommendations for future campaigns
1. Online was the most cost efficient media, and could sustain
significantly more weight:
Increase investment in online in future campaigns
2. TV & Online synergy was important, but online was only active for last 3rd of campaign
In future try and phase TV & Online together for more of campaign period to maximise synergy bonus
3. TV over delivered in 2nd half of campaign
Down weight GRP weights later in campaign periods to improve cost efficiencies
4. Magazines was cost efficient, but the reach was low
Look to extend reach via additional titles in future