Case Studies on the Economic Impacts of High Speed Rail … · Case Studies on the Economic Impacts...
33
Page 1 Case Studies on the Economic Impacts of High Speed Rail on US Cities The New Haven-Hartford-Springfield Rail Project: Opportunities for Economic Growth October 25, 2011 Presented by: Stephen S. Fitzroy Economic Development Research Group, Inc.
Transcript of Case Studies on the Economic Impacts of High Speed Rail … · Case Studies on the Economic Impacts...
Page 1
Case Studies on the Economic Impacts of High
Speed Rail on US Cities
The New Haven-Hartford-Springfield Rail Project:
Opportunities for Economic Growth
October 25, 2011Presented by:
Stephen S. FitzroyEconomic Development Research Group, Inc.
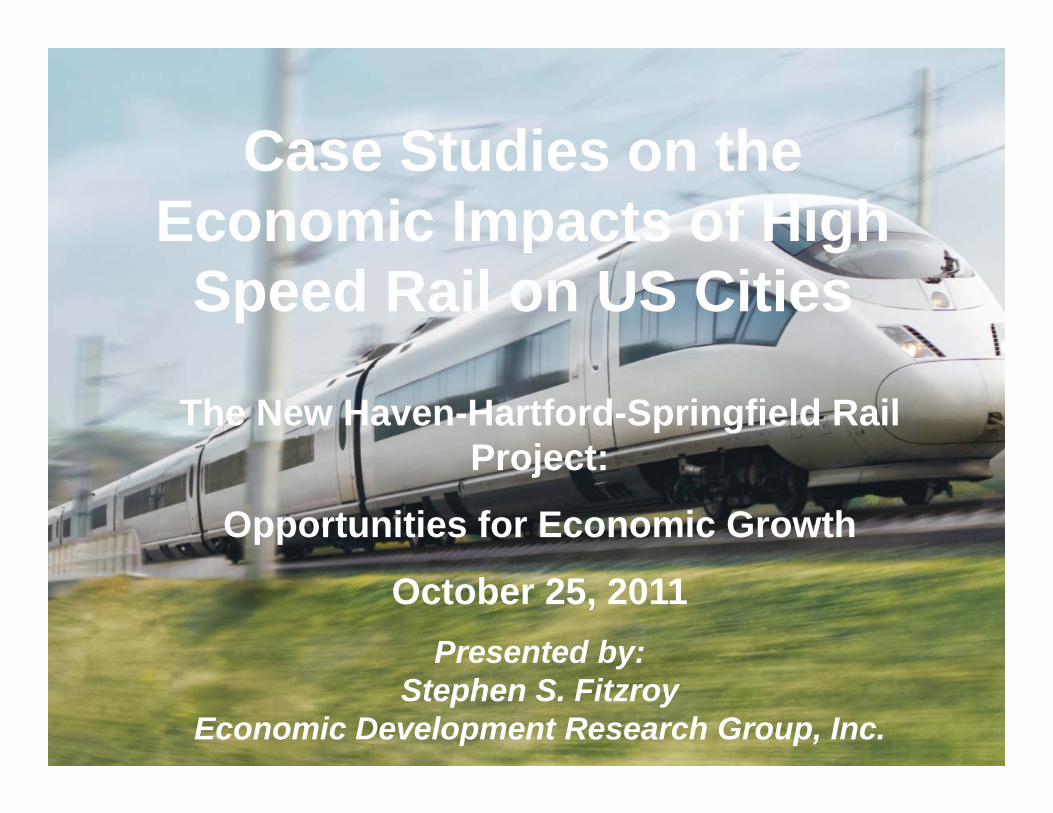
US Conference of Mayors Study:A Tale of Four Cities
Page 2
Higher-density, mixed use development at train stations that support sustainable development
Travel efficiency gains that increase business productivity and labor market access
Expanded visitor markets that generate additional spending
Linking centers of knowledge, finance and technology that support strategic industry clusters
Can high-speed rail help drive local economies?Q:YesA:How?Q:
A:

Conference of Mayors Study Approach
Page 3
Evaluate the effects of a range of design and operating speeds on economic development potential and market access.
Identify the concurrent land use, surface transportation infrastructure and economic development strategies needed to support alternative high-speed rail scenarios.
Assess the economic impacts of high-speed rail on four US cities of different sizes, economic structure and geographic location.

Conference of Mayors Study Findings
Page 4
A combination of “allocative” and “generative” impacts occur as travel is directed to downtown and intra-metropolitan stations.
The ability to transform high-speed rail generated traffic volumes into economic growth is highly dependent on interactions between land use, surface connections and economic development strategies.
Increased market access with higher speed operations provides more “generative” impacts – especially for cities that depend heavily on auto-based intercity connections.

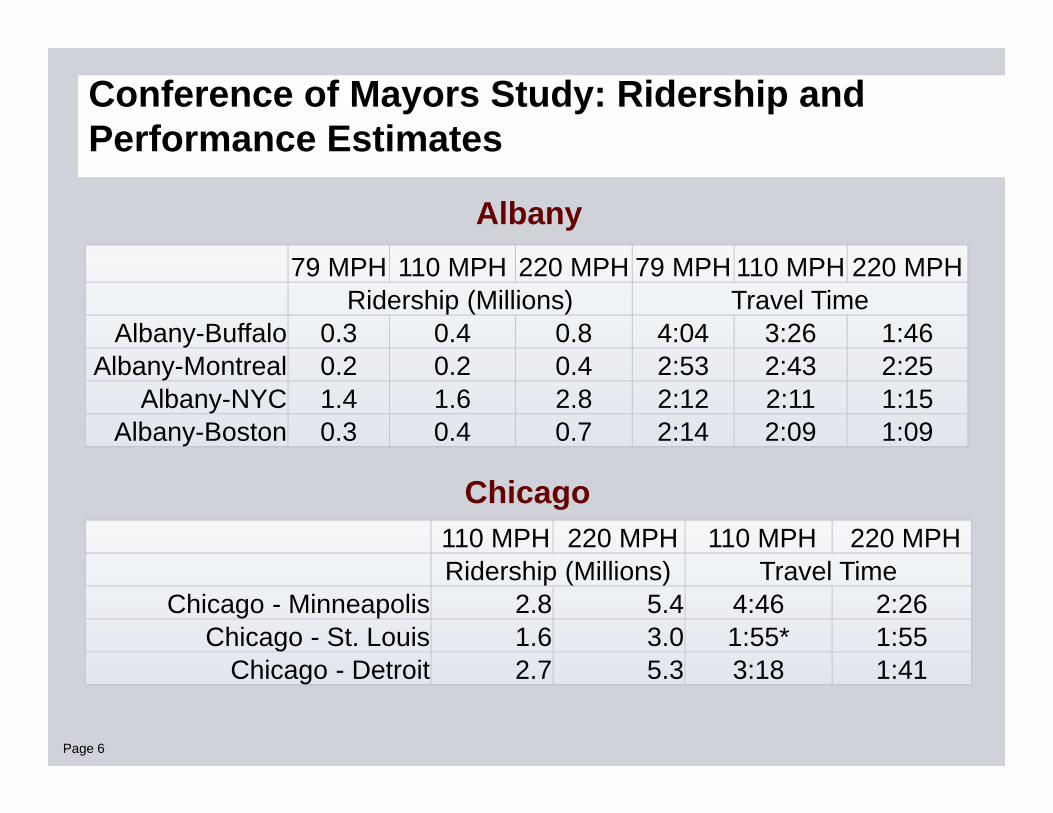
Conference of Mayors Study: Ridership and Performance Estimates
Page 5
168 MPH 220 MPH 168 MPH 220 MPHRidership (Millions) Travel Time
Orlando-St. Petersburg 2.9 3.7 0:59 0:46Orlando-Miami 7.5 8.7 1:45 1:31
220 MPH 220 MPHRidership (Millions) Travel Time
Los Angeles-San Francisco 11.1 2:38Los Angeles-Sacramento 4.5 2:17
Los Angeles-San Diego 3.5 1:18
Orlando
Los Angeles
Page 6
110 MPH 220 MPH 110 MPH 220 MPHRidership (Millions) Travel Time
Chicago - Minneapolis 2.8 5.4 4:46 2:26Chicago - St. Louis 1.6 3.0 1:55* 1:55
Chicago - Detroit 2.7 5.3 3:18 1:41
79 MPH 110 MPH 220 MPH 79 MPH 110 MPH 220 MPHRidership (Millions) Travel Time
Albany-Buffalo 0.3 0.4 0.8 4:04 3:26 1:46Albany-Montreal 0.2 0.2 0.4 2:53 2:43 2:25
Albany-NYC 1.4 1.6 2.8 2:12 2:11 1:15Albany-Boston 0.3 0.4 0.7 2:14 2:09 1:09
Albany
Chicago
Conference of Mayors Study: Ridership and Performance Estimates
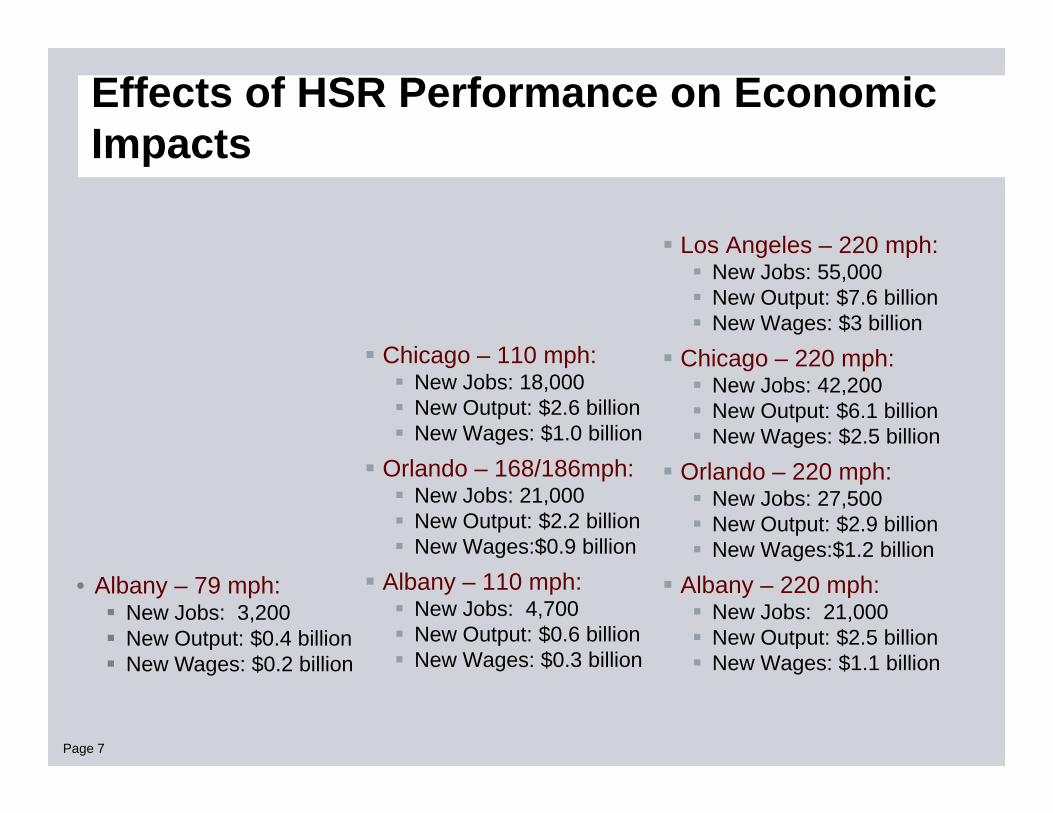
Effects of HSR Performance on Economic Impacts
Page 7
Chicago – 110 mph: New Jobs: 18,000 New Output: $2.6 billion New Wages: $1.0 billion
Orlando – 168/186mph: New Jobs: 21,000 New Output: $2.2 billion New Wages:$0.9 billion
Albany – 110 mph: New Jobs: 4,700 New Output: $0.6 billion New Wages: $0.3 billion
Los Angeles – 220 mph: New Jobs: 55,000 New Output: $7.6 billion New Wages: $3 billion
Chicago – 220 mph: New Jobs: 42,200 New Output: $6.1 billion New Wages: $2.5 billion
Orlando – 220 mph: New Jobs: 27,500 New Output: $2.9 billion New Wages:$1.2 billion
Albany – 220 mph: New Jobs: 21,000 New Output: $2.5 billion New Wages: $1.1 billion
• Albany – 79 mph: New Jobs: 3,200 New Output: $0.4 billion New Wages: $0.2 billion

Albany – Population 757,000
Page 8
Create faster access between Albany and New York markets
Additional potential jobs could grow to 2,500 for tourism and convention related jobs, as well as 6,000 for technology and related industries
Anchor new station development in the Capital District and support cultural and professional centers
Why does HSR make sense for Albany?Albany is home to several colleges and
universities. A new $185 million convention center & hotel complex can increase convention
delegates from 120,000 each year to 250,000. Rapid access to business and financial centers in
New York will strengthen emerging technology and research cluster development.
Albany
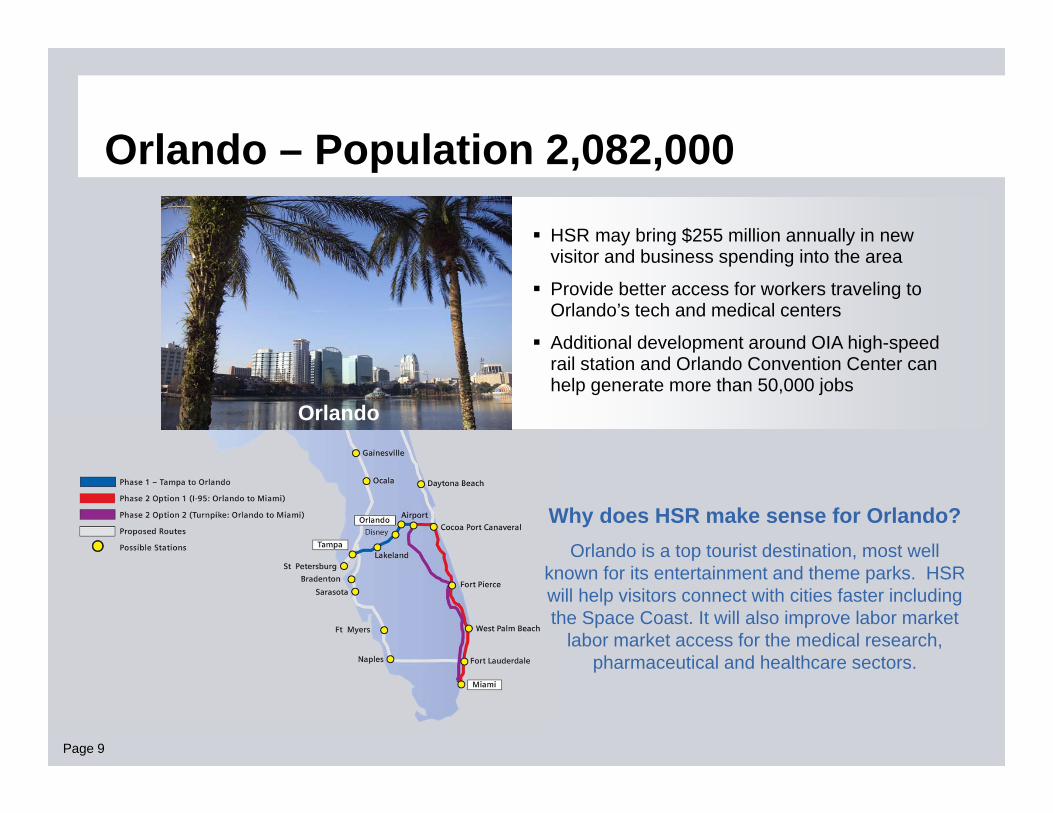
Orlando – Population 2,082,000
Page 9
HSR may bring $255 million annually in new visitor and business spending into the area
Provide better access for workers traveling to Orlando’s tech and medical centers
Additional development around OIA high-speed rail station and Orlando Convention Center can help generate more than 50,000 jobs
Why does HSR make sense for Orlando?Orlando is a top tourist destination, most well
known for its entertainment and theme parks. HSR will help visitors connect with cities faster including the Space Coast. It will also improve labor market
labor market access for the medical research, pharmaceutical and healthcare sectors.
Orlando

Los Angeles – Population 12,875,000
Page 10
New visitors will help bring at least $360 million per year of new spending in the downtown area
6,400 workers and visitors who drive to downtown LA will go from road to HSR
Every day 6,500 California residents will come to downtown LA for business and entertainment instead of going elsewhere in the metropolitan area.
Why does HSR make sense for LA?Los Angeles is a center for film, entertainment and
tourism. It is also the site of the most active seaport in the Western Hemisphere. Much of its economic base depends on connectivity to other parts of California,
the United States and overseas. HSR will bring people directly to downtown Los Angeles.
Los Angeles

Chicago – Population 7,998,000
Page 11
Expand labor markets and increase connectivity to major cities across the Midwest
Bring intercity travelers directly to downtown
Strengthen new development in the Union Station area
New visitors will spend $50 million dollars each year in Chicago generating 2,000 new jobs
Why does HSR make sense for Chicago?Chicago is an economic center for the Great
Lakes-Midwest economic region with nearly one million people living within a 550-mile distance
reaching eight states. The city is a major transportation gateway of the Midwest, the U.S.
and the world.
Chicago
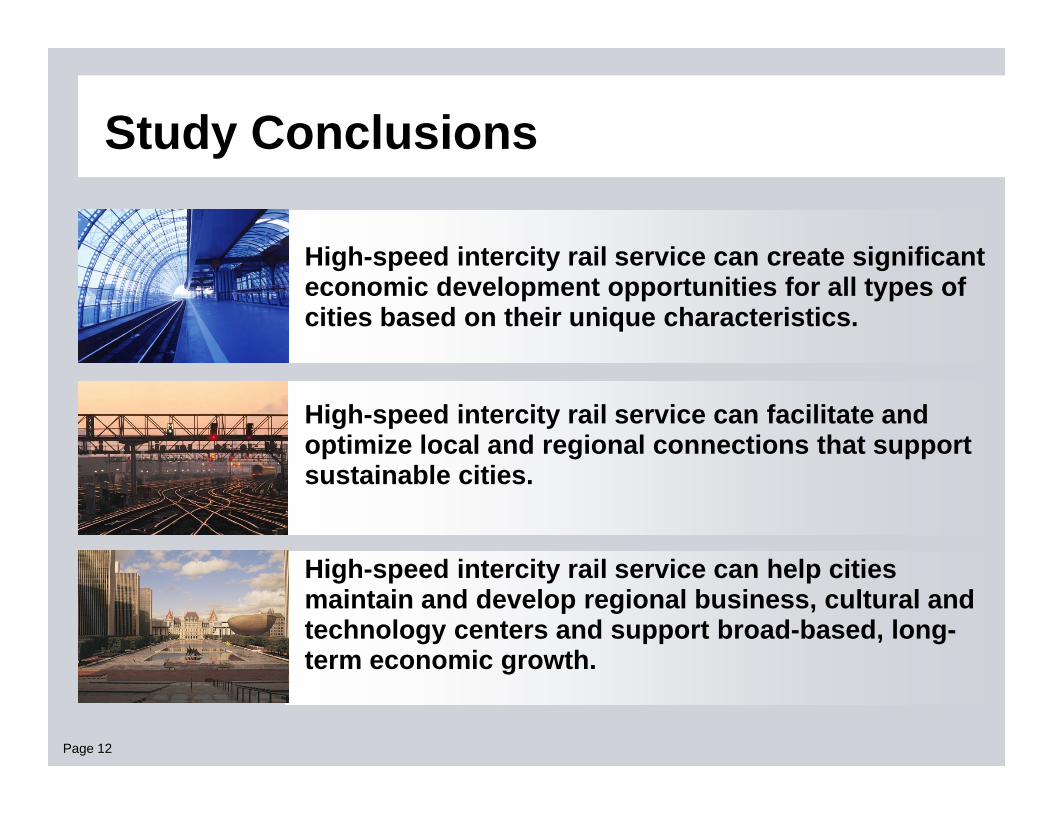
Study Conclusions
Page 12
High-speed intercity rail service can facilitate and optimize local and regional connections that support sustainable cities.
High-speed intercity rail service can help cities maintain and develop regional business, cultural and technology centers and support broad-based, long-term economic growth.
High-speed intercity rail service can create significant economic development opportunities for all types of cities based on their unique characteristics.

Key Issues Identified in Case StudiesAlbany Positive Factors: Drawn more closely to New York Metropolitan economy Problems to be Resolved: Connectivity to Capital area from Rensselaer
station stop
Orlando Positive Factors: Connections to “Space Coast” industries broadens
economic base Problems to be Resolved: Location of HSR stops within metro area
Los Angeles Positive Factors: Creates “Center” for LA that delivers “captive” demand Problems to be Resolved: Creating downtown development strategy of
appropriate scale and density
Chicago Positive Factors: Creating a “Hub” for Midwestern HSR network Problems to be Resolved: Balancing connection to O’Hare and Midwest
marketsPage 13

Page 14Page 14
Chicago Supplemental Infrastructure Study
Identify potential investments that may be required in Chicago and the Midwest to support a truly “high-speed” intercity passenger-train network.
Build on the foundation of multi-state cooperative rail planning that has been ongoing in the region for approximately 15 years.
Develop a “vision plan” for true HSR service connecting major metropolitan areas within 300 - 450 miles of Chicago.

Chicago Supplemental Infrastructure Study
Addressed System Design Considerations: Integration of O’Hare with HSR serving 17 major Midwest metro
areas Location of metro stations to integrate with commuter rail and transit
system Expansion of lines to include new routing (for Minneapolis HSR) and
new route (Cincinnati) Improved intercity times by improving alignments and using under-
utilized existing rights-of-way Expanded frequency of HSR services for both peak and off-peak
hours
Page 15

Page 16Page 16
HSR Corridors Include Regional and Commuter Rail Medium and small
markets served by conventional passenger rail routes
Regional Rail (and Bus) Systems “Feed” HSR system
Scheduling is coordinated so that network operations support connections
Airport connectivity for major regional hubs (e.g., O’Hare) are enhanced.

Chicago Study Shows Importance of Operating Assumptions
Page 17
150 MPH 220 MPH 150 MPH 220 MPHRidership (Millions) Travel Time
Chicago - Minneapolis 12.5 15.9 3:45 2:45Chicago - St. Louis 6.0 7.9 2:43 1:55
Chicago - Cincinnati 5.9 7.2 2:29 1:55Chicago - Detroit/Cleveland 10.6 12.7 2:26 / 2:49 1:55 / 2:15
110 MPH 220 MPH 110 MPH 220 MPHRidership (Millions) Travel Time
Chicago - Minneapolis 2.8 5.4 4:46 2:26Chicago - St. Louis 1.6 3.0 1:55* 1:55
Chicago - Detroit 2.7 5.3 3:18 1:41
Midwest High Speed Rail
US Conference of Mayors

Page 18
HSR Can be Introduced Incrementally Through Infrastructure Upgrades in Specific Segments
Phase 1: Emerging Corridor –Class 5 track with a maximum permissible freight speed of 80 mph and 90 mph passenger operations
Phase 2: Regional Corridor –Separate passenger track within a shared corridor supporting passenger speeds up to 110 mph; grade crossings with upgraded “sealed corridor” safety treatments
Phase 3: Regional Corridor –Separate directional tracks for speeds between 110 and 125 mph; elimination of grade crossings
Phase 4: Core Express Corridor –Electrification of passenger tracks allow true HSR speeds where track alignment and station spacing permit
Upgrade vehicle fleet in a parallel to 110, 125 and true HSR (150 –250mph):
Source: AECOM and EDR Group, 2011

Page 19Page 19
220 Service Provides Single Day Round-Trip
HSR reduces travel times and “shrinks” the distances between cities.
Travel time by automobile is shown on the left and by 220-mph HSR on the right, holding the travel time scale constant. The Midwest’s largest metropolitan areas would be less than three hours from Chicago via HSR.

0%
1%
2%
3%
4%
5%
6%
7%
10,000 100,000 1,000,000
Econ
omic Respo
nse to Access M
easure
County Population
40‐Min Pop by Road
3‐Hr Empl by HSR
3‐Hr Empl by Road
Domestic Airport
Sensitivity to Market Access for Professional, Scientific, Technical Services Sector
Page 20

Page 21Page 21
Chicago Infrastructure Study Findings
HSR network would serve the nine largest metropolitan areas of the Midwest, and a total of 17 major cities, providing end-to-end service under three hours in each corridor.
By 2030, the entire HSR network would carry 43 million riders with nearly 22 million destined for the Chicago metropolitan area.
Four corridors centered on Chicago appear appropriate for eventual upgrade to true HSR service (220+ mph): Minneapolis/St. Paul, St. Louis, Cincinnati and Detroit/Cleveland.
Page 22Page 22
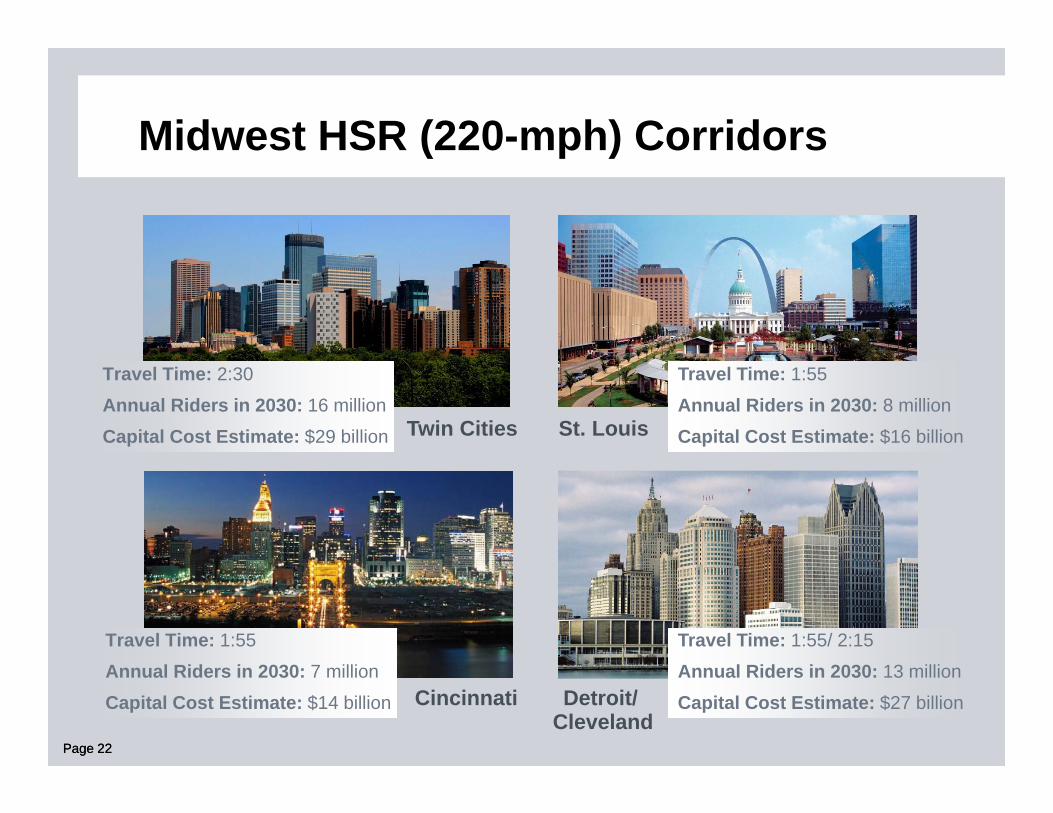
Midwest HSR (220-mph) Corridors
St. Louis
Cincinnati Detroit/
Travel Time: 2:30
Annual Riders in 2030: 16 million
Capital Cost Estimate: $29 billion Twin Cities
Travel Time: 1:55
Annual Riders in 2030: 8 million
Capital Cost Estimate: $16 billion
Travel Time: 1:55
Annual Riders in 2030: 7 million
Capital Cost Estimate: $14 billion
Travel Time: 1:55/ 2:15
Annual Riders in 2030: 13 million
Capital Cost Estimate: $27 billionCleveland
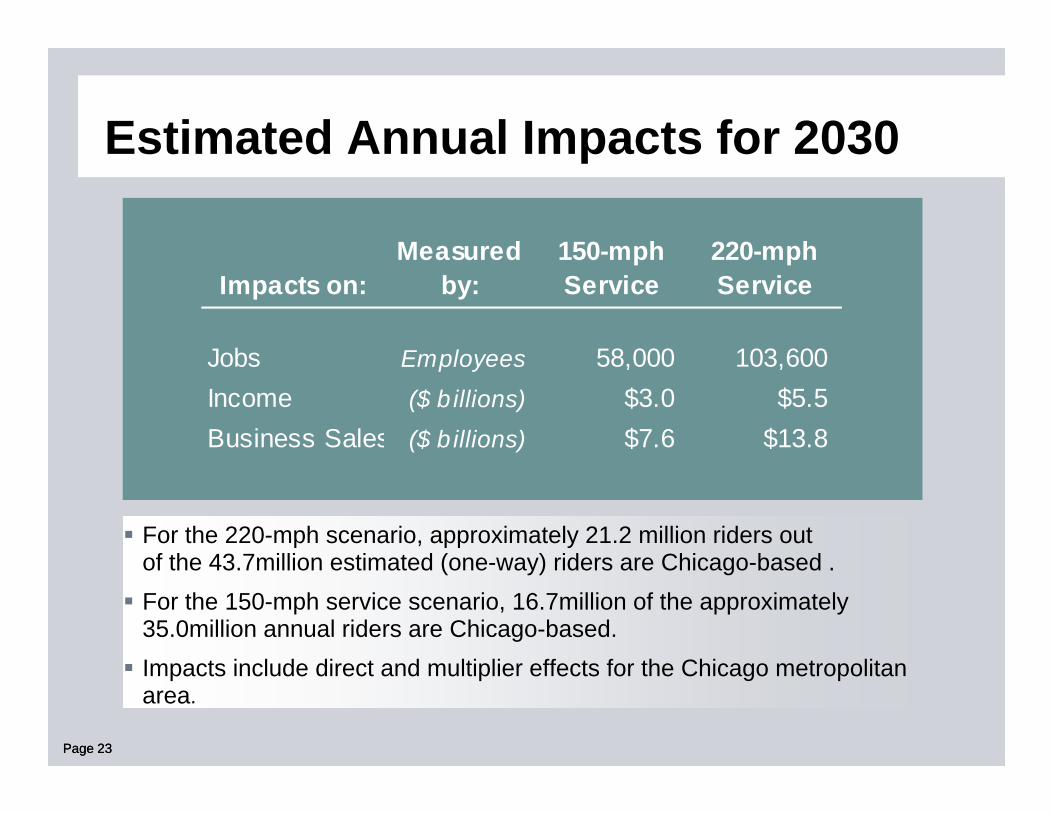
For the 220-mph scenario, approximately 21.2 million riders outof the 43.7million estimated (one-way) riders are Chicago-based . For the 150-mph service scenario, 16.7million of the approximately
35.0million annual riders are Chicago-based. Impacts include direct and multiplier effects for the Chicago metropolitan
area.
Page 23
Estimated Annual Impacts for 2030
Impacts on:Measured
by:150-mph Service
220-mph Service
Jobs Employees 58,000 103,600 Income ($ b illions) $3.0 $5.5Business Sales ($ b illions) $7.6 $13.8
Page 23
Page 24
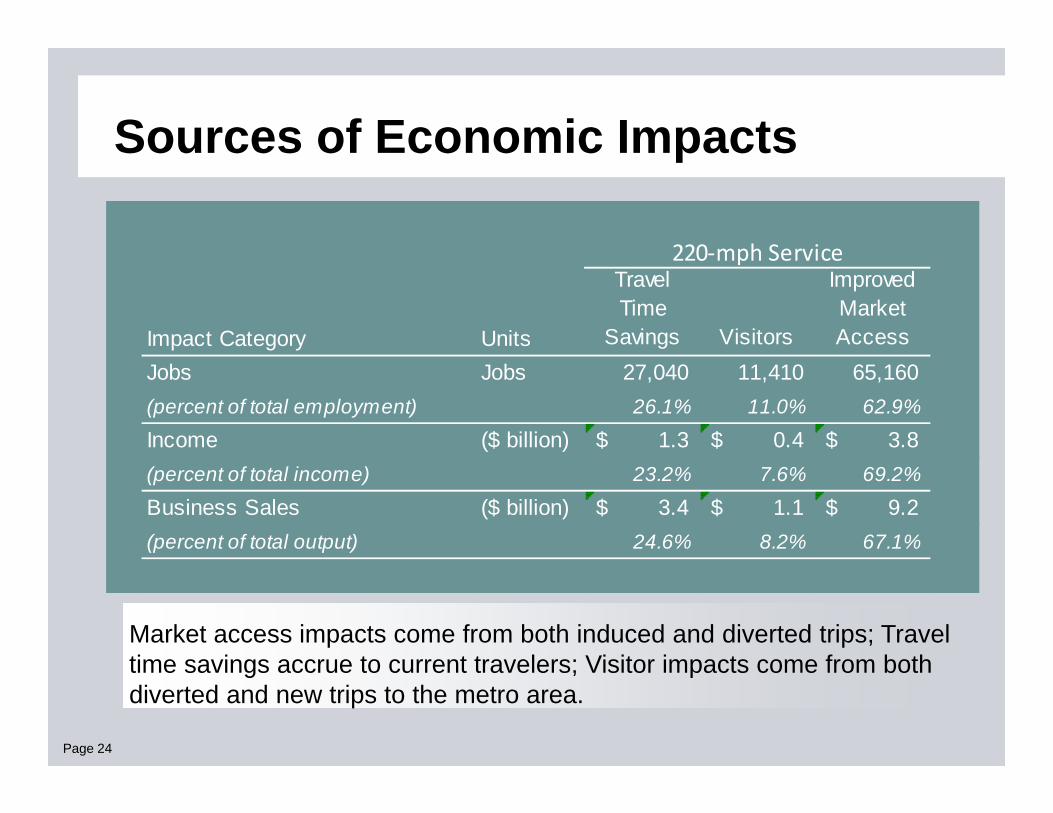
Impact Category Units
Travel Time
Savings Visitors
Improved Market Access
Jobs Jobs 27,040 11,410 65,160 (percent of total employment) 26.1% 11.0% 62.9%
Income ($ billion) 1.3$ 0.4$ 3.8$ (percent of total income) 23.2% 7.6% 69.2%
Business Sales ($ billion) 3.4$ 1.1$ 9.2$ (percent of total output) 24.6% 8.2% 67.1%
220‐mph Service
Sources of Economic Impacts
Market access impacts come from both induced and diverted trips; Travel time savings accrue to current travelers; Visitor impacts come from both diverted and new trips to the metro area.

Page 25
Visitor spending reflects new and induced trips for both tourists (recreational and leisure) and business travelers. Spending patterns also reflect travelers arriving at the downtown Chicago
and Metra stations served by HSR, who would have driven or flown to locations in the metropolitan area outside of Cook County
Page 25
Visitor Spending Impacts for the City of Chicago
Impacts on:150-mph Service
220-mph Service
New Visitor Spending $107.3 $157.8Diverted/Rerouted Visitor Spending $122.5 $156.3Total Visitor Spending $229.8 $314.1Visitor-Related Jobs 4,400 6,000
Visitor Spending by 2030 in Cook County (in $ millions)

Page 26Page 26
Chicago Study Conclusions
Designing feeder systems for HSR also expands HSR markets and contributes to sustainable ridership for supporting networks
Overall system design is optimized when same-day round trips are feasible (3-hour maximum travel times) between major metropolitan areas in network
Increased attention to network effects increases economic benefits by over 40%

HSR Development “Checklist”. . . Key System Planning Considerations
Identify economic connections to other metro market areas
Locate and develop key downtown HSR stations
Consider intermediate HSR station market conditions
Consider potential for through or connecting rail service
Page 27Page 27

HSR Development “Checklist”. . . Key Station Planning Considerations
Design multimodal access improvements to station areas
Create connecting rail, transit and local distribution services
Create short-term transition to support phasing plans
Coordinate long-term systems plans to support true HSR
Page 28Page 28
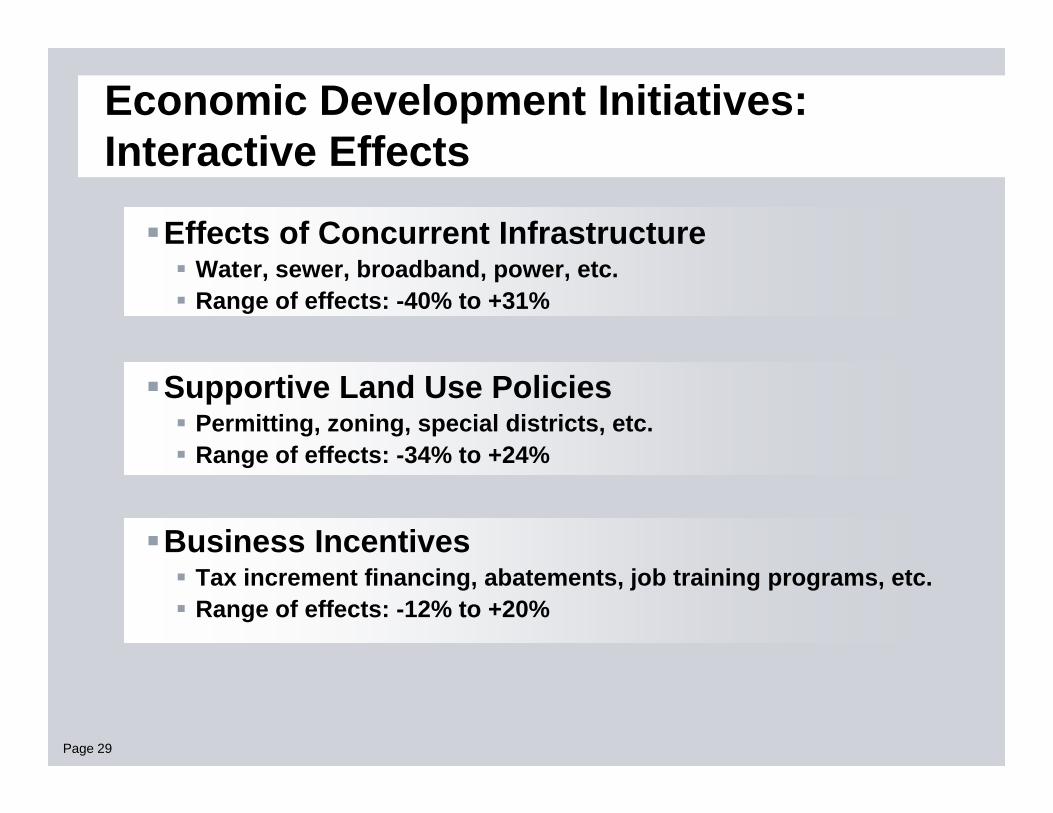
Economic Development Initiatives: Interactive Effects
Effects of Concurrent Infrastructure Water, sewer, broadband, power, etc. Range of effects: -40% to +31%
Supportive Land Use Policies Permitting, zoning, special districts, etc. Range of effects: -34% to +24%
Business Incentives Tax increment financing, abatements, job training programs, etc. Range of effects: -12% to +20%
Page 29

Important Station Area Development Characteristics
Distances between HSR metro-area stations “Rationalize” current and/or future development patterns
Scale Supportive density and allowable building codes
Connectivity Available/planned surface linkages with transit and commuter systems Feeder systems designed to deliver intercity ridership Local circulation and access characteristics
Markets Critical mass of existing or developing businesses Absorption potential that corresponds to increased market access
Value Capture Potential Value proposition based on location, scale, connectivity and market factors Business case for high-density development
Page 30

Page 31
Regional/Commuter Served Centers
Amtrak Station
2010 Population in Market Area* Distance to Major City CBD
2010 Population in CBD Market
Area*New Carrollton, MD 5,409,400 12 miles to DC 5,207,500
30 miles to Baltimore 3,512,500Metropark, NJ 12,340,880 30 miles to Manhattan 15,315,800
70 miles to Philadelphia 5,177,700Stamford, CT 8,380,700 40 miles to Manhattan 15,315,800
43 miles to New Haven 1,827,500Providence, RI 4,063,352 52 miles to Boston 4,063,400
175 miles to Manhattan 15,315,800
Page 32
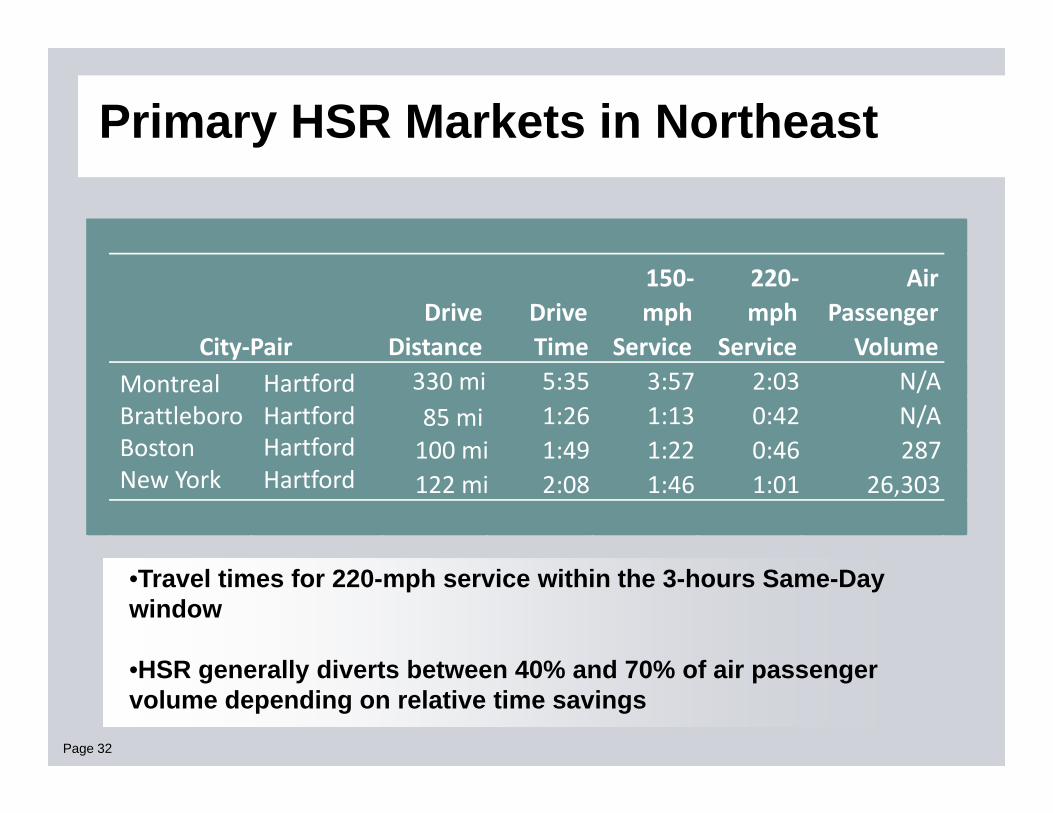
Primary HSR Markets in Northeast
•Travel times for 220-mph service within the 3-hours Same-Day window
•HSR generally diverts between 40% and 70% of air passenger volume depending on relative time savings
Drive Distance
Drive Time
150‐mph
Service
220‐mph
Service
Air Passenger Volume
330 mi 5:35 3:57 2:03 N/A85 mi 1:26 1:13 0:42 N/A100 mi 1:49 1:22 0:46 287122 mi 2:08 1:46 1:01 26,303
City‐PairMontreal HartfordBrattleboro HartfordBoston HartfordNew York Hartford

QUESTIONS?