Case studies on fish loss assessment of small-scale … FAO. 2017. Case studies on fish loss...
132
FAO Fisheries and Aquaculture Circular FIAM/C1129 (En) ISSN 2070-6065 CASE STUDIES ON FISH LOSS ASSESSMENT OF SMALL-SCALE FISHERIES IN INDONESIA
Transcript of Case studies on fish loss assessment of small-scale … FAO. 2017. Case studies on fish loss...

FAOFisheries and
Aquaculture Circular
FIAM/C1129 (En)
ISSN 2070-6065
CASE STUDIES ON FISH LOSS ASSESSMENT OF SMALL-SCALE FISHERIES IN INDONESIA

Cover photograph: Research and Development Centre for Marine and Fisheries Product Processing and Biotechnology, Ministry of Marine Affairs and Fisheries. Photo credit © RDCMFPPB

FAO Fisheries and Aquaculture Circular No.1129 FIAM/C1129 (En)
CASE STUDIES ON FISH LOSS ASSESSMENT OF SMALL-SCALE FISHERIES IN INDONESIA
Singgih Wibowo Bagus Sediadi Bandol Utomo Syamdidi Research and Development Center for Marine and Fisheries Product Processing and Biotechnology Ministry of Marine Affairs and Fishery The Republic of Indonesia Ansen R Ward Yvette Diei-Ouadi Siar Susana Petri Suuronen Food and Agriculture Organization Rome, Italy
FOOD AND AGRICULTURE ORGANIZATION OF THE UNITED NATIONS Rome, 2017

The designations employed and the presentation of material in this information product do not imply the
expression of any opinion whatsoever on the part of the Food and Agriculture Organization of the United
Nations (FAO) concerning the legal or development status of any country, territory, city or area or of its
authorities, or concerning the delimitation of its frontiers or boundaries. The mention of specific companies
or products of manufacturers, whether or not these have been patented, does not imply that these have
been endorsed or recommended by FAO in preference to others of a similar nature that are not
mentioned.
The views expressed in this information product are those of the author(s) and do not necessarily reflect the
views or policies of FAO.
ISBN 978-92-5-109462-4
© FAO, 2017
FAO encourages the use, reproduction and dissemination of material in this information product. Except
where otherwise indicated, material may be copied, downloaded and printed for private study, research and
teaching purposes, or for use in non-commercial products or services, provided that appropriate
acknowledgement of FAO as the source and copyright holder is given and that FAO’s endorsement of
users’ views, products or services is not implied in any way.
All requests for translation and adaptation rights, and for resale and other commercial use rights should be
made via www.fao.org/contact-us/licence-request or addressed to [email protected].
FAO information products are available on the FAO website (www.fao.org/publications) and can be
purchased through [email protected].

iii
PREPARATION OF THIS DOCUMENT This document presents the report of fish loss assessment case studies conducted within the framework of FAO’s Save Food programme and coordinated by FAO’s Fish Products, Trade and Marketing Branch (FIAM). Following the national capacity development workshop (National Workshop on Post-Harvest Fish Losses in Indonesia) on post-harvest fisheries loss assessment, held in Jakarta, Indonesia on 29–30 September 2014, in the aegis of the “Technology Expo on Marine and Fisheries Product Processing and Biotechnology 2014”, four loss assessment studies were conducted between October 2014 and September 2015. The first case study was on Muara Angke, where the research team was trained in carrying out loss assessment and getting familiar with the tools that were subsequently used in other fishing locations in Java: gillnet fisheries in Tegal, Central Java; gillnet fisheries in Gunung Kidul, Yogyakarta; and small pelagic processed fish in Brondong, East Java. The preliminary draft was submitted following the “National Workshop on Fish Loss Assessments: Causes and Solutions”, held on 3 November 2015. During the Workshop, participants:
exchanged lessons learned from the field research;
validated data on fish losses;
identified the critical control point of fish losses and efforts to reduce them; and
identified opportunities for collective action to be implemented at the local, regional and global levels.
The draft was thoroughly reviewed by FAO’s international consultant and post-harvest fisheries and fishing operations technical officers before the final version was then edited and published.

iv
FAO. 2017. Case studies on fish loss assessment of small-scale fisheries in Indonesia, by Singgih Wibowo, Ansen R. Ward, Yvette Diei-Ouadi, Siar Susana and Petri Suuronen. FAO Fisheries and Aquaculture Circular No. 1129. Rome, Italy.
ABSTRACT
The fish loss assessment methodology outlined by the Save Food programme (FAO, 2014) and with reference to earlier work by Ward and Jeffries (2000) and Diei-Ouadi and Mgawe (2011) had been used to undertake assessments in different locations in Java where the focus has been on particular fishing gear, fish species and products. These were major fishery products (with the main focus on squid products) in Muara Angke Fishing Port, North Jakarta, DKI Jakarta; gillnet fisheries in Tegal, Central Java; gillnet fisheries in Gunung Kidul, Yogyakarta; and small pelagic processed fish in Brondong, East Java. They were selected for their role in general fish supply, food security and employment, and for their prevalence in gillnet fisheries. The objective was to develop an up-to-date and detailed understanding of different types of losses affecting food security and stakeholders’ livelihoods. The key findings validated at the “National Workshop on Fish Loss Assessments: Causes and Solutions”, held on 3 November 2015, can be summarized as follows: Physical losses were generally negligible (about 5 percent). However, a key factor in fish waste
that affects this amount is the bycatch, which has a potential environmental and biodiversity impact. It is estimated that the annual loss for the total fleet annual is: 100 dolphins (5 tonnes), 100 turtles (5 to 200 kg each), 300 shark-suckers, crabs, murex and jellyfish, most of which in the net. Discards at sea (especially during the peak season) also occur and are cause for concern.
Poor quality raw material for processing, with substandard quality product identified only after thawing in the case of frozen products, forms the bulk of the quality losses. In addition to poor hygiene practices and facilities, another significant loss is the quality loss due to prolonged soaking time, i.e. 12 hours. This, combined with prolonged and poor on-board handling and storage, lead to 24.9 tonnes (99 percent in weight) in reduced quality, which is equal to a 28 percent loss in value per trip of the catch in locations such as Tegal.
Market force losses are not considered significant, but do occur during religious holidays when demand is low. Low demand is often followed by periods of high demand.
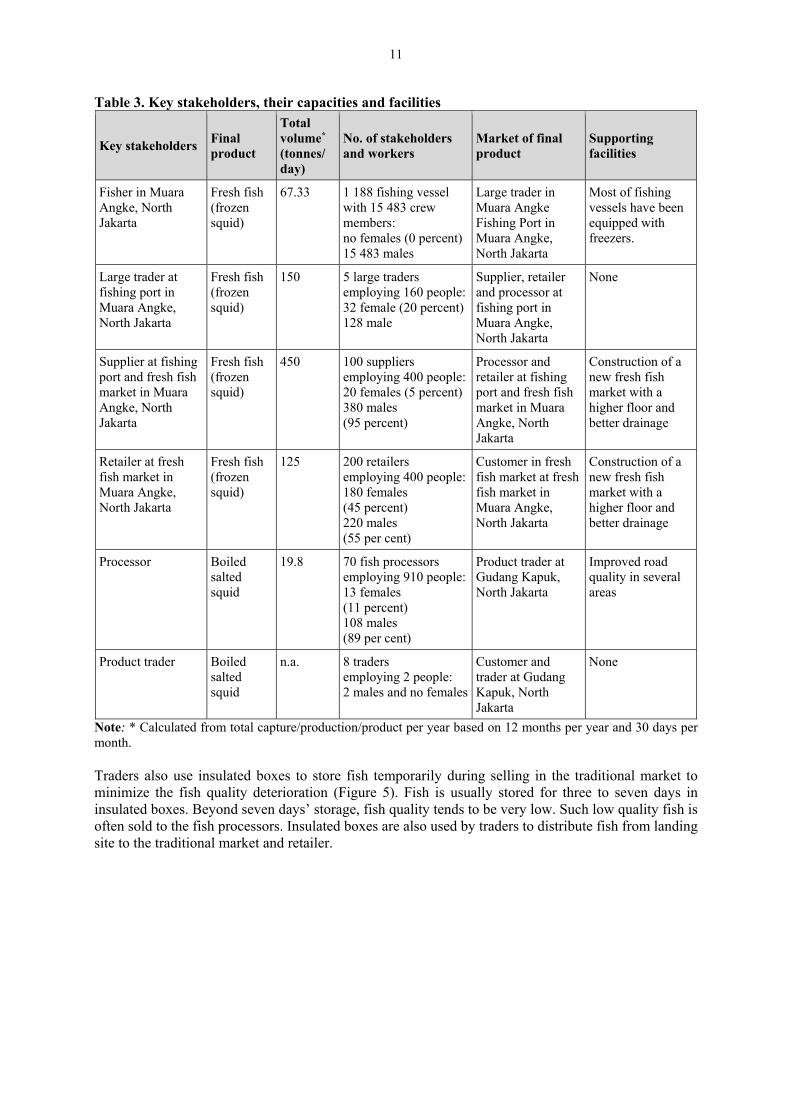
Recommended interventions in the fields of policy, legislation, technology, infrastructure and services, knowledge and skills have been identified, the most recurrent of which across study locations are: Ensure access to an adequate supply of affordable potable water for hygiene, sanitation, processing
and ice making. Experiment with alternative gear types to curb “ghost fishing” by lost gillnets. Also, locations where
fishers use better practices (shorter net soaking times in Gunung Kidul) can be used to demonstrate the benefits in terms of reducing quality loss.
Address the market force and quality losses by improving storage facilities (numbers and capacities) and their management to leverage against price and supply fluctuations. Consider a resi gudang (the warehouse receipt or “storage cheque”) system as per UU No. 9/2006 (Law No. 9/2006) for application in the fishery sector. Lessons learned from the past use of resi gudang should be used to guide all interventions to better manage the gap between supply and demand during and after religious holidays.

v
CONTENTS Page Preparation of this documents iii
Abstract iv
Abbreviations and acronyms vi
Executive Summary vii
Introduction 1
Methodology 1
Past and ongoing loss reduction interventions in Indonesia 3
A. Fish loss assessment on boiled salted squid product in Muara Angke, north Jakarta, DKI Jakarta 5
B. Fish loss assessment on gillnet capture fisheries in Tegal 25
C. Fish loss assessment on gillnet capture fisheries in Gunung Kidul, Yogyakarta 51
D. Fish loss assessment on small demersal fish in Brondong, east Java 73
ANNEXES 1. Community participatory survey form 95 2. Selected value chain actors’ participatory survey form 105

vi
ABBREVIATIONS AND ACRONYMS EFLAM Exploratory Fish Loss Assessment Method FAD Fish aggregating device GHP Good handling practices GMP Good manufacturing practices GT Gross tonnage IDR Indonesian rupiah (IDR13 500/US$1, in 2015) LT Load tracking MMAF Ministry of Marine Affairs and Fishery PPHPT Pusat pengolahan hasil perikanan tradisional (traditional fishery products processing
centre) PKPP Pengelola Kawasan Pelabuhan Perikanan (Management of Fishing Port Area) PPI Pelabuhan Pendaratan Ikan (fish landing port) RDCMFPPB Research and Development Center for Marine and Fisheries Product Processing
and Biotechnology TPI Tempat Pelelangan Ikan (fish landing centre) UPT Unit Pelaksana Teknis (local technical authority)

vii
EXECUTIVE SUMMARY This is a summary of the results of fish loss assessment case studies conducted by the FAO SAVE FOOD programme. Between October 2014 and December 2015, the Koperasi Artha Mina (KAM) conducted four post-harvest fish loss assessment case studies under this Programme. The case studies were: Major fishery products (focused on squid) in Muara Angke Fishing Port, North Jakarta, DKI Jakarta; Gillnet fisheries in Tegal, Central Java; Gillnet fisheries Gunung Kidul, Yogyakarta; Small pelagic processed Fish in Brondong, East Java. Using the Save Food loss assessment methodology, activities undertaken for each case study focused on the Exploratory Fish Loss Assessment Method (EFLAM) followed by the quantification of key losses through Load Tracking (LT). The aim was to understand in detail the physical losses and the quality and market force losses, the levels of loss, the critical loss points in the value chains and potential loss reduction interventions. The research culminated in a National Workshop on Fish Loss Assessments: Causes and Solutions held on 3 November 2015 in Jakarta, Indonesia, during which the participants: exchanged lessons learned from the field research; validated data on fish losses; identified the critical control point of losses and efforts to reduce fish losses; identified opportunities for collective action to be implemented at the local, regional and global
levels. Table 1 summarizes the key losses and proposed interventions from the case studies, which is followed by a short overview of data from each location.

viii
Table 1. Key losses and potential interventions
Location/ key loss Policy Legislation Technology Infrastructure and services
Knowledge and skills
MUARA ANGKE Poor quality raw material for processing.
Consider a resi gudang (the warehouse receipt or “storage storage cheque) system as per UU No. 9/2006 (Law No. 9/2006) for application in the fishery sector.
Develop a standard processing method for boiled and dried squid – simple guide to processing and handling.
Improve/ ensure a more efficient thawing process- Adopt better/more durable processing equipment such as boiling pans Reorganize processing units for better process flow-
Improve general hygiene and sanitation, drainage, infrastructure of all areas and transport from port to processing area. Ensure access to sufficient supply of affordable potable water for hygiene, sanitation and processing operations, and ice making. Ensure access to credit, drawing on lessons learned from the past use of a resi gudang system to better manage the gap between supply and demand, during and after religious holidays.
Build capacity for fishers and fish processors through knowledge of the use of better technology, handling fish, hygiene and sanitation. Use practices in the export chain to impart changes to the domestic processing practices.
TEGAL Incidental bycatch. Long net soaking times and poor on-board handling leading to 28 percent loss in the value of catch.
Consider a resi gudang (the warehouse receipt or storage cheque system as per (Law No. 9/2006) for application in the fishery sector.
In collaboration with fishers, map areas where turtles and sharks are caught and develop a plan to regulate the use of these areas.
Encourage fishers to shorten soaking time of gillnets (to up to 6 hours) and encourage the use of mechanized hauling equipment. Apply shorter soaking times of gillnets in Gunung Kidul, which results in better quality fish. Gunung Kidul can be
Upgrade the jetty facility by roofing to improve handling and working conditions. Ensure access to credit drawing on lessons learned from the past use of the resi gudang system to better manage the gap between supply
Build capacities to improve handling, hygiene and sanitation of on-board handling and processing Build capacities improve handling, hygiene and sanitation of on-shore handling and processing

ix
Location/ key loss Policy Legislation Technology Infrastructure and services
Knowledge and skills
Loss in quality (about 5 percent in value and volume terms) due to poor on-shore handling, hygiene and sanitation.
used as an example of good practice. Encourage greater use of ice and insulated containers/transport on-shore and for distribution
and demand, especially for the adequacy during and after religious holidays.
GUNUNG KIDUL Discards at sea (especially during the peak season so almost all of the fish are discarded). “Ghost” fishing. Theft of fish (12.5 percent). Poor on-board handling (Sadeng) leading to 15 percent of catch sold for a 25 percent lower price.
Establish stakeholder dialogue to consider improved management to address the illegal sale of undersized and berried lobsters. Consider resi gudang (the warehouse receipt or storage storage cheque system as per UU No. 9/2006 (Law No. 9/2006) for application in the fishery sector.
Experiment with alternative gear types, e.g. bamboo traps, which could be adopted by fishers in Tabanan, Bali to curb “ghost fishing” by lost gillnets.
Change the type of container used for fish transport or other locally identified solutions, hire private security, empower and better involve the committee appointed by the Governor.
Build capacity in proper on-board handling.
BRONDONG Poor on-board handling leading to 22 percent of catch sold for 30 percent lower price.
Consider a resi gudang (warehouse receipt or “storage cheque”), as per UU No. 9/2006 (Law No. 9/2006 for application in the fishery sector.
Improve ice production capacity and quality of ice Improve storage facilities
Improve the landing capacity of the harbour. Increase the depth of waters surrounding landing area of the harbour.
Build capacity in proper on-board handling.

x
Muara Angke – Squid Physical losses were found to be negligible. Quality loss affects the selling price. Based on an analysis of samples, 95 percent of squid is good quality and 5 percent is broken. Large and good quality squid is usually exported; small and low quality squid are processed in Muara Angke for the domestic market. Key issues are: There is poor handling on-board fishing vessels including delays in freezing on-board; Sub-standard quality product is only identified after thawing. When this low quality product is
processed it results in a lower final product yield and a lower quality final product; During transportation, products are poorly handled; Quality loss is associated with periods of high production and during the rainy season; There are poor hygiene and sanitation conditions at the processing units; There is a lack of storage at the processing units and the thawing of the frozen squid occurs outside
on the ground when volumes are high; Quality deterioration occurs during storage; Large-scale traders are not concerned about price declines provided that the squid can be sold; Small-scale fish processors are the most affected. Market force losses are not deemed significant, but occur during religious holidays when demand is low. Low demand is often followed by periods of high demand. In terms of reducing quality losses and improving food safety, the following interventions are recommended:
Improve general hygiene and sanitation, drainage, infrastructure of all areas and transport from port
to processing area; Improve storage facilities (numbers and capacities) and its management to leverage against price
and supply fluctuations. Consider a resi gudang (warehouse receipt or “storage cheque”) system as per UU No. 9/2006 (Law No. 9/2006) for application in the fishery sector. Lessons learned from the past use of resi gudang should be used to guide all interventions;
Reorganize processing units for better process flow; Develop a standard processing method for boiled and dried squid to be documented into a simple
guide to processing and handling; Improve and render the thawing process more efficient, bearing in mind time constraints; Access to sufficient supply of affordable potable water for hygiene, sanitation and processing
operations, and ice making; Transfer practices used in the export chain to domestic processing practice; Provide better more durable processing equipment such as boiling pans; Build capacity of fishers and fish processors through knowledge and use of better technology,
handling fish, hygiene and sanitation.
Tegal – gillnet fishery of small pelagics Bycatch is a key fish waste factor, which is more of an environmental in nature and entails biodiversity loss during fishing. The bycatch is estimated for the total fleet annual loss at 100 dolphins (5 tonnes), 100 turtles (5 to 200 kg each) and 300 shark-suckers, crabs, murex and jellyfish, most of which die in the net. The quality loss data from six vessels indicates deterioration due to prolonged soaking time, e.g. 12 hours. This combined with prolonged and poor on-board handling and storage leads to 24.9 tonnes (99 percent in weight) in reduced quality, which is equal to a 28 percent loss in value per trip of the catch. This amounts to an estimated average loss of potential income per vessel per trip of

xi
IDR21 000 000. Assuming 39 vessels make on average 7 trips per year and an average catch of 4.2 tonnes, a price of IDR45 000 per kg for grade 1 and IDR8 000 for low quality (depending on species), the estimated loss in income per annum to the gillnet fleet due to quality deterioration alone would be IDR5 733 000 000 (US$441 000). On landing, good quality fish enters the fresh fish retail chain and low quality is either processed or sold fresh. Between landing and before transport (two to three hours) for processing (salting and drying), poor handling, inadequate cooling, lack of space and exposure to ambient conditions lead to a 4 percent loss in weight or in value of fish. Losses are deemed negligible during and after processing. For reducing quality losses and improving food safety, the following interventions are recommended: Encourage fishers to shorten the soaking time of gillnets (to up to six hours) and use mechanized
hauling equipment. The shorter soaking time of gillnets in Gunung Kidul result in better quality fish. Gunung Kidul can be used as an example of better practice to be shared with Tegal fishers;
Upgrade the jetty facility by roofing to improve handling and working conditions; Encourage greater use of ice and insulated containers/transport on-shore and for distribution; In terms of food safety, improve handling, hygiene and sanitation of on-board handling and
processing; In collaboration with fishers, map areas where turtles and sharks are caught and develop a plan to
regulate the use of these areas. Gunung Kidul – gillnet fishery During the peak season, catches can be so high that there is no room and not enough ice on board so almost all of the fish are discarded, which could reach 500 kg per trip per vessel at sea, leading to physical losses. This is particularly associated with small vessels (outboard motor fishing vessels). It is estimated that there are 4 500 fishers in Gunung Kidul that target lobster and most vessels that fish lobster with gillnets incur some discards. Total gear loss leading to ghost fishing1 in Gunung Kidul that targets lobster could reach 86 panels of fish aggregating device (FAD) drift gillnet, 4 000 panels of pepetan lobster set gillnet, 90 panels of tanggungan lobster set gillnet, 150 panels of bottom gillnet and 60 000 lobster tangle net (krendet) per year, because the gears are stuck in the coral reef, especially when there are high waves and huge amounts of fish are caught. Approximately 22.5 percent of fish landed is given away or stolen: 10 percent is given to labourers and staff and 12.5 percent is classified as theft and is taken by local people. This amounts to 1.5 tonnes of fish which at a selling price of IDR11 500 results in lost income of IDR17 250 000 per trip in Sadeng port alone. This would amount to IDR 345 000 000 or US$26 500 per annum per vessel. The proportion that is “stolen” is valued at US$12 000. Quality loss is associated with Sadeng where fishing trips are relatively longer (five to 14 days). Based on an average catch per vessel per trip of 6.5 tonnes, approximately 15 percent (1 tonne) of fish by weight is downgraded due to soaking time. In other ports, vessels are day fishing and quality losses are negligible and tend to land a higher proportion of good quality fish. Assuming a price of IDR11 500 for good quality and IDR8 500 for low quality, the lost income per trip amounts to IDR3 000 000 per vessel which is approximately 4 percent by value of the catch. Extrapolating the data based on 79 vessels making on average 20 trips per year each, the lost income due to quality deterioration would be IDR4 740 000 000 (US$364 615) per annum.
1 The ability of abandoned, lost or otherwise discarded fishing gear (ALDFG) to continue to fish is often referred to as “ghost fishing”. Ghost fishing may have detrimental impacts on fish stocks, food security, endangered species and benthic environments.

xii
In terms of market force losses, during the high season (July to October) when catches tend to be the highest, the selling price of fish drops. Due to oversupply, the price can drop by up to 50 percent during the peak of the high season (for a one-month period) compared to the price of fish at other times in the season. In terms of reducing quality losses and improving food safety, the following interventions are recommended: Prevention of theft is a priority for fishing vessel owners and fishers, but has proved difficult to deal
with. Some form of participatory stakeholder dialogue is proposed at the site to decide on a way forward, such as hiring private security, changing the type of container used for fish transport to have a lid or insulated, reshuffling and redynamizing the committee appointed by the Governor, or other locally identified solutions;
Address the illegal sale of undersized and berried lobsters through a locally developed management plan, which may include the introduction of effective and agreeable management measures, education/awareness raising and market intervention;
Experiment with alternative gear types, e.g. bamboo traps, which could be adopted from fishers in Tabanan, Bali to curb “ghost fishing” by lost gillnets. Also locations where fishers use better practices (shorter net soaking) can be used to demonstrate the benefits in terms of reducing quality loss;
Improve storage facilities (numbers and capacities) as well as its management to leverage against price and supply fluctuations. Consider a resi gudang (warehouse receipt or “storage cheque storage cheque”) system as per UU No. 9/2006 (Law No. 9/2006) for application in the fishery sector. Lessons learned from the past use of resi gudang should be used to guide all interventions.
Brondong – mini trawl During unloading to weighing and then to the processing area, 3 percent of fish is lost due to theft, which amounts to approximately 500 kg of fish per day for the entire site. Some of this fish are taken in lieu of cash payment for weighing fish and other supporting activities. Some fish (0.2 percent) fall from containers on-shore and are crushed under foot. Fish processors traditionally add 5 percent more fish to packs of beheaded fish as a “gift” for export buyers. This is not a physical waste but a loss of income to fish processors. Drip loss also leads to a 5 percent loss in fish weight to fish processors. Quality deterioration through time temperature abuse on-board fishing vessels results in a 30 percent price reduction. Based on an average fishing trip of 14 days, it is estimated that 22 percent by weight (on average 2.2 tonnes) of fish (9 percent by value equivalent) has deteriorated by the time of landing (if the time between fishing and unloading is more than 14 days). The value of this loss is estimated at IDR12 100 000 per vessel per trip. Assuming 15 vessels (from 45) per day are affected by this loss, then IDR181 500 000 per day is lost in terms of potential income to the fleet. On an annual basis this indicates a potential loss in income due to quality deterioration for the fleet of IDR66 247 500 000 (US$5 095 961). Late landing may also suggest to buyers that fish on-board are of a lower quality. It can also lead to a delay in landing/unloading until the following day, furthering the deterioration of fish quality. Late landing increased due to limited landing capacity and shallow water during low tide. Demand for ice is high and hence it is produced quickly and not frozen properly. Ice quality is therefore generally poor (substandard cooling capacity), in inadequate supply and is contributing to quality deterioration. When vessels land late, there is a risk that buyers (demand) will already have bought sufficient fish for their needs so the price at first point of sale is low. Market force loss also occurs at times of religious holidays.

xiii
Here, fish production is increasing annually and may be outpacing the development of ancillary onshore infrastructure and industries such as ice production. This observation may help explain some of the handling and processing problems at other sites. In terms of reducing quality losses and improving food safety, the following interventions are recommended: Improve the landing capacity of the harbour from 30 vessels to a capacity of at least 45 vessels; Increase the depth of waters surrounding landing area so that in case of low tide, the vessels are still
able to land; Improve ice production capacity, leading to increased availability of better quality ice; Improve storage facilities (numbers and capacities) and its management to leverage against price
and supply fluctuations. Consider a resi gudang (warehouse receipt or “storage cheque”) system as per UU No. 9/2006 (Law No. 9/2006) for application in the fishery sector. Lessons learned from the past use of resi gudang should be used to guide all interventions;
Roof the sorting area to reduce exposure of fish to high ambient conditions and to improve working conditions;
Build capacity of fishers in proper on-board handling including good icing practice.


1
INTRODUCTION Indonesia’s fisheries production has grown significantly, from 9.82 million tonnes in 2009 to 20.72 million tonnes in 2014 (6.2 million tonnes from capture fisheries and 14.52 million tonnes from aquaculture). Production is now valued at IDR212.9 trillion (2014), with a GDP contribution of nearly 7 percent. Capture fisheries production is likely to have peaked. The emphasis, going forward, has been placed on conservation and management of resources, with production now more reliant on aquaculture. Nevertheless, demand for fish is predicted to increase, due primarily to population growth. One of the strategies to meet growing demand is to reduce post-harvest losses, estimated in Indonesia to be up to 30 percent. Key to reducing losses is recognizing that there are different types of loss and that they are influenced by a wide range of variables such as fishing gear type, processing method, season, species, time/temperature, access to infrastructure and services, and skills and knowledge of operators, among others. Hence, losses will vary in type and magnitude within and between value chains. Understanding losses in such detail is vital if effective solutions are to be identified and implemented successfully. The eradication of food insecurity and the reduction of food loss and food waste are more than ever a priority of the global development agenda. FAO’s mandate is to eradicate hunger and malnutrition; reducing fish loss is a policy objective of its Code of Conduct for Responsible Fisheries (CCRF). In 2011, together with various partners, FAO embarked on SAVE FOOD – The Global Initiative on Food Loss and Waste Reduction. Recognizing the mutual benefits of the programme, in 2014 the Koperasi Artha Mina (KAM), Indonesia and FAO began a fish loss assessment and reduction initiative in Indonesia, the objective of which is to identify and quantify the main causes of losses in selected fishery supply chains, and identify and implement appropriate loss reduction measures, taking into consideration technical, economic, social, environmental costs and benefits. Four case study assessments were undertaken in different locations in Java: Muara Angke (Jakarta), Tegal (Central Java), Gunung Kidul (Yogyakarta) and Brondong (East Java). The investigations focused on three types of food loss: physical (complete loss/waste), quality (quality deterioration leading to loss of income/food safety concerns and/or nutritional attributes loss) and market force (income loss not directly linked to quality deterioration). The remainder of the report describes the methodology used and past and ongoing loss reduction interventions. It also presents separate case study reports including potential loss reduction interventions. METHODOLOGY The fish loss assessment method was based on the methodology outlined by the Save Food Programme (FAO, 2014) and with reference to earlier work by Ward and Jeffries (2000) and Diei-Ouadi and Mgawe (2011). These methods had also been used previously in Indonesia to estimate fresh fish losses at landing (Wibowo et al., 2014a; 2014b), during fish filleting and boiled salted fish processing in Central Java (Utomo et al., 2013; Utomo et al., 2014). The assessment process combined four activities: preliminary screening, EFLAM, load tracking (LT) and solution finding. The objective was to develop a current and detailed understanding of different types of losses affecting food security and stakeholders’ livelihoods, especially physical losses, quality losses and market force losses. Quality loss having important implications in terms of income to producers, market access and food safety. Reference is also made to bycatch/discards in relation to gillnet fisheries, which are often classified as a type of physical loss, as well as to the deterioration in quality as a consequence of long soaking time (FAO, 2015).2 The assessments were undertaken in different locations in Java. The following summarizes the key stages of the assessment process.
2 Proceedings of the Expert Workshop on Estimating Food Loss and Wasted Resources from Gillnet and Trammel Net Fishing Operations, 8-10 April 2015, Cochin, India. FAO Fisheries and Aquaculture Proceedings 44. Rome.

2
Preliminary screening Preliminary screening of fish losses was carried out using secondary data, documentation and reports, and expert consultations (by phone, in person, internet) without travel to the field. Local authorities responsible for fish landing site, fresh fish market, and fish processing centres were contacted by phone for information related to fish landed, marketed, and processed. This helped to target and plan the EFLAM process.
Exploratory fish loss assessment
A qualitative research method, the Exploratory Fish Loss Assessment Method (EFLAM) (FAO, 2014; Ward and Jeffries, 2000) was used to generate primary data collection mainly using semi-structured interviews (SSIs). The EFLAM interviews and discussions were guided by a checklist (see Annex 1). Data collection centred on stakeholder group discussions with fishers, traders and fish processors who were knowledgeable about activities at the target location. Discussions also involved the local authorities responsible for overseeing or supporting fish landing, trading and processing activities. In conjunction with the SSI, activities and conditions were directly observed of fishing boats, fish markets and fish processing centres. Respondents were selected on the basis of recommendations of the fishing port and the fishing authorities.
The assessments were conducted in four locations and within each location, there was a focus on particular fishing gear, fish species and products. The reasons for location choice and why particular gears, species and products were chosen are summarized in Table 1. Muara Angke was the first case study that combined capacity building of the research team with application of the loss assessment process. Table 1. Case study location summary
Province Location Focus Reasons for choice
Jakarta Muara Angke Boiled salted squid Location plays a very important role in terms of general fish supply and food security to the local population (Jakarta), domestic, regional (international) markets. Squid is the most important product landed in terms of volume and value, and boiled salted squid is the most important processed product in terms of volume and value. Providing employment for many thousands of fishers, traders and fish processors and ancillary workers.
Central Java Tegal Gillnet fishery Very high volumes of fish are landed. This is the centre for gillnet fishery. This site was chosen due to the need for a gillnet loss assessment-
Yogyakarta Gunung Kidul Gillnet fishery Very high volumes of fish are landed. This is the centre for gillnet fishery, which was chosen due to the need to conduct a gillnet loss assessment. There are indications that the prevalence of “ghost fishing” is high in the coral reef area.
East Java Brondong Modified mini trawl/ Danish seine (cantrang/payang)
There are 16 000 fishers, over 80 percent of traders and fish processors, are women (at least 3 000). Two hundred tonnes of fish are landed per day. It is a high production area and also important for food security and employment.

3
Load tracking to quantify key losses Information from EFLAM was used to help design and focus load tracking (LT), which is a quantitative method used to measure key losses between two stages in a supply chain of the selected species and product.
Validation and solutions
Based on the findings of the assessment process, efforts were made to identify loss reduction measures or solutions that would form the basis of interventions. The case studies and interventions identified were discussed and validated at a national dissemination workshop in Jakarta in November 2015.
The results of the assessments are presented as four case studies. These studies highlight the occurrence, causes and implications of different types of loss as well as who is most affected, where the critical loss points in the value chains are, and potential solutions. PAST AND ONGOING LOSS REDUCTION INTERVENTIONS IN INDONESIA This section of the report summarises the key stages in Indonesian fish value-chains and major loss reduction initiatives. The generalized fish supply chain is based on either wild capture fisheries or aquaculture. A simplistic overview of supply chain components is given in Table 2. Table 2. Fish supply chain summary
Technology support
Production Collection/ transportation
Processing/ Value added
Distribution Sales
Fishing gear Fish hold Expertise
Wild capture Fishing companies Traditional fishers
Collection from fishing vessels/boat, transport to auction site Harvest from lakes/open waters Transport to local markets
Non-conventional processing Conventional processing Byproducts/ waste
Planes Trucks Retail
Large-scale buyers/ Importers Restaurants/ retailers Consumers
Feed Nets Fertilizer Expertise
Aquaculture Floating nets Mariculture
Collection from ponds Harvest from floating cage on open waters and sea transport to auction site/local markets
Mostly conventional processing By-products/waste
Trucks Retail
Restaurants/ retailers Consumers
Since 2000, Indonesia has been committed to integrating the Millennium Development Goals (MDGs) into its national development programme. The Ministry of Marine Affairs and Fisheries (MMAF) has aimed to revitalize and industrialize the sector. In 2008, it initiated a monitoring system for post-harvest fish loss in 33 regencies, but this was discontinued in 2012 due to internal policy changes. The monitoring was carried out at the fish landing point through a questionnaire for collecting data. The result showed that fish loss at the point of landing was between 5.85 and 7.11 percent in value, depending on fish species, method of capture, fishing vessel tonnage, duration of fishing trip, location of the capture, and port handling.

4
Efforts have been made to develop the cold chain system, especially for capture fisheries. On-board freezing for fish was improved, insulated vessel holds were installed, cold storage was used in almost all of the 1 409 fishing posts, ice production facilities were introduced, fish transportation was strengthened through refrigeration, and the use of insulated boxes was promoted. Between 2009 and 2014, MMAF developed 76 cold storage units with a total capacity of 3 680 tonnes. Current total capacity of cold storage in Indonesia (including private companies) is 7.2 million tonnes for fish to accommodate total production of 14 million tonnes. This is higher than the 1.9 million tonnes for chicken and 400 000 tonnes for beef. MMAF in 2015 provided IDR235 billion for developing 58 cold stores with a capacity of 100–300 tonnes per unit, air blast freezers, and 38 ice making factories. In 2015, at least seven foreign investors were ready to invest a further IDR550 billion. In addition to cold storage, MMAF has initiated a system for national fish logistics (Sistim Logistik Ikan Nasional, or SLIN). The aims of the system are to: (i) increase capacity and stability of fisheries production and marketing systems; (ii) strengthen and widen connectivity between production system upstream and downstream; and (iii) increase management efficiency of fish supply chains. The system will include support for fish procurement, storage, transportation and distribution activities, and was expected to be effective in 2015. In 2015, SLIN (national fish logistics system) was initiated as a project. In 2017, a Directorate of Logistics of the Directorate General for Strengthening the Competitiveness of Marine and Fisheries (Ministry of Marine Affairs and Fisheries) was established (Ministry decree no. 6/2017). In 2007, the Research and Development Center for Marine and Fisheries Product Processing and Biotechnology began field trials to improve tuna handling on board (Pelabuhan Ratu, 2007–2009; Pacitan and Bitung, 2012–2015) by installing insulated fish holds on artisanal fishing vessels. The results were positive with improvements in quality and loss reduction.

5
A. FISH LOSS ASSESSMENT ON BOILED SALTED SQUID PRODUCT IN MUARA ANGKE, NORTH JAKARTA, DKI JAKARTA
Singgih Wibowo Syamdidi Agus Heri Purnomo Bagus Sediadi Bandol Utomo Rinta Kusumawati Diah Ikasari Hasta Octavini Research and Development Center for Marine and Fisheries Product Processing and Biotechnology Ministry of Marine Affairs and Fisheries The Republic of Indonesia Ansen R. Ward Consultant Food and Agriculture Organization Rome, Italy

6
1. INTRODUCTION AND BACKGROUND Muara Angke was the first case study location and enabled the research team to gain an understanding of losses affecting fishers, traders and fish processors in general as well as losses associated with the target species/product. This information is reflected in the following case study description. Muara Angke is a suburb of North Jakarta, in the district of Penjaringan, as shown in Figure 1. Figure 1. Location of Muara Angke
Source: Dapur Peta, 2012. 1.1. Status and importance of Muara Angke Fishing Port Muara Angke Fishing Port is a major fishing port in Jakarta consisting of a fish landing place, fresh fish market, fish processing area and other supporting facilities. It serves fishing vessels operating on fishing grounds throughout Indonesia. Fish is also transported and landed here from West Java, Central Java and even East Java. Fish from the port is distributed to Jakarta, Bogor, Tangerang, Depok and Bekasi. Some of the fish are dried and salted, and smoked, and others are processed in other ways. The port

7
plays a very important role in terms of fish supply to the domestic and regional markets, as well as export markets. There is a tendency for better quality fish to be exported, while the low quality or undersized fish is sold locally, or processed into various secondary products. The three major infrastructures for fisheries activity in this area are a fishing port and fish landing, a fresh fish market, and a fish processing area. Each infrastructure is equipped with important facilities such as fish landing, loading and unloading, transportation and fish processing. The layout of the fisheries infrastructure and facilities at Muara Angke is shown in Figure 2.
Figure 2. Layout of the fisheries infrastructure and facilities at Muara Angke Fishing Port
Source: Streetdirectory.
There are 101 fish species landed in Muara Angke Fishing Port, squid being the most dominant fish landed. Table 1 shows the fish volume and value landed in Muara Angke Fishing Port according to species. Table 1. Major fish species landed in Muara Angke Fishing Port, 2014
No. Fish species Scientific name Annual production Volume of fish landed (tonnes)
Value of fish (IDR1 000 000)
1 Cumi (squid) Lolygo sp. 9 264.30 41 714.63 2 Layang (scad) Decapterus sp. 2 653.12 9 021.05 3 Lemuru (oil sardine) Sardinella lemuru 1 149.16 4 201.61 4 Bentong (bigeye scad) Selar crumenophthalmus 942.44 3 434.28 5 Selar, selar kuning (yellowstripe scad) Selaroides leptolepis 795.05 3 759.79 6 Tembang (fringescale sardinella) Sardinella fimbriata 761.82 2 992.32 7 Selar tetengkek (terpedo scad) Megalaspis cordyla 757.69 2 277.11 8 Sardin (sardine) Sardinella sp. 735.16 3 334.47 9 Tenggiri (Spanish mackerel) Scomberomorus sp. 685.19 4 168.11 10 Cakalang (skipjack) Katsuwonus pelamis 606.63 2 055.27 11 91 other species 6 223.53 23 849 Total 24 574.06 100 808

8
Squid is the most dominant commodity to be processed into boiled salted squid. Table 2 shows the fish product volume and value processed in Muara Angke fishing port based on the fish species. Table 2. The amount of fish processed in the Pusat pengolahan hasil perikanan tradisional
(PPHPT, traditional fishery products processing centre), Muara Angke No. Fish species Scientific name Sources
M. Angke (kg) M. Baru (kg) Total (kg)
1 Squid Lolygo sp. 5 372 700 1 741 500 7 114 200
2 Fringescale sardinella Sardinella fimbriata 1 615 500 537 800 2 153 300
3 Shark Carcharinus sp. 1 987 100 91 000 2 078 100
4 Small tuna Euthynnus affinis 955 900 682 300 1 638 200
5 Scad Decapterus sp. 732 300 842 000 1 574 300
6 Lesih 920 100 502 400 1 422 500
7 Yellowstripe scad Selaroides leptolepis 798 400 288 600 1 087 000
8 Oil sardine Sardinella lemuru 718 300 302 100 1 020 400
9 Stingray Dasyatis uarna 717 200 95 800 813 000
10 Indian mackerel Rastrelliger sp. 519 130 167 500 686 630
11 19 other species 2 242 500 808 000 3 050 500
Total 16 579 130 6 059 000 22 638 130
Based on these data, boiled salted squid was the most dominant product and therefore, it was the FSC selected in this study. Muara Angke also has an auction site, an on-site scale, simple transportation equipment (gerobak dorong) for transporting fish from fishing vessels to the auction site, and plastic baskets for handling fish during unloading, transportation and auctioning. There are also refrigerated trucks to transport frozen fish to cold storage or fish containers for export.
a) Services There are good facilities for fish handling at the fishing port. Freshwater supply for cleaning the fish is available as well as water for cleaning the floor. There is a water hose at the fish auction site for cleaning the floor after the fish auction. There is also a power supply for fish handling activities at the auction site and around the fishing port.
b) Hygiene and sanitation issues Facilities for fish hygiene and sanitation are available. The floor of the auction site has been paved with ceramic tiles and there is drainage. Toilets, fences and a high-pressure water hose are also available. Although all facilities are available in the fishing port area, the sanitation conditions of the port environment are not very good due to a poor management system and the carelessness of the people and the fishers in general. 1.2. Inventory of activities and stakeholders and lessons learned from past and ongoing interventions A new building of the Muara Angke Fish Market was built by the Government in April 2015; it is hoped that the traders wil be able to compete with the modern market and attract more customers. In the past, people were reluctant to visit the market because the place was dirty and overcrowded, and smelled foul. With this construction, the traders and fishers' welfare can be improved. The local government working unit known as Satuan Kerja Pemerintah Daerah (SKPD) is expected to always work in synergy to develop infrastructures such as roads, parks, ice factories, and larger parking lots in order to support the activities of traders and fishers. In addition, a seafood centre will also be built to attract more people in future. The area of Muara Angke Fish Market is 9 800 m2 and can accommodate 1 354 kiosks. It has

9
several facilities including fish processing centre. Now, as many as 640 traders from surrounding places have already been relocated to the new market. A photo of the inauguration of the Muara Angke fish market is shown in figure 3. Figure 3. Fish trading activity in new Muara Angke Fish Market, Penjaringan, North Jakarta, 15 April 2015
Photo credit © PPHPT 2. OVERVIEW OF SUPPLY CHAIN AT MUARA ANGKE The fish supply chains at Muara Angke are complex, as summarized in Figure 4. There are two main sources of fish landed at Muara Angke: the first is from the north coast of Java mainly from Juana, Rembang and Brondong, and transported by land; and the second is from other islands, mainly from Kalimantan, Sulawei and Papua, and is transported by sea. The landed fish is first bought by big traders and subsequently sold to suppliers, small traders and exporters, or sent to fish processors. Supplies market their fish to traders in other cities or sold fresh to restaurants, or sent to the fish processors where it is processed into traditional products such as dried salted fish, smoked and boiled salted squid, and semi-processed products such as headless, fillet or pre-eviscerated fish. Jakarta, Bogor, Depok and Bekasi (Jabodetabek) and Bandung are the main market for both fresh and processed products. The processed products are mainly sent to product warehouse at Kapuk, about 10 km from the processing centre at Muara Angke and subsequently sold to small traders, retailers or directly sold to consumers.

10
Figure 4. Overview of the fish supply chain in Muara Angke Port
Source: © RDCMFPPB Note: PT= processing technique; DH = delayed handling; DI = delayed icing; MF = Market force losses. M.A = Muara Angke. 2.1. Key stakeholders in the supply chains at Muara Angke The main activities at Muara Angke involve fishers, large and small traders, supplier and fish processors. Table 3 summarizes these different groups. a) Fishers Data indicate that there are approximately 1 200 fishing vessels and 15 500 fishers. Most of the fishing vessels are equipped with on board freezers and cold storage. Up to 90 percent of fish landed are frozen at sea. There are very few artisanal vessels (small boats, usually under 10 GT, using traditional fishing techniques and low technology). Based on secondary data, there are only six boats under 10 GT in Muara Angke, 799 boats between 10 and 30 GT, and 383 boats over 30 GT. It shows that fishers in Muara Angke are no longer artisanal fishers. The most popular fishing vessels used by the fishers in Muara Angke are bouke ami (a squid fishing vessel that use nets) (1 064 vessels), followed by purse seine (154 vessels) and gillnet (40 vessels). b) Traders There are five large-scale traders, 100 suppliers and 400 retailers. Large traders have access to the fishing port (jetty, toilets) and auction site (fence, clean floor, high-pressure water hose, good drainage, etc.), and transport fish from landing site to the trading place (truck with refrigerator, trolley, motorcycle supported with insulation box). Cold storage is provided for the large traders to store fish when the supply is abundant. This facility helps maintain the quality of fish and prevents both quality and market force losses. Suppliers usually work from the auction site to buy fish from large traders and carry the fish to traditional fish markets (clean, good drainage, etc.). Fish processors and retailers get their fish from suppliers to consumers and they have access to facilities to store and display the fish such as insulation box and selling tables.
11
Table 3. Key stakeholders, their capacities and facilities
Key stakeholders Final product
Total volume* (tonnes/ day)
No. of stakeholders and workers
Market of final product
Supporting facilities
Fisher in Muara Angke, North Jakarta
Fresh fish (frozen squid)
67.33 1 188 fishing vessel with 15 483 crew members: no females (0 percent) 15 483 males
Large trader in Muara Angke Fishing Port in Muara Angke, North Jakarta
Most of fishing vessels have been equipped with freezers.
Large trader at fishing port in Muara Angke, North Jakarta
Fresh fish (frozen squid)
150 5 large traders employing 160 people: 32 female (20 percent) 128 male
Supplier, retailer and processor at fishing port in Muara Angke, North Jakarta
None
Supplier at fishing port and fresh fish market in Muara Angke, North Jakarta
Fresh fish (frozen squid)
450 100 suppliers employing 400 people: 20 females (5 percent) 380 males (95 percent)
Processor and retailer at fishing port and fresh fish market in Muara Angke, North Jakarta
Construction of a new fresh fish market with a higher floor and better drainage
Retailer at fresh fish market in Muara Angke, North Jakarta
Fresh fish (frozen squid)
125 200 retailers employing 400 people: 180 females (45 percent) 220 males (55 per cent)
Customer in fresh fish market at fresh fish market in Muara Angke, North Jakarta
Construction of a new fresh fish market with a higher floor and better drainage
Processor Boiled salted squid
19.8 70 fish processors employing 910 people: 13 females (11 percent) 108 males (89 per cent)
Product trader at Gudang Kapuk, North Jakarta
Improved road quality in several areas
Product trader Boiled salted squid
n.a. 8 traders employing 2 people: 2 males and no females
Customer and trader at Gudang Kapuk, North Jakarta
None
Note: * Calculated from total capture/production/product per year based on 12 months per year and 30 days per month. Traders also use insulated boxes to store fish temporarily during selling in the traditional market to minimize the fish quality deterioration (Figure 5). Fish is usually stored for three to seven days in insulated boxes. Beyond seven days’ storage, fish quality tends to be very low. Such low quality fish is often sold to the fish processors. Insulated boxes are also used by traders to distribute fish from landing site to the traditional market and retailer.

12
In contrast to the conditions of the fishing port, the condition of infrastructure and facilities is seen to be substandard. There is a lack of sufficient services for good fish handling, including the lack of available water, electricity and ice. Since potable water is difficult to obtain and has to be bought at a cost of IDR100 per litre, sanitation and hygiene both in the auction site and in the market are affected, because water is important for fish handling. There is a lack of ice with no facilities for ice making or ice crushing. The ice can be bought in the form of ice blocks, with price of IDR30 000 per
block. The ice comes from surrounding area mostly from Muara Baru, Jakarta and Tangerang. Most of stakeholders crushed the ice manually with direct contact to the floor. This can affect the hygiene of the fish due to cross-contamination. The ratio of ice to fish that is usually applied by the traders is 3:7 (Figure 6). This is a low ice to fish ratio compared to the ideal of 1:1 or at least 1:2 with a good quality insulated box (no leaking). In addition, ice is used differently for squid than for fish. Squid is usually kept with a block of ice but with salt added to preserve it (Figure 7). This might cause a change in weight by the time it is sold to the consumers. To cope with this situation, traders often increase the price slightly to avoid the value loss. Figure 6. Fish sold in the market with ratio of ice to fish of 3:7
Photo credit © RDCMFPPB
Figure 7. Squid sold in the market soaked in saltwater with a block of ice
Photo credit © RDCMFPPB
Hygiene and sanitation associated with fresh fish trading are affected by the port’s poor facilities. Cleaning of the auction site is often inadequate, where many puddles left, which can be a source of bacterial contamination. In addition, drainage is poor and there is an undesirable smell. c) Fish processors There are centres of traditional fishery products processing (PHPT) in the 65 ha area ha The main processed products are dried fish, smoked fish, dried skin fish, salted boiled fish and
Figure 5. Insulated box for storing the fish
Photo credit © RDCMFPPB
Figure 8. The conditions of the landing site where the fish are sold
Photo credit © RDCMFPPB

13
boiled dried squid. Fish paste is no longer processed because the raw material/krill are no longer available in north Jakarta. Twelve squid processors buy fish at the landing site according to their processing capacity. They buy frozen fish packed in plastic bags, bamboo basket, or cartoon boxes. Raw material packed in two layers of packaging, e.g. plastic and carton, has a better quality than other products. In terms of final products, boiled dried squid are packed in carton boxes (see Figures 9A, 9B and 9C). Figure 9. Packaging of boiled salted squidA. Boiled salted squid in the packaging
Photo credit © RDCMFPPB
B. Packaging for retail market
Photo credit © RDCMFPPB
C. Packaging for subsequent traders
Photo credit © RDCMFPPB
There are both men and women fish processors. Fish processing units usually have one manager, generally a woman, and four workers, usually men. Around 10 percent of people are affected by post-harvest fish losses since the workers often make wrong decisions in measuring the composition, time of soaking, time of boiling, and as a result produce a low quality product with low price. The processing capacity of a typical processing unit is 1 000 kg (1 tonne) of raw material fish per day, or 19 800 kg (19.8 tonnes) of raw material fish per month for 20 days of processing. Fish processors do not have cold storage or freezers. Fish are stored in baskets made from plastic or bamboo. Trays for drying are also made from bamboo. Drying racks are made from wood. Other packaging such as hoppers and permanent boxes are made from plastic, bamboo and carton paper. Transportation to and from the processing area is good, and traders from outside Muara Angke usually come to buy directly from fish processors. Fish processors have good access to ice, water and electricity. However, the environment surrounding the fish processing area is very poor in terms of hygiene and sanitation. The drainage does not flow well; there is no waste/garbage recycling site; and Good Handling Practices (GHP) are poorly implemented (Figure 10).

14
Figure 10. Environment surrounding fish processors
Photo credit © RDCMFPPB Some of the equipment such as bamboo trays and wooden drying racks tend to retain dirt and thus conducive to spoilage as well as food poisoning microorganisms. Figure 11. Squid and fish dried under the sun
Photo credit © RDCMFPPB 2.2. Marketing systems Squid are caught by using bouke ami. It is the major fishing gear vessel being used in Muara Angke with a total of 1 064, followed by purse seine (154 units) and gillnet (40 units). In Muara Angke, up to 90 percent of squid landed are frozen during fishing and graded by species and size. Squid is frozen in blocks and packed in plastic bags. Weight loss from fresh to frozen is about 10 percent. The squid are graded and priced according to size as follows:
Grade 1 (5–6 squids/kg) IDR80 000 Grade 2 (7–12 squids/kg) IDR50 000 Grade 3 (13–16 squids/kg) IDR30 000 Grade 4 (17–25 squids/kg) IDR20 000
Squid of low quality usually goes to processing plants. The squid are thawed, rinsed, boiled, and then cooled. The final products are packed in cartoon boxes, which are distributed to traders from outside Muara Angke. Many of these traders come from Gudang Kapuk, North Jakarta. The good quality product is sold at IDR50 000/kg.

15
3. STUDY FINDINGS AND RESULTS It is difficult to carry out an accurate assessment of post-harvest loss because some of the catch is unrecorded. Additionally, it passes through many hands on its way from harvest to consumption. It has been estimated that less than 2 percent by weight of fish catch is lost owing to poor handling during unloading through distribution. The heterogeneity of fishing operations makes it difficult to make definitive estimates of post-harvest losses. Loss of frozen fish is mainly caused by rough handling during unloading, weighing and transportation to the auction site or during loading to the refrigerated truck. The assessment identified a number of post-harvest losses affecting different stakeholders, which are described below. 3.1. Critical loss points Fisheries at Muara Angke Fishing Port is mainly composed of marine fish, with squid being the most important species landed. In 2014, as much as 9 264 tonnes of squid valued at IDR42 billion was landed at Muara Angke. The second and third place were occupied by layang (scad) and lemuru (sardine) with the total landing of 2 653 tonnes and 1 149 tonnes, respectively. Other commercially important species landed at Muara Angke were mostly small pelagic fish such as bentong (Selar crumenophthalmus), selar (Selaroides leptolepis) and tembang (Sardinella fimbriata). Squid has become a very popular species both in local markets and international/export markets. In local markets, smaller size squid with low quality are usually processed into salted boiled product, and the bigger as well as the good quality squid are usually exported at a much higher price. The fish landed at Muara Angke including squid had mostly been frozen on board fishing vessels. Catching and processing of fish at Muara Angke has grown from a local activity of small-scale industry into a major large-scale industry for both local and export market. Losses can be grouped into three major steps in the supply chain: (i) losses that occur during fishing and on board handling, which are the responsibility of fishers; (ii) losses that occur during processing and packaging, which are the responsibility of fish processors; and (iii) losses that occur during trading and distribution, which are the responsibility of the product trader. The fieldwork using the EFLAM indicates that post-harvest fish losses in fishers occurs at handling stages in the landing of fish. Small physical and quality losses were found to occur due to the rough handling of capture fish, with quality losses (less than 2 percent of total catch). However, the findings from assessments of the fishery indicate almost the same losses are occurring in small-scale fishers conducting one-day fishing. Although the nutritional losses were not the focus of the study, it can be easily suggested that these conditions may give rise to nutritional losses, adding to the food safety and quality concerns in small-scale fisheries. a) Fishers Most fish landed, including squid, in Muara Angke has been frozen at sea and graded by species and size. Squid is frozen in blocks and packed in plastic bags. Weight loss from fresh to frozen is about 10 percent. The percentage of the fresh fish (unfrozen fish) in Muara Angke is about 1 percent. For frozen on board products, there are only minor physical losses during unloading, weighing and transportation to the truck or processing place. The fish are graded on board based on species and size before freezing. Unloading is carried out manually. The physical losses for the fish frozen individually can include fish that are thrown away accidentally. There is a direct impact of the loss on the fishers since the physical loss implies a reduction of the weight of the catch; however, the reduction of weight will cause higher prices of the product per unit of weight, so the impact is also experienced by the consumers. The assessment indicates that post-harvest fish losses occur during handling stages when landing fish. Small physical and quality losses were found to occur due to rough handling of capture fish, with quality

16
losses reported to account for less than 2 percent of total catch. Findings indicate almost the same losses are occurring in the small-scale fisheries sector (one-day fishing). There are three ways of addressing these handling problems on board and on shore, which can be associated with low fish losses: freezing the fish with air blast freezers and then keeping them in cold storage on board as soon as
possible after the fish are caught; in Muara Angke, 90 percent of the fish are frozen; icing the fish on board as soon as posible; in Muara Angke, around 1 to 10 percent of the fish are
iced; adding no preservatives: the fresh fish are caught and directly sent to the fish processors. The unloading process of fish from the fish hold through distribution, processing plants or export at Muara Angke is shown in Figures 12A and 12B. Figure 12. Weighing and loading squid (A) and fish (B) to the truck after unloading from fishing vessels
A B Photo credit © RDCMFPPB In 2014, the total squid landed in Muara Angke was 9 264 tonnes, with the catch directly graded on board by species and size, frozen in blocks weighing about 10 kg each, and stored in the fish hold. Squid was frozen in blocks with air blast freezers, and then kept in fish holds, which were equipped with a cooling system for cold storage. It appears that no loss occurred during storage on board. Losses, mainly physical, may have occurred during the unloading process of the frozen squid from the fish hold on to the deck and during the weighing process. If the blocks were not carefully handled, block bruises are very common during this process, so the loss of the frozen squid was mainly caused by rough handling during unloading, transportation and weighing. One observation is that fishers freeze up to 13 kg of squid in a pack, but sell it as a 10-kg pack, because there is often weight loss. Freezing 10 kg of squid can result in a thawed product weight of 8 kg. Hence, to avoid complaints from buyers about underweight product it is normal for additional squid to be frozen in packs. Thawing practice in Muara Angke is described in Box 1.
Box 1. Thawing practice
Thawing of frozen squid is often conducted outside in the open, and the fish are exposed to ambient conditions. The blocks are normally thawed in concrete tanks. However, if there is a large quantity of squid, then the thawing takes place on the ground. This practice is likely to contribute to a poor quality of processed products. Good thawing practice should be introduced, which is likely to entail investment in containers and upgrading the water supply.

17
b) Fish processors Quality loss, which affects the selling price, occurs because there is no standard processing method. Specifically, it may occur due to: poor handling during transportation; over production/high catches; lack of storage at processing units; the rainy season. The value of quality loss caused by the handling is as follows: the post-harvest quality loss of frozen squid can range from 0.1 to 1 percent. post-harvest quality loss of iced fish is 5 percent. the post-harvest fish loss of non-iced fish is 10 percent. Processing activities of boiled salted squid are conducted in the fish processing centre at Muara Angke. The work is mostly carried out by men living in this centre. Women’s roles are limited to sorting the finished products, preparing materials for packaging the products. Quality loss tends to occur during the processing of boiled squid because no standard method is implemented. The time of boiling process varies from processor to processor as does the concentration of salt used for boiling. The yield and quality of the final products highly depend on this process. Losses occur when the yield of final product is lower than expected. The products can be graded into three groups, i.e. good quality, medium quality and poor quality. Quality loss occurs in particular during boiling, when the raw material (fresh squid) is not wholesome and leading to final product being broken and classified as poor quality. Physical and quality loss could also occur due to bad handling during transportation. c) Traders Since there is no physical loss for fresh fish, traders can generally sell all of the fish, although at a low price. The traders prefer to have a value loss provided that they still can get their capital back. The most common loss that affects traders is quality loss. When the fish arrive at the landing site, they are sorted by the supplier (Figure 13). The supplier will sell good quality fish to retailers, while the low quality fish are sold in the traditional market. The low quality fish are damaged but can still be sold. The damaged fish are sold with low price. For example, kue fish, which is normally sold at IDR40 000, is sold at IDR25 000, due to damage. This loss occurs almost every day for almost all large traders (90 percent) but the quantity is relatively small, only 5 percent of the value. Fish are also graded based on size. There are usually three grades, sold at different prices. The largest grade size are sold for the highest price.

18
d) Product trader Boiled salted squid are usually marketed by fish processors to wholesalers or product traders. Product traders usually store the boiled salted squid in the chilling rooms. Physical as well as quality loss hardly occur in this supply chain except when the product could not be sold for more than three weeks. Should the product has been stored for more than three weeks, then oxidation occurs and the product colour tends to gradually darken, and its appearance becomes dull, which causes a reduction in price. But this is very rare; the product is usually sold less than two weeks after it is supplied by the fish processors. The traders are generally able to sell
all of the products without experiencing physical (weight) or quality loss. All the boiled salted squid are usually sold even though at a relatively low price, allowing them to only just get their capital back without any profit.
Box 2. Market force losses Market force losses occur annually for two months between Eid al-Fitr, Eid al-Adha (Moslem holidays). As a result, the fish price is low. To cope with this condition, the traders usually store fish in cold storage. However, storage causes quality deterioration, which also lowers the price. Large traders are not concerned, but this hiatus in trade causes problems for some of those affected who require income for basic needs. Efforts have been made to provide short-term credit in other sectors with similar problems such as seaweed growing. The seaweed warehouse or storage cheque scheme, however, was not deemed successful because there was a lack of trust of the lending institutions because fisheries are considered a high risk for lenders. Market force loss has been identified as an issue (see Box 2). For example, giant trevally fish, which normally can be sold at IDR40 000, is only sold at IDR5 000 after seven days of storage. However, this loss only takes 5 percent of the total volume. Other traders who are categorized as large-scale traders are suppliers. Suppliers generally sell the fish to major consumers such as retailers and restaurants. This type of trader experiences losses differently. Suppliers are probably less impacted by quality loss as well as market force loss. The suppliers generally obtain the best quality of fish from large-scale traders, thus they do not have any problem with low quality fish. In terms of market force loss, the suppliers have anticipated by providing storage facilities such as freezer and cold storage with large capacity. The oversupplied fish are stored in cold storage and eventually the frozen fish are sold when the demand starts to increase and the price is back to normal. In addition, suppliers usually have a contract with their consumers, who mostly consists of large retailers and restaurants; thus, there is a tendency to avoid losses. The average calculation of losses that are experienced by traders is as follows:
Selling price of good quality: IDR40 000/kg Selling price of poor quality: IDR5 000/kg Quantity sold for low price: 200 kg Total quantity: 4 000 kg Quantity thrown away (physical): 0
Figure 13. Fish sorting
Photo credit © RDCMFPPB

19
Then:
Physical loss percent: 0/4 000 x 100 = 0 percent Physical loss value: 0 x IDR40 000 = 0 Quality loss percent: 200/4 000 x 100/1 = 5 percent Quality loss value: 200 x (IDR40 000 – IDR5 000) = IDR7 000 000 Total loss value: PV + QV = 0 + IDR7 000 000 = IDR7 000 000 Total loss percent = IDR7 000 000/ (4 000 x IDR40 000) x 100/1 = 4.4 percent
Depending on the market demand, these losses, which affect almost all large-scale traders, occur regularly in seven-day cycles during fish storage. Coping strategies During the rainy season, the processor covers the products with plastic sheets. Fish processors reduce their production not only because of the rain, but also because of reduced fish catch. Based on interviews with the traders, the losses incurred did not significantly affect their business. At only 5 percent of the total, they considered their losses to be minimal. In addition, these losses can be recovered by maximizing other factors. They have strategies to cope with this situation, including providing the storage facilities to store the fish when the supply is high while the demand becomes low. Frozen fish is also a solution for them, because it does not lower the quality of fish. As a result, they still can sell the fish at a high or normal price. This can occur when the demand is high but the fish supply is low due to seasonal reasons. Moreover, increasing cold storage/ freezer facilities, either in the landing site or on board, can reduce the losses of fresh fish due to quality loses. The facilities have increased significantly over the past seven years. To reduce or prevent losses, various handling methods are used by fishers but, as has been demonstrated by the study, losses still occur; hence, there is a need for careful and continued technical guidance, especially for training on GHP, and infrastructure such as shelters for unloading and transporting fish. Fish processors still use a traditional method, which leads to poor quality products. An improved method using technology enhancements and standard GHP is required. The causes of loss and the possible solutions are summarized in Table 5. According to the main findings in Muara Angke, there are no quality standards for fish products such as dried fish, smoked fish, dried fish skin, boiled fish, fish paste and boiled dried squid. Specifications for each processing product needed to ensure food safety. Processing methods and the practices of the fish processors affect the quality of the product. Improvements require capacity building. 3.2. Load tracking Two fish processors were selected and three processing replications were carried out for each
processor. They each processed three baskets of selected fish (12 kg each), which were then distributed to the product trader. The parameters observed were weight and quality based on sensory evaluation.
LT was used to help identify critical loss points in the boiled salted squid value-chain from handling, processing, transportation, and storage. Before and after processing, the measurements of physical and quality parameters were taken for each step of the processing, transportation and storage. The objective was to quantify losses and to identify the causes of losses.
LT was conducted with two fish processors during one processing cycle. The weight loss as a result of regular, normal processes such as boiling, rinsing, and cooling occurs but is not calculated as a loss. Three replications were applied for each product processing. Quality analysis was conducted with the guidance of both fish processors and wholesalers to determine quality parameters and reasons for quality deterioration.

20
Figure 14. Processing steps: A) boiling in brine; B) transportation; C) cooling; D) packaging
A B
C D
Photo credit © RDCMFPPB An average total weight of raw material (fresh squid) of 36.69 kg, produced 23.38 kg of final product, or an average yield of 63.23 percent. From the total weight of frozen squid landed, the physical condition of the raw material was 95.89 percent of good quality unbroken squid and 4.11 percent broken squid. After processing, 72.53 percent of the dried salted squid produced was unbroken and 27.47 percent was broken. Comparing composition of expected result with the real finished product, there was a 23.36 percent difference, which was expected to be unbroken but became broken product. The price of unbroken product was IDR50 000/kg while the low quality broken product has a price of IDR25 000/kg, or 50 percent the price of good quality one which indicated quality loss was around 13.74 percent. Figure 15. Quality of boiled salted squid: A) good quality; B) low quality
A B
Photo credit © RDCMFPPB

21
4. CHARACTERIZATION OF FOOD LOSSES IN SELECTED SPECIES AND PRODUCT 4.1. Post-harvest fish losses The fish losses occur both during fishing and after processing. From the results of the EFLAM study, it was concluded that losses of fresh fish as raw material for processing was caused by delayed handling on the sea, although the loss is very low, i.e. less than 0.1 percent. Furthermore, the icing or freezing is often delayed, causing around a 0.3 percent loss. The fish is not pre-cooled before freezing. Higher losses are incurred by fish processors caused by inadequate processing techniques. Based on a LT experiment, total losses amounted to 13.73 percent, which were due to inadequate handling of raw materials (rough handling of frozen squid), the thawing process, boiling and cooling of the product. Rough handling of frozen squid causes broken raw material before processing, and as a result, the product is also broken. In thawing, the frozen squid is thawed in concrete containers or even put on the floor or on the road. The most severe losses experienced by fishers were market force losses caused by fraudulent practices. For example, as regard to fish weight per basket, traders are asked to add 2 kg more to the actual standard weight of 10 kg; which can amount to a 20.89 percent loss. Table 4 provides a clearer idea of the causes of losses and the possible solutions. Table 4. Causes of loss and possible solutions Type of loss
Cause of loss Percent of loss (%)
Stakeholders affected
Frequency Possible solution
Quality Delay in handling <0.1 Fisher Rarely Technical assistance, introduction of pre-cooling.
Inadequate processing technique
13.73 Processor Rarely Technical assistance in appropriate handling and processing.
Delay in icing on board
0.30 Processor Rarely Introduction of pre-cooling, freezing technical assistance.
Market force
Fraudulent practices 20.89 Fisher Twice a year Fair and transparent trading between the owner and the fisher.
4.2. Women’s involvement in fisheries activity in Muara Angke Women contribute significantly in some steps of the fish supply chain in Muara Angke. Almost no women are involved in the fishing activity, except through minor contributions in the logistic preparations prior to fishing. There are approximately 100 large-scale traders for fish distribution, of whom 5 percent are women. More women are involved as small traders, i.e. 45 percent out of around 200 traders. Additionally, there are five fish suppliers in Muara Angke, 20 percent of whom are women. In Muara Angke, there are 12 fish processors of boiled salted squid, which is the main fish processing activity in this area. Moreover, 121 people are involved in the processing of boiled salted squid, where male workers prevail. For this product item,the involvement of women is approximately 11 percent, mainly in sorting, washing and packaging of the product. The details of women’s involvement in the fishery sector in Muara Angke are provided in Table 4.

22
5. FISH LOSS REDUCTION STRATEGY – CONCLUSIONS AND RECOMMENDATIONS 5.1. Food loss reduction measures Physical losses were found to be negligible, but quality loss affected the selling price of squid. Based on an analysis of samples, 95 percent of squid were of good quality and 5 percent were broken. Good quality (large) squid are usually exported. Small and low quality squid are processed in Muara Angke for the domestic market. The key issues of concern are: There is poor on-board handling fish including delays in freezing; Substandard quality product is only identified after thawing. When this low quality product is
processed, it results in a lower final product yield and a lower quality final product; There is poor handling during transportation on-shore; Quality loss associated with periods of high production and during the rainy season; There is poor hygiene and sanitation of the processing units; There is a lack of storage at processing units and the thawing of frozen squid occurs outside, on the
ground when volumes are high quality deterioration occurs during storage; Large-scale traders are not concerned about the decline of prices provided that the fish can be sold; Small-scale fish processors are the most affected.
Market force losses are not deemed significant, but occur during religious holidays when demand is low. However, low demand is often followed by periods of high demand. In terms of reducing quality losses and improving food safety, the following are recommended: Improve general hygiene and sanitation, drainage, infrastructure of all areas and transport from port
to processing area; Improve storage facilities (numbers and capacities) and its management to leverage against price
and supply fluctuations. A resi gudang (the warehouse receipt or storage cheque) system as per UU No. 9/2006 (Law No. 9/2006) to be considered for application in the fishery sector. Lessons learned from the past use of resi gudang should be used to guide all interventions;
Reorganize processing units for better process flow; Develop a standard processing method for boiled and dried squid to be documented in a simple
guide to processing and handling; Improve or increase the hygienic conditions of the thawing process by placing fish in proper
containers rather than just leaving them to thaw on the floor; Access a sufficient supply of affordable potable water for hygiene, sanitation and processing
operations, and ice making; Transfer the practices used in the export chain to domestic processing practice; Provide better, more durable processing equipment such as boiling pans; Build capacity of fishers and fish processors in knowledge and in the use of better technology,
handling fish, hygiene and sanitation; Avoid improper handling during unloading, trading and distributing of fish, which significantly
contributes to reducing fish quality. 5.2. Strategies for food loss reduction Many efforts have been made both by the government and fishers at Muara Angke to reduce fish losses. However, significant improvement has not been observed. The proivision of fishing vessels with on-board air blast freezers is relatively new in Muara Angke; previously, fishers depended on an inadequate amount of ice to preserve captured fish during fishing. In Muara Angke fishing landing, low
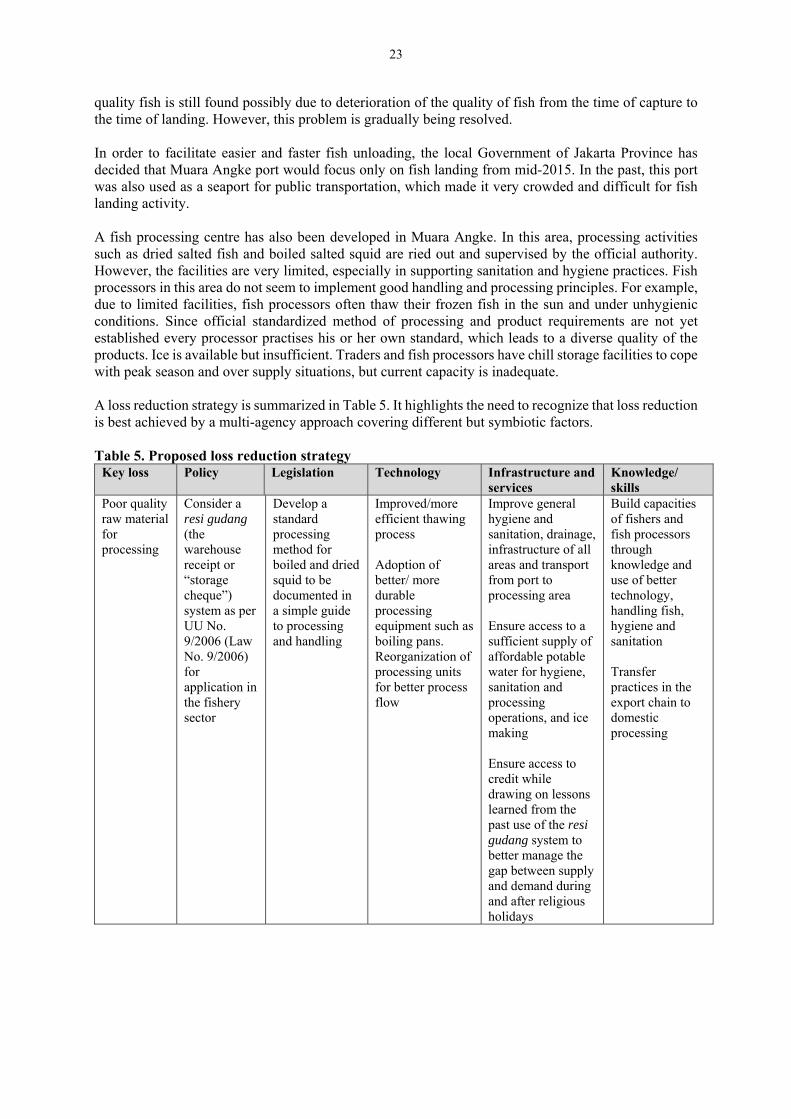
23
quality fish is still found possibly due to deterioration of the quality of fish from the time of capture to the time of landing. However, this problem is gradually being resolved. In order to facilitate easier and faster fish unloading, the local Government of Jakarta Province has decided that Muara Angke port would focus only on fish landing from mid-2015. In the past, this port was also used as a seaport for public transportation, which made it very crowded and difficult for fish landing activity. A fish processing centre has also been developed in Muara Angke. In this area, processing activities such as dried salted fish and boiled salted squid are ried out and supervised by the official authority. However, the facilities are very limited, especially in supporting sanitation and hygiene practices. Fish processors in this area do not seem to implement good handling and processing principles. For example, due to limited facilities, fish processors often thaw their frozen fish in the sun and under unhygienic conditions. Since official standardized method of processing and product requirements are not yet established every processor practises his or her own standard, which leads to a diverse quality of the products. Ice is available but insufficient. Traders and fish processors have chill storage facilities to cope with peak season and over supply situations, but current capacity is inadequate. A loss reduction strategy is summarized in Table 5. It highlights the need to recognize that loss reduction is best achieved by a multi-agency approach covering different but symbiotic factors. Table 5. Proposed loss reduction strategy
Key loss Policy Legislation Technology Infrastructure and services
Knowledge/ skills
Poor quality raw material for processing
Consider a resi gudang (the warehouse receipt or “storage cheque”) system as per UU No. 9/2006 (Law No. 9/2006) for application in the fishery sector
Develop a standard processing method for boiled and dried squid to be documented in a simple guide to processing and handling
Improved/more efficient thawing process Adoption of better/ more durable processing equipment such as boiling pans. Reorganization of processing units for better process flow
Improve general hygiene and sanitation, drainage, infrastructure of all areas and transport from port to processing area Ensure access to a sufficient supply of affordable potable water for hygiene, sanitation and processing operations, and ice making Ensure access to credit while drawing on lessons learned from the past use of the resi gudang system to better manage the gap between supply and demand during and after religious holidays
Build capacities of fishers and fish processors through knowledge and use of better technology, handling fish, hygiene and sanitation Transfer practices in the export chain to domestic processing

24
6. REFERENCES Utomo, B.S.B., Wibowo, S., Syamdidi & Badarudin. 2014. Losses evaluation of fish processing.
Paper presented in the International Seminar on Marine and Fisheries Product Processing and Biotechnology, Jakarta, 26 September 2014.
Utomo, B.S.B., Wibowo, S., Syamdidi, Agusman, Badarudin & Peranginangin, R. 2013. Evaluasi Susut Hasil Pasca Panen pada Industri Perikanan. Laporan Teknis Penelitian dan Pengembangan. Balai Besar Penelitian dan Pengembangan Pengolahan Produk dan Bioteknologi Kelautan dan Perikanan. Jakarta.
Ward, A.R. & Jeffries, D.J. 2000. A manual for assessing post-harvest fisheries losses. Natural Resources Institute, Chatam, United Kingdom.
Wibowo, S, Utomo, B.S.B., Syamdidi & Kusumawati, R. 2014a. Evaluating and monitoring of national post-harvest fish loss in Indonesia. Paper presented on International seminar on Fish Processing, Pekanbaru, 9 September 2014.
Wibowo, S, Utomo, B.S.B., Syamdidi & Kusumawati, R. 2014b. Evaluasi susut hasil pasca panen perikanan. Policy Brief. Research and Development Center for Marine and Fisheries Product Processing and Biotechnology. Jakarta.

25
B. FISH LOSS ASSESSMENT ON GILLNET CAPTURE FISHERIES IN TEGAL Singgih Wibowo Syamdidi Agus Heri Purnomo Bagus Sediadi Bandol Utomo Rinta Kusumawati Diah Ikasari Hasta Octavini Research and Development Center for Marine and Fisheries Product Processing and Biotechnology Ministry of Marine Affairs and Fishery The Republic of Indonesia Wudianto Andria A. Utama Research Center for Fisheries Management and Conservation Ministry of Marine Affairs and Fishery The Republic of Indonesia Ansen R. Ward Yvette Diei-Ouadi Susana Siar Petri Suuronen Food and Agriculture Organization Rome, Italy

26
1. INTRODUCTION AND BACKGROUND Tegal city is a large city in the northwest part of Central Java Province of Indonesia. It is situated on the north coast of Central Java, about 175 km) from Semarang to the east, the capital of Central Java province, and about 257 km east of Jakarta (Figure 1). According to the 2010 Census, the population was 239 599, but the latest 2014 official estimate is 242 539. A large fisheries school was built in this city by the Indonesian Government. Figure 1. Food loss study location, Tegal Fishing Port, Central Java
Source: Peta Indonesia. 1.1. The status and importance of Tegal Fishing Port Tegal has one fishing port (FP) (Pelabuhan Perikanan Pantai/PPP) and three fish landing places (FLP) (Pangkalan Pendaratan Ikan/PPI). The name of the fishing port is Tegalsari Fishing Port (Figure 2) and the three FLPs are Tegalsari, Pelabuhan and Muarareja. Tegalsari is the largest by volume of fish landed. In 2014, marine fish landed at Tegalsari was 49 772 tonnes valued at IDR490 693 million. There has been an annual increase in catch over the last five years of 7 percent per year. The increase in value has been much higher than the volume i.e. 23 percent per year. The fish price has increased by 15 percent per year (Anon., 2015). The increase of fish price is likely a result of the increase in demand. Fish landing at Tegal fishing port is relatively stable throughout the year with slightly higher landings between July and December. Tegalsari is dominated by domestic fishing vessels; however, on certain months, many fishing vessels from neighbouring cities such as Brebes, Batang and Pekalongan land their catch. Fishing grounds for Tegal fishers are not only in the Java Sea, but also in west Kalimantan (Belitong) south of Kalimantan, and south of Sulawesi. Fishing trips vary from one day to 60 days per trip depending on the fishing ground, the capacity of the fishing vessel and the fishing gear. For the gillnet fishing vessel, fishing trips vary from 33 to 45 days, or six to nine trips per vessel per year (average of seven fishing trips per vessel per year), depending on the season and the availability of fish.
Source: pipt.djpt.kkp.go.id

27
In 2014, there were 3 612 landings of fishing vessels to unload the fish, i.e. 301 fishing vessels to unload per month (12 months per year), or ten landings per day (based on 30 days per month). Among them, there were 13 gillnet fishing gears, from which fish were unloaded in every month. The main gears used are cantrang (modified mini trawl or Danish seine), drift gillnets and mini purse seine. Mostly demersal fish are landed such as sulphur goat fish (Upeneus moluccensis), purple-spotted bigeye (Priacanthus tayenus), rays (Dasyatis sp), omate-threadfin bream (Nemipterus nematoporus), false trevally (Geres punctatus),
lizardfish (Saurida micropectoralis), sea catfish (Arius thalassinus), Indian halibut (Isettodes irumei) and other pelagic fish such as kawa-kawa (Euthynnus affinis) and ponyfish (Leiognathus equulus). In 2014, production of purple-spotted bigeye fish amounted to 7 879 tonnes, or 16 percent of total fish landed, followed by sulphur goat fish, 7 390 tonnes (15 percent), omate-threadfin bream, 6 269 tonnes (14 percent), red bigeye fish 6 260 tonnes (12 percent), false trevally fish, 3 084 tonnes (11 percent), and other fish (32 percent). These types of fish are caught by cantrang fishing gear. In 2014, this type of fishing gear produced 48 555 tonnes, or 97 percent of the total fish landed at Tegalsari Fishing Port, while gillnet fishing gear produced 1 217 tonnes of fish (Anon., 2015). Services Based on Regulation No. 45, 2009 (UU No. 45 Tahun 2009), the functions of coastal fishing ports are: (i) mooring and anchoring services for fishing vessels; (ii) loading and unloading services; (iii) quality and processing guidance on fisheries products to fishers; (iv) fish distribution and marketing; (v) collection of data on the production of fish capture and fisheries products; (vi) extension services and the development of fishers’ associations; (vii) implementation of operational activities of fishing vessels; (viii) fish resource supervision and control; (ix) custom services; (x) quarantine services; (xi) publishing of information on mooring and anchoring services for fishing vessels and fisheries inspector ships; (xii) publication of research results on marine and fisheries; (xii) control of coastal areas and marine tourism; and/or (xiii) environmental control. Fish processing and marketing Fish landed at Tegalsari are mostly fresh or frozen. Catches are marketed fresh, or processed and marketed as follows: marketed fresh for local consumption or distributed to other cities especially to Jakarta; processed into fish fillet, marketed to local market or to some other cities such as Brebes, Cirebon,
Pemalang, Jakarta, Lampung, Medan used as raw material for crackers, fish ball and otak-otak; processed into boiled or grilled fish for local consumption in Tegal and surroundings; processed into dried salted fish and sent to Bandung and Jakarta; processed into fish meal for animal feed. Hygiene and sanitation issues Tegalsari as the largest landing place in Tegal plays a very important role in fresh fish production.
Figure 2. Tegalsari Fishing Port
Source: Google maps.
28
Box 1. Fish meal: a fish loss or loss reduction option
Downgraded fish, fish of poor quality or fish that are difficult to market for direct human consumption and bycatch are often sun-dried and then used as an ingredient in animal feeds, including feed used in aquaculture. In other fisheries of the world, fish are specifically caught for fish meal production, whereas in Indonesia, fish meal production is incidental. While incidental fish meal production provides a safety net for poor quality and unmarketable fish, it can also be seen as an inefficient use of fish protein and utilizing fish for direct human consumption is a more beneficial from a food security perspective. Fish landed at Tegalsari as well as fish brought from other cities are mainly marketed in Tegal fish market. The conditions of the fishing port are inadequate for the unloading of fish (Figures 3 and 4). Fish is unloaded in the jetty around the auction site, which is unsuitable for fish, especially the shelter, which is insufficient for protecting the fish from the sun. In and around the fishing port, the conditions are unhygienic and the facilities for fish handling and preservation are unclean. The floors of the auction site are mostly filthy with no proper drainage system for water and there is no hygienic disposal system of waste. There are no proper facilities for washing fish, and seawater taken from the surrounding landing place is used to wash the fish. It seems that fishers and stakeholders in the fisheries activity are unaware of hygiene and sanitation issues. Plastic bags and other waste litter the streets that surround the auction site and are also found in the drainage system, some parts of which do not function well. In sum, sanitary practices in handling fish are inadequately conducted in the auction site and in the fish market. Figure 3. Tegalsari fishing port: (A) unloading the fish from gillnet fishing vessel in Tegalsari fishing port. Insufficient shelter exposes the fish to the sun; (B) water puddles found in the fish auction site can be source of many contaminations; (C) unclean seawater is pumped for floor cleaning; (D) toilets found in front of fish auction site can be source for many contaminations
A B
C D
Photo credit © RDCMFPPB
1.2. Inventory of activities and stakeholders and lessons learned from past and ongoing interventions The Indonesian Government through the Directorate General of Fish Processing and Marketing, and the local government have been developing cold chain system (CCS) in Tegal with the aim of maintaining the quality and freshness of the catch from the fishing vessels right through the processing place and

29
even to the final consumers, so the expected quality can be maintained for several days. The targets of the CCS model development are the small and medium-sized fishing vessels, the fish auction site (TPI)/fish landing centre (PPI)/fish processing unit (UPI), transportation and storage facilities, as well as the distribution systems. Figure 4. The fish auction site and the fish market: A) transporting fish to the processing place; B) fish are placed on the floor during auction; C) fishing boats are moored and anchored at the rear side of the auction site; and D) the conditions of a traditional fish market
A B
C D Photo credit © RDCMFPPB There are three ice plants in Tegal:PT Salju Abadi, with a capacity of 30 tonnes per day; PT Tirta Gangga, with a capacity of 40 tonnes per day; and PT Sari Petojo, with the capacity of 40 tonnes per day. However, the actual production is only 25, 30 and 30 tonnes per day, respectively. Ice supply does not meet the demand, which is approximately 200 tonnes per day. Ice is therefore brought in from nearby cities such as Pekalongan, Pemalang, Brebes and Slawi. Fishing vessels of 20–30 GT with 6–8 fish holds need around 200–300 50 kg blocks of ice. Fishing vessels of 30 GT with nine fish holds of 2–4 tonnes each need 300–400 blocks, and fishing vessels of more than 30 GT with capacity of 4 tonnes per fish hold need 450 blocks. Ice is used to transport fish to other cities usually using insulated containers (blong) and transported by a truck or pick-up. The fish is placed in the containers lined and covered with crushed ice. Trucks can carry 50 containers of iced fish and pick-ups can carry around 10–15 containers.

30
2. OVERVIEW OF THE SUPPLY CHAIN – SITUATION ANALYSIS The fish supply chain of gillnet capture fisheries at Tegal fishing port is shown in Figure 5. The supply chain is simple and shows the crucial role of the large-scale trader in distributing the fish. Fish landed at Tegal fishing port from gillnet vessel are distributed fresh by large-scale traders. None of the fishers are involved in the fish distribution. There are only three large-scale traders who distribute the fish: therefore, the large-scale traders are considered the key of the supply chain. Medium- and small-scale traders and fish processors have to purchase the fish from large-scale traders. For reasons of trust, fishers prefer to deal directly with the large-scale traders in regard to bargaining for prices and the payment modalities. Large- scale traders unload and sort the fish based on species, size and quality. There are three main fish from gillnet capture: tenggiri (Scomberomorus sp., Spanish mackerel), tongkol jabrik (baby tuna) and tongkol batik (Euthynnus affinis, little tuna), which are classified into seven grades based on the quality (grade 1, 2, 3, TP, RS, RSS, XX). Figure 2. Fish supply chain of gillnet capture fisheries in Tegal, Central Java
2.1. Key stakeholders in the supply chains of gillnet fishing in Tegal The main activities of stakeholders of gillnet fishing in Tegal involve gillnet fishers, traders (large-scale and medium-scale/small-scale traders) and fish processors. The supply chain also involves traders in other cities for fresh and processed fish. Table 1 summarizes these different groups of stakeholders.

31
Table 1. Overview of stakeholders in gillnet capture fishery in Tegalsari Types of fish operators
Specific operators and equipment
Overall population of operators in Tegalsari
Percentage of women (%)
Percentage of people affected by losses (%)
Total of fish production* (tonne/day)
Fishers (total) 3 612 vessels 5 474 fishers 0 100 138.25 Gillnet fishers 39 vessels 429 fishers 0 100 3.38 Large-scale traders
3 traders 87 staff members 33.3 100 5.0
Small-scale/ middle-scale traders
40 traders 400 staff members 80 100 30.0
Selected fish processors
70 processors 910 staff members 46 100 2.45
Note: *Calculated from total capture/production/product per year, based on 12 months per year and 30 days per month. 2.2. The marketing system As mentioned, large-scale traders are the key market suppliers of fresh fish landed in Tegal. Since the role of the traders is central, they have very high bargaining position in the market system. Medium- and small-scale traders clean, wash, and repack the fish with ice and transported to market in other city as Bandung and Jakarta. The dried salted fish products are mostly distributed to other cities in West Java such as Garut and Bandung, and Jakarta. 3. STUDY FINDINGS AND RESULTS Figure 5. In EFLAM, a group discussion held in Tegal involving fishers, traders, fish processors, and local authority officers as key resource persons
Photo credit © RDCMFPPB
Figure 6. Small group discussion with fish processors in Tegal to generate primary data
Photo credit © RDCMFPPB 3.1. Critical loss points Field coordination and discussions were undertaken with local authorities Dinas Kelautan dan Pertanian Kota Tegal (Tegal Marine and Agriculture Authority), Head of Tegal Fishing Port, Head of Muarareja Fishing Port, and Head of Tegalsari Fishing Port. EFLAM aimed to obtain broad information regarding the supply chain and losses, and was completed using large group discussions (Figure 6) with fishers, big and small traders, and fish processors, followedr by a small group discussion (Figure 7) and on- field observations to generate primary data. LT was used to measure losses more accurately in the field.

32
Figure 7. Detailed description of a panel of Tegal gillnet
Photo credit © Andria A. Utama The findings indicate that different stakeholders incur different types of loss due to different causes. a) Type of gillnet fishing gear There are four types of gillnet used by fishers in the study area: Tegal gillnet (FG), Indramayu gillnet (AG), trammel net (TG) and rampus net (RG). Tegal gillnet Tegal gillnet (Figure 7) is characterized by its fixed floats made from plastic. In average, there are 10 to 12 people on crew on Tegal gillnet fishing vessels. It relies on a power block to haul the fishing gear. These vessels have 28–35 panels of net (200 m each panel) and the total length of the net (gear) is 4–4.5 miles. The number of days per fishing trip ranges between 33 and 45 days depending on the season and the availability of fish. Moreover, there are 6–9 trips (average of seven fishing trips) per year). The number of fleet per trip varies from 28–40, with 8–12 hours (average of nine hours) of soaking time. The length of the fleet is 10–20 m. Fishing grounds of Tegal gillnet fleets are located from Belitong, Karimun Jawa, and Madura to the South of Borneo. The main reason for gillnet fishing vessels losing gear is due to being crushed by big ship passing through fishing ground, entangled by anchor of squid fishing vessels, towed by Danish seine, and entangled by the FAD. The season has an effect on the loss of gear, for instance, during strong currents, there is more frequent loss of gear. Hammerhead shark (3 kg) and berried crab (60 kg) are often discarded, while live sharksucker (Echeneis sp) is frequently caught and released. Catches are dominated by Spanish mackerel (Scomberromorus commersoni) (7.61 percent), baby tuna (Thunnus sp.) (70.29 percent), kawakawa (Euthynnus affinis) (22.10 percent) and small amounts of other fish, such as small shark. The composition of the catch varies depending on fishing season. For example, during the Spanish mackerel season, the 28 percent (weight) of the catch is mackerel or even higher (Figure 9).

33
Figure 8. Catch composition of Tegal gillnet
Source: © Andria A. Utama Indramayu gillnet Indramayu gillnet (Figure 10) is known for its adjusted floats. Gillnets can be set at a preferable depth. Floats are made from styrofoam that float under the sea surface. They are provided with a power block and axle to haul in fishing gear. This fishing vessel has more panels than Tegal gillnet, with 50–60 panels (200 m each panel) and are operated by 10–12 crew members fishing trips last 30 days. There are five trips per year. There are 30 fleets; the average soaking time is eight hours. The fishing grounds of Indramayu gillnet fleets are located north of Pekalongan (Central Java) and Karawang (West Java). The main loss of Indramayu gillnet fishing vessels is due to large ships crushing it when passing through the fishing ground. The loss of gear is affected by the season; for example, periods of strong currents cause more frequent losses of gear. There are no reports of discards and releases. Catches are dominated by tongkol (85 percent) (Figure 11). Figure 9. Detailed description of a panel of Indramayu gillnet
Photo credit © Andria A. Utama

34
Figure 10. Catch composition of Indramayu gillnet
Source: © Andria A. Utama Trammel net Trammel nets (Figure 4) have three layers of net, consisting of two larger outer nets and a smaller one in between. Nets are operated by small jukung boats < 5 GT, 6 x 2.8 m, with a crew of 2–3 persons. A trammel net fishing vessel has 20–30 net panels (25.5 m each panel) with the vessel length of 6–9 m. The fishing grounds are relatively close to the fishing port (2 miles inshore), with typically sandy and muddy bottom, with depths ranging from 7 to 30 m. Fishing trips with trammel net in Tegal are only for one day. Fishers go to the sea from the morning (5.00 a.m.) to the afternoon (2.00–3.00 p.m.). They operate nets 3–4 times during one operation day, for an average of one hour of soaking time. The fishing season lasts eight months a year, specifically during the northwest monsoon in November-March. In contrast, fishers operate mini trawls instead of trammel nets, usually during the southeast monsoon. The average catches are about 15 kg a day, consisting of 5 kg penaeid shrimps (udang krosok, udang jerbung, udang putih) and 10 kg demersal and pelagic fish such as gulamah (Pseudociena amoyensis, croaker) and kembung (mackerel). The loss of gear of trammel net fishing vessels are mainly due to becoming entangled with wrecked ships or hard coral. The season affects the amount of gear loss. During the peak season for shrimp, fishers tend to set their nets less carefully, thus there is a more frequent loss of gear entangled with wrecked ships and hard coral.
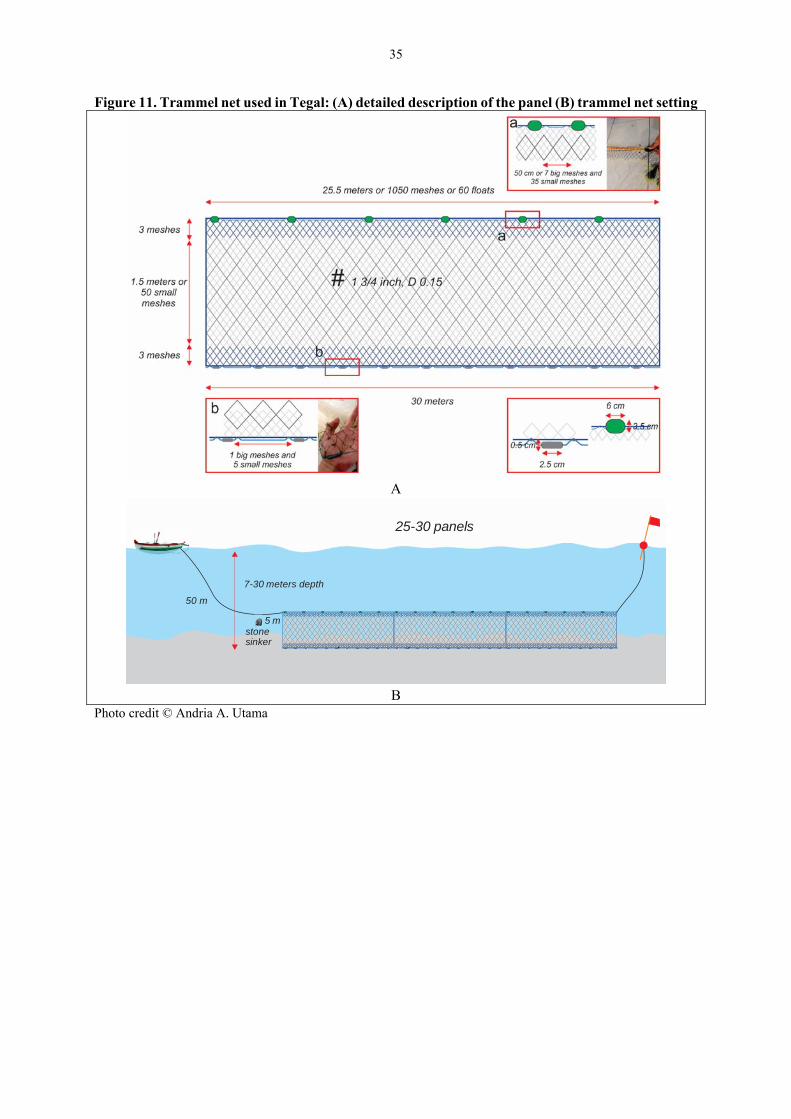
35
Figure 11. Trammel net used in Tegal: (A) detailed description of the panel (B) trammel net setting
A
B
Photo credit © Andria A. Utama
2 panels5-30
7-30 eters depth m
50 m
5 mstonesinker

36
Rampus gillnet Rampus gillnet (Figure 13) is categorized as an inshore gillnet due to its operation at the seafloor, targeting demersal fish. Like trammel nets, rampus gillnets are deployed by small jukung boats < 5 GT with a crew of 2–3 persons using a 10 m length vessel and 25 panels of net with 50 m each panel. Fishing grounds are also relatively close to the fishing port about 2 miles inshore; it is typically sandy and muddy bottom at depths ranging from 10 to 15 m. Fishing trips with rampus gillnet in Tegal last one day, with fishers going to the sea from the early morning (2.00–3.00 a.m.) to the afternoon (3.00 p.m.). They operate nets 3–4 times with an average of one hour of soaking time. The fishing season of rampus gillnet runs during the southeast monsoon in April to August. In contrast, fishers operate other fishing gears during the northeast monsoon. The average catches are about 5–6 kg a day, consisting of demersal and pelagic fish (croaker, mackerel). Based on interviews, rampus is rarely lost when it is operated. The relative insignificant number of bycatch also occurs when using rampus fishing compared to using other fishing gears in Tegal. The specifications and design of rampus gill net in Tegal are shown in Figure 12. Figure 12. Rampus gillnet used in Tegal with (a) a detailed description of the panel; and (b) its operation
Photo credit © Andria A. Utama
2 panels5

37
b) Fishers The critical loss point for fishers is during fishing activities, mainly due to the loss is due to fishing gear (Table 1). Gillnets are lost due to destruction by other vessels passing through the fishing ground, entangled by anchors of squid fishing vessels, towed by Danish seine and entangled by FAD. Loss of gear is seasonal; during strong currents, there is a more frequent loss of gear. Loss of gear causes high amounts of fish to be trapped and die in the net (Table 2). Gillnet bycatch includes hammerhead shark, berried crab and dolphin; sea turtles are often discarded, while gemi fish are frequently caught and released. Table 1. Potential number of gillnet fishing gear loss
Local gear name No. of vessels landing
Gear loss (panels/vessel/year)
Estimated total number of gear loss/year
Indramayu and Tegal drift gill net
150 2 300 panels, 200 m/panel (in Tegalsari)
Trammel net 70 5–6 350–420 panels, 25.5 m/panel (in Muarareja)
Rampus monofilament gill net 20 Infrequently (50 m/panel) Table 2. Estimated discards from gillnet capture
Local gear name Total discards/year
Indramayu and Tegal drift gillnet ± 100 dolphin (5 tonnes) ± 100 sea turtles (5 to 200 kg each) ± 300 shark-suckers (Echeneis naucratus) (100–250 g each) ± 240 kg crabs (in Tegalsari) Trammel net ± 0.3 tonnes of crabs, murex, jelly fish (in Muarareja) Rampus monofilament gillnet None
The number of gillnet fleets has fluctuated over the years. Crew members of between 1 and 60 boats sell their catch at TPI Pelindo 2 (Figure 14). The monthly catch of gillnets also fluctuates. Gillnets have the lowest production among fishing gears. Figure 13. Number of fishing vessels landed in TPI Pelindo 2 (A) and amount of catch using different fishing gears (B)
A
0
50
100
150
Num
ber
of b
oats
Gill net Purse seine Mini purse seine

38
B Source: © Andria A. Utama The main critical loss point in gillnet fisheries is the soaking time of the net during fishing. As mentioned, the soaking time of gillnet fishing gears range from 8 to 12 hours. This duration affects the fish catch quality and causes quality loss. The fish that are trapped first in the gillnet remain in the net for several hours until the gear is lifted. The loss is significant and almost always occurs. In addition, the length of the trip, prolonged storage, improper on-board handling and insufficient ice also contribute to quality loss of fish. Poor implementation of cold chain system is also another critical point, not only on-board but also after landing/onshore.
Quality loss is shown in the fish grades used to differentiate fish by quality on landing. The grading is performed by sorting the fish by experienced workers (Figure 15). Fish from gillnets are sorted into seven grades: Grade 1, Grade 2, Grade 3, TP (tape indicated by soften texture as soft as fermented cassava), RS (rusak sekali, or damaged), RSS (rusak sama sekali, or seriously damaged), and xx (rejected). From seven established grades, fishers almost always receive the 4th grade or below. The highest grade for gillnet catches is mostly grade 3 and rarely Grade 2. Data recorded from six fishing vessels during EFLAM showed that in total, the highest capture were in grade 6 (RSS grade) of 48.67 percent and grade 5 (RS grade) of 28.27 percent (Table 3). Grade 1 was only
1.13 percent. For Spanish mackerel (tenggiri) about 38.2 percent of the total catches is in Grade 4 (TP), while for baby tuna jabrik and little tuna batik the highest percentage is Grade 6 (RSS) with 45.56 percent and 75.32 percent, respectively. This shows a significant quality loss. Table 3. Composition of gillnet capture fishery in Tegal, based on fish quality
Grade Name of Grade Weight (kg) Percent weight (%) Grade 1 Grade 1 (best quality) 283 1.13 Grade 2 Grade 2 209 0.83 Grade 3 Grade 3 1 830 7.28 Grade 4 TP (Tape Tape = soft texture) 3 328 13.24 Grade 5 RS (Rusak Sekali = damaged) 7 105 28.27 Grade 6 RSS (Rusak Sama Sekali = seriously damaged) 12 234 48.67 Grade 7 XX (Rejected) 147 0.58
Note: Data are calculated from six gillnet fishing vessels in Tegal in 2015 based on main fish, i.e. Spanish mackerel, baby tuna and kawakawa.
0
500
1000
1500
2000
2500
1 3 5 7 9 11 1 3 5 7 9 11 1 3 5 7 9 11 1 3 5 7 9 11 1 3 5 7 9 11 1 3 5
2010 2011 2012 2013 2014 2015
Cat
ches
(to
nnes
)
Figure 14. Sorting based on the fish quality carefully carried out by experienced workers in the gillnet fishing vessel, Tegalsari fishing port, Tegal, Central Java
Photo credit © RDCMFPPB

39
The significant impact due to the quality loss is the fish value. For example, for mackerel, the price for grade 1 of mackerel reaches IDR. 44.416/kg, but using gillnet gears this grade is only 0.36 percent of the total catches. The highest amount that can be obtained is grade 4 fish (TP) with 38.28 percent of the total catches. However, the grade 4 fish is sold for only IDR39.250/kg. In this case, fishers experienced a loss of about IDR3 782 000 in one catch, or about 11 percent loss by value. Data recorded from six fishing vessels during a field survey in the EFLAM showed that post-harvest fish loss is very high. Soaking time combined with prolonged and poor on-board handling and storage leads to reduced quality of 24.9 tonnes, or 99 percent in weight, equal to a 28.03 percent loss in value per trip (calculated from six gillnet fishing vessels). Fish production is approximately 140 tonnes of fish per day (39 vessels with 3.6 tonnes of fish per vessel per day). Value loss due to reduced quality of mackerel is 13.30 percent; baby tuna, 29.76 percent; and kawakawa, 39.62 percent (Table 5). This amounts to an estimated average loss of potential income per vessel per trip of IDR21 000 000. Assuming 39 vessels make on average of seven trips per year and an average catch of 4.2 tonnes at a price of IDR45 000/kg for grade 1, and IDR8 000 for low quality (depending on species), the estimated loss in income per annum to the gillnet fleet due to quality deterioration alone would be IDR5 733 000 000 (US$441 000). On landing, good quality fish enters the fresh fish retail chain and low quality is either processed or sold fresh. The lowest quality will be processed into fishmeal for feed. Table 4. Value of post-harvest fish losses in one trip in Tegal gillnet capture fishery, 2015 (data from six gillnet fishing vessels)
Fish species Grade Volume
(kg) Price*
(IDR/kg) Value (IDR)
Value based on Grade 1
Loss value (IDR)
Loss value (%)
Tenggiri 1 7.00 44 416.67 310 917 310 917 - - (Spanish mackerel) 2 43.00 43 416.67 1 866 917 1 909 917 43 000 2.25 (Scomberomorus sp) 3 411.00 42 416.67 17 433 250 18 255 250 822 000 4.50
TP 732.00 39 250.00 28 731 000 32 513 000 3 782 000 11.63 RS 719.00 35 166.67 25 284 833 31 935 583 6 650 750 20.83
RSS - - - - - - XX - - - - - -
Sub-total 1 912 73 626 917 84 924 667 11 297 750 13.30 Tongkol jabrik 1 276.00 16 416.67 4 531 000 4 531 000 (baby tuna) 2 166.00 15 416.67 2 559 167 2 725 167 166 000 6.09
3 1 419.00 14 416.67 20 457 250 23 295 250 2 838 000 12.18 TP 2 596.00 13 416.67 34 829 667 42 617 667 7 788 000 18.27 RS 5 015.00 10 750.00 53 911 250 82 329 583 28 418 333 34.52
RSS 8 050.00 10 750.00 86 537 500 132 154 167 45 616 667 34.52 XX 147.00 6 250.00 918 750 2 413 250 1 494 500 61.93
Sub-total 17 669 203 744 583 290 066 083 86 321 500 29.76 Tongkol batik 1 - 13 250.00 - - - - (Euthynnus affinis, little tuna)
2 - - - - - -
3 - - - - - - TP - - - - - - RS 1 371.00 8 000.00 10 968 000 18 165 750 7 197 750 39.62
RSS 4 184.00 8 000.00 33 472 000 55 438 000 21 966 000 39.62 XX - - - - - -
Sub-total 5 555 44 440 000 73 603 750 29 163 750 39.62 Total 25 136 321 811 500 448 594 500 126 783 000 28.26 Average* 4 189.3 53 635 250 74 765 750 21 130 500
Note: *Average from six fishing vessels.

40
c) Traders In Tegal, there are three large-scale traders and 40 small and medium-scale traders. The three large-scale fish traders (wholesale buyers) buy all fish caught by gillnet fishing gear and landed in Tegal, especially in Tegalsari fishing port. Each of the traders will buy the catch of 6–7 fishing vessels. As mentioned above, there are three dominant fish species caught by gillnets: tenggiri or mackerel (Spanish mackerel), tongkol jabrik or baby tuna (Euthynus spp.), and tongkol batik (Euthynnus affinis.) with composition (in weight) of 70.28 percent jabrik, 22.11 percent batik, and 7.61 percent tenggiri. Figure 15. Mode of fresh fish transportation from the fishing port to traders or fish processors with no insulated boxes or ice, which contributes to quality degradation
Photo credit © RDCMFPPB Most of the fish landed, which are bought by traders, are Grade 6 (RSS grade) and Grade 5 (RS grade). In this condition, buyers must be more careful in handling the fish; otherwise, the quality will deteriorate further. Indeed, traders experience a post-harvest fish loss as high as 4.88 percent in value. Quality loss on shore is mostly due to poor implementation of the cold chain system including inadequate cooling, poor handling following landing/on shore, inadequate fish storage capacity, inadequate fish transportation facilities, and weak capacity of traders to adapt to GHP. Lack of ice used for handling was a sign of inadequate cooling practice. No ice is used during unloading, weighing and even transporting the fish to the processor or to trader’s warehouse. Poor handling occurs during unloading and weighing where fish are often thrown, thus damaging the fish. The damage exposes the fish to microorganisms from the environment. Moreover, there is a lack of shelter so the fish are exposed to the sun. In addition, fish are packed in baskets without ice and transported using trishaws or other modes of transportation (Figure 16). Traders have not adapted to improved GHP. This factor is important because human capacity is the key factor in reducing losses.
During storage, the traders use only a half of a small block of ice (±15 kg) per 100 kg fish. This amount is not sufficient to keep the fish at low temperature in order to maintain its quality. However, traders use

41
methods to reduce the losses. During fish handling, the fish is soaked with ice in a fibreglass container for two hours (pre-cooling). Containers are filled with 100 kg fish and with 25 kg ice. Pre-cooling renders the fish firma gain, giving it a better, cleaner appearance and increasing its durability and weight by up to 5 percent or even more. d) Fish processors An assessment was made of two typing of fish processing: (i) dried salted baby tuna and kawakawa; and (ii) smoked baby tuna and kawakawa. The production of dried salted baby tuna and kawakawa is 1.47 tonnes of dried salted fish per day per processor. With the conversion of 60 percent, this amounts to 2.45 tonnes of fresh baby tuna and kawakawa per day per processor. In total, dried salted kawakawa production in Tegal is 102.9 tonnes per day, processing 171.5 tonnes of fresh baby and kawakawa per day involving 70 fish processors. Assuming that the fish processors work 30 days per month for 12 months per year (360 working days), total production of dried salted baby tuna and kawakawa in Tegal per year is 37 044 tonnes, i.e. 61 740 tonnes of fresh baby tuna and kawakawa are processed into dried salted fish. The group discussion and direct observations during EFLAM reveal that the fish processors of dried salted fish experience losses of up to 4.73 percent in value for all fish losses. Using load tracking (Figure 17), the loss to the dried salted baby and little tuna processor was relatively low, at 1.82 percent in value for physical loss due to weight loss. The loss is due to the inadequate processing technique, mainly incomplete drying, resulting in a high moisture content in the final product, causing quality deterioration (in less than two days). In contrast, the fish processors prefer products that are not too dry because the appearance is better and there is less weight loss. The rainy season has strong influence on the drying process, which extends the drying time, causes a high moisture content in the product, invites more flies to infest the fish and causes the product to easily rot due to flies infestation and mold. However, fish processors re-salted fish when it is found to be not dry enough. Incomplete washing after salting causes a poor appearance, thus reducing the product value, e.g. the price difference can reach IDR1 000/kg (from IDR22 000 for good appearance to IDR21 000 per kg for poor appearance of the product). Insufficient amount of salt used during salting process can cause quality loss because the product suffer from insect during storage (Figure 18). When this occurs, the product price will decrease from IDR22 000 to IDR18 000. Indonesian dried-salted fish with salt content of 7–21 percent at aw 0.75 and stored under tropical conditions can be heavily infested by insect (Indriati et al., 1985). Common insects infesting Indonesia dried-salted fish and contributing to heavy losses are blowflies (Chrysomya sp.), flies (especially Musca sp. and Piophila sp.), beetles (Dermestes sp. particlarly D. carnivorous Fabricus, D. maculatus DeGeer and Necrobia rifupes DeGeer), and mite (Acarina) (Indriati et al., 1985). The loss due to inadequate processing techniques occurs often, especially during the rainy season. Other issues that contribute to loss are poor sanitation and hygiene. Even though sanitation and hygiene have been improved, GHP and good manufacturing practices (GMP) were not yet fully and properly implemented. The use of ice during handling and processing (no ice used during processing) and exposing the fish to the sun (Figure 17) may lead to fish deterioration, resulting in a low quality of product. Fish processing was carried out on the cement floor, sanitation was not maintained properly, the use of equipment was not sanitary, and hygiene was not assured. A market force loss is occasionally experienced by fish processors. This type of loss occurs two weeks before and two weeks after Ramadhan. The market demand goes down, causing the reduction of product selling price. The product that is normally sold at IDR22 000/kg is instead sold for IDR19 000/kg.

42
Figure 16. Dried salted fish processing during load tracking using little tuna from gillnet capture in Tegal
A B
Photo credit © RDCMFPPB Figure 17. Dried salted small tuna product suffering from insect infestation. Insect (blowflies) infestation starts from: (A) fresh fish as raw material for dried-salted fish; and (B) during drying, or any point at the supply chain
A B Photo credit © RDCMFPPB Load tracking result LT was conducted to measure the losses of dried salted little tuna (Euthynnus affinis) during handling, processing, transportation and storage (Figure 19). It focused on measuring physical and quality losses before and after each step and on identifying the causes of the loss. The LT measurement was conducted at two dried salted little tuna processors among a group of fish processors at Tegalsari on one processing cycle. The weight loss (60 percent) as a result of regular intentional processes such as handling, eviscerating, washing, rinsing, salting, and drying is considered yield” and not loss. Three replications were applied for each product. Quality analysis was carried out with the guidance of both processor and wholesaler to determine quality parameters and reasons for quality deterioration. The physical loss was measured by weighing the samples before and after processing, to give a more accurate estimate of losses. It was then converted into a percentage to express the results in a more easily recognized form. Based on the results of LT, from an average total weight of raw material (fresh kawakawa) of 44.91 kg, 24.54 kg of dried salted fish was produced, so the average yield was 54.64 percent. The raw material used in the processing was low quality fish, rejected from the fresh fish market. As regards the physical condition of the fresh kawakawa, 13.04 percent of total weight was broken and 86.96 percent was unbroken. The loss of dried salted little tuna was identified during the salting, drying, packaging process and transporting to the market in Garut and Bandung West Java, accounting for 0.43 kg of weight loss or 1.82 percent loss in value due to physical loss. An inadequate drying process was believed to be the cause of this loss, resulting in weight loss of the product. No quality loss was found in the LT since the

43
price of all products were the same. However, an insufficient amount of salt used during salting process and insufficient drying can cause quality loss because the product can be subject to insect infestation during storage. In addition, improper packaging of the final product using carton boxes also causes weight loss as well as physical damage.
Box 2. Insect infestation in dried-salted fish
An insufficient amount of salt used during the salting process and drying, especially during the rainy season, can cause severe quality loss because the product is subject to insect infestations during storage, which will reduce the price for approximately 18 percent. The common insects that infest dried-salted fish in Indonesia are blowflies, flies, Chrysomya sp., Piophila sp., Dermestes sp. and mite (Acarina) sp.
Figure 18. Processing steps of dried salted little tuna: (A) eviscerating; (B) rinsing after washing; (C) salting; (D) rinsing after desalting; (E) drying; (F) packaging; (G) transporting
A B
C D
E F
G Photo credit © RDCMFPPB
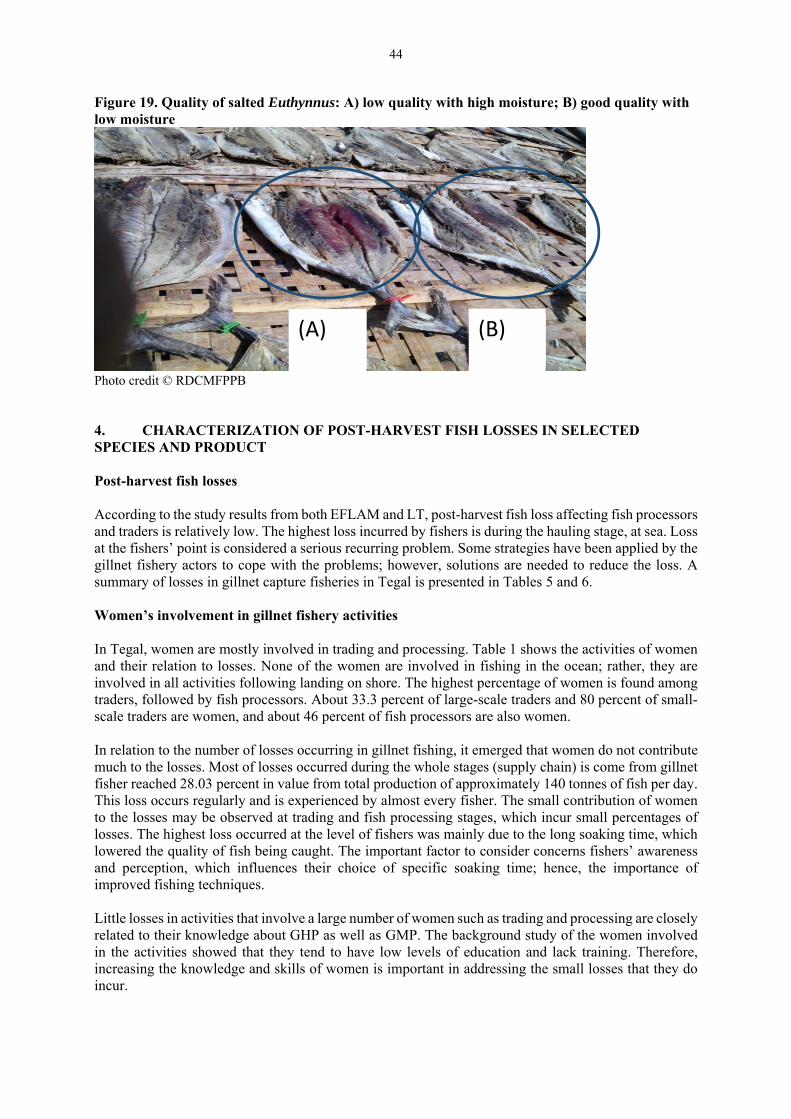
44
Figure 19. Quality of salted Euthynnus: A) low quality with high moisture; B) good quality with low moisture
Photo credit © RDCMFPPB 4. CHARACTERIZATION OF POST-HARVEST FISH LOSSES IN SELECTED SPECIES AND PRODUCT Post-harvest fish losses According to the study results from both EFLAM and LT, post-harvest fish loss affecting fish processors and traders is relatively low. The highest loss incurred by fishers is during the hauling stage, at sea. Loss at the fishers’ point is considered a serious recurring problem. Some strategies have been applied by the gillnet fishery actors to cope with the problems; however, solutions are needed to reduce the loss. A summary of losses in gillnet capture fisheries in Tegal is presented in Tables 5 and 6. Women’s involvement in gillnet fishery activities In Tegal, women are mostly involved in trading and processing. Table 1 shows the activities of women and their relation to losses. None of the women are involved in fishing in the ocean; rather, they are involved in all activities following landing on shore. The highest percentage of women is found among traders, followed by fish processors. About 33.3 percent of large-scale traders and 80 percent of small-scale traders are women, and about 46 percent of fish processors are also women. In relation to the number of losses occurring in gillnet fishing, it emerged that women do not contribute much to the losses. Most of losses occurred during the whole stages (supply chain) is come from gillnet fisher reached 28.03 percent in value from total production of approximately 140 tonnes of fish per day. This loss occurs regularly and is experienced by almost every fisher. The small contribution of women to the losses may be observed at trading and fish processing stages, which incur small percentages of losses. The highest loss occurred at the level of fishers was mainly due to the long soaking time, which lowered the quality of fish being caught. The important factor to consider concerns fishers’ awareness and perception, which influences their choice of specific soaking time; hence, the importance of improved fishing techniques. Little losses in activities that involve a large number of women such as trading and processing are closely related to their knowledge about GHP as well as GMP. The background study of the women involved in the activities showed that they tend to have low levels of education and lack training. Therefore, increasing the knowledge and skills of women is important in addressing the small losses that they do incur.
(A) (B)

45
Table 5. Summary result matrix of losses in gillnet capture fisheries, Tegal, Central Java Type of Loss Cause of loss Percent of loss in
value Stakeholders Affected
Frequency of loss/time/season
Impact of loss Trends Perception of stakeholders
Physical loss Bycatch discarded ± 100 dolphin (5 tonnes)
± 100 sea turtles (5–200 kg each)
± 240 kg crabs (in Tegalsari)
Fishers Every time Most of the impact affects the volume of fish catch.
There are no changes over time.
Quality loss Prolonged soaking time. Long fishing trip, prolonged storage, improper onboard handling and insufficient ice (poor implementation of cold chain system).
28.26 Fishers Every time Most of the impact affects food safety and security
No changes over time. An intervention is urgently needed to reduce the loss.
They do not care about the loss since it is considered a normal consequence of their activity.
Quality loss Poor handling, i.e.: Inadequate cooling. Poor handling following landing/on shore. Poor implementation of cold chain system, inadequate storage capacity. Improper fish transportation, Weak capacity to adapt to technology and GHP.
4.88 Traders Often Most of the impact affects food safety.
Some strategies have been done, including precooling and cold storage
They are aware of the loss and make some effort to reduce it, but ineffectively.
Physical loss Inadequate processing technique
4.73 (EFLAM; including quality loss) 1.82 (LT).
Fish processors
Often Most of the impact affects food safety and economic loss due to weight loss.
Some strategies have been implemented, including the improvement of processing techniques
They are aware of the loss. They have made efforts to reduce it but ineffectively.

46
Table 6. Summary of food losses, causes, and solutions
Critical loss point
Magnitude of loss
Economic loss (IDR)
Cause of loss Intervention to reduce loss
Expected loss reduction per vessel per day (percent/ IDR)
Estimated cost of intervention (IDR) Weight (tonne)
Percent (value based)
Fishing and on board handling by fisher, fish captured by gillnet
Quality loss on-board during capture, production of 3.38 tonnes/ vessel/day
28.03 21 130 500 per vessel per day
Long soaking time; first fish trapped in the net will deteriorate first
Shorten soaking time together with installing a hauler equipped with a machine, and improve on-board cold chain system, providing shelter for unloading, weighing
30% 6 336 150
Price of net hauler with machine (IDR25 000 000), price of permanent shelter (~ 250 m2, IDR50 000 000 by the Government).
Unloading, weighing and transportation to buyer in Tegal (Central Java) or in Bandung (West Java)
Quality loss 4.88 Inadequate cooling, poor handling following landing/on shore, inadequate fish storage capacity, inadequate fish transportation, and weak capacity to adapt to technology on GHP
Improvement of good hygiene practices (GHP) and good manufacturing practices (GMP), technical assistance.
50% Cost for training of trainers (TOT), continuous assistance and monitoring (by the Government)
Processing and mostly during transportation to market in Garut and Bandung (West Java)
Physical loss, production of 2.4 tonnes/day /processor, 0.076 tonne loss/processor/day
1.82 1 723 712 per processor /day
Inadequate processing techniques, low quality of raw material, evaporation during transportation
Improvement of processing technique, implementation of GHP and GMP, and packaging
25% 430 928
Cost for training of trainers (TOT), continuous assistance and monitoring (by the Government)

47
5. FISH LOSS REDUCTION STRATEGY – CONCLUSION AND RECOMMENDATIONS Food loss reduction measures A key physical loss, which is more of an environmental and biodiversity loss, is incidental bycatch during fishing. It is estimated that for the total fleet annual loss is estimated at 100 dolphins (5 tonnes), 100 turtles (5 to 200 kg each), 300 shark-suckers, crabs, murex and jellyfish, most of which die in the net. It terms of quality loss, data from six vessels indicate deterioration due to prolonged soaking time, e.g. 12 hours. This, combined with prolonged and poor on-board handling and storage, lead to 24.9 tonnes (99 percent in weight) in reduced quality, amounting to a 28 percent loss in value per trip of the catch. This amounts to an estimated average loss of potential income per vessel per trip of IDR21 000 000. Assuming that 39 vessels make on average seven trips per year and an average catch of 4.2 tonnes, a price of IDR45 000/kg for grade 1, and IDR8 000 for low quality (depending on species), the estimated loss in income per annum to the gillnet fleet due to quality deterioration alone would be IDR5 733 000 000 (US$441 000). On landing, good quality fish enter the fresh fish retail chain, and low quality is either processed or sold fresh. Between landing and before transport (two to three hours) for processing (salting and drying), poor handling, inadequate cooling, lack of space, and exposure to ambient conditions lead to a 4 percent loss in weight or in value of fish. Losses are deemed negligible during and after processing. In terms of reducing quality losses and improving food safety, the following interventions are recommended: Encourage fishers to shorten the soaking time of gillnets (to up to six hours) and use mechanized
hauling equipment. Shorter soaking times of gillnets occur in Gunung Kidul, which results in better quality
fish. Gunung Kidul can be used as an example of good practice to be shared with Tegal fishers. Upgrade the jetty facility by roofing to improve handling and working conditions. Encourage greater use of ice and insulated containers/transport on-shore and for distribution. In terms of food safety, improve the handling, hygiene and sanitation of on-board handling and
processing. In collaboration with fishers, map areas where turtles and sharks are caught and develop a plan to
regulate the use of these areas. Food loss reduction plan and strategy A loss reduction strategy is summarized in Table 7. It highlights the need to recognize that loss reduction is best achieved through a multi-agency approach covering different but symbiotic factors. When fish swim into the net, they are gilled and entangled, or trapped in it. The fish that are trapped first will die first and remain in the net for up to 12 hours, which facilitates quality deterioration. Shortening the soaking time will shorten the time lapse between the first fish caught and the hauling in of the net, thus improving fish quality. Shortening the soaking time could be facilitated by installing machine-operated net haulers on board the vessels. Improving the on-board cold chain system will help to maintain fish quality. Introducing pre-cooling before the fish is stored in the vessel, improving vessel insulation as well as installing freezers will help maintain the fish quality. Lessons can be learned from a pilot project in Bitung (North Sulawesi) between 2012 and 2014, which successfully improved the quality of fish by improving vessel insulation. A similar pilot project in Bali and Pelabuhan Ratu, West Java was sponsored by the European Union in 2007. With respect to the onboard freezing system, lessons can be learned and adopted from Muara Angke, North Jakarta and Tegal. However, the cost of investment could be a challenge to adoption.

48
Table 7. Proposed loss reduction strategy
Location/key loss Policy Legislation Technology Infra-structure and services
Knowledge/ skills
Tegal Incidental bycatch Long net soaking times and poor on-board handling leading to 28 percent loss in value of catch. Loss in quality (about 5 percent in value and volume terms) due to poor on-share handling, hygiene/sanitation.
Consider a resi gudang (warehouse receipt or “storage chequestorage cheque”) system as per UU No. 9/2006 (Law No. 9/2006) for application in the fishery sector.
In collabor-ation with fishers, map areas where turtles and sharks are caught and develop a plan to regulate the use of these areas.
Encourage fishers to shorten soaking time of gillnets (to up to 6 hours) and encourage use of mechanized hauling equipment. Shorter soaking times of gillnets in Gunung Kidul which results in better quality fish. Gunung Kidul can be used as an example of better practice. Encourage greater use of ice and insulated containers/trans-port on-shore and for distribution.
Upgrade the jetty facility by roofing to improve handling and working conditions. Ensure access to credit while drawing on the lessons learned from the past use of resi gudang to better manage the gap between supply and demand during and after Islamic religious holidays.
Build capacity to improve handling, hygiene and sanitation of on-board handling and processing. Build capacity to improve handling, hygiene and sanitation of on-shore handling and processing.
Traders incur post-harvest fish loss of about 4.88 percent in value, which is mostly due to inadequate cooling, poor handling following landing/on shore, poor implementation of cold chain system, inadequate fish storage capacity, inadequate fish transportation facilities, and weak capacity of traders to adapt to technology on GHP. Quality losses are also due to the lack of shelter when the fish are unloaded so that they are exposed directly to the sun and the lack of insulated boxes in transportation. Improvements on GHP and GMP should help reduce quality loss. Better use of ice and insulated boxes during the unloading from the vessel, weighing, and transporting the fish to the processing area is required. Shading fish from direct sun light is also recommended. It is necessary to improve the auction site in order to support implementation of GHP. Temporary shelters made of tents may help to protect the fish from the sun and rain. For long-term usage and better impact, a permanent shelter needs to be built. Almost all of the fish processors have received knowledge on fish processing from their ancestors. Other scientific knowledge from regular education is not common. This makes it difficult for fish processors to change their habits. Training or other capacity building will take time to produce an impact. It should be repeated often in order to prove the competiveness of the knowledge. A pilot project to demonstrate the benefit of better fish processing can be used to encourage change. Continuous capacity building is required, especially to improve understanding of the importance of competitiveness for marketing. Another way to change bad practices is through the influence of large-scale traders and consumer demand/awareness. Large-scale traders need to be involved in planning and implementing programmes. A pilot project is also needed to provide evidence that shortening the soaking time improves fish quality, which in turn will increase revenue. The project should improve the on-board cold chain system,
49
introducing on-board and outboard pre-cooling, improving vessel insulation as well as installing freezers. The project should also demonstrate GHP, GMP, sanitation and hygiene. The role of the government is vital. Central and regional governments can cooperate in implementing this pilot project. The pilot project should be accompanied by capacity development (training), and dissemination involving ship owners, crews, fishers, associations, traders, fish processors, and field officers. Field officers should receive training periodically (training of trainers, or TOT) and can be used as resource persons in the field for helping stakeholders. Extension officers should be directly involved. 6. REFERENCES Anonymous. 2015. Tegalsari fishing port activities 2014. Annual Report for Tegalsari Fishing Port,
Tegal, Central Java. Esaiassen, M., Nilsen, H., Joensen, S., Skjerdal, T., Carlehog, M., Eilertsen, G., Gundersen, B. &
Elvevoll, E. 2004. Effects of catching methods on quality changes during storage of cod (Gadus morhua). Lebensm.-Wiss. u.-Technol. (37): 643–648.
FAO. 2014. Save Food Global Initiative on Food Loss and Waste Reduction. Food Loss Assessment: Causes and Solutions Case Studies in the Small-scale Agriculture Subsectors: Methodology.
Indriati, N., Sudrajat, Y., Anggawati, A.M., Putro, S. & Madden, J. 1985. Insect infestation in dried-salted fish in Java. In Reilly, A. Spoilage of Tropical Fish and Product Development. Proceedings of a Symposium Held in Conjunction with the Sixth Session of the Indo-Pacific Fishery Commission Working Party on Fish Technology and Marketing, Royal Melbourne Institute of Technology, Melbourne Australia, 23–26 October 1984.
Utomo, B.S.B., Wibowo, S., Syamdidi, Agusman, Badarudin, dan Peranginangin, R. 2013. Evaluasi Susut Hasil Pasca Panen pada Industri Perikanan. Laporan Teknis Penelitian dan Pengembangan. Balai Besar Penelitian dan Pengembangan Pengolahan Produk dan Bioteknologi Kelautan dan Perikanan. Jakarta.
Utomo, B.S.B., S. Wibowo, Syamdidi and Badarudin. 2014. Losses evaluation of fish processing. Paper presented in the International Seminar on Marine and Fisheries Product Processing and Biotechnology, held in Jakarta on 26 September 2014.
Ward, A.R. and D.J. Jeffries. 2000. A manual for assessing post-harvest fisheries losses. Natural Resources Institute, Chatam, United Kingdom.
Wibowo, S., Utomo, B.S.B., Syamdidi, Kusumawati, R. 2014a. Evaluating and Monitoring I of National Post-Harvest Fish Loss in Indonesia. Paper presented on International seminar on Fish Processing, 9 September 2014, Pekanbaru.
Wibowo, S., Utomo, B.S.B., Syamdidi, Kusumawati, R. 2014b. Evaluasi susut hasil pasca panen perikanan. Policy Brief. Research and Development Center for Marine and Fisheries Product Processing and Biotechnology. Jakarta.


51
C. FISH LOSS ASSESSMENT ON GILLNET CAPTURE FISHERIES IN GUNUNG KIDUL, YOGYAKARTA Syamdidi Diah Ikasari Hasta Octavini Singgih Wibowo Research and Development Centre for Marine and Fisheries Product Processing and Biotechnology, Ministry of Marine Affairs and Fisheries The Republic of Indonesia Wudianto Andria A. Utama Research Center for Fisheries Management and Conservation Ministry of Marine Affairs and Fishery The Republic of Indonesia Ansen R Ward Yvette Diei-Ouadi Susana Siar Petri Suuronen Food and Agriculture Organization Rome, Italy

52
1. INTRODUCTION AND BACKGROUND Gunung Kidul is a regency in Yogyakarta Province. It is located on the southern coast of Java, bordered to the west by Bantul Regency, to the north by Sleman, Klaten and Sukoharjo Regencies, to the east by the Wonogiri Regency, and to the south by the Indian Ocean. Gunung Kidul Regency covers 1 485.36 km2 and has 18 districts and 144 villages.
Figure 1. Location of Gunung Kidul Regency
Source: Google maps. The development of marine capture fisheries in Gunung Kidul started in the mid-1980s. One of the milestones was the development of Sadeng Fishing Port in 1991. However, the development has been limited due to uncertainty of profit and the strong influence of local legend the Queen of Southern Seas. Known for its distinctive rock formations (Karst), Gunung Kidul is a rich area of pelagic fish and spiny lobster resources. There are eight artisanal fish auctions (TPI) in Gunung Kidul from east to west: - TPI Sadeng - TPI Nampu - TPI Siung - TPI Ngandong - TPI Drini - TPI Baron - TPI Ngrenehan - TPI Gesing. Three fishing ports/auctions were selected for this case study: TPI Sadeng, TPI Drini and TPI Baron.
1.1. Status and Importance of Gunung Kidul Fishing Port, Yogyakarta The three fishing ports were selected because of their high production. Revenues generated are based on 5 percent of the value of a transaction: 3 percent from fishers and 2 percent from traders. The highest revenue collected was from Sadeng fishing port at IDR213 million/year (US$16 400/year), whereas

53
Drini and Baron fishing port generated IDR59 million/year (UD$4 500/year) and 70 million/year (US$5 450/year) (Dinas Kelautan dan Perikanan, 2014). Figure 2. Location of the three Gunung Kidul Fishing Ports
Source: www.demis.nl Catches are sold to West Java (Surabaya, Gresik, Tuban and other districts) and in areas of Central Java and Jakarta. Services Facilities for fish handling at some fishing ports are not good. Local government and State Government are however trying to improve the facilities. All three fishing ports have a small auction site and freshwater supply for cleaning the fish and facilities. There is electricity. However, the fishing ports are not protected from unauthorized persons increasing the risk of contamination and theft of fish. Hygiene and sanitation issues Although water is available, the floor of the auction site has not been paved with ceramic tiles. No toilets, fences or high pressure water hoses are available. In general, the sanitation conditions of the port environments are inadequate due to a lack of equipment, poor management and the carelessness of the users and fishers. Policy framework or national strategy One of the most significant policies has been categorizing Gunung Kidul as a Minapolitan Area by the Ministry of Marine Affairs and Fisheries (MMAF) since 2010. A minapolitan area is an area that has a significant economic function as the source of fish production, processing and marketing. This facilitates development of services, equipment and management by the MMAF, which has provided equipment for fishers, fish processors and fish traders as well as capacity building to improve their knowledge. They also built cold storage to preserve the quality of fish.
Infrastructure development To support the development of fisheries sector including the implementation of good hygiene and sanitation practices and the cold chain, both the Ministry and local government built ice plants, fish

54
transporters, water distillation plants and fish stores in key locations. In 2009, Gunung Kidul Regency received an ice block plant, Sari Tirta Mina, with a production capacity of 10 tonnes/day. Ice blocks are distributed to the fishing ports, fish processors and traders. At Drini and Gesing fishing port, a salt water distillation plant was built in 2011 to provide freshwater to support fisheries activities. The capacity is 9,000 litres per day. This plant is managed by the local community (Poksambal) Tirta Samudera at Drini, and Tirto Mulyo at Gesing Fishing Port Port. Poksambal is a group people who responsible for managing drinking water processing facilities using seawater. Vessel development The programme Inkamina provides free fishing vessels to community groups. These vessels are equipped with fish holds and fishing instruments to help fishers increase catches and also the quality of fish landed. The objective of this programme is to help community switch to more appropriate vessels.
2. OVERVIEW OF SUPPLY CHAIN – SITUATION ANALYSIS
Overview of supply chain in Gunung Kidul, Yogyakarta Fish landed in Sadeng, Baron and Driniare are mostly distributed as fresh fish. Only a small quantity is further processed into traditional products such as dried salted fish, fish snack and shredded fish. Most processed fish are sold locally. Fresh fish are distributed locally except for premium quality species such as lobster and grouper, which are sent to Jakarta and Surabaya and mahi-mahi which is exported to Japan. The selected fish supply chains in Gunung Kidul, Yogyakarta The main stakeholders are fishers and traders. Fisher are divided into two types: lobster fishers (whose main catch is lobster) and fish fishers (whose main catch is fish). Fishers There are two main types of fishers at Gunung Kidul: water fishers and inland fishers. Water fishers use vessels and target pelagic fish such as tuna and groupers. Inland fishers, who are also called “cliff fishers” catch fish from the land or hills to the sea, on the beach, or from a steep cliff. The coast of Gunung Kidul is hilly, and the dominant inland fisher catch is lobster. Since the inland fishers catch the fish from the hill on the beach, no boat is used by the fishers. There are six types of fishing gear used: gillnet, long line, fish trap, purse seine, pelagic purse seine (payang) and traditional old fishing gear such as arrow and spear. Vessel sizes are below 10 GT (32 units), 10–30 GT (15 units) and 30 GT and larger (12 units). There are about 238 outboard motor fishing vessels (OMF) and about 819 inland fishers (without using a boat). In total, there are around 1 680 fishers (Anon., 2014). Krendet fishing is conducted during the lobster season. Figure 3 summarizes the distribution of fishing vessels, the number of fishers and fish production for each group.

55
Figure 3. Overview of number of fishers and fish production distribution in Gunung Kidul Regency, 2013
Source: © Andria A. Utama
Fishing gear characteristic Gillnets are commonly used for harvesting because they are relatively easy and inexpensive to use even in challenging environments. Other fishers introduced this gear from Pangandaran (West Java), Cilacap, Tegal, Pekalongan (Central Java) and Prigi (East Java). Several types of gillnet fisheries exist in Gunung Kidul, such as offshore drift gillnet, inshore drift gillnet, and inshore fixed gillnet or setnet. The offshore drift gillnet primarily targets skipjack and juvenile of yellowfin and bigeye tuna. Similar to the offshore drift gillnet fishery, the inshore drift gillnet fishery mainly targets pelagic fish such as barred Spanish mackerel, eastern little tuna, the frigate and bullet tunas. The inshore fixed gillnet is fixed at specific locations or associated with the sea floor, it mainly targets spiny lobster. The netting is made of multifilament nylon or monofilament. More detailed information about gillnet fisheries in Gunung Kidul may be found on the Table 1 below:
Table 1. Gillnet fisheries in Gunung Kidul, Yogyakarta
Local gear name Gear type Location Material Target species
Fish Aggregating Device (FAD) gillnet
Offshore gillnet Sadeng Multi-filament Skipjack and baby tuna
Kambangan fish gillnet
Inshore drift gillnet Sadeng Multi-filament Little tuna, Indian mackerel, the frigate and bullet tunas
Pelagic gillnet Drini Inshore drift gillnet Drini Multi-filament Little tuna, Indian mackerel, the frigate and bullet tunas
Mackerel fish gillnet Inshore drift gillnet Baron Multi-filament Mackerel (Scomberomorus spp.) tenggiri, little tuna and trevally
Pepetan lobster gillnet (ciker)
Inshore setnet Sadeng Multi-filament Spiny lobster
Tanggungan lobster gillnet (ciker)
Inshore setnet Sadeng Multi-filament Spiny lobster
Demersal gillnet Drini Inshore setnet Drini Multi-filament Croaker, rays, sea catfish
Lobster tangle nets (Krendet)
Trap Sadeng, Drini, Baron
Multi-filament Spiny lobster

56
Offshore drift gillnet The only offshore drift gillnet that can be found in Gunung Kidul regency is (FAD) gillnet. It is typically suspended close to the surface with the top of the net within 3–4 m of the surface over sea floor depths of 2 500 m. It combines the use of FADs and light attraction techniques that can increase fishing efficiency. When a school is detected under FADs, the vessel turn attracting light on to attract and herd fish under FADs to approach the vessel. When enough fish are gathered below attracting light and the vessel in correct positioning versus FADs, eventually gillnet is set thus allowing fish to hit the net (Figure 4). The activity of FAD gillnet is conducted in offshore waters (up to 200 miles offshore), using small boats made from wood of less than 15 GT. The specifications and design of typical FAD gillnet are shown in Figure 4. The FAD gillnet is designed to catch skipjack and baby tuna; it has an unusual net size, 50 m long and 60 m high. Each boat carries 4–5 panels with a crew of five or six and fishing trips last 4–8 days. Nets are operated at night and and are hauled in 3–7 times per trip following an average of 30–60 minutes soaking time. This fishery occurs all year-round, except for several days during the northwest monsoon (November to March).
Figure 4. Illustration of the fish aggregating device in Sadeng
Photo credit © Andria A. Utama

57
Figure 5. Technical specification and design of offshore drift gillnet in Sadeng
Photo credit © Andria A. Utama The peak fishing season runs in April through May. Fishers catch as little as 0.5 tonnes and a maximum 3.5 tonnes per trip. The catch are skipjack (60 per cent) and juvenile of yellowfin and bigeye tuna (40 percent). Fish is stored in three insulated compartments, each with a capacity of about 1.5 tonnes. The profit sharing system between crew members is described as follows. For example, assuming four crew members and one fisher who owns the net and boat. The total profit is firstly reduced by logistic costs (food and fuel), and the other costs are divided 50:50 between manpower and boat owner.
Inshore drift gillnet Kambangan gillnet Kambangan gillnet is used for catching pelagic species. Nets are made of monofilament twine of 2-inch mesh size operated by small jukung boats (double outrigger canoes) of 15 HP of 7–10 m in length. The specificatios and design of typical Kambangan gillnet are shown in Figure 6. Fishers operate nets in waters 5–15 miles from the coastline, along the territorial waters of Gunung Kidul Regency. They usually go out to sea in the afternoon and return at midnight or the next morning.

58
Figure 6. Technical specifications and design of kambangan inshore drift gillnet in Sadeng
Photo credit © Andria A. Utama Drini drift gillnet Drini drift gillnet fishing uses monofilament nets with 200 meshes or 60 metres long, and typically 100 meshes high or 6 metres high, with a stretched mesh size of 2–2.5 inches (Figure 7). It has three master floats attached per panel. Fishers are going to sea from dusk to dawn, and operate nets twice during the night for an average of two hours of soaking time.

59
Figure 7. Technical specifications and design of Drini inshore drift gillnet, Drini
Photo credit © Andria A. Utama Mackerel gillnet Mackerel gillnet is selective fishing gear in which the target species usually constitute more than 70 percent of the total catch weight. Mackerel (Scomberomorus spp.) or tenggiri is the main target species, while little tuna and trevally constitute 20–30 percent of the total catch weight.

60
Figure 8. Technical specifications and design of mackerel inshore drift gillnet, Baron
Photo credit © Andria A. Utama Mackerel gillnet fishing trips run for 15 days each month during the new moon phase only. Nets are operated by small jukung boats of 15 HP of 7–10 m in length with a crew of two members, and equipped with a styrofoam box (without ice for preservation). Information on the specifications and design of mackerel gillnet is shown in Figure 8. Average soaking time is about 15 minutes and hauling takes 3.5 hours. Fishing grounds are mainly in the Parangtritis water and the east coast of Sadeng, about one hour from the coastline. Fishers usually go out to sea in the afternoon and come back the next day, in the morning or the afternoon. During the peak fishing season, many fishers fill their holds by setting nets only five times; however, during the off-season, no fish can be caught even after setting nets ten times. The peak fishing season occurs around the northwest monsoon (November-March).
5-6 panels2 m

61
Inshore setnet Pepetan lobster gillnet Pepetan gillnet is unique fishing gear targeting spiny lobsters. It is high-risk fishing gear because it is deployed on the area close to the coast where large waves hit the coastline. Almost all of fishers have experience crashing their boats during pepetan fishing operation. Unlike common set gillnets, pepetan gillnets are deployed horizontally, covering rock and the reef bottom at depths ranging from 3 to 4.5 m where lobster are found (Figure 9). Initially, fishers observe where the lobsters usually hide before defining the potential spot to deploy the nets. Moreover, identified lobster fishing grounds are covered by 1 to 3 panels of overlaying net. Nets are set in the afternoon and hauled in in the next morning, hence an average soak time of 12 hours. Pepetan gillnet are used only during the lobster season (October-January). During the lobster season, it is common for many pepetan fishers to catch 3–20 kg of lobster per trip. Figure 9. Technical specifications and design of pepetan inshore setnet, Sadeng
Photo credit © Andria A. Utama
total 50 panels/ trip and set only 1-3 panels per spot
4,5 m
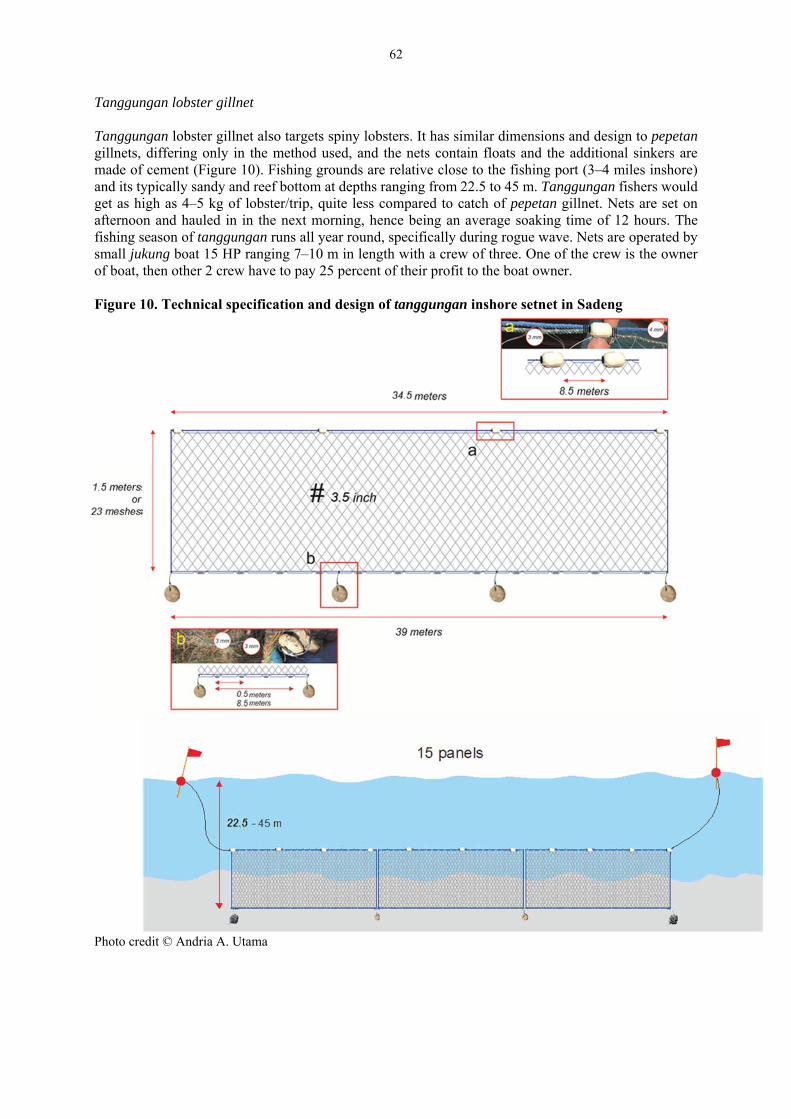
62
Tanggungan lobster gillnet Tanggungan lobster gillnet also targets spiny lobsters. It has similar dimensions and design to pepetan gillnets, differing only in the method used, and the nets contain floats and the additional sinkers are made of cement (Figure 10). Fishing grounds are relative close to the fishing port (3–4 miles inshore) and its typically sandy and reef bottom at depths ranging from 22.5 to 45 m. Tanggungan fishers would get as high as 4–5 kg of lobster/trip, quite less compared to catch of pepetan gillnet. Nets are set on afternoon and hauled in in the next morning, hence being an average soaking time of 12 hours. The fishing season of tanggungan runs all year round, specifically during rogue wave. Nets are operated by small jukung boat 15 HP ranging 7–10 m in length with a crew of three. One of the crew is the owner of boat, then other 2 crew have to pay 25 percent of their profit to the boat owner. Figure 10. Technical specification and design of tanggungan inshore setnet in Sadeng
Photo credit © Andria A. Utama

63
Drini setnets Drini setnets have similar dimensions and design to Drini pelagic gillnets. Nets used in this fishery are monofilament 200 meshes long, typically 100 meshes high and stretched mesh size are 5.08–6.35 cm (Figure 11). However, it has less floats on float line and master floats are only attached at both the upper ends of the net. Fishing depths are typically 100 m and soaking times are 30–180 minutes, depending on the availability and density of fish. Fishers go to sea from dawn to midday, and operate nets only once with average 30–120 minutes soaking time. The actual fishing grounds depend on the movement direction of fish. It takes about 45–180 minutes to reach the fishing ground from the fishing port.
Figure 11. Technical specifications and design of the Drini inshore setnet, Drini
Photo credit © Andria A. Utama
23 panels
90 m

64
Trap (Krendet tangle nets) The krendet fishery started in Gunung Kidul in 1987. There were many available broken gillnets so fishers decided to reuse them rather than discard them. At the time, the frame of krendet was made of bamboo with a monofilament net attached. Futhermore, fishers replace the bamboo with robust material. Krendet is a trap fishing gear widely used for catching spiny lobster because it is relatively easy and inexpensive to use. It cost less than US$1 to make one krendet. There are two types of krendet in Gunung Kidul Regency, which are based on unique local practices. Krendet is constructed of a circular iron frame with a layer of monofilament mesh attached to the frame, and bait is positioned centrally (Figure 12). Fishers usually use chitons or fish as bait. Krendet are set from high cliffs and from small jukung boats of 15 HP. The nets are cast and left on the sea floor from before dusk to dawn, for an average soaking time of 12 hours, and then lifted by ropes attached to the frame. It will be remain fix on the sea floor because of stone sinker tied on the frame. Figure 12. Technical specifications and design of the krendet tangle net
Photo credit © Andria A. Utama Cliff krendet fishing occurs all year-round, while boat krendet fishing occurs only during the lobster season (October-January). Traders In Gunung Kidul Regency, there are two types of fish traders: traders of live lobster and traders of fresh fish. According to EFLAM data, there are six large-scale traders of live lobster located in four fishing ports: Baron, Sadeng, Drini and Tepus. Each trader usually employs around 2–3 workers, one of whom is a female. The female worker works as the weighing staff while other jobs are taken care by male worker. Before sent to the market, lobster was acclimatized in cemented or fibretanks until the lobster reached the minimum volume for shipping (a box of lobster, around 10–15 kg). Acclimatization could be last
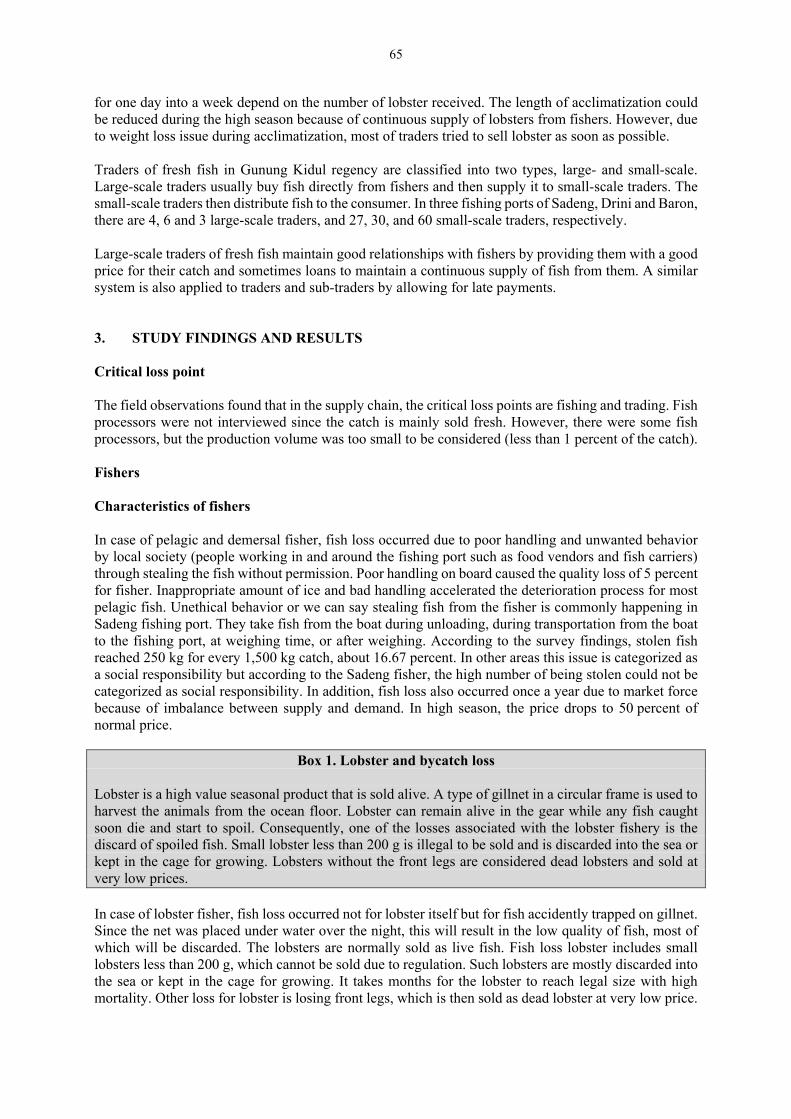
65
for one day into a week depend on the number of lobster received. The length of acclimatization could be reduced during the high season because of continuous supply of lobsters from fishers. However, due to weight loss issue during acclimatization, most of traders tried to sell lobster as soon as possible. Traders of fresh fish in Gunung Kidul regency are classified into two types, large- and small-scale. Large-scale traders usually buy fish directly from fishers and then supply it to small-scale traders. The small-scale traders then distribute fish to the consumer. In three fishing ports of Sadeng, Drini and Baron, there are 4, 6 and 3 large-scale traders, and 27, 30, and 60 small-scale traders, respectively. Large-scale traders of fresh fish maintain good relationships with fishers by providing them with a good price for their catch and sometimes loans to maintain a continuous supply of fish from them. A similar system is also applied to traders and sub-traders by allowing for late payments. 3. STUDY FINDINGS AND RESULTS Critical loss point The field observations found that in the supply chain, the critical loss points are fishing and trading. Fish processors were not interviewed since the catch is mainly sold fresh. However, there were some fish processors, but the production volume was too small to be considered (less than 1 percent of the catch). Fishers Characteristics of fishers In case of pelagic and demersal fisher, fish loss occurred due to poor handling and unwanted behavior by local society (people working in and around the fishing port such as food vendors and fish carriers) through stealing the fish without permission. Poor handling on board caused the quality loss of 5 percent for fisher. Inappropriate amount of ice and bad handling accelerated the deterioration process for most pelagic fish. Unethical behavior or we can say stealing fish from the fisher is commonly happening in Sadeng fishing port. They take fish from the boat during unloading, during transportation from the boat to the fishing port, at weighing time, or after weighing. According to the survey findings, stolen fish reached 250 kg for every 1,500 kg catch, about 16.67 percent. In other areas this issue is categorized as a social responsibility but according to the Sadeng fisher, the high number of being stolen could not be categorized as social responsibility. In addition, fish loss also occurred once a year due to market force because of imbalance between supply and demand. In high season, the price drops to 50 percent of normal price.
Box 1. Lobster and bycatch loss
Lobster is a high value seasonal product that is sold alive. A type of gillnet in a circular frame is used to harvest the animals from the ocean floor. Lobster can remain alive in the gear while any fish caught soon die and start to spoil. Consequently, one of the losses associated with the lobster fishery is the discard of spoiled fish. Small lobster less than 200 g is illegal to be sold and is discarded into the sea or kept in the cage for growing. Lobsters without the front legs are considered dead lobsters and sold at very low prices.
In case of lobster fisher, fish loss occurred not for lobster itself but for fish accidently trapped on gillnet. Since the net was placed under water over the night, this will result in the low quality of fish, most of which will be discarded. The lobsters are normally sold as live fish. Fish loss lobster includes small lobsters less than 200 g, which cannot be sold due to regulation. Such lobsters are mostly discarded into the sea or kept in the cage for growing. It takes months for the lobster to reach legal size with high mortality. Other loss for lobster is losing front legs, which is then sold as dead lobster at very low price.

66
There are larger fishing vessels at Sadeng (larger than 5 GT) compared to Drini and Baron where there are mostly small vessels using outboard motors and crews of 1 to 2 fishers. For Drini and Baron a key loss is due to market forces in the high season and lobster season. During the lobster season, most of fish caught is discarded. Only lobster is landed due to its high value. The price of live lobster reaches IDR400 000–700 000 (US$18) per kg, depending on the species of the lobster, 26–45 times higher than the price of fish. A critical loss point of fish in Sadeng is during the unloading and weighing process, when local people steal fish. Despite efforts to prevent this theft, it continues to occur. Bycatch and habitat impact Pepetan gillnet and tangle net have the highest impact on habitat due to high number of gears loses. Furthermore, FAD gillnet had the highest impact on non-target species due to high number of dolphin discards (Table 2).
Table 3. Impact of gillnet fisheries in Gunung Kidul to habitat and non-target species
Local gear name
Gear loss Fish discarded Reason Total number
of gear loss/year
Species Average quantity
Fish Aggregating Device (FAD) gillnet
Too many fish caught
Stuck in FAD
86 panels *only in Sadeng
Dolphin 5 dolphins/trip/fisher Estimated total discarded in average of 150 dolphins/year (only in Sadeng)
Kambangan fish gillnet
Infrequently
Pelagic gillnet Drini (kediran)
Infrequently
Mackerel fish gillnet
Infrequently Dolphin 1 dolphin/trip/fisher Estimated total discard an average of 58 dolphins/year (only in Baron)
Pepetan lobster gillnet (ciker)
Stuck in coral or stone
Rough weather, hence net lost or stuck
40,000 panels *only in Sadeng
Tanggungan lobster gillnet (ciker)
Nets are damaged by crabs (1 crab can damage 1.5 m net)
90 panels *only in Sadeng
Demersal fish (croaker, sea catfish, rays)
10–15 kg/trip/fisher Estimated total discard an average of 113 tonnes of demersal fish per year (only in Sadeng)
Demersal gillnet Drini (ciker)
Stuck in coral or stone
Rough weather, hence net lost or stuck
150 panels *only in Drini
Crabs, murex
5–10 kg/trip/fisher Estimated total discard an average of 87 tonnes of crabs, murex per year (only in Drini)
Lobster tangle nets (Krendet)
Stuck in coral or stone
Rough weather, hence net lost or stuck
60 000 units of cliff tangle nets 30 000 units of boat tangle nets
Based on interviews, FGDs, and fisheries statistical report it can be estimated the potential number of gears lost (Table 3). It is known that some pepetan fishers in Sadeng were trying to recover lost gear component. They could recover 0.2 tonnes of lead sinkers after two days dive around pepetan fishing ground.

67
Table 4. Potential number of gears lost in Gunung Kidul.
Local gear name Number of boats/vessels Gear loss per vessel
Estimated total number of gear loss/year
FAD gillnet 43 2 panels/year 86 panels *only in Sadeng
Pepetan lobster gillnet (ciker)
50 800 panels/year 40000 panels *only in Sadeng
Tanggungan lobster gillnet (ciker)
45 2 panels/year 90 panels *only in Sadeng
Demersal gillnet Drini (ciker)
30 5 panels/year 150 panels *only in Drini
Lobster tangle nets (Krendet)
1 000 boat fishers and
500 cliff fishers (non boat)
60 units/year 60 000 units of cliff tangle nets 30 000 units of boat tangle nets
Physical loss due to discarded bycatch catch fish is the most significant loss in fishing, especially in the high season and the lobster season. There are two types of physical loss: weight loss of lobster during captivity, and loss of fish caught as by-catch that has deteriorated and cannot be sold due to a quality problem. In the lobster season, fish are not expected to be caught and if they get trapped in the net, some are discarded due to deterioration. Another loss of lobster is due to lobster size that is less than 200 g. Quality loss of lobster is usually due to incomplete legs. Lobster that has lost its front legs are considered as dead lobster and sell at very low price. Based on the findings, lobster net (gillnet) is hauled in in the afternoon and checked the next morning. During the soaking time, lobster survive but fish die and deteriorate in the net, and then discarded. Traders Poor handling following landing causes losses. Traders buy fish based on a flat price irrespective of quality. Fish are then sorted according to quality and size. About 4–6 percent of fish is found to be of low quality. For every 50 kg fish, about 2–3 kg of fish is of low quality, which is sold for 50 percent of the best price. There are two types of traders: traders of fresh fish and traders of lobster. The critical loss point for fresh fish is commonly at the stage of storing or transporting the fish from the fish trader to the customer. Fish are sorted based on size and quality. During the sorting process, fish are selected according to quality. Usually, in every sorting process, there are low quality fish that are sold for a price that is 50 percent lower. Lobster traders experience loss during the acclimatization of lobster before they are sent to market. Lobsters are held in cemented or fibreglass tanks until the lobster reached the minimum volume to be shipped. During the acclimatization, some of the lobsters lose a front leg(s) and some of them die. Live lobster is sold for a high price; however, the price of dead lobster is low. Lobster obtain a prime price when it has all of its legs. Lobster without front legs is considered dead lobster. The front legs of the lobster are critical for the price. Lobster with a complete set of front legs and that have lost less than three legs but not all on the same side can be sold at a good price. Almost all of landed fish are sold but at a low price. Theft of fish on-shore represents a loss to fishers and traders. During unloading and weighing, local people take fish without the permission of the owner of the vessel. Fish bought from the fishing port might not be distributed directly to the small-scale trader and are sorted based on size and quality.

68
Table 4. Summary result matrix of losses in Gunung Kidul Type of loss Cause of loss Percentage
(%) of loss Stakeholders affected
Frequency of loss/time/ season
Impact of loss Trends Perception of stakeholders
Market force loss /quality loss
Poor management of catch during bumper harvest /lobster season
25 Fisher Every lobster season
Most of the impact affects food security
No changes over time. An intervention urgently needed to reduce the loss
They do not care about the loss since they consider it as a normal, unavoidable outcome.
Quality loss Poor handling following landing
4–6 Trader Every time Most of the impact affects food security
No changes over time. An intervention urgently needed to reduce the loss.
They do care about the loss but no action can be taken. 5 Fisher
Physical loss
Stolen 16.67 Fisher Every time Most of the impact affects food security
No changes over time. An intervention urgently needed to reduce the loss.
They do care about the loss but no action can be taken.
Dis-carded due to deterioration
113*) Lobster fisher using Tanggungan lobster gillnet (ciker)
Every time (in Sadeng)
Most of the impact affects food safety
No changes over time. An intervention urgently needed to reduce the loss.
They do care about the loss but no action can be taken.
Discarded due to deterioration
87*) Fisher using demersal gillnet Drini (ciker)
Every time (in Drini)
Most of the impact affects food safety
No changes over time. An intervention urgently needed to reduce the loss.
They do care about the loss but no action can be taken.
Discarded due to deterioration and loss of weight
10 Lobster trader Every time Most of the impact affects food safety
Improved by improving facilities in the acclimatization tanks and water filter. An intervention urgently needed to reduce the loss.
They improve the acclimatization facilities.
Non-target fish 208**) FAD gillnet fisher Infrequently Most of the impact affects the resources sustainability
No changes over time. An intervention urgently needed to reduce the loss.
They do care about the loss but no action can be taken.
Note: * tonnes/year; ** fish/year only in Sadeng and Baron.

69
4. FISH LOSS REDUCTION STRATEGY – CONCLUSIONS AND RECOMMENDATIONS During the lobster peak season, fish caught by lobster fishers are usually discarded due to their low value compared to lobsters and insufficient ice. About 500 kg of fish are discarded per trip per vessel at sea leading to physical losses. This is particularly associated with small vessels (outboard motor fishing vessels). It is estimated that there are 4 500 fishers in Gunung Kidul that target lobster, and most vessels that catch lobster with gillnets incur some discards. Total gear loss leads to “ghost fishing” in Gunung Kidul, which targets lobster. These losses could amount to 86 panels of FAD drift gill-net, 4 000 panels of pepetan lobster set gillnet, 90 panels of tanggungan lobster set gillnet, 150 panels of bottom gillnet and 60 000 lobster tangle net (krendet) per year because the gears are stuck in the coral reef. In particularly, when waves are high, huge amounts of fish are caught. Approximately 22.5 percent of fish landed are given away or stolen: 10 percent are given to labourers and staff, and 12.5 percent is classed as theft and is taken by local people. This amounts to 1.5 tonnes of fish, which at a selling price of IDR11 500, results in lost income of IDR 17 250 000 per trip in Sadeng Port alone. Per annum this would be IDR345 000,000 or US$26 500 per annum per vessel. The proportion that is “stolen” is valued at US$12 000. Quality loss is associated with Sadeng where fishing trips are relatively longer (five to 14 days). Based on an average catch per vessel per trip of 6.5 tonnes, approximately 15 percent (1 tonne) of fish by weight are downgraded due to soaking time. In other ports, vessels are for day fishing, and quality losses are negligible and tend to land a higher proportion of good quality fish. Assuming a price of IDR11 500 for good quality catch and IDR 8500 for low quality, the lost income per trip amounts to IDR3 000 000 per vessel, which is approximately 4 percent of the value of the catch. Extrapolating the data based on 79 vessels making on average 20 trips per year each, the lost income due to quality deterioration amounts to IDR4 740 000 000 (US$364 615) per annum. In terms of market force losses, during the high season (July to October) when catches tend to be highest, the selling price of fish drops. Due to oversupply, the price can drop by up to 50 percent during the peak of the high season (for a one-month period) compared to the price of fish at other times in the season. In terms of reducing quality losses and improving food safety, the following interventions are recommended: The prevention of theft is a priority for fishing vessel owners and fishers, but has proved difficult to
address. Participatory stakeholder dialogue is proposed at the site to decide on a way forward, such as hiring private security, changing the type of container used for fish transport that would have a lid or be insulated. This would involve and empower the committee appointed by the Governor or other locally identified solutions;
Address the illegal sale of undersized and berried lobsters through a locally developed management plan, which may include the introduction of effective and agreeable management measures, education/awareness raising and market intervention;
Experiment with alternative gear types, e.g. bamboo traps, which could be adopted from fishers in Tabanan, Bali to curb “ghost fishing” by lost gillnets. Locations where fishers use better practices (shorter net soaking) can be used to demonstrate the benefits in terms of reducing quality loss;
Improve storage facilities (numbers and capacities) and its management to leverage against price and supply fluctuations. Consider a resi gudang (warehouse receipt or “storage cheque storage cheque”) system as per UU No. 9/2006 (Law No. 9/2006) for application in the fishery sector. Lessons learned from the past use of a resi gudang system should be used to guide all interventions.
A loss reduction strategy is summarized in Table 5 It highlights the need to recognize that loss reduction is best achieved by a multi-agency approach covering different but symbiotic factors.

70
Table 5. Proposed loss reduction strategy
Location /key loss Policy Legislation Technology Infrastructure and services
Knowledge/ skills
Discards at sea (especially during the peak season, almost all of the fish are discarded). “Ghost” fishing. Theft of fish (12.5 percent). Poor on-board handling (Sadeng) leading to 15 percent of catch sold for a 25 percent lower price.
Establish stakeholder dialogue to consider improved management to address the illegal sale of undersized and berried lobsters Consider a resi gudang (warehouse receipt or “storage chequestorage cheque”) system as per UU No. 9/2006 (Law No. 9/2006) for application in the fishery sector.
Collaborate between the government, fishers’ associations to implement regulation pertaining to berried and undersized lobster.
Experiment with alternative gear types, e.g. bamboo traps, which could be adopted from fishers in Tabanan, Bali to curb “ghost fishing” by lost gillnets.
Change the type of container used for fish transport or other locally identified solutions, hiring private security or involve and empower the committee appointed by the Governor.
Build capacity in proper on-board handling.
Shortening the soaking time of nets is one of the easiest ways to avoid fish loss for fishers, but requires more effort since the hauling process is conducted more often. Shortening the soaking time will shorten the time that dead fish are in the water spoiling. Consequently, there will be an improvement in fish quality and a significant reduction in loss. Shortening the soaking time can be combined with installing a mechanical hauler. Improving the on-board cold chain system will help to maintain fish quality. Introducing pre-cooling before the fish are kept in the vessel and improving vessel insulation as well as installing freezers will help maintain the fish quality. Lessons can be learned from a pilot project in Bitung in 2012 and 2014, which successfully improved vessel insulation. A similar pilot project in Bali and Pelabuhan Ratu, West Java was sponsored by the European Union in 2007. For the on-board freezing system, lessons can be learned and adopted from Muara Angke, North Jakarta and Tegal. However, investment could be a challenge for adoption. To reduce or prevent losses, providing enough space and improvement in GHP and GMP, as well as technical assistance are needed. Providing a shelter for unloading, weighing and sorting is required. More and better use of ice is also required during handling and processing. Physical loss (theft) during unloading and weighing should be reduced by applying good management at the fishing port. Security can be used to protect fish from theft. Providing security personnel to secure the unloading and weighing area could be used. Moreover, another option is to raise awareness among the public about this poor practice. One proposed approach is through banners, leaflet, posters, loudspeakers or other media on the consequences of theft and involve the local/village authority or respected people to convey the message to the community.

71
5. REFERENCES Anonymous. 2014. Annual Report for Gunung Kidul Fisheries 2013. Gunung Kidul, Yogyakarta. Ward, A.R. & Jeffries, D.J. 2000. A manual for assessing post-harvest fisheries losses. Natural
Resources Institute, Chatam, United Kingdom. Wibowo, S., Utomo, B.S.B. Syamdidi & Kusumawati, R. 2014a. Evaluating and Monitoring Of
National Post-Harvest Fish Loss in Indonesia. Paper presented at the International Seminar on Fish Processing, Pekanbaru, 9 September 2014.
Wibowo, S., Utomo, B.S.B. Syamdidi & Kusumawati, R. 2014b. Evaluasi susut hasil pasca panen perikanan. Policy Brief. Research and Development Center for Marine and Fisheries Product Processing and Biotechnology. Jakarta. p 4.
Utomo, B.S.B.,Wibowo, S., Syamdidi & Badarudin. 2014. Losses evaluation of fish processing. Paper presented in the International Seminar on “Marine and Fisheries Product Processing and Biotechnology”, Jakarta, 26 September 2014.
Utomo, B.S.B., Wibowo, S., Syamdidi, Agusman, Badarudin & Peranginangin, R. 2013. Evaluasi Susut Hasil Pasca Panen pada Industri Perikanan. Laporan Teknis Penelitian dan Pengembangan. Balai Besar Penelitian dan Pengembangan Pengolahan Produk dan Bioteknologi Kelautan dan Perikanan. Jakarta.


73
D. FISH LOSS ASSESSMENT ON SMALL DEMERSAL FISH IN BRONDONG, EAST
JAVA Singgih Wibowo Syamdidi Agus Heri Purnomo Bagus Sediadi Bandol Utomo Rinta Kusumawati Dwiyitno Subaryono Hasta Octavini Research and Development Centre for Marine and Fisheries Product Processing and Biotechnology Ministry of Marine Affairs and Fisheries The Republic of Indonesia Ansen R. Ward Yvette DieiOuadi Food and Agriculture Organization Rome, Italy

74
1. INTRODUCTION AND BACKGROUND District of Brondong is located in the northern part of Lamongan Regency, East Java Province. Brondong is approximately 50 km from the capital city of Lamongan and situated on the main northern Java road (Pantura), connecting important cities along Java Island. Located on the Coast of the Java Sea, Brondong became an important economic town because it is located between two other important cities, i.e. Semarang and Surabaya, the capital cities of Central Java and East Java Provinces, respectively. Fishing and post-harvest fisheries activities are the leading sector in Brondong Region and contribute significantly to supporting the regional domestic product (PDRB) of Lamongan after agriculture sector. Geographically, Brondong city stretches between 060 53’ 30.81” – 7023’6” S and 112017’ 01.22” – 1120 33’ 12” E, as can be seen in Figure 1. Brondong fishing port is the centre of fishing activity in northern East Java.
Figure 1. Location of Brondong fishing port, East Java
Source: Google maps. 1.1. Status and importance of Brondong Fishing Port With a coastline of 47 km, capture fisheries is the prominent activity of the fisheries sector in Lamongan Region. Several fishing ports have been established in order to facilitate more than 13 000 fishers in capturing and unloading fish and the main fishing ground is located on the Java Sea. The landing and distribution of more than 70 000 tonnes of fish per year are carried out at five fish landing centres, i.e. PPN Brondong, Lohgung, Labuhan, Kranji and Weru. PPN Brondong is the main and largest fishing port in Lamongan, and more than 80 percent of capture fish in this district are landed and distributed from this port. Brondong Fishing Port is located at 06o 53’ 30, 81” S and 112o 17’ 01, 22” E. Brondong landing port was established in Dutch colonial times. With regard to its growing activity and production, the Government has acknowledged Brondong as a Nusantara (National) Fishing Port under the Ministry of Marine Affairs and Fisheries (the Central Government) under Ministerial Agreement (SK) No. 428/Kpts/410/1987 (Ministry of Agriculture) and No. Kep 26 I/MEN/2001 (the Ministry of Marine Affairs and Fisheries). Based on the new status as PPN level B, Brondong Fishing Port has several tasks and responsibilities as a landing site of fish and fishing vessels. It supports facilities for fishing vessels, supervises fishery resources and raises awareness of sustainable fisheries, improve the quality of fish handling and processing, distributes and markets fresh and processed fish for local

75
consumers and the regional market, and serves as a data centre for local capture fishery (PPN Brondong, 2014). Since the location is highly strategic and supported with good infrastructure (a sea port, fish landing, market access, transportation, ice supply, etc), Brondong Fishing Port is attractive to local and regional fishing vessels for landing and unloading their fish. Vessels from Madura, Kalimantan and Sulawesi land here. The fresh fish are then distributed to the local consumer and processor, as well as to the regional markets such as Gresik, Surabaya, Tuban, including Jakarta, West Java, Central Java, East Java and Bali. Some of the premium quality fish are exported through several exporters in Gresik and Surabaya. Between 30–150 tonnes of fish per day are unloaded in Brondong Fishing Port. The layout of the fisheries infrastructure and facilities at Brondong can be seen in Figure 2. Figure 2. Layout of the fisheries infrastructure and facilities at Brondong Fishing Port
Source: Google Earth. Based on the Ministry of Marine Affairs and Fisheries Decree No. 32/Men/2010 on Minapolitan Zone, Lamongan was designated as one of the 197 districts Minapolitan Region. In order to support capture fisheries activities, a number of facilities have been established at Brondong Fishing Port, including a landing site, an auction site with scales, fish processing sites, tap water, an ice maker, cold storage, a gas station, transportation facilities/vehicles, insulated boxes, and plastic and bamboo baskets. Financial assistance from the banks in the form of soft loan scheme is also available for any fisher or trader who requires financial support. Fish production Production of capture fisheries in Brondong is increasing yearly. In 2014, the landed fish at PPN Brondong increased by 23.19 percent compared to 2013, i.e. from 58 145 to 71 626 tonnes. Similarly, the value of fish increased from IDR643 841 million in 2013 to IDR863 992 million in 2014 (Table 1). To date, Lamongan Distrik is the main marine fishery producer in East Java Province in which Brondong is the main producer. There is variation in species landed in Brondong Fishing Port, including demersal and pelagic fish. However, demersal fish such as kuniran (Upeneus sp., sulphur goat fish), kapasan (Geres sp, false trevally), swanggi (Priacanthus sp., purple-spotted bigeye) and kurisi (Nemipterus sp., omate-treadfin bream) are the most dominant species captured in the fishing ground, which stray from Masalembu,

76
Bawean and Matasiri waters in the eastern and Bulak in the west. Details of the main species landed at Brondong fishing port are presented in Table 2. Table 1. Fish production and value in Brondong National Fishing Port, 2005–2014
No. Years Production
(tonnes) Production value
(IDR million) Average price
(IDR/kg) Average production
(tonnes/day) 1 2005 39 295 229 885 5 850 109 2 2006 46 569 306 464 6 581 129 3 2007 60 769 421 183 6 931 167 4 2008 52 249 442 323 8 466 144 5 2009 57 198 495 413 8 661 157 6 2010 46 432 437 815 9 429 126 7 2011 49 278 511 785 10 386 135 8 2012 57 763 610 997 10 578 158 9 2013 58 145 643 841 11 073 159
10 2014 71 626 863 992 12 063 196 Source: Brondong National Fishing Port (2014). Table 2. Number and value of fish species landed in Brondong National Fishing Port, 2014
No. Indonesian name Scientific name English name Production Average
price (IDR/kg)
volume (tonne)
Value (IDR million)
1 Alu–alu Sphyraena barracuda Great barracuda 873 8 815 10 089 2 Ayam–ayam Rhinecanthus sp. White barred triggerfish 2 079 17 070 8 208 3 Kembung laki Rastrelliger kanagurta Indian mackerel 60 649 10 813 4 Beloso Saurida sp. Lizardfish 1 330 8 754 6 582 5 Bawal hitam Parastromateus niger Black pomfret 76 1 825 23 956 6 Baronang Siganus canaliculatus White-spotted spinefoot 200 5 526 27 525 7 Cucut Carcharhinus sp. Requiem shark 536 8 831 16 474 8 Cumi–cumi Loligo sp. Squid 1 521 50 545 33 230 9 Ikan jaket Oxymonacanthus sp. Beaked leatherjacket 798 20 943 26 236 10 Ikan sebelah Hippoglossus sp. Indian halibut 392 6 743 17 189 11 Kakap merah Lutjanus sp. Red snapper 615 34 181 55 558 12 Kembung Rastrelliger sp. Short-bodied mackerel 54 424 7 815 13 Kuniran Upeneus sp. Sulphur goatfish 11 216 111 851 9 972 14 Kerapu Epinephelus sp. Groupers 1 179 40 464 34 305 15 Kerong-kerong Terapon jarbua Jarbua terapon 436 7 214 16 515 16 Kapasan Geres punctatus False trevally 8 289 51 289 6 187 17 Kurisi Nemipterus sp. Ornate-treadfin bream 7 223 118 912 16 461 18 Kuwe Caranx hippos Jack trevally 1 498 37 566 25 063 19 Layang Decapterus russelli Slander scad 4 359 50 670 11 624 20 Lencam Lethrinus sp. Emperors 492 10 349 21 004 21 Lemuru Sardinella lemuru Bali sardinella 15 77 5 087 22 Lemadang Coryphaena sp. Mahi-mahi 229 3 425 14 917 23 Layur Trichiurus sp. Hairtails 113 1 604 14 093 24 Swangi Priacanthus sp. Purple-spotted bigeye 22 153 187 311 8 455 25 Manyung Arius thalassinus Giant sea catfish 465 10 550 22 673 26 Peperek Leiognathus sp. Ponyfish 1 119 5 070 4 528 27 Pari Dasyatis sp Rays fish 943 15 071 15 980 28 Selar, selar kuning Selaroides leptolepis Yellowstripe scad 55 408 7 423 29 Tenggiri Scomberomorus sp. Spanish mackerel 299 10 940 36 549 30 Tongkol Euthynnus affinis Kawakawa 713 11 402 15 972 31 Tembang Sardinella sp. Fringescale sardinella 150 723 4 808 32 Tonang/Cunang Tylosurus sp. Needlefish 273 6 469 23 649 33 Biji nangka Upeneus sp. Goldband goatfish 1 527 16 784 10 986 34 Other fish 330 1 520 4 599 Total 71 610 855 157

77
Services Brondong landing site is a relatively old port with low capacity in comparison to the growing number of vessels that land here. This results in a delay of unloading for some vessels due to limited landing space. Alternatively, fishers land the vessels and fish at a small port located in Blimbing village. For this reason, the Government has been developing a new and bigger landing site in Sedayulawas with a capacity for more vessels. Currently, in 2017, the new Sedayulawas fishing port has already been operated for Berondong Fishing Port activity. A supply of potable water for cleaning fish, equipment and facilities is available at Brondong fishing port. Nevertheless, some fishers and traders prefer using marine water from around the jetty to wash their fish and equipment. Petroleum, diesel and ice are also available at the port. There is an ice maker and two cold storage facilities with a capacity of 150 and 400 tonnes, respectively. Electricity for fish handling activities at the auction site and around the fishing port is also available. Hygiene and sanitation Facilities are available for fish hygiene and sanitation. The floor of the auction site has been paved with ceramic tiles and surrounded with drainage. There are also a limited number of toilets in limited number are also available. Although all of the facilities are available in the fishing port area, the sanitation conditions of the port environment are inadequate due to poor management practices and the carelessness of the people in the location. 2. OVERVIEW OF SUPPLY CHAIN – SITUATION ANALYSIS 2.1. Overview of supply chain in Brondong Fishing Port Between 30–40 vessels/day land carry on average 7–9 tonnes of fish per vessel. Fish landed are either distributed as fresh fish or processed into traditional products and semi-processed products such as headless and pre-eviscerated fish. There are three main traditional processed products produced: dried salted, boiled salted and smoked fish. Java and Bali are the main market for fresh and processed products. Additionally, semi-processed product, known as fillet/headless fish, are distributed to domestic fish processors in Gresik, Surabaya and Sidoarjo, and used as raw material for various food products such as fish balls, nuggets and chips. The premium quality of headless/fillet are processed into surimi and exported to China and Republic of Korea. 2.2. Marketing systems The key markets for fish are Central Java, West Java, Jakarta and Bali. The general chain of fish and fish products in Brondong based on the field observation is summarized in Figure 3. Fish quality significantly contributes to the market price of fresh fish. For 1 kg first quality kurisi, prices are IDR15 000–19 000, but for lower quality the price drops to IDR 7,000–8,000 for 2nd quality, and IDR3 000/kg for very low quality. For some fish, size and season also affect the price. Table 3 presents an overview of price variations. As shown in Figure 3, the local market in East Java is the main destination of fresh fish from Brondong. Some of the fresh fish (tonang, jacket and shark fin) distributed to Jakarta and Surabaya are further processed there.

78
Figure 3. Overview of fish supply chain in Brondong fishing port, East Java
Photo credit © RDCMFPPB Table 3. Price variation of different fish based on the quality ranking
No. Fish species/quality High season (IDR) Lean season (IDR) 1 Grouper (kerapu):
1st quality Below-standard quality
55 000–65 000
45 000
55 000–65 000
45 000 2 Red snapper (kakap):
1st quality Below standard quality
73 000 25 000
73 000 30 000
3 Yellow spotted sweetlip (kaci kaci): 1st quality
Below-standard quality 20 000–25 000
15 000 20 000–25 000
15 000 4 Indian halibut (sebelah):
1st quality Below-standard quality
20 000 10 000
22 000 12 000
5 Ray fish (pari): 1st quality Below-standard quality
24 000–27 000
20 000
24 000–27 000
20 000 6 Ornate-treadfin bream (kurisi): Large
Medium Small
16 000–19 000 8 250 6 100
16 000–19 000 8 250 6 100
7 Purple-spotted bigeye (swangi) 10 000–15 000 8 000–10 000 8 False trevally (kapasan) 6 600 6 600 9 Shark (cucut) 16 000 16 000
10 Beaked leatherjacked (jaket) 63 000 63 000
Unloading, sorting
Trader and agent
Weighing area (auction site)
Weighing, packaging
Domestic markets:
• East Java 71 percent • West Java 12 percent • Bali 8 percent
Reseller
Headless fish (43 percent)
Domestic processor(Fish ball, Nugget, Chip)
Exported as surimi
Boiled salted fish (9 percent)
Fresh fish (59 percent)
Processed fish(41 percent)
Dried salted fish(33 percent)
Smoked fish(15 percent)
Longline fishers (3 percent)
Demersal purse seine fishers (97 percent)

79
In Brondong, in addition to the critical point for fish loss in fishing activities, other critical points are processing, packaging and transportation. East Java, Bali, Central Java, Jakarta and West Java are the market destinations of boiled and dried salted fish from Brondong. Boiled salted fish are mostly distributed to East Java and Central Java, while dried salted fish are mainly distributed to East Java and West Java; only smoked fish are distributed in East Java. Figure 4 shows the market distribution of boiled and dried salted fish produces from Brondong. Figure 4. Market distribution of dried and boiled salted fish from Brondong
Photo credit © RDCMFPPB 2.3. Selected fish supply chains at Brondong Fishing Port A number of stakeholders are involved in the fishery activities at Brondong fishing port, including fishers, traders (large-scale/small-scale traders and retailers), fish unloaders, sorters and transporters, as well as fish processors. Fishers There are 1 735 fishing vessels in Brondong involving 16 076 fishers/crew members. Most of the vessels are modified mini trawl/Danish seine (71 percent), followed by long line (18 percent), collector vessel (9 percent), pelagic seine (1 percent), small purse seine (1 percent). As a result, fish production in Brondong is also dominated by modified mini trawls/Danish seines. Figure 5 summarizes the distribution of fishing vessels, the number of fishers and the distribution of fish production for each group of fishing vessel. The number of vessels in PPN Brondong accounts for more than 70 percent of all fishing vessels in Brondong District, compared to 361 vessels in Labuhan landing port and 245 vessels in Lohgung landing port (PPN Brondong, 2014). There are five groups of fishing vessels in PPN Brondong, based on fishing gear: purse seine (pukat cincin), modified mini trawl/Danish seine (cantrang/dogol), pelagic purse seine (payang), long line (rawai) and fish collector vessels. Fish collector vessels are specifically operated to collect and transport fish from vessels to shore or transport fish from other fishing grounds such as Borneo and Cellebes. Purse seine vessels are between 30–50 GT, modified mini trawl/Danish seine (5–30 GT), pelagic seine (10–30 GT), long line (5–20 GT) and fish collector vessels from 10–30 GT. The number of fisher on each type of fishing vessel differs. On a modified mini trawl/Danish seine, there are 25 fishers, five to ten fishers on a mini purse seine, eight fishers on a pelagic seine, seven fisheries on a long line and seven fishers on fish collector vessel.
East Java84%
Central Java10%
West Java3%
Jakarta1%
Bali2%

80
Figure 5. Overview of fishing vessels, fish production distribution, and number of fishers in Brondong National Fishing Port, 2014
Source: © RDCMFPPB The duration of fishing periods depends on the vessel size, the fishing gear and the fishing ground. Generally, for purse seine vessel, fishing trips last 10–15 days/trip; a 10–30 GT modified mini trawl/Danish seine, of 7–14 days/trip; long line vessels, 3–7 days/trip, and collecting vessels, 10–12 days/trip. In contrast, the smaller demersal seiners make only one day trip. Vessels are equipped with insulated boxes and take ice to sea. The fishing trip length affects significantly the quality of landed fish due to the inadequate amount of ice for fish preservation. It was observed that an average of 150 kg ice (six blocks) are used to conserve an insulated box of fish containing approximately 1 500 kg of fish. Most fish are landed at early morning, then unloaded, sorted by species and size, washed, transported to weighing area, weighed and transported to supplier. All processes are completed by 9.00 a.m. This process is conducted as quickly as possible because the price of fish unloaded after 9.00 a.m is reduced by IDR1 000 for each hour late. After unloading, fish are sorted and put in bamboo baskets (50 kg per basket) and rinsed with ambient temperature water. Generally, the water used for rinsing is seawater taken from the fishing port, which is far from the recommended quality. Using bamboo baskets, the fish are then transported by bearers to the weighing area for weighing and transported to the further buyer (supplier) in the same area. The distance from the jetty to weighing area and from the weighing area to the supplier is about 500 m. Four pairs of bearers, all of whom are men, (two workers per pair) are needed for transporting a vessel of fish (Figure 6). During unloading and sorting, no ice is added.
Purse seine1%
Mini trawl/Danis…
Pelagic seine1%
Long line18%
Collector9%
Percentage of fishing vessel
Purse …
Mini trawl/Danish …
Pelagic seine1%
Long line3%
Collector 15%
Number of fish production based on fishing gear
Purse seine, 305
Mini trawl/Danish seine,12 378
Pelagic seine, 22
Long line, 2 178
Collector, 1 157
Number of fishers based on fishing gear

81
Fish traders Fish traders contribute significantly to the trading and distribution of fish in Brondong. Since there is no official auction, the fisher sells directly to a trader or an agent. Generally, this trading system operates for small demersal fish, the main landed fish in Brondong, which are captured by modified mini trawl/Danish seine (cantrang) gear (Figure 7). Most of the catch purple-spotted bigeye, sulphur goatfish, false trevally, ornate-threadfin bream and goldband goatfish, as shown in Figure 7. Figure 6. Transportation of the catch by the male carrier (tukang pikul)
Photo credit © RDCMFPPB
Source: Annual Report of PPN Brondong, 2014. Once the fisher agrees to sell to a trader, all of the fish in the vessel are sold at once. The trader will then pay all costs generated after transaction, including for unloading, sorting and transporting, etc. Fisher will get one fixed price for all the catches, no matter the quality and the size are. This trading method attracted the fisher for practical purposes and the ease. There is another trading method in which the fisher sells the fish to an agent (trader). In this system, the fisher agrees to get help from an agent to sell the fish (selected species or all of the fish) to buyers (traders or fish processors). The agent provides a service of selling the fish with a fixed fee or commission. All costs incurred in this agreement are paid by the fisher, including the cost for unloading, sorting and transporting, etc. On average, the fisher pays the agent a commission of IDR500 to 1 000 per kg of fish sold. Even if it seems to be more impractical
0
5000
10000
15000
20000
25000 22 154
11 216
8 2907 224
4 3592 079 1 528 1 521 1 179
Figure 7. Major fish species landed in Brondong fishing port, 2014 (tonnes)

82
and complicated for the fisher, this system is still being used. Fishers look for the best price for the quality of fish sold and based on the cash and carry payment system, which could not be found in the previous system. To set the buying price, the trader checks on-board type/species, volume, and quality of the fish. As reference, the trader assumes that the full capacity of each fish hold is 2.8 tonnes including ice. Assuming that ice: fish=1:1, normal load of each fish hold is 1.4 tonnes and estimated as 1.3 tonnes. The load is estimated as 1.2 tonnes if the hold is not full. This estimation is used by the trader to bargain the price with the captain of the vessel. In addition to small demersal fish, there are also fish captured by long line, classified as krakahan, which is a group of bigger demersal species. They include shark, groupers, snapper, ray fish, yellow spotted sweetlip, Indian halibut and beaked leatherjacked, among others. In general, their production is relatively low, i.e. 500–3 500 kg/trip depending on the vessel size. The fish are commonly sold to an agent or a small trader, and then sold to domestic resellers in Lamongan and Tuban, or further exported via Surabaya for the premium quality. The mode of payment is either cash on delivery or a maximum seven days after delivery. An overview of activities and stakeholders in Brondong fishing port is shown in Table 4.
Table 4. Overview of fisheries stakeholders at Brondong Fishing Port
Type of fishers Number of
operators and specific equipment
Overall population of operators at
Brondong
Percentage of women
(%)
People affected by losses
Total capture or product per
day* (tonnes/day)
Fishers (crews) 1 735 vessels 16 076 fishers 0 100 199
Traders and agent (crews)
34 1 921 crews 85 0 262.5
Small traders (crews)
30 570 members 79 100 54
Selected processors (workers)
23 1 254 members 83 23 193.2
Note: *Calculated from total capture or production or product per year divided by 360 (with assumption 12 months per year and 30 days per month). There are 34 large traders operating their business at Brondong fishing port. All of the catch are bought by them through two trading methods, the agent system and the one fixed price system. One of the largest traders in Brondong purchases a maximum of seven vessels’ catch in one day, or 17.5 percent of total catch landed from the vessel in Brondong Fishing Port. This may amount to around 100 tonnes of fish/day in the high season (an average of 50 tonnes of fish/day). The method of payment is cash on delivery (paid after weighing). Estimating that the average price of fish is IDR10 000/kg, the total payment by the trader amounts to IDR500 million per day. Figure 9 explains the different distribution chains for small demersal purse seine fish and bigger demersal long lined fish in Brondong. Traders provide the plastic baskets for unloading the fish. Insulated boxes are used to store fish temporarily during selling in the fishing port area in order to minimize the fish quality deterioration (Figure 8). If necessary, fish are stored on ice for 2–3 days in insulated boxes until they are completely sold. Insulated boxes are also provided by traders to distribute fish from landing site to the traditional market and retailer.

83
The cold chain system, sanitation and hygiene are among critical issues in the unloading and distribution of fish. Lack of ice utilization is common during unloading, sorting and transporting fish at the landing. During distribution, a trader uses ice to fish ratio of 1:10. Even though freshwater is available in the fish landing, most of traders/workers prefer using the water from the ocean around the jetty. Using bamboo baskets to transport fish from the jetty to the auction site is also believed to cause more fish contamination than using plastic baskets.
Figure 9. Distribution chain of small demersal purse seine fish (A) and bigger demersal long lined fish (B) in Brondong Fishing Port
Figure 8. Insulated box for temporarily storage
Photo credit © RDCMFPPB
FISHERS
UNLOADING
SORTING
WASHING
TRANSPORTING TO WEIGHING AREA
WEIGHING
PACKAGING
LOCAL MARKET EXPORT MARKET
• By men and women• Species, size • Freshness • Into bamboo basket • Without ice
TRANSPORTING TO RESELLER
• Into plastic container • With ice

84
(A)
(B)
Fish processors Since fish are captured by various vessel types that may be at sea for 1–2 weeks or more, the quality of the fish landed varies and they are graded accordingly. Fish caught early in the trip are usually downgraded due to quality deterioration. Premium quality fish enter the fresh fish distribution chain and low quality fish are usually processed. It is estimated that around 41 percent of fish landed are processed into various products (Figure 3). Processing is concentrated in three villages: Brondong, Labuhan and Lohgung. Table 4 gives a summary of the fish processing units. Production of headless and dried salted products is the most important processing activity. This method is used to preserve small pelagic fish such as kuniran/sulphur goat fish, flase trevally, swanggi/purple-
FISHERS ON BOARD
FISH CHECK
D-1 (one day before unloading), usually soon after the vessel harboring
For estimating weight, quality, price
SORTING
PRICE BARGAINING
UNLOADING
WASHING
WEIGHING
Species, size, quality By women (25 women
per vessel from fisher, controlled by 7 men per vessel from buyer/trader)
No iced Put in the bamboo
baskets
Pour with room tempt water into fish in the basket
Water from sea in the port
TRANSPORTING TO WEIGHING AREA
By “tukang pikul” (bearers) in the bamboo baskets
4 pairs of bearers/vessel
By “tukang pikul” in the bamboo baskets
Finished by 07.00 a.m.
SUPPLIER TRANSPORTING TO
SUPPLIER
Paid in cash after weighing
Takes 3-4 hours from unloading
Very early morning (starts at 03.00 a.m.)
Ended at about 07.00-09.00 am
Takes about 3 hours to finish unloading

85
spotted bigeye and kurisi/omate-treadfin bream. Fish processors obtain fish from traders. Low quality fish are processed into headless products, and high quality fish are destined for further processing into surimi3 for export. Lower quality headless fish are also sold to the domestic market as raw material for various food products such as fish balls, nuggets and fish chips. Table 5. Number of fish processing units in Lamongan District
Product Brondong Labuhan Lohgung TotalHeadless/fillet 53 6 4 63 Dried salted 47 19 7 73 Boiled salted 33 6 4 43 Smoked 17 5 - 22 Fish sauce 15 16 - 31 Chip 3 - - 3 Fish meal 2 2 - 4 Total 170 54 15 239
Source: Anon, 2015. Processing activities (deheading) are conducted at processing units (30 m2) provided by the Government at the landing area. Fish are deheaded with a simple knife, cutter or scissors, as presented in Figure 10. The yield is 65–75 percent, depending on the fish quality. The use of ice during processing for 2–3 hours is very limited. Ice is used during packaging of the product in insulated boxes for transportation to the fish processing units in Surabaya, Gresik or Sidoarjo (2–3 hours by car) (Figure 11). Tap water or groundwater is used during processing. Fish processors prefer plastic baskets to bamboo. As shown in Table 4, women workers are dominant in this activity (more than 80 percent). The number of workers depends on the capacity of the processing unit. A processor could involve 30–60 workers in the production of 5–10 tonnes headless fish (7.5–15 tonnes raw fish). Dried salting and boiling and salting are other common traditional processing methods typically used to process low quality fish, which cannot be sold fresh. The fringescale sardinella (Sardinella sp.), slander scad (Decapterus russelli) and Giant marine catfish (Arius thalassinus) are typical species for dry salting. The process of drying and salting fish involves immersing the fish in concentrated brine (10–35 percent) overnight before sun drying for several days until the fish are dry. Fringescale sardinella (Sardinella sp.), slander scad (Decapterus russelli), kawakawa (Euthynnus affinis) and short-bodied mackerel (Rastrelliger sp.) are boiled and salted. Boiled salted fish differs from dried salted in that the fish is boiled after salting, and a lower concentration of salt is used (Figure 12). Dried and boiled salted fish are distributed to local and provincial markets. Figure 10. Headless fish processing unit (left) and its typical product (right)
Photo credit © RDCMFPPB
3 This is a paste of inexpensive fish shaped, colored, and flavoured in imitation of lobster meat, crabmeat, etc.

86
Figure 11. Headless fish packaging (left) for transportation (right)
Photo credit © RDCMFPPB Figure 12. Boiled salted fish processing unit
Photo credit © RDCMFPPB 3. STUDY FINDINGS AND RESULTS 3.1. Critical loss points The fieldwork indicates that post-harvest fish losses affect fishers more than traders and fish processors. Poor handling on-board and the long time of fishing trips were believed to cause the loss for fishers. In contrast, for traders, small quality losses occurred during the unloading of the fish due to theft by unemployed persons at the fishing harbour. Fishers Analysis of the fieldwork indicates that physical losses only occur during handling and landing of fish. Almost all captured fish are sold without any thrown away, although some fish are sold for a low price. Physical losses mostly refer to stolen fish by the unemployed during unloading and transportation from fishing vessels to the weighing areas and suppliers. Nevertheless, this loss is considered to be a social obligation on the part of fishers. Quality losses are associated with changes due to spoilage or physical damage but the fish are still sold, often for a low price. Quality loss occurs due to poor handling on-board, i.e. an inappropriate amount of ice used. Moreover, fishing trips last longer than ten days, some even 15 days, which also causes the deterioration of fish. This condition is exacerbated by the queuing time for unloading due to the limited space at the fishing port. Since fish unloaded from the vessel after 9.00 a.m. that are paid at a lower price, most fishers postpone the unloading activity for the next day.

87
Box 1. Conditions of ice used upstream and losses in the subsequent stages Ports such as Brondong have seen an increase in production and volume of fish landed over the past years. Fundamental to loss reduction and control is access to enough good quality ice. Evidence from the study shows that ice is in high demand for both on-board and on-shore preservation of fish. However, supply does not meet demand, and the ice that is available is of a sub-standard cooling capacity. Hence, a key intervention to reduce quality loss should be focused on ice production and use. Quality deterioration through time temperature abuse on-board fishing vessels results in a 30 percent price reduction. Based on an average fishing trip of 14 days, it is estimated that 22 percent by weight (on average 2.2 tonnes) of fish (9 percent by value equivalent) has deteriorated by the time of landing (if the time between fishing and unloading is over 14 days). Losses that occurred during long fishing trips are affected by the lack of ice. Fish that are caught first will experience greater quality deterioration. Another quality loss occurs due to overproduction, especially during major Moslem holidays, which occur twice a year. Fish that are not sold directly are sold for fishmeal at very low prices. This typical quality loss is generally rare, only about once or twice a year. In general, the unloading process of fish catch from vessel to supplier in Brondong is shown in Figure 13. Figure 13. Unloading, sorting and transportation of fish from fishing vessel to the weighing site
Photo credit © RDCMFPPB The operating fishing time needed for Danish seine vessels, (mini purse seine) vessels and fishing vessels is 10–15 days, 7–10 days and 3–7 days, respectively. Most of the catches are sold locally since the quality does not the standard for export requirement. Only grade 1 and 2 are exported to the China and Singapore, respectively. The price of fish sold at Brondong Fishing Port are shown in Table 6. Table 6. Price of fish based on quality
No. Fish Grade Price (IDR/kg) Market destination
1 Grouper 1st 65 000 China 2nd 47 000 Singapore 3rd 30 000 Local 4th 12 000 Local 2 Spanish mackerel 1st 65 000 China 2nd 55 000 Singapore 3rd 50 000 Local 4th 47 000 Local 3 Beaked leatherjacket 1st 140 000 China 2nd 120 000 Singapore 3rd 45 000 Local 4th 20 000 Local

88
Traders Critical loss points during trading are the unloading from the vessel, sorting, transportation to the weighing area, weighing, and transportation to suppliers. The stages of unloading fish, sorting and transporting fish to suppliers are carried out without ice, but this does not significantly affect the quality of the fish. The unloading area is uncovered so fish are exposed to the sun, drying out the surface of the fish, which tends to lower the price. Another issue raised is the water used to wash fish. Unclean seawater is commonly utilized to wash the fish, which increases the possibility of being contaminated by microorganisms. Further research should be conducted to reveal how the contamination could increase fish loss in this fishing port.
The most common loss that affects traders is physical loss. Physical loss occurs during unloading to weighing and then to the processing area, where about 3 percent of fish is lost due to theft. This amount to approximately 500 kg of fish per day for the entire site. In addition, one to two fish are also taken by the weighing staff at each weighing. Another loss of around 0.2 percent of fish is due to fish falling from containers on-shore and crushed under foot. Another loss that occurs is quality loss. Traders generally can sell all the fish without any being thrown away, albeit at a low price. The traders prefer to have a value loss provided that they still can get their capital back. Quality
losses in the trader are due to rough handling in the unloading process. Some fish are damaged because of being trampled during unloading in the peak season, due to the high quantity of fish landed and small unloading space. It is estimated that 50–200 kg of fish become damaged (10 000 kg) and are sold for fishmeal at IDR2 500/kg. The quality losses reported account for about 1.01 percent of total catch. Quality loss also occurs when there are problems in delivering fish to the market vehicle or in freight delivery service. Nevertheless, this kind of quality loss is rare, occurring only 3–4 times per year. Fish processors Critical loss points are when the fish leave the landing site, the beginning of processing, and during processing. Poor cold chain practices result in a quality loss as do poor processing practices such as processing on the floor, increasing the risk of contamination. During transportation, water drains from fish, causing weight loss. 3.2. Load tracking result LT was conducted to measure losses in processing chains, which produce a product named head less false travelly (Geres punctatus). The deheading activity of false travelly was observed during handling, processing, transportation, and storage, relying on measuring physical and quality losses before and after each step of processing, transportation and storage. The main activity of processing of headless fish in Brondong is shown in Figure 15. The objective of this LT was to quantify the physical and quality losses of headless false travelly and to identify the causes of the product losses. A load was tracked with two fish processors during one processing cycle. Quality analysis was carried out with the guidance of both the processor and wholesaler to determine quality parameters and the reasons for quality deterioration.
Figure 14. Washing of captured fish using non-potable water
Photo credit © RDCMFPPB
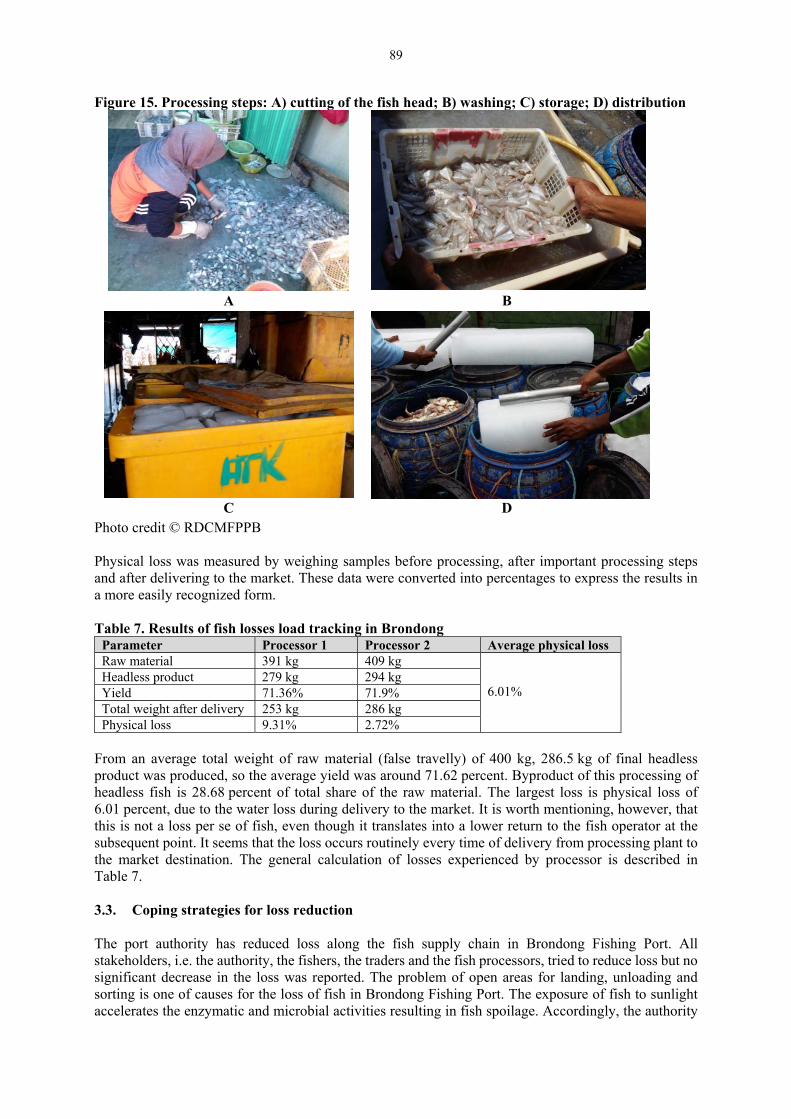
89
Figure 15. Processing steps: A) cutting of the fish head; B) washing; C) storage; D) distribution
A B
C D Photo credit © RDCMFPPB Physical loss was measured by weighing samples before processing, after important processing steps and after delivering to the market. These data were converted into percentages to express the results in a more easily recognized form. Table 7. Results of fish losses load tracking in Brondong
Parameter Processor 1 Processor 2 Average physical loss Raw material 391 kg 409 kg
6.01%
Headless product 279 kg 294 kg Yield 71.36% 71.9% Total weight after delivery 253 kg 286 kg Physical loss 9.31% 2.72%
From an average total weight of raw material (false travelly) of 400 kg, 286.5 kg of final headless product was produced, so the average yield was around 71.62 percent. Byproduct of this processing of headless fish is 28.68 percent of total share of the raw material. The largest loss is physical loss of 6.01 percent, due to the water loss during delivery to the market. It is worth mentioning, however, that this is not a loss per se of fish, even though it translates into a lower return to the fish operator at the subsequent point. It seems that the loss occurs routinely every time of delivery from processing plant to the market destination. The general calculation of losses experienced by processor is described in Table 7. 3.3. Coping strategies for loss reduction The port authority has reduced loss along the fish supply chain in Brondong Fishing Port. All stakeholders, i.e. the authority, the fishers, the traders and the fish processors, tried to reduce loss but no significant decrease in the loss was reported. The problem of open areas for landing, unloading and sorting is one of causes for the loss of fish in Brondong Fishing Port. The exposure of fish to sunlight accelerates the enzymatic and microbial activities resulting in fish spoilage. Accordingly, the authority

90
has conducted a coping strategy by roofing the sorting area. However, this activity is still under construction. Possibly, once the construction is completed together with the implementation of cold chain system, the fish loss during this supply chain could be reduced. Another coping strategy for loss reduction is the implementation of local regulations for illegal activity (such as theft). Furthermore, prevention of theft or of taking fish without permission is not given due attention at this fishing port. The number of fish stolen is high, reaching 500 kg/day. There are three critical points for theft in the supply chain, i.e. transporting from sorting area to the weighing area, at weighing area, and the last one is fish transportation to processor plant. The total loss at each stage was around 1 percent for an overall total of 3 percent. The authority and stakeholders have taken actions to avoid this illegal activity but to no avail. One of the actors is the weighing staff. They take fish from traders or agent during the weighing activity. They explain that they take fish because they are underpaid by the authority so they consider the fish taken as a supplementary additional salary. Figure 16. New facility of the fishing port with shelter in the jetty for unloading in Brondong Fishing Port, under construction
Photo credit © RDCMFPPB
4. CHARACTERIZATION OF POST-HARVEST FISH LOSSES IN SELECTED SPECIES
AND PRODUCT 4.1. Post-harvest fish losses According to the study results from both EFLAM and LT, post-harvest fish loss affecting fish processors and traders are relatively low. The highest loss incurred by fisher is due to both poor onboard handling and unloading at fishing port. Loss at fishers’ point is considered as serious problem because it occurs every time. A summary of losses in fisheries activity in Brondong is provided in Table 8. 4.2. Women’s involvement in fishery activities in Brondong, East Java There are a large number of workers involved in the fish landing activity at Brondong fishing port. Unloading usually starts at 5.00 a.m. and is completed at around 9.00 a.m. There are at least 25 female workers who carry out fish sorting for every vessel, and are supervised and controlled by seven male workers. Fish are sorted according to type of fish, size and quality. Women sort the fish for the fishers but are paid by the traders. In one day, 30–40 vessels dock at Brondong Fishing Port, so it is estimated that 1 300 female workers (95 percent) are employed to sort the fish under the supervision of 40 male workers, as well as 20 male workers as carriers (tukang pikul) (Table 3). As presented before (Table 3), another gender issue is related to fish processing units labour. The deheading fish product, dried salted and boiled salted are the most prominent processing activities in Brondong. Typically, there is a strong contribution of women workers in processing. In deheading fish,

91
for example, 85 percent of workers are women, while male workers are mainly responsible for transportation. A similar trend is also found in the processing of dried salted and boiled salted fish. Table 8. Summary result matrix of fish losses in Brondong Fishing Port
Type of Loss
Cause of loss
Percentage and value of loss
Stakeholdersaffected
Frequency of loss/time/season
Impact of loss
Trends Perception of stakeholders
Quality loss
Landing site limitations. Poor handling following landing.
22% by weight 9 % by value
Fishers Every time
Most of the impact affects food safety and food security
There are no changes over time. An intervention is urgently needed to reduce the loss.
They are aware of loss and require a larger landing site.
Physical loss*
Drip loss during transporta-otion. Theft.
6.01% 3%
Fish processors Traders
Every time
Most of the impact affects food safety
There are changes over time.
They do not care about the loss since it is considered a normal consequence of their activity
Market force loss
Over supplay before Eid and Eid al-Adha.
1–2% Fishers 1–2 days/year
Most of the impact affects food safety and food security
There are no changes over time.
They do not care about the loss since is it considered a normal consequence of their activity
Note: * The physical loss due to the drip loss during delivery to the market. Figure 17. Fish unloading and sorting activity in Brondong Fishing Port
Photo credit © RDCMFPPB

92
Figure 18. Washing fish with jetty water (left); transportation to the landing area while fish is strolen (centre); weighing (right)
Photo credit © RDCMFPPB 5. FISH LOSS REDUCTION STRATEGY – CONCLUSIONS AND RECOMMENDATIONS During unloading to weighing and then to the processing area, 3 percent of fish are lost due to theft. This amounts to approximately 500 kg of fish per day for the entire site. Some of this fish are taken in lieu of cash payment for weighing fish and other supporting activities. Some fish (0.2 percent) fall from containers on-shore and are crushed under foot. Fish processors traditionally add 5 percent more fish to packs of deheaded fish as a “gift” for export buyers. This is not a physical waste but a loss of income to fish processors. Drip loss also leads to a 5 percent loss in fish weight to fish processors. Quality deterioration through poor on-board handling (inappropriate ice used) results in a 30 percent price reduction. Based on an average fishing trip of 14 days, it is estimated that 22 percent by weight (on average 2.2 tonnes) of fish (9 percent by value equivalent) has deteriorated by the time of landing (if the time between fishing and unloading is more than 14 days). The value of this loss is estimated at IDR12 100 000 per vessel per trip. Assuming that 15 vessels (from 45) per day are affected by this loss, then IDR181 500 000 per day is lost in terms of potential income to the fleet. On an annual basis, this indicates a potential loss in income due to quality deterioration for the fleet of IDR66 247 500 000 (US$5 095 961). Late landing may also suggest to buyers that fish on-board is of a lower quality. It can also lead to landing/unloading being delayed until the following day, which exacerbates the deterioration of fish quality. Late landing has increased due to limited landing capacity and shallow water during low tide. Demand for ice is high and hence it is produced quickly, and not frozen properly. Ice quality is therefore generally poor (sub-standard cooling capacity), not in adequate supply, and contributes to quality deterioration. When vessels land late, there is a risk that buyers will already have bought sufficient fish for their needs and therefore the prices at first point of sale are low. Market force loss also occur during religious holidays. Table 9 provides a summary of some key data on losses at Brondong fishing Port.

93
Table 9. Percentage of value postharvest fish losses in Brondong Fishing Port Critical loss point
Magnitude of loss Percent- age (%)
Cause of loss
Intervention to reduced loss
Weight Economic loss (IDR)
Onboard handling
2.2 tonnes/vessel
12 100 000 per vessels per trip
22.22 Poor quality of ice. Shallow water delays landing
Improve ice production capacity and quality of ice. Improve the landing capacity of the harbour. Increase the depth of waters surrounding the landing area of the harbour. Improve storage facilities.
Sorting and weighing
500 kg/day 5 000 000/day 3 Theft Enforce laws and regulations
Transportation Not available 6.01 Drip loss Use a sufficient amount of ice. Use good packaging
In Brondong, fish production is increasing annually and may be outpacing the development of ancillary onshore infrastructure and industries such as ice production. This observation may help explain some of the handling and processing problems at other sites. In terms of reducing quality losses and improving food safety, the following interventions are recommended: Improve the landing capacity of the harbour from 30 vessels to a capacity of at least 45 vessels; Increase the depth of waters surrounding landing area so that at low tide, the vessels are still able to
land; Improve ice production capacity, leading to better availability of better quality ice; Improve storage facilities (numbers and capacities) and its management to leverage against price
and supply fluctuations. Consider a resi gudang (warehouse receipt or “storage cheque storage cheque”) system as per UU No. 9/2006 (Law No. 9/2006) for application in the fishery sector. Lessons learned from the past use of resi gudang should be used to guide all interventions;
Roof the sorting area to reduce exposure of fish to high ambient conditions and to improve working conditions;
Build the capacity of fishers in proper on-board handling including good icing practice. A loss reduction strategy is summarized in Table 10. It highlights the need to recognize that loss reduction is best achieved by a multi-agency approach covering different but symbiotic factors. Onboard handling is a key issue. Combined with the right equipment on board, the fishing port authority should provide enough ice for fishers and build their capacity to properly handle fish on board. Ice should be frozen for at least 8 hours but instead is frozen for 4 hours due to the high demand. As long as the supply of ice is still low, the quality of ice will not improve. Hence, the establishment of new ice producers or providing a better supply of ice from existing providers is a must to reduce fish loss during on-board handling.

94
Table 10. Proposed loss reduction strategy Location/key loss
Policy Legislation Technology Infrastructure and services
Knowledge/skills
Poor on-board handling leading to 22 percent of catch sold for 30 percent lower price.
Consider a resi gudang (warehouse receipt or “storage cheque”) system as per UU No. 9/2006 (Law No. 9/2006) for application in the fishery sector.
Develop standard method for on-board handling practices.
Improve ice production capacity and quality of ice. Improve storage facilities.
Improve the landing capacity of the harbour. Increase the depth of waters surrounding landing area of the harbour.
Build capacity in proper on-board handling.
The Government must also improve the depth of water at the port so that landing activities can take place at all times. Roofing the sorting area to reduce exposure of fish to high ambient conditions and to improve working conditions is another intervention. Many fishers try to unload their fish early in the morning, but due to the large number of fishers, unloading at the same time and the capacity of fishing port, quick unloading is difficult to achieve. Consequently, roofing the area would allow to extend working times. It is necessary to provide capacity building and technical assistance for good handling to all stakeholders and to strengthen the cold chain and the implementation of GMP and GHP. This will help to reduce fish loss along the supply chain. 6. REFERENCES Brondong District. 2015. Marine and Fishery. (available at http://lamongankab.go.id/
instansi/brondong/potensi/perikanan-dan-kelautan) Brondong National Fishing Port. 2014. Annual Report 2014. Brondong. Diei-Ouadi, Y. & Mgawe, Y.I. 2011. Post-harvest fish loss assessment in small-scale fisheries. A guide
for the extension officer. FAO Fisheries and Aquaculture Technical Paper 559. Rome. Esaiassen, M., Nilsen, H., Joensen, S., Skjerdal, T., Carlehog, M., Eilertsen, G., Gundersen, B. &
Elvevoll, E. 2004. Effects of catching methods on quality changes during storage of cod (Gadus morhua). Lebensm.-Wiss. u.-Technol. (37): 643–648.
FAO. 2014. Save Food Global Initiative on Food Loss and Waste Reduction. Food Loss Assessment: Causes and Solutions Case studies in the Small-scale Agriculture Subsectors: Methodology.
Utomo, B.S.B., Wibowo, S., Syamdidi, Agusman, Badarudin & Peranginangin, R. 2013. Evaluasi Susut Hasil Pasca Panen pada Industri Perikanan. Laporan Teknis Penelitian dan Pengembangan. Balai Besar Penelitian dan Pengembangan Pengolahan Produk dan Bioteknologi Kelautan dan Perikanan. Jakarta.
Utomo, B.S.B., Wibowo, S., Syamdidi & Badarudin. 2014. Losses evaluation of fish processing. Paper presented in the International Seminar on Marine and Fisheries Product Processing and Biotechnology, Jakarta, 26 September 2014.
Ward, A.R. & Jeffries, D.J. 2000. A manual for assessing post-harvest fisheries losses. Natural Resources Institute, Chatam, United Kingdom.
Wibowo, S, Utomo, B.S.B., Syamdidi & Kusumawati, R. 2014a. Evaluating and Monitoring Of National Post-Harvest Fish Loss in Indonesia. Paper presented at the International Seminar on Fish Processing, Pekanbaru, 9 September 2014.
Wibowo, S, Utomo, B.S.B., Syamdidi & Kusumawati, R. 2014b. Evaluasi susut hasil pasca panen perikanan. Policy Brief. Research and Development Center for Marine and Fisheries Product Processing and Biotechnology. Jakarta.

95
ANNEX 1
COMMUNITY PARTICIPATORY SURVEY FORM
POST‐HARVEST CHAIN PERFORMANCE ASSESSMENT WITH MAPPING OUT OF GENDER AND VULNERABILITY ASPECTS
Lead loss assessor (full name) Date of Assessment
Phone number
Administrative level Site name
On Board Storage facility Wholesale market OtherType of
Facility:
(Tick all that apply)
1. SITE ASSESSMENT:
Landing site Processing site Retail market
Contact Person at the site:
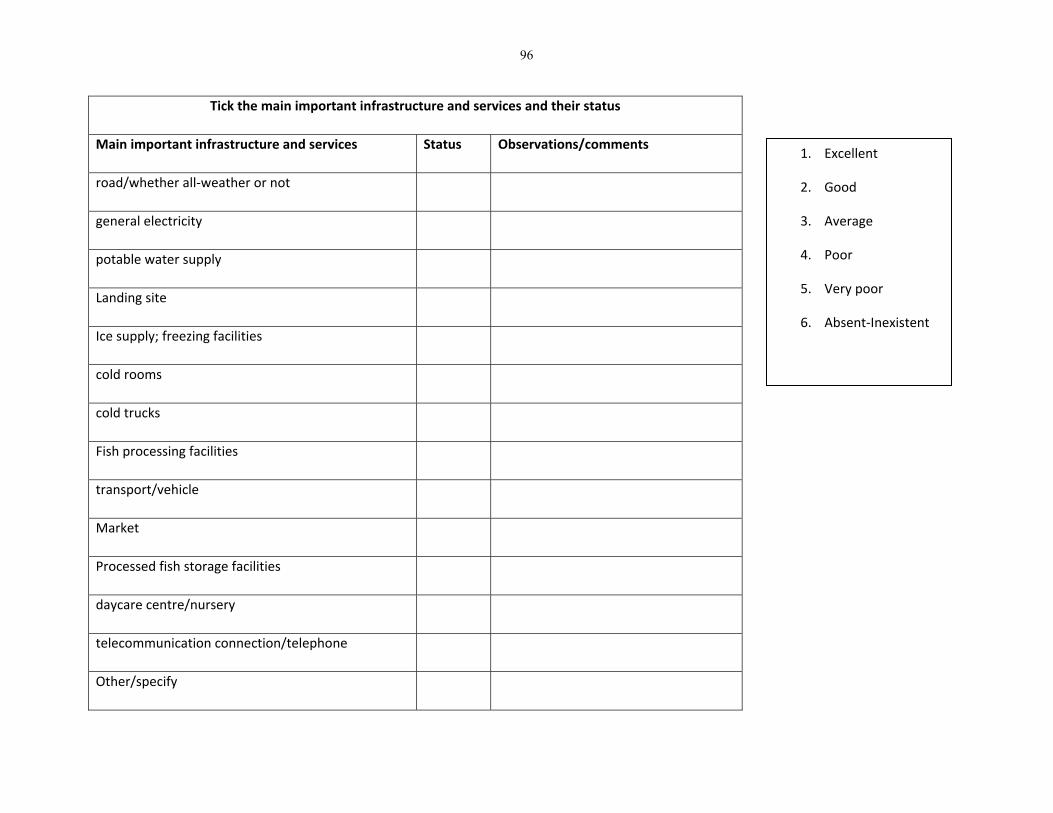
96
Tick the main important infrastructure and services and their status
Main important infrastructure and services Status Observations/comments
road/whether all‐weather or not
general electricity
potable water supply
Landing site
Ice supply; freezing facilities
cold rooms
cold trucks
Fish processing facilities
transport/vehicle
Market
Processed fish storage facilities
daycare centre/nursery
telecommunication connection/telephone
Other/specify
1. Excellent
2. Good
3. Average
4. Poor
5. Very poor
6. Absent‐Inexistent

97
2. GROUP MEETING
A. Set aside a notebook and pen for eventual calculation of units (ex: high and low volume per week or month then equivalent in year, number/%) B.Introduce the Project and the purpose of your visit. C. Make people feel at ease, invite them to be active in the discussion, carry out self‐introduction and fill in an attendance form. D. Take a group photo. E. Some questions (ex: foreigner, age) if sensitive at a site should better be asked through KI, such as chief and local worker F. Ask all the questions preferably in the exact order and validate each answer with the group prior to recording on the form 1. What are the 5 main activities carried out in this site
1. Distribution of the main activities carried out in the site
Activity Total People engaged
Tilapia fishers (%)
Women (%)
Fishers age range (%) Ethnicity Annual volumes (tonness)
Activity ranking in order of loss importance
Priority (in descending order)
15‐24 25 ‐ 49 > 50
Fishing
Smoking
Drying
Fermentation
Frying
Other/specify
Sale/fresh fish mongering
Sale of smoked fish
Sale of dried fish
Sale of fermented fish
Sale of fried fish
Other sale/specify

98
2. Of the 3 top activities prioritized, what are the products information regarding
Actor/Activity Losses in average When losses occur most? Reasons for losses
3. Are there within the actors of these prioritized activities, some who are not losing or who lose least? Y/N.
IF Y/Yes,
Why/ How do they do to avoid losses?
How many/Who are they?
Factors hindering replication by the other
operators to reduce losses reduce

99
4. What are the fishers’ main markets/by order of importance (local, national, regional, international)?
Main markets/destination(s)
of the products of this site
What determine the choice for that?
(Choose one or more among:
1/Price offered
2/Consumer preference for the type of product
3/ Volume of product in demand‐ Ease of supply
4/ Frequency of the market fairs
5/ Easily accessible
6/Existing commercial linkages‐partners
7/Familiar to the target country market;
8/I have no other choice
9/other/specify)
Constraints faced in accessing this market
(Tick/Choose one or more among:
1/Problem of/delay in transportation
2/Various harassments
3/ Difficult; direct sale/too many middlemen
4/Public security situation
5/Customer not rewarding the quality
6/ Other‐specify
1. ……..
2. ……..
3. ….
4. ….

100
5. Livelihoods and management within the value chain actors:
What are the other most significant livelihoods activities the site value chains actors are engaged in?
Livelihoods activities Main season when
mostly undertaken
Value chain actor(s) engaged
Number Proportion of
men & women
Which
operator(s)
mostly involved?
Age group Relative
proportion of
incomes from
different
activities
agro‐processing
forestry
Petty trade
Gardening
Livestock
Art‐craft
Other/specify
Are‐you organized in fisheries‐based group/association? Y/N
If Yes, List the main 5 groups, years of experience, membership and responsibilities in the Top 5 positions of their board

101
Group
type/name
Length of
experience/ Year
of creation
Membership
in total
% women
in total
Gender distribution of
the Top 5 positions of
the board
What does the organization do in relation to
the needs of the members and how
effectively is this performed?
Ownership of fish preservation and processing equipments:
Whether existing cold chain, processing (drying, smoking, fermentation, etc.), storage, and distribution/retailing equipments are individual
or community assets/ Distribution by gender for individual ownership and reasons, if any gender difference in quantity, quality/technical
performance, size
Equipments Community ownership
Number and
average
capacity
How does the asset come to be owned? (whether
Government support, Direct purchase, Credit
purchase, and other sources/to be specified)
Composition of the
management
committee
How frequently does the
asset need to be replaced?

102
Equipments Individual ownership
Number and
average
capacity
% women
owners
How does the asset come to be owned?
(whether Government support, Direct purchase,
Credit purchase, and other sources/to be
specified)
How frequently does the asset
need to be replaced?
6. Loss reduction/ prevention
What do you think can be done to effectively
reduce/prevent losses?
What constraints exist to implement the loss
reduction measures?
How can these constraints be
overcome/lifted?

103
Before closing the meeting,
G. Identify and select individual K.I and/or same age group of at least3‐ 5 informants among the ones incurring the most losses and those not incurring the losses, for each of the 3 products above and ask to meet them separately after the meeting. The sample size should be representative enough of products operators number for the site; otherwise a questionnaire survey/QLAM is necessary.
H. Thank everyone, mention that no delivery/action will be taken soon to raising expectations and close the meeting.
Any comment / useful information related to losses (250 words maximum)
‐‐‐‐‐‐‐‐‐‐‐‐‐‐‐‐‐‐‐‐‐‐‐‐‐‐‐‐‐‐‐‐‐‐‐‐‐‐‐‐‐‐‐‐‐‐‐‐‐‐‐‐‐‐‐‐‐‐‐‐‐‐‐‐‐‐‐‐‐‐‐‐‐‐‐‐‐‐‐‐‐‐‐‐‐‐‐‐‐‐‐‐‐‐‐‐‐‐‐‐‐‐‐‐‐‐‐‐‐‐‐‐‐‐‐‐‐‐‐‐‐‐‐‐‐‐‐‐‐‐‐‐‐‐‐‐‐‐‐‐‐‐‐‐‐‐‐‐‐‐‐‐‐‐‐‐‐‐‐‐‐‐‐‐‐‐‐‐‐‐‐‐‐‐‐‐‐‐‐‐‐‐‐‐
‐‐‐‐‐‐‐‐‐‐‐‐‐‐‐‐‐‐‐‐‐‐‐‐‐‐‐‐‐‐‐‐‐‐‐‐‐‐‐‐‐‐‐‐‐‐‐‐‐‐‐‐‐‐‐‐‐‐‐‐‐‐‐‐‐‐‐‐‐‐‐‐‐‐‐‐‐‐‐‐‐‐‐‐‐‐‐‐‐‐‐‐‐‐‐‐‐‐‐‐‐‐‐‐‐‐‐‐‐‐‐‐‐‐‐‐‐‐‐‐‐‐‐‐‐‐‐‐‐‐‐‐‐‐‐‐‐‐‐‐‐‐‐‐‐‐‐‐‐‐‐‐‐‐‐‐‐‐‐‐‐‐‐‐‐‐‐‐‐‐‐‐‐‐‐‐‐‐‐‐‐‐‐‐
‐‐‐‐‐‐‐‐‐‐‐‐‐‐‐‐‐‐‐‐‐‐‐‐‐‐‐‐‐‐‐‐‐‐‐‐‐‐‐‐‐‐‐‐‐‐‐‐‐‐‐‐‐‐‐‐‐‐‐‐‐‐‐‐‐‐‐‐‐‐‐‐‐‐‐‐‐‐‐‐‐‐‐‐‐‐‐‐‐‐‐‐‐‐‐‐‐‐‐‐‐‐‐‐‐‐‐‐‐‐‐‐‐‐‐‐‐‐‐‐‐‐‐‐‐‐‐‐‐‐‐‐‐‐‐‐‐‐‐‐‐‐‐‐‐‐‐‐‐‐‐‐‐‐‐‐‐‐‐‐‐‐‐‐‐‐‐‐‐‐‐‐‐‐‐‐‐‐‐‐‐‐‐‐
‐‐‐‐‐‐‐‐‐‐‐‐‐‐‐‐‐‐‐‐‐‐‐‐‐‐‐‐‐‐‐‐‐‐‐‐‐‐‐‐‐‐‐‐‐‐‐‐‐‐‐‐‐‐‐‐‐‐‐‐‐‐‐‐‐‐‐‐‐‐‐‐‐‐‐‐‐‐‐‐‐‐‐‐‐‐‐‐‐‐‐‐‐‐‐‐‐‐‐‐‐‐‐‐‐‐‐‐‐‐‐‐‐‐‐‐‐‐‐‐‐‐‐‐‐‐‐‐‐‐‐‐‐‐‐‐‐‐‐‐‐‐‐‐‐‐‐‐‐‐‐‐‐‐‐‐‐‐‐‐‐‐‐‐


105
INTERVIEWS FOR INDIVIDUAL OR GROUP(s) OF 3‐5 ACTORS OF THE SAME VALUE CHAIN
SELECTED VALUE CHAIN ACTORS’ PARTICIPATORY SURVEY FORM
POST‐HARVEST SYSTEM ASSESMENT WITH MAPPING OUT OF GENDER AND VULNERABILITY ASPECTS
Site name:
Date of interview: ____/___/_____
Loss assessor(s) details:
Respondents’ number: Sex:
Average age:
Level of education: Choice: literate/not literate:
Years of experience: 0‐5; 5‐10; 11‐15; 16‐20; 21‐25; +25
Belonging to a fisher‐based organization or not? If yes, name of the organization:
ANNEX 2

106
1. Please help draw a flow diagramme to describe your daily occupation (FISHERIES AND OTHER ACTIVITIES INCLUDED)
Activity/Stage in
the chain
When
(inception
time of the
task)
Where
(location)
Quantity of
fish (any
measurement
unit to be
translated in
Kg)
Quantity of
inputs (kg or
L)
Type of
equipment(s)/.
material used
Number of
equipment
Whether
individually
owned or
community
equipment or
rented
LABOUR AND MARKET INFORMATION

107
2. Has any change occurred during the past 5 years in your fish operation or trading activity? If yes, list the top 3‐5 of what did change and why?
What changed (Tick/Choose one or more in the listed responses below (and if needed add more options)
Reasons for changes (Choose one or more among the following or add more options if needed): 1/Adverse climatic conditions, 2/Changes in fish species or quantity; 3/Price changes; 4/Consumer changes in products type; 5/The overall economy / trade situation, 6/ Weakening of my capacity/means, 7/other‐to be specified)
Fishing area/supply location
In the : choice of fish species
In the way you handle/process the fish
In the way fish is transported
In the target market
Other/Specify

108
3. Market access
Type of
market
Outlets How do you
get there
(Choose one
or more
among:
1/By
walk/specify
the walking
distance or
time
2/air
3/ Car‐road
transport
4/ motorcycle;
bicycle
5/canoe
6/Traders or
fishmongers
come to me
7/ other‐
specify
How often do
you go there
(Choose one or
more among:
1/ Daily;
2/ Every 2 days;
3/ Twice a week
4/ Once a week
5/ Once every
10‐15 days
6/ Once every
month
7/ Other‐ to be
specified
Who/what determines
your choice for this
market (Choose one or
more among:
1/Price offered
2/Consumer
preference for the type
of product
3/ Volume of product
in demand‐ Ease of
supply
4/ Frequency of the
market fairs
5/ Easily accessible
6/Existing commercial
linkages‐partners
7/Familiar to the target
country market;
8/I have no other
choice
9/other/specify)
Average
volume of
products per
trip/supply
period ( any
measureme
nt unit to be
translated in
Kg)
Average
sale price
Method of
payment
(Choose
between one
or more
among:
1/Advance
payment;
2/Cash at
delivery or
sale point
3/Credit;
4/ Bartering
against other
food
commodity
5/Other‐
Specify
If more than 2
method of
payment,
please provide
importance/re
lative shares
5 major
constraints to
access market
or specific
outlet
(Tick/Choose
one or more
among:
1/Problem of
transportation
2/Various
harassments
3/ Difficult;
direct sale/too
many
middlemen
4/Public
security
situation
5/Customer
not rewarding
the quality
Other‐specify

109
National Local/fair or
market (List
the
cities/areas)
Hotel/restaura
nt/chop bars
Supermarket
Hospital/
School feeding
prison/Army
camp
Other
(specify)
Regional Countries (List
the countries):

110
International
During Bumper season (indicate the
months)
During Lean season (Indicate the months)
Volume of fish landed/purchased
(Kg)
Volume of processed fish
(Kg)
Supply source (with who):
fisherman/middleman/cold store/import
If multiple origins, indicate relative shares (%)
Average number of days you operate in a month
Average selling/buying price
FISH LOSS DATA:

111
5 critical loss points (descending order of
importance). Choices to be made from the List of
common stages or add if needed (1/Before hauling
back, 2/During hauling back from water; 3/Onboard;
4/Transportation to the landing site; 5/ Landing, 6/First
sale/purchase; 7/Transportation to the processing site;
8/Transportation to market, 9/ Sale; 10/Pre‐
treatment/cleaning; draining;
11/smoking/drying/salting/fermentation/frying/other;
12/Cooling of processed (smoked, dried, fried) fish ;
13/Sorting for packaging; 12/Packaging; 13/Storage;
14/Other‐specify
% quality loss (Or fraction of fish units or of
measurement unit)
Average Reduced price of quality loss
Frequency of quality loss (days/month)
5 major Causes (descending order) Choices to be
made from the List of common causes provided
% physical loss (Or fraction of fish units or of
measurement unit)

112
Frequency of physical loss (days/month)
5 major Causes (descending order) Choices to be
made from the List of common causes provided
% market force loss
(Or fraction of fish units or of measurement unit)
Average Reduced price of market force loss
Frequency of market force loss (days/month).
5 major Causes (descending order of importance)
Choices to be made from the List of common
causes provided
1. What are the main measures you take to reduce/prevent or try to reduce your losses?
Possible actions YES NO
Try to recoup /Attempt to compensate on the subsequent supply
Try to apply different method/technique
COPING STRATEGIES & VARIOUS OPPORTUNITIES:
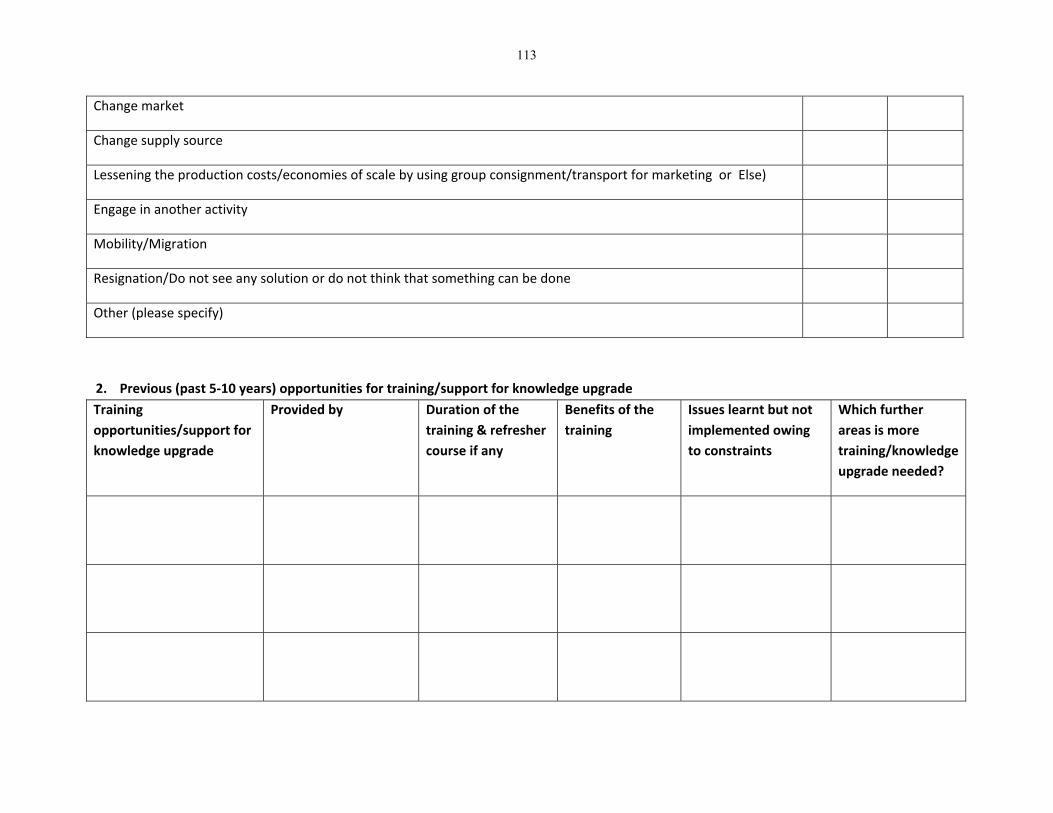
113
Change market
Change supply source
Lessening the production costs/economies of scale by using group consignment/transport for marketing or Else)
Engage in another activity
Mobility/Migration
Resignation/Do not see any solution or do not think that something can be done
Other (please specify)
2. Previous (past 5‐10 years) opportunities for training/support for knowledge upgrade
Training
opportunities/support for
knowledge upgrade
Provided by Duration of the
training & refresher
course if any
Benefits of the
training
Issues learnt but not
implemented owing
to constraints
Which further
areas is more
training/knowledge
upgrade needed?

114
3. Previous (past 5‐10 years) opportunities for access to credit or any material support to your activity
Credit access
opportunities or any
material support
How many
times it was
provided
Main sources of
credit
Cost & Purpose of
credit
Terms of credit Cost of credit as a
proportion of total
income
RESPONDENT(S) DETAILS
Name(s)
Phone contacts
Location/site name
Administrative level (1 = Region; 2= Province/district; 3 = Department; 4 = Village, 5= Other/Specify)


I6282En/1/�����
ISBN 978-92-5-109462-4
9 7 8 9 2 5 1 0 9 4 6 2 4
ISSN 2070-6065


![[PPT]PROTOZOA - a creation by a jundullah | Ilmu yang ... · Web viewPROTOZOA Marlia Singgih Wibowo Pendahuluan “Protozoa” berarti “first animal”, suatu bentuk sederhana kehidupan](https://static.fdocuments.in/doc/165x107/5bbf725109d3f22e7d8c222f/pptprotozoa-a-creation-by-a-jundullah-ilmu-yang-web-viewprotozoa-marlia.jpg)