case studies on energy subsidy reform: lessons and implications
117
CASE STUDIES ON ENERGY SUBSIDY REFORM: LESSONS AND IMPLICATIONS Prepared By A staff team led by Benedict Clements and comprising David Coady, Stefania Fabrizio, Allan Dizioli, Katja Funke, Javier Kapsoli, Kangni Kpodar, Alvar Kangur, Masahiro Nozaki, Baoping Shang, Mauricio Soto, Vimal Thakoor, Louis Sears, and Lilla Nemeth (all FAD); Trevor Alleyne, Mauricio Villafuerte, Anton Op de Beke, Genevieve Verdier, Clara Mira, Farayi Gwenhamo, Antonio David, and Mumtaz Hussain (all AFR); Andreas Bauer, Carlo Sdralevich, Ozgur Demirkol, Kamal Krishna, Luc Moers, Dragana Ostojic, and Younes Zouhar (all MCD). General guidance was provided by Sanjeev Gupta (FAD), Roger Nord (AFR), and Daniela Gressani (MCD). Production assistance was provided by Jeffrey Pichocki, Mileva Radisavljević, and Pierre Jean Albert (FAD). INTRODUCTION _________________________________________________________________________ 4 PETROLEUM PRODUCT SUBSIDIES _____________________________________________________ 6 A. Brazil ___________________________________________________________________________________ 6 B. Chile __________________________________________________________________________________ 11 C. Ghana _________________________________________________________________________________ 16 D. Indonesia _____________________________________________________________________________ 21 E. Islamic Republic of Iran _______________________________________________________________ 26 F. Mauritania_____________________________________________________________________________ 30 G. Namibia ______________________________________________________________________________ 35 H. Niger _________________________________________________________________________________ 40 I. Nigeria _________________________________________________________________________________ 47 J. Peru ___________________________________________________________________________________ 54 K. Philippines ____________________________________________________________________________ 59 L. South Africa ___________________________________________________________________________ 63 CONTENTS January 28, 2013
Transcript of case studies on energy subsidy reform: lessons and implications
CASE STUDIES ON ENERGY SUBSIDY REFORM:
LESSONS AND IMPLICATIONS
Prepared By
A staff team led by Benedict Clements and comprising
David Coady, Stefania Fabrizio, Allan Dizioli, Katja Funke,
Javier Kapsoli, Kangni Kpodar, Alvar Kangur,
Masahiro Nozaki, Baoping Shang, Mauricio Soto,
Vimal Thakoor, Louis Sears, and Lilla Nemeth (all FAD);
Trevor Alleyne, Mauricio Villafuerte, Anton Op de Beke,
Genevieve Verdier, Clara Mira, Farayi Gwenhamo,
Antonio David, and Mumtaz Hussain (all AFR);
Andreas Bauer, Carlo Sdralevich, Ozgur Demirkol,
Kamal Krishna, Luc Moers, Dragana Ostojic, and
Younes Zouhar (all MCD). General guidance was provided
by Sanjeev Gupta (FAD), Roger Nord (AFR), and
Daniela Gressani (MCD). Production assistance was
provided by Jeffrey Pichocki, Mileva Radisavljević, and
Pierre Jean Albert (FAD).
INTRODUCTION _________________________________________________________________________ 4
PETROLEUM PRODUCT SUBSIDIES _____________________________________________________ 6
A. Brazil ___________________________________________________________________________________ 6
B. Chile __________________________________________________________________________________ 11
C. Ghana _________________________________________________________________________________ 16
D. Indonesia _____________________________________________________________________________ 21
E. Islamic Republic of Iran _______________________________________________________________ 26
F. Mauritania _____________________________________________________________________________ 30
G. Namibia ______________________________________________________________________________ 35
H. Niger _________________________________________________________________________________ 40
I. Nigeria _________________________________________________________________________________ 47
J. Peru ___________________________________________________________________________________ 54
K. Philippines ____________________________________________________________________________ 59
L. South Africa ___________________________________________________________________________ 63
CONTENTS
January 28, 2013
ENERGY SUBSIDY REFORM: CASE STUDIES
2 INTERNATIONAL MONETARY FUND
M. Turkey ________________________________________________________________________________ 66
N. Yemen ________________________________________________________________________________ 71
ELECTRICITY AND COAL SUBSIDIES ___________________________________________________76
A. Armenia _______________________________________________________________________________ 76
B. Brazil __________________________________________________________________________________ 83
C. Kenya _________________________________________________________________________________ 88
D. Mexico ________________________________________________________________________________ 94
E. Philippines, ____________________________________________________________________________ 99
F. Poland ______________________________________________________________________________ 102
G. Turkey ______________________________________________________________________________ 108
H. Uganda _____________________________________________________________________________ 112
BOX
1. Nigeria: Rationale for Subsidy Removal _______________________________________________ 50
FIGURES
1. Brazil: Macroeconomic Developments and Energy Subsidy Reforms, 1990–2012 ______ 8
2. Brazil: Fuel Price Developments 1995–2011 ____________________________________________ 9
3. Chile: Balance of Fuel Stabilization Funds, 1991–2012 _________________________________ 13
4. Ghana: Fuel Price Developments, 2000–2012__________________________________________ 18
5. Indonesia: Macroeconomic Developments and Energy Subsidy Reforms, 1997–2011 _ 23
6. Mauritania: Diesel Retail Price and Price Gap, 2011–12 ________________________________ 32
7. Namibia: National Energy Fund and Slate Account, 1990–2011 _______________________ 37
8. Namibia: Macroeconomic Developments and Fuel Subsidy Reform, 1990–2011 ______ 38
9. Niger: Fuel Price Developments, 2005–2011 __________________________________________ 43
10. Niger: Macroeconomic Developments and Energy Subsidy Reforms, 2008–2011 ____ 44
11. Nigeria: International and Domestic Fuel Prices, 2006–2011 _________________________ 48
12. Peru: International Prices and the Fiscal Cost of Fuel Subsidies ______________________ 56
13. Philippines: Macroeconomic Developments and Energy Subsidy Reforms,
1993–2011 ___________________________________________________________________________ 60
14. South Africa: Composition of Gasoline Pump Prices and Taxes, 2001–2012 __________ 64
15. Turkey: Macroeconomic Developments and Energy Subsidy Reforms, 1990–2011 ___ 68
16. Turkey: Gasoline and Diesel: Net Tax, 2000–2011 ____________________________________ 69
17. Yemen: Macroeconomic Developments and Energy Subsidy Reforms, 1999–2011 ___ 73
18. Yemen: Fuel Prices and International Full Pass-through Prices, 2005–2012 __________ 74
19. Armenia: Residential Electricity Tariffs, 1995–2011 ___________________________________ 77
20. Armenia: Electricity Sector Financial Deficit, 1994–2004 ______________________________ 78
21. Armenia: Electricity Bill Collection Rate, 1996–2003 __________________________________ 79
22. Armenia: Macroeconomic Developments and Electricity Subsidy Reforms,
1993–2011 ___________________________________________________________________________ 80
ENERGY SUBSIDY REFORM: CASE STUDIES
INTERNATIONAL MONETARY FUND 3
23. Brazil: Macroeconomic Developments and Electricity Subsidy Reforms ______________ 85
24. Kenya: Hidden Costs in the Power Sector, 2001–08 __________________________________ 91
25. Mexico: Macroeconomic Developments and Electricity Subsidy Reforms,
1998–2011 ___________________________________________________________________________ 96
26. Philippines Macroeconomic: Developments and Electricity Subsidy Reforms ______ 100
27. Poland: Coal Prices in Poland and Selected International Markets _________________ 104
28. Poland: Macroeconomic Developments and Coal Sector Reforms _________________ 105
29. Poland: Indicators for the Coal Sector Reform, 1990–2002 _________________________ 106
30. Turkey: Macroeconomic Developments and Energy Subsidy Reforms _____________ 110
TABLES
1. Summary of Country Energy Subsidy Reform Episodes ________________________________ 5
2. Brazil: Key Macroeconomic Indicators, Selected Years, 2000–2011 _____________________ 6
3. Chile: Key Macroeconomic Indicators _________________________________________________ 11
4. Ghana: Key Macroeconomic Indicators, 2000–2011 ___________________________________ 16
5. Indonesia: Key Macroeconomic Indicators, 2000–2011 ________________________________ 21
6. Iran: Key Macroeconomic Indicators 2005–2011 ______________________________________ 26
7. Mauritania: Key Macroeconomic Indicators ___________________________________________ 30
8. Namibia: Key Macroeconomic Indicators, 2000–2011 _________________________________ 35
9. Niger: Key Macroeconomic Indicators _________________________________________________ 40
10. Nigeria: Key Macroeconomic Indicators______________________________________________ 47
11. Nigeria: Developments in Fuel Prices and Fuel Subsidies, 2006–2012 ________________ 49
12. Peru: Key Macroeconomic Indicators, 2000–2011 ____________________________________ 54
13. Peru: Spending of the Oil Price Stabilization Fund by Type of Product, 2011_________ 57
14. Philippines: Key Macroeconomic Indicators, 2000–2011 _____________________________ 59
15. South Africa: Key Macroeconomic Indicators, 1993–2011 ____________________________ 63
16. Turkey: Key Macroeconomic Indicators, 2000–2011 __________________________________ 66
17. Yemen: Key Macroeconomic Indicators, 2000–2011 _________________________________ 71
18. Armenia: Key Macroeconomic Indicators, 2000–2011 ________________________________ 76
19. Armenia: Electricity Share in Total Household Spending _____________________________ 81
20. Brazil: Key Macroeconomic Indicators________________________________________________ 83
21. Kenya: Key Macroeconomic Indicators _______________________________________________ 88
22. Kenya: Key Power Sector and Macroeconomic Indicators ____________________________ 90
23. Mexico: Key Macroeconomic Indicators, 2000–2011 _________________________________ 94
24. Philippines: Key Macroeconomic Indicators __________________________________________ 99
25. Poland: Key Macroeconomic Indicators ____________________________________________ 102
26. Poland: Selected Indicators of Coal Mining Industry, 1990–2006 ___________________ 105
27. Turkey: Spending of the Oil Price Stabilization Fund by Type of Product, 2011 ____ 108
28. Uganda: Key Macroeconomic Indicators ___________________________________________ 112
29. Uganda: Explicit Fiscal Subsidies for the Power Sector and the Cost of
Thermal Generation _______________________________________________________________ 113
30. Uganda: Quasi-fiscal Deficit of the Power Sector __________________________________ 115
ENERGY SUBSIDY REFORM: CASE STUDIES
4 INTERNATIONAL MONETARY FUND
INTRODUCTION
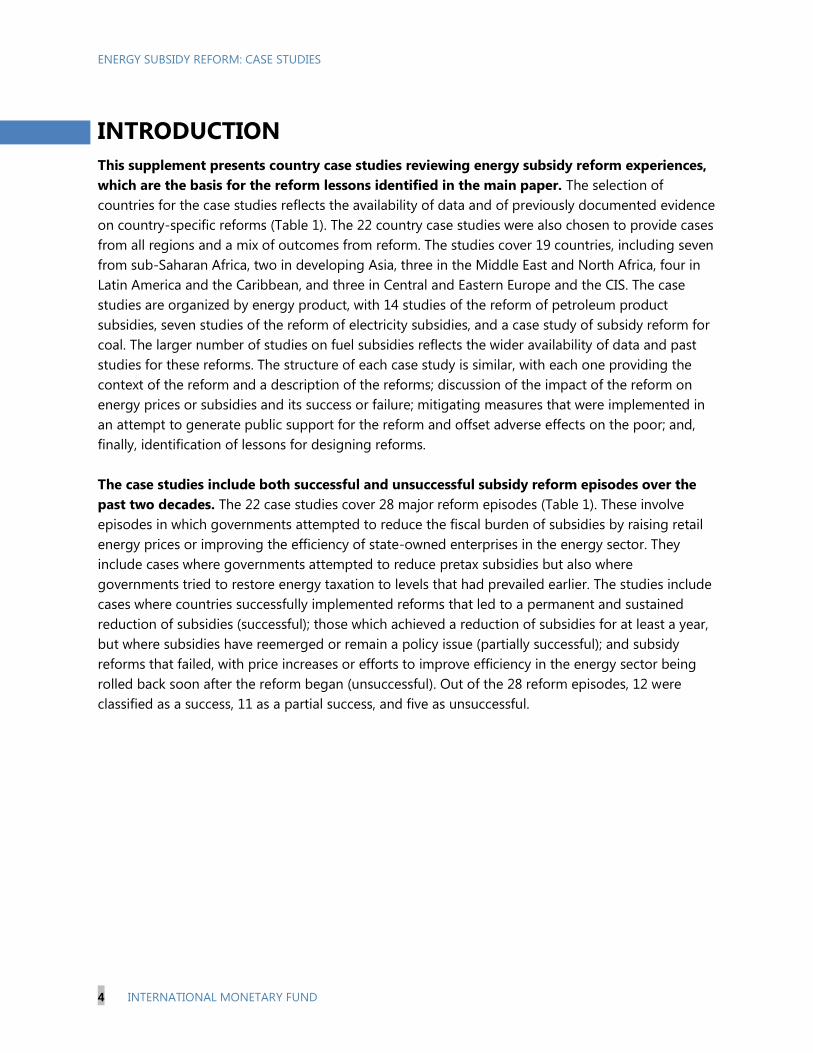
This supplement presents country case studies reviewing energy subsidy reform experiences,
which are the basis for the reform lessons identified in the main paper. The selection of
countries for the case studies reflects the availability of data and of previously documented evidence
on country-specific reforms (Table 1). The 22 country case studies were also chosen to provide cases
from all regions and a mix of outcomes from reform. The studies cover 19 countries, including seven
from sub-Saharan Africa, two in developing Asia, three in the Middle East and North Africa, four in
Latin America and the Caribbean, and three in Central and Eastern Europe and the CIS. The case
studies are organized by energy product, with 14 studies of the reform of petroleum product
subsidies, seven studies of the reform of electricity subsidies, and a case study of subsidy reform for
coal. The larger number of studies on fuel subsidies reflects the wider availability of data and past
studies for these reforms. The structure of each case study is similar, with each one providing the
context of the reform and a description of the reforms; discussion of the impact of the reform on
energy prices or subsidies and its success or failure; mitigating measures that were implemented in
an attempt to generate public support for the reform and offset adverse effects on the poor; and,
finally, identification of lessons for designing reforms.
The case studies include both successful and unsuccessful subsidy reform episodes over the
past two decades. The 22 case studies cover 28 major reform episodes (Table 1). These involve
episodes in which governments attempted to reduce the fiscal burden of subsidies by raising retail
energy prices or improving the efficiency of state-owned enterprises in the energy sector. They
include cases where governments attempted to reduce pretax subsidies but also where
governments tried to restore energy taxation to levels that had prevailed earlier. The studies include
cases where countries successfully implemented reforms that led to a permanent and sustained
reduction of subsidies (successful); those which achieved a reduction of subsidies for at least a year,
but where subsidies have reemerged or remain a policy issue (partially successful); and subsidy
reforms that failed, with price increases or efforts to improve efficiency in the energy sector being
rolled back soon after the reform began (unsuccessful). Out of the 28 reform episodes, 12 were
classified as a success, 11 as a partial success, and five as unsuccessful.
ENERGY SUBSIDY REFORM: CASE STUDIES
INTERNATIONAL MONETARY FUND 5
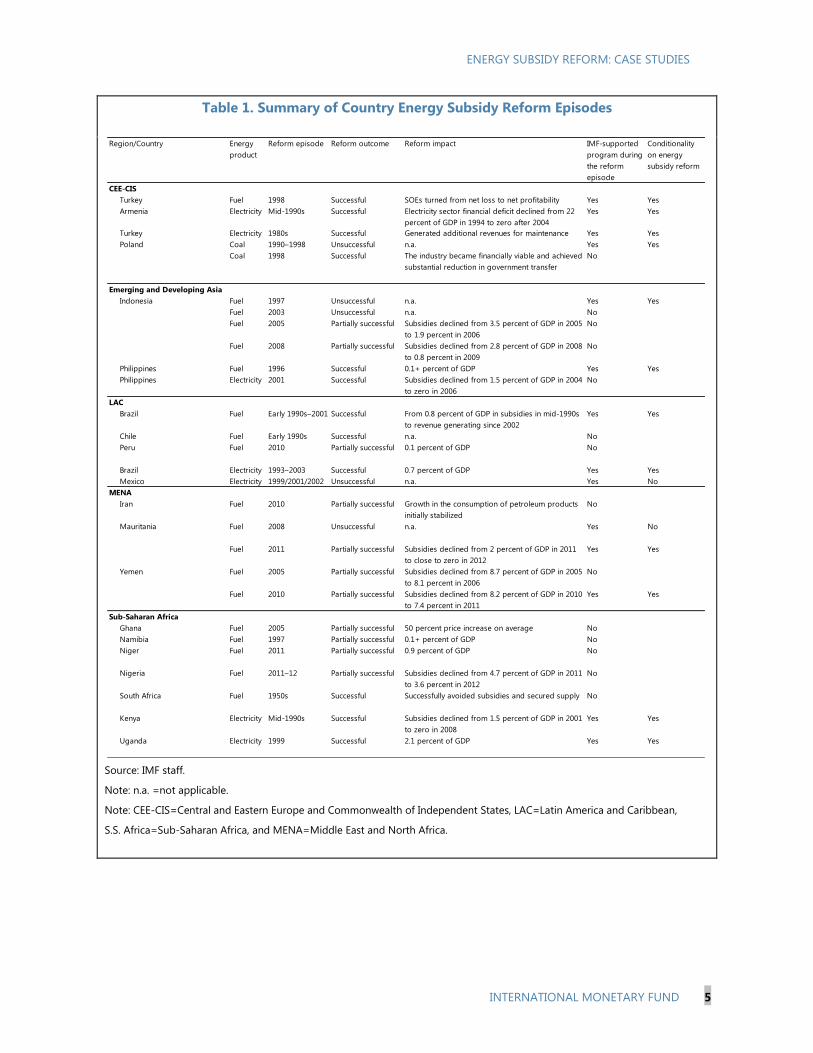
Table 1. Summary of Country Energy Subsidy Reform Episodes
Source: IMF staff.
Note: n.a. =not applicable.
Note: CEE-CIS=Central and Eastern Europe and Commonwealth of Independent States, LAC=Latin America and Caribbean,
S.S. Africa=Sub-Saharan Africa, and MENA=Middle East and North Africa.
Region/Country Energy
product
Reform episode Reform outcome Reform impact IMF-supported
program during
the reform
episode
Conditionality
on energy
subsidy reform
CEE-CIS
Turkey Fuel 1998 Successful SOEs turned from net loss to net profitability Yes Yes
Armenia Electricity Mid-1990s Successful Electricity sector financial deficit declined from 22
percent of GDP in 1994 to zero after 2004
Yes Yes
Turkey Electricity 1980s Successful Generated additional revenues for maintenance Yes Yes
Coal 1990–1998 Unsuccessful n.a. Yes Yes
Coal 1998 Successful The industry became financially viable and achieved
substantial reduction in government transfer
No
Emerging and Developing Asia
Fuel 1997 Unsuccessful n.a. Yes Yes
Fuel 2003 Unsuccessful n.a. No
Fuel 2005 Partially successful Subsidies declined from 3.5 percent of GDP in 2005
to 1.9 percent in 2006
No
Fuel 2008 Partially successful Subsidies declined from 2.8 percent of GDP in 2008
to 0.8 percent in 2009
No
Philippines Fuel 1996 Successful 0.1+ percent of GDP Yes Yes
Philippines Electricity 2001 Successful Subsidies declined from 1.5 percent of GDP in 2004
to zero in 2006
No
LAC
Brazil Fuel Early 1990s–2001 Successful From 0.8 percent of GDP in subsidies in mid-1990s
to revenue generating since 2002
Yes Yes
Chile Fuel Early 1990s Successful n.a. No
Peru Fuel 2010 Partially successful 0.1 percent of GDP No
Brazil Electricity 1993–2003 Successful 0.7 percent of GDP Yes Yes
Mexico Electricity 1999/2001/2002 Unsuccessful n.a. Yes No
MENA
Iran Fuel 2010 Partially successful Growth in the consumption of petroleum products
initially stabilized
No
Fuel 2008 Unsuccessful n.a. Yes No
Fuel 2011 Partially successful Subsidies declined from 2 percent of GDP in 2011
to close to zero in 2012
Yes Yes
Fuel 2005 Partially successful Subsidies declined from 8.7 percent of GDP in 2005
to 8.1 percent in 2006
No
Fuel 2010 Partially successful Subsidies declined from 8.2 percent of GDP in 2010
to 7.4 percent in 2011
Yes Yes
Sub-Saharan Africa
Ghana Fuel 2005 Partially successful 50 percent price increase on average No
Namibia Fuel 1997 Partially successful 0.1+ percent of GDP No
Niger Fuel 2011 Partially successful 0.9 percent of GDP No
Nigeria Fuel 2011–12 Partially successful Subsidies declined from 4.7 percent of GDP in 2011
to 3.6 percent in 2012
No
South Africa Fuel 1950s Successful Successfully avoided subsidies and secured supply No
Kenya Electricity Mid-1990s Successful Subsidies declined from 1.5 percent of GDP in 2001
to zero in 2008
Yes Yes
Uganda Electricity 1999 Successful 2.1 percent of GDP Yes Yes
Poland
Indonesia
Mauritania
Yemen
ENERGY SUBSIDY REFORM: CASE STUDIES
6 INTERNATIONAL MONETARY FUND
PETROLEUM PRODUCT SUBSIDIES
A. Brazil1
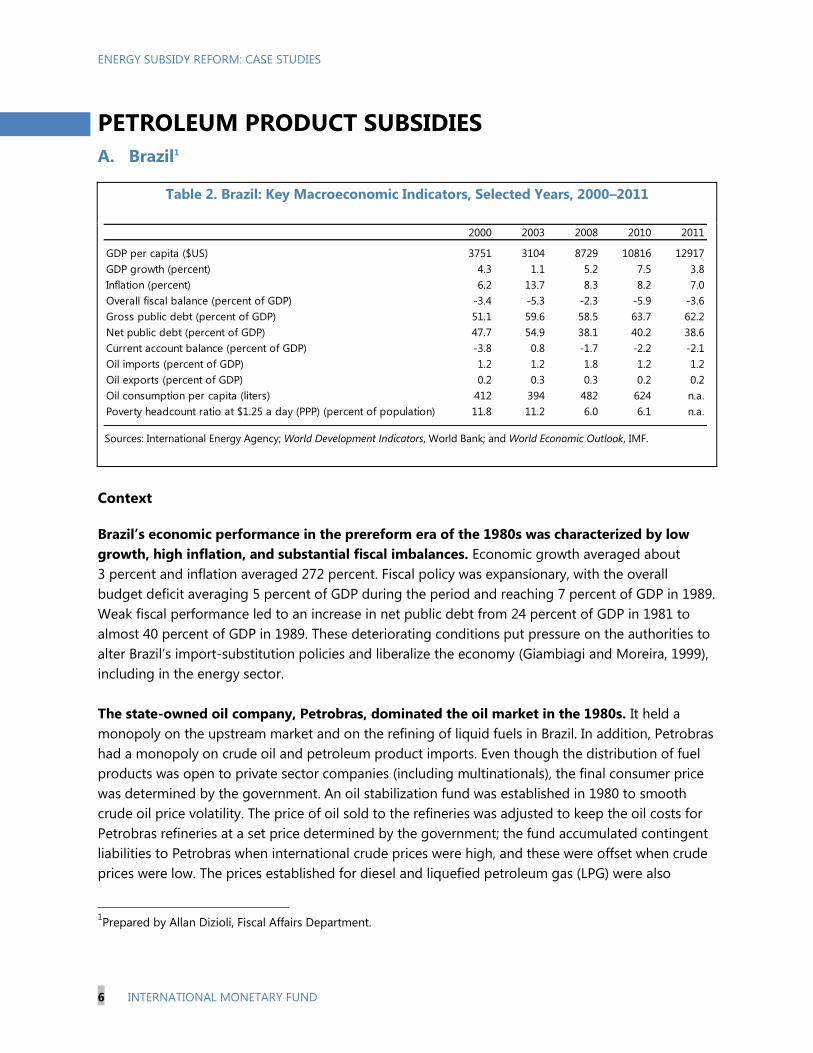
Table 2. Brazil: Key Macroeconomic Indicators, Selected Years, 2000–2011
Sources: International Energy Agency; World Development Indicators, World Bank; and World Economic Outlook, IMF.
Context
Brazil’s economic performance in the prereform era of the 1980s was characterized by low
growth, high inflation, and substantial fiscal imbalances. Economic growth averaged about
3 percent and inflation averaged 272 percent. Fiscal policy was expansionary, with the overall
budget deficit averaging 5 percent of GDP during the period and reaching 7 percent of GDP in 1989.
Weak fiscal performance led to an increase in net public debt from 24 percent of GDP in 1981 to
almost 40 percent of GDP in 1989. These deteriorating conditions put pressure on the authorities to
alter Brazil‘s import-substitution policies and liberalize the economy (Giambiagi and Moreira, 1999),
including in the energy sector.
The state-owned oil company, Petrobras, dominated the oil market in the 1980s. It held a
monopoly on the upstream market and on the refining of liquid fuels in Brazil. In addition, Petrobras
had a monopoly on crude oil and petroleum product imports. Even though the distribution of fuel
products was open to private sector companies (including multinationals), the final consumer price
was determined by the government. An oil stabilization fund was established in 1980 to smooth
crude oil price volatility. The price of oil sold to the refineries was adjusted to keep the oil costs for
Petrobras refineries at a set price determined by the government; the fund accumulated contingent
liabilities to Petrobras when international crude prices were high, and these were offset when crude
prices were low. The prices established for diesel and liquefied petroleum gas (LPG) were also
1Prepared by Allan Dizioli, Fiscal Affairs Department.
2000 2003 2008 2010 2011
GDP per capita ($US) 3751 3104 8729 10816 12917
GDP growth (percent) 4.3 1.1 5.2 7.5 3.8
Inflation (percent) 6.2 13.7 8.3 8.2 7.0
Overall fiscal balance (percent of GDP) -3.4 -5.3 -2.3 -5.9 -3.6
Gross public debt (percent of GDP) 51.1 59.6 58.5 63.7 62.2
Net public debt (percent of GDP) 47.7 54.9 38.1 40.2 38.6
Current account balance (percent of GDP) -3.8 0.8 -1.7 -2.2 -2.1
Oil imports (percent of GDP) 1.2 1.2 1.8 1.2 1.2
Oil exports (percent of GDP) 0.2 0.3 0.3 0.2 0.2
Oil consumption per capita (liters) 412 394 482 624 n.a.
Poverty headcount ratio at $1.25 a day (PPP) (percent of population) 11.8 11.2 6.0 6.1 n.a.
ENERGY SUBSIDY REFORM: CASE STUDIES
INTERNATIONAL MONETARY FUND 7
consistently set below import-parity costs. Due to increasing oil import costs, the crude oil
stabilization fund and Petrobras ran up enormous deficits. To pay for these accumulated losses, the
government transferred R$5.8 billion (0.8 percent of 1995 GDP) to Petrobras in the mid-1990s and
Petrobras had to absorb other losses that were never transparently recorded on the budget.
Description of fuel pricing reforms—early 1990s to 2001
A gradual approach to the removal of subsidies was chosen by the government to deal with
opposition from interest groups. To build public support for the reforms, the government
promised consumers that privatization and liberalization would lower energy prices and improve
services. Even though low prices to consumers had led to the subsidies, the authorities hoped that
improvements in efficiency of the refinery would be sufficient to reduce these outlays without
increases in consumer prices.
There were several steps involved in liberalizing fuel prices. The process of liberalizing the
market began in the early 1990s with the liberalization of prices for petroleum products used
primarily by firms, such as asphalt and lubricants (see Figure 1). This was followed by a more
extensive liberalization that included gasoline prices for final consumers in 1996, LPG for final
consumers in 1998 and diesel in 2001. The first products to lose subsidies were generally those
consumed by politically weak stakeholders, while the politically more difficult subsidies (for liquid
fuels used for transport and industry) were removed later. The removal of subsidies for ethanol
producers and the suppliers of equipment and services to Petrobras was left to the end of the
liberalization program.
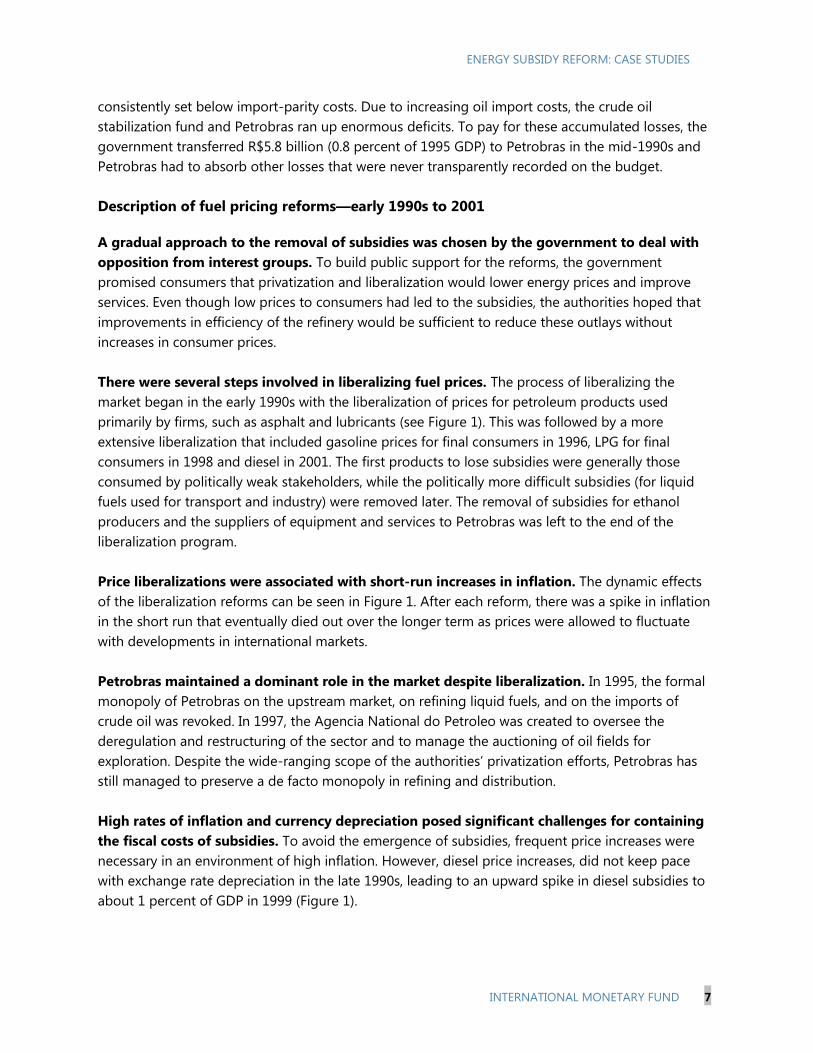
Price liberalizations were associated with short-run increases in inflation. The dynamic effects
of the liberalization reforms can be seen in Figure 1. After each reform, there was a spike in inflation
in the short run that eventually died out over the longer term as prices were allowed to fluctuate
with developments in international markets.
Petrobras maintained a dominant role in the market despite liberalization. In 1995, the formal
monopoly of Petrobras on the upstream market, on refining liquid fuels, and on the imports of
crude oil was revoked. In 1997, the Agencia National do Petroleo was created to oversee the
deregulation and restructuring of the sector and to manage the auctioning of oil fields for
exploration. Despite the wide-ranging scope of the authorities‘ privatization efforts, Petrobras has
still managed to preserve a de facto monopoly in refining and distribution.
High rates of inflation and currency depreciation posed significant challenges for containing
the fiscal costs of subsidies. To avoid the emergence of subsidies, frequent price increases were
necessary in an environment of high inflation. However, diesel price increases, did not keep pace
with exchange rate depreciation in the late 1990s, leading to an upward spike in diesel subsidies to
about 1 percent of GDP in 1999 (Figure 1).
ENERGY SUBSIDY REFORM: CASE STUDIES
8 INTERNATIONAL MONETARY FUND
Figure 1. Brazil: Macroeconomic Developments and Energy Subsidy Reforms, 1990–2012
(Percent of GDP or rate)
Sources: IMF staff and authorities.
Experience with fuel price setting since 2002
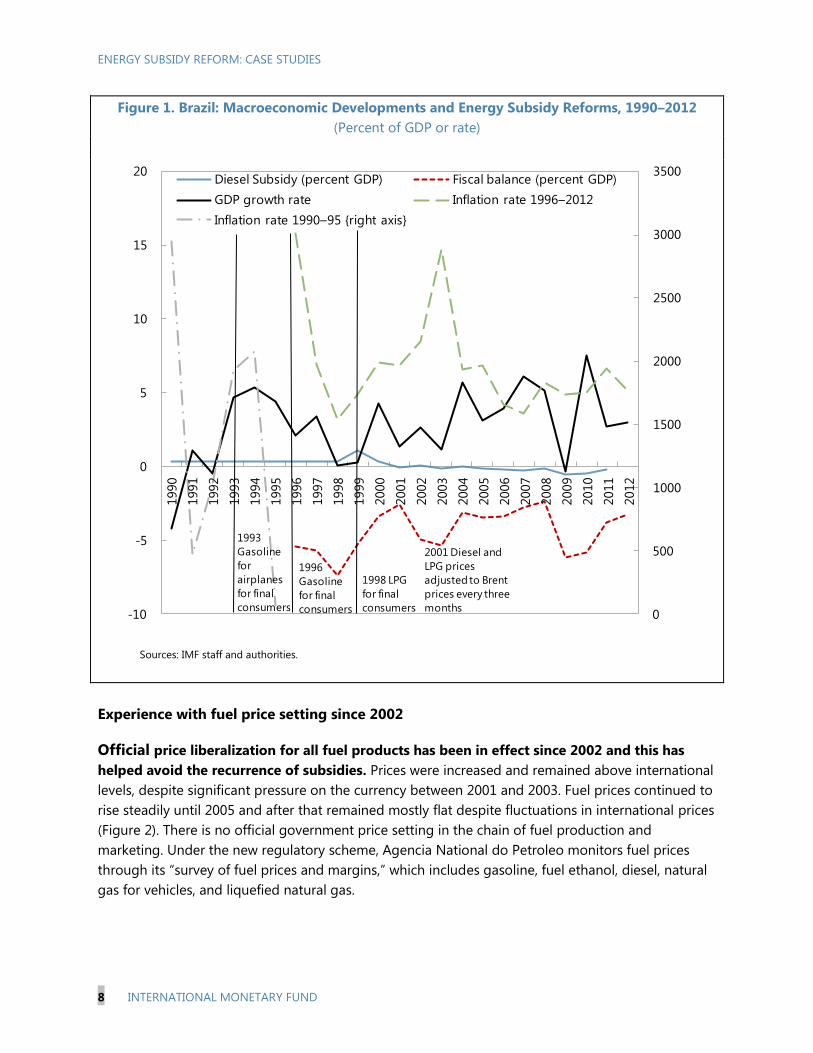
Official price liberalization for all fuel products has been in effect since 2002 and this has
helped avoid the recurrence of subsidies. Prices were increased and remained above international
levels, despite significant pressure on the currency between 2001 and 2003. Fuel prices continued to
rise steadily until 2005 and after that remained mostly flat despite fluctuations in international prices
(Figure 2). There is no official government price setting in the chain of fuel production and
marketing. Under the new regulatory scheme, Agencia National do Petroleo monitors fuel prices
through its ―survey of fuel prices and margins,‖ which includes gasoline, fuel ethanol, diesel, natural
gas for vehicles, and liquefied natural gas.
0
500
1000
1500
2000
2500
3000
3500
-10
-5
0
5
10
15
201990
1991
1992
1993
1994
1995
1996
1997
1998
1999
2000
2001
2002
2003
2004
2005
2006
2007
2008
2009
2010
2011
2012
Diesel Subsidy (percent GDP) Fiscal balance (percent GDP)
GDP growth rate Inflation rate 1996–2012
Inflation rate 1990–95 {right axis}
1993
Gasoline
for
airplanes
for final
consumers
1998 LPG
for final
consumers
1996
Gasoline
for final
consumers
2001 Diesel and
LPG prices
adjusted to Brent
prices every three
months
ENERGY SUBSIDY REFORM: CASE STUDIES
INTERNATIONAL MONETARY FUND 9
Figure 2. Brazil: Fuel Price Developments 1995–2011
Sources: Country authorities and IMF staff estimates.
Durability of the reforms
While officially oil prices are determined by Petrobras, in practice the government has used them as
a tool to control inflation. For instance, the government reduced taxes on gasoline and diesel in
2004 and removed the taxes on LPG and fuel oil so as to keep petroleum prices constant for final
consumers. As a result of the lower levy rate and narrower coverage, the aggregate total amount of
petroleum taxes has not increased in spite of growing consumption. The effect of this policy has
been that Petrobras makes operational losses on its downstream business which implies that the net
taxes 2 are lower.
Mitigating measures
Fuel subsidies. Subsidies for the supply of fuels to thermal power plants in Amazonia, a politically
sensitive region, were maintained for a period of 10 years until 2012.
2Net taxes are defined as taxes on petroleum products to final consumers minus possible transfers from the central
government to Petrobras to pay for the losses.
0
0.5
1
1.5
2
2.5
3
1995 1996 1997 1998 1999 2000 2001 2002 2003 2004 2005 2006 2007 2008 2009 2010 2011
Diesel: domestic prices over
international prices
Gasoline: domestic prices over
international prices
ENERGY SUBSIDY REFORM: CASE STUDIES
10 INTERNATIONAL MONETARY FUND
Import tax. In 2001, the government introduced a new tax on the importation and marketing of
petroleum products. The levy raised revenues that were then used to fund: i) subsidies for
ethanol producers and the transportation costs of hydrocarbons; ii) LPG used by low-income
families; iii) projects oriented to environmental protection; and iv) the construction of roads.
Gas voucher. After the withdrawal of LPG subsidies in 2001, the government introduced a new
LPG subsidy in 2002 to assist low-income families‘ purchase of LPG through a gas-voucher.
Eligibility was based on a means test.
Conditional cash transfers. A conditional cash transfers program, the ―Bolsa Escola,‖ was
implemented in 2001.
Both of these targeted programs (the gas voucher and Bolsa Escola) were consolidated under a
new national flagship conditional cash transfer program, the Bolsa Familia, in 2003.
Lessons
A gradual approach in implementing subsidies removal can help minimize the resistance of
opposition groups that benefit from subsidies. The phased removal of subsidies in Brazil was
carefully tailored to ensure that the process would be politically acceptable. The first products to
lose subsidies (asphalt, lubricants, and gasoline for airplanes) were products that generally benefited
politically weak stakeholders, and the politically more difficult subsidies (for liquid fuels used for
transport and by industry) were removed last.
Liberalization reforms have more chance to succeed with a popular government. After
controlling hyperinflation, which had been chronic for over a decade, President Cardoso‘s
administration was able to capitalize on this political support to undertake his liberalization agenda.
Discretionary policies to adjust oil prices and stabilization funds do not work under unstable
macroeconomic conditions and can have adverse consequences for the sector. The oil price
stabilization fund had run up an enormous deficit in the 1980s, and the government had to transfer
an equivalent of 0.8 percent of the 1995 GDP to Petrobras in the middle of the 1990s to pay for oil
fund losses. Moreover, underpricing contributed to low investment in exploration and refining
capacity.
Macroeconomic instability can contribute to the emergence of subsidies for products with
controlled prices. Diesel subsidies emerged in 1999 in the wake of large currency depreciation and
the failure to rapidly adjust fuel prices. The liberalization of prices soon afterwards allowed the
subsidy reform to remain durable, as prices automatically adjusted with fluctuations in the exchange
rate.
Targeted social programs can reduce opposition to subsidy reform and enhance its durability.
Brazil adopted a gas-voucher to compensate low-income households for the increase in LPG prices
ENERGY SUBSIDY REFORM: CASE STUDIES
INTERNATIONAL MONETARY FUND 11
after the liberalization in 2001, and subsequently it has adopted a conditional cash transfer program,
which supports the durability of the subsidy removal.
References
Giambiagi, F., and M. Moreira, 1999, A Economia Brasileira nos Anos 90, (Rio de Janeiro: Banco
Nacional de Desenvolvimento Econômico e Social).
Oliveira, A., and T. Laan, 2010, ―Lessons Learned from Brazil‘s Experience with Fossil-Fuel Subsidies
and their Reform,‖ Trade, Investment, and Climate Change Series (Geneva: International
Institute for Sustainable Development).
Sathler, M.W.L., and M.T. Tolmasquim, 2000, ―A formação de preços dos derivados de petróleo no
Brasil,‖ Revista Brasileira de Energia, Vol. 8, No. 1, pp. 1–15.
B. Chile3
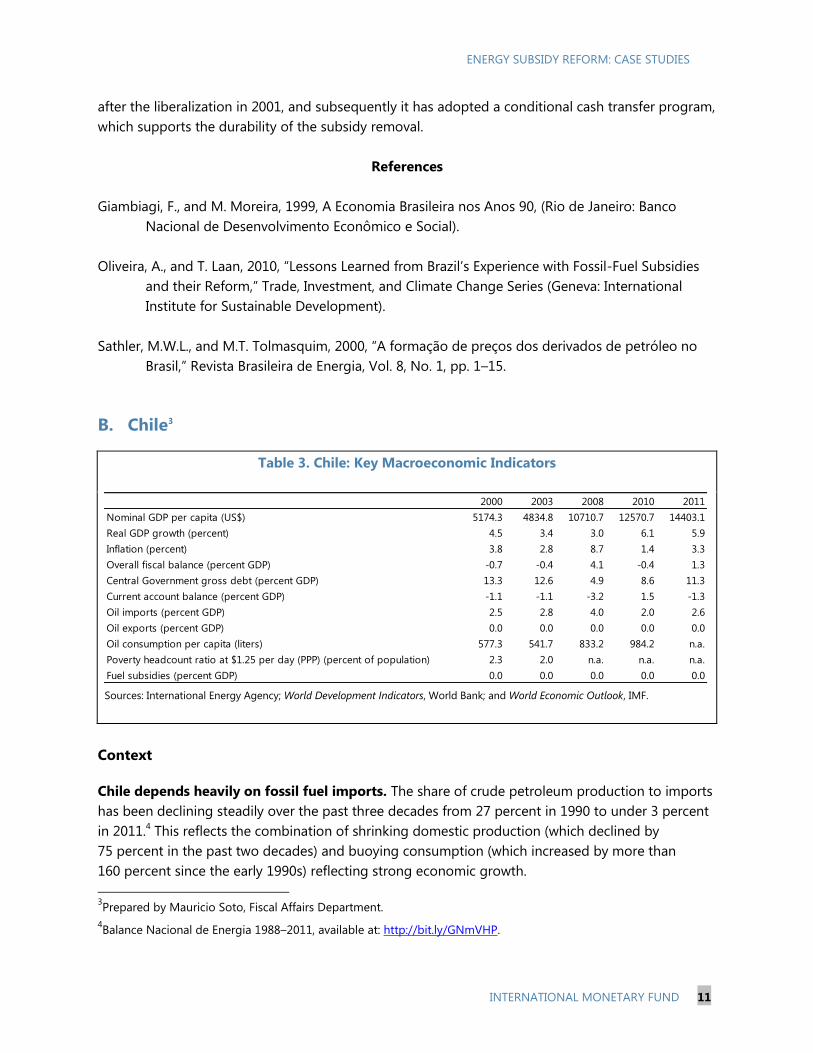
Table 3. Chile: Key Macroeconomic Indicators
Sources: International Energy Agency; World Development Indicators, World Bank; and World Economic Outlook, IMF.
Context
Chile depends heavily on fossil fuel imports. The share of crude petroleum production to imports
has been declining steadily over the past three decades from 27 percent in 1990 to under 3 percent
in 2011.4 This reflects the combination of shrinking domestic production (which declined by
75 percent in the past two decades) and buoying consumption (which increased by more than
160 percent since the early 1990s) reflecting strong economic growth.
3Prepared by Mauricio Soto, Fiscal Affairs Department.
4Balance Nacional de Energia 1988–2011, available at: http://bit.ly/GNmVHP.
2000 2003 2008 2010 2011
Nominal GDP per capita (US$) 5174.3 4834.8 10710.7 12570.7 14403.1
Real GDP growth (percent) 4.5 3.4 3.0 6.1 5.9
Inflation (percent) 3.8 2.8 8.7 1.4 3.3
Overall fiscal balance (percent GDP) -0.7 -0.4 4.1 -0.4 1.3
Central Government gross debt (percent GDP) 13.3 12.6 4.9 8.6 11.3
Current account balance (percent GDP) -1.1 -1.1 -3.2 1.5 -1.3
Oil imports (percent GDP) 2.5 2.8 4.0 2.0 2.6
Oil exports (percent GDP) 0.0 0.0 0.0 0.0 0.0
Oil consumption per capita (liters) 577.3 541.7 833.2 984.2 n.a.
Poverty headcount ratio at $1.25 per day (PPP) (percent of population) 2.3 2.0 n.a. n.a. n.a.
Fuel subsidies (percent GDP) 0.0 0.0 0.0 0.0 0.0
ENERGY SUBSIDY REFORM: CASE STUDIES
12 INTERNATIONAL MONETARY FUND
Oil markets in Chile have a long history of deregulation. From the 1920s until the 1970s, the
state played a dominant role in Chilean oil markets—from direct involvement in exploration and
production to the creation of the national oil company (ENAP). Government involvement kept prices
relatively low over this period through implicit subsidies (O‘Ryan and others, 2003). In the 1970s, as
part of the general push for economic liberalization in Chile, fuel markets (including LGP) were
deregulated. This included opening up markets for production, import, distribution, and sale of fuel
products. Nevertheless, the state-owned oil company (ENAP) maintains exclusive rights to explore
and refine and remains an important player in the oil market. In 2010, ENAP supplied about
70 percent of the Chilean demand for gasoline, diesel, and kerosene.5
Reforms
Recognizing the need to smooth the impact of international oil price shocks on domestic
consumers, Chile introduced a stabilization mechanism in the early 1990s. Following the spike
in oil prices associated with the Gulf War (1990–91), Chile established the Oil Prices Stabilization
Fund (FEPP) with an initial fund of US$200 million (0.5 percent of 1991 GDP). Under this mechanism,
the authorities set a reference price based on the expected evolution of CIF prices of crude oil in the
medium and long term. The fund operated when international prices deviated by more than
12.5 percent from the reference price, by fully subsidizing the difference between international
prices and the upper band and imposing a 60 percent tax on deviations below the lower band. The
reference price was updated on an ad hoc basis and the formula behind its calculation was not
made public. There was only one fund covering different product (gas, kerosene, diesel, and LPG),
which allowed for cross-product subsidization.
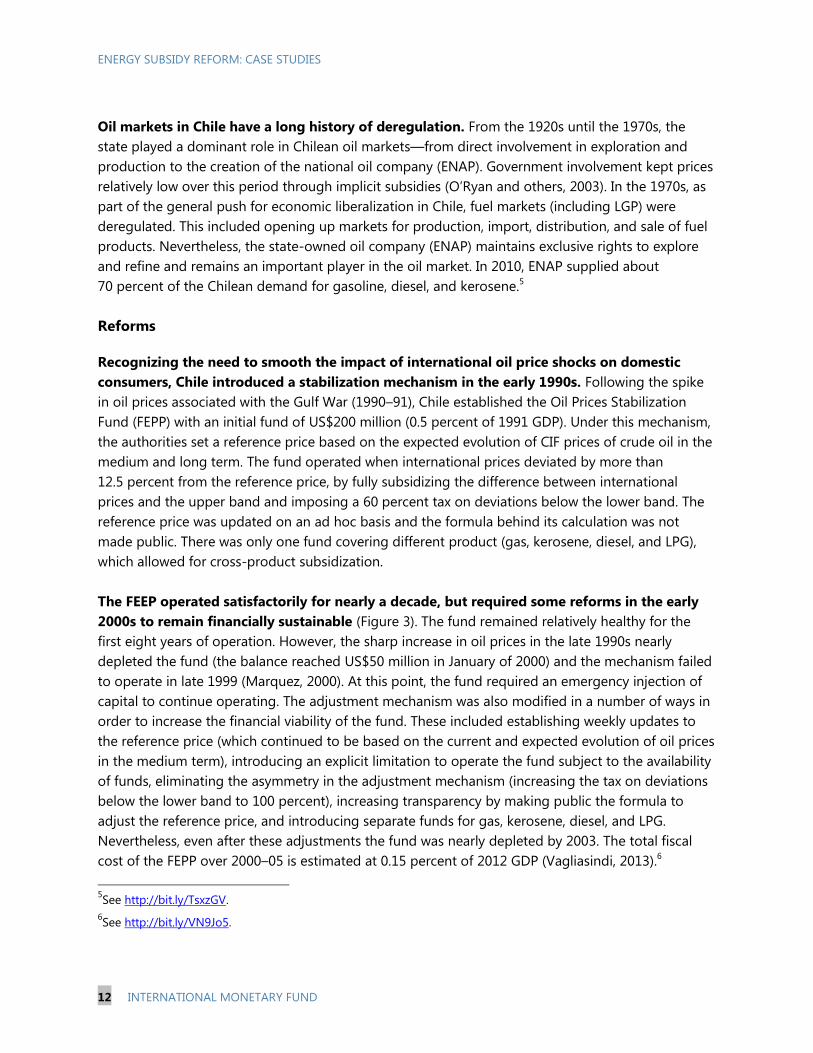
The FEEP operated satisfactorily for nearly a decade, but required some reforms in the early
2000s to remain financially sustainable (Figure 3). The fund remained relatively healthy for the
first eight years of operation. However, the sharp increase in oil prices in the late 1990s nearly
depleted the fund (the balance reached US$50 million in January of 2000) and the mechanism failed
to operate in late 1999 (Marquez, 2000). At this point, the fund required an emergency injection of
capital to continue operating. The adjustment mechanism was also modified in a number of ways in
order to increase the financial viability of the fund. These included establishing weekly updates to
the reference price (which continued to be based on the current and expected evolution of oil prices
in the medium term), introducing an explicit limitation to operate the fund subject to the availability
of funds, eliminating the asymmetry in the adjustment mechanism (increasing the tax on deviations
below the lower band to 100 percent), increasing transparency by making public the formula to
adjust the reference price, and introducing separate funds for gas, kerosene, diesel, and LPG.
Nevertheless, even after these adjustments the fund was nearly depleted by 2003. The total fiscal
cost of the FEPP over 2000–05 is estimated at 0.15 percent of 2012 GDP (Vagliasindi, 2013).6
5See http://bit.ly/TsxzGV.
6See http://bit.ly/VN9Jo5.
ENERGY SUBSIDY REFORM: CASE STUDIES
INTERNATIONAL MONETARY FUND 13
Figure 3. Chile: Balance of Fuel Stabilization Funds, 1991–2012
(Percent of GDP)
Source: General Treasury of the Republic of Chile (http://bit.ly/Wm0e1e).
A temporary stabilization fund was established in 2005 in response to supply disruptions.
Chile introduced the Fuel Prices Stabilization Fund (FEPC) as a temporary measure to respond to the
spike of prices resulting from the disruption of supply following hurricane Katrina. The mechanism
operated in a similar way to the FEPP but relied on a narrower band (5 percent) around a reference
price based on the recent and expected evolution of WTI prices in the medium term plus a refining
fee instead of the price of each derivate product (OECD, 2013). This mechanism was originally
intended to be used for about a year, but was extended until 2010. The total fiscal cost of the FEPC
over 2006–09 is estimated at 0.65 percent of 2012 GDP (Vagliasindi, 2013).
More recently, the stabilization fund was replaced by a tax adjustment mechanism. In 2011,
Chile introduced the Consumer‘s Protection System for Fuel Excise Taxes (SIPCO). Instead of a fund,
this adjustment mechanism relies on excise taxes to smooth transmission of changes of international
prices to domestic prices. The mechanism reduces excise taxes for fuel when international prices
jump above a 10 percent band around a reference price and increasing excise taxes when
international prices fall below the band.7 The reference price is based on the recent and expected
evolution of WTI prices in the medium term plus a refining fee for each derivate product.
Importantly, by focusing on excise taxes, this excludes large industries (mining, electric generators)
who can recover these taxes through deductions (Larrain, 2010).
7SIPCO was originally introduced with a 12.5 percent band which was narrowed to 10 percent in September 2012.
See http://bit.ly/VRAadr.
0.0
0.1
0.2
0.3
0.4
0.5
19
91
19
92
19
93
19
94
19
95
19
96
19
97
19
98
19
99
20
00
20
01
20
02
20
03
20
04
20
05
20
06
20
07
20
08
20
09
20
10
20
11
20
12
Perc
ent
of
GD
PFEPC
FEPP
ENERGY SUBSIDY REFORM: CASE STUDIES
14 INTERNATIONAL MONETARY FUND
Mitigating measures
Chile has a range of well-targeted safety net programs that it uses to protect low-income groups
from economic and other shocks (World Bank, 2010). In 2005, Chile compensated 5 million
low-income households to offset the impacts of rising fuel prices, and another 1.6 million
households whose electricity consumption was less than 150 kWh per month. A further payment to
low-income families was made in 2006.
Lessons
The costs of smoothing mechanisms depend on their design. For example, there is some
evidence that narrowing the bands from 12.5 percent over 1991–2005 to 5 percent over 2006–2010
greatly increased cost. In addition, the asymmetric nature of the original adjustment mechanism
contributed to the depletion of the fund. These suggest that, when thinking about the parameters of
adjustment mechanism, specific details can have a great impact of the cost of these programs. Thus,
countries considering introducing these smoothing devices should carry out illustrative scenarios
including sensitivity analysis of the parameters to ensure that the cost of the program would be in
line with expectations.
Adjustment mechanisms should be transparent. Initially, the FEPP used a secret formula and
allowed for ad-hoc adjustments in the reference band. This added unnecessary uncertainty
regarding the timing and size of future fuel price adjustments and the extent to which international
shocks would be transmitted to local prices. Such uncertainty is at odds with the goal of stabilizing
prices. The reform of the early 2000s shows that it is possible to use a transparent rules-based
approach to meet these goals.
It is possible to target the smoothing adjustment to smaller consumers. One important
characteristic of the latest Chilean reform is that it excludes large energy consumers by applying the
adjustment through an excise tax that is generally deducted by industries in mining, electricity, and
other large fuel consumers. This sends a clear signal that these large consumers should be able to
hedge on their own and helps to buy in support for reforms from the general population.
Smoothing mechanisms should only offer temporary relief. In Chile, the fuel market has been
liberalized since the 1970s. Thus, these smoothing mechanisms have been in part a product of
popular outcry related to higher fuel prices (in the context of the Gulf War and hurricane Katrina, for
example). Nevertheless, Chile has used these mechanisms for temporary support—all of the
adjustment schemes intended the increases to international prices to be eventually transmitted to
local prices in full. Importantly, Chile has achieved this while at the same time devoting important
resources to a well-targeted safety net (World Bank, 2010).
ENERGY SUBSIDY REFORM: CASE STUDIES
INTERNATIONAL MONETARY FUND 15
References
Larrain, Felipe B., 2010, ―Nuevos Mecanismos de Protección ante Variaciones de Precios de
Combustibles,‖ Presentation, Chilean Ministry of Finance. Available via the Internet:
http://www.chiletransporte.cl/3w/images/Documentos/Sipco.pdf.
Márquez, Miguel, 2000, ―El Fondo de Estabilización de Precios del Petróleo (FEPP) y el Mercado de
los derivados en Chile,‖ División de Recursos Naturales e Infraestructura, ECLAC. Available
via the Internet: http://www.eclac.org/publicaciones/xml/9/5789/Lcl1452e.pdf.
Organisation for Economic Co-operation and Development, 2013, ―Chile: Inventory of Estimated
Budgetary Support and Tax Expenditures for Fossil Fuels,‖ Overview Note, OECD-IEA Fossil
Fuel Subsidies and Other Support. Available via the Internet:
http://www.oecd.org/site/tadffss/Chileoverviewfossilfuelsupport2013.pdf.
O‘Ryan, Raul, Sebastian Miller, Jorge Rogat, and Carlos de Miguel, 2003, ―The Impact of Removing
Energy Subsidies in Chile,‖ in Energy Subsidies: Lessons Learned in Assessing their Impact
and Designing Policy Reforms (Geneva: United Nations Environment Programme). Available
via the Internet: http://www.unep.ch/etb/publications/energySubsidies/Energysubreport.pdf.
Vagliasindi, Maria, 2013, Implementing Energy Subsidy Reforms, Evidence from Developing
Countries (Washington: World Bank). Available via the Internet:
https://openknowledge.worldbank.org/handle/10986/11965.
World Bank, 2010, ―Subsidies in the Energy Sector: An Overview,‖ Background Paper for the World
Bank Group Energy Sector Strategy, July. Available via the Internet:
http://siteresources.worldbank.org/EXTESC/Resources/Subsidy_background_paper.pdf.
ENERGY SUBSIDY REFORM: CASE STUDIES
16 INTERNATIONAL MONETARY FUND
C. Ghana8
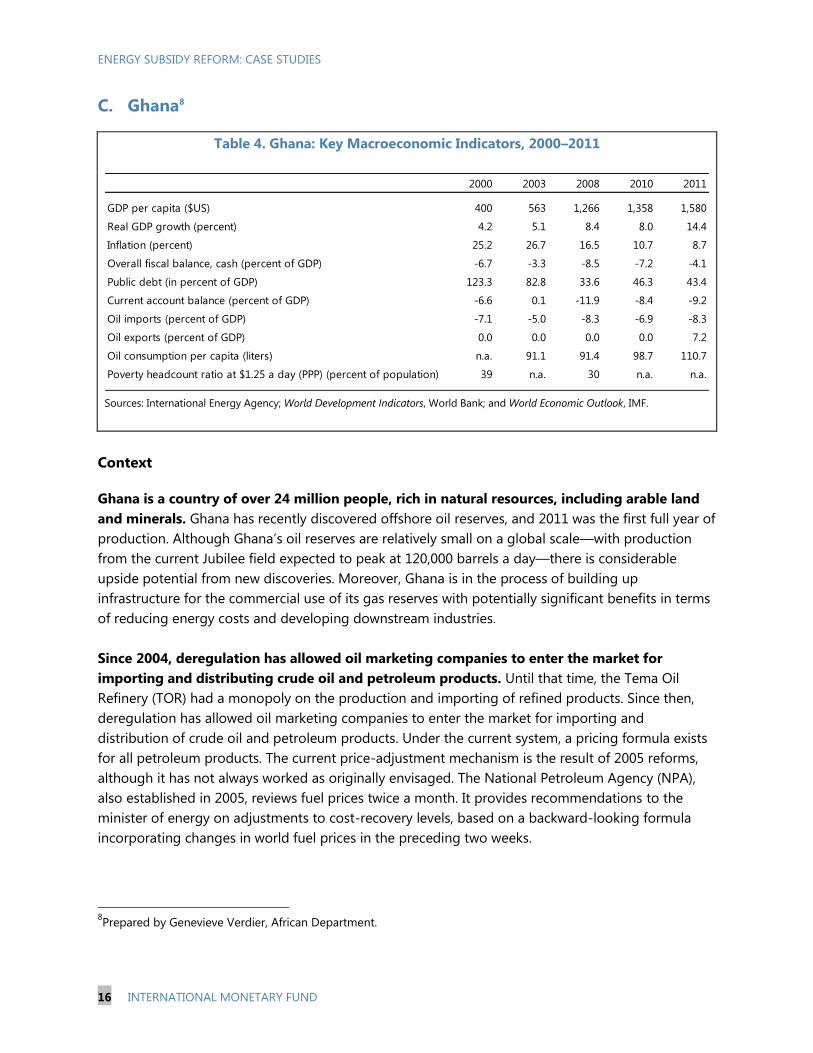
Table 4. Ghana: Key Macroeconomic Indicators, 2000–2011
Sources: International Energy Agency; World Development Indicators, World Bank; and World Economic Outlook, IMF.
Context
Ghana is a country of over 24 million people, rich in natural resources, including arable land
and minerals. Ghana has recently discovered offshore oil reserves, and 2011 was the first full year of
production. Although Ghana‘s oil reserves are relatively small on a global scale—with production
from the current Jubilee field expected to peak at 120,000 barrels a day—there is considerable
upside potential from new discoveries. Moreover, Ghana is in the process of building up
infrastructure for the commercial use of its gas reserves with potentially significant benefits in terms
of reducing energy costs and developing downstream industries.
Since 2004, deregulation has allowed oil marketing companies to enter the market for
importing and distributing crude oil and petroleum products. Until that time, the Tema Oil
Refinery (TOR) had a monopoly on the production and importing of refined products. Since then,
deregulation has allowed oil marketing companies to enter the market for importing and
distribution of crude oil and petroleum products. Under the current system, a pricing formula exists
for all petroleum products. The current price-adjustment mechanism is the result of 2005 reforms,
although it has not always worked as originally envisaged. The National Petroleum Agency (NPA),
also established in 2005, reviews fuel prices twice a month. It provides recommendations to the
minister of energy on adjustments to cost-recovery levels, based on a backward-looking formula
incorporating changes in world fuel prices in the preceding two weeks.
8Prepared by Genevieve Verdier, African Department.
2000 2003 2008 2010 2011
GDP per capita ($US) 400 563 1,266 1,358 1,580
Real GDP growth (percent) 4.2 5.1 8.4 8.0 14.4
Inflation (percent) 25.2 26.7 16.5 10.7 8.7
Overall fiscal balance, cash (percent of GDP) -6.7 -3.3 -8.5 -7.2 -4.1
Public debt (in percent of GDP) 123.3 82.8 33.6 46.3 43.4
Current account balance (percent of GDP) -6.6 0.1 -11.9 -8.4 -9.2
Oil imports (percent of GDP) -7.1 -5.0 -8.3 -6.9 -8.3
Oil exports (percent of GDP) 0.0 0.0 0.0 0.0 7.2
Oil consumption per capita (liters) n.a. 91.1 91.4 98.7 110.7
Poverty headcount ratio at $1.25 a day (PPP) (percent of population) 39 n.a. 30 n.a. n.a.
ENERGY SUBSIDY REFORM: CASE STUDIES
INTERNATIONAL MONETARY FUND 17
The decision to adjust pump prices is at the discretion of the Executive. If price increases are
warranted but not implemented, the cost of subsidies is in principle borne by the budget. However,
in the past, TOR carried the cost of the subsidy, and under-pricing of petroleum products saddled
TOR with large losses that spilled over into the financial sector in the form of non-performing loans.
The government was forced ultimately to clear TOR‘s arrears to the banking sector at a large
budgetary cost. Since October 2010, a hedging scheme using call options has also provided some
temporary protection against upward movements in oil prices. The government purchases monthly
call options that generate revenues in the event of upside shocks to global oil prices; these revenues
are used to cover temporary delays in adjusting domestic petroleum product prices to cost-recovery
levels (IMF, 2011).
Experience with fuel price adjustments
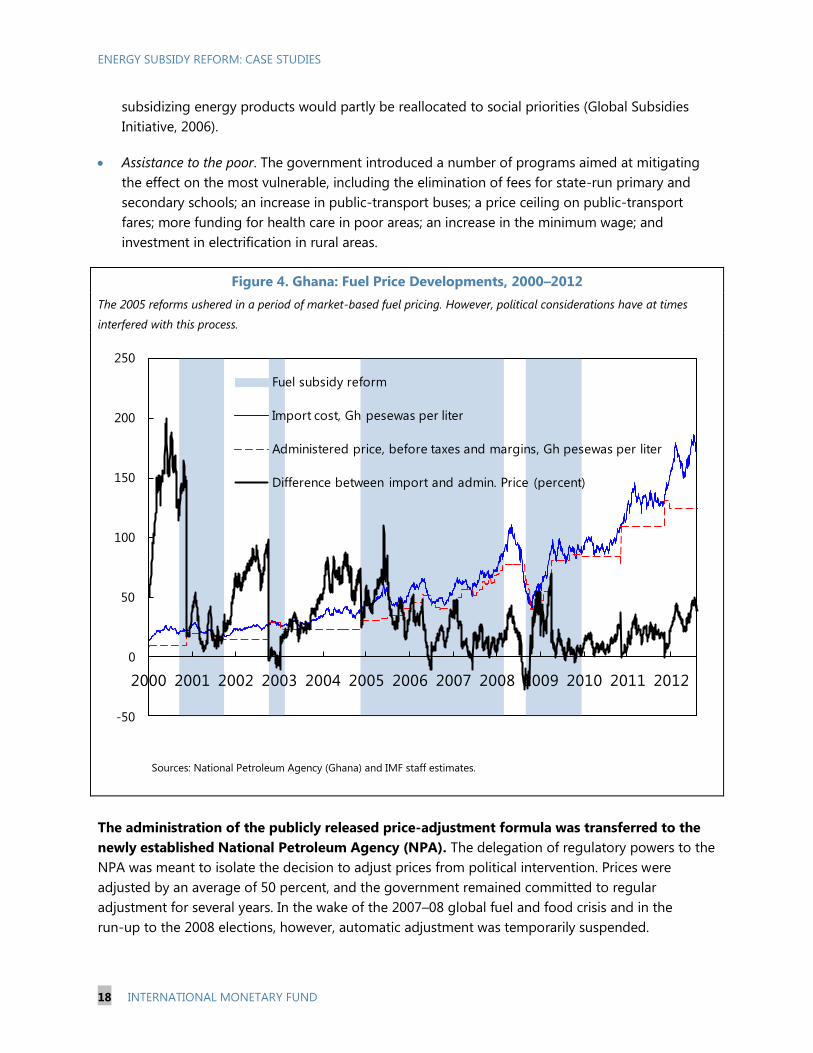
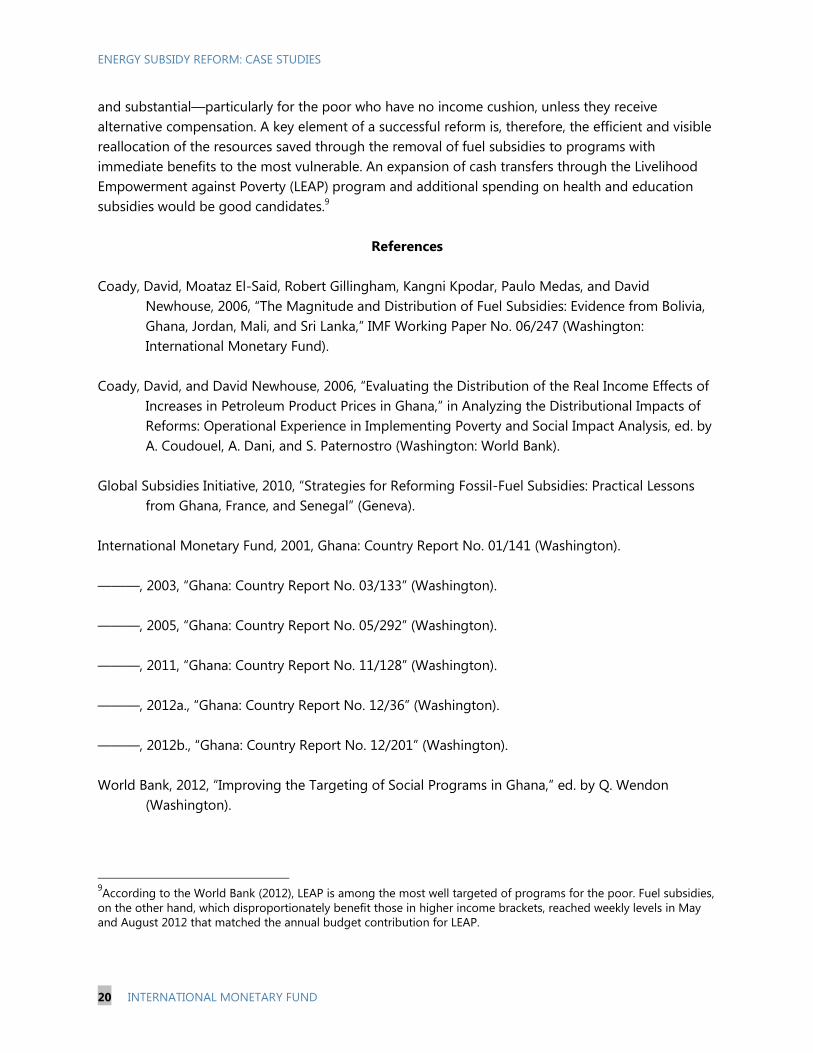
The past decade has been marked by several attempts to deregulate fuel prices in Ghana
(Figure 4).
In 2001, a 91 percent adjustment of petroleum pump prices was driven in part by the desire to
restore TOR‘s financial health. Delays in adjusting petroleum prices during 2000 led to large
accumulated losses for the state-owned public energy company, which reached 7 percent of
GDP (IMF, 2001). The reform was soon abandoned, however, in the face of rising world prices
and a depreciating currency. TOR‘s losses were largely absorbed by the state-owned Ghana
Commercial Bank, whose solvency was threatened.
In early 2003, recognizing the unsustainable financial position of both TOR and Ghana
Commercial Bank, the government renewed its commitment to cost-recovery pricing with a
90 percent increase in pump prices. Facing widespread opposition to the price increase, the
government partially reversed the price increase in the run-up to the 2004 elections and it
abandoned cost-recovery adjustments until 2005. In 2004, the subsidies to TOR reached
2.2 percent of GDP, and the company continued to borrow from Ghana Commercial Bank to
finance its operations (IMF, 2005).
The deregulation of petroleum product pricing in 2005 was accompanied by strategic
measures meant to ensure broad popular support for the reform. The strategy was supported
by research, communication, and programs to mitigate the impact on the most vulnerable groups,
all of which contributed to its successful implementation.
Research. A poverty and social impact assessment (PSIA) studying the impact of fuel subsidy
removal revealed that the program was poorly targeted, with the rich receiving the lion‘s share
of the benefits (Coady and Newhouse, 2006).
Communication. The government engaged in a widespread communications campaign,
including public addresses by the president and the minister of finance, explaining the reform‘s
benefits. The results of the PSIA were made public and discussed in a dialogue with various
stakeholders, including trade unions. The government also explained how resources freed from
ENERGY SUBSIDY REFORM: CASE STUDIES
18 INTERNATIONAL MONETARY FUND
subsidizing energy products would partly be reallocated to social priorities (Global Subsidies
Initiative, 2006).
Assistance to the poor. The government introduced a number of programs aimed at mitigating
the effect on the most vulnerable, including the elimination of fees for state-run primary and
secondary schools; an increase in public-transport buses; a price ceiling on public-transport
fares; more funding for health care in poor areas; an increase in the minimum wage; and
investment in electrification in rural areas.
Figure 4. Ghana: Fuel Price Developments, 2000–2012
The 2005 reforms ushered in a period of market-based fuel pricing. However, political considerations have at times
interfered with this process.
Sources: National Petroleum Agency (Ghana) and IMF staff estimates.
The administration of the publicly released price-adjustment formula was transferred to the
newly established National Petroleum Agency (NPA). The delegation of regulatory powers to the
NPA was meant to isolate the decision to adjust prices from political intervention. Prices were
adjusted by an average of 50 percent, and the government remained committed to regular
adjustment for several years. In the wake of the 2007–08 global fuel and food crisis and in the
run-up to the 2008 elections, however, automatic adjustment was temporarily suspended.
-50
0
50
100
150
200
250
2000 2001 2002 2003 2004 2005 2006 2007 2008 2009 2010 2011 2012
Fuel subsidy reform
Import cost, Gh pesewas per liter
Administered price, before taxes and margins, Gh pesewas per liter
Difference between import and admin. Price (percent)
ENERGY SUBSIDY REFORM: CASE STUDIES
INTERNATIONAL MONETARY FUND 19
The NPA remains the main regulatory agency and publishes the price adjustments required
for cost recovery on a biweekly basis. When an upward price adjustment has been required in
recent years, the shortfall has often been covered by the budget or more recently by hedging
profits. This has resulted in infrequent and large price adjustments, when hedging profits were
exhausted and the fiscal burden became too onerous. Prices were adjusted twice in 2011, by
30 percent in January and 15 percent in December. Prices have not been adjusted in 2012 (with the
exception of a small downward adjustment early in the year) and the gap between domestic and
global oil prices, exacerbated by a depreciating currency, has increased substantially (IMF, 2012a, b).
Mitigating measures
Following the 2005 fuel price reform, the government introduced a number of programs
aimed at mitigating its effect on the most vulnerable. (See bullet on ―Assistance to the poor‖
above).
Lessons
A number of lessons can be drawn from Ghana‘s experience in the past decade.
The durability of reform depends crucially on political will and the independence of
regulatory agencies from political interference. Without these conditions, it is difficult to
maintain an independent regulatory agency. The NPA is not free to adjust prices without the
consent of the Executive: it has adjusted prices only three times (once downwards) since January
2011. Although democratically elected governments have stronger mandates to implement difficult
reforms, commitment to automatic adjustment often falters in the run-up to elections.
A constant dialogue with stakeholders and civil society at large about the cost of subsidies is
necessary to maintain commitment to the reform. Recent attempts at adjusting prices have not
been accompanied by an extensive public information campaign similar to the 2005 efforts. Price
increases have been irregular, difficult to anticipate, and usually announced shortly before being
implemented. This can result in strong opposition by various stakeholders, including powerful trade
unions, and can undermine the government‘s efforts. The 2005 campaign was also successful
because it engaged civil society and powerfully demonstrated the cost of fuel subsidies by sharing
the results of the PSIA.
Supportive research and analysis are important for convincing the public of the benefits of
reforms. During the 2005 reform, the PSIA was crucial in demonstrating the costs of subsidies. It
also outlined that fuel subsidies were a poor policy measure in the fight against poverty: in Ghana,
less than 2.3 percent of outlays on fuel subsidies benefitted the poor.
Visible mitigating measures increase the likelihood of success. Although fuel subsidies are
ill-targeted, they are a direct transfer to most if not all citizens, their benefits are immediate and easy
to understand compared to other social programs, and the individual cost of their removal is swift
ENERGY SUBSIDY REFORM: CASE STUDIES
20 INTERNATIONAL MONETARY FUND
and substantial—particularly for the poor who have no income cushion, unless they receive
alternative compensation. A key element of a successful reform is, therefore, the efficient and visible
reallocation of the resources saved through the removal of fuel subsidies to programs with
immediate benefits to the most vulnerable. An expansion of cash transfers through the Livelihood
Empowerment against Poverty (LEAP) program and additional spending on health and education
subsidies would be good candidates.9
References
Coady, David, Moataz El-Said, Robert Gillingham, Kangni Kpodar, Paulo Medas, and David
Newhouse, 2006, ―The Magnitude and Distribution of Fuel Subsidies: Evidence from Bolivia,
Ghana, Jordan, Mali, and Sri Lanka,‖ IMF Working Paper No. 06/247 (Washington:
International Monetary Fund).
Coady, David, and David Newhouse, 2006, ―Evaluating the Distribution of the Real Income Effects of
Increases in Petroleum Product Prices in Ghana,‖ in Analyzing the Distributional Impacts of
Reforms: Operational Experience in Implementing Poverty and Social Impact Analysis, ed. by
A. Coudouel, A. Dani, and S. Paternostro (Washington: World Bank).
Global Subsidies Initiative, 2010, ―Strategies for Reforming Fossil-Fuel Subsidies: Practical Lessons
from Ghana, France, and Senegal‖ (Geneva).
International Monetary Fund, 2001, Ghana: Country Report No. 01/141 (Washington).
———, 2003, ―Ghana: Country Report No. 03/133‖ (Washington).
———, 2005, ―Ghana: Country Report No. 05/292‖ (Washington).
———, 2011, ―Ghana: Country Report No. 11/128‖ (Washington).
———, 2012a., ―Ghana: Country Report No. 12/36‖ (Washington).
———, 2012b., ―Ghana: Country Report No. 12/201‖ (Washington).
World Bank, 2012, ―Improving the Targeting of Social Programs in Ghana,‖ ed. by Q. Wendon
(Washington).
9According to the World Bank (2012), LEAP is among the most well targeted of programs for the poor. Fuel subsidies,
on the other hand, which disproportionately benefit those in higher income brackets, reached weekly levels in May
and August 2012 that matched the annual budget contribution for LEAP.
ENERGY SUBSIDY REFORM: CASE STUDIES
INTERNATIONAL MONETARY FUND 21
D. Indonesia10
Table 5. Indonesia: Key Macroeconomic Indicators, 2000–2011
Sources: International Energy Agency; World Development Indicators, World Bank; and World Economic Outlook, IMF.
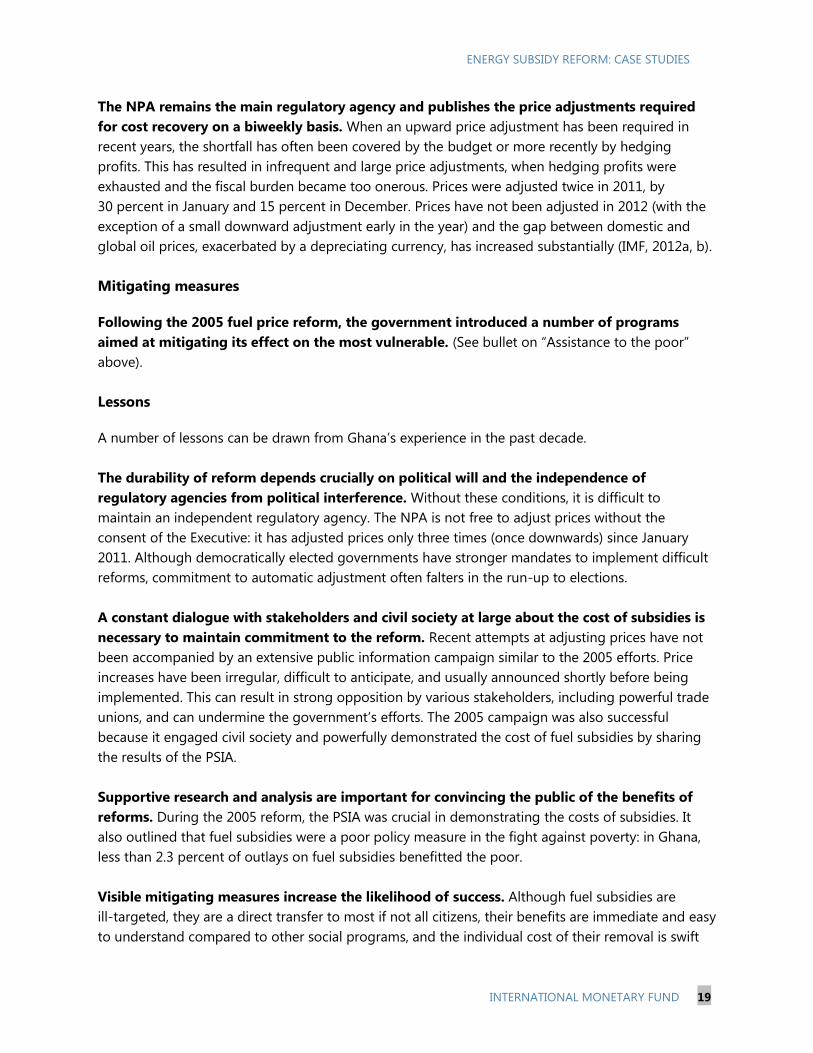
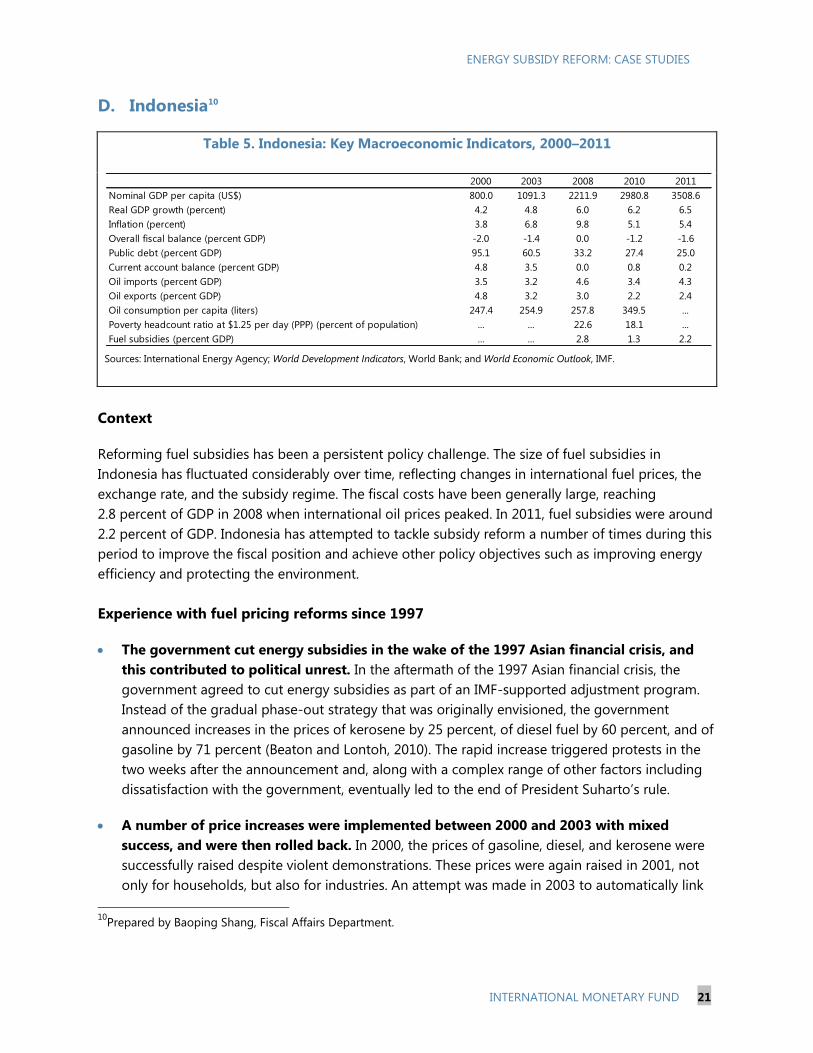
Context
Reforming fuel subsidies has been a persistent policy challenge. The size of fuel subsidies in
Indonesia has fluctuated considerably over time, reflecting changes in international fuel prices, the
exchange rate, and the subsidy regime. The fiscal costs have been generally large, reaching
2.8 percent of GDP in 2008 when international oil prices peaked. In 2011, fuel subsidies were around
2.2 percent of GDP. Indonesia has attempted to tackle subsidy reform a number of times during this
period to improve the fiscal position and achieve other policy objectives such as improving energy
efficiency and protecting the environment.
Experience with fuel pricing reforms since 1997
The government cut energy subsidies in the wake of the 1997 Asian financial crisis, and
this contributed to political unrest. In the aftermath of the 1997 Asian financial crisis, the
government agreed to cut energy subsidies as part of an IMF-supported adjustment program.
Instead of the gradual phase-out strategy that was originally envisioned, the government
announced increases in the prices of kerosene by 25 percent, of diesel fuel by 60 percent, and of
gasoline by 71 percent (Beaton and Lontoh, 2010). The rapid increase triggered protests in the
two weeks after the announcement and, along with a complex range of other factors including
dissatisfaction with the government, eventually led to the end of President Suharto‘s rule.
A number of price increases were implemented between 2000 and 2003 with mixed
success, and were then rolled back. In 2000, the prices of gasoline, diesel, and kerosene were
successfully raised despite violent demonstrations. These prices were again raised in 2001, not
only for households, but also for industries. An attempt was made in 2003 to automatically link
10
Prepared by Baoping Shang, Fiscal Affairs Department.
2000 2003 2008 2010 2011
Nominal GDP per capita (US$) 800.0 1091.3 2211.9 2980.8 3508.6
Real GDP growth (percent) 4.2 4.8 6.0 6.2 6.5
Inflation (percent) 3.8 6.8 9.8 5.1 5.4
Overall fiscal balance (percent GDP) -2.0 -1.4 0.0 -1.2 -1.6
Public debt (percent GDP) 95.1 60.5 33.2 27.4 25.0
Current account balance (percent GDP) 4.8 3.5 0.0 0.8 0.2
Oil imports (percent GDP) 3.5 3.2 4.6 3.4 4.3
Oil exports (percent GDP) 4.8 3.2 3.0 2.2 2.4
Oil consumption per capita (liters) 247.4 254.9 257.8 349.5 ...
Poverty headcount ratio at $1.25 per day (PPP) (percent of population) ... ... 22.6 18.1 ...
Fuel subsidies (percent GDP) ... ... 2.8 1.3 2.2
ENERGY SUBSIDY REFORM: CASE STUDIES
22 INTERNATIONAL MONETARY FUND
movements in domestic fuel product prices to international prices. This reform, however, was
poorly communicated. Many protesters believed that various government decisions at the time
had been in favor of powerful interest groups. General dissatisfaction with political corruption
and inefficiency also contributed to public opposition. In addition, many of the announced
compensation programs did not materialize. As a result, the government rolled back most of the
price increases and also severed the link to world prices.
Indonesia became a net oil importer for the first time in 2004 and resumed fuel price
increases. Concerned over the increasing fiscal pressure from fuel subsidies, the government
undertook two large fuel price increases in 2005. As a result, the price of diesel fuel doubled and
that of kerosene nearly tripled. Protests again took place in opposition to the reform, but with
less intensity than in 1998 and 2003. The government was led by President Yudhoyono who was
first elected in 2004 and won a convincing reelection in 2009.
Petroleum subsidies have continued, with some reductions. In 2008, with international fuel
prices at their peak, petroleum product subsidies reached 2.8 percent of GDP. Fuel prices were
raised by 29 percent, on average, and were later reduced as international prices started to fall,
though remaining above their pre-increase levels. The government also ceased paying subsidies
to larger industrial electricity consumers. The government announced its objective to remove
fossil-fuel subsidies by 2014. But in September 2010, the House of Representatives agreed to
raise budget allocations for subsidized fuel consumption in the revised 2010 budget, which was
inconsistent with the government‘s objective to reduce energy subsidies. Indonesia may have
also missed an opportunity to reduce fuel subsides in 2012 as the proposed increases in fuel
prices by the government was significantly reduced by the parliament.
The government has begun to encourage LPG use over kerosene. Indonesia also initiated a
program to phase out the use of kerosene in favor of liquid propane gas (LPG) in 2007. LPG is
less subsidized than kerosene and also has lower levels of cost, pollution, and CO2 emissions.
LPG stoves and small LPG cylinders have been distributed, free of charge. However, the program
was not without problems and may have led to LPG diversion and accidents.
ENERGY SUBSIDY REFORM: CASE STUDIES
INTERNATIONAL MONETARY FUND 23
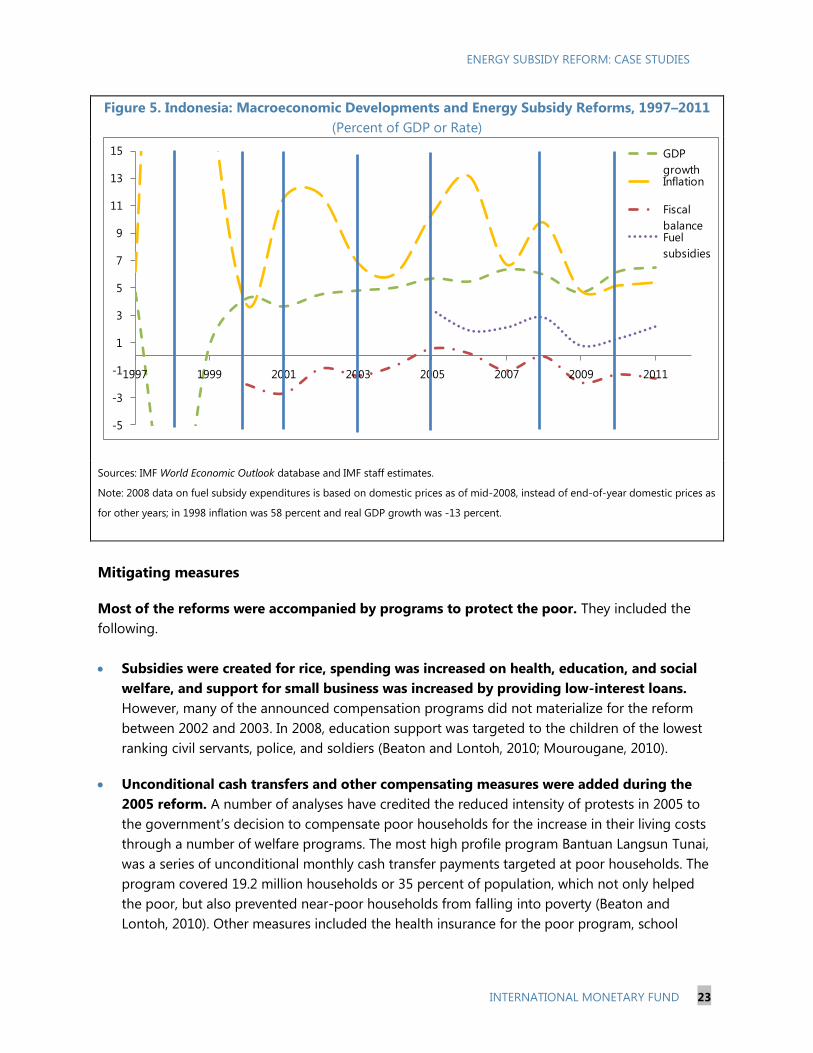
Figure 5. Indonesia: Macroeconomic Developments and Energy Subsidy Reforms, 1997–2011
(Percent of GDP or Rate)
Sources: IMF World Economic Outlook database and IMF staff estimates.
Note: 2008 data on fuel subsidy expenditures is based on domestic prices as of mid-2008, instead of end-of-year domestic prices as
for other years; in 1998 inflation was 58 percent and real GDP growth was -13 percent.
Mitigating measures
Most of the reforms were accompanied by programs to protect the poor. They included the
following.
Subsidies were created for rice, spending was increased on health, education, and social
welfare, and support for small business was increased by providing low-interest loans.
However, many of the announced compensation programs did not materialize for the reform
between 2002 and 2003. In 2008, education support was targeted to the children of the lowest
ranking civil servants, police, and soldiers (Beaton and Lontoh, 2010; Mourougane, 2010).
Unconditional cash transfers and other compensating measures were added during the
2005 reform. A number of analyses have credited the reduced intensity of protests in 2005 to
the government‘s decision to compensate poor households for the increase in their living costs
through a number of welfare programs. The most high profile program Bantuan Langsun Tunai,
was a series of unconditional monthly cash transfer payments targeted at poor households. The
program covered 19.2 million households or 35 percent of population, which not only helped
the poor, but also prevented near-poor households from falling into poverty (Beaton and
Lontoh, 2010). Other measures included the health insurance for the poor program, school
-5
-3
-1
1
3
5
7
9
11
13
15
1997 1999 2001 2003 2005 2007 2009 2011
GDP
growthInflation
Fiscal
balanceFuel
subsidies
ENERGY SUBSIDY REFORM: CASE STUDIES
24 INTERNATIONAL MONETARY FUND
operational assistance program, and expanded rural infrastructure support project. Awareness of
these programs was raised through an extensive public information campaign.
An effort to convert households and small businesses from kerosene to LPG has been
underway. Kerosene has been widely used in households for cooking and is the most heavily
subsidized petroleum product in Indonesia. Reducing the subsidies for kerosene requires an
alternative way to provide affordable cooking fuel for households. The same logic also applies to
small businesses. In addition to providing a free starter pack, including a stove and a compact
cylinder, the government established a communication program to educate the public on the
safety of LPG technology. Government statistics indicate that the program has achieved
significant savings by increasing the use of LPG and reducing the consumption of kerosene.
Lessons
Targeted cash transfers can reduce opposition to subsidy reform and assist the poor.
Indonesia‘s unconditional cash transfer program was a successful strategy in overcoming social and
political opposition to fuel subsidy reforms. Experience with the Bantuan Langsun Tunai program
suggests that such programs need good preparation, deployment, and monitoring in order to
effectively assist the poor.
Providing an affordable alternative energy source could also help reduce subsidies and
minimize opposition to reforms. Initial data indicate that the kerosene to LPG conversion in
Indonesia has been successful. It has achieved the government‘s goal to reduce fuel subsidies with
limited adverse impacts on households and small businesses.
A rapid reduction of subsidies can generate opposition to reform. The sudden, large price
increases in 1998 and 2003 were strongly resisted by the public.
Reforms are more likely to be successful with a popular government. The failure of the 1998
reform to some extent reflected public dissatisfaction with the Suharto government. The reforms
that followed between 2000 and 2003 were a mix of success and failure, in which the public distrust
of the government also played a role. The success of the 2005 and 2008 reforms, in contrast, was
helped by the popularity of President Yudhoyono at the time. The erosion of his popularity in recent
years, however, may have contributed to the reversal of the reforms.
Reform initiatives are often triggered by adverse economic events, but durable reform
requires recognition of the benefits of subsidy removal and long-term commitment to it. The
1998 reform was triggered by the Asian financial crisis. The 2000–03 reforms were responses to the
resulting high fiscal imbalance and government debt. Fiscal pressure and a negative current account
balance were the main causes of the 2005 reform as Indonesia became a net oil importer in 2004.
And the 2008 reform was the result of historically high oil prices. Without a firm plan for subsidy
removal, subsidy reform was stalled in 2010 despite favorable economic conditions.
ENERGY SUBSIDY REFORM: CASE STUDIES
INTERNATIONAL MONETARY FUND 25
Ad hoc price adjustments without a clear long-term goal, together with the inability to
depoliticize pricing and subsidy policy, led to the reemergence of subsidies and the failure to
implement durable reform. Ideally, once the political decision has been made to reduce or remove
energy subsides, technical decisions on prices and quantities to subsidize can be delegated to an
independent institution that analyzes reform options, disseminates their potential impact, and
makes reform recommendations that should be fully implemented. This could improve the
transparency of the reform process and reduce the likelihood of setbacks because of election
politics. The National Energy Council in Indonesia, however, is not fully independent of the political
process. The action by the House of Representatives to increase subsidies in 2010, for example,
might have been prevented if there had been a depoliticized decision-making process both for
pricing and for the determining quantities to be subsidized.
Communicating the reform objectives and planned mitigating measures to the public can be
effective in promoting the acceptance of reforms. As the public becomes better informed about
the reasons for, and the objectives of, reforms, it is more likely to understand and accept the
measures. Better communicating about the mitigating programs can increase their take-up and thus
reduce the negative impact on many households as well as public opposition. The opposition to the
2003 reform in Indonesia was partially motivated by the belief that the reform had been in favor of
powerful interest groups.
References
Beaton, Christopher, and Lucky Lontoh, 2010, ―Lessons Learned from Indonesia‘s Attempts to
Reform Fossil-Fuel Subsidies‖ (Winnipeg: International Institute for Sustainable
Development).
Mourougane, Annabelle, 2010, ―Phasing Out Energy Subsidies in Indonesia,‖ OECD Economics
Department Working Papers No. 808 (Paris: Organisation for Economic Co-operation and
Development).
ENERGY SUBSIDY REFORM: CASE STUDIES
26 INTERNATIONAL MONETARY FUND
E. Islamic Republic of Iran11
Table 6. Iran: Key Macroeconomic Indicators 2005–2011
Sources: International Energy Agency; World Development Indicators, World Bank; and World Economic Outlook, IMF.
Note: data for 2011 are projected.
Context
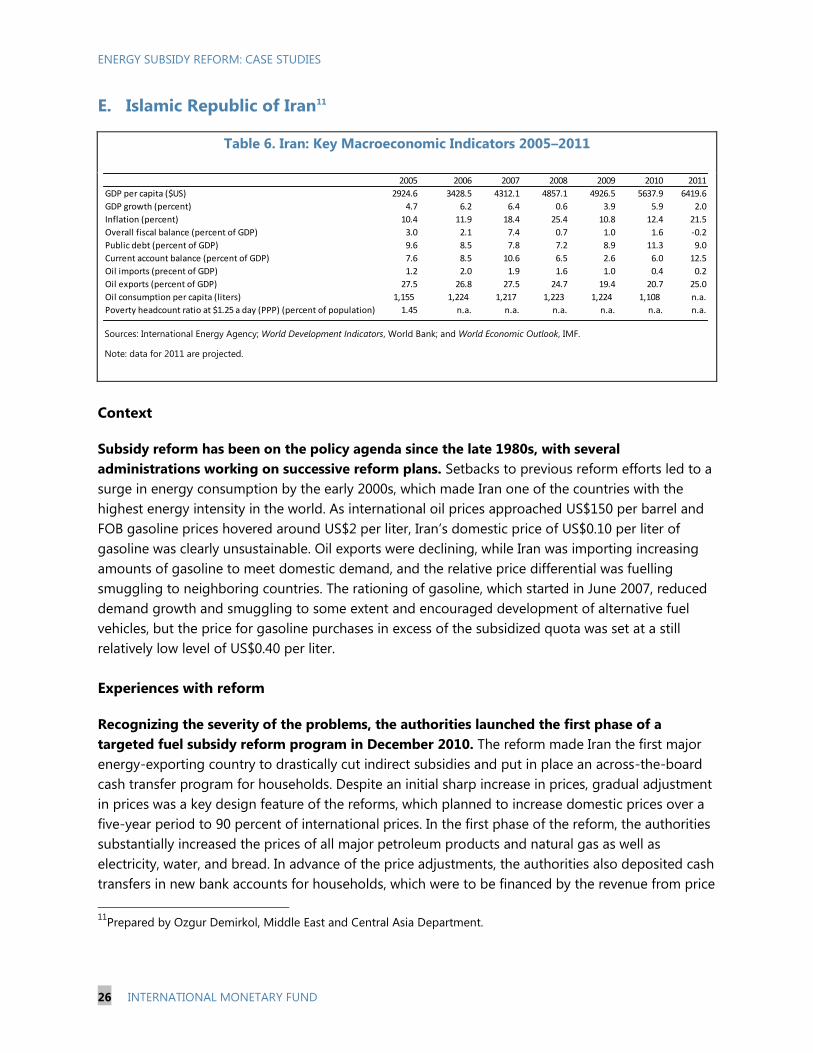
Subsidy reform has been on the policy agenda since the late 1980s, with several
administrations working on successive reform plans. Setbacks to previous reform efforts led to a
surge in energy consumption by the early 2000s, which made Iran one of the countries with the
highest energy intensity in the world. As international oil prices approached US$150 per barrel and
FOB gasoline prices hovered around US$2 per liter, Iran‘s domestic price of US$0.10 per liter of
gasoline was clearly unsustainable. Oil exports were declining, while Iran was importing increasing
amounts of gasoline to meet domestic demand, and the relative price differential was fuelling
smuggling to neighboring countries. The rationing of gasoline, which started in June 2007, reduced
demand growth and smuggling to some extent and encouraged development of alternative fuel
vehicles, but the price for gasoline purchases in excess of the subsidized quota was set at a still
relatively low level of US$0.40 per liter.
Experiences with reform
Recognizing the severity of the problems, the authorities launched the first phase of a
targeted fuel subsidy reform program in December 2010. The reform made Iran the first major
energy-exporting country to drastically cut indirect subsidies and put in place an across-the-board
cash transfer program for households. Despite an initial sharp increase in prices, gradual adjustment
in prices was a key design feature of the reforms, which planned to increase domestic prices over a
five-year period to 90 percent of international prices. In the first phase of the reform, the authorities
substantially increased the prices of all major petroleum products and natural gas as well as
electricity, water, and bread. In advance of the price adjustments, the authorities also deposited cash
transfers in new bank accounts for households, which were to be financed by the revenue from price
11
Prepared by Ozgur Demirkol, Middle East and Central Asia Department.
2005 2006 2007 2008 2009 2010 2011
GDP per capita ($US) 2924.6 3428.5 4312.1 4857.1 4926.5 5637.9 6419.6
GDP growth (percent) 4.7 6.2 6.4 0.6 3.9 5.9 2.0
Inflation (percent) 10.4 11.9 18.4 25.4 10.8 12.4 21.5
Overall fiscal balance (percent of GDP) 3.0 2.1 7.4 0.7 1.0 1.6 -0.2
Public debt (percent of GDP) 9.6 8.5 7.8 7.2 8.9 11.3 9.0
Current account balance (percent of GDP) 7.6 8.5 10.6 6.5 2.6 6.0 12.5
Oil imports (precent of GDP) 1.2 2.0 1.9 1.6 1.0 0.4 0.2
Oil exports (percent of GDP) 27.5 26.8 27.5 24.7 19.4 20.7 25.0
Oil consumption per capita (liters) 1,155 1,224 1,217 1,223 1,224 1,108 n.a.
Poverty headcount ratio at $1.25 a day (PPP) (percent of population) 1.45 n.a. n.a. n.a. n.a. n.a. n.a.
ENERGY SUBSIDY REFORM: CASE STUDIES
INTERNATIONAL MONETARY FUND 27
increases. Part of the revenue from price increases was also allocated to enterprises to help reduce
their energy intensity.
The subsidy reform was also motivated by the authorities’ broader structural reform agenda
to foster growth and job creation more than to address fiscal concerns. Unlike other countries,
Iran‘s reform was driven by a need to put its valuable hydrocarbon resources to more productive use
rather than a need to reduce the direct burden of subsidies on the fiscal accounts. The Iranian
authorities were clear from the outset that the main reform objective was to reduce waste and
rationalize consumption. The reform legislation, and the political debate that preceded it, ruled out
using the reduction of energy subsidies to improve the country‘s fiscal balance. The subsidy reform
was intended to complement a larger structural reform package that also included financial sector
and tax reforms to enhance the competitiveness of the economy.
Despite a good start at the end of 2010, the implementation of the reform program was
suspended in late 2012 owing to growing concerns over its financing and the deteriorating
macroeconomic situation. In mid-2012 the authorities postponed the implementation of the
second phase of the reform because of lack of parliamentary support for the authorities‘ proposed
cash transfer budget and implied price increases under the second phase. Later in November 2012,
parliament formally voted to halt the implementation of the second phase of the subsidy reform
citing rising inflation and unfavorable economic developments in the country. The parliament‘s vote
kept the existing cash transfer program intact but barred further energy price increases under the
subsidy reform. The second phase, originally planned to be implemented in the second half of 2012,
would have involved further increases in energy prices and cash transfers to households. The new
round, as originally proposed, was also expected to replace across-the-board cash transfers with
more targeted cash transfers for low-income groups.
Mitigating measures
About 80 percent of the revenue from price increases was redistributed to households as
bi-monthly cash transfers. Initially, the authorities leaned towards targeting the transfers to the
poorer segments of society. It became clear, however, that it would be administratively difficult to
identify and properly screen the recipients given the timeline established. Also, denying support for
upper-income groups risked triggering public discontent among the biggest energy users. In the
end, all citizens were allowed to apply for the compensatory transfers, which were made equal for all
applicants. At the same time, the richest households were discouraged from applying.
The remaining balance of the revenue from price increases was to be set aside to provide
support for enterprise restructuring with a view of reducing their energy intensity. The
authorities conducted a systematic analysis of more than 12,000 enterprises along several criteria to
assess the various channels through which the reform could affect them. Out of these enterprises,
7,000 were selected to receive some form of targeted assistance to restructure their operations. This
included direct assistance as well as sales of limited quantities of fuels at partially subsidized rates to
ENERGY SUBSIDY REFORM: CASE STUDIES
28 INTERNATIONAL MONETARY FUND
moderate the impact of the price increase on the input costs of enterprises in the industrial and
agricultural sectors.
Multitier tariffs on electricity, natural gas, and water were used to moderate the impact of the
price increases on small users, mostly the poor. Unit tariffs on electricity, natural gas, and water
use were set using escalating schedules. Large household consumers were charged prices marginally
higher than in international markets. New tariffs also took into account regional disparities in the
availability of different heating fuels. Tariff schedules were further differentiated by region, with
prices set at lower rates in hot regions with relatively higher air-conditioning demand. Tariff
schedules for natural gas and water were similarly differentiated by quantity used and region. In
areas where natural gas was not available, heating costs were to remain closely monitored and
regulated, and lower-priced kerosene quotas and lifeline electricity rates were provided to ensure
affordability of heating.
The use of the electronic cards system for gasoline rationing and quotas introduced in June
2007 also provided a de facto multi-tier energy pricing structure for gasoline, making the
reform seem gradual. The price of rationed gasoline was increased but it remained well below the
full price at which households could purchase an unlimited amount of fuel. In addition, households
were told that they would not lose any of their unused gasoline quotas. Rationing required the
implementation of a comprehensive vehicle registration system and personalized distribution and
management of the gasoline quotas.
Lessons
Cash transfers to all segments of the population were pivotal in acceptance of the subsidy
reform by the population. The authorities initially considered a targeted cash transfer scheme
towards the poorer segments of the society but determined that it would be administratively
difficult to identify and properly screen the recipients. Also, denying support for the upper income
groups risked triggering public discontent among the biggest energy users. In the end, all citizens
were allowed to apply for the compensatory transfers, which were made equal for all applicants. At
the same time, with the subsidies being highly regressive, the richest households were encouraged
to refrain from applying, with limited success.
Providing all households with equal transfers achieved redistributive effects. For the poor who
benefited little from cheap domestic energy prices, the compensation represented a larger share of
their income than it did for the middle class; in fact, it was large enough to lift virtually every Iranian
out of poverty. In addition, equal transfers helped limit the regressivity of subsidies. This gave the
government‘s economic rationale a powerful public relations stance and built support for the
reform.
Maintaining macro stability is critical to the success of the reform. Iran suspended the
implementation of the second phase of the reform because of concerns over the deteriorating
macroeconomic situation. Expansionary monetary and fiscal policies, coupled with the worsening
ENERGY SUBSIDY REFORM: CASE STUDIES
INTERNATIONAL MONETARY FUND 29
external environment, added to the pressures on the exchange rate, fueled inflation, and put further
strain on growth during the implementation of the first phase of the reform. In contrast to the
proposed reform, the cash transfer program‘s budget was reportedly in deficit. Furthermore, high
inflation reduced energy prices in real terms and partially offset the impact of energy price increases
on consumption, undermining progress under the subsidy reform.
Moving to more energy-efficient production technologies and restructuring enterprises takes
more time than initially planned. Although some enterprises were able to continue to expand
their production since the subsidy reform, small and medium-sized enterprises were reportedly
squeezed by high energy prices and limited government support. There was also reportedly no
meaningful progress in adoption of more energy efficient technologies in enterprises.
Communication is indispensable in creating public ownership of the reform. The reform was
preceded by an extensive public relations campaign to educate the population on the growing costs
of low energy prices, and on the benefits expected from the reform. The authorities emphasized that
the reform would benefit poor households, which would receive cash benefits, while in the past
these households had not benefitted much from the cheap energy that was mostly consumed by
the richer groups. The Iranian authorities also underlined from the outset that the reforms were not
about eliminating subsidies, but about switching subsidies from products to households. However,
following its implementation, the reform did not seem fully supported by public official information
about the de facto implementation and outcome of the reform.
References
Guillaume, Dominique, Roman Zytek, and Mohammad Reza Farzin, 2011, ―Iran—The Chronicles of
The Subsidy Reform,‖ IMF Working Paper No. 11/167 (Washington: International Monetary
Fund). Available via the Internet: http://www.imf.org/external/pubs/ft/wp/2011/wp11167.pdf.
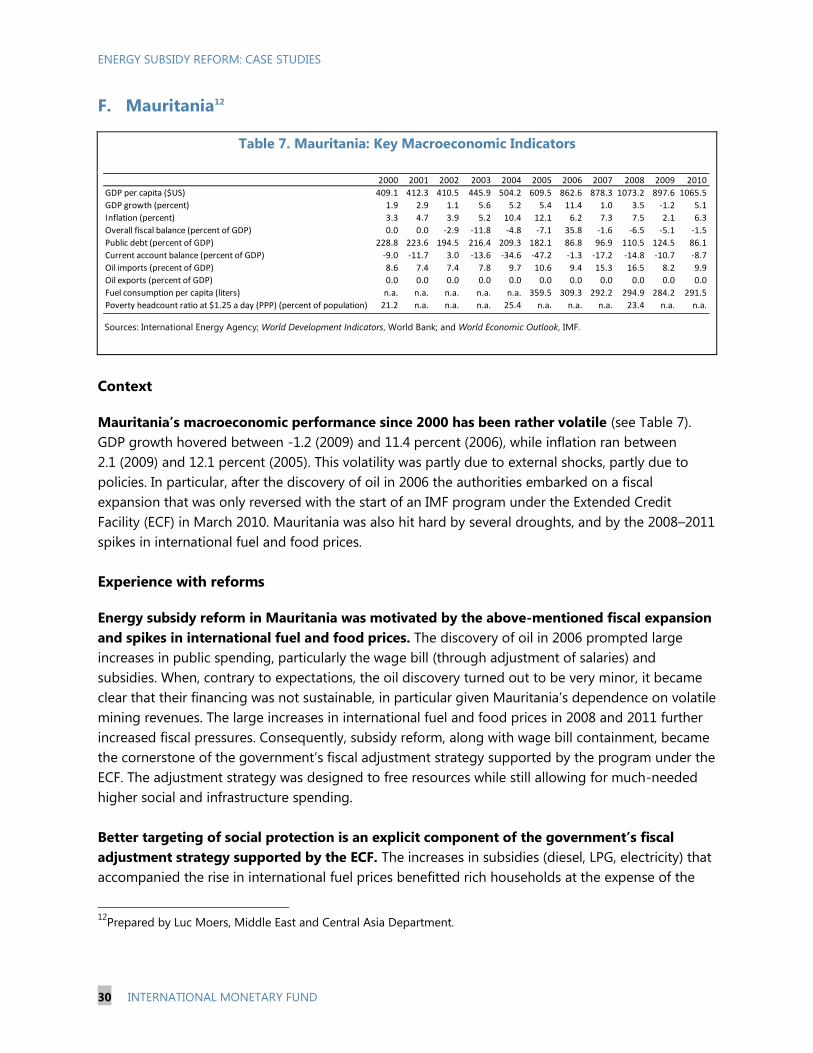
ENERGY SUBSIDY REFORM: CASE STUDIES
30 INTERNATIONAL MONETARY FUND
F. Mauritania12
Table 7. Mauritania: Key Macroeconomic Indicators
Sources: International Energy Agency; World Development Indicators, World Bank; and World Economic Outlook, IMF.
Context
Mauritania’s macroeconomic performance since 2000 has been rather volatile (see Table 7).
GDP growth hovered between -1.2 (2009) and 11.4 percent (2006), while inflation ran between
2.1 (2009) and 12.1 percent (2005). This volatility was partly due to external shocks, partly due to
policies. In particular, after the discovery of oil in 2006 the authorities embarked on a fiscal
expansion that was only reversed with the start of an IMF program under the Extended Credit
Facility (ECF) in March 2010. Mauritania was also hit hard by several droughts, and by the 2008–2011
spikes in international fuel and food prices.
Experience with reforms
Energy subsidy reform in Mauritania was motivated by the above-mentioned fiscal expansion
and spikes in international fuel and food prices. The discovery of oil in 2006 prompted large
increases in public spending, particularly the wage bill (through adjustment of salaries) and
subsidies. When, contrary to expectations, the oil discovery turned out to be very minor, it became
clear that their financing was not sustainable, in particular given Mauritania‘s dependence on volatile
mining revenues. The large increases in international fuel and food prices in 2008 and 2011 further
increased fiscal pressures. Consequently, subsidy reform, along with wage bill containment, became
the cornerstone of the government‘s fiscal adjustment strategy supported by the program under the
ECF. The adjustment strategy was designed to free resources while still allowing for much-needed
higher social and infrastructure spending.
Better targeting of social protection is an explicit component of the government’s fiscal
adjustment strategy supported by the ECF. The increases in subsidies (diesel, LPG, electricity) that
accompanied the rise in international fuel prices benefitted rich households at the expense of the
12
Prepared by Luc Moers, Middle East and Central Asia Department.
2000 2001 2002 2003 2004 2005 2006 2007 2008 2009 2010
GDP per capita ($US) 409.1 412.3 410.5 445.9 504.2 609.5 862.6 878.3 1073.2 897.6 1065.5
GDP growth (percent) 1.9 2.9 1.1 5.6 5.2 5.4 11.4 1.0 3.5 -1.2 5.1
Inflation (percent) 3.3 4.7 3.9 5.2 10.4 12.1 6.2 7.3 7.5 2.1 6.3
Overall fiscal balance (percent of GDP) 0.0 0.0 -2.9 -11.8 -4.8 -7.1 35.8 -1.6 -6.5 -5.1 -1.5
Public debt (percent of GDP) 228.8 223.6 194.5 216.4 209.3 182.1 86.8 96.9 110.5 124.5 86.1
Current account balance (percent of GDP) -9.0 -11.7 3.0 -13.6 -34.6 -47.2 -1.3 -17.2 -14.8 -10.7 -8.7
Oil imports (precent of GDP) 8.6 7.4 7.4 7.8 9.7 10.6 9.4 15.3 16.5 8.2 9.9
Oil exports (percent of GDP) 0.0 0.0 0.0 0.0 0.0 0.0 0.0 0.0 0.0 0.0 0.0
Fuel consumption per capita (liters) n.a. n.a. n.a. n.a. n.a. 359.5 309.3 292.2 294.9 284.2 291.5
Poverty headcount ratio at $1.25 a day (PPP) (percent of population) 21.2 n.a. n.a. n.a. 25.4 n.a. n.a. n.a. 23.4 n.a. n.a.
ENERGY SUBSIDY REFORM: CASE STUDIES
INTERNATIONAL MONETARY FUND 31
neediest. Almost 80 percent of all energy subsidies were captured by the richest 40 percent of
households, thus widening income inequality. Moreover, the emergency relief subsidies on food
prices, intended to alleviate the effects of high commodity prices, were not well targeted.
An attempt at energy subsidy reform in 2008 was unsuccessful. A freeze on fuel prices in early
2008 led to huge losses for energy distribution companies (all private). In late June 2008, the
government increased the prices of petroleum products by 17.5 percent to 20 percent. No particular
public communication strategy was implemented, nor were specific mitigating measures introduced
in the context of this fuel subsidy reform episode. Furthermore, subsidy reform-related
conditionality was not included in the Poverty Reduction and Growth Facility (PRGF) arrangement
covering 2006–09. The one-off price adjustment triggered protests, which contributed to a climate
of political instability that culminated in a military coup in August 2008. After the coup, the PRGF
was suspended; the price increases were reversed in November 2008.
The timing and magnitude of changes in the prices of petroleum products thus remained
discretionary and ad hoc. Prices of petroleum products were controlled by the government and set
according to a price structure and formula that was in principle to be adjusted monthly, whenever
changes in the international prices or the exchange rate exceeded +/-5 percent. In practice, the
authorities were reluctant to adjust retail prices. In particular, the government limited price increases
when international prices were high (e.g., in 2008), thus causing large losses for distribution
companies, and limited domestic price declines when international prices collapsed, thus allowing
petroleum companies to make up for past losses (e.g., in 2009).
The government made progress starting in 2011, supported by the ECF agreed after the
stabilization of the political situation. The government introduced in May 2012 a new diesel price
formula, agreed with petroleum distribution companies, following a simplified cost structure. The
reform met with relatively limited opposition, despite a price increase of more than 20 percent since
January 2011 and the lack of a real public communication strategy. However, unlike in the 2008
episode, the introduction of mitigating measures was an explicit component of the energy subsidy
reform strategy (see below). Technical assistance from the IMF fed into the policy dialogue. Despite
substantial increases in international fuel prices, the rigorous application of the new simplified
automatic fuel price formula on a biweekly basis helped bring domestic fuel prices up to
international levels by June 2012 (see Figure 6), which was a major achievement.
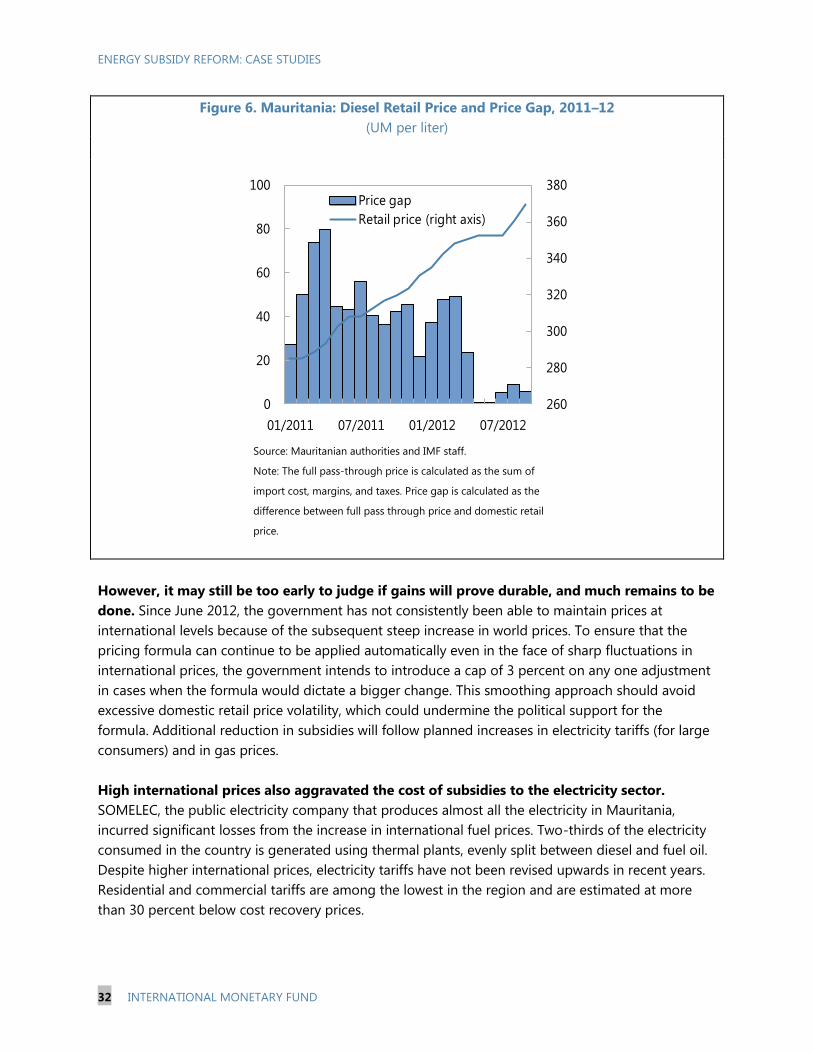
ENERGY SUBSIDY REFORM: CASE STUDIES
32 INTERNATIONAL MONETARY FUND
Figure 6. Mauritania: Diesel Retail Price and Price Gap, 2011–12
(UM per liter)
Source: Mauritanian authorities and IMF staff.
Note: The full pass-through price is calculated as the sum of
import cost, margins, and taxes. Price gap is calculated as the
difference between full pass through price and domestic retail
price.
However, it may still be too early to judge if gains will prove durable, and much remains to be
done. Since June 2012, the government has not consistently been able to maintain prices at
international levels because of the subsequent steep increase in world prices. To ensure that the
pricing formula can continue to be applied automatically even in the face of sharp fluctuations in
international prices, the government intends to introduce a cap of 3 percent on any one adjustment
in cases when the formula would dictate a bigger change. This smoothing approach should avoid
excessive domestic retail price volatility, which could undermine the political support for the
formula. Additional reduction in subsidies will follow planned increases in electricity tariffs (for large
consumers) and in gas prices.
High international prices also aggravated the cost of subsidies to the electricity sector.
SOMELEC, the public electricity company that produces almost all the electricity in Mauritania,
incurred significant losses from the increase in international fuel prices. Two-thirds of the electricity
consumed in the country is generated using thermal plants, evenly split between diesel and fuel oil.
Despite higher international prices, electricity tariffs have not been revised upwards in recent years.
Residential and commercial tariffs are among the lowest in the region and are estimated at more
than 30 percent below cost recovery prices.
260
280
300
320
340
360
380
0
20
40
60
80
100
01/2011 07/2011 01/2012 07/2012
Price gap
Retail price (right axis)
ENERGY SUBSIDY REFORM: CASE STUDIES
INTERNATIONAL MONETARY FUND 33
Supported by the ECF, the government also moved to address the electricity subsidies.
A restructuring plan was laid out with the help of the World Bank and the French Development
Agency (AFD). The government recapitalized SOMELEC, and clarified its financial relationship with it
by: (i) paying its electricity bills on time; (ii) providing SOMELEC with the required subsidy for its
operations at regular intervals throughout the year; and (iii) drawing out a plan for the settlement of
arrears accumulated through end-2010. Furthermore, electricity rates for the services sector were
aligned with the rates for medium-voltage electricity starting at the beginning of 2012. These
measures, together with a new credit line from the Islamic Development Bank, enabled the company
to significantly limit its recourse to bank borrowing at high interest rates, which were a drain on its
finances in the past. A tariff study, conducted by an international firm, will be completed in
November 2012 and will result in electricity rates being increased, particularly those paid by large
consumers. In addition, the authorities have called on a consulting firm to establish a performance
contract between SOMELEC and the government.
Mitigating measures
In 2011, the Mauritanian authorities introduced emergency relief measures to mitigate the
impact on the poor of higher international fuel prices and a drought, which led to a food
emergency. Unlike the 2008 emergency plan, the new package, which was worth about UM40
billion (3.4 percent of GDP) and was the largest in terms of GDP among the region‘s oil importers,
comprised mostly reversible measures (e.g., it did not include a raise in the wages of civil servants). It
was thus an improvement over earlier measures, and some social response by the government was
certainly needed.
However, the ECF-supported government program envisages substituting this temporary
program with permanent well-targeted social safety nets. The government plans to conduct a
full assessment of the existing drought-emergency program, particularly the functioning of the
―subsidized-food shops‖ programs, which were extended through the end of 2012. This food
subsidy program has not always been effective in reaching the poorest households in rural areas.
Moreover, with the worst of the drought‘s impact behind, there is an opportunity to gradually
remove most components of this emergency program, re-orienting the savings toward scaling up
well-targeted cash transfer schemes.
With the assistance of the World Food Program, a start has been made with such a cash
transfer program. This program, which was rapidly put in place, targets 10,000 vulnerable
households in Nouakchott identified through a recent poverty survey. Each household receives
UM 15,000 monthly (equivalent to half of the legal minimum wage) via a bank transfer. A positive
side effect is that beneficiaries thus also gain access to financial services. The program was extended
in June 2012 to 15,000 households in four rural areas deemed to have high food insecurity. The
agenda of scaling up such well-targeted cash transfer schemes should benefit from the expansion of
the vulnerability and poverty survey to provide nationwide coverage, as most of the poor are in rural
areas.
ENERGY SUBSIDY REFORM: CASE STUDIES
34 INTERNATIONAL MONETARY FUND
A broader social protection strategy developed with UNICEF will also further strengthen the
coverage of the social protection system and better protect the poor and vulnerable.
Accordingly, with the assistance of technical and financial partners, the authorities plan to
strengthen programs such as free school cafeterias, food-for-work, and support for pregnant
women. Moreover, recognizing the adverse effects of drought on food security, they are developing
a national food security strategy for the period 2015 to 2030 and an associated national investment
program.
Lessons
Depoliticizing fuel price adjustments as much as possible can help lock in initial price gains.
The automatic implementation of Mauritania‘s new diesel-price formula has been very effective in
keeping a lid on subsidies. Putting a cap on any one price change would ensure that large
international price fluctuations do not lead to excessive retail price volatility, which could undermine
political support for the automatic fuel price formula. At the same time, such price smoothing would
still allow domestic prices to follow the trend in international prices.
Too rapid a reduction of subsidies can generate opposition to reforms. The sudden, large price
increases in 2008 met with strong opposition, stimulated political instability, and ultimately had to
be rolled back. The absence of any mitigating social measures at the time exacerbated the situation.
Mitigating social measures can help address opposition to energy price increases and their
impact on the poor, but they should be well-targeted. Mauritania‘s recent cash-transfer schemes,
developed with assistance from the World Food Program, appear promising in this respect. In
contrast, the earlier emergency-relief programs were less well-targeted and not as effective.
Furthermore, care should be taken that temporary emergency programs do not become permanent
entitlements, draining fiscal resources. The absence of a fully-fledged communication campaign has
not been an obstacle to reforms in Mauritania so far. However, the authorities are well advised to
accompany energy subsidy reform by an explicit communication campaign that explains its benefits
to the population. Transparent reporting on the use of freed-up budget resources should also
increase public confidence in the outcome of the reform.
The linkages between fuel and electricity subsidy reform need to be explicitly recognized and
addressed. If a highly subsidized electricity sector uses large amounts of fuel, as in Mauritania, fuel
price increases can add to problems in the electricity sector. In the case of public sector electricity
utilities, reform should also be accompanied by the clarification of their financial relationship with
the government.
Involving donor partners specialized in other areas can increase the reforms’ chance of
success. In the Mauritanian case, the role of the World Food Program and UNICEF in the
development of social mitigation strategies was clearly helpful. The study on the restructuring of the
electricity sector and SOMELEC assisted by the World Bank and AFD was key in addressing electricity
subsidies.
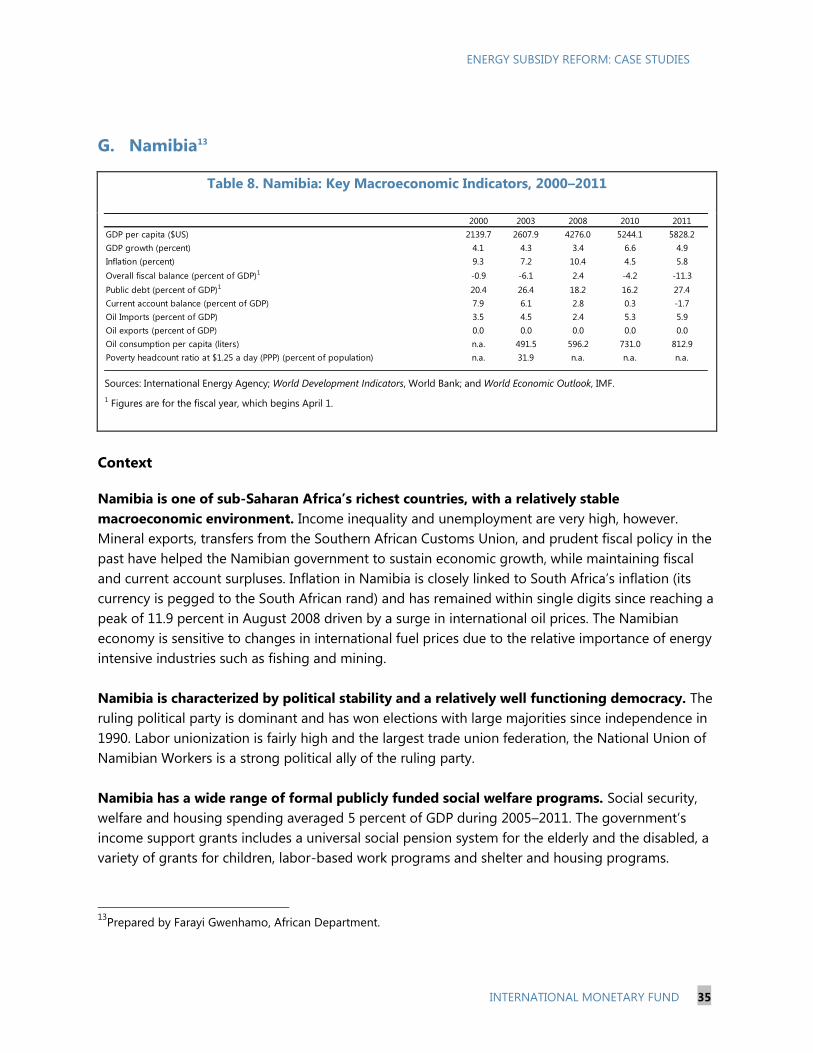
ENERGY SUBSIDY REFORM: CASE STUDIES
INTERNATIONAL MONETARY FUND 35
G. Namibia13
Table 8. Namibia: Key Macroeconomic Indicators, 2000–2011
Sources: International Energy Agency; World Development Indicators, World Bank; and World Economic Outlook, IMF.
1 Figures are for the fiscal year, which begins April 1.
Context
Namibia is one of sub-Saharan Africa’s richest countries, with a relatively stable
macroeconomic environment. Income inequality and unemployment are very high, however.
Mineral exports, transfers from the Southern African Customs Union, and prudent fiscal policy in the
past have helped the Namibian government to sustain economic growth, while maintaining fiscal
and current account surpluses. Inflation in Namibia is closely linked to South Africa‘s inflation (its
currency is pegged to the South African rand) and has remained within single digits since reaching a
peak of 11.9 percent in August 2008 driven by a surge in international oil prices. The Namibian
economy is sensitive to changes in international fuel prices due to the relative importance of energy
intensive industries such as fishing and mining.
Namibia is characterized by political stability and a relatively well functioning democracy. The
ruling political party is dominant and has won elections with large majorities since independence in
1990. Labor unionization is fairly high and the largest trade union federation, the National Union of
Namibian Workers is a strong political ally of the ruling party.
Namibia has a wide range of formal publicly funded social welfare programs. Social security,
welfare and housing spending averaged 5 percent of GDP during 2005–2011. The government‘s
income support grants includes a universal social pension system for the elderly and the disabled, a
variety of grants for children, labor-based work programs and shelter and housing programs.
13
Prepared by Farayi Gwenhamo, African Department.
2000 2003 2008 2010 2011
GDP per capita ($US) 2139.7 2607.9 4276.0 5244.1 5828.2
GDP growth (percent) 4.1 4.3 3.4 6.6 4.9
Inflation (percent) 9.3 7.2 10.4 4.5 5.8
Overall fiscal balance (percent of GDP)1 -0.9 -6.1 2.4 -4.2 -11.3
Public debt (percent of GDP)1 20.4 26.4 18.2 16.2 27.4
Current account balance (percent of GDP) 7.9 6.1 2.8 0.3 -1.7
Oil Imports (percent of GDP) 3.5 4.5 2.4 5.3 5.9
Oil exports (percent of GDP) 0.0 0.0 0.0 0.0 0.0
Oil consumption per capita (liters) n.a. 491.5 596.2 731.0 812.9
Poverty headcount ratio at $1.25 a day (PPP) (percent of population) n.a. 31.9 n.a. n.a. n.a.
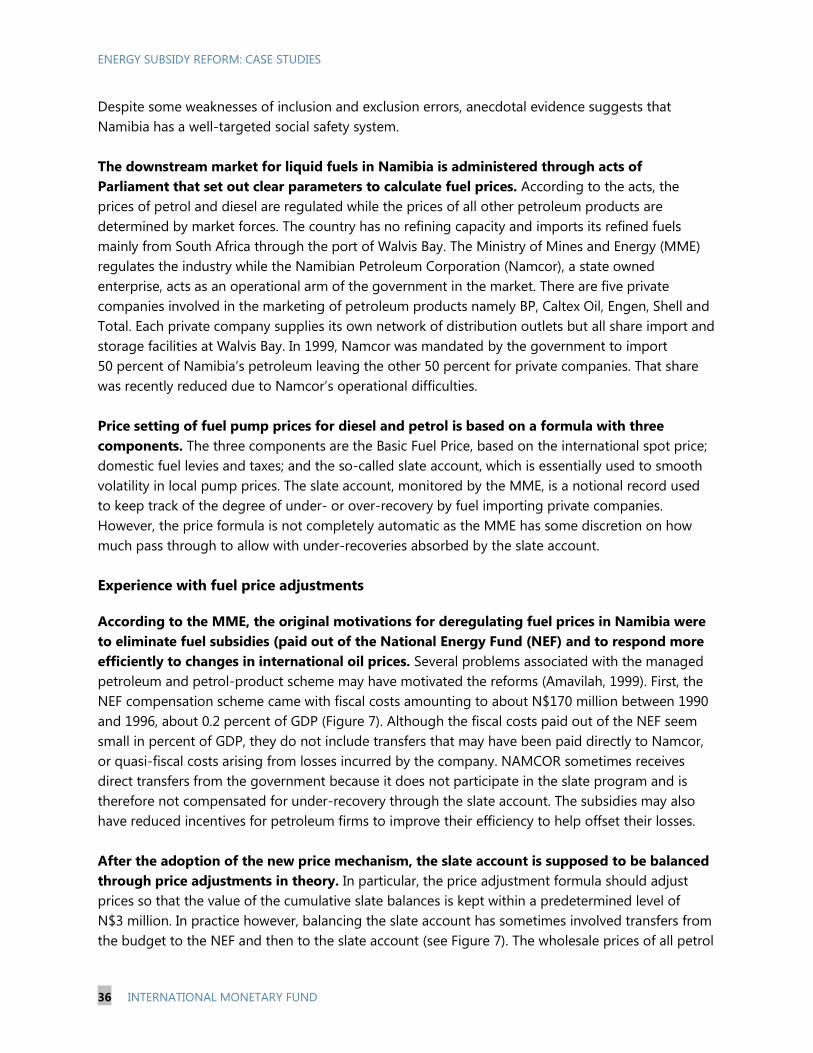
ENERGY SUBSIDY REFORM: CASE STUDIES
36 INTERNATIONAL MONETARY FUND
Despite some weaknesses of inclusion and exclusion errors, anecdotal evidence suggests that
Namibia has a well-targeted social safety system.
The downstream market for liquid fuels in Namibia is administered through acts of
Parliament that set out clear parameters to calculate fuel prices. According to the acts, the
prices of petrol and diesel are regulated while the prices of all other petroleum products are
determined by market forces. The country has no refining capacity and imports its refined fuels
mainly from South Africa through the port of Walvis Bay. The Ministry of Mines and Energy (MME)
regulates the industry while the Namibian Petroleum Corporation (Namcor), a state owned
enterprise, acts as an operational arm of the government in the market. There are five private
companies involved in the marketing of petroleum products namely BP, Caltex Oil, Engen, Shell and
Total. Each private company supplies its own network of distribution outlets but all share import and
storage facilities at Walvis Bay. In 1999, Namcor was mandated by the government to import
50 percent of Namibia‘s petroleum leaving the other 50 percent for private companies. That share
was recently reduced due to Namcor‘s operational difficulties.
Price setting of fuel pump prices for diesel and petrol is based on a formula with three
components. The three components are the Basic Fuel Price, based on the international spot price;
domestic fuel levies and taxes; and the so-called slate account, which is essentially used to smooth
volatility in local pump prices. The slate account, monitored by the MME, is a notional record used
to keep track of the degree of under- or over-recovery by fuel importing private companies.
However, the price formula is not completely automatic as the MME has some discretion on how
much pass through to allow with under-recoveries absorbed by the slate account.
Experience with fuel price adjustments
According to the MME, the original motivations for deregulating fuel prices in Namibia were
to eliminate fuel subsidies (paid out of the National Energy Fund (NEF) and to respond more
efficiently to changes in international oil prices. Several problems associated with the managed
petroleum and petrol-product scheme may have motivated the reforms (Amavilah, 1999). First, the
NEF compensation scheme came with fiscal costs amounting to about N$170 million between 1990
and 1996, about 0.2 percent of GDP (Figure 7). Although the fiscal costs paid out of the NEF seem
small in percent of GDP, they do not include transfers that may have been paid directly to Namcor,
or quasi-fiscal costs arising from losses incurred by the company. NAMCOR sometimes receives
direct transfers from the government because it does not participate in the slate program and is
therefore not compensated for under-recovery through the slate account. The subsidies may also
have reduced incentives for petroleum firms to improve their efficiency to help offset their losses.
After the adoption of the new price mechanism, the slate account is supposed to be balanced
through price adjustments in theory. In particular, the price adjustment formula should adjust
prices so that the value of the cumulative slate balances is kept within a predetermined level of
N$3 million. In practice however, balancing the slate account has sometimes involved transfers from
the budget to the NEF and then to the slate account (see Figure 7). The wholesale prices of all petrol
ENERGY SUBSIDY REFORM: CASE STUDIES
INTERNATIONAL MONETARY FUND 37
grades and diesel are published in a government gazette at each price adjustment. Tax revenue data
is published in budget documents.
Figure 7. Namibia: National Energy Fund and Slate Account, 1990–2011
(N$ million)
Resources devoted to smoothing out fuel prices experienced sharp swings over time.
Source: Bank of Namibia, Quarterly Bulletin, March 2005.
The MME used a structured, balanced and consultative approach to price deregulation and
subsidy removal. The National Energy Council, chaired by the Minister of Mines and Energy,
established the National Deregulation Task Force in 1996 to examine fuel price deregulation
through a consultative process. This culminated in the publication of the White Paper on Energy
Policy in 1998 articulating, among other issues, the importance of keeping targeted subsidies to
remote areas, gradual deregulation, and enhancing transparency in government fuel tax revenues.
The fuel price mechanism with quarterly price reviews was adopted in 1997.
NEF expenditures to cover subsidies only started to decline after 2001. That represented a full
three years after the release of the ―White Paper on Energy Policy,‖ an indication that the
implementation of fuel subsidy removal takes time. In addition, as shown by the slate balance in
Figure 7, close to full cost recovery by private firms only came after 2001.
Domestic fuel prices in Namibia increased steadily from 2003 onward and more than doubled
from early 2007 to a peak in July 2008. In response to the 2007–08 fuel price shocks, the
-350
-250
-150
-50
50
150
250
350
450
550
1990
1991
1992
1993
1994
1995
1996
1997
1998
1999
2000
2001
2002
2003
2004
2005
2006
2007
2008
2009
2010
2011
Income
Expenditure
Difference in NEF income and expenditure
Slate Balance
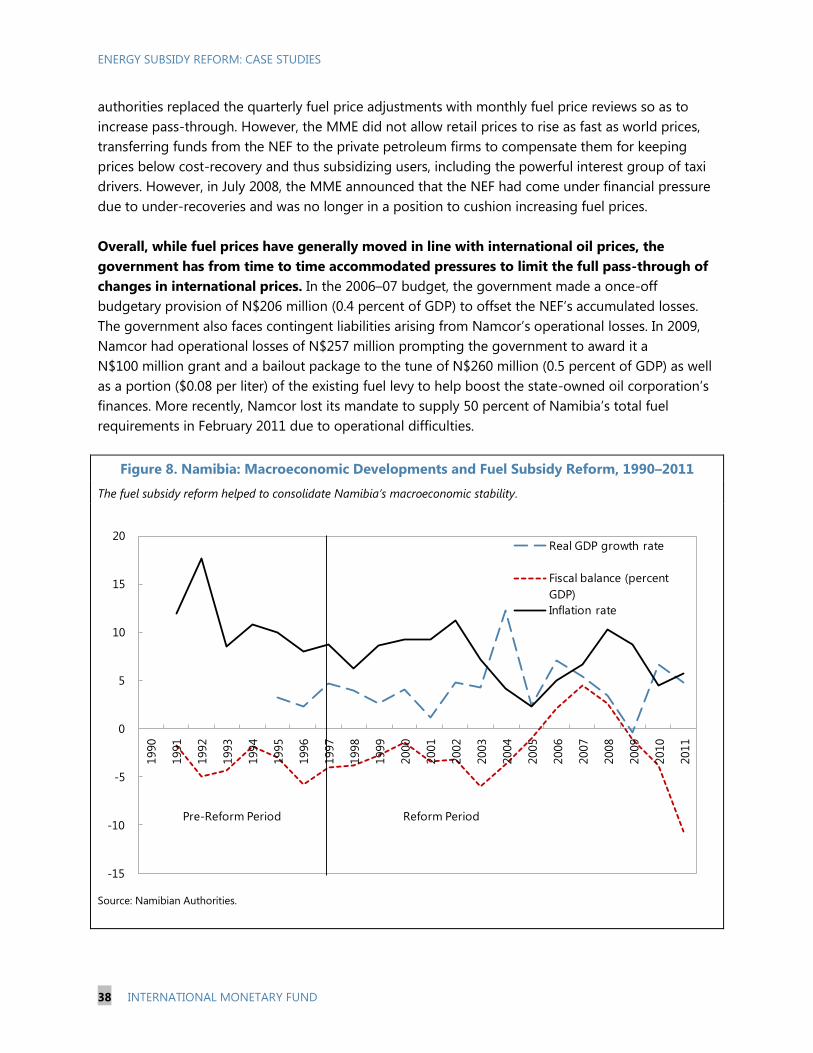
ENERGY SUBSIDY REFORM: CASE STUDIES
38 INTERNATIONAL MONETARY FUND
authorities replaced the quarterly fuel price adjustments with monthly fuel price reviews so as to
increase pass-through. However, the MME did not allow retail prices to rise as fast as world prices,
transferring funds from the NEF to the private petroleum firms to compensate them for keeping
prices below cost-recovery and thus subsidizing users, including the powerful interest group of taxi
drivers. However, in July 2008, the MME announced that the NEF had come under financial pressure
due to under-recoveries and was no longer in a position to cushion increasing fuel prices.
Overall, while fuel prices have generally moved in line with international oil prices, the
government has from time to time accommodated pressures to limit the full pass-through of
changes in international prices. In the 2006–07 budget, the government made a once-off
budgetary provision of N$206 million (0.4 percent of GDP) to offset the NEF‘s accumulated losses.
The government also faces contingent liabilities arising from Namcor‘s operational losses. In 2009,
Namcor had operational losses of N$257 million prompting the government to award it a
N$100 million grant and a bailout package to the tune of N$260 million (0.5 percent of GDP) as well
as a portion ($0.08 per liter) of the existing fuel levy to help boost the state-owned oil corporation‘s
finances. More recently, Namcor lost its mandate to supply 50 percent of Namibia‘s total fuel
requirements in February 2011 due to operational difficulties.
Figure 8. Namibia: Macroeconomic Developments and Fuel Subsidy Reform, 1990–2011
The fuel subsidy reform helped to consolidate Namibia’s macroeconomic stability.
Source: Namibian Authorities.
-15
-10
-5
0
5
10
15
20
1990
1991
1992
1993
1994
1995
1996
1997
1998
1999
2000
2001
2002
2003
2004
2005
2006
2007
2008
2009
2010
2011
Real GDP growth rate
Fiscal balance (percent
GDP)
Inflation rate
Pre-Reform Period Reform Period
ENERGY SUBSIDY REFORM: CASE STUDIES
INTERNATIONAL MONETARY FUND 39
Mitigating measures
The fuel price smoothing mechanism has been complemented by several mitigating measures
to address the increases in fuel prices. Unlike its SACU counterparts, Namibia did not experience
violent protests in response to rising fuel and food prices, although tax drivers complained when
fuel prices increased. This might be partly explained by the MME‘s fuel price smoothing mechanism
and other mitigating measures that were put in place in 2008 to address poverty and alleviate the
temporary impact of high fuel and food prices. Mitigating measures included a zero-rate
value-added tax on selected food items, rebate facilities for food importers, and a food distribution
program to feed the most vulnerable. In addition, rural pump prices are subsidized as part of the
socioeconomic policy of government. This is achieved by subsidizing transportation costs to remote
areas to ensure that the pump price in remote areas is not inflated by retailers‘ transport costs.
Claims on actual road deliveries are submitted by the oil companies to the MME for reimbursement
from the NEF.
Lessons
Comprehensive planning and gradual implementation were key to success. The Namibian
authorities undertook comprehensive planning, which included broad consultation with civil society,
culminating in a comprehensive reform plan that retained a targeted subsidy for remote areas.
Reforms were implemented gradually, allowing enough time for consensus building between the
government and various stakeholders.
Price adjustments that employed smoothing mechanisms helped prevent social unrest. The
reform established a quarterly (later monthly) price adjustment mechanism in line with changes in
international prices but incorporating a price smoothing mechanism to avoid sharp price
adjustments. This, along with the introduction of other mitigating measures, allowed Namibia to
manage the large price shocks of 2008 and 2011 with no social unrest.
De-politicization of the price adjustment mechanism has been made difficult by legal
obligations to the state-owned energy company. The legally stipulated participation of the state
petroleum company in the importation and supply of petroleum products seems to have prevented
a full de-politicization of the price adjustment mechanism (i.e., allowing prolonged
under-recoveries). This in turn has resulted in large losses for the company that have had to be
covered by fiscal transfers. This suggests the need to carefully design price smoothing mechanisms.
References
Bank of Namibia, 2005, Quarterly Bulletin, Vol. 14, No 1. (March).
Deutsche Gesellschaft für Internationale Zusammenarbeit, 2009, International Fuel Prices 2009:
6th
Edition (Bonn and Berlin).
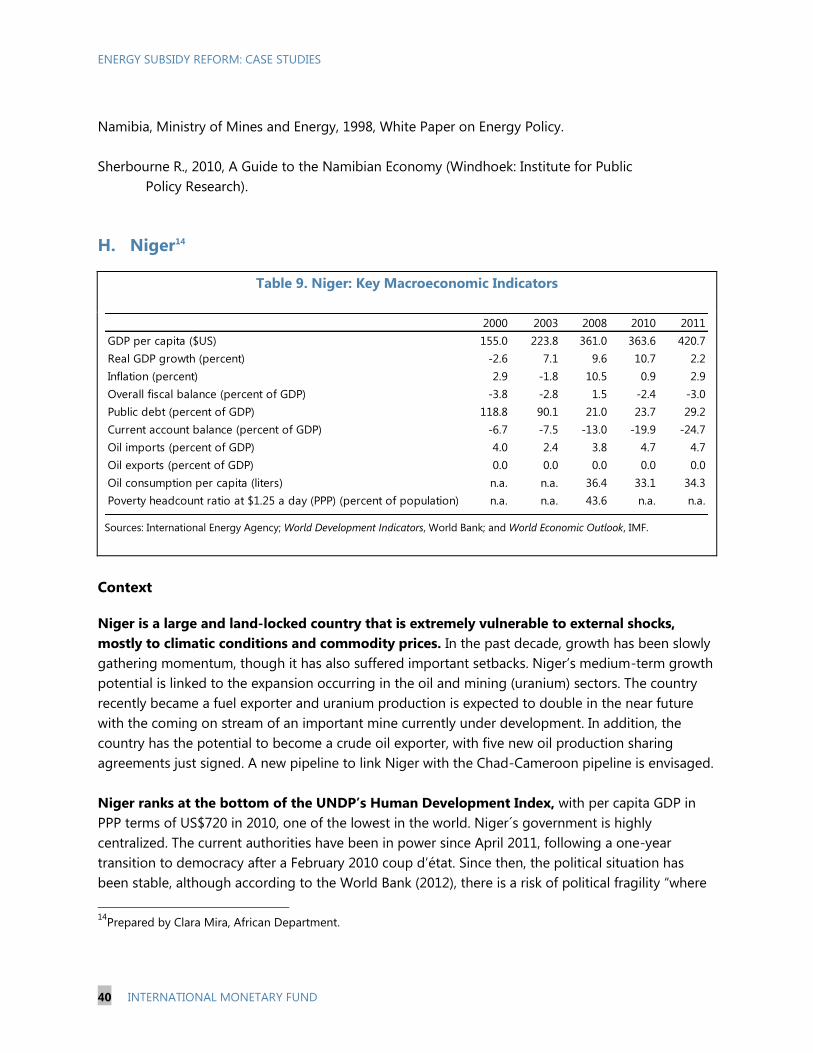
ENERGY SUBSIDY REFORM: CASE STUDIES
40 INTERNATIONAL MONETARY FUND
Namibia, Ministry of Mines and Energy, 1998, White Paper on Energy Policy.
Sherbourne R., 2010, A Guide to the Namibian Economy (Windhoek: Institute for Public
Policy Research).
H. Niger14
Table 9. Niger: Key Macroeconomic Indicators
Sources: International Energy Agency; World Development Indicators, World Bank; and World Economic Outlook, IMF.
Context
Niger is a large and land-locked country that is extremely vulnerable to external shocks,
mostly to climatic conditions and commodity prices. In the past decade, growth has been slowly
gathering momentum, though it has also suffered important setbacks. Niger‘s medium-term growth
potential is linked to the expansion occurring in the oil and mining (uranium) sectors. The country
recently became a fuel exporter and uranium production is expected to double in the near future
with the coming on stream of an important mine currently under development. In addition, the
country has the potential to become a crude oil exporter, with five new oil production sharing
agreements just signed. A new pipeline to link Niger with the Chad-Cameroon pipeline is envisaged.
Niger ranks at the bottom of the UNDP’s Human Development Index, with per capita GDP in
PPP terms of US$720 in 2010, one of the lowest in the world. Niger´s government is highly
centralized. The current authorities have been in power since April 2011, following a one-year
transition to democracy after a February 2010 coup d‘état. Since then, the political situation has
been stable, although according to the World Bank (2012), there is a risk of political fragility ―where
14
Prepared by Clara Mira, African Department.
2000 2003 2008 2010 2011
GDP per capita ($US) 155.0 223.8 361.0 363.6 420.7
Real GDP growth (percent) -2.6 7.1 9.6 10.7 2.2
Inflation (percent) 2.9 -1.8 10.5 0.9 2.9
Overall fiscal balance (percent of GDP) -3.8 -2.8 1.5 -2.4 -3.0
Public debt (percent of GDP) 118.8 90.1 21.0 23.7 29.2
Current account balance (percent of GDP) -6.7 -7.5 -13.0 -19.9 -24.7
Oil imports (percent of GDP) 4.0 2.4 3.8 4.7 4.7
Oil exports (percent of GDP) 0.0 0.0 0.0 0.0 0.0
Oil consumption per capita (liters) n.a. n.a. 36.4 33.1 34.3
Poverty headcount ratio at $1.25 a day (PPP) (percent of population) n.a. n.a. 43.6 n.a. n.a.
ENERGY SUBSIDY REFORM: CASE STUDIES
INTERNATIONAL MONETARY FUND 41
failure of the government to deliver tangible results could result quickly in the loss of popular
support and a political stalemate.‖
With the start of operations of its new oil refinery (SORAZ), fuel imports have come nearly to
a halt since early 2012. Niger was an oil importer until end-2011. Its market size is small, with
annual domestic consumption of about 7,000 barrels a day. The state-owned company SONIDEP has
a monopoly on imports and distribution. The new refinery is expected to reach a maximum capacity
of 20,000 barrels per day of fuel including gasoline, diesel and LPG. About one third of the
petroleum products produced by SORAZ feed the domestic market, with the remainder being
exported. SONIDEP is in charge of marketing the petroleum products.
This case study focuses on the period until end-2011, the period in which Niger was an oil
importer. It builds on IMF technical assistance support provided to Niger in 2001 to elaborate a
pricing formula akin to a full pass-through rule for the automatic adjustment of the price of
imported petroleum products. In 2010, a note was prepared by the Fiscal Affairs Department to
support the authorities in their intention to eliminate the post-tax fuel subsidies, in the context of
discussions with the IMF to prepare an assessment letter.
Experience with fuel price adjustments
According to the formula established with the help of technical assistance from the IMF in
2001, automatic pass-through of international prices would be achieved through a flexible,
transparent, and automatic mechanism. The retail price would be adjusted monthly whenever the
change in international prices was above CFAF 5. Otherwise, the price at the pump would not
change and taxes would counteract the increase or decrease in prices. The pricing formula included:
fuel import costs (CIF import price at the port); estimated costs and margins of importing and
distributing fuel to domestic consumers (storage and distribution margins); and net fuel taxes
(ad-valorem customs and value-added taxes and specific excise taxes). A multi-sectoral body was
envisaged to be statutorily in charge of applying the formula; however, such a body was never
created.
As international prices started to increase in 2005, an explicit subsidy component was
introduced in the formula. The subsidy was initially used to smooth domestic prices. Then, as
international import prices increased rapidly and steadily up to mid 2008, the subsidy component
rose in order to keep domestic retail prices fixed for extended periods. The increase in international
prices and the depreciation of the euro resulted in a significant increase in the subsidies in 2010.
Since fuel prices were substantially lower in Niger than in some neighboring countries, increased
smuggling contributed to a strong rise in fuel imports.
Changes in import prices without corresponding pass-through to retail prices resulted in a
reduction of government tax revenue from fuels. The net fiscal contribution of fuel taxes
decreased from 1 percent of GDP in 2005 to 0.6 percent in 2009, and to 0.3 in 2010. The cost of the
subsidy on petroleum products amounted to more than 1 percent of GDP. While this pattern applies
ENERGY SUBSIDY REFORM: CASE STUDIES
42 INTERNATIONAL MONETARY FUND
to all products, the tax decline in the case of gasoline was more pronounced, going from a peak of
0.8 percent of GDP in 2005 to 0.3 percent of GDP in 2009. Net taxes on diesel also declined from
0.3 percent of GDP in 2005 to 0.2 percent of GDP in 2009. The net tax on kerosene has been
continuously negative over this period, although the fiscal cost of this measure has been limited, as
the share of kerosene consumption is fairly low.
As the subsidy reached unsustainable levels, the authorities decided to start implementing a
strategy to gradually phase out subsidies. The size of the subsidy, together with its very
regressive distributional impact, was a critical factor in the authorities‘ decision to eliminate it.
Indeed, the population groups that benefited more from the subsidy were the higher income
groups, who consumed more gasoline. While this is particularly the case in gasoline consumption, it
is less so in kerosene and lamp oil, which are more widely consumed by lower-income groups. Fuel
prices were increased by 12 percent in mid-2010 (Figures 9 and 10).15
The agreed reform contained two steps. First, international oil price variations would be passed
through to domestic prices starting in June 2011. Second, the existing subsidy would be gradually
unwound over the following 12–18 months. Fuel prices were increased by about 8 percent in mid-
2011. As a result, the subsidy was significantly reduced, though not completely eliminated, and the
total amount devoted to fuel subsidies in 2011 was kept below the 2010 level (1.1 percent of GDP).
Country-specific circumstances and the political situation played key roles in the design and
pace of the reform. First, the imminent start of domestic fuel production introduced urgency in the
phasing out of the subsidies. The authorities thought that it would have been politically
unacceptable to increase prices exactly when domestic production was starting. In fact, the society
was expecting rather the opposite: a decrease in fuel prices with the start of domestic production.
Second, the initial reforms (in late 2010 and early 2011) were implemented by a transitional
government that believed it had less legitimacy to embark on such a sensitive reform process.
To increase public awareness about the dimension of the problem, for the first time the
budget explicitly reflected the costs of the subsidy. This helped create an appropriate
environment for the subsidy‘s elimination. In addition, and to help overcome vested interests and
gain support from the civil society, the government introduced public information campaigns
pointing out the regressive nature of the subsidies and linking the savings from petroleum price
increases to priority social spending.
The authorities opted for a consensual approach to the reform, incorporating all relevant
shareholders. They established a committee (the Comité du Differé) to discuss the best way to
15
Weighted average of the prices of gasoline, kerosene, and diesel. Full pass-through includes import prices, taxes,
and margins in the formula. In both cases, price increases were considered preconditions for the IMF to issue an
assessment letter, and to proceed with the ECF-supported program review.
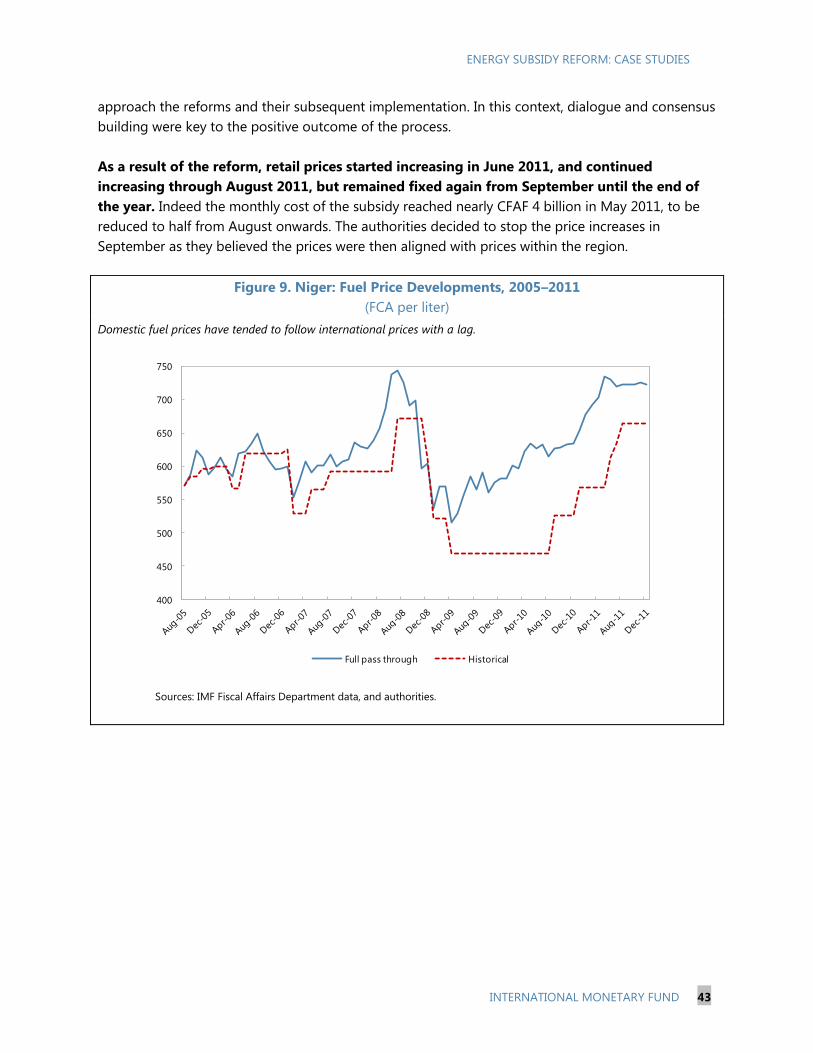
ENERGY SUBSIDY REFORM: CASE STUDIES
INTERNATIONAL MONETARY FUND 43
approach the reforms and their subsequent implementation. In this context, dialogue and consensus
building were key to the positive outcome of the process.
As a result of the reform, retail prices started increasing in June 2011, and continued
increasing through August 2011, but remained fixed again from September until the end of
the year. Indeed the monthly cost of the subsidy reached nearly CFAF 4 billion in May 2011, to be
reduced to half from August onwards. The authorities decided to stop the price increases in
September as they believed the prices were then aligned with prices within the region.
Figure 9. Niger: Fuel Price Developments, 2005–2011
(FCA per liter)
Domestic fuel prices have tended to follow international prices with a lag.
Sources: IMF Fiscal Affairs Department data, and authorities.
400
450
500
550
600
650
700
750
Full pass through Historical
Sources: IMF FAD data, and Authorities
Full pass -through vs. historical retail prices
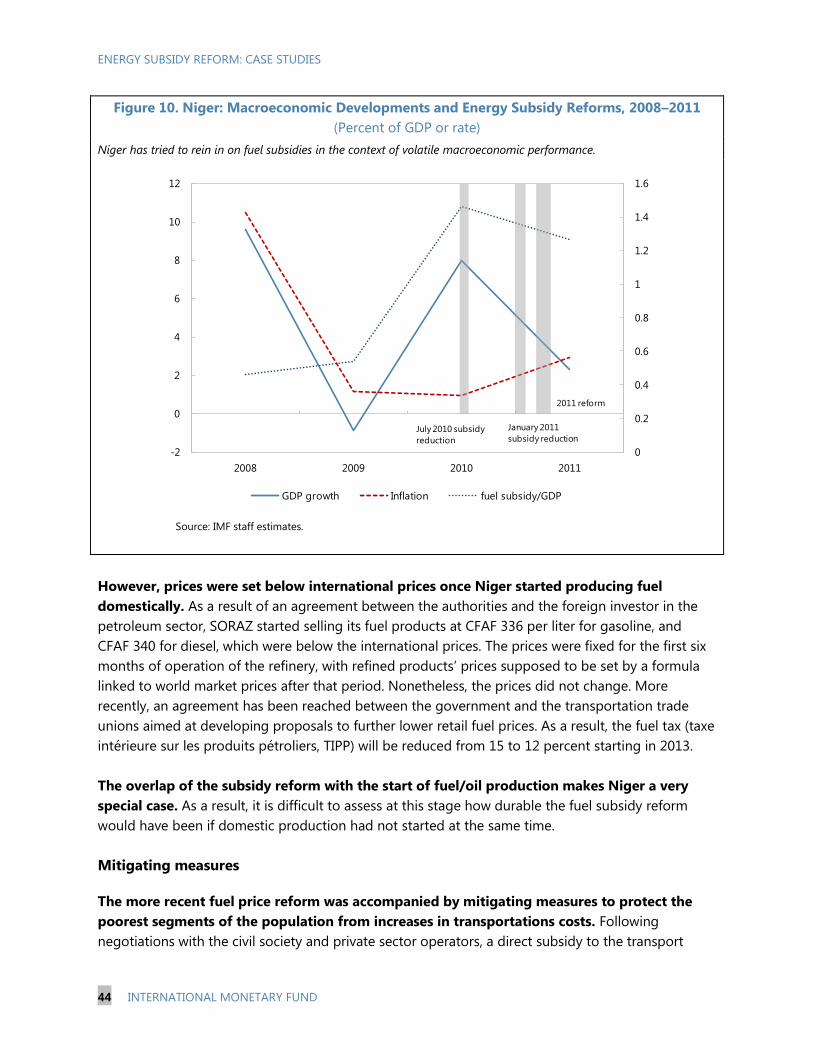
ENERGY SUBSIDY REFORM: CASE STUDIES
44 INTERNATIONAL MONETARY FUND
Figure 10. Niger: Macroeconomic Developments and Energy Subsidy Reforms, 2008–2011
(Percent of GDP or rate)
Niger has tried to rein in on fuel subsidies in the context of volatile macroeconomic performance.
Source: IMF staff estimates.
However, prices were set below international prices once Niger started producing fuel
domestically. As a result of an agreement between the authorities and the foreign investor in the
petroleum sector, SORAZ started selling its fuel products at CFAF 336 per liter for gasoline, and
CFAF 340 for diesel, which were below the international prices. The prices were fixed for the first six
months of operation of the refinery, with refined products‘ prices supposed to be set by a formula
linked to world market prices after that period. Nonetheless, the prices did not change. More
recently, an agreement has been reached between the government and the transportation trade
unions aimed at developing proposals to further lower retail fuel prices. As a result, the fuel tax (taxe
intérieure sur les produits pétroliers, TIPP) will be reduced from 15 to 12 percent starting in 2013.
The overlap of the subsidy reform with the start of fuel/oil production makes Niger a very
special case. As a result, it is difficult to assess at this stage how durable the fuel subsidy reform
would have been if domestic production had not started at the same time.
Mitigating measures
The more recent fuel price reform was accompanied by mitigating measures to protect the
poorest segments of the population from increases in transportations costs. Following
negotiations with the civil society and private sector operators, a direct subsidy to the transport
0
0.2
0.4
0.6
0.8
1
1.2
1.4
1.6
-2
0
2
4
6
8
10
12
2008 2009 2010 2011
GDP growth Inflation fuel subsidy/GDP
Macroeconomic Developments and
Energy Subsidy Reforms
(percent of GDP or rate)
2011 reform
July 2010 subsidy
reduction
January 2011
subsidy reduction
ENERGY SUBSIDY REFORM: CASE STUDIES
INTERNATIONAL MONETARY FUND 45
sector was introduced (tickets modérateurs), as this sector was the most affected by the increase and
the poorer sectors of the population were the ones that used more public transport.
The costs of the subsidy policy were still reduced significantly since the costs of the
mitigating measures (less than 0.1 percent of GDP) were significantly lower than the subsidy
itself. The discontinuation of the subsidy on fuel products created room for a 19 percent increase in
social spending in the 2012 budget compared to 2011, with particular emphasis on investment in
education. The public wage bill was increased to accommodate the recruitment of 4,000 teachers in
early 2012.
Lessons
There is a need to appropriately understand the extent of the fuel subsidy problem.
Determining the distributional incidence of the subsidies can also help to ensure commitment to the
reform.
Promoting an understanding of the issues by society as a whole is important. Being transparent
about the costs of the subsidy by an explicit budget line proved very useful in Niger.
An adequate public information campaign also played a crucial role in ensuring the support
of the society for reform. In Niger, there were debates on TV and radio about this issue.
A participative approach is valuable. Adopting a participative approach to decision-making was
also useful, particularly through the establishment of an ad-hoc and inclusive committee.
Sufficient time needs to be allowed to build support. There is a need for sufficient time to
explain, negotiate, and implement the reform. Building reform momentum, stakeholders‘ consensus
and social support requires time. In the case of Niger, ensuring that all stakeholders were on board
and agreed with the main elements of the reform took about six months.
Engaging financial partners can be helpful. Engaging partners can help to ensure that there is
sufficient information about the problem and put pressure to launch the reform process. A delicate
equilibrium needs to be reached between encouragement and ownership of the reform process.
Ensuring that mitigating measures reach the most affected groups is crucial. These measures
can take the form of targeted subsidies based on a detailed analysis of who would be the most
affected vulnerable groups.
Fuel subsidy reform becomes more complicated when a country becomes an oil exporter. At
such times, it might be more difficult to resist the expectations and pressures from civil society to
significantly lower pump prices.
ENERGY SUBSIDY REFORM: CASE STUDIES
46 INTERNATIONAL MONETARY FUND
References
International Monetary Fund, 2001, ―Niger,‖ Country Report No. 02/35 (Washington). Available via
the Internet: http://www.imf.org/external/pubs/ft/scr/2002/cr0235.pdf.
______, 2004, ―Niger,‖ Country Report No. 04/275 (Washington). Available via the Internet:
http://www.imf.org/external/pubs/ft/scr/2004/cr04275.pdf.
______, 2010a, ―Adopting an Automatic Fuel Pricing Mechanism in Niger,‖ FAD Technical Assistance
report prepared by David Coady, Anita Tuladhar, Javier Arze Del Granado, Luc Eyraud, and
Lilla Nemeth (Washington).
______, 2010b, Assessment Letter for the European Union and African Development Bank, August 20
(Washington).
______, 2011a, ―Niger,‖ Country Report No. 11/357 (Washington). Available via the Internet:
http://www.imf.org/external/pubs/ft/scr/2011/cr11357.pdf.
______, 2011b, ―Niger,‖ Country Report No. 11/358 (Washington). Available via the Internet:
http://www.imf.org/external/pubs/ft/scr/2011/cr11358.pdf.
______, 2011c, Assessment Letter for the World Bank and the European Union, June 2 (Washington).
______, 2012, ―Nigeria,‖ Country Report No. 12/109 (Washington). Available via the Internet:
http://www.imf.org/external/pubs/ft/scr/2012/cr12109.pdf.
World Bank, 2012, Proposed Credit in the Amount of SDR 32.3 million (US$50 million equivalent) to
the Republic of Niger for a first Shared Growth Credit, Report No. 69131-NE, May 31
(Washington).
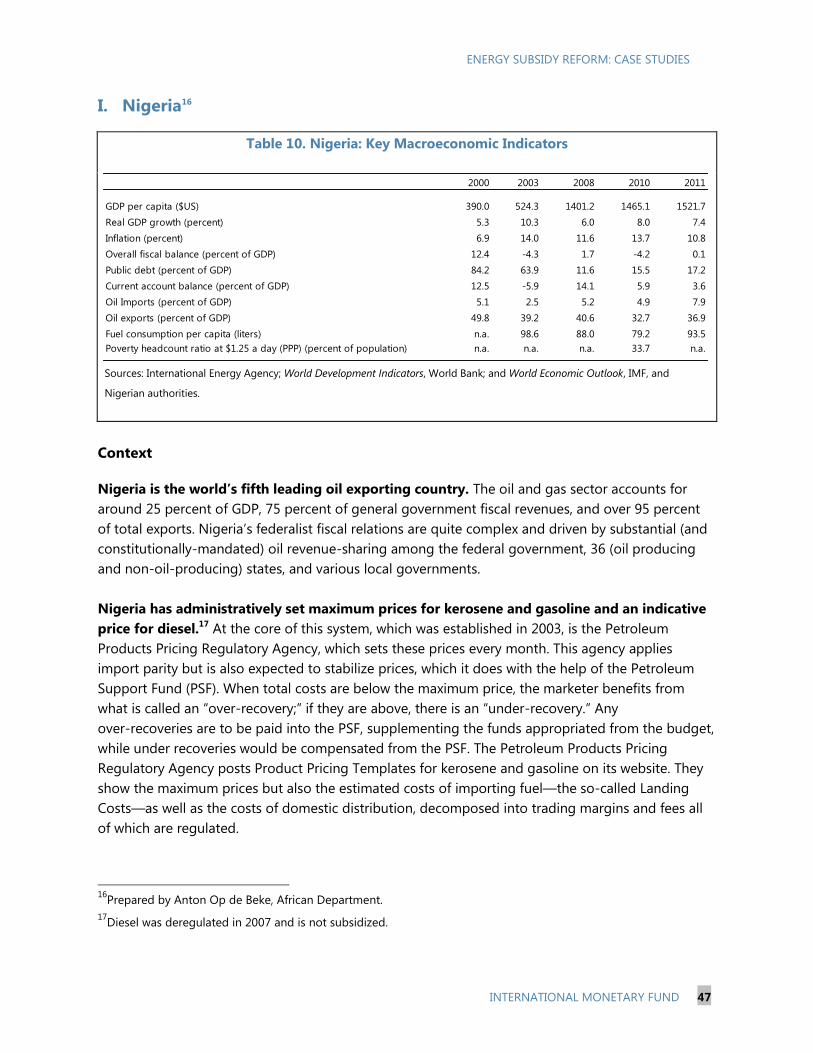
ENERGY SUBSIDY REFORM: CASE STUDIES
INTERNATIONAL MONETARY FUND 47
I. Nigeria16
Table 10. Nigeria: Key Macroeconomic Indicators
Sources: International Energy Agency; World Development Indicators, World Bank; and World Economic Outlook, IMF, and
Nigerian authorities.
Context
Nigeria is the world’s fifth leading oil exporting country. The oil and gas sector accounts for
around 25 percent of GDP, 75 percent of general government fiscal revenues, and over 95 percent
of total exports. Nigeria‘s federalist fiscal relations are quite complex and driven by substantial (and
constitutionally-mandated) oil revenue-sharing among the federal government, 36 (oil producing
and non-oil-producing) states, and various local governments.
Nigeria has administratively set maximum prices for kerosene and gasoline and an indicative
price for diesel.17
At the core of this system, which was established in 2003, is the Petroleum
Products Pricing Regulatory Agency, which sets these prices every month. This agency applies
import parity but is also expected to stabilize prices, which it does with the help of the Petroleum
Support Fund (PSF). When total costs are below the maximum price, the marketer benefits from
what is called an ―over-recovery;‖ if they are above, there is an ―under-recovery.‖ Any
over-recoveries are to be paid into the PSF, supplementing the funds appropriated from the budget,
while under recoveries would be compensated from the PSF. The Petroleum Products Pricing
Regulatory Agency posts Product Pricing Templates for kerosene and gasoline on its website. They
show the maximum prices but also the estimated costs of importing fuel—the so-called Landing
Costs—as well as the costs of domestic distribution, decomposed into trading margins and fees all
of which are regulated.
16
Prepared by Anton Op de Beke, African Department.
17Diesel was deregulated in 2007 and is not subsidized.
2000 2003 2008 2010 2011
GDP per capita ($US) 390.0 524.3 1401.2 1465.1 1521.7
Real GDP growth (percent) 5.3 10.3 6.0 8.0 7.4
Inflation (percent) 6.9 14.0 11.6 13.7 10.8
Overall fiscal balance (percent of GDP) 12.4 -4.3 1.7 -4.2 0.1
Public debt (percent of GDP) 84.2 63.9 11.6 15.5 17.2
Current account balance (percent of GDP) 12.5 -5.9 14.1 5.9 3.6
Oil Imports (percent of GDP) 5.1 2.5 5.2 4.9 7.9
Oil exports (percent of GDP) 49.8 39.2 40.6 32.7 36.9
Fuel consumption per capita (liters) n.a. 98.6 88.0 79.2 93.5
Poverty headcount ratio at $1.25 a day (PPP) (percent of population) n.a. n.a. n.a. 33.7 n.a.
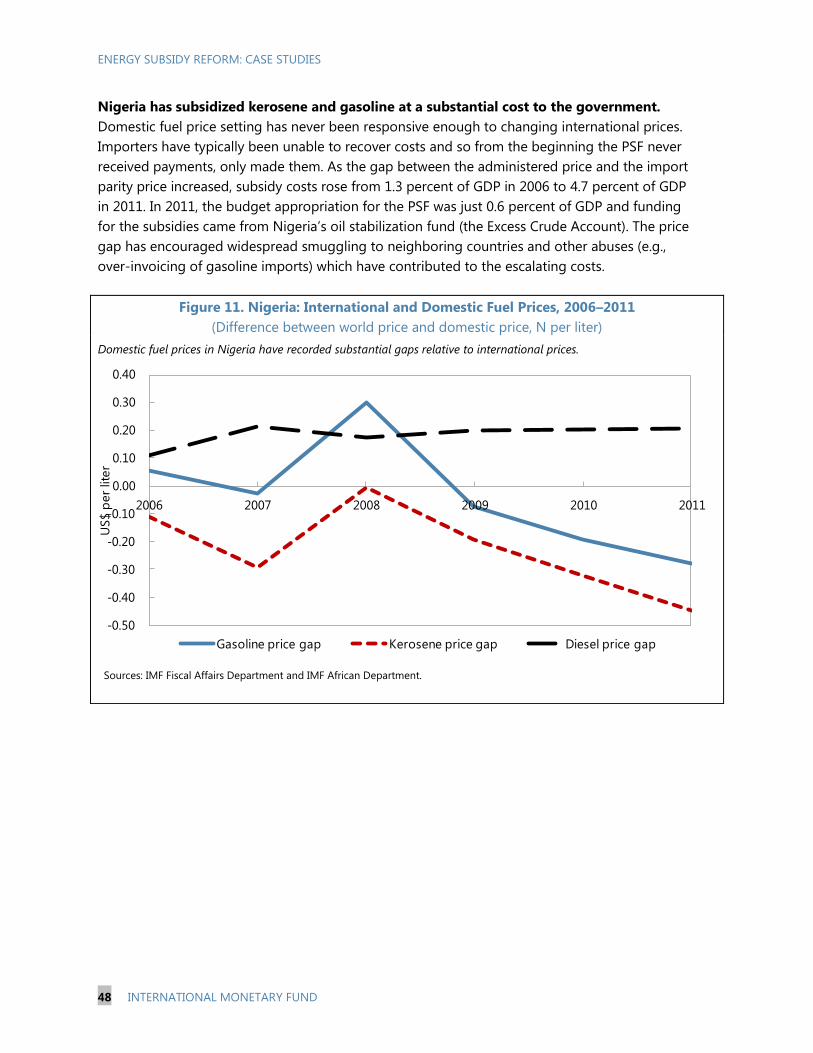
ENERGY SUBSIDY REFORM: CASE STUDIES
48 INTERNATIONAL MONETARY FUND
Nigeria has subsidized kerosene and gasoline at a substantial cost to the government.
Domestic fuel price setting has never been responsive enough to changing international prices.
Importers have typically been unable to recover costs and so from the beginning the PSF never
received payments, only made them. As the gap between the administered price and the import
parity price increased, subsidy costs rose from 1.3 percent of GDP in 2006 to 4.7 percent of GDP
in 2011. In 2011, the budget appropriation for the PSF was just 0.6 percent of GDP and funding
for the subsidies came from Nigeria‘s oil stabilization fund (the Excess Crude Account). The price
gap has encouraged widespread smuggling to neighboring countries and other abuses (e.g.,
over-invoicing of gasoline imports) which have contributed to the escalating costs.
Figure 11. Nigeria: International and Domestic Fuel Prices, 2006–2011
(Difference between world price and domestic price, N per liter)
Domestic fuel prices in Nigeria have recorded substantial gaps relative to international prices.
Sources: IMF Fiscal Affairs Department and IMF African Department.
-0.50
-0.40
-0.30
-0.20
-0.10
0.00
0.10
0.20
0.30
0.40
2006 2007 2008 2009 2010 2011
US$ p
er
lite
r
Gasoline price gap Kerosene price gap Diesel price gap
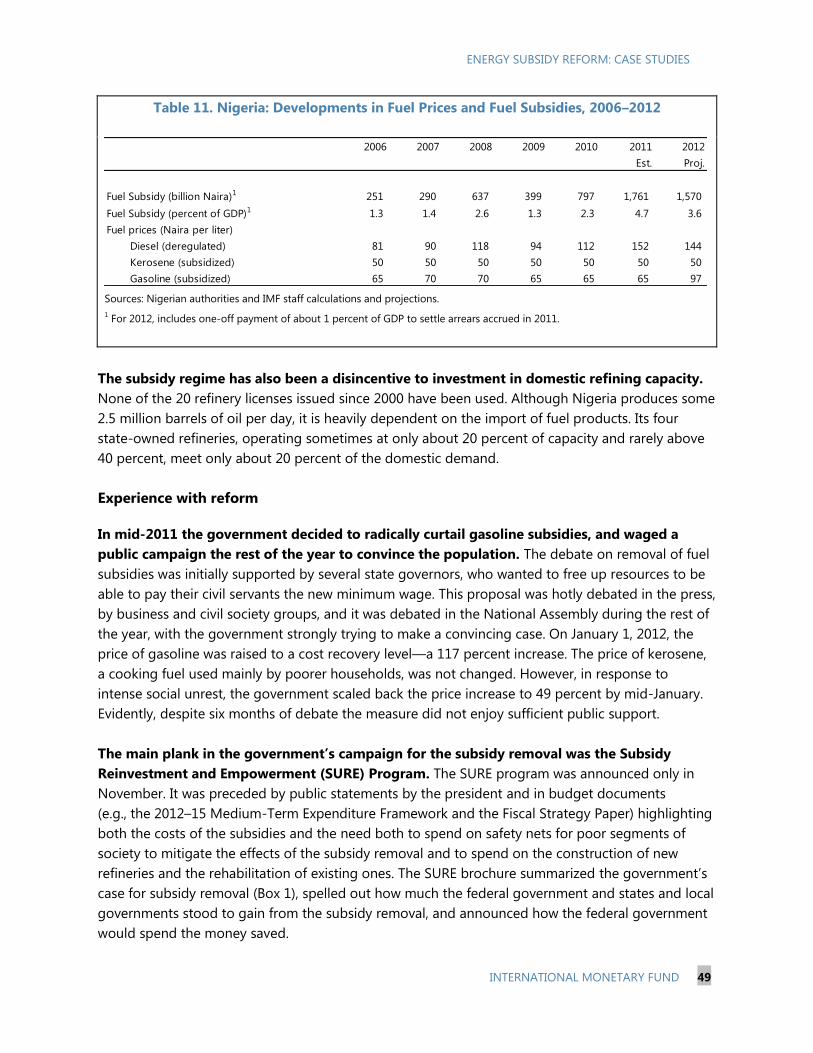
ENERGY SUBSIDY REFORM: CASE STUDIES
INTERNATIONAL MONETARY FUND 49
Table 11. Nigeria: Developments in Fuel Prices and Fuel Subsidies, 2006–2012
Sources: Nigerian authorities and IMF staff calculations and projections.
1 For 2012, includes one-off payment of about 1 percent of GDP to settle arrears accrued in 2011.
The subsidy regime has also been a disincentive to investment in domestic refining capacity.
None of the 20 refinery licenses issued since 2000 have been used. Although Nigeria produces some
2.5 million barrels of oil per day, it is heavily dependent on the import of fuel products. Its four
state-owned refineries, operating sometimes at only about 20 percent of capacity and rarely above
40 percent, meet only about 20 percent of the domestic demand.
Experience with reform
In mid-2011 the government decided to radically curtail gasoline subsidies, and waged a
public campaign the rest of the year to convince the population. The debate on removal of fuel
subsidies was initially supported by several state governors, who wanted to free up resources to be
able to pay their civil servants the new minimum wage. This proposal was hotly debated in the press,
by business and civil society groups, and it was debated in the National Assembly during the rest of
the year, with the government strongly trying to make a convincing case. On January 1, 2012, the
price of gasoline was raised to a cost recovery level—a 117 percent increase. The price of kerosene,
a cooking fuel used mainly by poorer households, was not changed. However, in response to
intense social unrest, the government scaled back the price increase to 49 percent by mid-January.
Evidently, despite six months of debate the measure did not enjoy sufficient public support.
The main plank in the government’s campaign for the subsidy removal was the Subsidy
Reinvestment and Empowerment (SURE) Program. The SURE program was announced only in
November. It was preceded by public statements by the president and in budget documents
(e.g., the 2012–15 Medium-Term Expenditure Framework and the Fiscal Strategy Paper) highlighting
both the costs of the subsidies and the need both to spend on safety nets for poor segments of
society to mitigate the effects of the subsidy removal and to spend on the construction of new
refineries and the rehabilitation of existing ones. The SURE brochure summarized the government‘s
case for subsidy removal (Box 1), spelled out how much the federal government and states and local
governments stood to gain from the subsidy removal, and announced how the federal government
would spend the money saved.
2006 2007 2008 2009 2010 2011 2012
Est. Proj.
Fuel Subsidy (billion Naira)1 251 290 637 399 797 1,761 1,570
Fuel Subsidy (percent of GDP)1 1.3 1.4 2.6 1.3 2.3 4.7 3.6
Fuel prices (Naira per liter)
Diesel (deregulated) 81 90 118 94 112 152 144
Kerosene (subsidized) 50 50 50 50 50 50 50
Gasoline (subsidized) 65 70 70 65 65 65 97
ENERGY SUBSIDY REFORM: CASE STUDIES
50 INTERNATIONAL MONETARY FUND
Box 1. Nigeria: Rationale for Subsidy Removal
The government summarized its case for subsidy removal in the SURE brochure:
Fixed prices have led to a huge unsustainable subsidy burden.
Fuel subsidies do not reach intended beneficiaries, and they benefit the rich mostly.
Subsidy administration has been beset with inefficiencies, leakages, and corruption.
Subsidy costs have diverted resources away from investment in critical infrastructure.
Subsidies have discouraged competition and stifled private investment in downstream petroleum.
Huge price disparity has encouraged smuggling to neighboring countries.
According to the SURE brochure, savings from the removal of the fuel subsidy would be
channeled into ―a combination of programs to stimulate the economy and alleviate poverty
through critical infrastructure and safety net projects.‖ Capital projects would be selected in line
with the government‘s Vision 20:2020 development strategy, in the power, roads, transportation,
water, and downstream petroleum sectors. The potential impact of the subsidy removal on the poor
would be mitigated ―through properly targeted safety net programs.‖ The SURE brochure provided
details on the various projects and programs to be undertaken, from the specific road segments to
be built to the maternal and child health services to be upgraded.
The SURE program envisaged the creation of a specific subsidy savings fund to finance its
spending initiatives. The fund itself and the specific spending programs would be overseen by an
18-person board, with a chair appointed by the president and including only four government
representatives, and other members made up of respected individuals from a wide cross-section of
civil society. The board would seek technical assistance from internationally reputed consulting
firms, while an independent body would report to the board directly on implementation.18
Government’s attempts to win support for its subsidy reform met with strong opposition
from powerful sectors of society. In early December 2011, the National Assembly came out
against the removal of the gasoline subsidy, claiming that the measure was premature and not
supported by firm data underpinning the size and incidence of the subsidies. In response, the
Ministry of Finance presented a Brief on Fuel Subsidies, laying out once again the case for removal,
and supporting it with data on the explosive growth of the subsidies and comparing their costs with
18
President Goodluck officially inaugurated the program on February 13, 2012, and appointed Dr. Christopher Kolade
as Chair of the SURE Board.
ENERGY SUBSIDY REFORM: CASE STUDIES
INTERNATIONAL MONETARY FUND 51
the government‘s capital expenditure and borrowing requirements (Okonjo-Iweala, 2011).19
In
addition, several senior officials gave interviews and speeches during the last two weeks of
December. However, trade unions were also voicing their strong opposition to the measure echoing
a widely held view that the proceeds from the subsidy removal would most likely go to fund
wasteful government spending (including for corrupt politicians) rather than projects to benefit
ordinary Nigerians (Okigbo and Enekebe, 2011).20
State governors who had generally supported the
reform earlier on were now silent. Throughout the entire period, the government had deliberately
refrained from setting any date for the planned removal of subsidies.
The January 1 announcement came as a surprise and set off widespread protests across the
country. On January 9, the two large union federations launched a national strike. Certain parts of
the country experienced a near breakdown of law and order and there were a number of deaths
related to violence and acts of intimidation associated with the strike. On January 15, the president
announced that the January 1 price increase would be partly reversed and the new maximum retail
price for gasoline would be N97 (US$0.60) per liter, a 40 percent increase over its end-2011 level.
However, he emphasized that the government would continue to pursue full deregulation of the
downstream gasoline sector. The SURE program would go ahead but would be scaled back in line
with the reduced subsidy savings. The president also announced that the legal and regulatory
regime for the petroleum industry would be ―reviewed to address accountability issues and current
lapses.‖ Unions called off their strike that same day.
Mitigating measures
The SURE program outlined a variety of social safety net programs to mitigate the impact of
removing the subsidy on the poor segment of the population. These included:
Urban mass transit—Increasing mass transit availability by facilitating the procurement of diesel-
run vehicles (subsidized loans, reduced import tariffs, etc.) to established operators. In the first
step of this program, the government intended to import 1600 buses within months.
Maternal and child health services—Expanding the conditional cash transfer program for
pregnant women in rural areas; and upgrading facilities at clinics.
Public works—Providing temporary employment to youth and women from the poorest
populations in environmental projects and maintaining education and health facilities.
Vocational training—Establishing vocational training centers across the country to help tackle
the problem of youth unemployment.
19
Okonjo-Iweala, December 6, 2011.
20Okigbo, December 15, 2011.
ENERGY SUBSIDY REFORM: CASE STUDIES
52 INTERNATIONAL MONETARY FUND
Lessons
A well-thought out public information and consultation campaign is crucial to the success of
a reform. While the government campaigned vigorously for removal of the subsidies, the measure
was still highly controversial when it went into effect. The backlash had been predicted. The public
communication campaign lasted only six months and there was no broad popular consultation. The
ministry of finance produced several short briefs to support its proposal, but these were issued
several months into the campaign, and there was no comprehensive report.
The government must establish credibility for its promise that the proceeds from the removal
of the subsidy will actually be used for the benefit of the broad population. Notwithstanding
the laudable objectives of the SURE program and the plans for oversight by a highly reputable
board of directors, the new administration had yet to establish credibility that it would live up to
commitments. On the contrary, it suffered from a very negative image of government held by the
general public. As such, the subsidy reform was viewed very suspiciously and the general public
simply did not believe that the government would live up to its commitments.
Thorough research on the costs and beneficiaries of subsidies is important to be able to
bolster the case for subsidy reform. The absence of good quantitative information on the state of
Nigeria‘s refining industry and of the fuel subsidy mechanism itself allowed spurious arguments,
often made by parties with vested interests, that government investment in the state-owned
refineries and/or measures to stop abuse by marketers were preferable to removing the subsidies. In
addition, the claim that subsidies mostly benefited the poor had been based on anecdotal evidence
rather than on research based on household survey data.
References
Adelabu, Nenpominyi Sarah, 2012, ―The Political Economy of Oil Deregulation in Nigeria‘s Fourth
Republic: Prospects and Challenges,‖ Journal of Emerging Trends in Educational Research and
Policy Studies.
Arizona-Ogwu, L. Chinedu, 2011, ―Downstream Petroleum Deregulation: Options and Constraints,―
Science and Technology, December 11.
Igbikiowuby, Hector, 2011, ―Nigeria‘s Unending Flirtation with Deregulation,‖ Sweet Crude Reports,
October 3.
Nigeria Extractive Industries Transparency Initiative (NEITI), 2011, ―Report 2006–2008, Executive
Summary‖ (July).
Nigeria, Federal Republic, 2011, Subsidy Reinvestment and Empowerment (SURE) Programme,
November.
ENERGY SUBSIDY REFORM: CASE STUDIES
INTERNATIONAL MONETARY FUND 53
Nigeria, Federal Ministry of Finance, 2011, ―FAQ on Deregulation of the Downstream Petroleum
Sector and Removal of Fuel Subsidy‖ (October).
Nigeria, National Assembly, 2012, ―Lawan Report,‖ Unpublished report by the Ad Hoc Committee of
the Petroleum Subsidy Probe Panel chaired by Farouk Lawan, April.
Ogbu, Osita, 2012, ―The Removal of Oil Price Subsidy in Nigeria: Lessons in Leadership and
Policymaking in a Trust-Deficit Environment,‖ Brookings Opinion, January 26 (Washington:
Brookings Institute).
Okigbo, Patrick O., and Dili Enekebe, 2011, ―Nigeria: Fuel Subsidy Removal—Achieving the Optimal
Solution,‖ Nextier Policy Brief, December 15 (Washington: Nextier).
Okonjo-Iweala, Ngozi, 2011, Brief on Fuel Subsidy, December 6.
World Bank, 2012, ―Fuel Subsidies Impose a Large Fiscal Burden, and Disproportionately Benefit the
Rich,‖ Africa‘s Pulse, Vol. 5, April.
Website Resources:
Nigeria, Budget Office of the Federation, http://www.budgetoffice.gov.ng/.
Nigeria, Department of Petroleum Resources, http://www.dprnigeria.com/.
Nigeria, Federal Ministry of Finance, http://www.fmf.gov.ng/.
Nigeria Extractive Industries Transparency Initiative (NEITI), http://www.neiti.org.ng/.
Nigerian National Petroleum Company, http://www.nnpcgroup.com/Home.aspx.
Petroleum Products Pricing Regulatory Agency (PPPRA), http://www.pppra-nigeria.org/index.asp.
Petroleum Support Fund, http://www.pppra-nigeria.org/psf.htm.
Pipelines and Products Marketing Company (PPMC), (subsidiary of NNPC),
http://ppmc.nnpcgroup.com/.
Sweet Crude—A Review of the Nigerian Energy Sector, http://sweetcrudereports.com/.
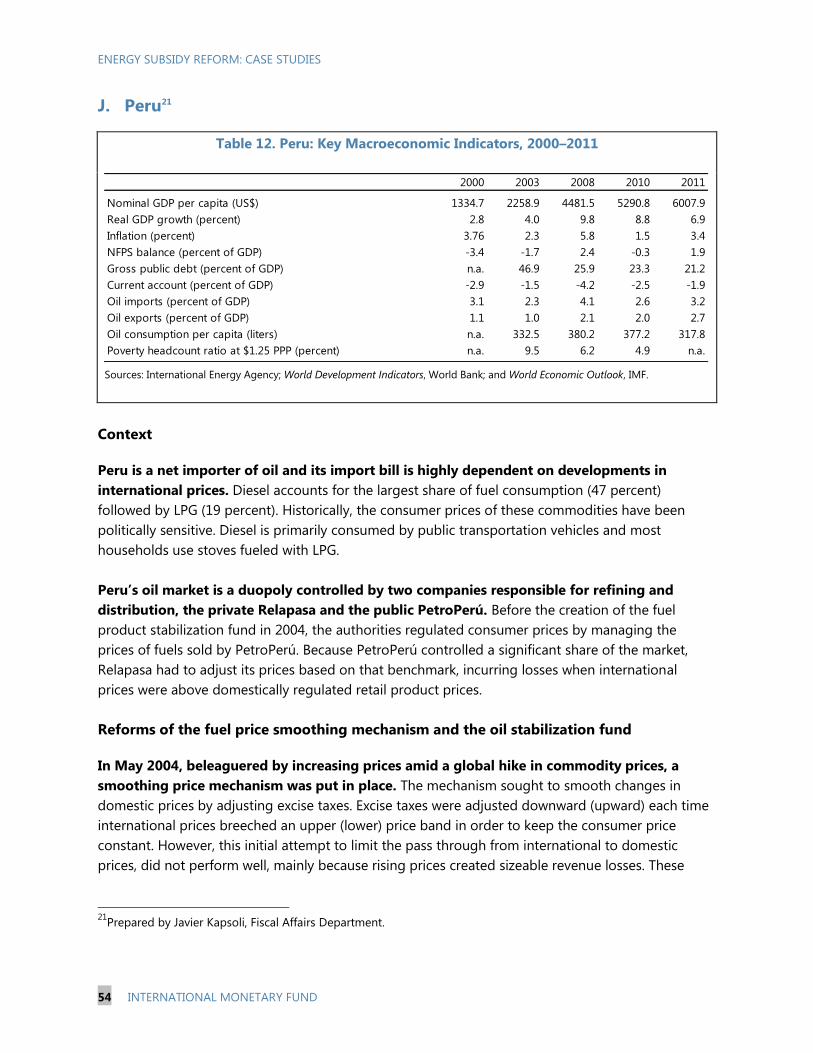
ENERGY SUBSIDY REFORM: CASE STUDIES
54 INTERNATIONAL MONETARY FUND
J. Peru21
Table 12. Peru: Key Macroeconomic Indicators, 2000–2011
Sources: International Energy Agency; World Development Indicators, World Bank; and World Economic Outlook, IMF.
Context
Peru is a net importer of oil and its import bill is highly dependent on developments in
international prices. Diesel accounts for the largest share of fuel consumption (47 percent)
followed by LPG (19 percent). Historically, the consumer prices of these commodities have been
politically sensitive. Diesel is primarily consumed by public transportation vehicles and most
households use stoves fueled with LPG.
Peru’s oil market is a duopoly controlled by two companies responsible for refining and
distribution, the private Relapasa and the public PetroPerú. Before the creation of the fuel
product stabilization fund in 2004, the authorities regulated consumer prices by managing the
prices of fuels sold by PetroPerú. Because PetroPerú controlled a significant share of the market,
Relapasa had to adjust its prices based on that benchmark, incurring losses when international
prices were above domestically regulated retail product prices.
Reforms of the fuel price smoothing mechanism and the oil stabilization fund
In May 2004, beleaguered by increasing prices amid a global hike in commodity prices, a
smoothing price mechanism was put in place. The mechanism sought to smooth changes in
domestic prices by adjusting excise taxes. Excise taxes were adjusted downward (upward) each time
international prices breeched an upper (lower) price band in order to keep the consumer price
constant. However, this initial attempt to limit the pass through from international to domestic
prices, did not perform well, mainly because rising prices created sizeable revenue losses. These
21
Prepared by Javier Kapsoli, Fiscal Affairs Department.
2000 2003 2008 2010 2011
Nominal GDP per capita (US$) 1334.7 2258.9 4481.5 5290.8 6007.9
Real GDP growth (percent) 2.8 4.0 9.8 8.8 6.9
Inflation (percent) 3.76 2.3 5.8 1.5 3.4
NFPS balance (percent of GDP) -3.4 -1.7 2.4 -0.3 1.9
Gross public debt (percent of GDP) n.a. 46.9 25.9 23.3 21.2
Current account (percent of GDP) -2.9 -1.5 -4.2 -2.5 -1.9
Oil imports (percent of GDP) 3.1 2.3 4.1 2.6 3.2
Oil exports (percent of GDP) 1.1 1.0 2.1 2.0 2.7
Oil consumption per capita (liters) n.a. 332.5 380.2 377.2 317.8
Poverty headcount ratio at $1.25 PPP (percent) n.a. 9.5 6.2 4.9 n.a.
ENERGY SUBSIDY REFORM: CASE STUDIES
INTERNATIONAL MONETARY FUND 55
losses, in turn, caused liquidity shortfalls in the treasury because of the shortfall in expected
revenues.
In September 2004, the authorities created a stabilization fund—the Fondo de Estabilización
de Precios de Combustibles (FEPC). The fund involved a complex payment system financed
directly by the treasury. All types of gasoline and LPG were included as products whose prices were
to be regulated by the FEPC. The objective of the FEPC was to prevent the full transmission of
international to domestic prices. This was to be achieved by providing transfers to the refineries in
periods when international prices were rising to compensate them for their increase in supply costs.
When reference prices were above the upper limit of the price band, a contingent credit for
refineries (payable by the treasury) was created. Similarly, if reference prices were below the lower
limit, a contingent liability for refineries (payable to the treasury) was created.
The performance of the FEPC prior to the reforms was mixed. Although it has been successful in
limiting the pass-through from international to domestic prices, the FEPC has also generated
sizeable fiscal costs (Figure 12). The latter is the consequence of the upward trend in oil prices and
the authorities‘ reluctance to increase the upward limit of the band. This combination of higher
prices and frozen bands has proven to be a drain on fiscal resources. Another problem has been the
accumulation of contingent liabilities. There is no legal obligation of the treasury to pay the
refineries; instead, the treasury has paid when it had sufficient cash on hand. This has created acute
liquidity issues for the refineries, particularly in 2008, which have made repeated requests to the
treasury to honor its obligations.
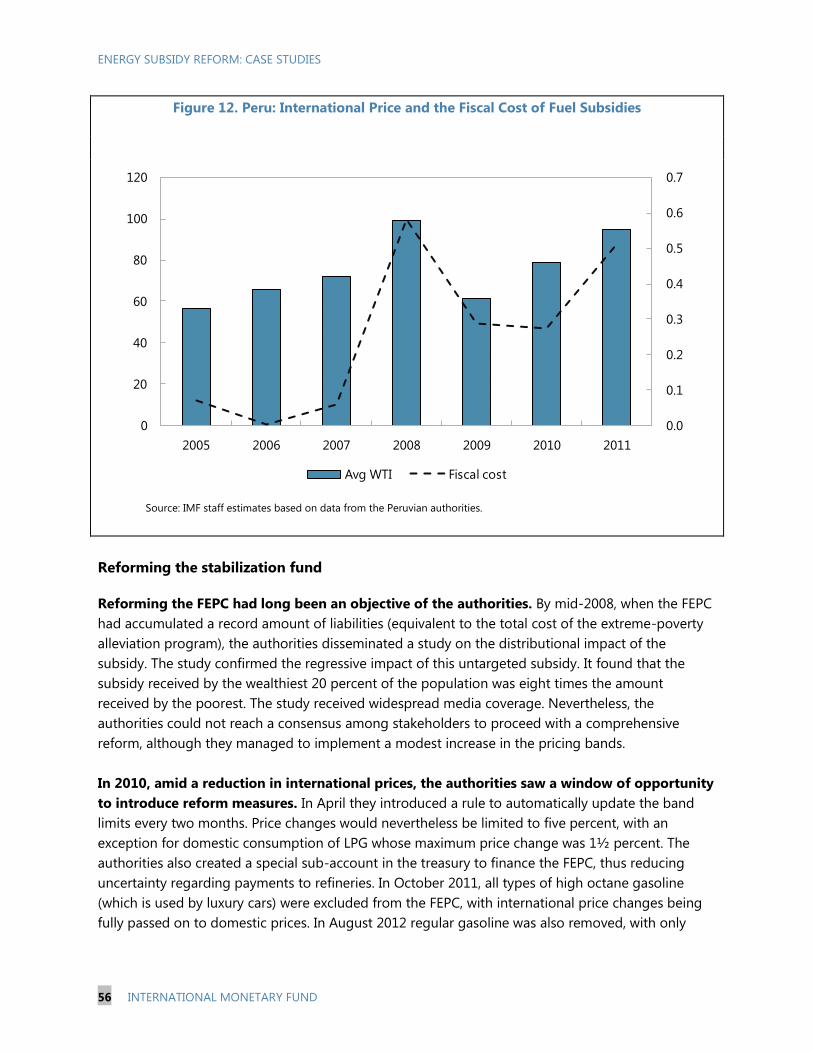
ENERGY SUBSIDY REFORM: CASE STUDIES
56 INTERNATIONAL MONETARY FUND
Figure 12. Peru: International Price and the Fiscal Cost of Fuel Subsidies
Source: IMF staff estimates based on data from the Peruvian authorities.
Reforming the stabilization fund
Reforming the FEPC had long been an objective of the authorities. By mid-2008, when the FEPC
had accumulated a record amount of liabilities (equivalent to the total cost of the extreme-poverty
alleviation program), the authorities disseminated a study on the distributional impact of the
subsidy. The study confirmed the regressive impact of this untargeted subsidy. It found that the
subsidy received by the wealthiest 20 percent of the population was eight times the amount
received by the poorest. The study received widespread media coverage. Nevertheless, the
authorities could not reach a consensus among stakeholders to proceed with a comprehensive
reform, although they managed to implement a modest increase in the pricing bands.
In 2010, amid a reduction in international prices, the authorities saw a window of opportunity
to introduce reform measures. In April they introduced a rule to automatically update the band
limits every two months. Price changes would nevertheless be limited to five percent, with an
exception for domestic consumption of LPG whose maximum price change was 1½ percent. The
authorities also created a special sub-account in the treasury to finance the FEPC, thus reducing
uncertainty regarding payments to refineries. In October 2011, all types of high octane gasoline
(which is used by luxury cars) were excluded from the FEPC, with international price changes being
fully passed on to domestic prices. In August 2012 regular gasoline was also removed, with only
0.0
0.1
0.2
0.3
0.4
0.5
0.6
0.7
0
20
40
60
80
100
120
2005 2006 2007 2008 2009 2010 2011
Avg WTI Fiscal cost
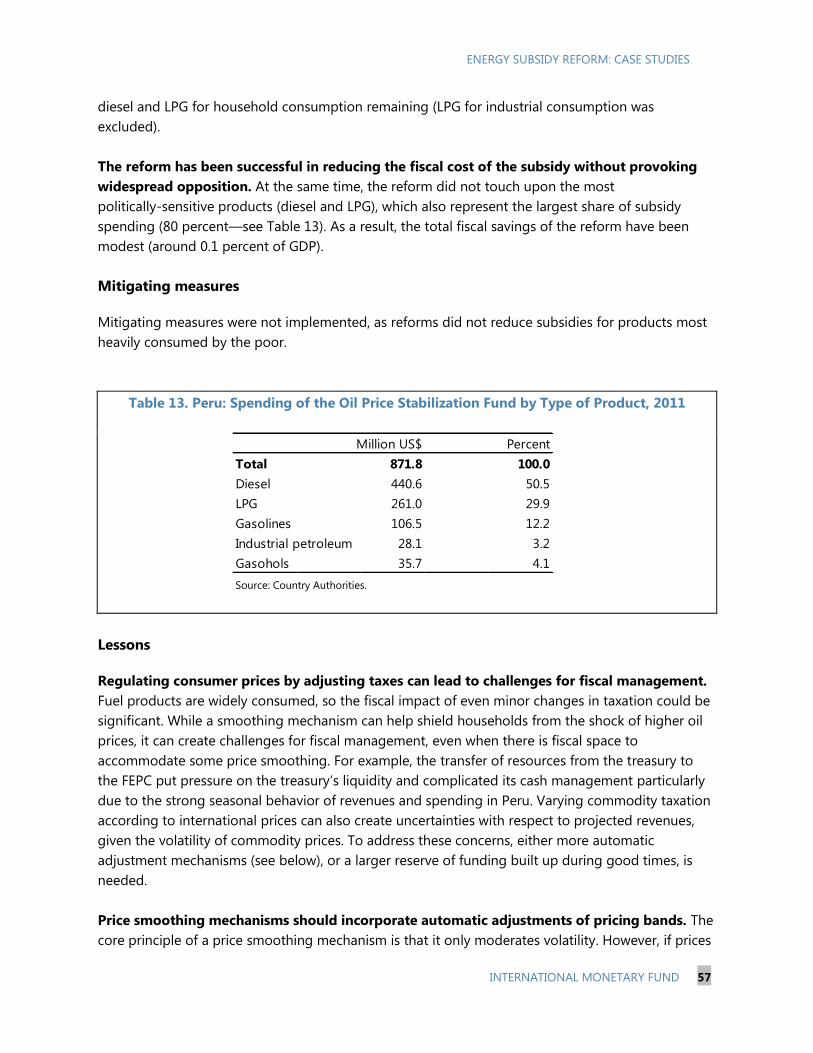
ENERGY SUBSIDY REFORM: CASE STUDIES
INTERNATIONAL MONETARY FUND 57
diesel and LPG for household consumption remaining (LPG for industrial consumption was
excluded).
The reform has been successful in reducing the fiscal cost of the subsidy without provoking
widespread opposition. At the same time, the reform did not touch upon the most
politically-sensitive products (diesel and LPG), which also represent the largest share of subsidy
spending (80 percent—see Table 13). As a result, the total fiscal savings of the reform have been
modest (around 0.1 percent of GDP).
Mitigating measures
Mitigating measures were not implemented, as reforms did not reduce subsidies for products most
heavily consumed by the poor.
Table 13. Peru: Spending of the Oil Price Stabilization Fund by Type of Product, 2011
Source: Country Authorities.
Lessons
Regulating consumer prices by adjusting taxes can lead to challenges for fiscal management.
Fuel products are widely consumed, so the fiscal impact of even minor changes in taxation could be
significant. While a smoothing mechanism can help shield households from the shock of higher oil
prices, it can create challenges for fiscal management, even when there is fiscal space to
accommodate some price smoothing. For example, the transfer of resources from the treasury to
the FEPC put pressure on the treasury‘s liquidity and complicated its cash management particularly
due to the strong seasonal behavior of revenues and spending in Peru. Varying commodity taxation
according to international prices can also create uncertainties with respect to projected revenues,
given the volatility of commodity prices. To address these concerns, either more automatic
adjustment mechanisms (see below), or a larger reserve of funding built up during good times, is
needed.
Price smoothing mechanisms should incorporate automatic adjustments of pricing bands. The
core principle of a price smoothing mechanism is that it only moderates volatility. However, if prices
Million US$ Percent
Total 871.8 100.0
Diesel 440.6 50.5
LPG 261.0 29.9
Gasolines 106.5 12.2
Industrial petroleum 28.1 3.2
Gasohols 35.7 4.1
ENERGY SUBSIDY REFORM: CASE STUDIES
58 INTERNATIONAL MONETARY FUND
are on an upward trend, the smoothing mechanism must have some method to adjust to this. In the
case of Peru, the decision to keep the bands untouched in the wake of an upward trend in oil prices
has proven to be fiscally costly. This has de facto converted a price smoothing mechanism into a
pure subsidy.
Rules for the payment of refineries for subsidies should be explicit. This can be done with a
special sub-account, which ideally should be integrated into the Treasury Single Account to ensure
transparency. This will make explicit the size of the subsidy and also give certainty to the amounts
that could be compensated to refineries.
Introducing subsidy reforms during ―good times‖ can enhance the chances of success. The
decision to introduce the reform in early 2010, during a period of stable prices and strong economic
growth, helped make the reform politically more palatable.
Subsidy reforms can fruitfully begin with the products consumed most heavily by higher-
income groups to ensure public support. In the case of Peru, this meant starting the reform by
raising high-octane gasoline prices. Despite the fact that fiscal savings under this approach can be
limited, such a strategy may be warranted to allow stakeholders to see the effects of the reform and
allow more time to muster support for a broader reform. This approach also signals the direction of
reform and can pave the road for further more ambitious reforms. There is nevertheless a trade-off
involved between fiscal savings and safeguarding adverse effects on lower-income groups, as
indicated by the modest savings that subsidy reform has achieved thus far for Peru.
References
Ministerio de Economía y Finanzas, 2012, ―Marco Macroeconómico Multianual 2013–15,‖
May (Lima).
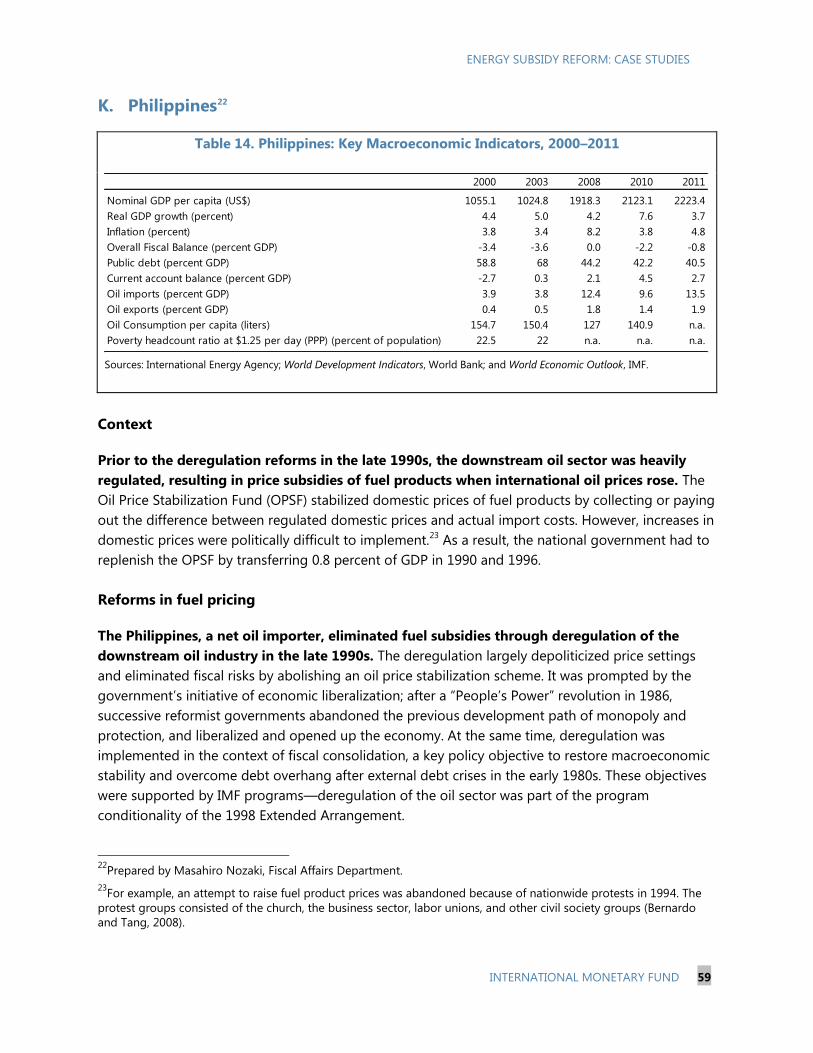
ENERGY SUBSIDY REFORM: CASE STUDIES
INTERNATIONAL MONETARY FUND 59
K. Philippines22
Table 14. Philippines: Key Macroeconomic Indicators, 2000–2011
Sources: International Energy Agency; World Development Indicators, World Bank; and World Economic Outlook, IMF.
Context
Prior to the deregulation reforms in the late 1990s, the downstream oil sector was heavily
regulated, resulting in price subsidies of fuel products when international oil prices rose. The
Oil Price Stabilization Fund (OPSF) stabilized domestic prices of fuel products by collecting or paying
out the difference between regulated domestic prices and actual import costs. However, increases in
domestic prices were politically difficult to implement.23
As a result, the national government had to
replenish the OPSF by transferring 0.8 percent of GDP in 1990 and 1996.
Reforms in fuel pricing
The Philippines, a net oil importer, eliminated fuel subsidies through deregulation of the
downstream oil industry in the late 1990s. The deregulation largely depoliticized price settings
and eliminated fiscal risks by abolishing an oil price stabilization scheme. It was prompted by the
government‘s initiative of economic liberalization; after a ―People‘s Power‖ revolution in 1986,
successive reformist governments abandoned the previous development path of monopoly and
protection, and liberalized and opened up the economy. At the same time, deregulation was
implemented in the context of fiscal consolidation, a key policy objective to restore macroeconomic
stability and overcome debt overhang after external debt crises in the early 1980s. These objectives
were supported by IMF programs—deregulation of the oil sector was part of the program
conditionality of the 1998 Extended Arrangement.
22
Prepared by Masahiro Nozaki, Fiscal Affairs Department.
23For example, an attempt to raise fuel product prices was abandoned because of nationwide protests in 1994. The
protest groups consisted of the church, the business sector, labor unions, and other civil society groups (Bernardo
and Tang, 2008).
2000 2003 2008 2010 2011
Nominal GDP per capita (US$) 1055.1 1024.8 1918.3 2123.1 2223.4
Real GDP growth (percent) 4.4 5.0 4.2 7.6 3.7
Inflation (percent) 3.8 3.4 8.2 3.8 4.8
Overall Fiscal Balance (percent GDP) -3.4 -3.6 0.0 -2.2 -0.8
Public debt (percent GDP) 58.8 68 44.2 42.2 40.5
Current account balance (percent GDP) -2.7 0.3 2.1 4.5 2.7
Oil imports (percent GDP) 3.9 3.8 12.4 9.6 13.5
Oil exports (percent GDP) 0.4 0.5 1.8 1.4 1.9
Oil Consumption per capita (liters) 154.7 150.4 127 140.9 n.a.
Poverty headcount ratio at $1.25 per day (PPP) (percent of population) 22.5 22 n.a. n.a. n.a.
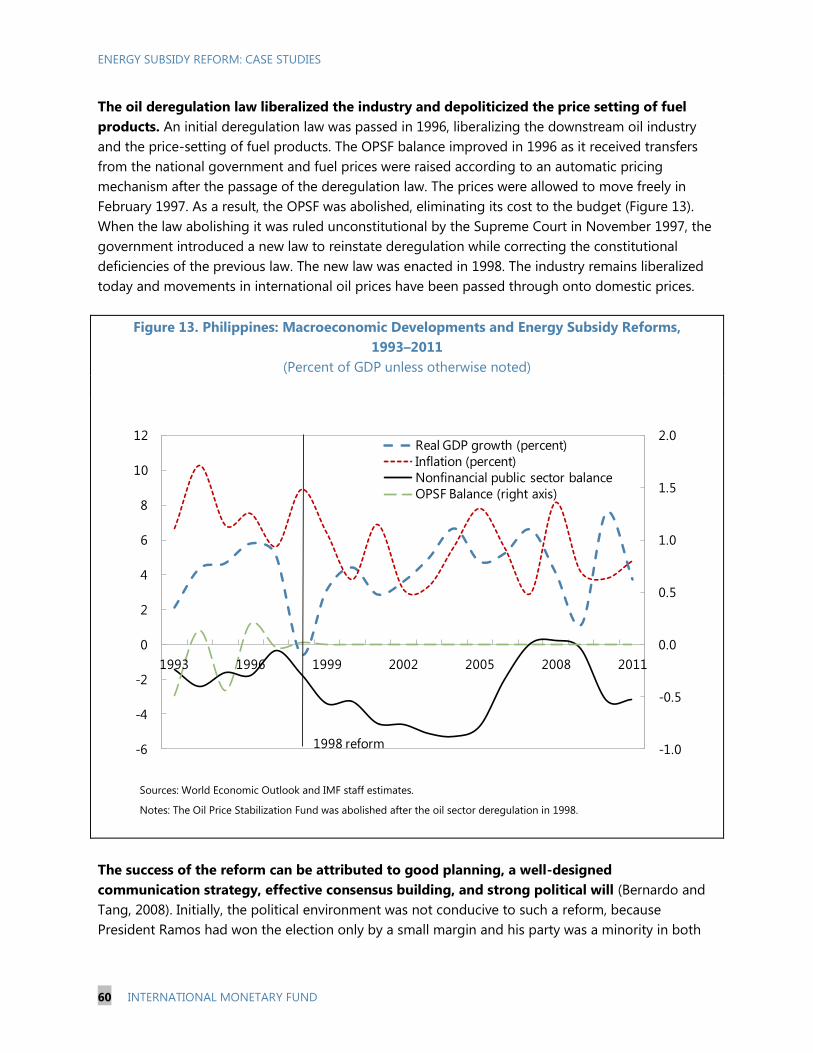
ENERGY SUBSIDY REFORM: CASE STUDIES
60 INTERNATIONAL MONETARY FUND
The oil deregulation law liberalized the industry and depoliticized the price setting of fuel
products. An initial deregulation law was passed in 1996, liberalizing the downstream oil industry
and the price-setting of fuel products. The OPSF balance improved in 1996 as it received transfers
from the national government and fuel prices were raised according to an automatic pricing
mechanism after the passage of the deregulation law. The prices were allowed to move freely in
February 1997. As a result, the OPSF was abolished, eliminating its cost to the budget (Figure 13).
When the law abolishing it was ruled unconstitutional by the Supreme Court in November 1997, the
government introduced a new law to reinstate deregulation while correcting the constitutional
deficiencies of the previous law. The new law was enacted in 1998. The industry remains liberalized
today and movements in international oil prices have been passed through onto domestic prices.
Figure 13. Philippines: Macroeconomic Developments and Energy Subsidy Reforms,
1993–2011
(Percent of GDP unless otherwise noted)
Sources: World Economic Outlook and IMF staff estimates.
Notes: The Oil Price Stabilization Fund was abolished after the oil sector deregulation in 1998.
The success of the reform can be attributed to good planning, a well-designed
communication strategy, effective consensus building, and strong political will (Bernardo and
Tang, 2008). Initially, the political environment was not conducive to such a reform, because
President Ramos had won the election only by a small margin and his party was a minority in both
-1.0
-0.5
0.0
0.5
1.0
1.5
2.0
-6
-4
-2
0
2
4
6
8
10
12
1993 1996 1999 2002 2005 2008 2011
Real GDP growth (percent)
Inflation (percent)
Nonfinancial public sector balance
OPSF Balance (right axis)
1998 reform
ENERGY SUBSIDY REFORM: CASE STUDIES
INTERNATIONAL MONETARY FUND 61
chambers of Congress. Nevertheless, the reform was planned and communicated soon after the
president took office in 1992. A public communication campaign began at an early stage and
included a nationwide road-show to inform the public of the problems of oil price subsidies. While
the president‘s party was a minority in congress, he set up a coordination body between the
executive and the two chambers of congress and used it to prioritize the oil deregulation bill and
forge consensus on it. The commitment of the oil sector reform as part of the conditionality of an
IMF program helped to set a timeframe for passing legislation. It was opportune that the initial
deregulation bill was advanced in 1994–96, a ―lull‖ period with declining inflation, high output
growth, and stable exchange rates. Political leadership was exercised when the president pursued
the reform despite the Supreme Court ruling that the 1996 deregulation law was unconstitutional—
the revised bill was enacted in 1998 amid a negative growth shock from the Asian crisis, a surge in
domestic oil prices due to exchange rate depreciation, and renewed political pressure to reregulate
the industry.
Mitigating measures
The authorities introduced appropriate indirect measures to mitigate the effect of the reform
(Bernardo and Tang, 2008). For example, the 1996 law included a transition period during which fuel
product prices were adjusted monthly using an automatic pricing mechanism. During this period,
the government provided transfers to the OPSF to absorb price increases in excess of a threshold.
For some years after the deregulation, the government adjusted the duty on oil imports when
international oil prices exceeded a threshold, and it used moral suasion to persuade oil companies
to adjust prices in small increments.
More recently, the authorities announced several measures to mitigate the impact of the food
and fuel crisis in mid-2008. The government launched a package of pro-poor spending programs
that are financed by windfall VAT revenue from high oil prices. The policy package included
electricity subsidies for indigent families, college scholarships for low-income students, and
subsidized loans to convert engines of public transportation to less costly LPGs (World Bank, 2008).
In addition, the government distributed subsidized rice to low-income families. A pilot project of a
conditional cash transfer program was conducted in late 2007 and scaled up in 2008 (Fernandez and
Olfindo, 2011).
Lessons
The Philippines’ experience with fuel subsidy reform underscores the importance of planning,
persistence, and a good communication plan in achieving a successful outcome. The fact that
reform efforts started soon after the Ramos administration took office indicates the benefit of
advance planning. Commitment to the reform under an IMF-supported program helped set up the
timeframe for the reform. The reform was supported by a thorough communication strategy, which
began at an early stage of the reform. Despite the president‘s weak political base, a coordination
body between the executive and the legislative helped prioritize the reform law. Political leadership
ENERGY SUBSIDY REFORM: CASE STUDIES
62 INTERNATIONAL MONETARY FUND
was also essential, as evidenced by the government‘s effort to pass new legislation after the
Supreme Court ruling against the first deregulation law.
The survival of the reform to date can be attributed to its comprehensiveness. Rather than ad
hoc price adjustments or the simple introduction of an automatic pricing mechanism, the Philippines
chose to introduce deeper reforms with liberalization of the downstream oil sector. It succeeded in
de-politicizing the price setting of fuel products throughout the product chain, thus raising the bar
for a reversal of the reform.
Mitigating measures for the poor during the 2008 fuel price hike helped maintain support for
the authorities’ approach to fuel pricing. The authorities were able to finance a package of
mitigating measures with windfall VAT revenues from higher fuel prices. This was better targeted
and a more desirable policy response than a reintroduction of fuel subsidies.
References
Bernardo, Romeo L., Marie-Christine G. Tang, 2008, ―The Political Economy of Reform During the
Ramos Administration (1992–98),‖ Commission on Growth and Development Working Paper
No. 39 (Washington: World Bank).
Fernandez, Luisa, and Rosechin Olfindo, 2011, ―Overview of the Philippines‘ Conditional Cash
Transfer Program,‖ Social Protection Note No. 2, May (Washington: World Bank).
World Bank, 2008, Philippines Quarterly Update (Washington). Available via the Internet:
http://documents.worldbank.org/curated/en/2008/11/11962976/philippines-quarterly-
update.
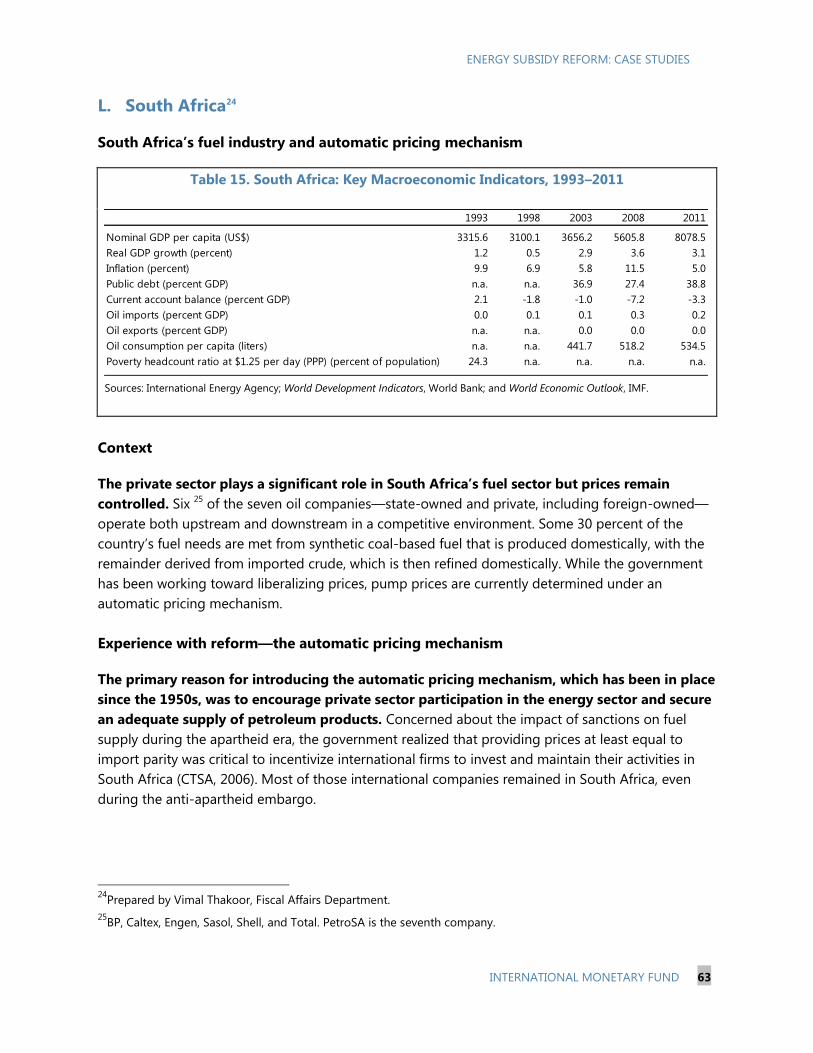
ENERGY SUBSIDY REFORM: CASE STUDIES
INTERNATIONAL MONETARY FUND 63
L. South Africa24
South Africa’s fuel industry and automatic pricing mechanism
Table 15. South Africa: Key Macroeconomic Indicators, 1993–2011
Sources: International Energy Agency; World Development Indicators, World Bank; and World Economic Outlook, IMF.
Context
The private sector plays a significant role in South Africa’s fuel sector but prices remain
controlled. Six 25
of the seven oil companies—state-owned and private, including foreign-owned—
operate both upstream and downstream in a competitive environment. Some 30 percent of the
country‘s fuel needs are met from synthetic coal-based fuel that is produced domestically, with the
remainder derived from imported crude, which is then refined domestically. While the government
has been working toward liberalizing prices, pump prices are currently determined under an
automatic pricing mechanism.
Experience with reform—the automatic pricing mechanism
The primary reason for introducing the automatic pricing mechanism, which has been in place
since the 1950s, was to encourage private sector participation in the energy sector and secure
an adequate supply of petroleum products. Concerned about the impact of sanctions on fuel
supply during the apartheid era, the government realized that providing prices at least equal to
import parity was critical to incentivize international firms to invest and maintain their activities in
South Africa (CTSA, 2006). Most of those international companies remained in South Africa, even
during the anti-apartheid embargo.
24
Prepared by Vimal Thakoor, Fiscal Affairs Department.
25BP, Caltex, Engen, Sasol, Shell, and Total. PetroSA is the seventh company.
1993 1998 2003 2008 2011
Nominal GDP per capita (US$) 3315.6 3100.1 3656.2 5605.8 8078.5
Real GDP growth (percent) 1.2 0.5 2.9 3.6 3.1
Inflation (percent) 9.9 6.9 5.8 11.5 5.0
Public debt (percent GDP) n.a. n.a. 36.9 27.4 38.8
Current account balance (percent GDP) 2.1 -1.8 -1.0 -7.2 -3.3
Oil imports (percent GDP) 0.0 0.1 0.1 0.3 0.2
Oil exports (percent GDP) n.a. n.a. 0.0 0.0 0.0
Oil consumption per capita (liters) n.a. n.a. 441.7 518.2 534.5
Poverty headcount ratio at $1.25 per day (PPP) (percent of population) 24.3 n.a. n.a. n.a. n.a.
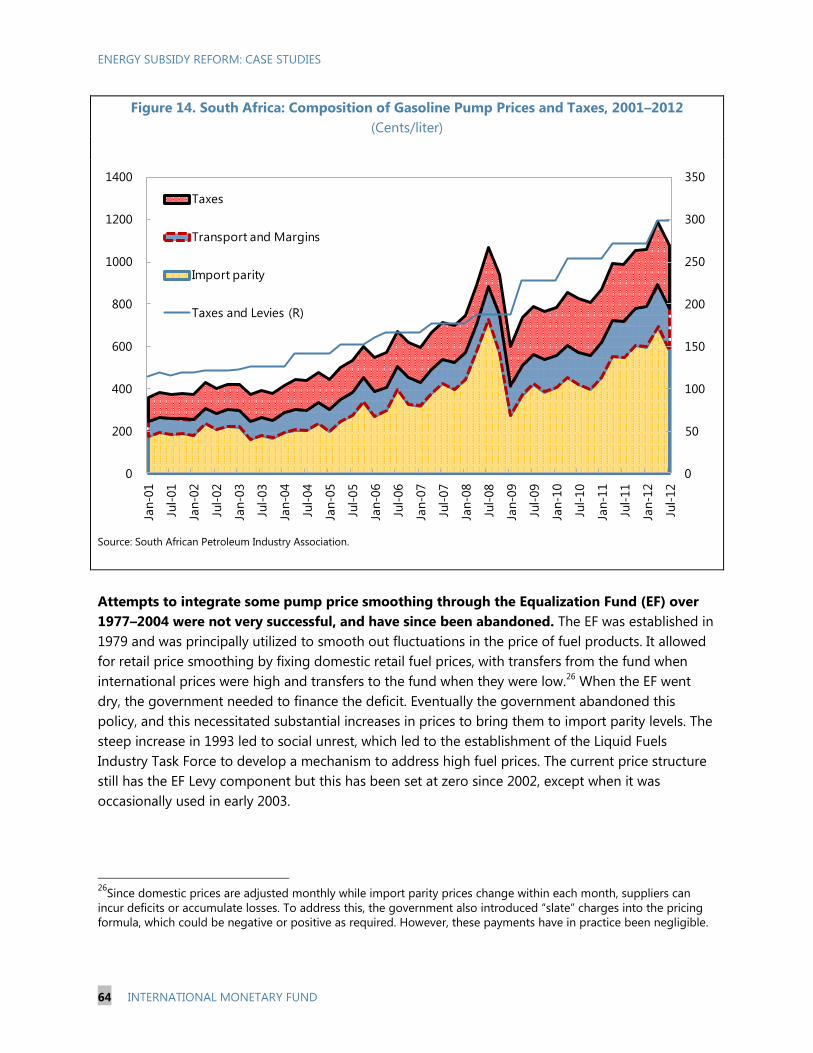
ENERGY SUBSIDY REFORM: CASE STUDIES
64 INTERNATIONAL MONETARY FUND
Figure 14. South Africa: Composition of Gasoline Pump Prices and Taxes, 2001–2012
(Cents/liter)
Source: South African Petroleum Industry Association.
Attempts to integrate some pump price smoothing through the Equalization Fund (EF) over
1977–2004 were not very successful, and have since been abandoned. The EF was established in
1979 and was principally utilized to smooth out fluctuations in the price of fuel products. It allowed
for retail price smoothing by fixing domestic retail fuel prices, with transfers from the fund when
international prices were high and transfers to the fund when they were low.26
When the EF went
dry, the government needed to finance the deficit. Eventually the government abandoned this
policy, and this necessitated substantial increases in prices to bring them to import parity levels. The
steep increase in 1993 led to social unrest, which led to the establishment of the Liquid Fuels
Industry Task Force to develop a mechanism to address high fuel prices. The current price structure
still has the EF Levy component but this has been set at zero since 2002, except when it was
occasionally used in early 2003.
26
Since domestic prices are adjusted monthly while import parity prices change within each month, suppliers can
incur deficits or accumulate losses. To address this, the government also introduced ―slate‖ charges into the pricing
formula, which could be negative or positive as required. However, these payments have in practice been negligible.
0
50
100
150
200
250
300
350
0
200
400
600
800
1000
1200
1400
Jan-0
1
Jul-
01
Jan-0
2
Jul-
02
Jan-0
3
Jul-
03
Jan-0
4
Jul-
04
Jan-0
5
Jul-
05
Jan-0
6
Jul-
06
Jan-0
7
Jul-
07
Jan-0
8
Jul-
08
Jan-0
9
Jul-
09
Jan-1
0
Jul-
10
Jan-1
1
Jul-
11
Jan-1
2
Jul-
12
Taxes
Transport and Margins
Import parity
Taxes and Levies (R)
ENERGY SUBSIDY REFORM: CASE STUDIES
INTERNATIONAL MONETARY FUND 65
The Central Energy Fund, a state-owned entity, was set up in 1977 and given responsibility for
determining pump prices on behalf of the Department of Energy. Prices are determined on a
monthly basis (the first Wednesday of each month) and include margins, taxes, and levies. The fuel
tax—the main tax—is a specific levy announced every February in the budget speech (for
implementation in April); it has increased steadily over time including in periods of rising
international prices (Figure 14). The decisions of the Central Energy Fund are transparently
communicated to the public. There is an online publication 27
of the monthly decisions and price
structure, which contributes to a good understanding of the factors driving pump prices among the
general public.
Mitigating measures
No mitigating measures have been introduced in connection with the automatic pricing
mechanism. Given the long-standing application of the formula to determine fuel prices, there has
been little debate regarding the adverse effects of international fuel prices increases.
Lessons
South Africa‘s success in implementing the automatic price mechanism shows that, when well
designed, private (including foreign) companies can operate under such a mechanism without much
problem. It also yields some insights for other countries:
The long-standing automatic pricing mechanism has worked well and is likely to remain in
place for the foreseeable future. While South Africa initially implemented the mechanism for
strategic reasons under a peculiar political situation, it has been applied consistently over the
years. There has been little discussion of an alternative, even when pump prices have had to be
increased sharply.
The transparency and credibility of the automatic pricing process has contributed to its
durability. South Africa‘s experience with automatic pricing has been attributed to the
credibility that the Central Energy Fund has gained over the years and the transparency with
which the mechanism is implemented. The public dissemination of the fund‘s decisions has
contributed to its success.
Stabilization funds can backfire when they are not provided with sufficient resources to
absorb volatility in international prices. In South Africa, the EF was underfunded, and when
resources were exhausted, prices needed to rise sharply—thus defeating the very purpose of
the EF.
27
See www.energy.gov.za/files/petroleum_frame.html.
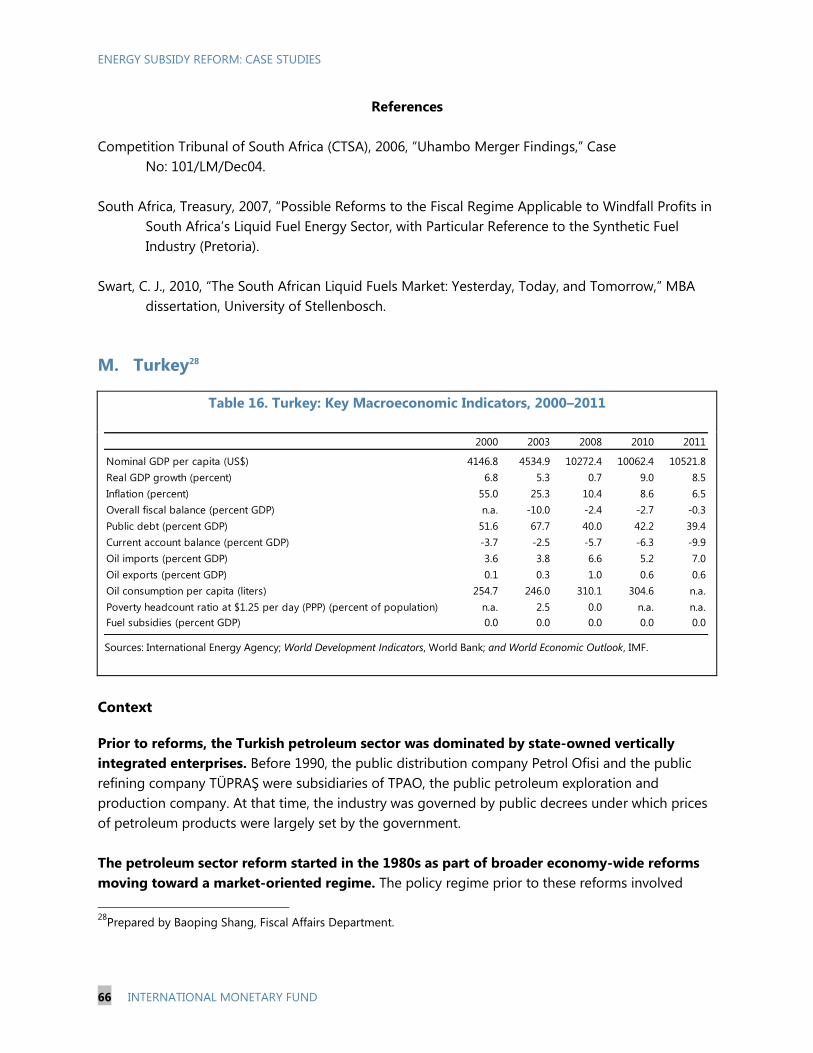
ENERGY SUBSIDY REFORM: CASE STUDIES
66 INTERNATIONAL MONETARY FUND
References
Competition Tribunal of South Africa (CTSA), 2006, ―Uhambo Merger Findings,‖ Case
No: 101/LM/Dec04.
South Africa, Treasury, 2007, ―Possible Reforms to the Fiscal Regime Applicable to Windfall Profits in
South Africa‘s Liquid Fuel Energy Sector, with Particular Reference to the Synthetic Fuel
Industry (Pretoria).
Swart, C. J., 2010, ―The South African Liquid Fuels Market: Yesterday, Today, and Tomorrow,‖ MBA
dissertation, University of Stellenbosch.
M. Turkey28
Table 16. Turkey: Key Macroeconomic Indicators, 2000–2011
Sources: International Energy Agency; World Development Indicators, World Bank; and World Economic Outlook, IMF.
Context
Prior to reforms, the Turkish petroleum sector was dominated by state-owned vertically
integrated enterprises. Before 1990, the public distribution company Petrol Ofisi and the public
refining company TÜPRAŞ were subsidiaries of TPAO, the public petroleum exploration and
production company. At that time, the industry was governed by public decrees under which prices
of petroleum products were largely set by the government.
The petroleum sector reform started in the 1980s as part of broader economy-wide reforms
moving toward a market-oriented regime. The policy regime prior to these reforms involved
28
Prepared by Baoping Shang, Fiscal Affairs Department.
2000 2003 2008 2010 2011
Nominal GDP per capita (US$) 4146.8 4534.9 10272.4 10062.4 10521.8
Real GDP growth (percent) 6.8 5.3 0.7 9.0 8.5
Inflation (percent) 55.0 25.3 10.4 8.6 6.5
Overall fiscal balance (percent GDP) n.a. -10.0 -2.4 -2.7 -0.3
Public debt (percent GDP) 51.6 67.7 40.0 42.2 39.4
Current account balance (percent GDP) -3.7 -2.5 -5.7 -6.3 -9.9
Oil imports (percent GDP) 3.6 3.8 6.6 5.2 7.0
Oil exports (percent GDP) 0.1 0.3 1.0 0.6 0.6
Oil consumption per capita (liters) 254.7 246.0 310.1 304.6 n.a.
Poverty headcount ratio at $1.25 per day (PPP) (percent of population) n.a. 2.5 0.0 n.a. n.a.
Fuel subsidies (percent GDP) 0.0 0.0 0.0 0.0 0.0
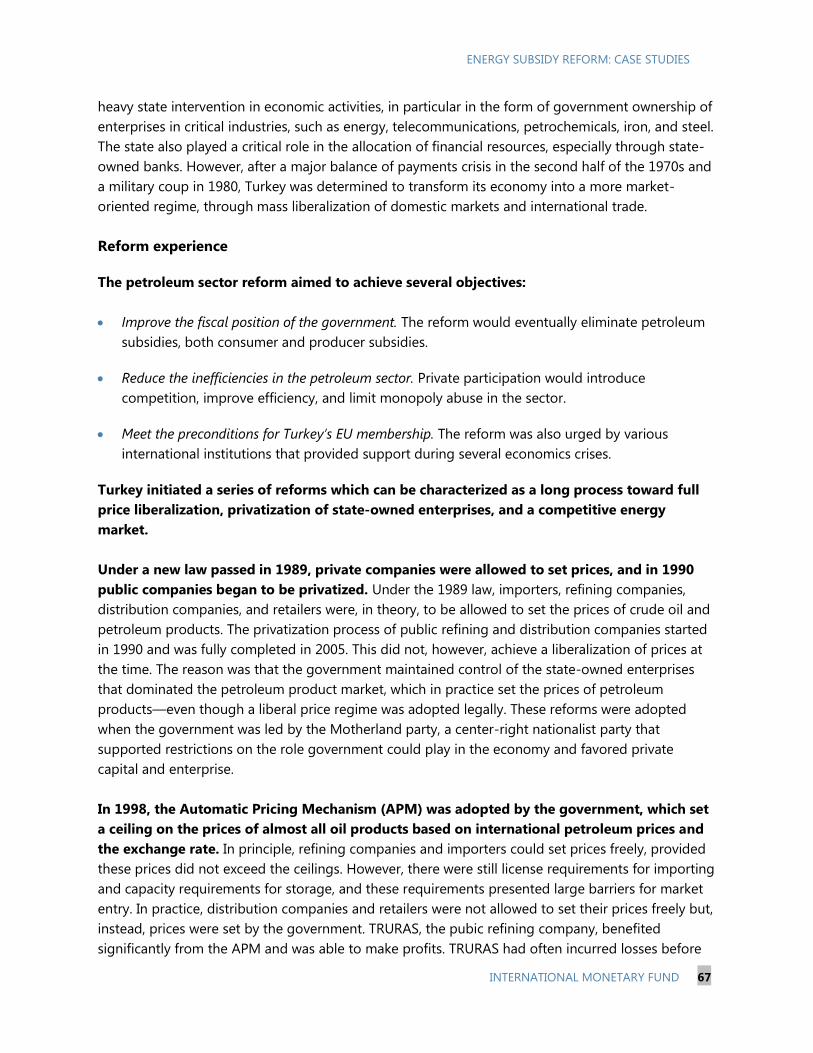
ENERGY SUBSIDY REFORM: CASE STUDIES
INTERNATIONAL MONETARY FUND 67
heavy state intervention in economic activities, in particular in the form of government ownership of
enterprises in critical industries, such as energy, telecommunications, petrochemicals, iron, and steel.
The state also played a critical role in the allocation of financial resources, especially through state-
owned banks. However, after a major balance of payments crisis in the second half of the 1970s and
a military coup in 1980, Turkey was determined to transform its economy into a more market-
oriented regime, through mass liberalization of domestic markets and international trade.
Reform experience
The petroleum sector reform aimed to achieve several objectives:
Improve the fiscal position of the government. The reform would eventually eliminate petroleum
subsidies, both consumer and producer subsidies.
Reduce the inefficiencies in the petroleum sector. Private participation would introduce
competition, improve efficiency, and limit monopoly abuse in the sector.
Meet the preconditions for Turkey’s EU membership. The reform was also urged by various
international institutions that provided support during several economics crises.
Turkey initiated a series of reforms which can be characterized as a long process toward full
price liberalization, privatization of state-owned enterprises, and a competitive energy
market.
Under a new law passed in 1989, private companies were allowed to set prices, and in 1990
public companies began to be privatized. Under the 1989 law, importers, refining companies,
distribution companies, and retailers were, in theory, to be allowed to set the prices of crude oil and
petroleum products. The privatization process of public refining and distribution companies started
in 1990 and was fully completed in 2005. This did not, however, achieve a liberalization of prices at
the time. The reason was that the government maintained control of the state-owned enterprises
that dominated the petroleum product market, which in practice set the prices of petroleum
products—even though a liberal price regime was adopted legally. These reforms were adopted
when the government was led by the Motherland party, a center-right nationalist party that
supported restrictions on the role government could play in the economy and favored private
capital and enterprise.
In 1998, the Automatic Pricing Mechanism (APM) was adopted by the government, which set
a ceiling on the prices of almost all oil products based on international petroleum prices and
the exchange rate. In principle, refining companies and importers could set prices freely, provided
these prices did not exceed the ceilings. However, there were still license requirements for importing
and capacity requirements for storage, and these requirements presented large barriers for market
entry. In practice, distribution companies and retailers were not allowed to set their prices freely but,
instead, prices were set by the government. TRURAS, the pubic refining company, benefited
significantly from the APM and was able to make profits. TRURAS had often incurred losses before
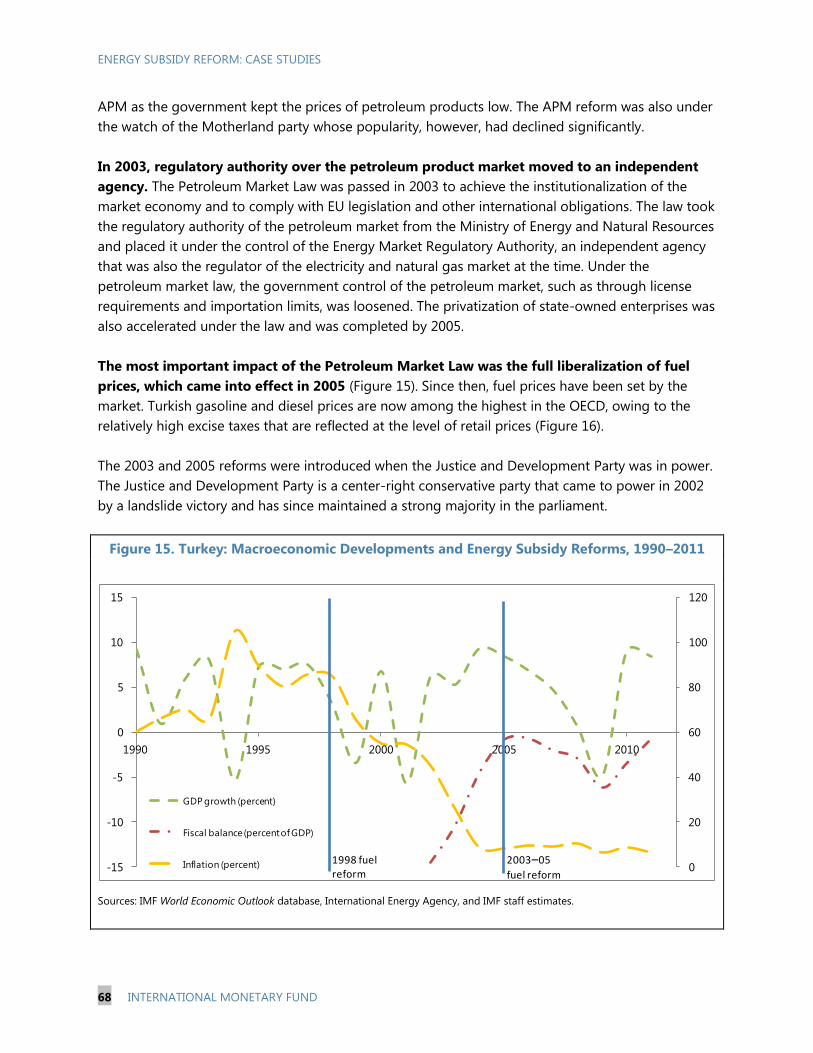
ENERGY SUBSIDY REFORM: CASE STUDIES
68 INTERNATIONAL MONETARY FUND
APM as the government kept the prices of petroleum products low. The APM reform was also under
the watch of the Motherland party whose popularity, however, had declined significantly.
In 2003, regulatory authority over the petroleum product market moved to an independent
agency. The Petroleum Market Law was passed in 2003 to achieve the institutionalization of the
market economy and to comply with EU legislation and other international obligations. The law took
the regulatory authority of the petroleum market from the Ministry of Energy and Natural Resources
and placed it under the control of the Energy Market Regulatory Authority, an independent agency
that was also the regulator of the electricity and natural gas market at the time. Under the
petroleum market law, the government control of the petroleum market, such as through license
requirements and importation limits, was loosened. The privatization of state-owned enterprises was
also accelerated under the law and was completed by 2005.
The most important impact of the Petroleum Market Law was the full liberalization of fuel
prices, which came into effect in 2005 (Figure 15). Since then, fuel prices have been set by the
market. Turkish gasoline and diesel prices are now among the highest in the OECD, owing to the
relatively high excise taxes that are reflected at the level of retail prices (Figure 16).
The 2003 and 2005 reforms were introduced when the Justice and Development Party was in power.
The Justice and Development Party is a center-right conservative party that came to power in 2002
by a landslide victory and has since maintained a strong majority in the parliament.
Figure 15. Turkey: Macroeconomic Developments and Energy Subsidy Reforms, 1990–2011
Sources: IMF World Economic Outlook database, International Energy Agency, and IMF staff estimates.
0
20
40
60
80
100
120
-15
-10
-5
0
5
10
15
1990 1995 2000 2005 2010
GDP growth (percent)
Fiscal balance (percent of GDP)
Inflation (percent) 1998 fuel reform
2003–05
fuel reform
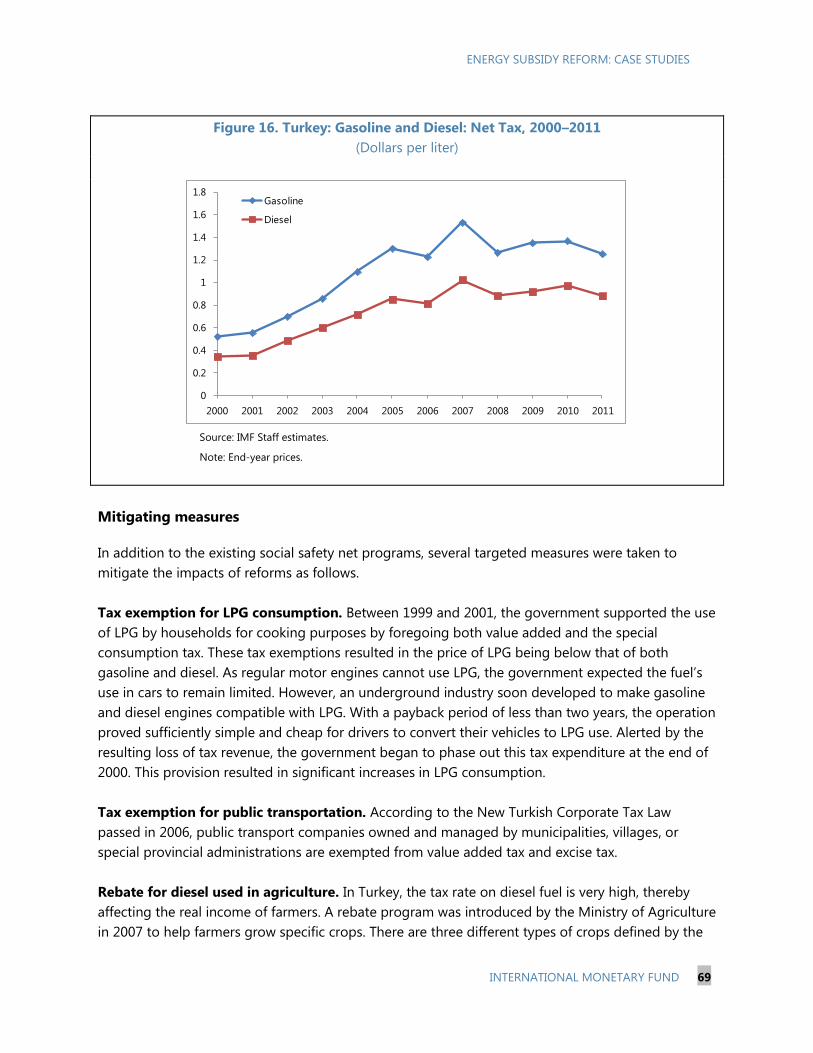
ENERGY SUBSIDY REFORM: CASE STUDIES
INTERNATIONAL MONETARY FUND 69
Figure 16. Turkey: Gasoline and Diesel: Net Tax, 2000–2011
(Dollars per liter)
Source: IMF Staff estimates.
Note: End-year prices.
Mitigating measures
In addition to the existing social safety net programs, several targeted measures were taken to
mitigate the impacts of reforms as follows.
Tax exemption for LPG consumption. Between 1999 and 2001, the government supported the use
of LPG by households for cooking purposes by foregoing both value added and the special
consumption tax. These tax exemptions resulted in the price of LPG being below that of both
gasoline and diesel. As regular motor engines cannot use LPG, the government expected the fuel‘s
use in cars to remain limited. However, an underground industry soon developed to make gasoline
and diesel engines compatible with LPG. With a payback period of less than two years, the operation
proved sufficiently simple and cheap for drivers to convert their vehicles to LPG use. Alerted by the
resulting loss of tax revenue, the government began to phase out this tax expenditure at the end of
2000. This provision resulted in significant increases in LPG consumption.
Tax exemption for public transportation. According to the New Turkish Corporate Tax Law
passed in 2006, public transport companies owned and managed by municipalities, villages, or
special provincial administrations are exempted from value added tax and excise tax.
Rebate for diesel used in agriculture. In Turkey, the tax rate on diesel fuel is very high, thereby
affecting the real income of farmers. A rebate program was introduced by the Ministry of Agriculture
in 2007 to help farmers grow specific crops. There are three different types of crops defined by the
0
0.2
0.4
0.6
0.8
1
1.2
1.4
1.6
1.8
2000 2001 2002 2003 2004 2005 2006 2007 2008 2009 2010 2011
Gasoline
Diesel
ENERGY SUBSIDY REFORM: CASE STUDIES
70 INTERNATIONAL MONETARY FUND
ministry which correspond to different aid levels. The amounts of aid are calculated according to the
area of the land used in growing specified crops, and paid according to a schedule defined by the
cabinet. There are no restrictions on how grant money is spent. The measure is to be phased out.
Lessons
Broad support for and firm commitment to market reform was key to the success of subsidy
reforms in Turkey. Turkey started a more liberalized regime for energy pricing in the late 1980s and
early 1990s, and sustained these reforms under the administration of various political parties. Aided
by economy-wide reforms to enter the European Union, energy sector reforms have received broad
support with little setback. Because of this, only very limited mitigating measures were adopted and
the popularity of government did not appear to have a large bearing on the success of energy
reforms.
Improving economic conditions also helped advance reforms. In the past two decades, the
Turkish economy has grown steadily; inflation has been lowered substantially; and the overall fiscal
balance has also been improving. The short-run impact of energy reforms on household welfare has
been limited because of relatively high household income. This assured the public that the country
was moving in the right direction and prevented any setback to reforms from occurring.
Independent agencies for energy policy can help steer technical decisions away from politics.
Under the Petroleum Market Law, an independent agency, the Energy Market Regulatory Authority,
was responsible for implementing the laws and regulating the petroleum sector. This took the
technical decisions on pricing and market regulation out of the hands of politicians and ensured the
stability and consistency of reforms.
References
Erdogdu, Erkan, 2007, ―Regulatory Reform in Turkish Energy Industry: An Analysis,‖ Energy Policy,
Vol. 35, No. 2, pp. 984–93.
International Energy Agency, 2010, ―Energy Policies of IEA Countries: Turkey 2009 Review‖ (Paris).
Oguz, Ender, 2006, ―The Liberalization of Downstream Oil Industry in Turkey,‖ A Thesis Submitted to
the Graduate School of Social Sciences, Middle East Technical University.
Organisation for Economic Co-operation and Development, 2011, ―Turkey: Inventory of Estimated
Budgetary Support and Tax Expenditures for Fossil Fuels‖ (Paris).
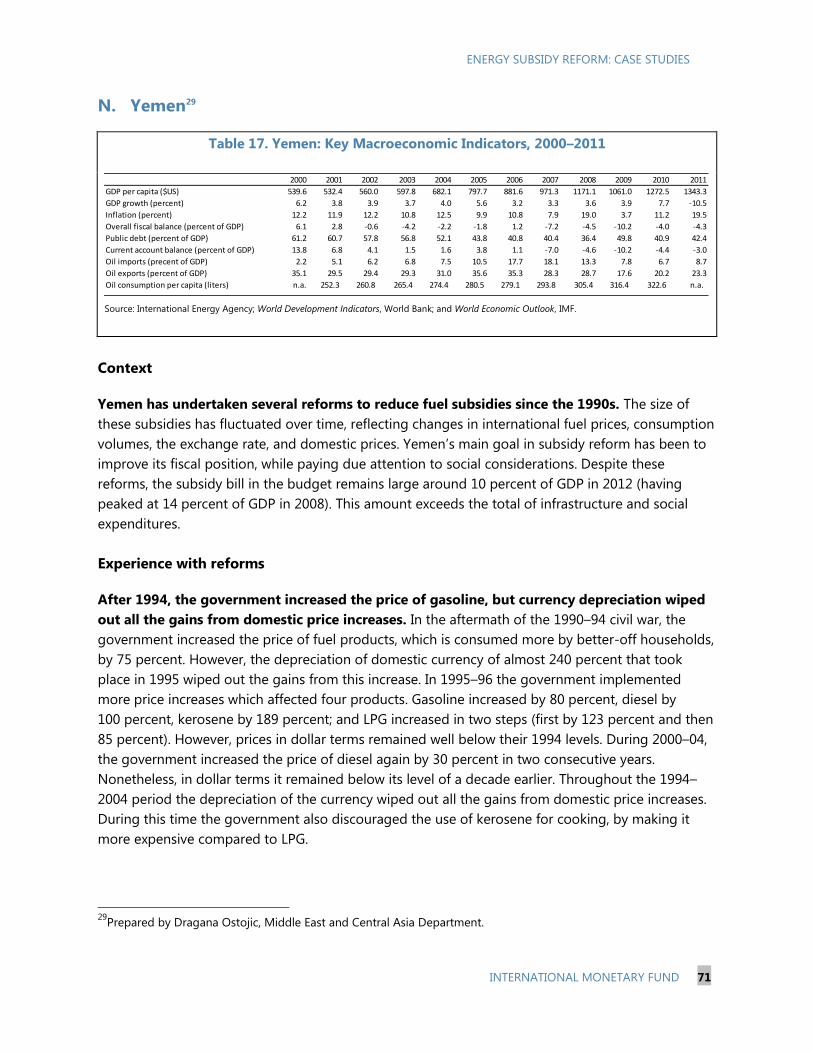
ENERGY SUBSIDY REFORM: CASE STUDIES
INTERNATIONAL MONETARY FUND 71
N. Yemen29
Table 17. Yemen: Key Macroeconomic Indicators, 2000–2011
Source: International Energy Agency; World Development Indicators, World Bank; and World Economic Outlook, IMF.
Context
Yemen has undertaken several reforms to reduce fuel subsidies since the 1990s. The size of
these subsidies has fluctuated over time, reflecting changes in international fuel prices, consumption
volumes, the exchange rate, and domestic prices. Yemen‘s main goal in subsidy reform has been to
improve its fiscal position, while paying due attention to social considerations. Despite these
reforms, the subsidy bill in the budget remains large around 10 percent of GDP in 2012 (having
peaked at 14 percent of GDP in 2008). This amount exceeds the total of infrastructure and social
expenditures.
Experience with reforms
After 1994, the government increased the price of gasoline, but currency depreciation wiped
out all the gains from domestic price increases. In the aftermath of the 1990–94 civil war, the
government increased the price of fuel products, which is consumed more by better-off households,
by 75 percent. However, the depreciation of domestic currency of almost 240 percent that took
place in 1995 wiped out the gains from this increase. In 1995–96 the government implemented
more price increases which affected four products. Gasoline increased by 80 percent, diesel by
100 percent, kerosene by 189 percent; and LPG increased in two steps (first by 123 percent and then
85 percent). However, prices in dollar terms remained well below their 1994 levels. During 2000–04,
the government increased the price of diesel again by 30 percent in two consecutive years.
Nonetheless, in dollar terms it remained below its level of a decade earlier. Throughout the 1994–
2004 period the depreciation of the currency wiped out all the gains from domestic price increases.
During this time the government also discouraged the use of kerosene for cooking, by making it
more expensive compared to LPG.
29
Prepared by Dragana Ostojic, Middle East and Central Asia Department.
2000 2001 2002 2003 2004 2005 2006 2007 2008 2009 2010 2011
GDP per capita ($US) 539.6 532.4 560.0 597.8 682.1 797.7 881.6 971.3 1171.1 1061.0 1272.5 1343.3
GDP growth (percent) 6.2 3.8 3.9 3.7 4.0 5.6 3.2 3.3 3.6 3.9 7.7 -10.5
Inflation (percent) 12.2 11.9 12.2 10.8 12.5 9.9 10.8 7.9 19.0 3.7 11.2 19.5
Overall fiscal balance (percent of GDP) 6.1 2.8 -0.6 -4.2 -2.2 -1.8 1.2 -7.2 -4.5 -10.2 -4.0 -4.3
Public debt (percent of GDP) 61.2 60.7 57.8 56.8 52.1 43.8 40.8 40.4 36.4 49.8 40.9 42.4
Current account balance (percent of GDP) 13.8 6.8 4.1 1.5 1.6 3.8 1.1 -7.0 -4.6 -10.2 -4.4 -3.0
Oil imports (precent of GDP) 2.2 5.1 6.2 6.8 7.5 10.5 17.7 18.1 13.3 7.8 6.7 8.7
Oil exports (percent of GDP) 35.1 29.5 29.4 29.3 31.0 35.6 35.3 28.3 28.7 17.6 20.2 23.3
Oil consumption per capita (liters) n.a. 252.3 260.8 265.4 274.4 280.5 279.1 293.8 305.4 316.4 322.6 n.a.
ENERGY SUBSIDY REFORM: CASE STUDIES
72 INTERNATIONAL MONETARY FUND
The most important subsidy reform, launched in 2005, aimed at gradually adjusting domestic
prices over the medium term. This reform was based on a World Bank study and IMF policy
advice, which underlined the need to preserves fiscal sustainability in the face of declining oil
reserves. So, in July 2005, the government increased domestic prices by 130 percent on average.
This price increase led to violent protests and the government reacted by partially reversing it.
Nonetheless, the net price adjustment remained substantial at 71 percent for gasoline, 106 percent
for diesel, 119 percent for kerosene, and 7 percent for LPG. There was no increase in the price of
mazot, which is mainly used for electricity generation.30
It is important to note that social tensions
during this episode were related not only to the subsidy reform but also to reforms in the taxation
system. The initial relative success of the fuel price adjustments was cancelled by the spike in
commodity prices in later years. As a result, the subsidy bill remained high, at almost 9 percent of
GDP in 2005.
In 2010, as a part of the reforms supported by an IMF Extended Credit Facility arrangement,
the prices of gasoline, diesel, and kerosene were gradually increased by about 30 percent on
average, and the price of LPG was doubled over a period of nine months. The reform strategy
was based on technical assistance from the World Bank, which drew lessons from the experience of
the previous reforms. However, the public information campaign component of the strategy was not
adopted. Instead, the government implemented small, surprise increases. In addition to fuel price
increases, the government also introduced some efficiency-promoting measures such as replacing
diesel-fueled power generators with gas-fueled ones. In late 2010, Yemen started to differentiate
diesel prices by charging higher prices to commercial users. The main objective of this reform
episode was to reduce fiscal pressures, following the record-high fiscal deficit of 10 percent of GDP
in 2009.
In 2011/12, as a consequence of the political crisis and tight fiscal space, the government
increased the price of gasoline by 66 percent, and doubled the prices of diesel and kerosene.
31 Overall, this reform episode was accepted by the population despite the political tension between
the ruling party and the opposition. The major pipeline that provides oil to domestic refineries had
been sabotaged. At the same time, the government was able to import only limited quantities of
refined fuel products. The ensuing fuel scarcity resulted in the emergence of a black market, with
prices that were a multiple of the official sale prices, and long lines at the gas stations. This situation
may have played a role in the population‘s acceptance of the official price increases in exchange for
the benefit of uninterrupted supply.
30
In addition, the electricity company receives diesel at a lower price than other users.
31The price of gasoline was initially increased by 133 percent for 90 percent of consumers, and for 10 percent of
consumers (poor households who use gasoline) it was left unchanged. In 2011 the increase was partially reversed,
but prices were unified.
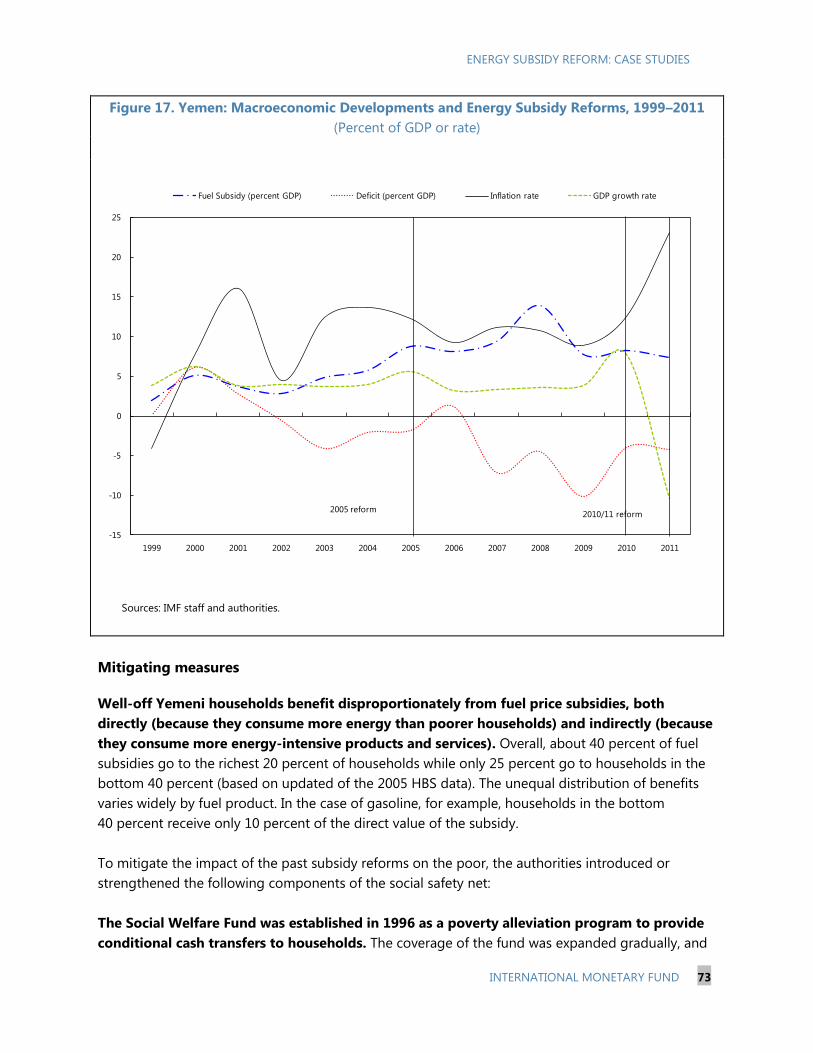
ENERGY SUBSIDY REFORM: CASE STUDIES
INTERNATIONAL MONETARY FUND 73
Figure 17. Yemen: Macroeconomic Developments and Energy Subsidy Reforms, 1999–2011
(Percent of GDP or rate)
Sources: IMF staff and authorities.
Mitigating measures
Well-off Yemeni households benefit disproportionately from fuel price subsidies, both
directly (because they consume more energy than poorer households) and indirectly (because
they consume more energy-intensive products and services). Overall, about 40 percent of fuel
subsidies go to the richest 20 percent of households while only 25 percent go to households in the
bottom 40 percent (based on updated of the 2005 HBS data). The unequal distribution of benefits
varies widely by fuel product. In the case of gasoline, for example, households in the bottom
40 percent receive only 10 percent of the direct value of the subsidy.
To mitigate the impact of the past subsidy reforms on the poor, the authorities introduced or
strengthened the following components of the social safety net:
The Social Welfare Fund was established in 1996 as a poverty alleviation program to provide
conditional cash transfers to households. The coverage of the fund was expanded gradually, and
-15
-10
-5
0
5
10
15
20
25
1999 2000 2001 2002 2003 2004 2005 2006 2007 2008 2009 2010 2011
Fuel Subsidy (percent GDP) Deficit (percent GDP) Inflation rate GDP growth rate
2005 reform2010/11 reform
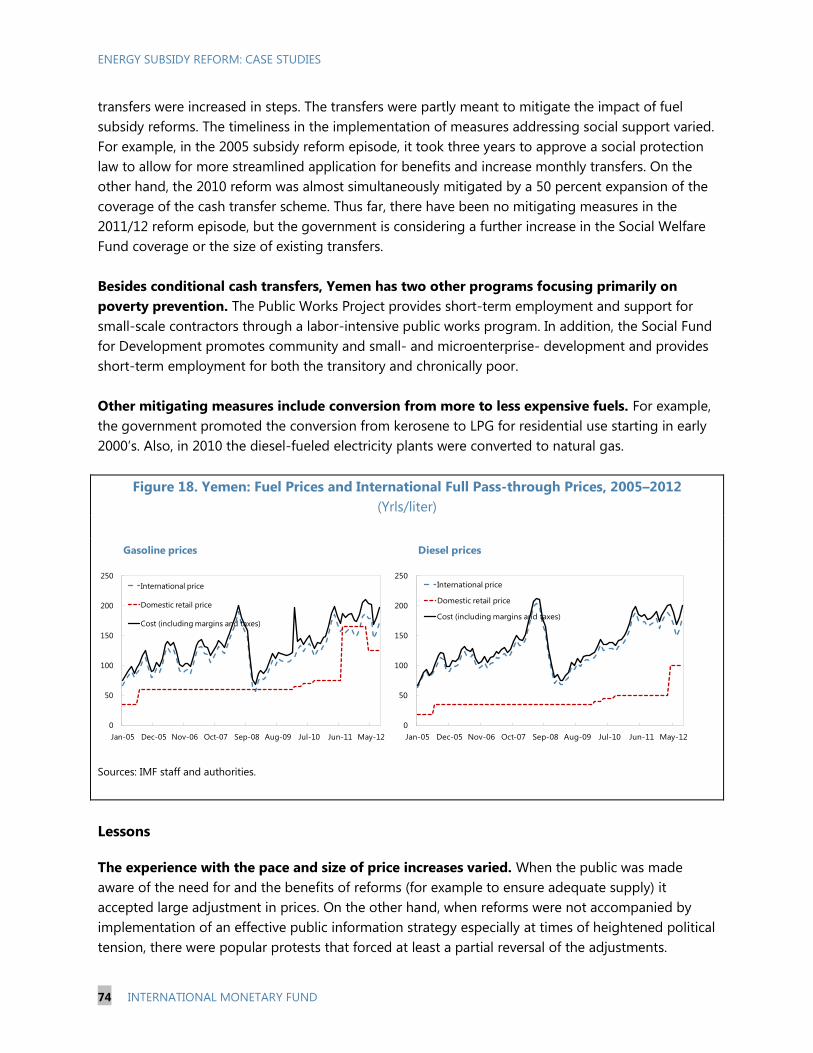
ENERGY SUBSIDY REFORM: CASE STUDIES
74 INTERNATIONAL MONETARY FUND
transfers were increased in steps. The transfers were partly meant to mitigate the impact of fuel
subsidy reforms. The timeliness in the implementation of measures addressing social support varied.
For example, in the 2005 subsidy reform episode, it took three years to approve a social protection
law to allow for more streamlined application for benefits and increase monthly transfers. On the
other hand, the 2010 reform was almost simultaneously mitigated by a 50 percent expansion of the
coverage of the cash transfer scheme. Thus far, there have been no mitigating measures in the
2011/12 reform episode, but the government is considering a further increase in the Social Welfare
Fund coverage or the size of existing transfers.
Besides conditional cash transfers, Yemen has two other programs focusing primarily on
poverty prevention. The Public Works Project provides short-term employment and support for
small-scale contractors through a labor-intensive public works program. In addition, the Social Fund
for Development promotes community and small- and microenterprise- development and provides
short-term employment for both the transitory and chronically poor.
Other mitigating measures include conversion from more to less expensive fuels. For example,
the government promoted the conversion from kerosene to LPG for residential use starting in early
2000‘s. Also, in 2010 the diesel-fueled electricity plants were converted to natural gas.
Figure 18. Yemen: Fuel Prices and International Full Pass-through Prices, 2005–2012
(Yrls/liter)
Sources: IMF staff and authorities.
Lessons
The experience with the pace and size of price increases varied. When the public was made
aware of the need for and the benefits of reforms (for example to ensure adequate supply) it
accepted large adjustment in prices. On the other hand, when reforms were not accompanied by
implementation of an effective public information strategy especially at times of heightened political
tension, there were popular protests that forced at least a partial reversal of the adjustments.
0
50
100
150
200
250
Jan-05 Dec-05 Nov-06 Oct-07 Sep-08 Aug-09 Jul-10 Jun-11 May-12
International price
Domestic retail price
Cost (including margins and taxes)
Diesel prices
0
50
100
150
200
250
Jan-05 Dec-05 Nov-06 Oct-07 Sep-08 Aug-09 Jul-10 Jun-11 May-12
International price
Domestic retail price
Cost (including margins and taxes)
Gasoline prices
ENERGY SUBSIDY REFORM: CASE STUDIES
INTERNATIONAL MONETARY FUND 75
Adequate planning to strengthen the safety net and communicate assurances regarding the
mitigating effort were also essential for gaining public support.
It is important to avoid multiple prices of a single fuel product. The Yemeni government
introduced multiple pricing for gasoline and diesel with a view to protecting vulnerable households.
However, the implementation of that strategy was difficult and gave rise to arbitrage, and
distortions. It also raised a governance challenge as it created an incentive for commercial users to
try to obtain the product at the cheaper price intended for residential users. This is not the case for
metered products, such as electricity, for which differential pricing is easier to implement.
If well designed and implemented in a timely fashion, cash transfers and other social
protection programs can be effective in protecting the poor and reducing opposition to
reforms. The Social Welfare Fund cash transfers, as well as support from the Public Works Project
and the Social Fund for Development, helped to reduce opposition to reforms. Based on this
experience, it is possible to argue that opposition to the 2005 reforms could have been reduced if
the social protection programs had been simultaneously implemented.
While adverse economic conditions increase the need for reforms, they can make price
adjustments more difficult, especially if combined with political tensions. It is therefore
important whenever possible to implement reforms in a timely fashion before economic and social
conditions deteriorate further. The large resources used in generalized subsidies can then be used
more effectively to target the poor and to spur growth and employment creation.
Efficiency and governance improvements can also help reduce subsidy costs. Adequate relative
pricing (e.g., natural gas vs. diesel, and LPG vs. kerosene) provides and incentive for efficient
switching of consumption. Strengthening governance would also help to enhance targeting and
reduce abuse and smuggling.
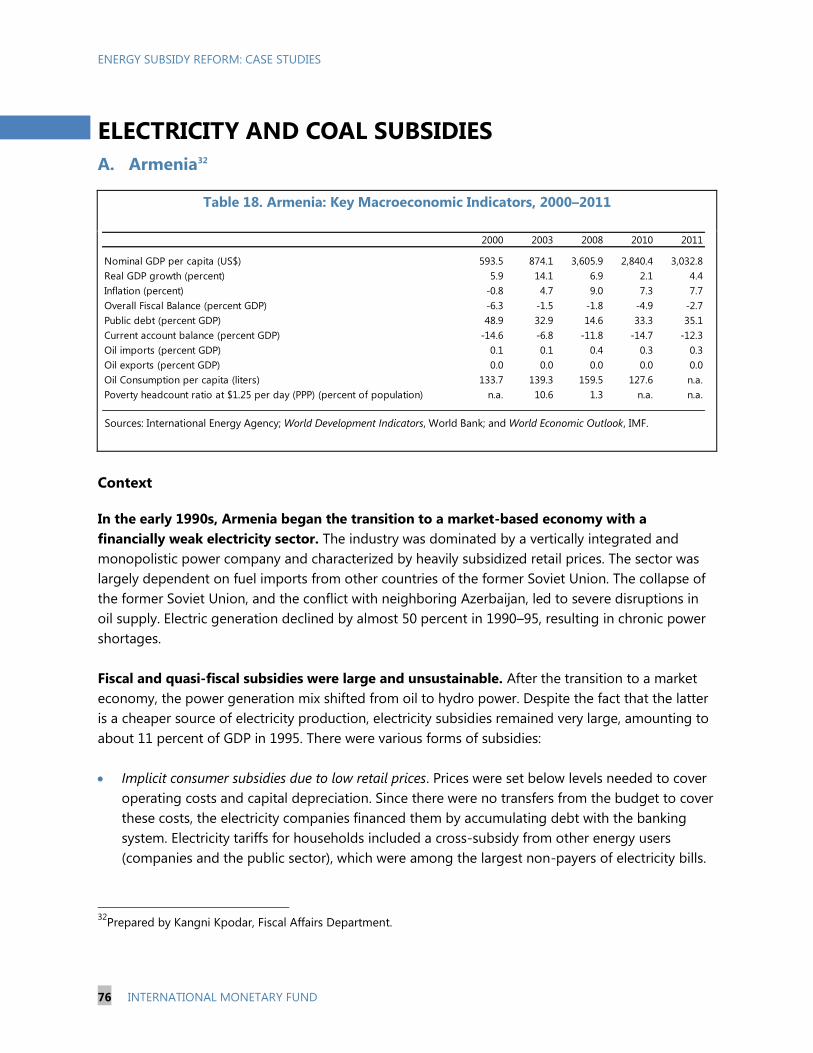
ENERGY SUBSIDY REFORM: CASE STUDIES
76 INTERNATIONAL MONETARY FUND
ELECTRICITY AND COAL SUBSIDIES
A. Armenia32
Table 18. Armenia: Key Macroeconomic Indicators, 2000–2011
Sources: International Energy Agency; World Development Indicators, World Bank; and World Economic Outlook, IMF.
Context
In the early 1990s, Armenia began the transition to a market-based economy with a
financially weak electricity sector. The industry was dominated by a vertically integrated and
monopolistic power company and characterized by heavily subsidized retail prices. The sector was
largely dependent on fuel imports from other countries of the former Soviet Union. The collapse of
the former Soviet Union, and the conflict with neighboring Azerbaijan, led to severe disruptions in
oil supply. Electric generation declined by almost 50 percent in 1990–95, resulting in chronic power
shortages.
Fiscal and quasi-fiscal subsidies were large and unsustainable. After the transition to a market
economy, the power generation mix shifted from oil to hydro power. Despite the fact that the latter
is a cheaper source of electricity production, electricity subsidies remained very large, amounting to
about 11 percent of GDP in 1995. There were various forms of subsidies:
Implicit consumer subsidies due to low retail prices. Prices were set below levels needed to cover
operating costs and capital depreciation. Since there were no transfers from the budget to cover
these costs, the electricity companies financed them by accumulating debt with the banking
system. Electricity tariffs for households included a cross-subsidy from other energy users
(companies and the public sector), which were among the largest non-payers of electricity bills.
32
Prepared by Kangni Kpodar, Fiscal Affairs Department.
2000 2003 2008 2010 2011
Nominal GDP per capita (US$) 593.5 874.1 3,605.9 2,840.4 3,032.8
Real GDP growth (percent) 5.9 14.1 6.9 2.1 4.4
Inflation (percent) -0.8 4.7 9.0 7.3 7.7
Overall Fiscal Balance (percent GDP) -6.3 -1.5 -1.8 -4.9 -2.7
Public debt (percent GDP) 48.9 32.9 14.6 33.3 35.1
Current account balance (percent GDP) -14.6 -6.8 -11.8 -14.7 -12.3
Oil imports (percent GDP) 0.1 0.1 0.4 0.3 0.3
Oil exports (percent GDP) 0.0 0.0 0.0 0.0 0.0
Oil Consumption per capita (liters) 133.7 139.3 159.5 127.6 n.a.
Poverty headcount ratio at $1.25 per day (PPP) (percent of population) n.a. 10.6 1.3 n.a. n.a.
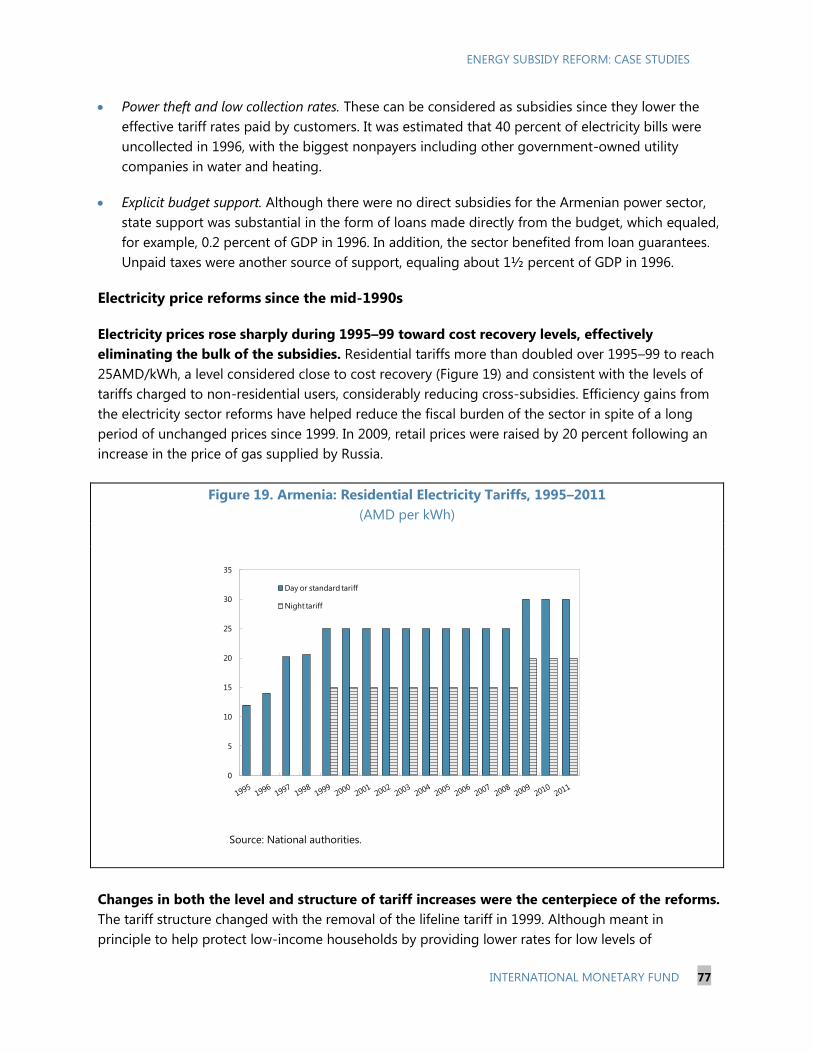
ENERGY SUBSIDY REFORM: CASE STUDIES
INTERNATIONAL MONETARY FUND 77
Power theft and low collection rates. These can be considered as subsidies since they lower the
effective tariff rates paid by customers. It was estimated that 40 percent of electricity bills were
uncollected in 1996, with the biggest nonpayers including other government-owned utility
companies in water and heating.
Explicit budget support. Although there were no direct subsidies for the Armenian power sector,
state support was substantial in the form of loans made directly from the budget, which equaled,
for example, 0.2 percent of GDP in 1996. In addition, the sector benefited from loan guarantees.
Unpaid taxes were another source of support, equaling about 1½ percent of GDP in 1996.
Electricity price reforms since the mid-1990s
Electricity prices rose sharply during 1995–99 toward cost recovery levels, effectively
eliminating the bulk of the subsidies. Residential tariffs more than doubled over 1995–99 to reach
25AMD/kWh, a level considered close to cost recovery (Figure 19) and consistent with the levels of
tariffs charged to non-residential users, considerably reducing cross-subsidies. Efficiency gains from
the electricity sector reforms have helped reduce the fiscal burden of the sector in spite of a long
period of unchanged prices since 1999. In 2009, retail prices were raised by 20 percent following an
increase in the price of gas supplied by Russia.
Figure 19. Armenia: Residential Electricity Tariffs, 1995–2011
(AMD per kWh)
Source: National authorities.
Changes in both the level and structure of tariff increases were the centerpiece of the reforms.
The tariff structure changed with the removal of the lifeline tariff in 1999. Although meant in
principle to help protect low-income households by providing lower rates for low levels of
0
5
10
15
20
25
30
35
Day or standard tariff
Night tariff
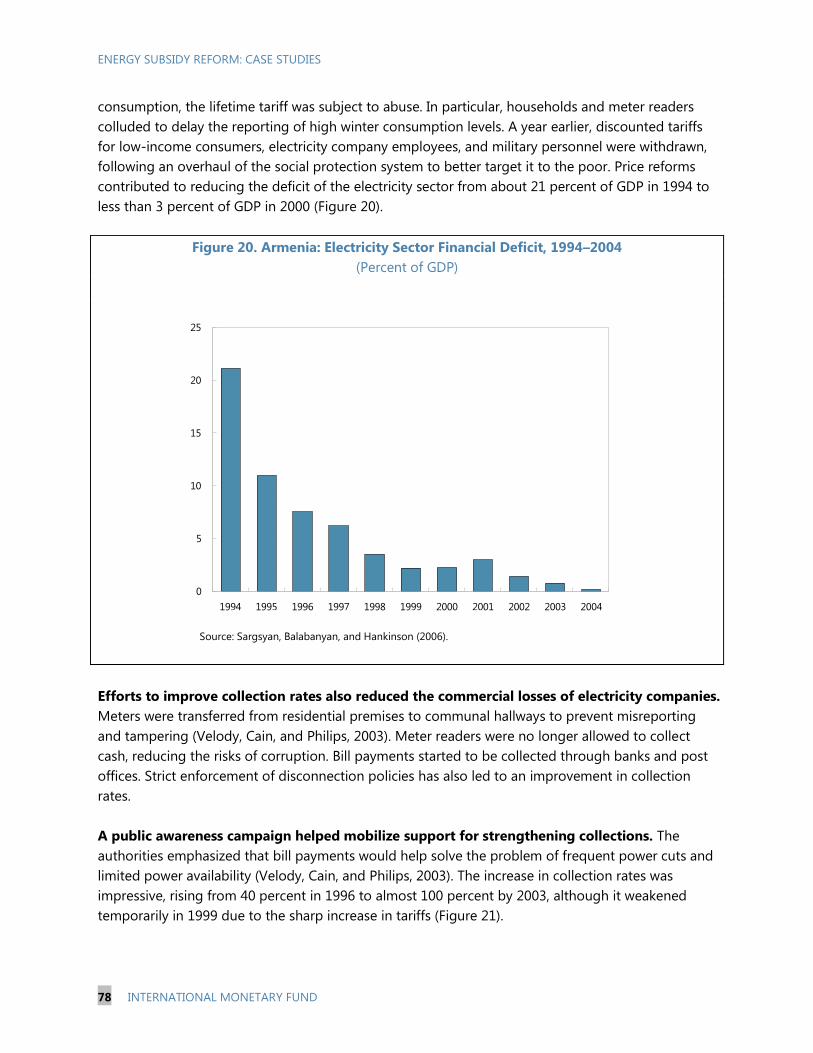
ENERGY SUBSIDY REFORM: CASE STUDIES
78 INTERNATIONAL MONETARY FUND
consumption, the lifetime tariff was subject to abuse. In particular, households and meter readers
colluded to delay the reporting of high winter consumption levels. A year earlier, discounted tariffs
for low-income consumers, electricity company employees, and military personnel were withdrawn,
following an overhaul of the social protection system to better target it to the poor. Price reforms
contributed to reducing the deficit of the electricity sector from about 21 percent of GDP in 1994 to
less than 3 percent of GDP in 2000 (Figure 20).
Figure 20. Armenia: Electricity Sector Financial Deficit, 1994–2004
(Percent of GDP)
Source: Sargsyan, Balabanyan, and Hankinson (2006).
Efforts to improve collection rates also reduced the commercial losses of electricity companies.
Meters were transferred from residential premises to communal hallways to prevent misreporting
and tampering (Velody, Cain, and Philips, 2003). Meter readers were no longer allowed to collect
cash, reducing the risks of corruption. Bill payments started to be collected through banks and post
offices. Strict enforcement of disconnection policies has also led to an improvement in collection
rates.
A public awareness campaign helped mobilize support for strengthening collections. The
authorities emphasized that bill payments would help solve the problem of frequent power cuts and
limited power availability (Velody, Cain, and Philips, 2003). The increase in collection rates was
impressive, rising from 40 percent in 1996 to almost 100 percent by 2003, although it weakened
temporarily in 1999 due to the sharp increase in tariffs (Figure 21).
0
5
10
15
20
25
1994 1995 1996 1997 1998 1999 2000 2001 2002 2003 2004Source: Sargsyan, Balabanyan, and Hankinson (2006).
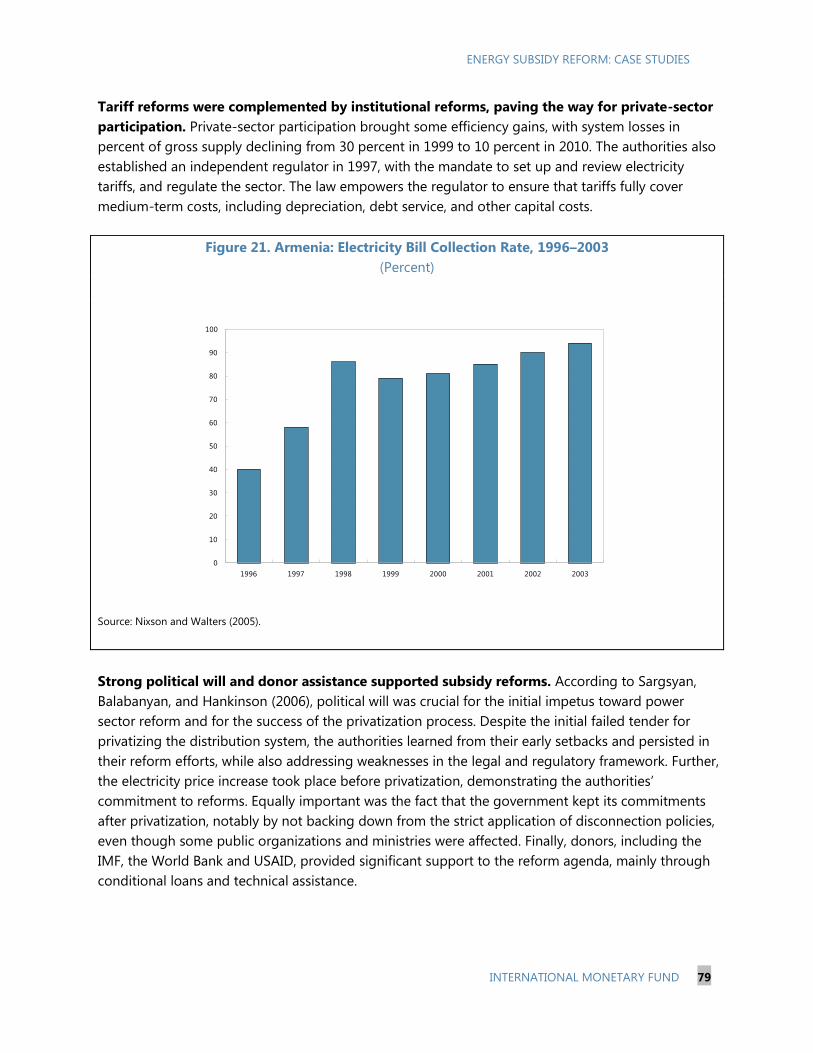
ENERGY SUBSIDY REFORM: CASE STUDIES
INTERNATIONAL MONETARY FUND 79
Tariff reforms were complemented by institutional reforms, paving the way for private-sector
participation. Private-sector participation brought some efficiency gains, with system losses in
percent of gross supply declining from 30 percent in 1999 to 10 percent in 2010. The authorities also
established an independent regulator in 1997, with the mandate to set up and review electricity
tariffs, and regulate the sector. The law empowers the regulator to ensure that tariffs fully cover
medium-term costs, including depreciation, debt service, and other capital costs.
Figure 21. Armenia: Electricity Bill Collection Rate, 1996–2003
(Percent)
Source: Nixson and Walters (2005).
Strong political will and donor assistance supported subsidy reforms. According to Sargsyan,
Balabanyan, and Hankinson (2006), political will was crucial for the initial impetus toward power
sector reform and for the success of the privatization process. Despite the initial failed tender for
privatizing the distribution system, the authorities learned from their early setbacks and persisted in
their reform efforts, while also addressing weaknesses in the legal and regulatory framework. Further,
the electricity price increase took place before privatization, demonstrating the authorities‘
commitment to reforms. Equally important was the fact that the government kept its commitments
after privatization, notably by not backing down from the strict application of disconnection policies,
even though some public organizations and ministries were affected. Finally, donors, including the
IMF, the World Bank and USAID, provided significant support to the reform agenda, mainly through
conditional loans and technical assistance.
0
10
20
30
40
50
60
70
80
90
100
1996 1997 1998 1999 2000 2001 2002 2003
Source: Nixson and Walters
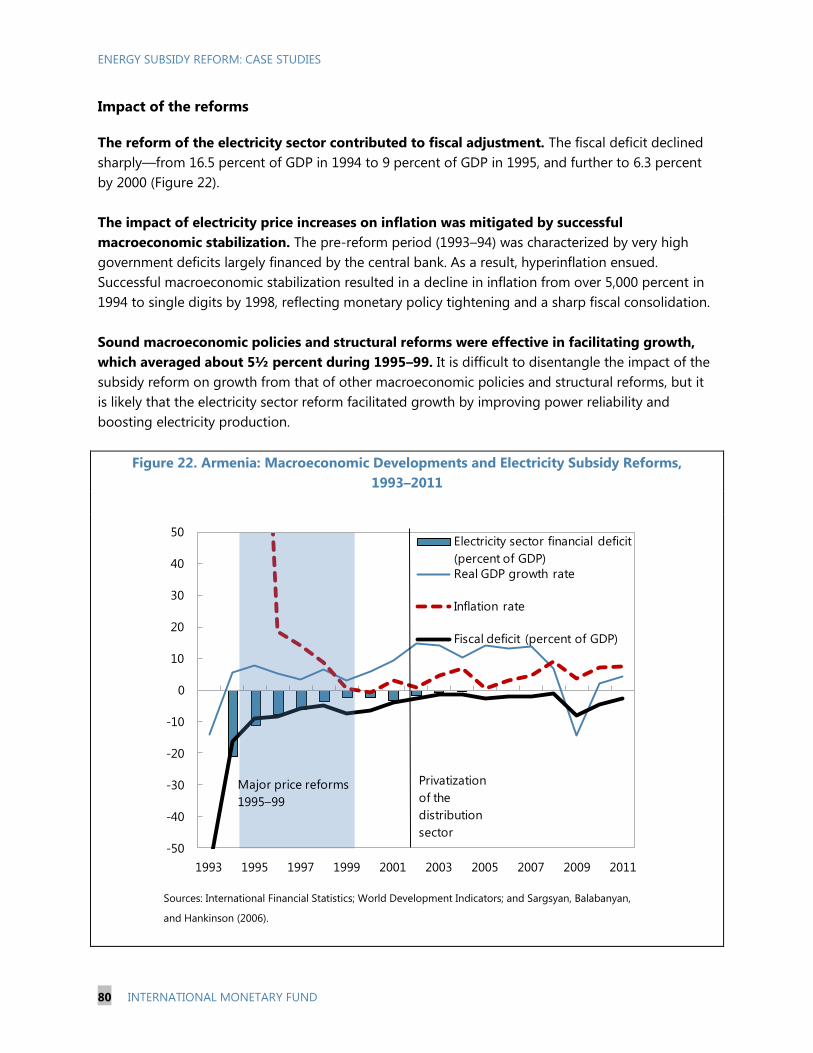
ENERGY SUBSIDY REFORM: CASE STUDIES
80 INTERNATIONAL MONETARY FUND
Impact of the reforms
The reform of the electricity sector contributed to fiscal adjustment. The fiscal deficit declined
sharply—from 16.5 percent of GDP in 1994 to 9 percent of GDP in 1995, and further to 6.3 percent
by 2000 (Figure 22).
The impact of electricity price increases on inflation was mitigated by successful
macroeconomic stabilization. The pre-reform period (1993–94) was characterized by very high
government deficits largely financed by the central bank. As a result, hyperinflation ensued.
Successful macroeconomic stabilization resulted in a decline in inflation from over 5,000 percent in
1994 to single digits by 1998, reflecting monetary policy tightening and a sharp fiscal consolidation.
Sound macroeconomic policies and structural reforms were effective in facilitating growth,
which averaged about 5½ percent during 1995–99. It is difficult to disentangle the impact of the
subsidy reform on growth from that of other macroeconomic policies and structural reforms, but it
is likely that the electricity sector reform facilitated growth by improving power reliability and
boosting electricity production.
Figure 22. Armenia: Macroeconomic Developments and Electricity Subsidy Reforms,
1993–2011
Sources: International Financial Statistics; World Development Indicators; and Sargsyan, Balabanyan,
and Hankinson (2006).
-50
-40
-30
-20
-10
0
10
20
30
40
50
1993 1995 1997 1999 2001 2003 2005 2007 2009 2011
Electricity sector financial deficit
(percent of GDP)
Real GDP growth rate
Inflation rate
Fiscal deficit (percent of GDP)
Major price reforms
1995–99
Privatization
of the
distribution
sector
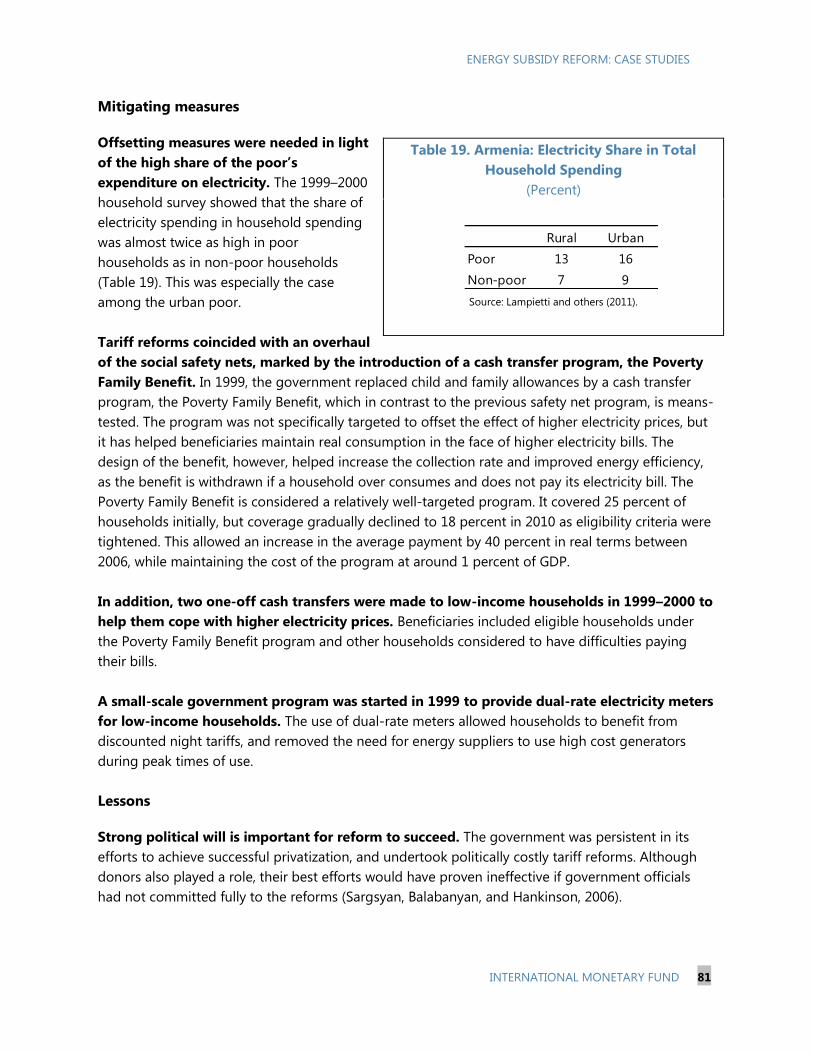
ENERGY SUBSIDY REFORM: CASE STUDIES
INTERNATIONAL MONETARY FUND 81
Mitigating measures
Offsetting measures were needed in light
of the high share of the poor’s
expenditure on electricity. The 1999–2000
household survey showed that the share of
electricity spending in household spending
was almost twice as high in poor
households as in non-poor households
(Table 19). This was especially the case
among the urban poor.
Tariff reforms coincided with an overhaul
of the social safety nets, marked by the introduction of a cash transfer program, the Poverty
Family Benefit. In 1999, the government replaced child and family allowances by a cash transfer
program, the Poverty Family Benefit, which in contrast to the previous safety net program, is means-
tested. The program was not specifically targeted to offset the effect of higher electricity prices, but
it has helped beneficiaries maintain real consumption in the face of higher electricity bills. The
design of the benefit, however, helped increase the collection rate and improved energy efficiency,
as the benefit is withdrawn if a household over consumes and does not pay its electricity bill. The
Poverty Family Benefit is considered a relatively well-targeted program. It covered 25 percent of
households initially, but coverage gradually declined to 18 percent in 2010 as eligibility criteria were
tightened. This allowed an increase in the average payment by 40 percent in real terms between
2006, while maintaining the cost of the program at around 1 percent of GDP.
In addition, two one-off cash transfers were made to low-income households in 1999–2000 to
help them cope with higher electricity prices. Beneficiaries included eligible households under
the Poverty Family Benefit program and other households considered to have difficulties paying
their bills.
A small-scale government program was started in 1999 to provide dual-rate electricity meters
for low-income households. The use of dual-rate meters allowed households to benefit from
discounted night tariffs, and removed the need for energy suppliers to use high cost generators
during peak times of use.
Lessons
Strong political will is important for reform to succeed. The government was persistent in its
efforts to achieve successful privatization, and undertook politically costly tariff reforms. Although
donors also played a role, their best efforts would have proven ineffective if government officials
had not committed fully to the reforms (Sargsyan, Balabanyan, and Hankinson, 2006).
Table 19. Armenia: Electricity Share in Total
Household Spending
(Percent)
Source: Lampietti and others (2011).
Rural Urban
Poor 13 16
Non-poor 7 9
ENERGY SUBSIDY REFORM: CASE STUDIES
82 INTERNATIONAL MONETARY FUND
A good regulatory environment that limits interference in setting tariffs can facilitate reform.
A proper legal framework for private-sector participation was put in the place, and an independent
regulatory commission was created to determine tariffs.
Measures to improve collections are essential. Strict enforcement of disconnection policies and
collection schemes (e.g., through bank accounts) that limit the risk of collusion between consumers
and meter readers can increase collection rates.
An effective public awareness campaign linking payments of utility bills to more reliable
service helps garner support for reform.
Implementation of mitigating measures for the poor helps fortify support for reform. A
means-tested cash transfer program was introduced, improving the targeting of social safety nets.
Additionally, two one-off cash payments and the provision of dual meters for low-income
households helped soften the impact of electricity price increases on the poor, thereby facilitating
public acceptance of the reforms. In the case of Armenia, there were useful synergies between the
simultaneous reforms of the social protection system and the energy sector.
References
Lampietti, Julian, 2004, ―Power‘s Promise: Electricity Reforms in Eastern Europe and Central Asia,‖
World Bank Working Paper No 40. (Washington: World Bank).
———, Anthony A. Kolb, Sumila Gulyani, and Vahram Avenesyan, 2011, ―Utility Pricing and the Poor:
Lessons from Armenia, ―World Bank Technical Papers No. 497 (Washington: World Bank).
Nixson, Frederick, and Bernard Walters, 2005, ―Utilities‘ Pricing and the Poor: the Case of Armenia,‖
UNDP Armenia White Paper (New York: United Nations Development Programme).
Sargsyan Gevorg, Ani Balabanyan, and Denzel Hankinson, 2006, ―From Crisis to Stability in the
Armenian Power Sector: Lessons Learned from Armenia‘s Energy Reform Experience,‖ World
Bank Working Paper No. 74 (Washington: World Bank).
Velody, Mark, Michael J.G. Cain, and Michael Philips, 2003, ―Energy Reform and Social Protection in
Armenia,‖ in A Regional Review of Social Safety Net Approaches: In Support of Energy Sector
Reform (Washington: United States Agency for International Development).
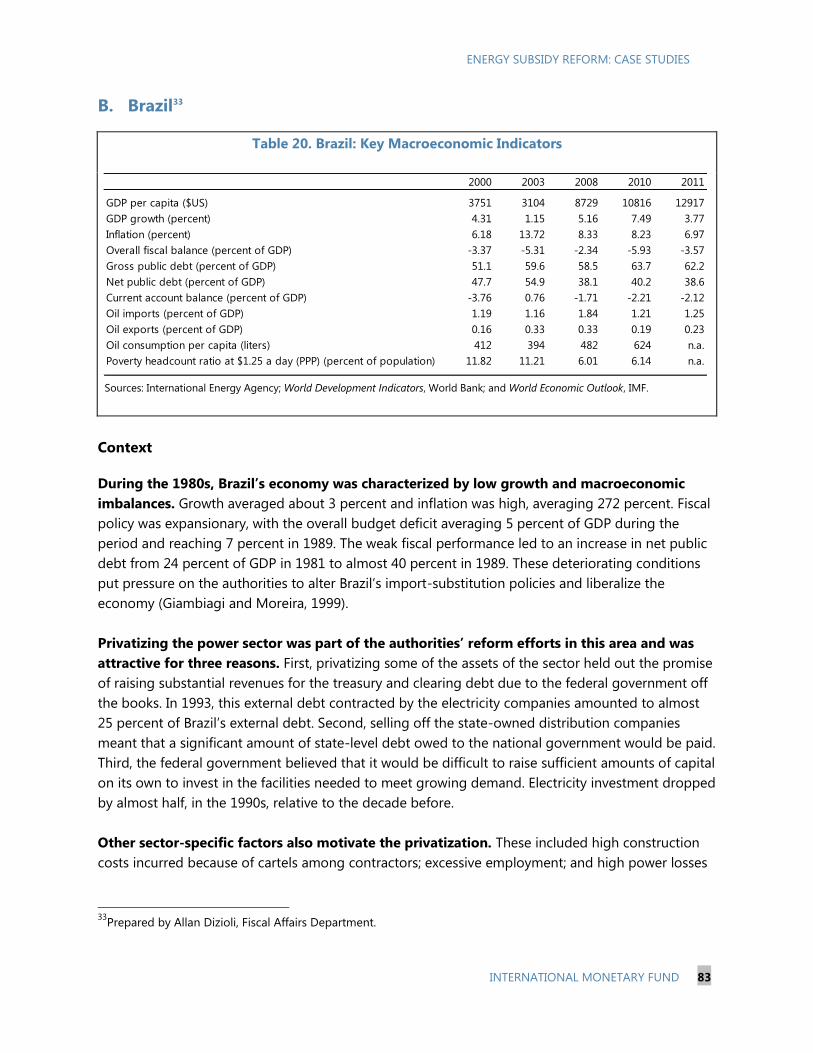
ENERGY SUBSIDY REFORM: CASE STUDIES
INTERNATIONAL MONETARY FUND 83
B. Brazil33
Table 20. Brazil: Key Macroeconomic Indicators
Sources: International Energy Agency; World Development Indicators, World Bank; and World Economic Outlook, IMF.
Context
During the 1980s, Brazil’s economy was characterized by low growth and macroeconomic
imbalances. Growth averaged about 3 percent and inflation was high, averaging 272 percent. Fiscal
policy was expansionary, with the overall budget deficit averaging 5 percent of GDP during the
period and reaching 7 percent in 1989. The weak fiscal performance led to an increase in net public
debt from 24 percent of GDP in 1981 to almost 40 percent in 1989. These deteriorating conditions
put pressure on the authorities to alter Brazil‘s import-substitution policies and liberalize the
economy (Giambiagi and Moreira, 1999).
Privatizing the power sector was part of the authorities’ reform efforts in this area and was
attractive for three reasons. First, privatizing some of the assets of the sector held out the promise
of raising substantial revenues for the treasury and clearing debt due to the federal government off
the books. In 1993, this external debt contracted by the electricity companies amounted to almost
25 percent of Brazil‘s external debt. Second, selling off the state-owned distribution companies
meant that a significant amount of state-level debt owed to the national government would be paid.
Third, the federal government believed that it would be difficult to raise sufficient amounts of capital
on its own to invest in the facilities needed to meet growing demand. Electricity investment dropped
by almost half, in the 1990s, relative to the decade before.
Other sector-specific factors also motivate the privatization. These included high construction
costs incurred because of cartels among contractors; excessive employment; and high power losses
33
Prepared by Allan Dizioli, Fiscal Affairs Department.
2000 2003 2008 2010 2011
GDP per capita ($US) 3751 3104 8729 10816 12917
GDP growth (percent) 4.31 1.15 5.16 7.49 3.77
Inflation (percent) 6.18 13.72 8.33 8.23 6.97
Overall fiscal balance (percent of GDP) -3.37 -5.31 -2.34 -5.93 -3.57
Gross public debt (percent of GDP) 51.1 59.6 58.5 63.7 62.2
Net public debt (percent of GDP) 47.7 54.9 38.1 40.2 38.6
Current account balance (percent of GDP) -3.76 0.76 -1.71 -2.21 -2.12
Oil imports (percent of GDP) 1.19 1.16 1.84 1.21 1.25
Oil exports (percent of GDP) 0.16 0.33 0.33 0.19 0.23
Oil consumption per capita (liters) 412 394 482 624 n.a.
Poverty headcount ratio at $1.25 a day (PPP) (percent of population) 11.82 11.21 6.01 6.14 n.a.
ENERGY SUBSIDY REFORM: CASE STUDIES
84 INTERNATIONAL MONETARY FUND
throughout the system. Finally, private distribution companies would establish tariff structures that
were more reflective of costs.
The performance of the sector in the 1980s was poor and provided the primary impetus for
structural change. A number of factors contributed to this weak performance, including the
regulatory framework for determining prices. This was determined by the Planning Secretary of the
President‘s Office. Price adjustments were influenced by the desire to contain inflation and were
unrelated to developments in costs and the need to ensure an adequate rate of return to capital.
This approach to pricing resulted in declining electricity tariffs in real terms and undermined
incentives for improving productivity. It led to a worsening of the companies‘ financial position and
an increase in external debt to finance expansion of the electricity supply. As a result, by 1993 debt
accumulated in the CRC (Conta de Resultados a Compensar) reached US$26 billion in 1993, which
was absorbed by the central government in the same year. Assuming this represented the
accumulation of losses over the preceding five years, the subsidy to the electricity sector had
averaged 0.7 percent of GDP per year in 1987 (Figure 23).
Reforms of electricity pricing
The overall plan devised for the power sector was for all assets to be privatized to the fullest
extent possible. In order to remove constraints for privatization, in 1993 the requirements of
uniform national tariffs and of a mandated 10 percent rate of return on capital were removed.
Significant pricing reforms were also undertaken. To increase the transparency of the pricing system
in the electricity sector, a law was enacted in 1998 unbundling the electricity sector system.
The government decided to begin the electricity sector privatization with the distribution
companies. This was motivated by the fact that substantial productivity gains could be realized in
these activities. In addition, the financial problems in these companies had ripple effects in the entire
sector, since financially insolvent distribution companies were not paying electricity generation
companies. Fixing the finances of the distribution companies and making them creditworthy buyers
of energy had a positive effect on the power generation sector and helped pave the way for
privatizing these assets.
The privatization program took place over a 10-year period from 1993 to 2003 and resulted in
a competitive generation market with a number of private companies competing. The
distribution sector was privatized under a series of monopoly licenses although over time the end
users could obtain third-party access to the grid and the industry was under regulatory jurisdiction.
The 1993 reforms were successful, from a fiscal point of view, in eliminating subsidies.
However, the privatization of the sector was not accompanied by a strong regulatory framework.
This led to an uncertain investment climate and the suspension in the construction of some
distribution lines. The lack of investment in electricity generation, combined with a drought in 2001,
caused Brazil‘s hydroelectricity reservoirs to become dangerously depleted. In order to avoid a
larger energy supply crisis, the government introduced regulations that forced producers to ration
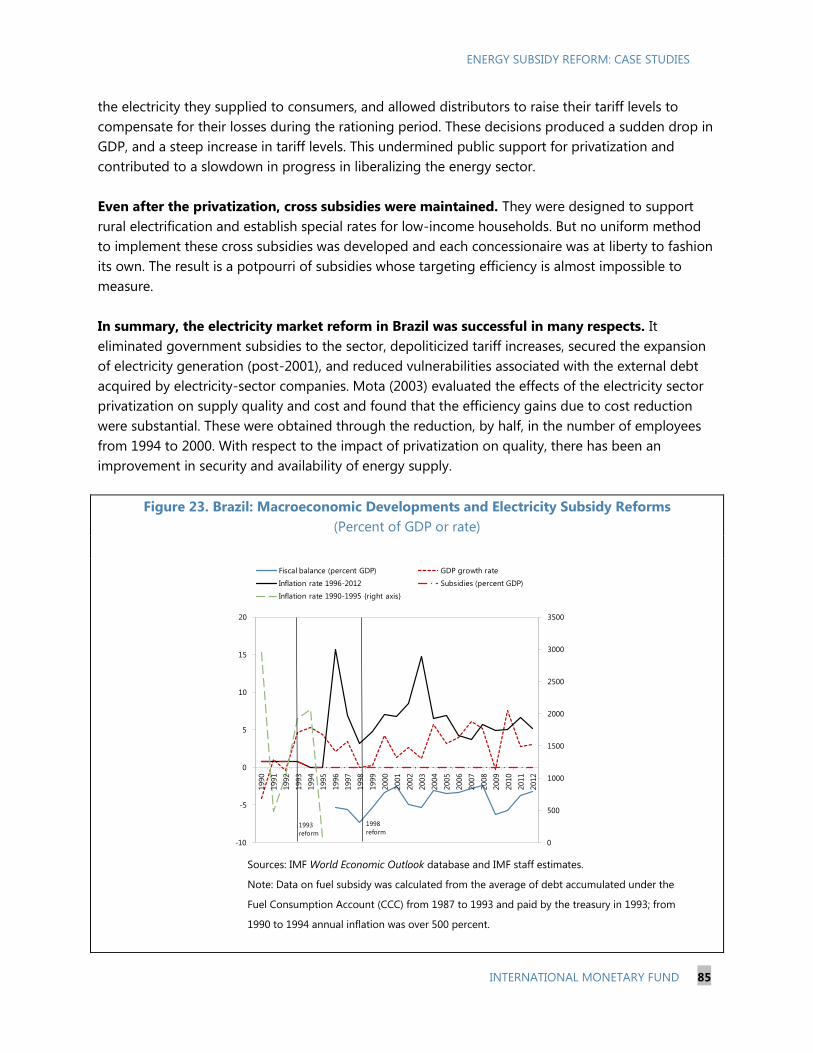
ENERGY SUBSIDY REFORM: CASE STUDIES
INTERNATIONAL MONETARY FUND 85
the electricity they supplied to consumers, and allowed distributors to raise their tariff levels to
compensate for their losses during the rationing period. These decisions produced a sudden drop in
GDP, and a steep increase in tariff levels. This undermined public support for privatization and
contributed to a slowdown in progress in liberalizing the energy sector.
Even after the privatization, cross subsidies were maintained. They were designed to support
rural electrification and establish special rates for low-income households. But no uniform method
to implement these cross subsidies was developed and each concessionaire was at liberty to fashion
its own. The result is a potpourri of subsidies whose targeting efficiency is almost impossible to
measure.
In summary, the electricity market reform in Brazil was successful in many respects. It
eliminated government subsidies to the sector, depoliticized tariff increases, secured the expansion
of electricity generation (post-2001), and reduced vulnerabilities associated with the external debt
acquired by electricity-sector companies. Mota (2003) evaluated the effects of the electricity sector
privatization on supply quality and cost and found that the efficiency gains due to cost reduction
were substantial. These were obtained through the reduction, by half, in the number of employees
from 1994 to 2000. With respect to the impact of privatization on quality, there has been an
improvement in security and availability of energy supply.
Figure 23. Brazil: Macroeconomic Developments and Electricity Subsidy Reforms
(Percent of GDP or rate)
Sources: IMF World Economic Outlook database and IMF staff estimates.
Note: Data on fuel subsidy was calculated from the average of debt accumulated under the
Fuel Consumption Account (CCC) from 1987 to 1993 and paid by the treasury in 1993; from
1990 to 1994 annual inflation was over 500 percent.
0
500
1000
1500
2000
2500
3000
3500
-10
-5
0
5
10
15
20
1990
1991
1992
1993
1994
1995
1996
1997
1998
1999
2000
2001
2002
2003
2004
2005
2006
2007
2008
2009
2010
2011
2012
Fiscal balance (percent GDP) GDP growth rate
Inflation rate 1996-2012 Subsidies (percent GDP)
Inflation rate 1990-1995 {right axis}
1993
reform
1998
reform
ENERGY SUBSIDY REFORM: CASE STUDIES
86 INTERNATIONAL MONETARY FUND
Mitigating measures
Even after the liberalization of the sector, regional cross subsidies remained.
A levy on electricity tariffs was introduced in 1993 to subsidize the supply of fuels to the
inefficient thermal power plants of Amazonia, a politically sensitive region, and was maintained
for an extended period.
In 1995, legislation was approved to provide lower electricity tariffs for low-income households.
In 2003, the government introduced a program to finance free electricity to 10 million rural
people, which is funded by levies on electricity tariffs.
Lessons
The need to correct macroeconomic imbalances can provide political support for reforms. The
low economic growth, hyperinflation, and high external debt burden of Brazil in the 1980s forced
politicians to react and consider subsidy reform as an option to confront these imbalances.
Controlling increases in electricity prices as an anti-inflationary tool can have adverse fiscal
consequences. The adoption of this policy in the 1980s resulted in financial losses for the sector,
the accumulation of debt, and underinvestment.
Reforms have a better chance of success with a popular government. After controlling the
hyperinflation, which had been chronic for over a decade, President Cardoso‘s administration was
able to capitalize on this political support to undertake his agenda for energy sector liberalization.
Targeted social programs can reduce opposition to subsidy reform and assist the poor. Brazil
has adopted a policy to reduce the electricity tariffs for low income people and has adopted a
conditional cash transfer program, which facilitated the implementation of the subsidy reforms.
Privatization of electricity companies without a strong regulatory framework can have serious
consequences and undermine popular support for energy reform. The unclear rules in the first
years of the privatization process resulted in low levels of investment and contributed to the energy
crisis in 2001.
ENERGY SUBSIDY REFORM: CASE STUDIES
INTERNATIONAL MONETARY FUND 87
References
Bonini, Mario, 2011, ―Tarifas de Energia Elétrica: Evolução nos Últimos Anos e Perspectivas,‖ Grupo
de Economia / Fundap Boletim de Economia, Vol. 8.
Brown, Ashley C., 2002, ―The Privatization of Brazil's Electricity Industry: Sector Reform or
Restatement of the Government‘s Balance Sheet?‖ Working Paper (Washington:
Inter-American Development Bank).
de Araujo, J. L. R. H., 2006, ―The Case of Brazil: Reform by Trial and Error?‖ In International Experience
in Restructured Electricity Markets: What Works, What Does Not, and Why? ed. by
F. P. Sioshansi and W. Pfaffenberger, Vol. 1 (Oxford: Elsevier).
de Oliveira, Adilson, and Tara Laan, 2010, ―Lessons Learned from Brazil‘s Experience with Fossil-Fuel
Subsidies and their Reform,‖ International Institute for Sustainable Development, Trade,
Investment, and Climate Change Series (Winnipeg: International Institute for Sustainable
Development).
Giambiagi, Fabio, and Maurício Moreira, 1999, ―A Economia Brasileira nos Anos 90,‖ (Rio de Janeiro:
Banco Nacional de Desenvolvimento Econômico e Social).
Gomes, Antônio Claret S., Carlos David G. Abarca, Elíada Antonieta S. T. Faria, and Heloísa Helena de
O. Fernandes, 2003, ―O Setor Eletrico no Brasil,‖ Estudos Setoriais 14, (Rio de Janeiro: Banco
Nacional de Desenvolvimento Econômico e Social).
Montalvao, Edmundo, 2009, ―Impacto de Tributos, Encargos, e Subsidios Setoriais Sobre as Contas
de Luz dos Consumidores,‖ Working Paper No. 62, (Brasilia: Centro de Estudos da
Consultoriado Senado Federal).
Mota, Raffaella, 2003, ―The Restructuring and Privatisation of Electricity Distribution and Supply
Business in Brazil: A Social Cost-Benefit Analysis,‖ Working Paper No. WP 0309, (Cambridge:
University of Cambridge, Department of Applied Economics).
Pinheiro, Armando, 1999, ―Privatização no Brasil: Por quê? Até onde? Até quando?,‖ (Rio de Janeiro:
Banco Nacional de Desenvolvimento Econômico e Social).
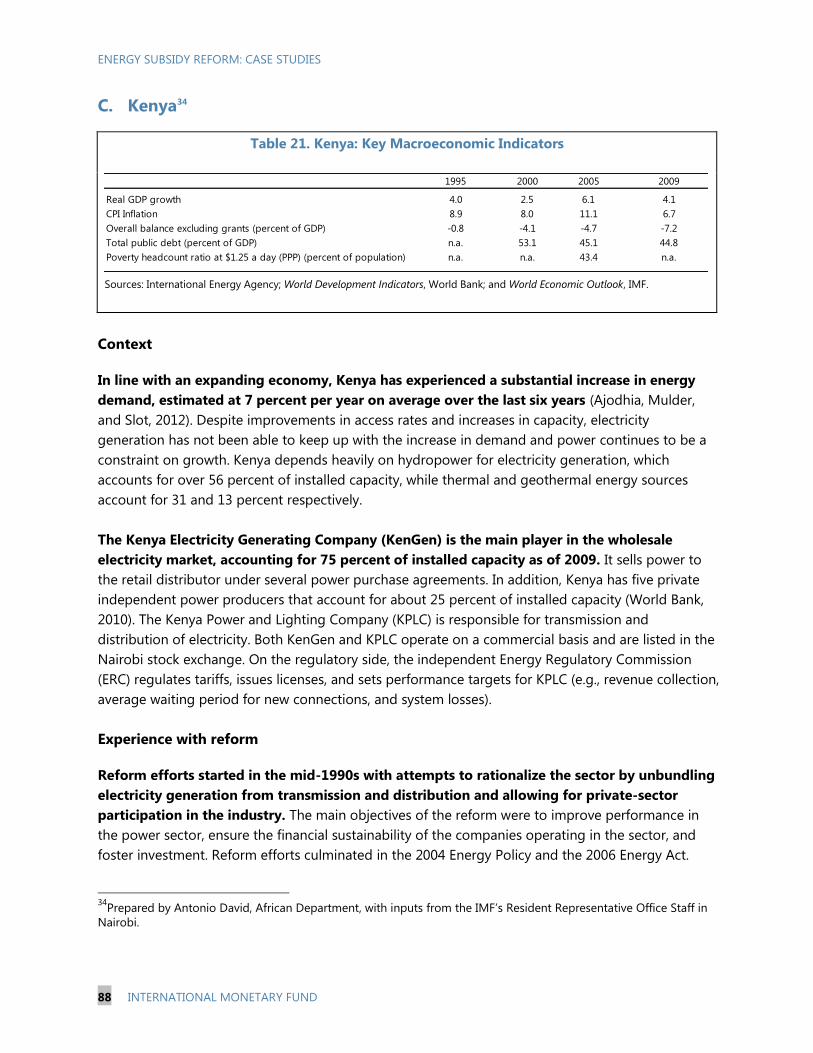
ENERGY SUBSIDY REFORM: CASE STUDIES
88 INTERNATIONAL MONETARY FUND
C. Kenya34
Table 21. Kenya: Key Macroeconomic Indicators
Sources: International Energy Agency; World Development Indicators, World Bank; and World Economic Outlook, IMF.
Context
In line with an expanding economy, Kenya has experienced a substantial increase in energy
demand, estimated at 7 percent per year on average over the last six years (Ajodhia, Mulder,
and Slot, 2012). Despite improvements in access rates and increases in capacity, electricity
generation has not been able to keep up with the increase in demand and power continues to be a
constraint on growth. Kenya depends heavily on hydropower for electricity generation, which
accounts for over 56 percent of installed capacity, while thermal and geothermal energy sources
account for 31 and 13 percent respectively.
The Kenya Electricity Generating Company (KenGen) is the main player in the wholesale
electricity market, accounting for 75 percent of installed capacity as of 2009. It sells power to
the retail distributor under several power purchase agreements. In addition, Kenya has five private
independent power producers that account for about 25 percent of installed capacity (World Bank,
2010). The Kenya Power and Lighting Company (KPLC) is responsible for transmission and
distribution of electricity. Both KenGen and KPLC operate on a commercial basis and are listed in the
Nairobi stock exchange. On the regulatory side, the independent Energy Regulatory Commission
(ERC) regulates tariffs, issues licenses, and sets performance targets for KPLC (e.g., revenue collection,
average waiting period for new connections, and system losses).
Experience with reform
Reform efforts started in the mid-1990s with attempts to rationalize the sector by unbundling
electricity generation from transmission and distribution and allowing for private-sector
participation in the industry. The main objectives of the reform were to improve performance in
the power sector, ensure the financial sustainability of the companies operating in the sector, and
foster investment. Reform efforts culminated in the 2004 Energy Policy and the 2006 Energy Act.
34
Prepared by Antonio David, African Department, with inputs from the IMF‘s Resident Representative Office Staff in
Nairobi.
1995 2000 2005 2009
Real GDP growth 4.0 2.5 6.1 4.1
CPI Inflation 8.9 8.0 11.1 6.7
Overall balance excluding grants (percent of GDP) -0.8 -4.1 -4.7 -7.2
Total public debt (percent of GDP) n.a. 53.1 45.1 44.8
Poverty headcount ratio at $1.25 a day (PPP) (percent of population) n.a. n.a. 43.4 n.a.
ENERGY SUBSIDY REFORM: CASE STUDIES
INTERNATIONAL MONETARY FUND 89
Substantial changes in the tariff structure first occurred in 2005, when revisions were introduced to
reflect long-run marginal costs and automatically pass-through changes in fuel costs and exchange
rate movements. Tariff reform has proved to be durable, but it is important to note that tariff
increases occurred concomitantly with improvements in the quality of service. Furthermore, the
reform process did not involve any retrenchment of staff in the utilities. The setting up of an Energy
Tribunal to arbitrate on disputes between ERC and stakeholders has been instrumental in creating a
level playing field in the sector.
Tariffs are based on a formula that, in addition to the basic rate of charge, reflects long-run
marginal costs and features a monthly automatic pass-through of generation-related fuel
costs and adjustments for exchange rate movements. Furthermore, every six months the formula
also takes into account adjustments for domestic inflation. Information on the calculation of tariff
adjustments is readily available on the ERC‘s website. On the generation side, KenGen has long-term
power purchase agreements with KPLC that determine prices and generally reflect underlying costs.
Moreover, residential electricity tariffs in Kenya are based on an increasing block tariff scheme (IBT),
such that the unit price per kWh increases according to three defined blocks. The first block ranges
from 0 up to 50 kWh per month at a rate of K Sh 2 per kWh. The second block rages from 51 to
1,500 kWh per month at a rate of K Sh 8.10. Finally, the third block applies to households that
consume more than 1,500 kWh per month with a rate of 18.57 per KWh. Thus, the tariff rate charged
to the highest block is over 828 percent higher than the rate applicable to the lowest one.
Residential consumers also pay a fixed charge of K Sh 120. Non-residential consumers are charged
different linear rates (which do not vary according to consumption levels) depending on their
category (i.e., commercial, industrial, or government).
Earlier in the reform process, tariff increases faced significant difficulties and required intense
negotiations, particularly with large consumers (Bacon, Ley, and Kojima, 2010). Key in securing
the cooperation of the private sector was the commitment by the government that the additional
cost of energy would help finance the development and expansion of domestic sources of
renewable energy that would ultimately reduce the cost of power and strengthen competitiveness.
Moreover, there was agreement among stakeholders that ensuring the financial soundness of
KenGen and KPLC and setting up a tariff structure reflecting true costs were essential in order to
attract foreign investors into the sector. Subsequently, owing to the negative impact of droughts in
2008 and 2009, a decision was taken to lower the value-added tax (VAT) rate on electricity from
16 to 12 percent.
Power pricing reforms in Kenya allowed tariffs to increase in line with costs from an
estimated average of $0.07 per kWh in 2000 to $0.15 in 2006, and $0.19 in 2009 (Table 21). The
current electricity tariff structure for KPLC tariffs has been in place since July 2008. According to the
World Bank (2010), currently the negotiations for tariff-setting and power purchase agreements are
transparent; the regulatory framework in the sector is robust and resistant to political interference.
However, planned increases in the basic tariff rate in June 2011 did not occur due to political
economy constraints because the authorities believed the prevailing food and energy prices were
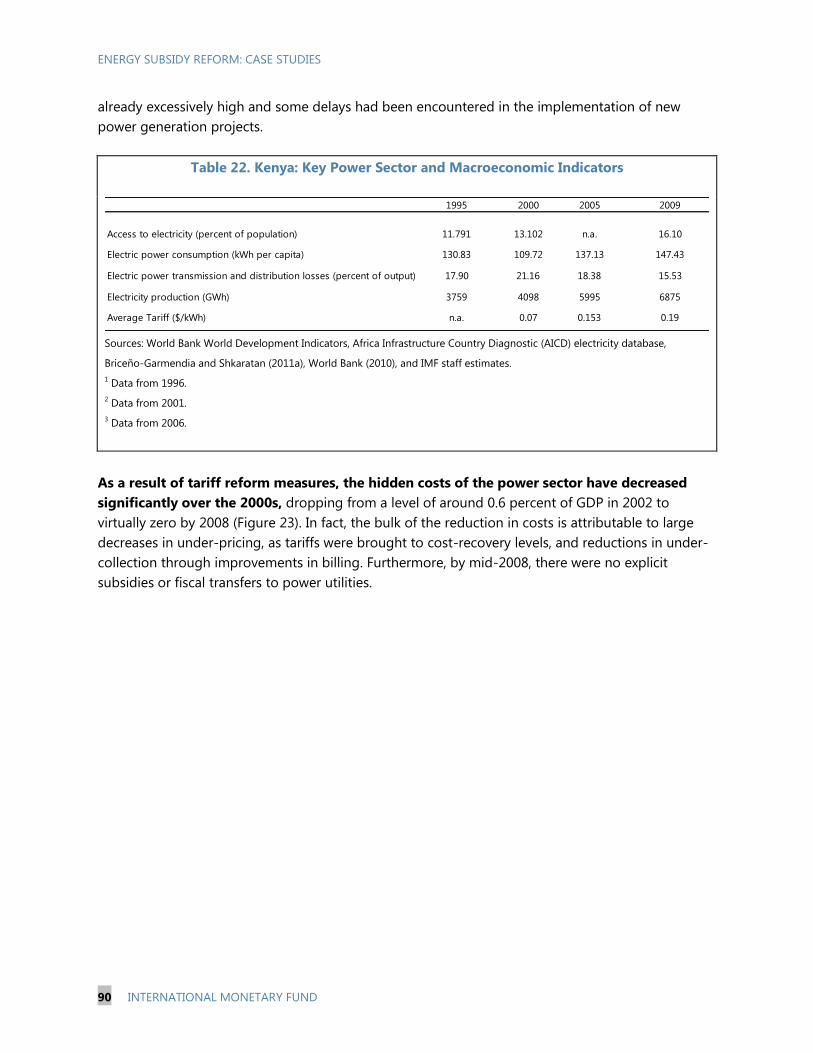
ENERGY SUBSIDY REFORM: CASE STUDIES
90 INTERNATIONAL MONETARY FUND
already excessively high and some delays had been encountered in the implementation of new
power generation projects.
Table 22. Kenya: Key Power Sector and Macroeconomic Indicators
Sources: World Bank World Development Indicators, Africa Infrastructure Country Diagnostic (AICD) electricity database,
Briceño-Garmendia and Shkaratan (2011a), World Bank (2010), and IMF staff estimates.
1 Data from 1996.
2 Data from 2001.
3 Data from 2006.
As a result of tariff reform measures, the hidden costs of the power sector have decreased
significantly over the 2000s, dropping from a level of around 0.6 percent of GDP in 2002 to
virtually zero by 2008 (Figure 23). In fact, the bulk of the reduction in costs is attributable to large
decreases in under-pricing, as tariffs were brought to cost-recovery levels, and reductions in under-
collection through improvements in billing. Furthermore, by mid-2008, there were no explicit
subsidies or fiscal transfers to power utilities.
1995 2000 2005 2009
Access to electricity (percent of population) 11.791 13.102 n.a. 16.10
Electric power consumption (kWh per capita) 130.83 109.72 137.13 147.43
Electric power transmission and distribution losses (percent of output) 17.90 21.16 18.38 15.53
Electricity production (GWh) 3759 4098 5995 6875
Average Tariff ($/kWh) n.a. 0.07 0.153 0.19
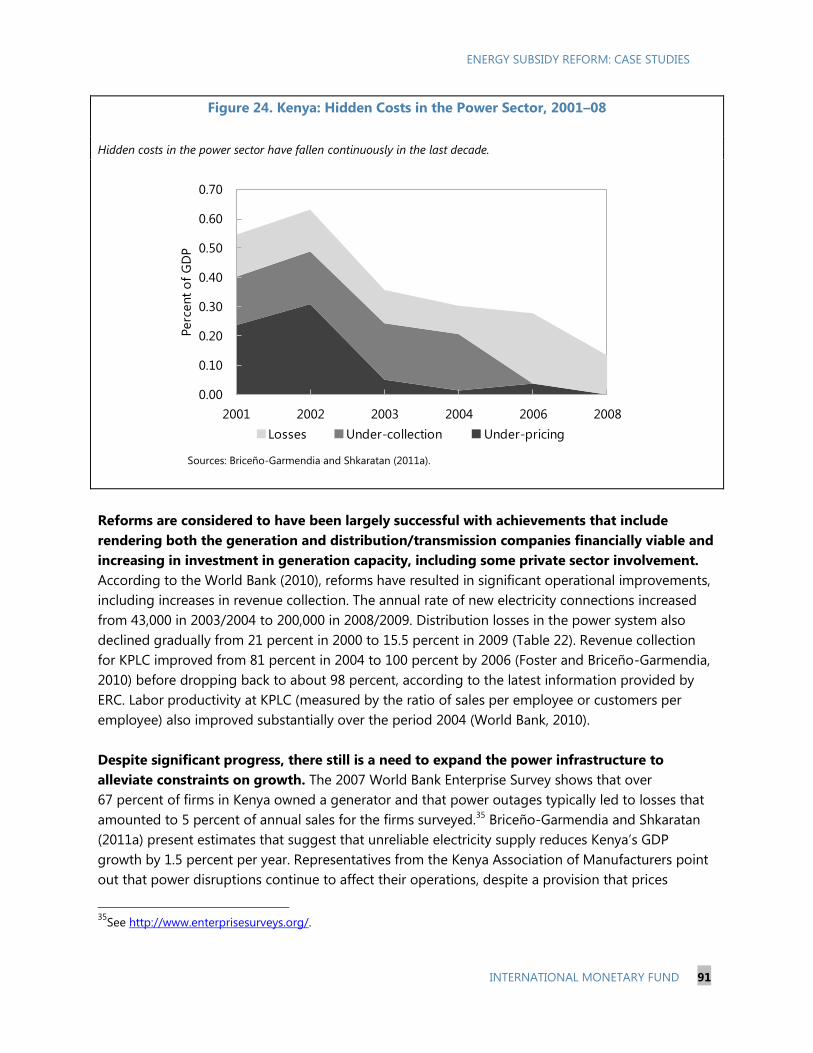
ENERGY SUBSIDY REFORM: CASE STUDIES
INTERNATIONAL MONETARY FUND 91
Figure 24. Kenya: Hidden Costs in the Power Sector, 2001–08
Hidden costs in the power sector have fallen continuously in the last decade.
Sources: Briceño-Garmendia and Shkaratan (2011a).
Reforms are considered to have been largely successful with achievements that include
rendering both the generation and distribution/transmission companies financially viable and
increasing in investment in generation capacity, including some private sector involvement.
According to the World Bank (2010), reforms have resulted in significant operational improvements,
including increases in revenue collection. The annual rate of new electricity connections increased
from 43,000 in 2003/2004 to 200,000 in 2008/2009. Distribution losses in the power system also
declined gradually from 21 percent in 2000 to 15.5 percent in 2009 (Table 22). Revenue collection
for KPLC improved from 81 percent in 2004 to 100 percent by 2006 (Foster and Briceño-Garmendia,
2010) before dropping back to about 98 percent, according to the latest information provided by
ERC. Labor productivity at KPLC (measured by the ratio of sales per employee or customers per
employee) also improved substantially over the period 2004 (World Bank, 2010).
Despite significant progress, there still is a need to expand the power infrastructure to
alleviate constraints on growth. The 2007 World Bank Enterprise Survey shows that over
67 percent of firms in Kenya owned a generator and that power outages typically led to losses that
amounted to 5 percent of annual sales for the firms surveyed.35
Briceño-Garmendia and Shkaratan
(2011a) present estimates that suggest that unreliable electricity supply reduces Kenya‘s GDP
growth by 1.5 percent per year. Representatives from the Kenya Association of Manufacturers point
out that power disruptions continue to affect their operations, despite a provision that prices
35
See http://www.enterprisesurveys.org/.
0.00
0.10
0.20
0.30
0.40
0.50
0.60
0.70
2001 2002 2003 2004 2006 2008
Perc
ent
of
GD
P
Losses Under-collection Under-pricing
ENERGY SUBSIDY REFORM: CASE STUDIES
92 INTERNATIONAL MONETARY FUND
charged by KPLC to its customers incorporate a requirement that system losses cannot exceed
15 percent.36
Mitigating measures
In order to address social objectives and affordability concerns a number of measures have
been adopted (World Bank, 2010, ERC website, Briceño-Garmendia and Shkaratan, 2011b). These
include a rural electrification program that has helped increase the number of connections from
650,000 in 2003 to 2 million at present, a revolving fund for deferred connection fee payments
(financed by donor funds), commercial bank loans for connection fees, and a ―life-line‖ tariff (below
costs) for households that consume less than 50 kWh per month, which is cross-subsidized by rates
imposed on larger consumers. The 50 kWh per month threshold is commonly used in Africa as a
benchmark for the subsistence level of energy consumption. It is estimated to be affordable for
99 percent of Kenyan households (Briceño-Garmendia and Shkaratan, 2011b). In addition, there are
cross-subsidies from urban to rural consumers, as tariffs are uniform across these areas.
Access continues to be a challenge, particularly in rural areas, where access rates are
estimated at 4 percent in 2009 compared to 51 percent for urban locations. Briceño-Garmendia
and Shkaratan (2011a) argue that Kenya will need to double its current installed capacity over the
next decade and will need to reinforce cross-border transmission links with neighboring countries to
increase access to cheaper hydroelectric power and improve overall system security. Despite the fact
that there is scope to reduce energy costs through regional interconnections, exchanges across
countries in the East Africa power pool are still small.
Lessons
Successful electricity reform involves more than tariff changes and it takes time. The reform of
the power sector in Kenya started in the mid-1990s and took over 10 years to mature. Apart from a
prudent tariff policy, improving the technical and administrative efficiency of state-owned
companies was key to eliminating hidden costs. The establishment of a relatively sound regulatory
framework (including a regulator that is considered to be largely effective and independent) has also
been vital to the durability of the reform process and to encouraging greater private sector
participation in generation capacity.
Tariff increases were arguably made more acceptable because they were accompanied by
improvements in quality service delivery and access. At the earlier stages of the reform process,
authorities actively negotiated changes in tariffs with stakeholders demonstrating strong political
commitment to addressing the challenges of the sector. At the moment, the transparent (with
information regularly published on the ERC‘s website) automatic adjustments to changes in fuel
36
Members of the Kenya Association of Manufacturers account for approximately 60 percent of total industrial
energy consumption.
ENERGY SUBSIDY REFORM: CASE STUDIES
INTERNATIONAL MONETARY FUND 93
costs, exchange rate movements, and inflation appear to be largely accepted by consumers.
Nevertheless, political economy constraints have led to the postponement of a revision in the tariff
structure scheduled for mid-2011.
The Kenyan experience also shows that with appropriate instruments, it is possible to
reconcile tariff rates at cost-recovery levels with affordability of services for poorer segments
of the population. Estimates suggest that the vast majority of Kenyan households are able to afford
basic electricity consumption at the effective tariff rate. In addition to the so-called life-line tariffs
(cross-subsidized by large electricity consumers), authorities also implemented alternative
mechanisms to alleviate the burden of connection fees, such as a revolving fund for deferred
payments (financed by donors) as well as commercial bank loans.
References
Ajodhia, V.W. Mulder, and T. Slot, 2012, ―Tariff Structures for Sustainable Electrification in Africa‖
(Arnhem, Netherlands: KEMA).
Bacon, R, E. Ley, and M. Kojima, 2010, ―Subsidies in the Energy Sector: An Overview‖ Background
Paper for the World Bank Group Energy Sector Strategy, July (Washington: World Bank).
Briceño-Garmendia, C., and M. Shkaratan, 2011a, ―Kenya‘s Infrastructure: A Continental Perspective‖
World Bank Policy Research Working Paper No. 5596 (Washington: World Bank).
———, 2011b, ―Power Tariffs: Caught Between Costs Recovery and Affordability‖ World Bank Policy
Research Working Paper No. 5904, (Washington: World Bank).
International Monetary Fund, 2008, ―Kenya: 2008 Article IV Consultation Staff Report‖ IMF Country
Report No. 08/339 (Washington). Available via the Internet:
http://www.imf.org/external/pubs/ft/scr/2008/cr08339.pdf.
———, 2012, ―Kenya: Third Review Under the Three-Year Arrangement Under the Extended Credit
Facility and Request for Modification of Performance Criteria—Staff Report‖ IMF Country
Report No. 12/97 (Washington).
Foster, V. and C. Briceño -Garmendia, 2010, Africa‘s Infrastructure: A Time for Transformation
(Washington: World Bank).
World Bank, 2010, ―Project Appraisal Document for the Electricity Expansion Project‖ Report
No. 54147-KE, May (Washington).
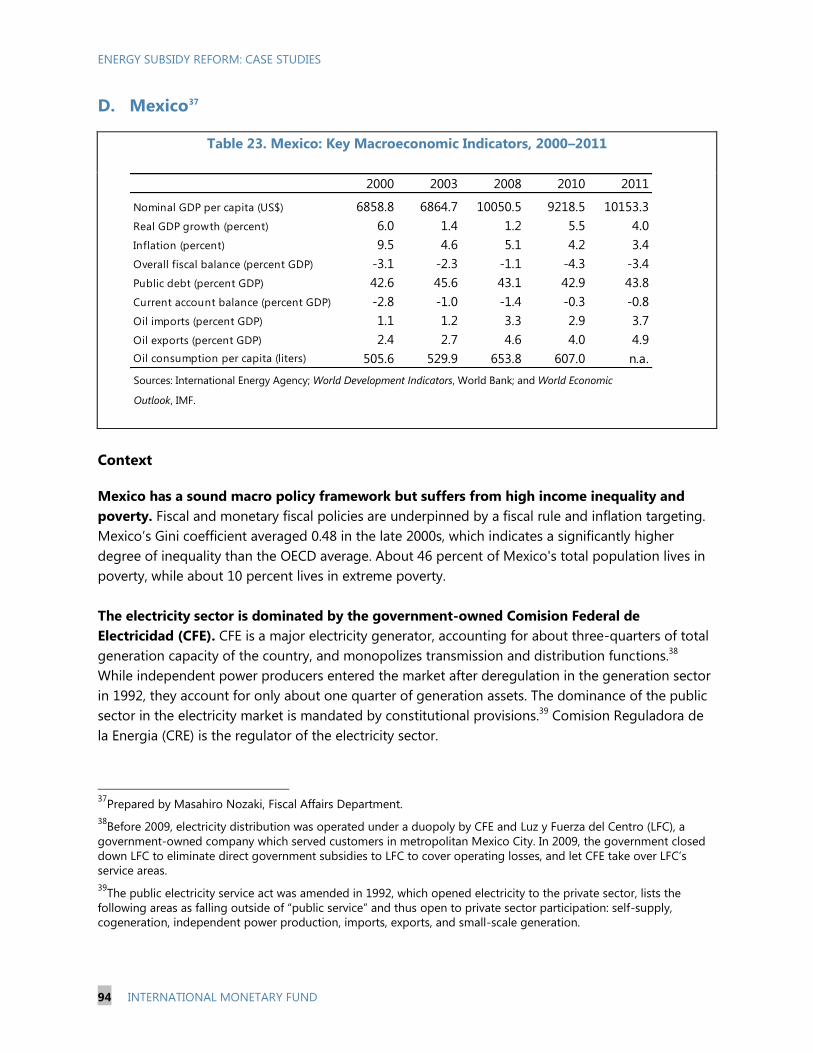
ENERGY SUBSIDY REFORM: CASE STUDIES
94 INTERNATIONAL MONETARY FUND
D. Mexico37
Table 23. Mexico: Key Macroeconomic Indicators, 2000–2011
Sources: International Energy Agency; World Development Indicators, World Bank; and World Economic
Outlook, IMF.
Context
Mexico has a sound macro policy framework but suffers from high income inequality and
poverty. Fiscal and monetary fiscal policies are underpinned by a fiscal rule and inflation targeting.
Mexico‘s Gini coefficient averaged 0.48 in the late 2000s, which indicates a significantly higher
degree of inequality than the OECD average. About 46 percent of Mexico's total population lives in
poverty, while about 10 percent lives in extreme poverty.
The electricity sector is dominated by the government-owned Comision Federal de
Electricidad (CFE). CFE is a major electricity generator, accounting for about three-quarters of total
generation capacity of the country, and monopolizes transmission and distribution functions.38
While independent power producers entered the market after deregulation in the generation sector
in 1992, they account for only about one quarter of generation assets. The dominance of the public
sector in the electricity market is mandated by constitutional provisions.39
Comision Reguladora de
la Energia (CRE) is the regulator of the electricity sector.
37
Prepared by Masahiro Nozaki, Fiscal Affairs Department.
38Before 2009, electricity distribution was operated under a duopoly by CFE and Luz y Fuerza del Centro (LFC), a
government-owned company which served customers in metropolitan Mexico City. In 2009, the government closed
down LFC to eliminate direct government subsidies to LFC to cover operating losses, and let CFE take over LFC‘s
service areas.
39The public electricity service act was amended in 1992, which opened electricity to the private sector, lists the
following areas as falling outside of ―public service‖ and thus open to private sector participation: self-supply,
cogeneration, independent power production, imports, exports, and small-scale generation.
2000 2003 2008 2010 2011
Nominal GDP per capita (US$) 6858.8 6864.7 10050.5 9218.5 10153.3
Real GDP growth (percent) 6.0 1.4 1.2 5.5 4.0
Inflation (percent) 9.5 4.6 5.1 4.2 3.4
Overall fiscal balance (percent GDP) -3.1 -2.3 -1.1 -4.3 -3.4
Public debt (percent GDP) 42.6 45.6 43.1 42.9 43.8
Current account balance (percent GDP) -2.8 -1.0 -1.4 -0.3 -0.8
Oil imports (percent GDP) 1.1 1.2 3.3 2.9 3.7
Oil exports (percent GDP) 2.4 2.7 4.6 4.0 4.9
Oil consumption per capita (liters) 505.6 529.9 653.8 607.0 n.a.
ENERGY SUBSIDY REFORM: CASE STUDIES
INTERNATIONAL MONETARY FUND 95
Electricity tariffs have been set below cost-recovery levels. A study of tariff structures in 2005–06
showed that tariffs were below cost-recovery levels for most residential users (by about 40 percent)
and the agricultural sector (by about 30 percent). Subsidies were smaller for other sectors, but tariffs
still failed to cover costs. The benefit incidence of these subsidies is highly regressive (Komives and
others, 2009). The Ministry of Finance and Public Credit has tariff-setting authority, and tariffs have
been adjusted monthly in proportion to changes in input prices for electricity generation,
transmission, and distribution, rather than based on actual service costs. Tariff systems are highly
complex, with over a hundred different billing possibilities for residential users. They are built upon
block tariffs, which provide larger subsidies for users who consume less. In addition, a scheme of
―summer subsidies‖ provides a discount to residential customers residing in warm areas to
compensate for higher air-conditioning costs.
Electricity subsidies impose a substantial fiscal burden. Electricity subsidies were estimated at
about ½ percent of GDP in 2011, a similar ratio as 10 years earlier (Figure 24).40
The government
does not record the subsidies explicitly. Under the so-called aprovechamiento system, CFE must pay
the government a return on the fixed assets (9 percent), but this is transferred back from the
government to CFE to cover tariff subsidies and infrastructure investment (OECD, 2004). Since 2002,
the amount of aprovechamiento fell short of what was needed to cover tariff subsidies, thus eroding
CFE‘s capital base (Komives and others, 2009).
40
This estimate of the cost of subsidies, from the authorities, exceeds the figure provided by the International Energy
Agency (IEA), which indicates subsidies were about 0.1 percent of GDP or smaller in 2007–2010. The reason is that
the IEA approach only measures consumer subsidies using the price gap approach, and does not measure the total
budget support that also compensates producers for inefficiencies (producer subsidies).
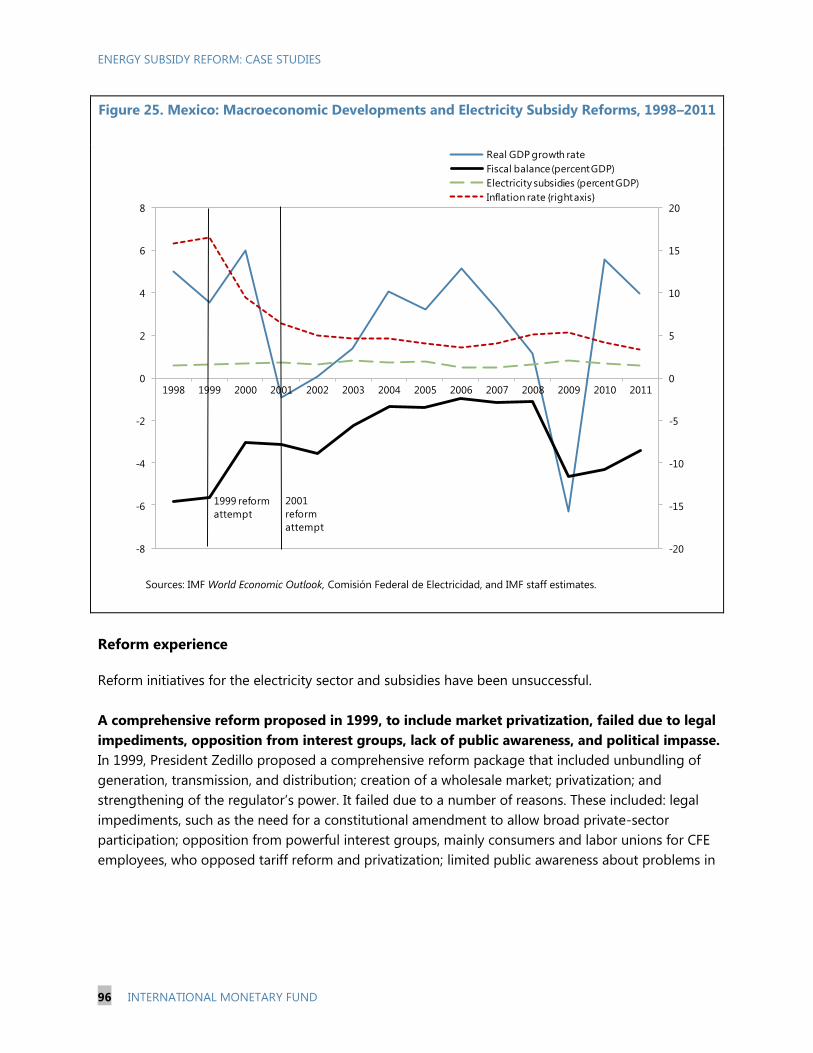
ENERGY SUBSIDY REFORM: CASE STUDIES
96 INTERNATIONAL MONETARY FUND
Figure 25. Mexico: Macroeconomic Developments and Electricity Subsidy Reforms, 1998–2011
Sources: IMF World Economic Outlook, Comisión Federal de Electricidad, and IMF staff estimates.
Reform experience
Reform initiatives for the electricity sector and subsidies have been unsuccessful.
A comprehensive reform proposed in 1999, to include market privatization, failed due to legal
impediments, opposition from interest groups, lack of public awareness, and political impasse.
In 1999, President Zedillo proposed a comprehensive reform package that included unbundling of
generation, transmission, and distribution; creation of a wholesale market; privatization; and
strengthening of the regulator‘s power. It failed due to a number of reasons. These included: legal
impediments, such as the need for a constitutional amendment to allow broad private-sector
participation; opposition from powerful interest groups, mainly consumers and labor unions for CFE
employees, who opposed tariff reform and privatization; limited public awareness about problems in
-20
-15
-10
-5
0
5
10
15
20
-8
-6
-4
-2
0
2
4
6
8
1998 1999 2000 2001 2002 2003 2004 2005 2006 2007 2008 2009 2010 2011
Real GDP growth rate
Fiscal balance (percent GDP)
Electricity subsidies (percent GDP)
Inflation rate {right axis}
1999 reform
attempt
2001
reform
attempt
ENERGY SUBSIDY REFORM: CASE STUDIES
INTERNATIONAL MONETARY FUND 97
the electricity sector and public opinion against privatization;41
and a political impasse in the period
leading up to the 2000 presidential election (Carreón-Rodriguez, San Vicente and Rosellón, 2003).
A reform proposal launched by President Fox in April 2001, although it deemphasized
privatization, also failed. The president could not forge a consensus in the Congress to turn the
bill into a law. In addition to the obstacles against President Zedillo‘s reform, President Fox also had
to cope with political fragmentation after a drastic change in the political landscape. In particular,
after seven decades of continuous ruling, the Partido Revolucionario Institutional (PRI) was defeated
in the 2000 presidential election, and political parties were forced to compromise with labor unions
and powerful conglomerates, which had earlier been submissive to presidential administrations
under the PRI. Various reform proposals made by opposition parties, as well as their petition to the
Supreme Court on the constitutionality of President Fox‘s proposal, complicated the debate.
Tariff reform was implemented in 2002 to reduce electricity subsidies. In particular, a tariff was
introduced that exceeded the long-run marginal cost for customers with high consumption volumes.
However, the reform did not lead to a permanent reduction in subsidies, as the scheme of ―summer
subsidies‖ allowed customers to be reclassified into highly subsidized categories (see below).
Mitigating measures
The residential tariff structure is characterized by an extensive list of subsidized categories.
Tariffs are subsidized for customers who consume less and reside in warm areas. The latter, called a
scheme of ―summer subsidies‖ applicable during the summer season, classifies customers into six
categories based on average real temperatures (cutoffs are 25ºC, 28ºC, 30ºC, 31ºC, 32ºC, and 33ºC),
with customers living in warmer areas receiving higher subsidies. More customers were reclassified
from lower temperature categories to higher temperature ones during the 2000s, further increasing
the overall subsidy bill (Komives and others, 2009).
Mexico has a well-developed safety net program, Oportunidades, that has not yet been used
in the context of subsidy reform. Oportunidades is a cash transfer targeted for families of extreme
poverty and is conditional on school attendance and medical checkups of family members. In 2008,
about 5 million families benefited from the program. Benefits consist of not only direct cash
transfers and education grants but also cash compensation for energy consumption expenses.
Oportunidades offers more effective and better-targeted pro-poor subsidies than fuel and electricity
subsidies (the authorities also acknowledge that the incidence of the electricity subsidy is highly
regressive), while it cost only one-fifth of total fuel subsidies (including subsidies for petroleum
products and electricity) in 2008.
41
According to a public opinion poll in 2002, 49 percent of respondents acknowledged problems in the electricity
sector. 35 percent of respondents opposed private investment, while 17 percent supported a strategy of encouraging
it (Carreón-Rodriguez, San Vicente, and Rosellón, 2003).
ENERGY SUBSIDY REFORM: CASE STUDIES
98 INTERNATIONAL MONETARY FUND
Lessons
The failure of the electricity sector reform in Mexico reveals the numerous obstacles to
successful reform. A long history of tariff subsidies and the vertical and horizontal dominance of a
state-owned company created strong interest groups against reform, especially consumers and
labor unions. Political fragmentation, the constitutional mandate for the public sector to run the
electricity sector, and public opinion against privatization made the reform even more challenging.
The extensive list of subsidized customer categories has contributed to an increase in overall
subsidies, as customers have been reclassified into highly subsidized categories. Mexico‘s case also
suggests that the existence of a targeted safety net and commitment to sound macroeconomic
policies are not sufficient to successfully reform electricity subsidies. A thorough public information
campaign, as well as transparent accounting of electricity subsidies, would be a key first step for
successful reform.
References
Carreón-Rodriguez, Victor, Armando Jiménez San Vicente, and Juan Rosellón, 2003, ―The Mexican
Electricity Sector: Economic, Legal and Political Issues,‖ Working paper, Program on Energy
and Sustainable Development, Stanford University.
Department of Energy, 2012, ―National Energy Strategy, 2012–2026.‖ Available via the Internet:
www.sener.gob.mx/res/PE_y_DT/pub/2012/ENE_2012_2026.pdf.
Komives, Kristin, Todd Johnson, Jonathan Halpern, Jose Luis Aburto, and John Scott, 2009,
―Residential Electricity Subsidies in Mexico: Exploring Options for Reform and for Enhancing
the Impact on the Poor,‖ Working Paper No. 160 (Washington: World Bank).
Organisation for Economic Co-operation and Development, 2004, ―Mexico: Progress in
Implementing Regulatory Reform‖ (Paris).
———, 2011, ―Fiscal Reform for a Stronger, Fairer, and Cleaner Mexican Economy,‖ Chapter 3 in
Mexico Economic Surveys 2011 (Paris).
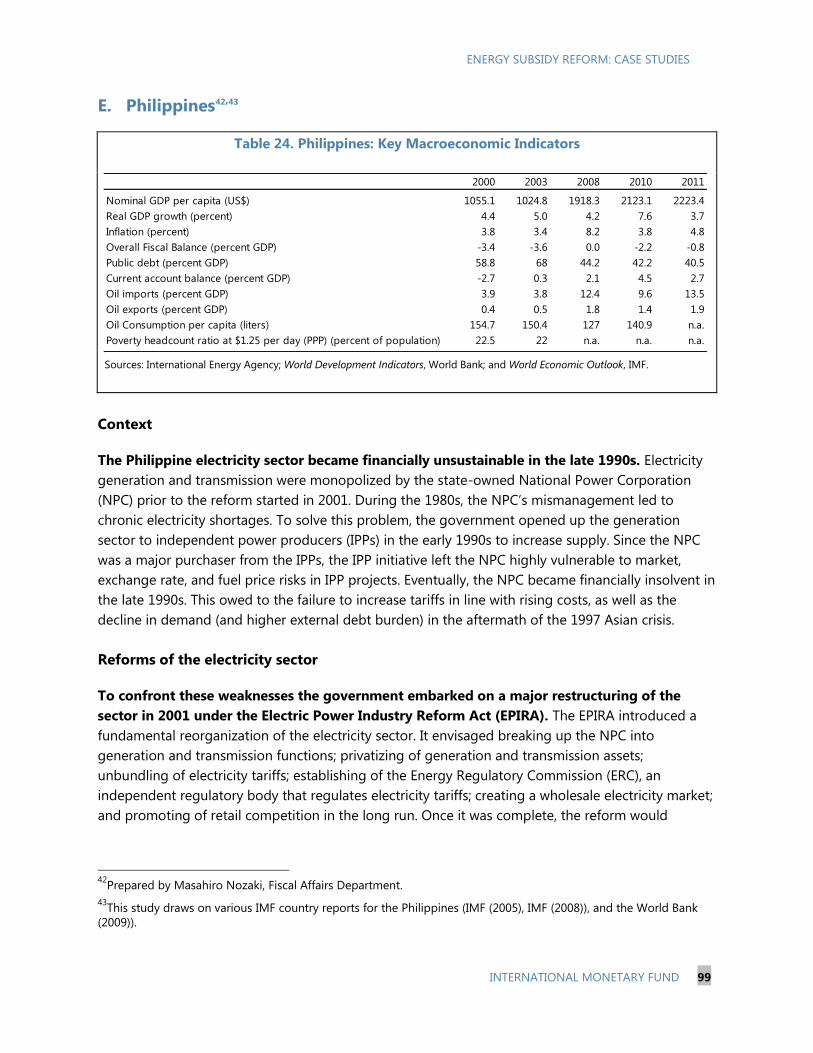
ENERGY SUBSIDY REFORM: CASE STUDIES
INTERNATIONAL MONETARY FUND 99
E. Philippines42,43
Table 24. Philippines: Key Macroeconomic Indicators
Sources: International Energy Agency; World Development Indicators, World Bank; and World Economic Outlook, IMF.
Context
The Philippine electricity sector became financially unsustainable in the late 1990s. Electricity
generation and transmission were monopolized by the state-owned National Power Corporation
(NPC) prior to the reform started in 2001. During the 1980s, the NPC‘s mismanagement led to
chronic electricity shortages. To solve this problem, the government opened up the generation
sector to independent power producers (IPPs) in the early 1990s to increase supply. Since the NPC
was a major purchaser from the IPPs, the IPP initiative left the NPC highly vulnerable to market,
exchange rate, and fuel price risks in IPP projects. Eventually, the NPC became financially insolvent in
the late 1990s. This owed to the failure to increase tariffs in line with rising costs, as well as the
decline in demand (and higher external debt burden) in the aftermath of the 1997 Asian crisis.
Reforms of the electricity sector
To confront these weaknesses the government embarked on a major restructuring of the
sector in 2001 under the Electric Power Industry Reform Act (EPIRA). The EPIRA introduced a
fundamental reorganization of the electricity sector. It envisaged breaking up the NPC into
generation and transmission functions; privatizing of generation and transmission assets;
unbundling of electricity tariffs; establishing of the Energy Regulatory Commission (ERC), an
independent regulatory body that regulates electricity tariffs; creating a wholesale electricity market;
and promoting of retail competition in the long run. Once it was complete, the reform would
42
Prepared by Masahiro Nozaki, Fiscal Affairs Department.
43This study draws on various IMF country reports for the Philippines (IMF (2005), IMF (2008)), and the World Bank
(2009)).
2000 2003 2008 2010 2011
Nominal GDP per capita (US$) 1055.1 1024.8 1918.3 2123.1 2223.4
Real GDP growth (percent) 4.4 5.0 4.2 7.6 3.7
Inflation (percent) 3.8 3.4 8.2 3.8 4.8
Overall Fiscal Balance (percent GDP) -3.4 -3.6 0.0 -2.2 -0.8
Public debt (percent GDP) 58.8 68 44.2 42.2 40.5
Current account balance (percent GDP) -2.7 0.3 2.1 4.5 2.7
Oil imports (percent GDP) 3.9 3.8 12.4 9.6 13.5
Oil exports (percent GDP) 0.4 0.5 1.8 1.4 1.9
Oil Consumption per capita (liters) 154.7 150.4 127 140.9 n.a.
Poverty headcount ratio at $1.25 per day (PPP) (percent of population) 22.5 22 n.a. n.a. n.a.
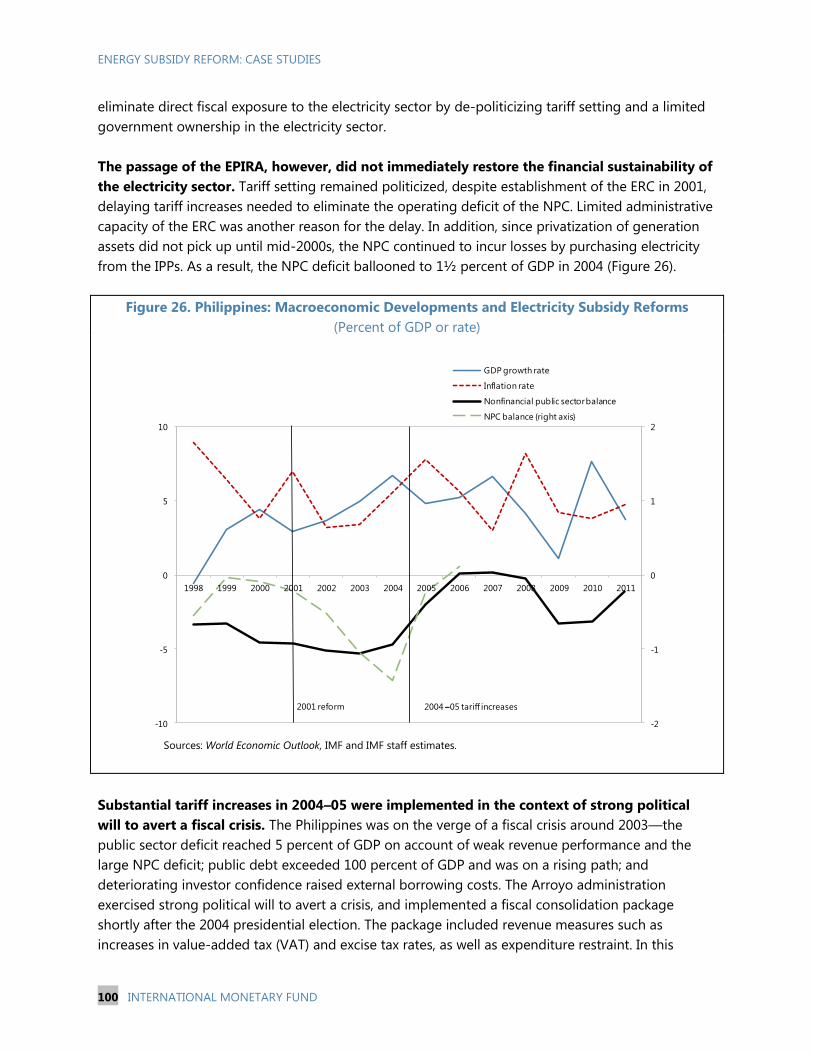
ENERGY SUBSIDY REFORM: CASE STUDIES
100 INTERNATIONAL MONETARY FUND
eliminate direct fiscal exposure to the electricity sector by de-politicizing tariff setting and a limited
government ownership in the electricity sector.
The passage of the EPIRA, however, did not immediately restore the financial sustainability of
the electricity sector. Tariff setting remained politicized, despite establishment of the ERC in 2001,
delaying tariff increases needed to eliminate the operating deficit of the NPC. Limited administrative
capacity of the ERC was another reason for the delay. In addition, since privatization of generation
assets did not pick up until mid-2000s, the NPC continued to incur losses by purchasing electricity
from the IPPs. As a result, the NPC deficit ballooned to 1½ percent of GDP in 2004 (Figure 26).
Figure 26. Philippines: Macroeconomic Developments and Electricity Subsidy Reforms
(Percent of GDP or rate)
Sources: World Economic Outlook, IMF and IMF staff estimates.
Substantial tariff increases in 2004–05 were implemented in the context of strong political
will to avert a fiscal crisis. The Philippines was on the verge of a fiscal crisis around 2003—the
public sector deficit reached 5 percent of GDP on account of weak revenue performance and the
large NPC deficit; public debt exceeded 100 percent of GDP and was on a rising path; and
deteriorating investor confidence raised external borrowing costs. The Arroyo administration
exercised strong political will to avert a crisis, and implemented a fiscal consolidation package
shortly after the 2004 presidential election. The package included revenue measures such as
increases in value-added tax (VAT) and excise tax rates, as well as expenditure restraint. In this
-2
-1
0
1
2
-10
-5
0
5
10
1998 1999 2000 2001 2002 2003 2004 2005 2006 2007 2008 2009 2010 2011
GDP growth rate
Inflation rate
Nonfinancial public sector balance
NPC balance {right axis}
2001 reform 2004 –05 tariff increases
ENERGY SUBSIDY REFORM: CASE STUDIES
INTERNATIONAL MONETARY FUND 101
context, electricity tariffs were raised by about 30 percent during late 2004–early 2005, contributing
to a reduction in the NPC deficit to 0.2 percent of GDP in 2005 (Figure 26). These measures turned
out to be successful in averting a fiscal crisis.
Electricity sector reform has continued to advance over the past eight years. In particular, most
of the generation assets are now owned by the private sector; wholesale electricity markets are up
and running; retail electricity tariffs are unbundled into generation, transmission, and distribution
charges; and cross-subsidization among customers has been eliminated except for lifeline tariffs for
poor families and subsidies provided by the Small Power Utilities Group (SPUG) to users in remote
and less developed areas. One remaining issue is settlement of restructuring cost of the NPC—
universal electricity charges to cover sunk costs have yet to be introduced.
Mitigating measures
The adverse effect of the 2004–05 tariff increases on poor households was absorbed mainly
by lifeline tariff structures. The EPIRA allowed a lifeline tariff schedule as a subsidized rate for poor
households. The ERC approved lifeline tariff applications for most of distributors by 2006. The
discount ranged from 5–50 percent and benefited 3 million poor households (Philippines,
Department of Energy, 2006).
Lessons
A comprehensive reform that addresses pricing, regulation, privatization, and mitigation of
adverse effects on the poor can be successful in eliminating electricity subsidies. In the case of
the Philippines, establishing an independent electricity regulator helped de-politicize pricing, and
privatization reduced the direct fiscal exposure to the electricity sector. A lifeline tariff schedule
mitigated the effect of tariff increases on poor households.
Electricity reforms can take a long time to implement. The Philippines‘ reform, which started in
2001 and is still ongoing, took a long time to bear fruit. This was because they involve various
institutional challenges such as unbundling of the electricity industry, privatization of a large number
of generation facilities, and the capacity building of the regulator.
The success of the reform hinged on strong political support throughout the reform process.
In the case of the Philippines, the deficit of the state electricity company kept increasing in the early
stage of the reform, posing a threat to the country‘s overall fiscal sustainability. This followed
because tariff increases were politicized and delayed even after the establishment of an independent
regulator, while privatization of generation assets did not materialize. Tariff increases were
eventually approved as the government remained determined to reduce the deficit of the state
electricity company, in the context of decisive fiscal consolidation efforts to avert a fiscal crisis.
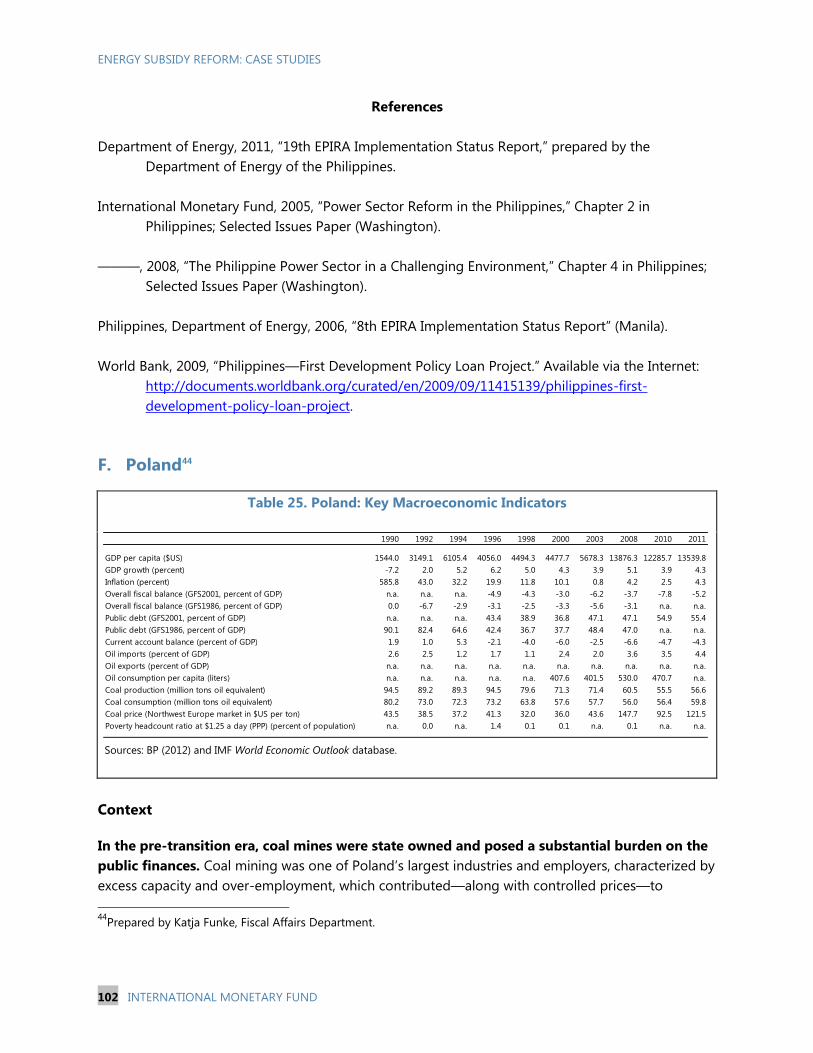
ENERGY SUBSIDY REFORM: CASE STUDIES
102 INTERNATIONAL MONETARY FUND
References
Department of Energy, 2011, ―19th EPIRA Implementation Status Report,‖ prepared by the
Department of Energy of the Philippines.
International Monetary Fund, 2005, ―Power Sector Reform in the Philippines,‖ Chapter 2 in
Philippines; Selected Issues Paper (Washington).
———, 2008, ―The Philippine Power Sector in a Challenging Environment,‖ Chapter 4 in Philippines;
Selected Issues Paper (Washington).
Philippines, Department of Energy, 2006, ―8th EPIRA Implementation Status Report‖ (Manila).
World Bank, 2009, ―Philippines—First Development Policy Loan Project.‖ Available via the Internet:
http://documents.worldbank.org/curated/en/2009/09/11415139/philippines-first-
development-policy-loan-project.
F. Poland44
Table 25. Poland: Key Macroeconomic Indicators
Sources: BP (2012) and IMF World Economic Outlook database.
Context
In the pre-transition era, coal mines were state owned and posed a substantial burden on the
public finances. Coal mining was one of Poland‘s largest industries and employers, characterized by
excess capacity and over-employment, which contributed—along with controlled prices—to
44
Prepared by Katja Funke, Fiscal Affairs Department.
1990 1992 1994 1996 1998 2000 2003 2008 2010 2011
GDP per capita ($US) 1544.0 3149.1 6105.4 4056.0 4494.3 4477.7 5678.3 13876.3 12285.7 13539.8
GDP growth (percent) -7.2 2.0 5.2 6.2 5.0 4.3 3.9 5.1 3.9 4.3
Inflation (percent) 585.8 43.0 32.2 19.9 11.8 10.1 0.8 4.2 2.5 4.3
Overall fiscal balance (GFS2001, percent of GDP) n.a. n.a. n.a. -4.9 -4.3 -3.0 -6.2 -3.7 -7.8 -5.2
Overall fiscal balance (GFS1986, percent of GDP) 0.0 -6.7 -2.9 -3.1 -2.5 -3.3 -5.6 -3.1 n.a. n.a.
Public debt (GFS2001, percent of GDP) n.a. n.a. n.a. 43.4 38.9 36.8 47.1 47.1 54.9 55.4
Public debt (GFS1986, percent of GDP) 90.1 82.4 64.6 42.4 36.7 37.7 48.4 47.0 n.a. n.a.
Current account balance (percent of GDP) 1.9 1.0 5.3 -2.1 -4.0 -6.0 -2.5 -6.6 -4.7 -4.3
Oil imports (percent of GDP) 2.6 2.5 1.2 1.7 1.1 2.4 2.0 3.6 3.5 4.4
Oil exports (percent of GDP) n.a. n.a. n.a. n.a. n.a. n.a. n.a. n.a. n.a. n.a.
Oil consumption per capita (liters) n.a. n.a. n.a. n.a. n.a. 407.6 401.5 530.0 470.7 n.a.
Coal production (million tons oil equivalent) 94.5 89.2 89.3 94.5 79.6 71.3 71.4 60.5 55.5 56.6
Coal consumption (million tons oil equivalent) 80.2 73.0 72.3 73.2 63.8 57.6 57.7 56.0 56.4 59.8
Coal price (Northwest Europe market in $US per ton) 43.5 38.5 37.2 41.3 32.0 36.0 43.6 147.7 92.5 121.5
Poverty headcount ratio at $1.25 a day (PPP) (percent of population) n.a. 0.0 n.a. 1.4 0.1 0.1 n.a. 0.1 n.a. n.a.
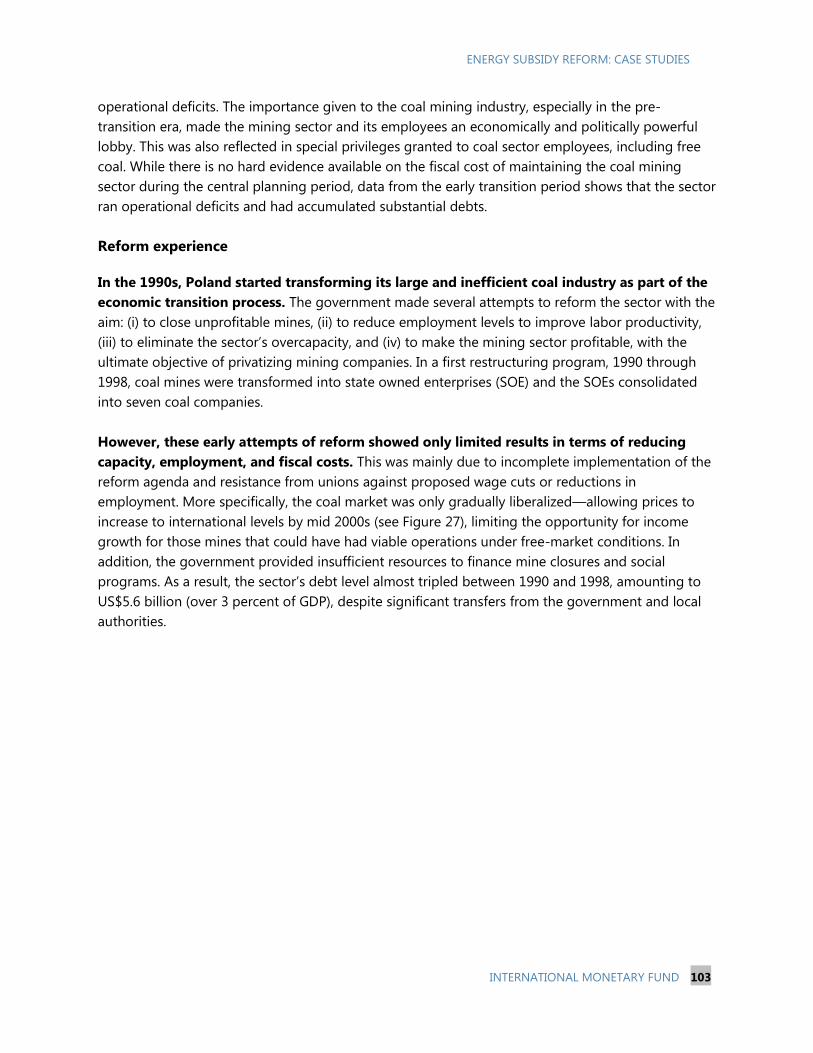
ENERGY SUBSIDY REFORM: CASE STUDIES
INTERNATIONAL MONETARY FUND 103
operational deficits. The importance given to the coal mining industry, especially in the pre-
transition era, made the mining sector and its employees an economically and politically powerful
lobby. This was also reflected in special privileges granted to coal sector employees, including free
coal. While there is no hard evidence available on the fiscal cost of maintaining the coal mining
sector during the central planning period, data from the early transition period shows that the sector
ran operational deficits and had accumulated substantial debts.
Reform experience
In the 1990s, Poland started transforming its large and inefficient coal industry as part of the
economic transition process. The government made several attempts to reform the sector with the
aim: (i) to close unprofitable mines, (ii) to reduce employment levels to improve labor productivity,
(iii) to eliminate the sector‘s overcapacity, and (iv) to make the mining sector profitable, with the
ultimate objective of privatizing mining companies. In a first restructuring program, 1990 through
1998, coal mines were transformed into state owned enterprises (SOE) and the SOEs consolidated
into seven coal companies.
However, these early attempts of reform showed only limited results in terms of reducing
capacity, employment, and fiscal costs. This was mainly due to incomplete implementation of the
reform agenda and resistance from unions against proposed wage cuts or reductions in
employment. More specifically, the coal market was only gradually liberalized—allowing prices to
increase to international levels by mid 2000s (see Figure 27), limiting the opportunity for income
growth for those mines that could have had viable operations under free-market conditions. In
addition, the government provided insufficient resources to finance mine closures and social
programs. As a result, the sector‘s debt level almost tripled between 1990 and 1998, amounting to
US$5.6 billion (over 3 percent of GDP), despite significant transfers from the government and local
authorities.
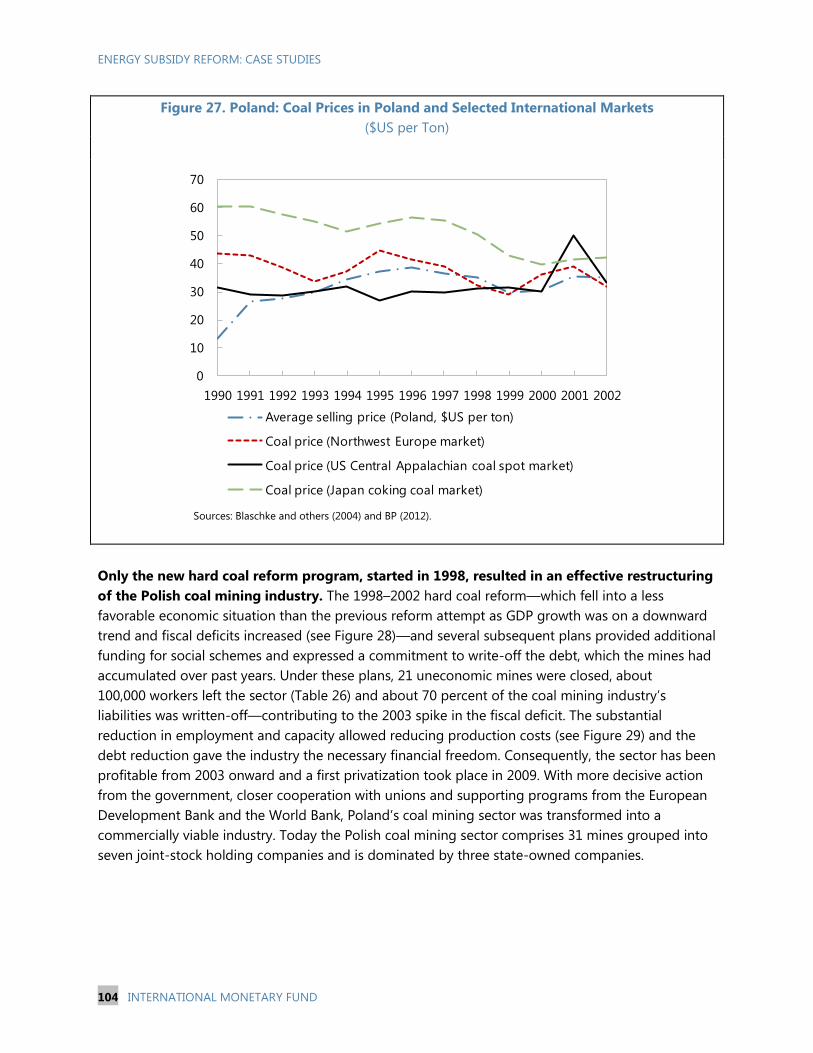
ENERGY SUBSIDY REFORM: CASE STUDIES
104 INTERNATIONAL MONETARY FUND
Figure 27. Poland: Coal Prices in Poland and Selected International Markets
($US per Ton)
Sources: Blaschke and others (2004) and BP (2012).
Only the new hard coal reform program, started in 1998, resulted in an effective restructuring
of the Polish coal mining industry. The 1998–2002 hard coal reform—which fell into a less
favorable economic situation than the previous reform attempt as GDP growth was on a downward
trend and fiscal deficits increased (see Figure 28)—and several subsequent plans provided additional
funding for social schemes and expressed a commitment to write-off the debt, which the mines had
accumulated over past years. Under these plans, 21 uneconomic mines were closed, about
100,000 workers left the sector (Table 26) and about 70 percent of the coal mining industry‘s
liabilities was written-off—contributing to the 2003 spike in the fiscal deficit. The substantial
reduction in employment and capacity allowed reducing production costs (see Figure 29) and the
debt reduction gave the industry the necessary financial freedom. Consequently, the sector has been
profitable from 2003 onward and a first privatization took place in 2009. With more decisive action
from the government, closer cooperation with unions and supporting programs from the European
Development Bank and the World Bank, Poland‘s coal mining sector was transformed into a
commercially viable industry. Today the Polish coal mining sector comprises 31 mines grouped into
seven joint-stock holding companies and is dominated by three state-owned companies.
0
10
20
30
40
50
60
70
1990 1991 1992 1993 1994 1995 1996 1997 1998 1999 2000 2001 2002
Average selling price (Poland, $US per ton)
Coal price (Northwest Europe market)
Coal price (US Central Appalachian coal spot market)
Coal price (Japan coking coal market)
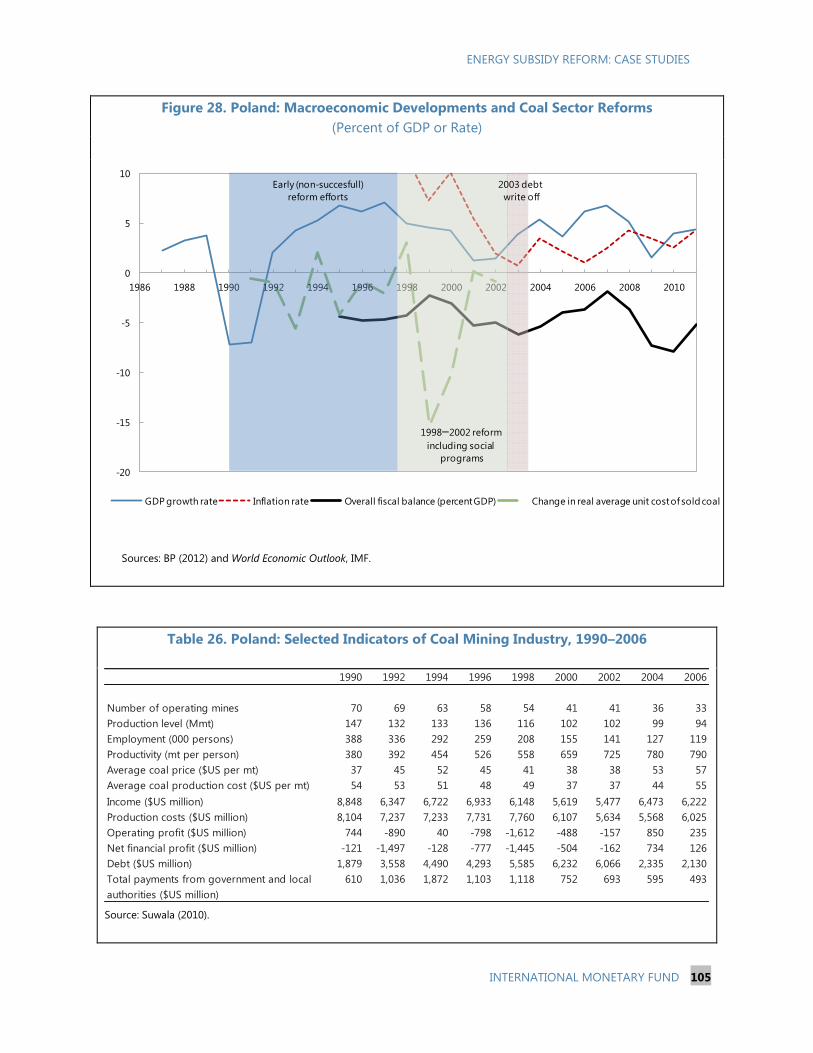
ENERGY SUBSIDY REFORM: CASE STUDIES
INTERNATIONAL MONETARY FUND 105
Figure 28. Poland: Macroeconomic Developments and Coal Sector Reforms
(Percent of GDP or Rate)
Sources: BP (2012) and World Economic Outlook, IMF.
Table 26. Poland: Selected Indicators of Coal Mining Industry, 1990–2006
Source: Suwala (2010).
1990 1992 1994 1996 1998 2000 2002 2004 2006
Number of operating mines 70 69 63 58 54 41 41 36 33
Production level (Mmt) 147 132 133 136 116 102 102 99 94
Employment (000 persons) 388 336 292 259 208 155 141 127 119
Productivity (mt per person) 380 392 454 526 558 659 725 780 790
Average coal price ($US per mt) 37 45 52 45 41 38 38 53 57
Average coal production cost ($US per mt) 54 53 51 48 49 37 37 44 55
Income ($US million) 8,848 6,347 6,722 6,933 6,148 5,619 5,477 6,473 6,222
Production costs ($US million) 8,104 7,237 7,233 7,731 7,760 6,107 5,634 5,568 6,025
Operating profit ($US million) 744 -890 40 -798 -1,612 -488 -157 850 235
Net financial profit ($US million) -121 -1,497 -128 -777 -1,445 -504 -162 734 126
Debt ($US million) 1,879 3,558 4,490 4,293 5,585 6,232 6,066 2,335 2,130
Total payments from government and local
authorities ($US million)
610 1,036 1,872 1,103 1,118 752 693 595 493
-20
-15
-10
-5
0
5
10
1986 1988 1990 1992 1994 1996 1998 2000 2002 2004 2006 2008 2010
GDP growth rate Inflation rate Overall fiscal balance (percent GDP) Change in real average unit cost of sold coal
Early (non-succesfull)
reform efforts
1998–2002 reform
including social
programs
2003 debt
write off
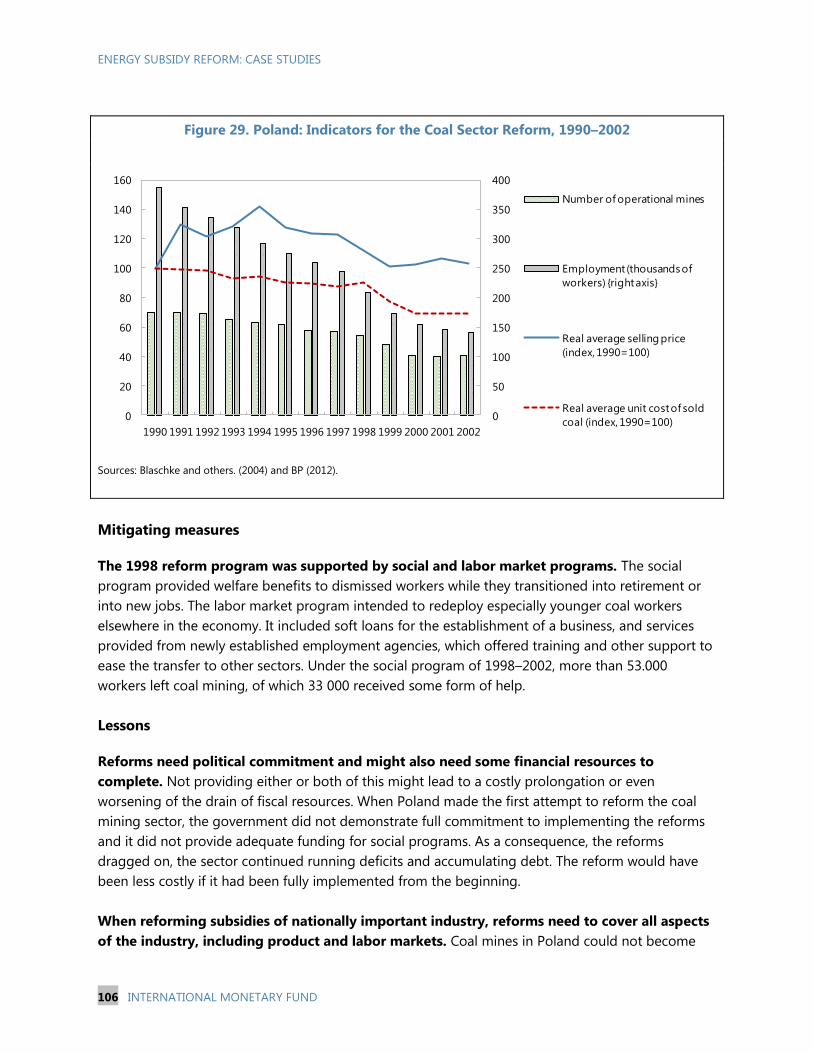
ENERGY SUBSIDY REFORM: CASE STUDIES
106 INTERNATIONAL MONETARY FUND
Figure 29. Poland: Indicators for the Coal Sector Reform, 1990–2002
Sources: Blaschke and others. (2004) and BP (2012).
Mitigating measures
The 1998 reform program was supported by social and labor market programs. The social
program provided welfare benefits to dismissed workers while they transitioned into retirement or
into new jobs. The labor market program intended to redeploy especially younger coal workers
elsewhere in the economy. It included soft loans for the establishment of a business, and services
provided from newly established employment agencies, which offered training and other support to
ease the transfer to other sectors. Under the social program of 1998–2002, more than 53.000
workers left coal mining, of which 33 000 received some form of help.
Lessons
Reforms need political commitment and might also need some financial resources to
complete. Not providing either or both of this might lead to a costly prolongation or even
worsening of the drain of fiscal resources. When Poland made the first attempt to reform the coal
mining sector, the government did not demonstrate full commitment to implementing the reforms
and it did not provide adequate funding for social programs. As a consequence, the reforms
dragged on, the sector continued running deficits and accumulating debt. The reform would have
been less costly if it had been fully implemented from the beginning.
When reforming subsidies of nationally important industry, reforms need to cover all aspects
of the industry, including product and labor markets. Coal mines in Poland could not become
0
50
100
150
200
250
300
350
400
0
20
40
60
80
100
120
140
160
1990 1991 1992 1993 1994 1995 1996 1997 1998 1999 2000 2001 2002
Number of operational mines
Employment (thousands of
workers) {right axis}
Real average selling price
(index, 1990=100)
Real average unit cost of sold
coal (index, 1990=100)
ENERGY SUBSIDY REFORM: CASE STUDIES
INTERNATIONAL MONETARY FUND 107
profitable until the coal market was liberalized and prices were able to adjust in line with
international price fluctuations. In addition, preferential employment conditions in the coal mining
sector made it difficult to motivate employees to leave the sector voluntarily. Converting the
publically owned coal mines into stock companies that are managed according to business interests
lead also to an adjustment of employment conditions. Together with the implementation of a social
safety net for the sector‘s employees, this allowed to increase the mobility of the labor force and
their willingness to move to other sectors.
Reforms that come with substantial employment losses in major industries have to be
designed in cooperation with unions and supported by appropriate social and labor market
programs. In Poland, the first mining sector reform attempts were not successful because they did
not provide adequate support for the miners, who were most affected by the reforms and who had
a strong lobby. The mitigating measures designed in cooperation with the unions and included in
subsequent reform plans broke the resistance of the miners to the restructuring. The case of
Poland‘s coal industry demonstrated that the role of unions in the reform process and the
magnitude for the required social and labor market program is especially important for an industry
that (i) is a major employer for the economy and the absolutely dominant employer in some regions
and (ii) has employees with very specialized skills that are of very limited use outside the industry.
The assumption of social liabilities and accumulated debt can be instrumental to successful
subsidy reforms, especially when the sector needs to be modernized. In order to become
profitable under market conditions, the Polish coal mining industry needed to be transformed from
an oversized and inefficient energy provider for a centrally planned economy into an internationally
competitive lean and modern industry. Given the substantial financial burden from the past—from
the rehabilitation of old mines as well as from obligations towards the sector‘s employees—the
sector could not have lifted the reform without the financial support from the government. The
assumption of past liabilities, as well as substantial support for transition costs, allowed the industry
to move toward profitability and to eventually be weaned from public support.
References
Blaschke W., Lorenz U., 2004, Restructuring of Polish Hard Coal Industry in the Last Decade and
Perspectives for the Next Decade, in European Conference on Raw Building and Coal: New
Perspectives. Wyd IP Svjetlost, d.d., Sarajevo, pp. 121–131. Available via the Internet:
www.min-pan.krakow.pl/zaklady/zrynek/zasoby/04_04wb_ul_sarajewo.pdf.
BP, 2012, Statistical Review of World Energy June 2012. Available via the Internet:
www.bp.com/statisticalreview.
Europe Economics, and others, 2006, Energy Evaluation of State aid for the Coal Industry. Available
via the Internet:
www.ec.europa.eu/energy/coal/studies/doc/2006_10_report_europe_economics.pdf.
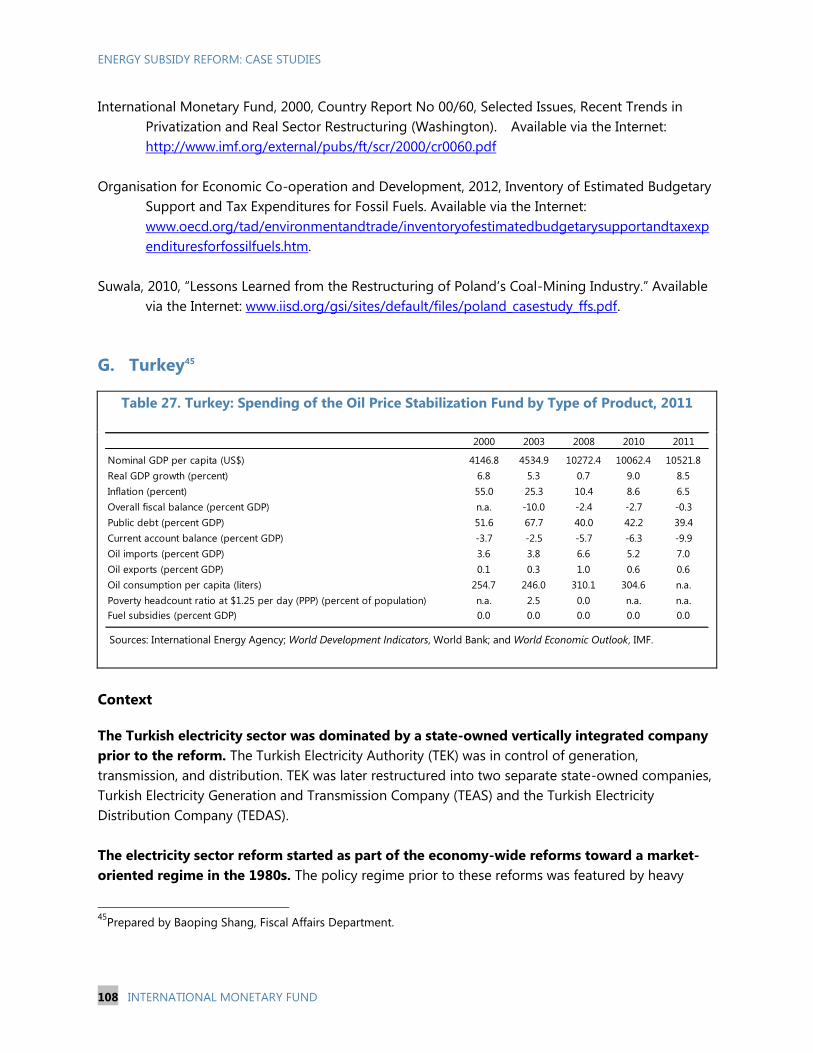
ENERGY SUBSIDY REFORM: CASE STUDIES
108 INTERNATIONAL MONETARY FUND
International Monetary Fund, 2000, Country Report No 00/60, Selected Issues, Recent Trends in
Privatization and Real Sector Restructuring (Washington). Available via the Internet:
http://www.imf.org/external/pubs/ft/scr/2000/cr0060.pdf
Organisation for Economic Co-operation and Development, 2012, Inventory of Estimated Budgetary
Support and Tax Expenditures for Fossil Fuels. Available via the Internet:
www.oecd.org/tad/environmentandtrade/inventoryofestimatedbudgetarysupportandtaxexp
endituresforfossilfuels.htm.
Suwala, 2010, ―Lessons Learned from the Restructuring of Poland‘s Coal-Mining Industry.‖ Available
via the Internet: www.iisd.org/gsi/sites/default/files/poland_casestudy_ffs.pdf.
G. Turkey45
Table 27. Turkey: Spending of the Oil Price Stabilization Fund by Type of Product, 2011
Sources: International Energy Agency; World Development Indicators, World Bank; and World Economic Outlook, IMF.
Context
The Turkish electricity sector was dominated by a state-owned vertically integrated company
prior to the reform. The Turkish Electricity Authority (TEK) was in control of generation,
transmission, and distribution. TEK was later restructured into two separate state-owned companies,
Turkish Electricity Generation and Transmission Company (TEAS) and the Turkish Electricity
Distribution Company (TEDAS).
The electricity sector reform started as part of the economy-wide reforms toward a market-
oriented regime in the 1980s. The policy regime prior to these reforms was featured by heavy
45
Prepared by Baoping Shang, Fiscal Affairs Department.
2000 2003 2008 2010 2011
Nominal GDP per capita (US$) 4146.8 4534.9 10272.4 10062.4 10521.8
Real GDP growth (percent) 6.8 5.3 0.7 9.0 8.5
Inflation (percent) 55.0 25.3 10.4 8.6 6.5
Overall fiscal balance (percent GDP) n.a. -10.0 -2.4 -2.7 -0.3
Public debt (percent GDP) 51.6 67.7 40.0 42.2 39.4
Current account balance (percent GDP) -3.7 -2.5 -5.7 -6.3 -9.9
Oil imports (percent GDP) 3.6 3.8 6.6 5.2 7.0
Oil exports (percent GDP) 0.1 0.3 1.0 0.6 0.6
Oil consumption per capita (liters) 254.7 246.0 310.1 304.6 n.a.
Poverty headcount ratio at $1.25 per day (PPP) (percent of population) n.a. 2.5 0.0 n.a. n.a.
Fuel subsidies (percent GDP) 0.0 0.0 0.0 0.0 0.0
ENERGY SUBSIDY REFORM: CASE STUDIES
INTERNATIONAL MONETARY FUND 109
involvement of the state in economic activities, in particular in the form of government ownership of
enterprises in critical industries, such as energy, telecommunications, petrochemicals, iron, and steel.
The state also played a critical role in the allocation of financial resources, especially through state-
owned banks. However, after a major balance-of-payments crisis in the second half of the 1970s and
a military coup in 1980, Turkey was determined to transform its economy into a more market-
oriented regime, through mass liberalization of domestic markets and international trade.
The reform experience
The electricity sector reform was set to achieve several objectives:
To better meet the growing electricity demand and to improve the fiscal position of the
government. The reform would eventually eliminate electricity subsidies, both consumer and
producer subsidies. In addition, it was apparent that the government does not have the fiscal
capacity to finance the expansions necessary to meet the future electricity demand.
To reduce the inefficiency in the electricity sector. Private participation would introduce
competition, improve efficiency, and limit monopoly abuse in the sector.
To meet the preconditions for Turkey’s EU membership. The reform was also been urged by
various international institutions which provided support during several economics crises.
Turkey has taken a series of steps to reform its electricity sector, with the goal to attract
investment, encourage competition, and improve efficiency. The first law setting up a
framework for private participation came into effect in 1984. The unbundling of the Turkish public
electricity sector started in 1993. However, progress had been slow, with the public sector remaining
dominant. An important attempt to privatize through sale of ownership rights in 1994 was struck
down by the Constitutional Court. The privatization was only able to resume after an amendment to
the Constitution in 1999. Instead, attempts to engage the private sector took the form of designing
investment schemes such as build-operate-transfer, build-operate, , and transfer-of-operating rights
contracts. These schemes, however, do not appear to have led to the development of competitive
electricity markets in Turkey as these contracts locked generation companies into long-term
exclusive sale agreements with pre-determined prices and did not provide sufficient incentives for
efficiency (Atiyas and Dutz, 2012).
By the end of the 1990s, the rapidly deteriorating fiscal stance led to pressures for a more
ambitious privatization program, including in the electricity sector. In 2001, Turkey initiated a
comprehensive electricity reform program by enacting its Electricity Market Law. The goal was to
establish a competitive electricity market so as to increase private investment, improve efficiency,
and ultimately strengthen Turkey‘s energy security while meeting the rapidly growing electricity
demand. The state-owned enterprises were further unbundled into different business activities,
including generation, transmission, distribution, wholesale and retail supply. In 2006, a wholesale
electricity market was also introduced to spur competition and improve efficiency.
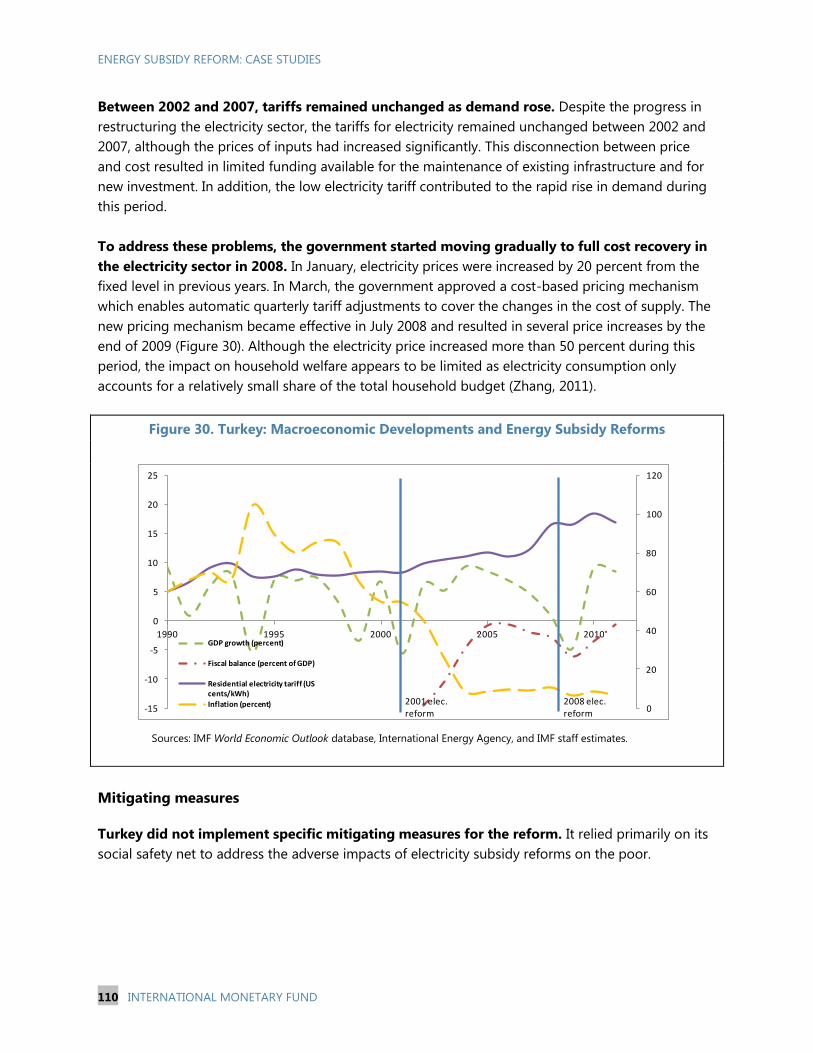
ENERGY SUBSIDY REFORM: CASE STUDIES
110 INTERNATIONAL MONETARY FUND
Between 2002 and 2007, tariffs remained unchanged as demand rose. Despite the progress in
restructuring the electricity sector, the tariffs for electricity remained unchanged between 2002 and
2007, although the prices of inputs had increased significantly. This disconnection between price
and cost resulted in limited funding available for the maintenance of existing infrastructure and for
new investment. In addition, the low electricity tariff contributed to the rapid rise in demand during
this period.
To address these problems, the government started moving gradually to full cost recovery in
the electricity sector in 2008. In January, electricity prices were increased by 20 percent from the
fixed level in previous years. In March, the government approved a cost-based pricing mechanism
which enables automatic quarterly tariff adjustments to cover the changes in the cost of supply. The
new pricing mechanism became effective in July 2008 and resulted in several price increases by the
end of 2009 (Figure 30). Although the electricity price increased more than 50 percent during this
period, the impact on household welfare appears to be limited as electricity consumption only
accounts for a relatively small share of the total household budget (Zhang, 2011).
Figure 30. Turkey: Macroeconomic Developments and Energy Subsidy Reforms
Sources: IMF World Economic Outlook database, International Energy Agency, and IMF staff estimates.
Mitigating measures
Turkey did not implement specific mitigating measures for the reform. It relied primarily on its
social safety net to address the adverse impacts of electricity subsidy reforms on the poor.
0
20
40
60
80
100
120
-15
-10
-5
0
5
10
15
20
25
1990 1995 2000 2005 2010GDP growth (percent)
Fiscal balance (percent of GDP)
Residential electricity tariff (US cents/kWh)
Inflation (percent) 2001 elec.reform
2008 elec. reform
ENERGY SUBSIDY REFORM: CASE STUDIES
INTERNATIONAL MONETARY FUND 111
Lessons
Broad support for and firm commitment to the market approach is the key to the reform
progress in the electricity sector in Turkey. The electricity sector reform started from the 1980s
and has made significant progress despite several obstacles.
Improving economic conditions also helped advance reforms. A growing economy and
improving standards of living assured the public that the country was moving in the right direction
and helped move the reform forward.
Independent agencies for energy policy can help steer technical decisions away from politics.
Under the Electricity Market Law, EMRA, the same independent agency in charge of petroleum
sector, was also responsible for implementing the electricity market laws and regulating the
electricity sector.
References
Atiyas, Izak, and Mark Dutz, 2012, ―Competition and Regulatory Reform in the Turkish Electricity
Industry,‖ Chapter 2 in Reforming Turkish Energy Markets (New York: Springer).
Erdogdu, Erkan, 2007, ―Regulatory Reform in Turkish Energy Industry: An Analysis,‖ Energy Policy,
Vol. 35, No. 2 (February), pp 984–93.
International Energy Agency, 2010, ―Energy Policies of IEA Countries: Turkey 2009 Review‖ (Paris).
Starodubtsev, Ivan, 2007, ―Reform of the Turkish Electrical Energy Sector: Basic Principles and Interim
Results,‖ Energy Market Design, November 1.
Zhang, Fan, 2011, ―Distributional Impact Analysis of the Energy Price Reform in Turkey,‖ Policy
Research Working Paper No. 5831 (Washington: World Bank).
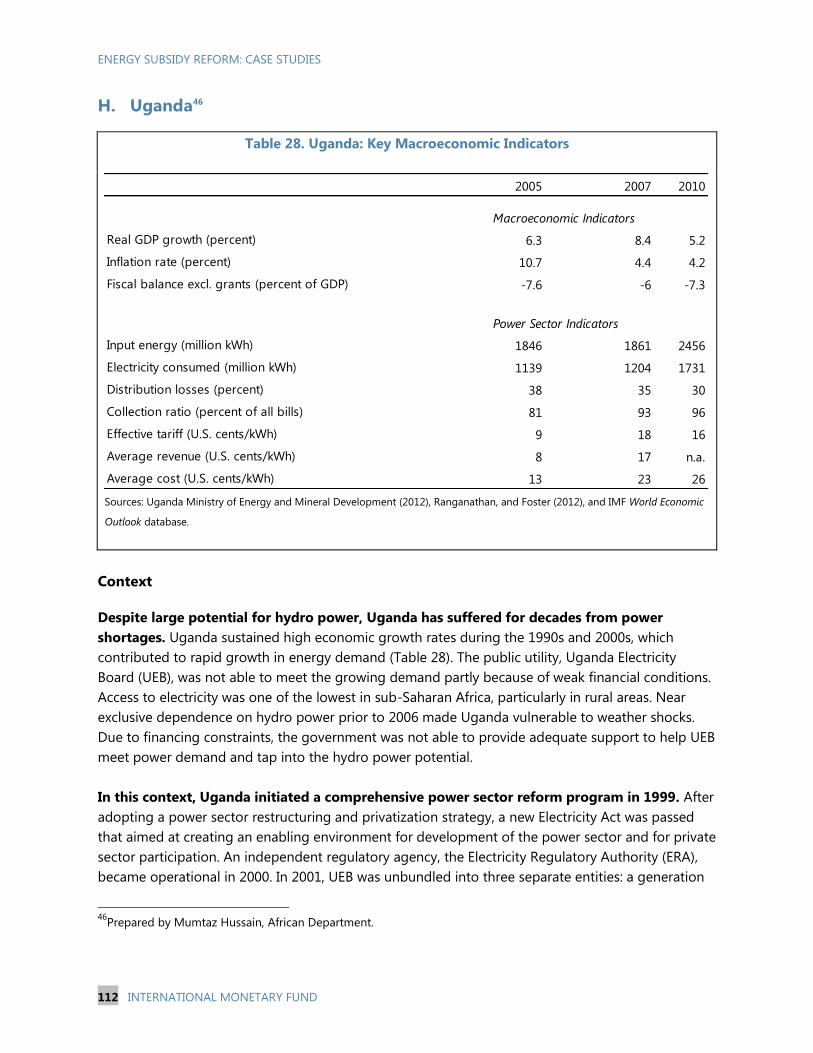
ENERGY SUBSIDY REFORM: CASE STUDIES
112 INTERNATIONAL MONETARY FUND
H. Uganda46
Table 28. Uganda: Key Macroeconomic Indicators
Sources: Uganda Ministry of Energy and Mineral Development (2012), Ranganathan, and Foster (2012), and IMF World Economic
Outlook database.
Context
Despite large potential for hydro power, Uganda has suffered for decades from power
shortages. Uganda sustained high economic growth rates during the 1990s and 2000s, which
contributed to rapid growth in energy demand (Table 28). The public utility, Uganda Electricity
Board (UEB), was not able to meet the growing demand partly because of weak financial conditions.
Access to electricity was one of the lowest in sub-Saharan Africa, particularly in rural areas. Near
exclusive dependence on hydro power prior to 2006 made Uganda vulnerable to weather shocks.
Due to financing constraints, the government was not able to provide adequate support to help UEB
meet power demand and tap into the hydro power potential.
In this context, Uganda initiated a comprehensive power sector reform program in 1999. After
adopting a power sector restructuring and privatization strategy, a new Electricity Act was passed
that aimed at creating an enabling environment for development of the power sector and for private
sector participation. An independent regulatory agency, the Electricity Regulatory Authority (ERA),
became operational in 2000. In 2001, UEB was unbundled into three separate entities: a generation
46
Prepared by Mumtaz Hussain, African Department.
2005 2007 2010
Real GDP growth (percent) 6.3 8.4 5.2
Inflation rate (percent) 10.7 4.4 4.2
Fiscal balance excl. grants (percent of GDP) -7.6 -6 -7.3
Input energy (million kWh) 1846 1861 2456
Electricity consumed (million kWh) 1139 1204 1731
Distribution losses (percent) 38 35 30
Collection ratio (percent of all bills) 81 93 96
Effective tariff (U.S. cents/kWh) 9 18 16
Average revenue (U.S. cents/kWh) 8 17 n.a.
Average cost (U.S. cents/kWh) 13 23 26
Macroeconomic Indicators
Power Sector Indicators
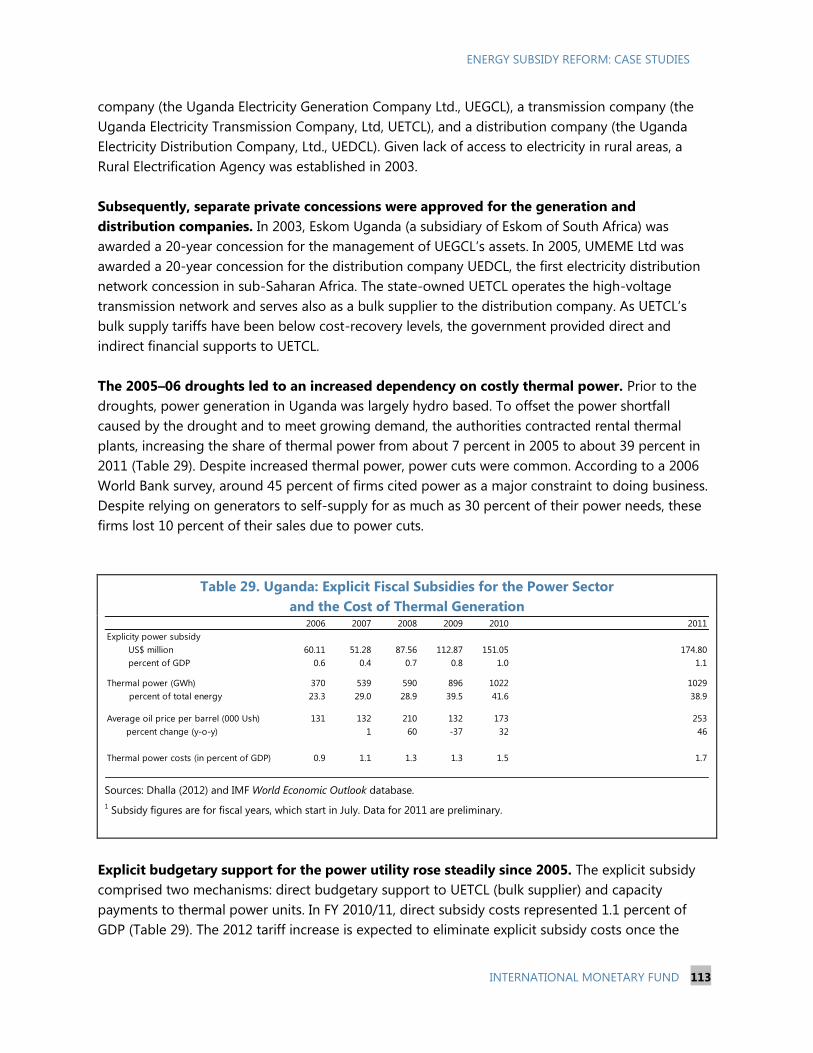
ENERGY SUBSIDY REFORM: CASE STUDIES
INTERNATIONAL MONETARY FUND 113
company (the Uganda Electricity Generation Company Ltd., UEGCL), a transmission company (the
Uganda Electricity Transmission Company, Ltd, UETCL), and a distribution company (the Uganda
Electricity Distribution Company, Ltd., UEDCL). Given lack of access to electricity in rural areas, a
Rural Electrification Agency was established in 2003.
Subsequently, separate private concessions were approved for the generation and
distribution companies. In 2003, Eskom Uganda (a subsidiary of Eskom of South Africa) was
awarded a 20-year concession for the management of UEGCL‗s assets. In 2005, UMEME Ltd was
awarded a 20-year concession for the distribution company UEDCL, the first electricity distribution
network concession in sub-Saharan Africa. The state-owned UETCL operates the high-voltage
transmission network and serves also as a bulk supplier to the distribution company. As UETCL‘s
bulk supply tariffs have been below cost-recovery levels, the government provided direct and
indirect financial supports to UETCL.
The 2005–06 droughts led to an increased dependency on costly thermal power. Prior to the
droughts, power generation in Uganda was largely hydro based. To offset the power shortfall
caused by the drought and to meet growing demand, the authorities contracted rental thermal
plants, increasing the share of thermal power from about 7 percent in 2005 to about 39 percent in
2011 (Table 29). Despite increased thermal power, power cuts were common. According to a 2006
World Bank survey, around 45 percent of firms cited power as a major constraint to doing business.
Despite relying on generators to self-supply for as much as 30 percent of their power needs, these
firms lost 10 percent of their sales due to power cuts.
Table 29. Uganda: Explicit Fiscal Subsidies for the Power Sector
and the Cost of Thermal Generation
Sources: Dhalla (2012) and IMF World Economic Outlook database.
1 Subsidy figures are for fiscal years, which start in July. Data for 2011 are preliminary.
Explicit budgetary support for the power utility rose steadily since 2005. The explicit subsidy
comprised two mechanisms: direct budgetary support to UETCL (bulk supplier) and capacity
payments to thermal power units. In FY 2010/11, direct subsidy costs represented 1.1 percent of
GDP (Table 29). The 2012 tariff increase is expected to eliminate explicit subsidy costs once the
2006 2007 2008 2009 2010 2011
Explicity power subsidy
US$ million 60.11 51.28 87.56 112.87 151.05 174.80
percent of GDP 0.6 0.4 0.7 0.8 1.0 1.1
Thermal power (GWh) 370 539 590 896 1022 1029
percent of total energy 23.3 29.0 28.9 39.5 41.6 38.9
Average oil price per barrel (000 Ush) 131 132 210 132 173 253
percent change (y-o-y) 1 60 -37 32 46
Thermal power costs (in percent of GDP) 0.9 1.1 1.3 1.3 1.5 1.7
ENERGY SUBSIDY REFORM: CASE STUDIES
114 INTERNATIONAL MONETARY FUND
Bujagali hydro generation unit becomes fully operational in late 2012. With increased hydro
generation capacity, the government will avoid purchase of expensive thermal power, though it will
still need to make capacity payments to the IPPs.
Private concession of the distribution company has produced slow but steady improvements.
First, distribution line losses have steadily fallen from 38 percent in 2005 to 28 percent in 2011
(Table 28). Similarly, the collection rate increased from 80 percent of total power bills in 2005 to 96
percent in 2011. To attain these improvements in the distribution system, UMEME invested US$105
million by end-2010—more than envisaged in the contract (Uganda MEMD , 2012). After little
progress in 2005–08, UMEME increased the number of customers by over 30 percent by 2009–2010.
The increased power supply is expected to further boost the access rate. Notwithstanding this
progress, about one-third of the electricity supplied is still not paid for due to distribution and
transmission losses and non-collection of bills.
Once the latter losses are accounted for, the quasi-fiscal deficit of the power system has also
increased over time.47
The quasi-fiscal deficit (QFD) of the power sector would have amounted to
2.6 percent of Uganda‘s GDP in 2011—of which about 1.1 percent of GDP were explicit fiscal costs.
The QFD continued to grow even after some progress in reducing inefficiencies, largely because of
the rising gap between the average effective tariff and the average cost of electricity (Table 30).
Growing demand also contributed to the QFD—consumption almost doubled between 2006 and
2011. In any case, QFDs in Uganda have been primarily driven by under-pricing: in 2011,
underpricing accounted for about 80 percent of the QFD.
Uganda’s long-run marginal costs can be substantially lower than the current average costs,
but this requires substantial investment. By developing its hydro-power potential the country can
reduce costs from US$0.16 to around US$0.12 per kWh (Ranganathan and Foster, 2012). The
Bujagali power project was the first step, while other major hydro projects are currently being
finalized that could double the capacity in a few years.
47
Quasi-fiscal deficit of a power utility is defined as the difference between the actual revenue collected at regulated
electricity prices and the revenue required to fully cover the operating costs of production and capital depreciation.
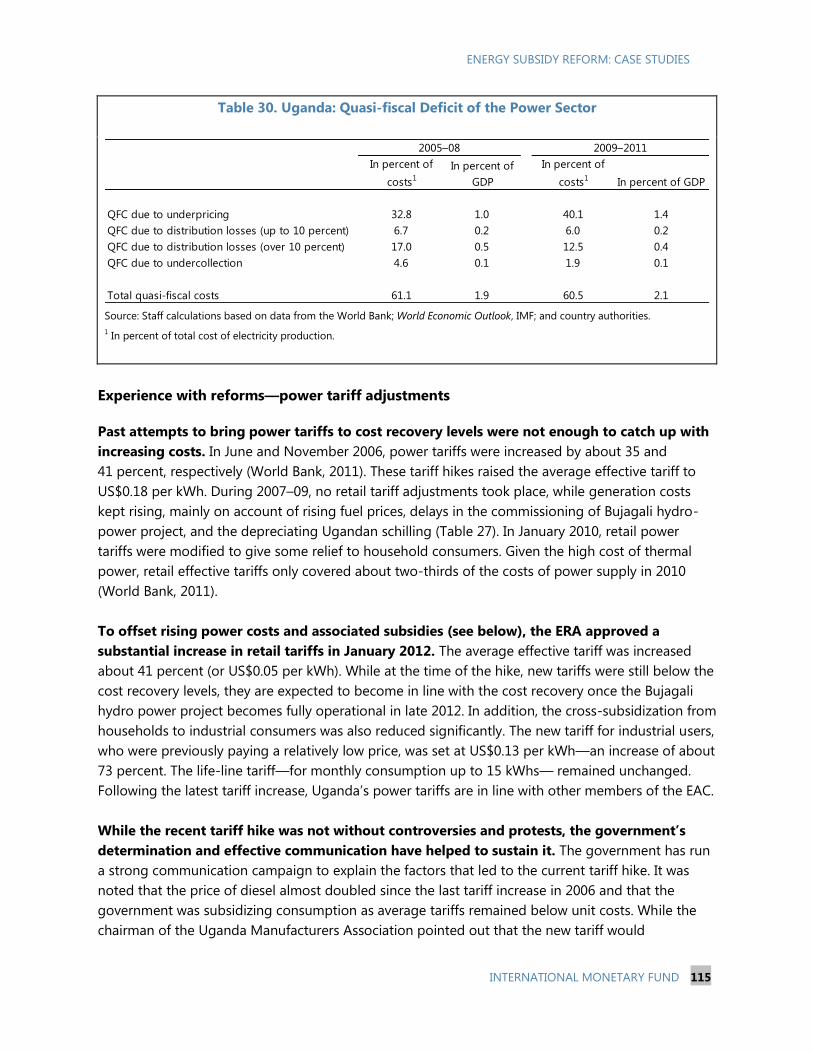
ENERGY SUBSIDY REFORM: CASE STUDIES
INTERNATIONAL MONETARY FUND 115
Table 30. Uganda: Quasi-fiscal Deficit of the Power Sector
Source: Staff calculations based on data from the World Bank; World Economic Outlook, IMF; and country authorities.
1 In percent of total cost of electricity production.
Experience with reforms—power tariff adjustments
Past attempts to bring power tariffs to cost recovery levels were not enough to catch up with
increasing costs. In June and November 2006, power tariffs were increased by about 35 and
41 percent, respectively (World Bank, 2011). These tariff hikes raised the average effective tariff to
US$0.18 per kWh. During 2007–09, no retail tariff adjustments took place, while generation costs
kept rising, mainly on account of rising fuel prices, delays in the commissioning of Bujagali hydro-
power project, and the depreciating Ugandan schilling (Table 27). In January 2010, retail power
tariffs were modified to give some relief to household consumers. Given the high cost of thermal
power, retail effective tariffs only covered about two-thirds of the costs of power supply in 2010
(World Bank, 2011).
To offset rising power costs and associated subsidies (see below), the ERA approved a
substantial increase in retail tariffs in January 2012. The average effective tariff was increased
about 41 percent (or US$0.05 per kWh). While at the time of the hike, new tariffs were still below the
cost recovery levels, they are expected to become in line with the cost recovery once the Bujagali
hydro power project becomes fully operational in late 2012. In addition, the cross-subsidization from
households to industrial consumers was also reduced significantly. The new tariff for industrial users,
who were previously paying a relatively low price, was set at US$0.13 per kWh—an increase of about
73 percent. The life-line tariff—for monthly consumption up to 15 kWhs— remained unchanged.
Following the latest tariff increase, Uganda‘s power tariffs are in line with other members of the EAC.
While the recent tariff hike was not without controversies and protests, the government’s
determination and effective communication have helped to sustain it. The government has run
a strong communication campaign to explain the factors that led to the current tariff hike. It was
noted that the price of diesel almost doubled since the last tariff increase in 2006 and that the
government was subsidizing consumption as average tariffs remained below unit costs. While the
chairman of the Uganda Manufacturers Association pointed out that the new tariff would
In percent of
costs1
In percent of
GDP
In percent of
costs1 In percent of GDP
QFC due to underpricing 32.8 1.0 40.1 1.4
QFC due to distribution losses (up to 10 percent) 6.7 0.2 6.0 0.2
QFC due to distribution losses (over 10 percent) 17.0 0.5 12.5 0.4
QFC due to undercollection 4.6 0.1 1.9 0.1
Total quasi-fiscal costs 61.1 1.9 60.5 2.1
2005–08 2009–2011
ENERGY SUBSIDY REFORM: CASE STUDIES
116 INTERNATIONAL MONETARY FUND
automatically increase production costs, he also acknowledged that the new tariffs would be
bearable if power supply was reliable.
The extent of protests was limited. There were some protests in Kampala and a big political
debate in Parliament about the tariff hike. The government argued that there were simply no
resources to continue subsidizing electricity for the small and relatively rich elite. Low access to
power also helped as the 88 percent of the people without access to electricity were not interested
in the protests. Some newspapers highlighted the fact that the subsidy accrues disproportionately to
the rich and stressed that the tariff hike would be actually a pro-poor policy decision. Importantly,
the life-line tariff was maintained.
Overall, a variety of factors help create an environment that allowed the authorities to raise
power tariffs in early 2012.
The increasing and unsustainable fiscal costs of thermal power in the context of rising fuel prices.
In recent years, the government repeatedly ran arrears in payments for thermal power. In 2011,
the explicit fiscal subsidy reached over 1.1 percent of GDP.
Poorly targeted electricity subsidies. Before the recent tariff hike, large industrial consumers paid
less than a quarter of the cost of producing a kWh. These consumers accounted for 44 percent
of total power consumption in 2010. Thus, almost two-thirds of the power subsidy accrued to a
small group of industrial consumers. Among households, only 12 percent of Ugandans have
access to the national power grid, while the rest rely on unsubsidized kerosene and firewood.
The poor generally do not have access to the electricity grid and the initial power connection
costs (about US$80) are too prohibitive.
Evidence that both industrial and household consumers are willing to pay substantially more
than the prevailing tariffs in 2010. A World Bank report noted that average coping costs for
intermittent power supply was US$0.30 per kWh (or US$0.40 including fixed costs). For
residential customers, the willingness to pay would be US$0.50 per kWh.
Investments in hydro power infrastructure leading to a reduction in electricity provision costs
over the medium- and long-term.
Limited access to power in Uganda. As of 2010, only 12 percent of the population (under 4
percent of rural population) had access to power, which was less than half of the rate observed
on average in other low-income African countries.
Mitigating measures
The key explicit mitigating measure to power tariff reform is the lifeline tariff for low income
consumers. Uganda has lifeline tariff for poor domestic consumers for power consumption of up to
15 kWhs a month. This lifeline tariff has remained unchanged at USh 100 per kWh.
ENERGY SUBSIDY REFORM: CASE STUDIES
INTERNATIONAL MONETARY FUND 117
Reform lessons
The Ugandan case clearly shows that a key impediment to addressing inefficiencies in a power
utility is lack of investment. As UMEME made substantial investments, it was able to reduce
distribution losses and improve collection while increasing access rate by about 50 percent in the
last three years.
Poor financial performance of power utilities is not only caused by the government’s desire to
maintain low tariffs. Their performance is equally impacted by high levels of distribution network
losses and under collection of bills. Therefore, increasing power tariffs alone will not be enough.
Power tariffs should be set at economic levels but need to allow for a reasonable level of line losses.
In addition, the utility‘s financial sustainability needs to be pursued through measures to improve
efficiency. For this purpose, regulatory policies can help provide utilities with appropriate incentives.
Institutional reform of the power sector takes some time (e.g., 5–10 years). Uganda started its
reforms in 1999 and took moer than 10 years to make progress (in terms of access rates, efficiency
measures, fiscal burden, etc.). The reforms led to the establishment of a largely independent
regulator with a relatively sound regulatory framework, greater private sector participation in
electricity generation and distribution through concessions, and tariff policies that are expected to
eliminate hidden costs by the end of this year.
Tariff increases require a careful strategy for communication and implementation. The
Ugandan government communicated well the cost of the power subsidy and its incidence to the
public. A large portion of the media considered raising tariffs to be pro-poor measure.
Raising access to power is challenging. Targets for rural electrification had to be revised from
2010 to 2012. It should be noted that the high cost of getting a new power connection is a major
impediment to accessing power.
References
Mawejje, J., and others, 2012, Uganda‘s Electricity Reforms and Institutional Restructuring, Economic
Policy Research Centre Working Paper No. 89 (Kampala: Economic Policy Research Centre).
Mwenda, January 16, 2012. The Independent.
Ranganathan, R., and Vivien Foster, 2012, ―Uganda‘s Infrastructure: A Continental Perspective,‖
World Bank Policy Research Working Paper No. 5963 (Washington: World Bank).
Uganda Ministry of Energy and Mineral Development, 2012, Energy and Mineral Sector Performance
Report, 2008–2011.
World Bank, 2011, Uganda: Strategic Review of the Electricity Sector, Draft Policy Note (Washington).