Cardiovascular Responses of Trained Cyclists to Different ...
63
Eastern Illinois University e Keep Masters eses Student eses & Publications 1993 Cardiovascular Responses of Trained Cyclists to Different Pedaling Rates at a Constant Power Output on a Cycle Ergometer David C. Immke is research is a product of the graduate program in Physical Education at Eastern Illinois University. Find out more about the program. is is brought to you for free and open access by the Student eses & Publications at e Keep. It has been accepted for inclusion in Masters eses by an authorized administrator of e Keep. For more information, please contact [email protected]. Recommended Citation Immke, David C., "Cardiovascular Responses of Trained Cyclists to Different Pedaling Rates at a Constant Power Output on a Cycle Ergometer" (1993). Masters eses. 2099. hps://thekeep.eiu.edu/theses/2099
Transcript of Cardiovascular Responses of Trained Cyclists to Different ...

Eastern Illinois UniversityThe Keep
Masters Theses Student Theses & Publications
1993
Cardiovascular Responses of Trained Cyclists toDifferent Pedaling Rates at a Constant PowerOutput on a Cycle ErgometerDavid C. ImmkeThis research is a product of the graduate program in Physical Education at Eastern Illinois University. Findout more about the program.
This is brought to you for free and open access by the Student Theses & Publications at The Keep. It has been accepted for inclusion in Masters Thesesby an authorized administrator of The Keep. For more information, please contact [email protected].
Recommended CitationImmke, David C., "Cardiovascular Responses of Trained Cyclists to Different Pedaling Rates at a Constant Power Output on a CycleErgometer" (1993). Masters Theses. 2099.https://thekeep.eiu.edu/theses/2099

THESIS REPRODUCTION CERTIFICATE
TO: Graduate Degree Candidates who have written formal theses.
SUBJECT: Permission to reproduce theses.
The University Library is receiving a number of requests from other institutions asking permission to reproduce dissertations for inclusion in their library holdings. Although no copyright laws are involved, we feel that professional courtesy demands that permission be obtained from the author before we allow theses to be copied.
Please sign one of the following statements:
Booth Library of Eastern Illinois University has my permission to lend my thesis to a reputable college or university for the purpose of copying it for inclusion in that institution's library or research holdings.
Date Author
. .._
I respectfully request Booth Library of Eastern Illinois University not allow my thesis be reproduced because
~~~~~--~~~~~~~~
Date Author

Cardiovascular Responses of Trained Cyclists to Different
Pedaling Rates at a Constant Power Output on a Cycle (TITLE)
Ergometer.
BY
David C. Immke
THESIS
SUBMITIED IN PARTIAL FULFILLMENT OF THE REQUIREMENTS
FOR THE DEGREE OF
Master of Science
IN THE GRADUATE SCHOOL, EASTERN ILLINOIS UNIVERSITY
CHARLESTON, ILUNOIS
1993 YEAR
I HEREBY RECOMMEND THIS THESIS BE ACCEPTED AS FULFILLING
THIS PART OF THE GRADUATE DEGREE CITED ABOVE
' DATU / ADVISER
r
DATE DEPARTMENT HEAD

ABSTRACT
Cardiovascular Responses of Trained Cyclists
to Different Pedaling Rates at a Constant Power
Output on a Cycle Ergometer
David lmmke
Previous research has not resolved the issue as to which pedaling rate is
the most efficient in terms of oxygen uptake (V02) for competitive cyclists. The
purpose of this study was to determine the most efficient pedaling rate (30, 60,
or 90 rpm) at steady state submaximal cycling (720 kpm/min) for trained cyclists.
Eight healthy subjects (all male) were examined during steady state exercise for
each of the three trials for which work rate was kept constant with varying pedal
rate and resistance. Variables included oxygen uptake, cardiac output, heart
rate, stroke volume, arterio-venous ~ difference, respiratory exchange ratio,
and respiratory rate. Basic descriptive statistics (mean, standard deviation, etc.)
and one-factor analysis of variance with repeated measures were used to
analyze the data. Significance was set at 95% (p<0.05) for the data. Results
showed that V02 (Umin and ml/kg/min), heart rate, and VC~ were significantly
lower (p<0.05) for 60 rpm compared to 30 rpm and 90 rpm. Minute ventilatory
volume was significantly lower (p<0.05) for 60 rpm compared to 90 rpm.
Respiratory exchange ratio was significantly lower (p<0.05) for 30 rpm and 60
rpm compared to 90 rpm. It is hypothesized that at low pedal rates the muscle
fibers are in a longer period of contraction and at high pedal rates more muscle
fibers are recruited to stabilize the trunk. Each of these will result in a decrease
in efficiency for the competitive cyclist. The results indicate that 60 rpm is more
efficient for the competitive cyclist when compared to the low pedal rate of 30
rpm and the high pedal rate of 90 rpm at an absolute steady state work rate of
720 kpm/min.
ii

ACKNOWLEDGEMENTS
Many sincere thanks goes to Dr. John Emmett, Dr. Thomas Woodall, Dr.
Max Chapman, and Dr. Jeff McClung for their great interest, support, direction,
and patience in the completion of this study. A special thanks goes to the
subjects who volunteered their time to participate in the study.
The author also wishes to thank Dr. Patricia Fehling and Dr. Gail Dalsky
of the University of Connecticut Osteoporosis Center for their knowledge and
encouragement for the completion of this masters thesis.
iii

TABLE OF CONTENTS
LIST OF TABLES
LIST OF FIGURES
Chapter I: INTRODUCTION
Purpose
Hypotheses
Limitations
Definition of Terms
Chapter II: REVIEW OF LITERATURE
Physiological Changes Due to Different Pedal Rates
The Effect of Pedal Rate on Endurance
Techniques for Measuring Cardiac Output During Exercise
Cardiac Output - Oxygen Uptake Relationship During Cycle Ergometry
iv
vii
viii
1
4
4
5
6
8
13
14
18

Chapter Ill: METHODOLOGY
Introduction
Subjects
Setting
Experimental Design
Submaximal Exercise Protocol
Carbon Dioxide Rebreathing Protocol
Analysis of Data
Chapter IV: RESULTS
Introduction
Subject Data
Descriptive Data for Each Pedal Rates
Comparison of Oxygen Uptake
Comparison of the Central Limitations of Oxygen Uptake
Comparison of the Peripheral Limitation of Oxygen Uptake
Comparison of Respiratory Function
Statistical Analysis of Differences Between Groups
20
20
21
22
22
24
25
26
26
27
31
32
36
37
39
v

Chapter V: DISCUSSION, CONCLUSIONS, & RECOMMENDATIONS
Discussion 42
Summary
Conclusions
Recommendations
REFERENCES
46
47
47
49
vi
vii
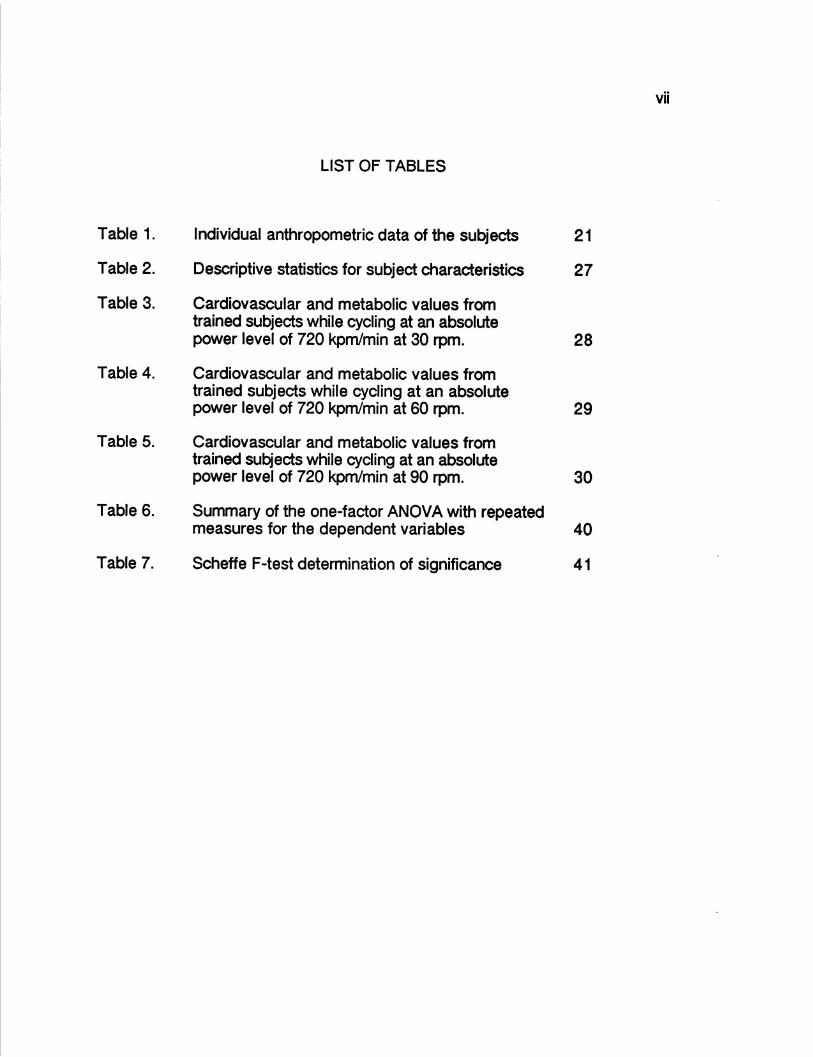
LIST OF TABLES
Table 1. Individual anthropometric data of the subjects 21
Table 2. Descriptive statistics for subject characteristics 27
Table 3. Cardiovascular and metabolic values from trained subjects while cycling at an absolute power level of 720 kpm/min at 30 rpm. 28
Table 4. Cardiovascular and metabolic values from trained subjects while cycling at an absolute power level of 720 kpm/min at 60 rpm. 29
Table 5. Cardiovascular and metabolic values from trained subjects while cycling at an absolute power level of 720 kpm/min at 90 rpm. 30
Table 6. Summary of the one-factor ANOVA with repeated measures for the dependent variables 40
Table 7. Scheffe F-test determination of significance 41

viii
LIST OF FIGURES
Figure 1. Oxygen uptake versus each of the three different exercise trials at 30, 60, and 90 rpm at a work rate of 720 kprn/min. 31
Figure 2. Heart rate compared between each of the three separate exercise trials at 30, 60, and 90 rpm at a work rate of 720 kprn/min. 33
Figure 3. Stroke volume comparison between each of the three separate exercise trials at 30, 60, and 90 rpm at a work rate of 720 kprn/min. 34
Figure 4. Cardiac output compared between each of the three separate exercise trials at 30, 60, and 90 rpm at a work rate of 720 kprn/min. 35
Figure 5. Arterio-venous difference oxygen difference compared between each of the three separate exercise trials at 30, 60, and 90 rpm at a work rate of 720 kprn/min. 36
Figure 6. Minute ventilatory volume compared between each of the three separate exercise trials at 30, 60, and 90 rpm at a work rate of 720 kpm/min. 37
Figure 7. Respiratory rate compared between each of the three separate exercise trials at 30, 60, and 90 rpm at a work rate of 720 kprn/min. 38

CHAPTER 1
INTRODUCTION
Identification of the Problem
Competitive cycling is a unique human powered sport because athletes
can attain similar velocities at markedly different rates of limb movements, by
varying gear ratios. Other competitive sports, such as running, swimming, and
speedskating rely on standard rate of limb movements to attain certain
velocities and not force applied to a mechanical device as in cycling (Hagberg,
Mullin, Giese,& Spitznagel, 1981). Road-racing cyclists can vary their pedaling
rate to as low as 30 rpm or as high as 120 rpm and attain the same speed by
altering resistance by gear ratios. However, cyclists routinely use high pedal
rates in the range of 80-110 rpm (Hagberg, Mullin, Bahrke,& Limburg, 1979).
Contrary to the high pedal rates used by competitive cyclists, laboratory testing
frequently uses the range of 50-60 rpm.
Many studies have addressed the question of the optimal pedal rate.
The problem that has occurred with the research is that many of the subjects
were either noncyclists or recreational cyclists and the results have been
inferred to aid the competitive cyclist (Ramey, 1977). These studies and others
have shown that the most efficient pedaling rate ranges from S0-80 rpm, well
below the range used by competitive cyclists.
The criteria to determine which pedaling rate is most efficient is the rate
at which oxygen uptake (V02) is lowest at an absolute submaximal test or the
highest at a maximal test. V02 is the gold standard that has worldwide

2
acceptance for measuring the ability of humans to perform prolonged exercise.
Oxygen uptake is determined by the product of cardiac output (Q) and arterio
venous 02 difference (a-v 02 diff.). Since V02 is a product of two variables
there are different means for achieving the same V02 value. Cardiac output
can be low with a high a-v 02 diff., or vice verca. This is important because
there is discussion as to which of the two variables, Q or a-v 02 diff., is the
limiting factor for V~max· Since, the ability for an athlete to increase exercise
capacity following training depends partially on the magnitude of the increase in
oxygen uptake. Although resting oxygen uptake is very similar in trained and
untrained individuals there can be a one and a half to twofold higher maximal
oxygen uptake in the trained versus the untrained individual (Sutton, 1991).
Therefore, studies that have not used competitive cyclists for subjects should
not apply results to all populations, namely, noncyclists, recreational cyclists,
and competitive cyclists.
Oxygen consumption itself, though, has several different variables that
have not been widely studied when researching pedaling rates. The
component that usually is reported is heart rate. This is useful since heart rate
response is known to parallel that of V02 during exercise. However, the limiting
variables for oxygen consumption where little research has been done in
connection with pedal rate are stroke volume and a-v 02 diff. These two
variables are the central and peripheral limiting factors, respectively.
Measuring these variables at different pedaling rates could possibly explain
why different efficiencies at different pedaling rates are reported in the literature.
3
Various results have been reported when investigating which pedaling
rates to use when measuring V02max· Pivarnik and associates (1988) showed
less than three percent difference in absolute peak oxygen consumption when
comparing 50 rpm versus 90 rpm. In contrast, McKay and Bannister (1976)
found that 80 rpm and 100 rpm produced a greater V02max than did 60 and 120
rpm. Additionally, both of these studies (Pivarnik, et al., 1988; McKay, et al.,
1976) differ from Hermansen and Saltin (1969) who reported that 60 rpm
elicited the highest V02max· The confusion concerning which pedaling rate is
most efficient for maximal values has carried over to submaximal efforts of
competitive cyclists. However, few studies measure the variables that
determine oxygen consumption at submaximal levels: cardiac output ( heart
rate x stroke volume ) and arterio-venous oxygen difference.
One reason for the lack of data for this type of testing is because until the
last twenty years there was no non-invasive yet accurate and reliable method of
determining cardiac output during exercise. Because of the risks and technical
complications of the Direct Fick and Indicator Dye Dilution methods of
determining cardiac output, testing in this area had not often been previously
attempted. However, now that the consistency and accuracy of the non
invasive carbon dioxide rebreathing technique to determine cardiac output
during exercise has been verified, testing can now be accomplished for
competitive cyclists at submaximal levels (Knowlton & Adams, 1974).

Statement of the Problem
The purpose of this study was to determine the most efficient pedaling
rate ( 30, 60, or 90 rpm) at steady state submaximal cycling (720 kpm/min, 120
W) for trained cyclists in terms of oxygen uptake, heart rate, stroke volume,
cardiac output, and arterio-venous oxygen difference. The results of this study
will have practical applications regarding the pedal rate which trained cyclists
may compete.
Hypotheses
1. There is no difference in the oxygen uptake among the three pedal
4
rates (30, 60, and 90 rpms) at a steady state submaximal work rate of 720
kpm/min (120 Watts).
2. There is no difference in the central (cardiac output, heart rate, and stroke
volume) or peripheral (a-v 02 diff.) limiting factors of oxygen uptake
among the three pedal rates (30, 60, and 90 rpms) at a steady state
submaximal work rate of 720 kpm/min (120 Watts)

Limitations
1. This study was limited to eight subjects. It was difficult to find subjects
who were competitive cyclists and willing to participate in the study
during the summer months when races normally take place.
5
2. Because of time constraints for the subjects, testing was done at random
throughout the day and not at an established time of day.
3. It was assumed that physiological responses were due to exercise and
not influenced by any other factors such as medications, caffeine, diet, or
prior exercise. It would have been to difficult to control for these variables
due to the different time of day when testing took place.
4. The subjects used the ergometer as provided from the research
laboratory and were not allowed to use their own bicycle or any of its
components.
5. Due to time constraints the researcher did not test the maximal
oxygen consumption for each subject. The work load was the same for
each subject regardless of fitness. This did not enable the researcher to
determine the percent of V02max the subjects were utilizing.
Definition of terms
Arterio-venous Oxygen Difference (a-v 02 diff). The average difference
between the oxygen content of arterial and mixed venous blood. (McArdle,
Katch,& Katch, 1986, page 269)
Cardiac Output (Q). The amount of blood determined by the hearts rate of
pumping and the quantity of blood ejected with each stroke. (McArdle, et al.,
1986, page 269)
Central Limitation. The limitation of oxygen uptake by the cardiorespiratory
system involving cardiac output (HR x SV) or maximal arterial oxygen content.
(Sutton, 1991, page 26)
Competitive Cyclist. The level of each of the subjects was at Category 3 or
better.
Fick Equation. VD2 = Cardiac Output x Arterio-Venous Oxygen Difference.
(McArdle, et al., 1986, page 269)
Peripheral Limitation. The limitation of oxygen uptake by the degree of
extraction and utilization of oxygen from the arterial blood by the muscle cells.
Described as arterio-venous oxygen difference. (Sutton, page 26)
6

Revolutions Per Minute (rpm). The number of cycles per unit of time on an
ergometer.
Stroke Volume (SV). The quantity of blood ejected from the heart with each
beat. (McArdle, et al., page 269)
Oxygen Uptake (V02). The volume of oxygen (STPD) extracted from the
inspired air, usually expressed in liters per minute. (Astrand & Rodahl, 1986,
page 738)
7

CHAPTER II
REVIEW OF LITERATURE
The research in the literature that is pertinent to this investigation will be
described in this chapter. Included will be the following topics: 1) Physiological
changes due to different pedal rates; 2) Effect of pedal rate on endurance; 3)
Techniques for measuring cardiac output during exercise; 4) Cardiac output -
oxygen uptake relationship during cycle ergometry.
Physiological Changes Due To Different Pedal Rates
In theory, in cardiovascular, respiratory, metabolic, or perceptual
responses during different bouts of submaximal exercise at absolute work rates
should be similar. For competitive cyclists there are many ways in which to
attain a submaximal work rate. By varying pedal rate versus gear ratio to either
extreme the cyclist can attain the same velocity if the resulting power output are
equal. The cyclist, therefore, has a large number of combinations of pedal rates
versus resistance in order to attain the same speed.
Researchers have found that in unloaded cycling exercise, responses
are not the same at different pedal rates. Differences were noted within the
cardiovascular system, respiratory system, metabolically, and even the
perception of effort by the cyclist. Hagberg, et al., (1981) found that unloaded

9
cycling at different pedal rates in seven road-racing cyclists that had just
completed their competitive year, differences do occur. V02. ventilation (Ve),
and HR were all significantly greater for each increase in unloaded pedal rate.
On the other hand, there were no significant changes seen with the respiratory
exchange ratio, lactic acid, or perceived exertion parameters. They reported,
however, that the relationship between the parameters and the pedal rates
during unloaded cycling is somewhat more complex than simply the additional
work required to move the legs more rapidly, insomuch as V02 and Ve
increases exponentially with increasing pedal rates while HR increases linearly.
The possible explanation for these changes at the lower pedal rates is a less
uniform pattern of blood flow caused by increasing the force requirement per
pedal stroke. Meanwhile at the higher pedal rates, the difference could be due
to the recruitment of additional musculature to stabilize the trunk.
Hagberg, et. al, (1981) also investigated the effects of the physiological
parameters under differing pedal rates at a work load requiring 80% of their
maximal 02 uptake. The researchers showed that vo.z. Ve, Respiratory
Exchange Ratio (RER), and lactic acid (LA) were best fit by quadratic models.
Perceived exertion and heart rate increased linearly with an increase in pedal
rate, supporting the original contention of Borg (1962), that perceived exertion is
best related to heart rate. Hagberg, et al., (1981) speculated as pedal rate
increases, less absolute power (and therefore force) is required per pedal
stroke. Since blood flow during the time of contraction is known to be related to
the relative force of the contraction (Barcroft and Millen, 1930), an increased
pedal rate may cause less occlusion of blood flow during the contraction period.

10
Hagberg, et al., (1981) noted 91 rpm as the most efficient pedal rate as judged
by V02, Ve, RER, and LA. A study similar to Hagberg, et al, (1981) but used
50% of peak power instead of 80% (Bolonchuk et al. 1992). All three of their
tests were set at a mean of 731± 149 kpm/min at pedaling rates of 25, 50, and
75, and external resistance of 3.0, 1.5, and 1.0, respectively. The study used
eight college age males for subjects. The results concluded that although work
and power were held constant for pedal rates of 25, 50, and 75, physiological
changes did occur. Mean V02, VC02, CN02 debt and V021kg for the 25 rpm
test were significantly greater than those values for 50 and 75 rpm. Heart rates
were significantly different for 25 rpm also. There were no significant
differences found for the heart rate and respiratory variables (Ve, F, VT or
ratios). The anaerobic component was greater for the 25 rpm (8%) than the 50
rpm (4%) and the 75 rpm (5%) despite an absolute power output.
Buchanan & Weitman (1985) examined the effects of three pedal rates
(60,90, 120 rpm) on VD2max and lactate threshold in competitive cyclists. Nine
competitive road racing cyclists were tested using a continuous incremental
protocol on a Monark ergometer which was equipped with toe clips. At
submaximal work rates from 0 kpm/min to 1300 kpm/min oxygen uptake values
were significantly higher at 120 rpm as compared to 60 and 90 rpm. There
were no statistically significant differences in VD2 at these work outputs when
60 and 90 rpm were examined. At higher submaximal levels (from 1300
kpm/min to 2000 kpm/min) both 60 and 120 rpm resulted in higher VD2 than
observed at 90 rpm. The data at higher submaximal levels are similar to and
different from other reports. Pandolf & Noble ( 1973) noted no difference in VD2

11
at power outputs of 550, 775, and 1075 kpm/min when 40, 60, and 80 rpm were
compared. However, Lollgen, Graham, and Sjogaerd (1980) reported that 100
rpm resulted in the highest V02 when compared to 40, 60, and 80 rpm at 70%
of VD2. Additionally, Hughes, Turner, and Brooks (1982) reported that VD2
values at 90 rpm were significantly greater than VD2 values at 50 rpm and work
rates from 300 kpm/min to 2100 kpm/min. Hughes, et al., (1982) suggested that
pedaling at faster rates increases the caloric cost thus elevating the V02 at a
given work load. Buchanan and Weitman (1985) do not support this suggestion
since no difference in V02 was seen for 60 versus 90 rpm for work rates of 0
kpm/min to 1300 kpm/min and a higher V02 was observed at 60 rpm as
compared to 90 rpm from work rates of 1300 to 2000 kpm/min.
In the comparison of 50 rpm and 90 rpm, Pivarnik, Montain, Graves, and
Pollock (1988), sought to determine whether there were differences in peak
V02 values, at any of the metabolic, ventilatory, or perceived exertion variables
during the submaximal stages of a maximal cycle test. Eleven male subjects
underwent two incremental cycle ergometer tests designed to elicit maximal
aerobic capacity (V02max). The speeds were set at 50 and 90 rpm and the
power output was increased every two minutes by 300 kpm/min. Their results
included a non-significant difference of 3% due to pedal speed for absolute
peak V02. There was a significant main effect of pedal speed as average
values of V02. VC02. RER, Ve, and HR were all greater at 90 rpm for
submaximal levels. In this study, however, there were no significant interactions
within the respiratory rate (RR) or perceived exertion (RPE). The fact that there
was no change with perceived exertion is different from many studies that found

12
that there is a lower perception of exertion as pedal rate increases (Coast, Cox,
& Welch, 1986; Lollgen, et al., 1980). Gaesser and Brooks (1975) studied the
differences between the traditional and theoretical exercise efficiency
calculations. They defined that gross efficiency was not corrected, net efficiency
was corrected for resting metabolism at base-line, work efficiency was defined
by correcting for unloaded cycling, and finally delta efficiency was computed by
adjusting for measurable work rate as a base-line correction. Twelve well
conditioned male subjects exercised at 40, 60, 80, and 100 rpm at work rates of
0, 200, 400, 600, and 800 kpm/min. Their results stated that all definitions for
efficiency (gross, net, work, and delta) yielded decreasing efficiency with
increments in speed.
Many submaximal exercise studies suffer from the drawback that only
low work rates are measured when competitive cyclists perform at relatively
high work rates was noticed by Boning, Gonen, and Maassen (1984). Another
problem they felt needed to be looked into was the difference between trained
and untrained cyclists. They exercised nine well-trained amateur road-racing
cyclists and six untrained medical students at work loads of 50, 100, and 200 W
each at pedaling rates of 40, 60, 70, 80, and 100 rpm. Their results showed
significantly higher oxygen uptake, ventilatory minute volume, and heart rate for
the untrained group versus the trained group. The most important finding of this
study was that the ·optimal" pedaling rate shifted from 40 rpm at 50 W to 70 rpm
at 200 W. This study is similar to others (Lollgen, et al., 1980, and Pugh, 1974)
in that the dependence of VOJ. on pedaling rate disappears when approaching
maximal oxygen uptake. One of the suggestions that the authors make is that

13
·efficiency must be reduced when using numerous muscle fibers as well as
when using few fibers frequently for a given load. Also, additional effects may
come from the difficulty of pedaling regularly at high work loads with low rate;
thus, acceleration and auxiliary movements increase energy expenditure.·
(Boning, et al.. 1986, page 96)
The Effect Of Pedal Rate On Endurance
One aspect of cycling at high rates is that endurance could be
compromised. Carnevale and Gaesser ( 1991) reported the effects of pedaling
rate on the power-duration relationship for high-intensity exercise. Their
subjects included seven males who performed eight exhaustive bouts (four at
60 rpm and four at 100 rpm). Their report conclude that the power asymptote
(capacity for sustained power output) at 60 rpm bout of exercise (235 ± SW) was
significantly greater than at 100 rpm (204 ± 11W). The power asymptote reflects
an inherent characteristic of aerobic energy production during exercise, above
which only a finite amount of work can be performed, regardless of the rate at
which the work is performed. Their data demonstrates that there is a greater
cardiorespiratory and blood/muscle lactate response during constant-power
exercise while cycling at high versus low rpm. It also indicates that the
theoretical maximum sustainable power during cycle ergometry in untrained
males is greater at 60 rpm than at 100 rpm. In essence, endurance is

14
compromised at higher pedaling rates for untrained versus trained cyclists.
Similar to this study Jones, et al., (1985) found that the fatigue index of subjects
are different at different pedal rates without affecting the changes in muscle
metabolites.
In summary, many exercise laboratories have addressed the question of
which pedal rate is most efficient. There have been studies utilizing maximal
and submaximal levels of exercise and no definite answer has emerged. Due
to the differing opinions on the subject research needs to be expanded to show
how the central (Q, HR, SV) and peripheral factors (a-v 02 diff.) of V02 are
affected by pedaling rate. Due to the difficulty of determining cardiac output
during exercise it has rarely been measured. Three laboratory procedures can
be used to determine cardiac output: Direct Fick method, dye dilution method,
and carbon dioxide rebreathing technique. But, carbon dioxide rebreathing is
the only non-invasive yet reliable means of determining cardiac output during
exercise.
Techniques For Measuring Cardiac Output During Exercise
In 1870 Fick devised a formula expressing the relationship between
cardiac output, oxygen consumption, and arterio-venous difference: cardiac
output = oxygen consumption I arterio-venous difference. The difficulty in
determining cardiac output with this theory ,directly. is that the arterio-venous

15
difference must be calculated from samples of arterial and venous blood.
Although the arteries needed are easily located, the actual arterial puncture can
be traumatic to the subject. In addition, the most accurate assessment of
oxygen content in venous blood is from the right atrium, right ventricle, or
pulmonary artery taken by catheterization. This is needed because if the
sample is taken from a peripheral vein its oxygen content will only reflect the
metabolic activity from the area it drains. The Direct Fick method is generally
the standard by which other techniques are validated but its use as a laboratory
technique is criticized for its invasive nature to subjects.
The second method of determining cardiac output is the indicator dye
dilution method. Like the direct Fick method of determining cardiac output the
indicator dye dilution involves both venous and arterial punctures, but does not
require cardiac catheterization. A harmless dye is injected into the venous
system of a subject where it usually binds to plasma proteins on red blood cells.
Arterial blood samples are then continuously measured with a radioactive
counter. The area under the dilution-concentration curve obtained by this
repetitive sampling indicates the average concentration of indicator material as
blood is pumped from the heart. Cardiac output would then be calculated as
follows: cardiac output = quantity of dye injected I average concentration of dye
in blood for duration of curve x duration of curve( McArdle, et al., 1986).
These two techniques can be more traumatic to the subject than the
value of the information received. It is for that reason that the carbon dioxide
rebreathing technique was established. With this method, steady state exercise
is needed while the subject ·rebreathes· a certain mixture of oxygen and carbon

16
dioxide from an anesthetic bag. This combination of gases mixes with the air in
the lungs and results in an indication of venous carbon dioxide. The
measurement of end tidal CQ.z represents arterial C02. After calculations are
made from the values of carbon dioxide from the plateau technique of Collier
(1950) or the extrapolation technique of Defares (1958) estimates of PvC02 are
established. From this PvC02 critical measurements permit the useful
estimation of the CD2 content in the mixed venous and arterial blood. After this
is known cardiac output can be calculated from equations (Q = VC02 I a-v C02
diff.).
Because of the many assumptions and indirect calculations made for the
carbon dioxide rebreathing technique studies needed to be done to verify its
validity and reliability. Comparisons of the rebreathing technique versus the
dye dilution and have been performed. Ferguson, et al., (1968) showed that the
validity of the rebreathing method correlated well with the dye dilution method.
Also in 1968, Muiesan, et al., showed that when compared to the gold standard,
the Direct Fick method, the rebreathing technique was a reliable non-invasive
clinical testing device for determining cardiac output.
The consistency of carbon dioxide rebreathing as a non-invasive method
to determine exercise cardiac output was investigated by Knowlton and Adams
(1974). The researchers performed cardiac output studies on 15 college age
volunteers from the student body. Four separate bouts of exercise were
conducted on consecutive days. The first and second days the bicycle
ergometer resistance was set at 600 kpm/min and the third and fourth days it
was set at 900 kpm/min. Each subject rode for twelve minutes with steady state
usually occurring near minute seven. PvC02 and PaCD2 were calculated from

17
the extrapolation method and Bohr equation, respectively. The mean cardiac
output for the 600 kpm/min workload was 11.1Umin for the first day, 10.9 Umin
for the second day and at the heavier workload 13. 7 Umin and 13.5 Umin for
the third and fourth days. Their data showed a 5.5% error and and 4.2% error
for variability for the 600 and 900 kpm/min, respectively. This variability
compares favorably with duplicate Direct Fick determinations obtained under
the same conditions. However, mean cardiac output values seem to appear
low when related to oxygen consumption values at both workloads. The
authors attributed this to the fact that all subjects were well-trained and at least
half were experienced bicycle riders. Knowlton and Adams (1974) state that the
carbon dioxide rebreathing method of determining cardiac output at steady
state exercise was reliable and well correlated to the Direct Fick method.
Clausen (1969) and Holmgren (1967) both showed pre- and post-training
studies, that at a given level of submaximal oxygen consumption that post
training cardiac output values are lower than pre-trained. Knowing the linear
relationship of cardiac output to oxygen consumption the authors pointed out
that one would expect the "conservation of energy" for the central circulation to
be most significant for physically trained and skilled subjects.
In 1991 Auchincloss, et al., studied the effect of the carbon dioxide
rebreathing technique in terms of steady state versus progressive exercise.
Two separate testing sessions were included in their data set along with data
from a study done earlier. In the testing session I two men and seven women
participated and in session II six men and two women participated. In the
18
previous study there were 18 men between the ages of 21-64 who were tested
only in the steady state. Four determinations were done in the steady state for
the first two sessions and averages of cardiac output and oxygen consumption
were taken. For the steady state cardiac output - oxygen consumption
relationship the data from the previous studies was added and relation slope
was linear with a slope of 5.2. For the unsteady state the relationship was
curvilinear and the comparison was much more complex. The authors results
further depicted that the rebreathing method at steady state is viable, but at
progressive exercise nearing maximal levels the reliability of the results
diminishes.
Cardiac Output - Oxygen Uptake Relationship During Cycle Ergometr:y
As previously stated Auchincloss, et al., (1991) reported the steady state
cardiac output - oxygen consumption relationship as linear with a slope of 5.2.
Similar results come from Faulkner, Heigenhauser, and Schork (1977). In a
study which included 50 normal healthy males between the ages of 17 to 71 a
slope of 5.2 was also reported. This study exercised the the volunteers on a
bicycle pedaling at 50 rpm for 5 min with an increase of 25 or 50 Wafter a rest
of five minutes. The magnitude of increase was based on a previously obtained
V02max· Since this study was large (n=50) differences could be ascertained
19
between ages and body sizes. No significant differences were observed in the
intercepts or slopes of the relationship between light weight men compared to
heavy men, young men compared to old men, and men with low V02max
compared to men with high V02max· The results did show significance
difference in cardiac output and V02 due to age differences, as expected.
The authors noted that assuming the relationship is not significantly
different from linear, the cardiac output/kg -V~/kg relation may be expressed
as the equation, y = rnx+b where y = cardiac output (ml/kg/min), x = V~
(ml/kg/min), m = slope of 5.2, and b = intercept (66 ml/kg/min). This equation
could be used as a predictor of cardiac output at given levels of V02.
Since this study utilized submaximal exercise on a bicycle ergometer at a
pedaling rate of 50 rpm, it remains to answer whether the slope of the cardiac
output - V~ relationship change at the same submaximal level with different
pedal rates?

CHAPTER Ill
METHODOLOGY
Introduction
In theory, oxygen uptake during submaximal cycle ergometry should not
change at different pedal rates if the resistance is adjusted to elicit the same
work rate. It has been well documented, though, that there are different levels of
oxygen uptake for cyclists at different pedal rates even when the work rate is the
same. This study was designed to determine which pedal rate (30, 60, or 90
rpm) at a work rate of 720 kpm/min elicits the most efficient means of oxygen
uptake. In addition, cardiac output was measured during each exercise bout by
carbon dioxide rebreathing. A description of the subjects, the experimental
setting, equipment used, treatments, and treatment of data are included in this
chapter.
Subjects
Eight male subjects were selected for the study. Subjects were selected
from competitive cyclists (minimum of Catgeroy 3) and triathletes in the area.
Six of the subjects had been competitive cyclists for at least three years, one
was a triathlete, and one was a trained cyclist not in competition. Prior to
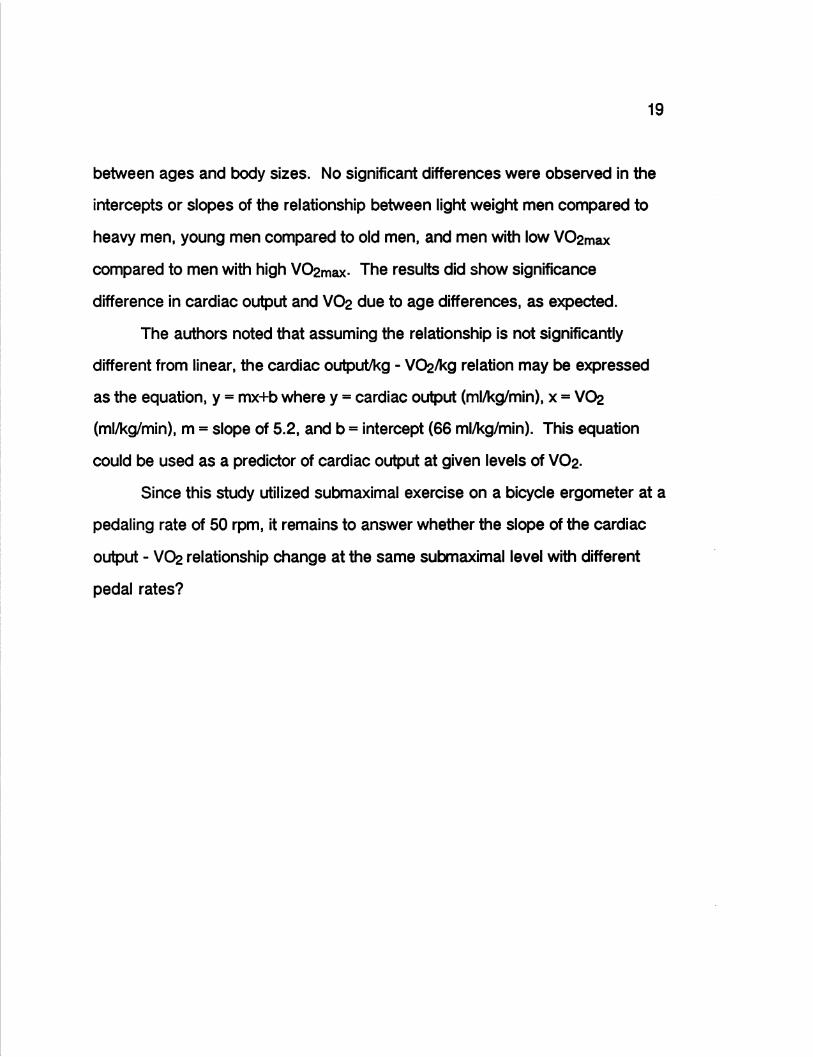
participation an informed consent was signed by each volunteer. Physical
characteristics of the subjects are shown in Table 1.
Table 1: Individual anthropometric data of the subjects
Subject Age Height Weight Body Mass Index (yr) (cm) (kg) (kglm2)
1 23 190.5 79.5 21.9 2 47 174.0 76.3 25.2 3 17 172.7 65.0 21.8 4 21 167.6 60.0 21.4 5 33 172.7 78.5 26.3 6 35 182.9 73.5 22.0 7 21 170.2 74.7 25.8 8 26 180.3 72.3 22.2
Setting
Investigations took place at the Eastern Illinois University Human
Performance Laboratory. The room temperature ranged from 23-25 degrees
21
22
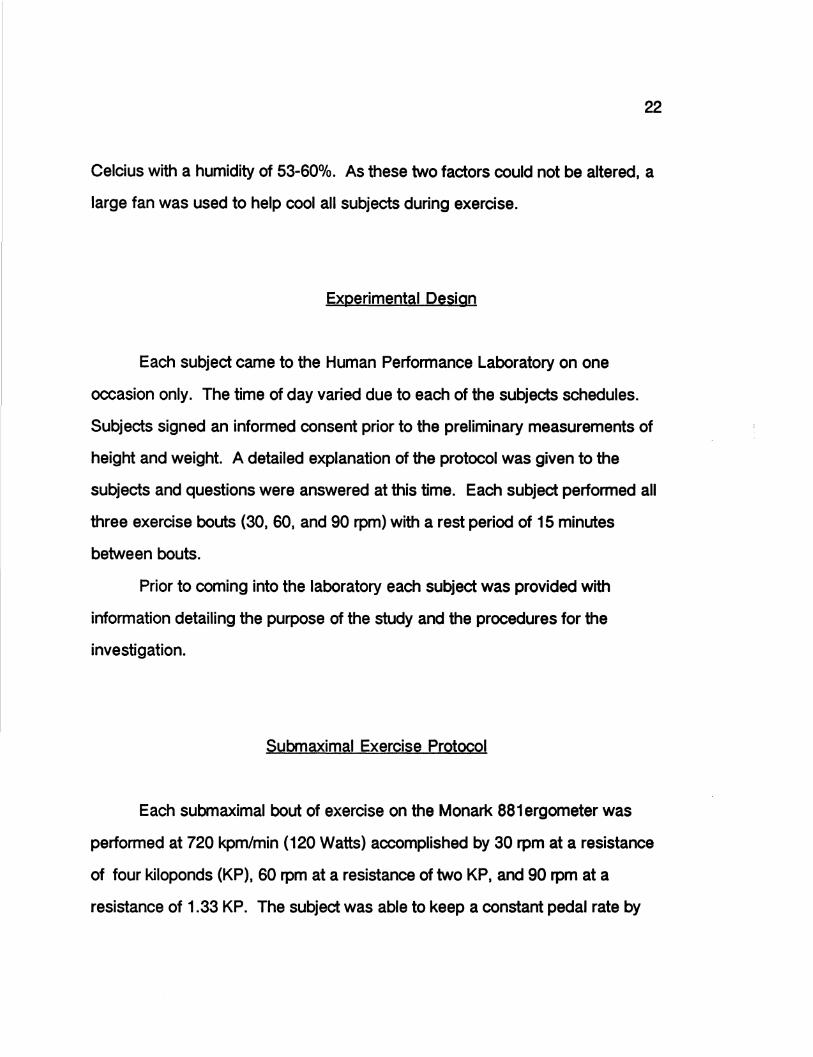
Celcius with a humidity of 53-60%. As these two factors could not be altered, a
large fan was used to help cool all subjects during exercise.
Experimental Design
Each subject came to the Human Performance Laboratory on one
occasion only. The time of day varied due to each of the subjects schedules.
Subjects signed an informed consent prior to the preliminary measurements of
height and weight. A detailed explanation of the protocol was given to the
subjects and questions were answered at this time. Each subject performed all
three exercise bouts (30, 60, and 90 rpm) with a rest period of 15 minutes
between bouts.
Prior to coming into the laboratory each subject was provided with
information detailing the purpose of the study and the procedures for the
investigation.
Submaximal Exercise Protocol
Each submaximal bout of exercise on the Monark 881 ergometer was
performed at 720 kpm/min (120 Watts) accomplished by 30 rpm at a resistance
of four kiloponds (KP), 60 rpm at a resistance of two KP, and 90 rpm at a
resistance of 1.33 KP. The subject was able to keep a constant pedal rate by

23
keeping rhythm with an electric metronome. Each subject was assigned,
according to a table of random numbers, corresponding to which test would be
performed first, second, and third. After correctly positioning the seat height and
toe clips each subject pedaled for five minutes to be used as a warm-up period.
Each bout was a maximum of seven minutes in length. During each
subrnaximal bout HR, V02. Ve, VC02, and RR were recorded at 30 second
intervals. Oxygen uptake was determined by using standard open circuit
spirometry procedures. Nose clips were used and gas was collected through
the Hans Rudolph three way respiratory valve with
modification for carbon dioxide rebreathing technique. Inspired minute
ventilation was calculated with the Rayfield Ram 9200 air flow meter. Expired
gases were analyzed with the Applied Electrochemistry SA-3 oxygen Analyzer
and Applied Electrochemistry CD-3A Carbon Dioxide Analyzer. The data was
automatically collected and analyzed by the REP-2000 B Data Acquisition
System developed by Rayfield Equipment Ltd for use with an Apple lie
microcomputer. A hard copy of oxygen consumptions, respiratory exchange
ratios, VC02. and respiratory rates was printed every 30 seconds during the
cycle ergometer test.
Heart rate was recorded every 30 seconds with the Polar Pacer heart
rate monitor. All heart rate records were stored in its memory and each 30
second interval was recorded on the data sheet to note when steady state was
achieved by the subject.
The subjects were declared to be at steady state when four consecutive
thirty second heart rates were within ±2 bpm. No steady states were reached
prior to five minutes exercise time and none longer than seven minutes.

24
After steady state heart rates were noted one additional 30 second
interval was measured and final HR, V02, VE, RER, and RR values were
recorded. At this time the carbon dioxide rebreathing technique was started to
indirectly determine cardiac output.
Carbon Dioxide Rebreathing Protocol
Prior to the start of exercise an anesthetic (rebreathing) bag which was
connected to the Hans Rudolph valve and filled with a mixture of oxygen and
carbon dioxide. The percentage(%) of carbon dioxide was set between 13.75
and 14.25. This percentage was set as a result of a pilot study done prior to the
start of the research (Emmett, McClung, and lmmke, unpublished data). It was
found that this percentage provided a steady state CD2 value without eliciting
lightheadedness. After steady state had been reached the end tidal volume of
carbon dioxide was measured. Ten consecutive end tidal volumes were
recorded. The high and low values were discarded and the remaining eight
values were averaged.
During the submaximal exercise bout the rebreathing bag hung below
the Hans Rudolph valve with the subject breathing room air. At the point when
steady state VOJ. had been reached and the final data was collected the subject
was instructed to continue to pedal at the same rate. Following an exhalation
the subject then pushed in a plunger on the Hans Rudolph valve which
switched the breathing from open circuit to the closed circuit system containing
25
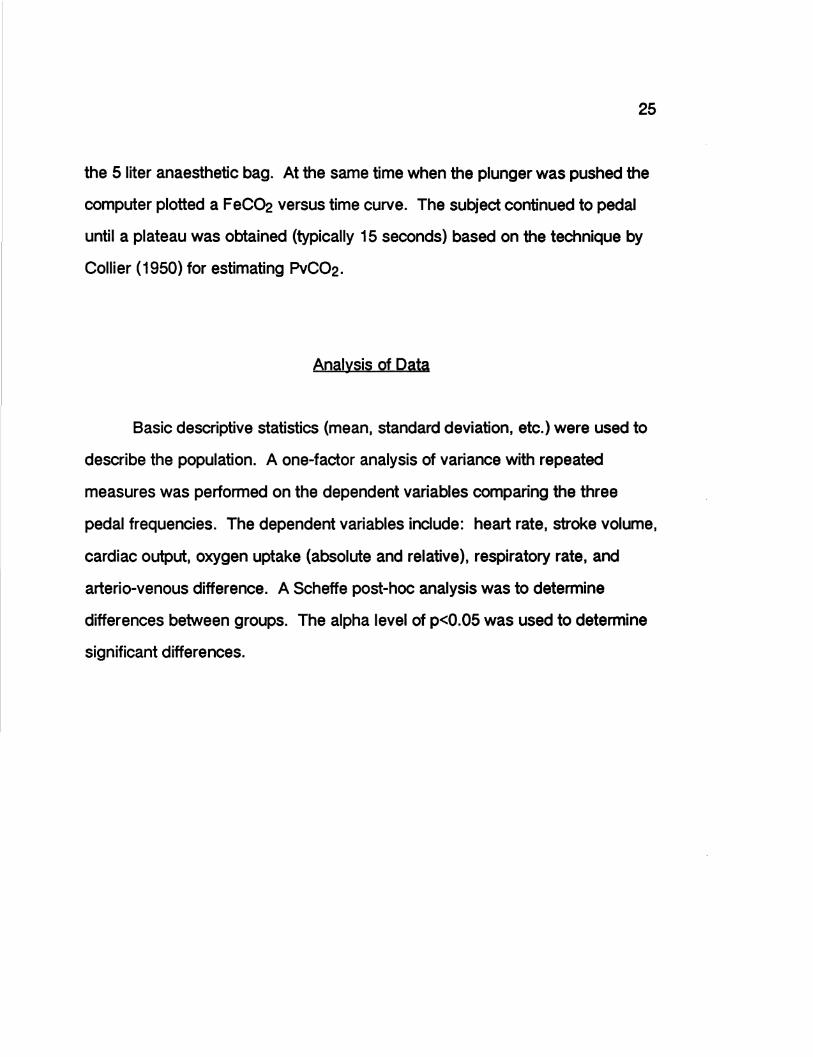
the 5 liter anaesthetic bag. At the same time when the plunger was pushed the
computer plotted a FeC02 versus time curve. The subject continued to pedal
until a plateau was obtained (typically 15 seconds) based on the technique by
Collier (1950) for estimating PvC02.
Analysis of Data
Basic descriptive statistics (mean, standard deviation, etc.) were used to
describe the population. A one-factor analysis of variance with repeated
measures was performed on the dependent variables comparing the three
pedal frequencies. The dependent variables include: heart rate, stroke volume,
cardiac output, oxygen uptake (absolute and relative), respiratory rate, and
arterio-venous difference. A Scheffe post-hoc analysis was to determine
differences between groups. The alpha level of p<0.05 was used to determine
significant differences.
CHAPTER IV
RESULTS
Introduction
This study was designed to evaluate the differences of efficiency for
pedaling rates of 30, 60, and 90 rpm at a resistance level of 720 kpm/min. The
relationship of the variables (VD2. HR, SV, Q, a-v D2 difference, VC~. RR, RER,
and Ve) were compared for each of the three pedaling rates.
Subject Data
Table 2 shows the descriptive statistics for the subjects that participated
in the study. Six of the subjects were competitive cyclists (Cat 3) for at least
three years, one was a trained triathlete, and one subject was a trained cyclist
not currently in competition. The subject pool had a variation of ages, cycling
experience (though all were trained cyclists), and body surface area.

27
Table 2: Descriptive statistics for subject characteristics
(n=8)
Mean Std. Dev. Minimum Maximum S. Err
Age (yr) 27.88 9.88 17 47 3.49
Height (cm) 176.36 7.61 167.6 190.5 2.69
Weight (kg) 72.47 6.74 60.0 79.5 2.38
Surface area 23.32 2.06 21.4 26.3 0.73 (kg/cm2)
Descriptive data for each pedal rate
Tables 3, 4, and 5 shows the descriptive statistics for 30, 60, and 90 rpm,
respectively. Mean, standard deviation, minimum, maximum, and standard
error are included for each pedal rate. All of the variables are taken for the
same time period for each subject during which steady state exercise was
attained. The variables were averaged for the two minute steady state exercise
period.
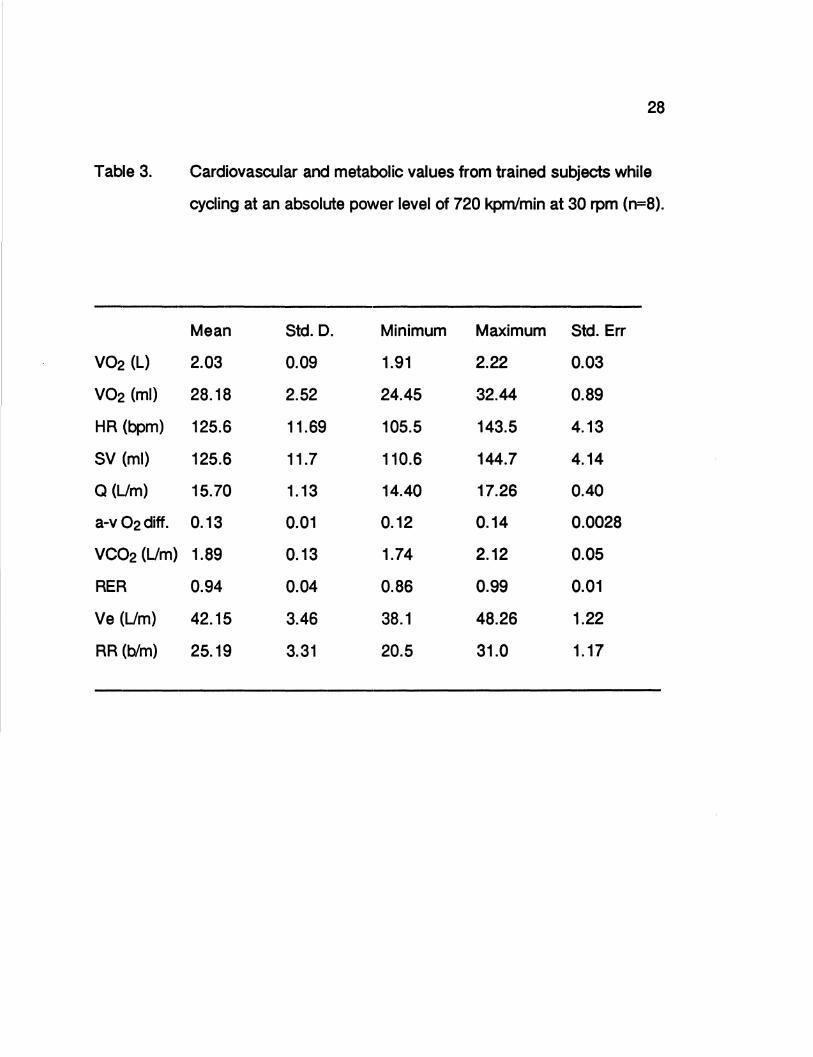
Table 3.
V02 (L)
V02 (ml)
HR (bpm)
SV (ml)
Q(Um)
a-v 02diff.
VC02 (Um)
RER
Ve (Um)
RR (blm)
28
Cardiovascular and metabolic values from trained subjects while
cycling at an absolute power level of 720 kpm/min at 30 rpm (n=8).
Mean Std. D. Minimum Maximum Std. Err
2.03 0.09 1.91 2.22 0.03
28.18 2.52 24.45 32.44 0.89
125.6 11.69 105.5 143.5 4.13
125.6 11.7 110.6 144.7 4.14
15.70 1.13 14.40 17.26 0.40
0.13 0.01 0.12 0.14 0.0028
1.89 0.13 1.74 2.12 0.05
0.94 0.04 0.86 0.99 0.01
42.15 3.46 38.1 48.26 1.22
25.19 3.31 20.5 31.0 1.17

Table 4.
V02 (L)
V02 (ml)
HR (bpm)
SV (ml)
Q (Um)
a-v 02 diff.
VC02 (Um)
RER
Ve (Um)
RR (b/m)
29
Cardiovascular and metabolic values from trained subjects while
cycling at an absolute power level of 720 kpm/min at 60 rpm (n=8).
Mean Std. D. Minimum Maximum Std. Err
1.83 0.06 1.74 1.91 0.02
25.63 3.01 22.2 31.0 1.06
120.4 12.29 102 144 4.35
126.27 14.92 112.5 157.2 5.28
15.09 1.15 13.46 16.67 0.41
0.12 0.01 0.11 0.13 0.0026
1.74 0.07 1.6 1.82 0.02
0.94 0.04 0.87 0.98 0.01
38.08 3.69 32.38 41.89 1.30
23.59 4.6 16 30 1.63

Table 5.
V02 (L)
V02(ml)
HR (bpm)
SV (ml)
a (Lim)
a-v 02 diff.
VC02 (Lim)
RER
Ve (Lim)
RR (blm)
30
Cardiovascular and metabolic values from trained subjects while
cycling at an absolute power level of 720 kpm/min at 90 rpm (n=8).
Mean Std. D. Minimum Maximum Std. Err
1.99 0.07 1.93 2.10 0.02
27.77 3.28 24.43 34.0 1.16
126.7 11.78 109.5 149 4.16
126.2 18.84 108.82 161.29 6.66
15.83 1.22 14.47 17.66 0.43
0.13 0.01 0.11 0.15 0.0041
1.96 0.17 1.73 2.24 0.06
0.98 0.07 0.89 1.06 0.02
44.19 6.78 34.68 56.85 2.40
25.44 4.69 16.5 31.0 1.66

31
Comparison of Oxygen Uptake
The relationship among V02 (L/min) at the three pedal rates. The mean
values for 30, 60, and 90 rpm are 2.03, 1.83, and 1.99 (L/min), respectively.
One standard deviation for each value is indicated by the bars. Statistical
significance was seen between 60 rpm and both 30 and 90 rpm. No
significance was seen between 30 and 90 rpm.
2 .15...----__._• _________ . ....._ ______ ...... ___ ...,.
2.1
2 I 2.05
V02 1 .95 ...
1 .9
1.8 I 1.85
1.75...__----.----------,,.--------~.---~
L/min 30 rpm 60 rpm 90 rpm
Revolutions\minute
* p < 0.05 for 60 rpm compared to 30 rpm and 90 rpm
Figure 1. Oxygen uptake versus each of the three different exercise trials at 30, 60, and 90 rpm at a work rate of 720 kpm/min. (n=8)

32
Comparison of the Central Limitations of Oxygen Uptake
The central limitation of V02 as affected by the differing pedal rates is
depicted in figures 2, 3, and 4. Figure 2 shows the relationship of heart rate
(bpm) for the three pedal rates. The mean values for 30, 60, and 90 rpm are
125.6, 120.4, and 126.7 (bpm). respectively. Figure 3 shows the relationship of
stroke volume (ml) for the three pedal rates. The mean values for 30, 60, and 90
rpm were 125.6, 126.3, and 126.2 (ml), respectively. Figure 4 shows the
relationship of cardiac output (L/min) for the three pedal rates. The mean
values for 30, 60, and 90 rpm were 15.7, 15.09, and 15.83 (L/min), respectively.
One standard deviation is indicated by the bars for each figure.

33
HR
beats\min 30 rpm 60 rpm
Revo lutions\minute
90 rpm
Figure 2.
* p <0.05 for 60 rpm compared to 30 rpm and 90 rpm
Heart rate compared between each of the three separate exercise trials at 30, 60, and 90 rpm at a work rate of 720 kpm/min. (n=8)

sv
150-.--~~--1~~~~~~~-L-~~~~~~--"~~~--
145
140
135
130
125
120
115
110
105.._~~---.~~~~~~~-.-~~~~~~-....~~~--
34
ml 30 rpm 60 rpm
Revo lulions\minute
90 rpm
Figure 3.
* No significance was seen at the p<0.05 level between exercise levels
Stroke volume comparison between each of the three separate exercise trials at 30, 60, and 90 rpm at a work rate of 720 kprn/min. (n=8)

35
17
16.5
16
Q 15.5
15
14.5
14
30 rpm 60 rpm 90 rpm L/min Revo lulions\minute
Figure 4.
* No significance was seen at the p<0.05 level between the exercise levels
Cardiac output compared between each of the three separate exercise trials at 30, 60, and 90 rpm at a work rate of 720 kpm/min. (n=8)
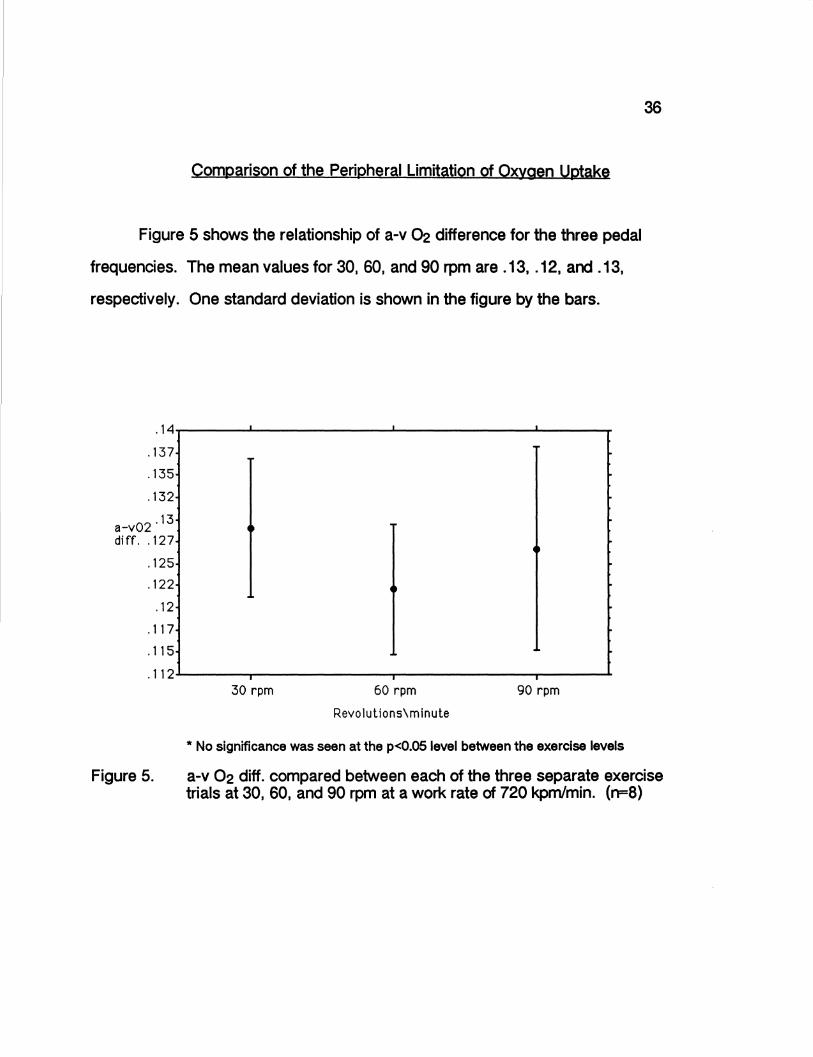
Comparison of the Peripheral Limitation of Oxygen Uptake
Figure 5 shows the relationship of a-v ~ difference for the three pedal
frequencies. The mean values for 30, 60, and 90 rpm are .13, .12, and .13,
respectively. One standard deviation is shown in the figure by the bars .
. 14....--~~----~~~~~~~--~~~~~~--~~---..
' 137
'135
'132
02 '13 a-v diff. '127
'125
'122
'12
'117
'115
.112---~~--..~~~~~~~.--~~~~~~--~~--
30 rpm 60 rpm
Revolulions\minute
90 rpm
* No significance was seen at the p<0.05 level between the exercise levels
36
Figure 5. a-v 02 diff. compared between each of the three separate exercise trials at 30, 60, and 90 rpm at a work rate of 720 kpm/min. (n=8)

37
Comparison of Respiratory Function
Figures 6 and 7 show the relationship of ventilation and respiratory rate
for the three pedal rates. Figure 6 shows the means for ventilation (Umin) at 30,
60, and 90 rpm to be 42.15, 38.08, and 44.19, respectively.
Ve
Figure 6.
52..--~~--~~~~~~--~~~~~~---~~ .....
50
48
46
44
42
40
38
36
34....._~~--~~~~~~--~~~~~~....-~~--
30 rpm
L/min
60 rpm
Revolutions\minute
* p<0.05 for 60 rpm compared to 90 rpm
90 rpm
Minute ventilatory volume (Umin) compared between each of the three separate exercise trials at 30, 60, and 90 rpm at a work rate of 720 kpm/min. (n=8)

RR
Figure 7.
30 rpm
Breaths\mi n 60 rpm
Revolutions\minute
90 rpm
* p<0.05 for 60 rpm versus 90 rpm, p<0.05 for 30 rpm versus 90 rpm
Respiratory rate compared between each of the three separate exercise trials at 30, 60, and 90 rpm at a work rate of 720 kpm/min.
38
Figure 7 shows the means for respiratory rate (breaths/min) to be 25.19, 23.59,
and 25.44 for 30, 60, and 90 rpm, respectively. Standard deviation is shown by
the bars on the figure.

39
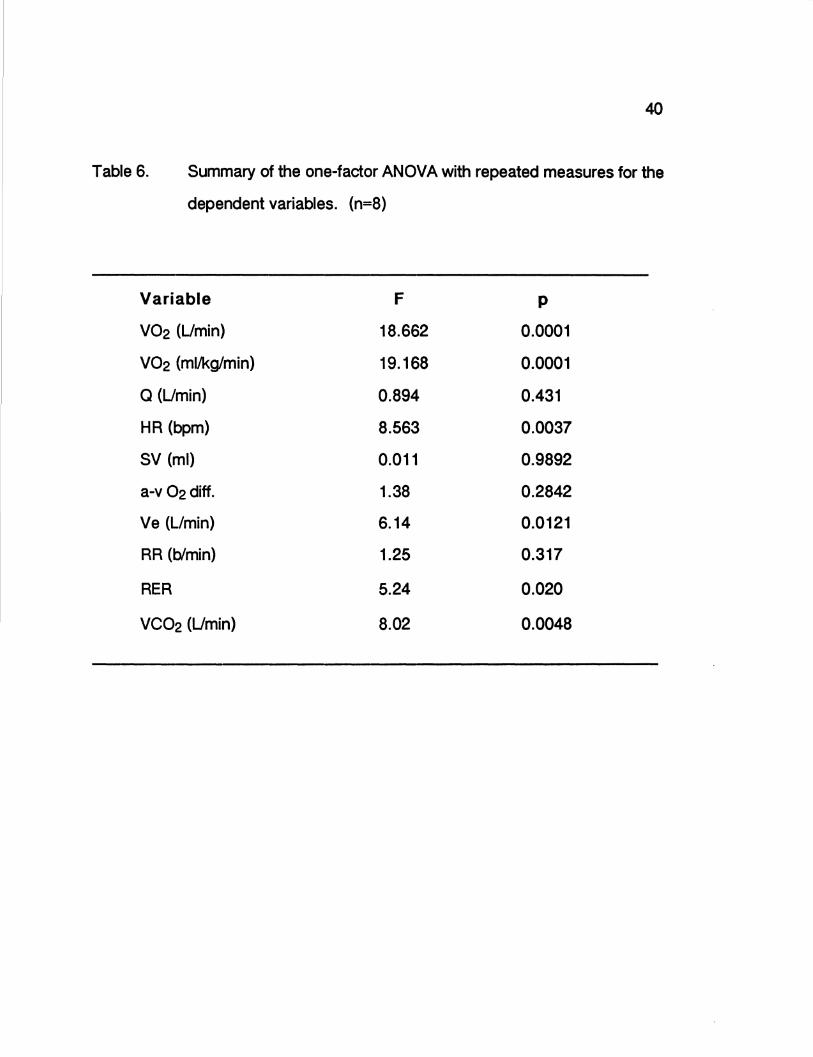
Statistical Analysis of Differences Between Groups
A one-way analysis of variance with repeated measures was used to
determine differences between groups for the dependent variables. A post-hoc
Scheffe F-test was used to determine significance at the 95% level. Table 6
shows the dependent variables along with the appropriate F-test and p value.
The level of significance was set at a 95% confidence interval so any p value
less than(<) .05 will show significance. Table 7 shows the results of the
Scheffe post-hoc analysis for significance, if any, between each of the three
groups.
40
Table 6. Summary of the one-factor ANOVA with repeated measures for the
dependent variables. (n=8)
Variable F p
V02 (Umin) 18.662 0.0001
V02 (ml/kg/min) 19.168 0.0001
Q (Umin) 0.894 0.431
HR (bpm) 8.563 0.0037
SV (ml) 0.011 0.9892
a-v 02 diff. 1.38 0.2842
Ve (L/min) 6.14 0.0121
RR (blmin) 1.25 0.317
RER 5.24 0.020
VC02 (Umin) 8.02 0.0048
41
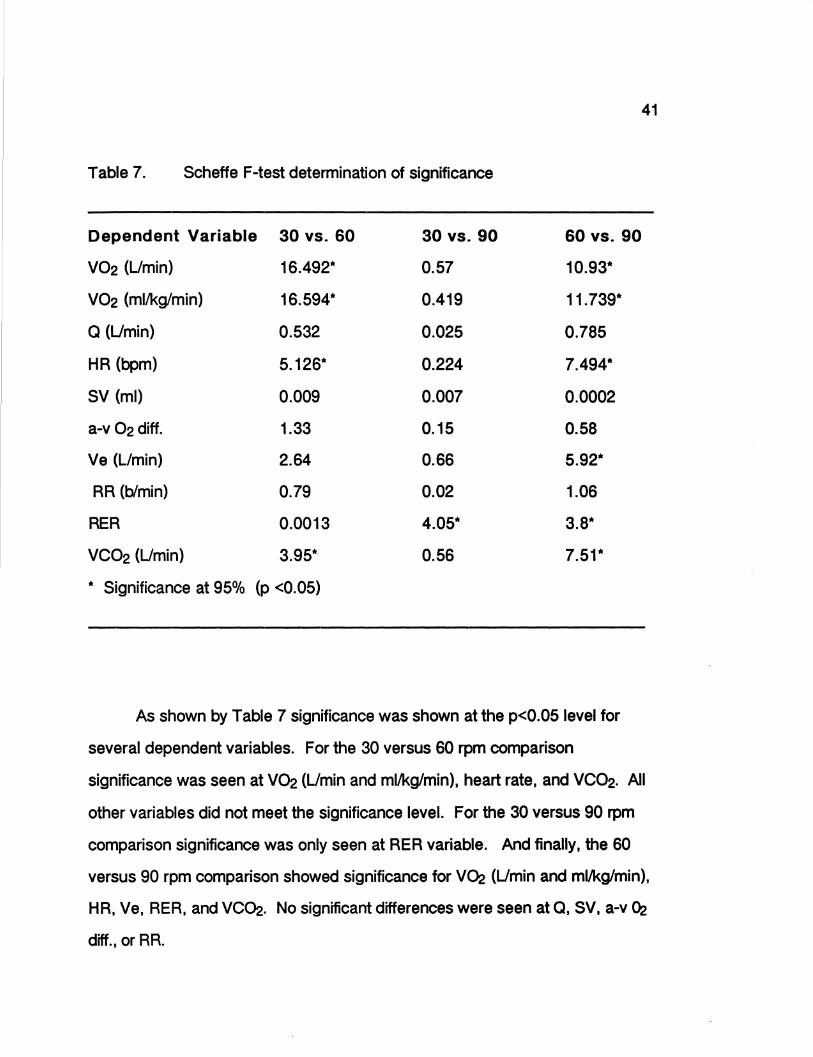
Table 7. Scheffe F-test determination of significance
Dependent Variable 30 vs. 60 30 vs. 90 60 vs. 90
V02 (Umin) 16.492* 0.57 10.93*
V02 (ml/kg/min) 16.594* 0.419 11.739*
Q (Umin) 0.532 0.025 0.785
HR (bpm) 5.126* 0.224 7.494*
SV (ml) 0.009 0.007 0.0002
a-v 02 diff. 1.33 0.15 0.58
Ve (L/min) 2.64 0.66 5.92*
RR (b/min) 0.79 0.02 1.06
RER 0.0013 4.05* 3.8*
VC02 (L/min) 3.95* 0.56 7.51*
* Significance at 95% (p <0.05)
As shown by Table 7 significance was shown at the p<0.05 level for
several dependent variables. For the 30 versus 60 rpm comparison
significance was seen at V02 (L/min and ml/kg/min), heart rate, and VC02. All
other variables did not meet the significance level. For the 30 versus 90 rpm
comparison significance was only seen at RER variable. And finally, the 60
versus 90 rpm comparison showed significance for V02 (Umin and ml/kg/min),
HR, Ve, RER, and VC02. No significant differences were seen at a. SV, a-v ~
diff., or RR.

CHAPTER V
DISCUSSION. CONCLUSIONS. AND RECOMMENDATIONS
Discussion
The present study examined whether any differences would occur in
oxygen consumption at three separate pedaling rates (30, 60 90 rpm)
performed at a submaximal workload of 720 kpm/min. Also, this study
examined whether there was a difference in the central or peripheral limitations
of oxygen uptake due to the different pedal rates. Results from this study
indicate that 60 rpm is the most oxygen efficient pedaling rate and there is little
difference between the 30 rpm and 90 rpm pedal rates . These findings support
some previous studies (Hermansen, et al. 1969; Bolonchuk, et al. 1992;
Pivarnik, et al. 1988; Boning, et al. 1984; Hughes, et al. 1982) but contradicts
others (McKay, et al. 1976; Hagberg, et al. 1981; Buchanan, et al., 1985;
Pandolf & Noble, 1973). Due to study design differences, opinions about the
most efficient pedal rates is debated. Some studies are compared although
there are various fitness levels and cycling experience of the subjects. Studies
have shown there were differences in V02 when comparing trained versus
untrained individuals at different pedal rates. This study, however, tried to
minimize this possibility of error by recruiting trained subjects . Other theories
suggest that as submaximal levels increase towards maximal levels that the
differences in oxygen consumption become less to a point of no significance
(Boning, et al., 1985). Because competitive cyclists train and race at

submaximal levels a resistance setting of 720 kpm/min ( 120 W) was decided
upon.
43
The oxygen uptake for the 60 rpm stage (x = 1.83 Umin) is significantly
lower (p<0.05) than both the 30 rpm stage (x = 2.03 Umin) and the 90 rpm stage
(x = 1.99 Umin). Differing results came from Buchanan, et al. (1985) who found
no difference between 60 and 90 rpm at submaximal values from 0 kpm/min to
1300 kpm/min. Similar to Buchanan, et al. (1985), Pandolf and Noble (1973)
noted no differences in V02 at power outputs of 550, 775, and 1075 kpm/min
when 40, 60, and 80 rpm were compared. However, Hughes, et al. (1982),
presented data that is similar to the results of this study. They found that VD2
values at 90 rpm were significantly greater than V02 values at 50 rpm at work
rates from 300 kpm/min to 2100 kpm/min. Hughes, et al. (1982), suggested that
pedaling at a faster rate causes the body to use more muscles to move the legs
more rapidly and extra abdominal muscles to stabilize the trunk. In effect, the
more muscles recruited increases the caloric cost and therefore results in an
elevation of V02 at a given work load. Buchanan, et al. (1985), disagrees with
this idea because no differences in their study were found between 60 and 90
rpm. However, the data presented in this study supports Hughes' suggestion.
If the theory of Hughes, et al. ( 1982), is accurate the difference in VD2
between 60 and 90 rpm is explained, but, the difference in V02 between 30 and
60 rpm is not. Bolonchuk, et al. (1992), examined the difference between 25,
50, and 75 rpm at 50% of peak power (731 kpm/min ±149 kpm/min). The
authors noted that although work and power were held constant for all three
exercise bouts HR, mean V02, VC02, and V02/kg were significantly greater

44
(p<0.05) for 25 rpm compared to 50 and 75 rpm. The anaerobic component
was greater for 25 rpm (8%) than 50 rpm (4%) and 75 rpm (5%), also. The
authors suggest the 25 rpm stage utilizes a greater dependence on anaerobic
metabolism than the 50 and 75 rpm stages even though the anaerobic
components were not significantly different because the trend is consistent with
the increased V02 and C02. The data in this study follows the same pattern as
the data from Bolonchuk, et al., (1992). Along with the values of V02 being
significant for the three different stages, HR was also significantly different.
Bolonchuk, et al., found that HR at 50 rpm was significantly lower than those at
25 and 75 rpm. In this study HR values were significantly different (p<0.05) 30
rpm (125.6 bpm), 60 rpm (120.4 bpm), and 90 rpm (126.7 bpm). The factthat
HR is linearly related to VOi. is shown in both of the studies.
As discussed earlier V02 is controlled by central (cardiac output) and
peripheral (a-v Oi. diff.) factors. According to Pirnay, et al., (1972) ·vo2 in the
muscles during general exercise seems to be limited by the carrying power of
the circulatory system, ... whether this limitation is cardiac or peripheral remains
to be investigated: Astrand (1952) and Taylor, Buskirk, and Henschel (1955)
supported the idea that the muscles become unable to accept a supplementary
blood flow. Opposing views come from Stenberg, Astrand, Ekblom, Royce, and
Saltin ( 1967) who found while studying exercises carried out by different
muscular groups, concluded that the cardiac output was the limiting factor. This
study indirectly measured cardiac output by carbon dioxide rebreathing and
calculated stroke volume and a-v 02 difference. Significant differences
between groups were found for V02 and HR but no differences were found for
Q, SV, or a-v 02 difference. The data by Stenberg, et al., (1967) found that

45
there was no leveling off of the peripheral factors that limit V02 in any of there
subjects. Therefore, it was their estimation that the limitation of V02 by
peripheral factors was hardly probable.
The V02 versus a relationship was studied by Faulkner, et al., (1977).
The authors reported that the V02-0 relationship is not significantly different
from linear. This is supported by Ekblom and Hermansen (1968). Faulkner, et
al., (1977) had their subjects at pedal rate of 50 rpm and plotted the change of a compared to the rise in V02. The data of the present study show different V02
for different pedal rates without significant change of a. But, in this study there
is a trend for a to follow the changes of V02 with a change in HR and not in SV.
The results from this study show a trend that the linear relationship of V02 and
a is the result of the change in HR not in SV.
The change in V02 between 30 and 60 rpm seems to be due to the fact
that the length of time the legs are needed to contract increases the amount of
anaerobic work. The change in V~ between 60 and 90 rpm seems to be due
to the fact that at the higher pedal rate more muscles are needed to stabilize the
trunk, thus using more caloric output. For all three of the pedal rates V02 seems
to be centrally controlled by HR (and Q) with no change in SV and not by
peripheral factors (a-v 02 diff.).

46
Summary
Eight male competitive cyclists were examined during steady state
submaximal exercise on a cycle ergometer at three separate pedal rates. Each
subject pedaled at frequencies of 30, 60, and 90 rpm at a resistance of 720
kpm/min. Variables measured included V02 (Umin and ml/kg/min), Q, HR, SV,
a-v 02 diff., VC02, RR, RER, and Ve. Previous research reports differing
findings regarding which pedal rate is the most efficient in terms of V02. The
purpose of this study was to examine the differences of V02 for competitive
cyclists at submaximal exercise for differing rpm. Second, it was to determine if
there were any central or peripheral limitations of V02 at submaximal exercise.
Descriptive statistics and one way analysis of variance with repeated measures
were used to analyze the data. Results showed that V02 and HR for 60 rpm
was significantly different (p<0.05) than those for 30 and 90 rpm. Significance
(p<0.05) was also seen for Ve, RER, and VC02 for 60 versus 90 rpm, and RER
and VC02 for 30 versus 90 rpm. The results indicate that the most efficient
pedaling rate at 720 kpm/min for competitive cyclists (Category 3) to be 60 rpm
when compared to 30 and 90 rpm. The differences in V02 seem to be as a
result of the longer period of time that the muscles stay contracted in the 30 rpm
bout and the acquisition of more muscles to stabilize the trunk for the 90 rpm
bout.

47
Conclusions
The findings of the study do not support the first null hypothesis that there
is no difference in the V02 among three pedal rates at a steady state
submaximal work rate of 720 kprn/min. Competitive cyclists will use less energy
and thus have more endurance if 60 rpm is used rather than the popular rate of
90-100 rpm.
The findings of the study do support the second null hypothesis that there
is no difference in the central or peripheral limiting factors of V~. Even though
the V~ changed between the groups the cause of the change is directly related
to the HR. Since all three groups changed because of the same variable there
were no differences in the central or peripheral limiting factors of V02.
Recommendations
1. For studies similar to this V02max is recommended to show the percentage
of peak effort the cyclists were exercising. The closer the percentage is to
actual racing conditions the more meaningful the results will be.
2. Studies need to show at what percent of V~max cyclists compete for
different races and then develop a protocol around those results. Cyclists have
various types of races ranging from sprints to long endurance trials and the
proper pedaling rate may be different for each of these races.

48
3. As with other sports competitive cyclists have varying degrees of fitness.
Studies should be done to show if there are any efficiency differences when
differing levels of competitive cyclists are used. The proper pedaling rate could
be different for amateur versus professional cyclists.
4. Borg's Rating of Perceived Exertion should be used to determine how hard
the subjects feel they are working at various work rates. It is possible that VOi,
is lower at a submaximal level for a certain pedal rate but the cyclists perceives
to be working harder.
5. A larger sample size is needed to make the results of cycling studies
stronger. In order for a detailed examination of the proper pedal rate to be
addressed a large population is needed to verify the results.
6. Studies need to done showing how much of the total energy expenditure
during cycling is a direct result of pedal rate. Most studies that have researched
pedal rate have data resulting from clinical testing within a laboratory and not
where training and races take place. The cyclists need to be tested in their
environment when other factors are introduced, such as wind resistance.
49
References
Astrand, P. 0. Experimental studies of physical working capacity in relation to sex and age. Copenhagen: Munksgaard, 1952.
Astrand, P. 0., & K. Rodahl. Textbook of work physiology. Physiological bases of exercise. (3rd ed.). Singapore: McGraw-Hill, 1986.
Auchincloss, J. H., R. Gilbert, R. Morales, & D. Peppi. The effect of progressive exercise on the equilibrium rebreathing cardiac output method. Medicine and Science in Sports and Exercise. 23(9):1111-1115, 1991.
Barcroft, S. B., & J. L. E. Millen. Blood flow through muscle during sustained contraction. Journal Physiology London. 97: 17-31, 1930.
Bolonchuk, W.W., H. C. Lukaski, & W. A. Siders. Physiologic responses to different pedaling rates at constant power output on a cycle ergometer. Research Quarterly for Exercise and Sport. March 1992 Supplement.
Boning, D., Y. Gonen, & N. Maassen. Relationship between work load, pedal frequency, and physical fitness. International Journal of Sports Medicine. 5:92-97, 1984.
Borg, G. Physical performance and perceived exertion. Lund, Sweden: Gleerup, 1962.
Buchanan, M., & A. Weitman. Effects of pedal frequency on V02 and work output at lactate threshold (LT), fixed blood lactate concentrations of 2 mM and 4 mM, and max in competitive cyclists. International Journal of Sports Medicine. 6: 163-168, 1985.
Carnevale, T. J., & G. A. Gaesser. Effects of pedaling speed on the powerduration relationship for high-intensity exercise. Medicine and Science in Sports and Exercise. 23(2):242-246, 1991.
Clausen, J.P., Effects of physical conditioning. A hypothesis concerning circulatory adjustment to exercise. Scandinavian Journal of Clinical and Laboratory Investigation. 24:305-313, 1969.
Coast, J. R., R.H. Cox & H. G. Welch. Optimal pedaling rate in prolonged bouts of cycle ergometry. Medicine and Science in Sports and Exercise. 18:225-230, 1986.

50
Coast, J. R., & H. G. Welch. Linear increase in optimal pedal rate with increased power output in cycle ergometry. European Journal of Ap,plied Physiology. 53:339-342, 1985.
Collier, C. R. Determination of mixed venous C02 tensions by rebreathing. Journal of Applied Physiology. 9:25-29, 1950.
De Cort, S. C., J. A. Innes, T. J. Barstow, & A. Guz. Cardiac output, oxygen consumption and arteriovenous oxygen difference following a sudden rise in exercise level in humans. Journal of Physiology. 441:501-512, 1991.
DeFares, J. G. Determination of mexed venous C02 tensions from the exponential C02 rise during rebreathing. Journal of Ap,plied Physiology. 13:159-169.
Ekblom, B., & L. Hermansen. Cardiac output in athletes. Journal of Applied Physiology. 25:619-625, 1968.
Emmett, J., J. McClung, & D. lmmke. unpublished data, Eastern Illinois University, 1992.
Faulkner, J. A., G. F. Heigenhauser, & M.A. Schork. The cardiac outputoxygen uptake relationship of men during graded bicyde ergometry. Medicine and Science in Sports. 9(3):148-154, 1977.
Ferguson, R. J., J. A. Faulkner, S. Julius, & J. Conway. Comparison of cardiac output determined by C02 rebreathing and dye-dilution methods. Journal of Ap,plied Physiology. 25:450-454, 1968.
Gaesser, G. A., & G. A. Brooks. Muscular efficiency during steady-rate exercise: effects of speed and word rate. Journal of Applied Physiology. 38(6):1132-1139, 1975.
Hagberg, J.M., J. P. Mullin, M. Bahrke, & J. Limburg. Physiological profiles and selected psychological characteristics of national dass American cyclists. International Journal of Medicine and Physical Fitness. 19:341-346, 1979.
Hagberg, J. M., J. P. Mullin, M. D. Giese, & E. Spitznagel. Effect of pedaling rate on submaximal exercise responses of competitive cydists. Journal of Ap,plied Physiology. 51(2):447-451, 1981.
Hermansen, L., & B. Saltin. Oxygen uptake during maximal treadmill and bicycle exercise. Journal of Applied Physiology. 26:31-37, 1969.

Holmgren, A., & L. G. Ekelund. Central hemodynamics during exercise. Circulation Research Supplement. 24 and 25: 1-33-43, 1967.
Hughes, E. F., S. C. Turner, G. A. Brooks. Effects of glycogen depletion and pedaling speed on ·anaerobic threshold·. Journal of Applied Physiology. 52: 1598-1607 I 1982.
51
Jones, J. L., N. McCartney, T. Graham, L. L. Spriet, J.M. Kowalchuk, G. J. F. Heigenhauser, & J. R. Sutton. Muscle performance and metabolism in maximal isokinetic cycling at slow and fast speeds. Journal of Applied Physiology. 59(1 ):132-136, 1985.
Jones, N. J., D. G. Robertson, & J. W. Kane. Difference between end-tidal and arterial PC02 in exercise. Journal of Physiology. 47:954-960, 1979.
Knowlton, R. G., & G. E. Adams. The consistency of carbon dioxide rebreathing as a non-invasive method to determine exercise cardiac output. Ergonomics. 17(2):241-248, 1974.
Lollgen, H., T. Graham, & G. Sjogaard. Muscle metabolites, force, and perceived exertion bicycling at varying pedal rates. Medicine and Science in Sports and Exercise. 12:345-351, 1980.
McArdle, W. D., F. I. Katch, & V. L. Katch. Exercise Physiology: energy, nutrition, and human performance. (2nd ed.). Philadelphia: Lea & Febiger. 1986.
McCay, G. A., & E. W. Banister. A comparison of maximal oxygen uptake determination by bicycle ergometry at various pedaling frequencies and by treadmill running at various speeds. European Journal of Applied Physiology. 35:191-200, 1976.
Muiesan, G. C., A. Sorbini, E. Solinas, V. Grassi, G. Casucci, & E. Petz. Comparison of carbon dioxide rebreathing and direct Fick methods for determining cardiac output. Journal of Applied Physiology. 24:424-429, 1968.
Pandolf, K. B., & B. J. Noble. The effect of pedaling speed and resistance change on perceived exertion for equivalent power outputs on the bicycle ergometer. Medicine and Science in Sports and Exercise. 17:132-136, 1973.
Pirnay, F ., R. Marechal, R. Radermecker, & J. M. Petit. Muscle blood flow during submaximum and maximum exercise on a bicycle ergometer. Journal of Applied Physiology. 32(2):210-212, 1972.

Pivamik, J.M., S. J. Montain, J.E. Graves, & M. L. Pollock. Effects of pedal speed during incremental cycle ergometer exercise. Research Quarterly for Exercise and Sport. 59(1):73-77, 1988.
Pugh, L. G. C. E. The relation of oxygen intake and speed in competition cycling and comparative observation on the bicycle ergometer. Journal of Physiology. 241:795-808, 1974.
Seabury, J. J., W. C. Adams, & M. R. Ramey. Influence of pedaling rate and power output on energy expenditure during bicycle ergometry. Ergonomics. 20:491-498, 1977.
Stenberg, J., P. 0. Astrand, B. Ekblom, J. Royce, & B. Saltin. Hemodynamic response to work with different muscle groups, sitting and supine. Journal of Applied Physiology. 22:61-70, 1967.
52
Sutton, J. R. V02max - new concepts on an old theme. Medicine and Science in Sport and Exercise. 24(1):26-29, 1992.
Takano, N. Effects of pedal rate on respiratory responses to incremental bicycle work. Journal of Physiology. 396:389-397, 1988.
Taylor, H. L., E. Buskirk, & A. Henschel. Maximal oxygen uptake as an objective measure of cardiorespiratory performance. Journal of Applied Physiology. 8:73-80, 1955.
Wagner, P. D. Central and Peripheral aspects of oxygen transport and adaptations with exercise. Sports Medicine. 11(3):133-142, 1991.