PROGNOSTIC SIGNIFICANCE OF CARDIAC BIOMARKERS IN PATIENTS WITH ACUTE PULMONARY THROMBOEMBOLISM
Sanz González, Íñigo (2018) Cardiac biomarkers, acute phase proteins and
survival in small animals. MVM(R) thesis.
https://theses.gla.ac.uk/30704/
Copyright and moral rights for this work are retained by the author
A copy can be downloaded for personal non-commercial research or study,
without prior permission or charge
This work cannot be reproduced or quoted extensively from without first
obtaining permission in writing from the author
The content must not be changed in any way or sold commercially in any
format or medium without the formal permission of the author
When referring to this work, full bibliographic details including the author,
title, awarding institution and date of the thesis must be given
Enlighten: Theses
https://theses.gla.ac.uk/

Cardiac Biomarkers, Acute
Phase Proteins and Survival in
Small Animals.
Dr. Íñigo Sanz González LdoVet MRCVS
Thesis submitted in fulfillment of the requirements for the
degree of Master of Veterinary Medicine (MVM)
College of Medical, Veterinary & Life Sciences
University of Glasgow, United Kingdom
June 2018


i
I. ACKNOWLEDGEMENTS:
I am so grateful to many individuals who participated in the making of this
thesis, for believing in this project and making it happen. I would like to thank
you all for your patience, belief, love and support.
Special thanks to Dr. Anne French without whom this entire adventure would
not be possible. Thank you for believing in me and giving me the chance to
investigate about something we both love, Veterinary Cardiology. Thank you
for being such an incredible support and looking after me when I did not know
anyone or anything. I really admire your dedication, your passion and your
commitment to this profession.
Big thanks to Dr. Paul Wotton for always being an example of professionalism
and good manners. Thank you for your great ideas, encouragement and
involvement.
To Dr. Jorge Prieto-Ramos for being an exceptional resident, the worst of the
critics and my best friend along the hard way.
To Dr. Tim Parkin, for helping me with the Statistics and for explaining
everything patiently before, during and after the analysis. Thank you for being
there whenever I needed you, weekdays, weekends and even when I panicked
few hours before an oral presentation.
Dearest thanks to my family (my mother, my father and my sister) for
supporting me for so long and their total belief in my dreams. Thank you for
making me feel that anything is possible if you put your heart and soul into it,
being my umbrella against the sticks and stones and loving me unconditionally.
Lastly, an enormous thank you to David Eckersall and Eilidh McCulloch (Acute
Phase Protein Laboratory, Glasgow University), Abigail Brown, all the clinicians
and nurses from the Small Animal Hospital of Glasgow University, Anne Porritt
and everyone from Idexx Laboratories who supported this project. Thank you
all for your time, energy and dedication.
ii
II. ABSTRACT:
Blood-based biomarkers are commonly used in veterinary patients; however,
cardiac blood testing is a relatively new concept in Small Animal Medicine and
the correct use of these circulating substances remains uncertain. This Masters
project includes two retrospective studies investigating the association
between cardiac troponin I (cTnI) and survival in dogs and cats with cardiac
disease and one prospective study exploring the relationship between cTnI, B-
type prohormone natriuretic peptide (NT-proBNP) and acute phase proteins
(APP) in cats with cardiac and non-cardiac diseases.
The first retrospective study included 94 dogs with cardiac diseases. Higher cTnI
concentrations were associated with shorter median survival times. Dogs with
cardiac disease and cTnI concentrations above the reference range
(>0.16ng/ml) had a median survival time of 29 months whereas dogs with cTnI
concentrations within the reference range (<0.16ng/ml) had a median survival
time of 44 months. However, there was a significant overlap of cTnI
concentrations between survivors and non-survivors. The contribution of
arrhythmias to cTnI release remains uncertain as some dogs with severe
arrhythmias and high cTnI values survived long periods.
The second retrospective study included 51 cats with cardiac disease, 9 with
hyperthyroidism and 8 with systemic diseases. Increased cTnI concentrations
were associated with shorter median survival time in cats with cardiac disease.
Cats with cTnI concentrations above 5ng/ml survived a median of 1 month
whereas cats with cTnI concentrations between 0.5-5ng/ml survived a median
of 15 months.
Finally, in a prospective study, two cardiac biomarkers (cTnI and NTproBNP) and
four APP (Serum Amyloid A, SAA; Haptoglobin, Hp; C-reactive protein, CRP; α₁-
acid glycoprotein, AGP) were measured in 99 cats with cardiac and non-cardiac
diseases. Signficantly higher concentrations of hscTnI, NT-proBNP and AGP were
found in cats in congestive heart failure (CHF). Concentrations of cardiac
biomarkers were commonly increased in cats with non-cardiac diseases. Some
of these animals were non-anaemic, non-azotaemic and had normal
echocardiographic examinations. No associations were found between cardiac
and inflammatory markers.

iii
III. LIST OF CONTENTS
I. Acknowledgements i
II. Abstract ii
III. List of contents iii
IV. List of figures v
V. List of tables vii
VI. List of abbreviations viii
VII. Conflict of interest and originality declaration xi
1. Introduction to Cardiac and Inflammation markers 1
1.1 Cardiac Biomarkers. 2
1.1.1 History of cardiac biomarkers 2
1.1.2 Biochemical background 4
1.2 Troponin in Small Animals.
1.2.1 Troponin in Canine Medicine 11
1.2.1.1 Cardiac disease 11
1.2.1.2 Non-cardiac causes 18
1.2.2 Troponin in Feline Medicine 28
1.2.2.1 Cardiac disease 28
1.2.2.2 Non-cardiac disease 30
1.3 Inflammation and cardiac disease in cats. 34
1.3.1 SAA 37
1.3.2 AGP 42
1.3.3 Hp 45
1.3.4 CRP 46
1.3.5 Inflammation in feline CM 48
1.3.6 Inflammation in human HCM 49
2. Retrospective study in dogs 51
2.1 Aims and objectives 51
2.2 Material and methods 51
2.3 Results 53
2.4 Discussion 64
3. Retrospective study in cats 69
3.1 Aims and objectives 70

iv
3.2 Material and methods 70
3.3 Results 72
3.4 Discussion 79
4. Prospective study in cats 85
4.1 Aims and objectives 86
4.2 Methods 86
4.3 Results 92
4.4 Discussion 101
5. Final discussion and conclusions. 109
6. References 112

v
IV. LIST OF FIGURES
Figure 1.1. Structure of the muscle. 5
Figure 1.2. Calcium regulation of muscle contraction. 8
Figure 1.3. Mechanisms of release of troponin in transient
or permanent ischaemia. 9
Figure 1.4. Non-cardiac causes of increased cTnI in the dog. 27
Figure 1.5. Non-cardiac causes of increased cTnI in the cat. 33
Figure 1.6. Major and minor positive APP in domestic animal
species. 37
Figure 2.1. Boxplot of cTnI concentrations in dogs with and
without CHF. 56
Figure 2.2. Boxplot of cTnI concentrations in dogs with and
without arrhythmias. 57
Figure 2.3 Boxplot of cTnI concentrations in dogs with mild,
moderate and severe arrhythmias. 58
Figure 2.4. Boxplot of cTnI concentrations in survivors and
non-survivors. 59
Figure 2.5. Kaplan Meier curve (A) and ROC curve (B) for cTnI
and survival in dogs with cardiac disease 60
Figure 3.1. Dotplot of cTnI concentrations in cats with cardiac
disease 74
Figure 3.2. Boxplot of cTnI concentrations in cats with (+) and
without (-) CHF. 75
Figure 3.3. Boxplot of cTnI concentrations in cats with cardiac,
hyperthyroid and systemic diseases 76
Figure 3.4. Boxplot of cTnI concentrations in survivors and
non-survivors cats with cardiac disease. 77
Figure 3.5. Kaplan-Meier curve for survival analysis in cats
with cardiac disease. 78
Figure 3.6. ROC curves for cTnI and survival in cats with cardiac
disease. 79
Figure 4.1. Transport and aliquoting serum samples. 88
vi
Figure 4.2. Immuno-diffusion test for AGP determination. 90
Figure 4.3. Double antibody sandwich ELISA test for CRP
determination. 90
Figure 4.4. Boxplots illustrating hscTnI, NT-proBNP and AGP
concentrations in cats with cardiac disease. 95
Figure 4.5. ROC curves for NT-proBNP, hscTnI and AGP as
predictors of CHF in cats with cardiac disease. 96
Figure 4.6. Boxplot of hscTnI (A) and NTproBNP (B) concentrations
in the 4 study groups: cardiac, systemic, hyperthyroid
and comorbidities 100
Figure 4.7. Boxplot of AGP(C) and CRP (D) concentrations in the
4 study groups: cardiac, systemic, hyperthyroid and
comorbidities. 100

vii
V. LIST OF TABLES
Table 1.1. Acute phase proteins in feline medicine 36
Table 2.1. Tachyarrhythmias in dogs with cardiac disease. 54
Table 2.2. Bradyarrhythmias in dogs with cardiac disease. 54
Table 2.3. Arrhythmia Score System. 55
Table 2.4. Dogs with cardiac disease, increased cTnI and
prolonged survival. 62
Table 2.5. Unpublished data compiling clinical information
from dogs with non-cardiac diseases and cTnI
concentrations higher than 1ng/ml. 63
Table 4.1. Methods of analysis of cardiac and inflammatory
biomarkers used in this study. 92
Table 4.2. Panel of cardiac and inflammatory biomarkers in
the study population. 93
table 4.3. Panel of cardiac and inflammatory biomarkers in
4 groups of disease: cardiac, systemic,
hyperthyroidism (T4) and comorbidities. 97

viii
VI. LIST OF ABBREVIATIONS:
AGP α₁-acid glycoprotein
AICM Anthracycline induced cardiomyopathy
AID Anaemia secondary to inflammatory disease
APP Acute phase proteins
APR Acute phase response
AMI Acute myocardial infarction
ANP Atrial natriuretic peptide
AST Aspartate amino-transferase
ARVC Arrhythmogenic right ventricular cardiomyopathy
ATE Arterial thromboembolism
AUC Area under the curve
BCT Blunt chest trauma
BNP Brain natriuretic peptide
CHF Congestive heart failure
CK Creatine Kinase
CM Cardiomyopathy
CMhm Candidatus Mycoplasma haemominutum
cMRI Cardiac magnetic resonance
cTnI Cardiac Troponin I/ Cardiac isoform of Troponin I
cTnT Cardiac Troponin T
CRF Corticotropin releasing factor
CRP C-reactive protein
DCM Dilated Cardiomyopathy
DIC Disseminated intravascular coagulation
ECG Electrocardiogram
Echo Echocardiography
ECM Endomyocarditis
ES-HCM End-stage hypertrophic cardiomyopathy
FCoV Feline Coronavirus
FECV Feline enteric coronavirus
FIP Feline infectious peritonitis

ix
FIPV Feline infectious peritonitis virus
GDV Gastric dilatation-volvulus
Hb Haemoglobin
Hp Haptoglobin
HCM Hypertrophic cardiomyopathy
HOCM Hypertrophic obstructive cardiomyopathy
HSA Haemangiosarcoma
HscTnI High sensitivity cardiac troponin I
ICU Intensive care unit
IMHA Immune-mediated haemolytic anaemia
IPE Idiopathic pericardial effusion
JDCM Juvenile dilated cardiomyopathy
LD Lactate dehydrogenase
LGE Late gadolinium enhancement
LVEDDN Left ventricular end-diastolic diameter
LVPWd Left ventricular posterior wall in diastole
Mhf Mycoplasma haemofelis
MVD Mitral valve disease
NT-proBNP B-type prohormone natriuretic peptide
PE Pericardial effusion
PSVT Paroxysmal supraventricular tachycardia
PWD Portuguese water dog
RCM Restrictive cardiomyopathy
RIA Radioimmunoassay
ROC Receiver operator characteristic curve
SAA Serum Amyloid A
SAS Subaortic stenosis
SGOT Serum glutamic oxaloacetic transaminase
SIRS Systemic inflammatory response syndrome
SPVC Supraventricular premature complex
TnI Troponin I
TnT Troponin T
TnC Troponin C

x
UCM Unclassified cardiomyopathy
VHS Vertebral heart score
VPC Ventricular premature complex
IVSd Interventricular septum in diastole
WBC White blood cell count
WHO World Health Organization
xi
CONFLICT OF INTEREST DECLARATION
This study was partially funded by IDEXX Laboratories and ReactivLab Ltd. These
sponsors participated in the analysis of the data but did not take part in the
study design, sample collection, interpretation or statistical analysis.
ORIGINALITY DECLARATION
The work in this thesis was performed solely by the author except where the
assistance of others has been acknowledged.

1
CHAPTER 1:
Introduction to Cardiac and Inflammation
markers

2
1.INTRODUCTION
1.1 CARDIAC BIOMARKERS
Time to treatment plays a critical role in human patients with ischaemic coronary
heart disease. Morbidity and mortality rates decrease significantly in those patients
undergoing early intervention [Moscucci and Eagle, 2006]. In consequence,
scientists have been looking for a reliable and sensitive blood marker that could give
an early indicator of patients suffering from acute myocardial infarction (AMI).
The National Cancer Institute defines a “biomarker” as a biological molecule found
in blood, body fluids or tissues that is a sign of a normal or abnormal process, or of
a condition or disease. The Biomarkers Definitions Working Group stated in 2001 that
a biological marker is a “characteristic that is objectively measured and evaluated
as an indicator of normal biological processes, pathogenic processes or
pharmacologic responses to a therapeutic intervention” [Atkinson et al, 2001].
1.1.1 HISTORY
When cardiomyocytes die the proteins inside the cells are released. Because the
major function of the heart is pumping, the proteins involved in contraction and
producing the energy to support it have been traditionally tested as candidates for
cardiac biomarkers [Ladenson, 2007].
The first cardiac biomarker used was serum glutamic oxaloacetic transaminase
(SGOT), now called aspartate amino-transferase (AST). Increased concentrations of
SGOT after AMI were reported in 1954 for the first time [Karmen et al. 1955]. It
was the starting point for assaying substances discharged from necrotized
myocardium into blood.
As SGOT became more widely used, increased concentrations in patients with liver
damage, and thus the lack of specificity, were appreciated. Today, it is known that
AST is not cardiac specific as it is found in liver, skeletal muscle, red blood cells and
many other tissues [Dolci and Panteghini, 2006].
In the 1960s, creatine kinase (CK) and lactate dehydrogenase (LD) and its isoenzymes
were demonstrated to be possible markers of cardiac damage [Wróblewski et al.
1956; Wróblewski et al. 1960]. LD was found in nearly all human tissues but CK
gave the cardiologist the opportunity to make a diagnosis of AMI within 24 hours of
3
admission. Rapid appearance, marked increase in the serum concentration after AMI
and higher specificity when compared with AST and LD made CK the “first cardiac
biomarker”. However, CK was not fully specific and it was proven that CK was
present in greater concentrations in skeletal muscle than in myocardium in the
human body [Jaffe et al.1984, Brancaccio et al.2007].
Electrophoretic methods for separation of CK and LD isoenzymes were first described
in 1972 [Roe et al. 1972]. The clinical value of CK isoenzymes stems from the fact
that skeletal and myocardial muscle have different isoenzyme distribution. CK-MM
is present in both but only trace levels of CK-MB are present in the skeletal muscle
and a higher percentage in the myocardium [Wu, 2002]. CK-MB isoenzyme showed
the highest diagnostic accuracy for AMI. The discovery of the relatively higher
concentration of CK-MB in the myocardium (22% in myocardium, 1-3% in the skeletal
muscle) made it the most important biomarker of cardiac injury in the 1980s [Dolci
and Panteghini, 2006].
New immunoinhibition assays for CK-MB were soon developed. The availability of a
rapid and automated assay for CK-MB determination made this test popular and
widely adopted for several years. In 1979, the World Health Organization (WHO)
included cardiac biomarkers in the triad of diagnostic tools for AMI [World Health
Organization, 1979]. However, the results were far from satisfactory. The major
problem was the high rate of false positive results. CK-MB was increased in 20% of
patients following general surgery interventions in the absence of myocardial
damage [Adams et al. 1993]. In the 1980s scientists started to measure the protein
concentration instead of catalytic activity using antibody-assisted techniques.
Radioimmunoassays (RIA) and sandwich assays were developed, but even if measured
immunochemically as protein, CK-MB was not totally cardiac specific and did not
differentiate the origin of the damage [Chan et al. 1985; Wu et al. 1985]. This
prompted investigators to turn their attention to other cardiac proteins and the
troponin era began.
In 1987, a RIA for detecting the subunit I of the troponin complex (TnI) was
developed [Cummins et al. 1987] and, two years later, an enzyme-linked
immunoassay for the T subunit (TnT) was designed [Katus et al. 1989]. However,
these first-generation assays for the cardiac isoform of TnT (cTnT) showed
significant cross reactivity with skeletal isoforms. Moreover, it was proven that cTnT
4
was re-expressed during diseases that involve skeletal muscle regeneration
(muscular dystrophy, polymyositis or uremic myopathy) [Bodor et al. 1997; Muller-
Bardoff et al. 1997]. In consequence, cTnI came into the limelight.
Clinical studies with isoform I (cTnI) led to a few surprises. While CK-MB returned to
the baseline after a few days, cTnI was still detectable 7-10 days after the cardiac
insult. This turned out to be an advantage to detect cardiac damage in patients seen
late after their MI [Jaffe et al. 1996]. Secondly, troponins were shown to be
elevated in about one third of patients in whom AMI was ruled out by WHO criteria.
These patients were believed to have sustained “minor myocardial injury”, later
described as “unstable coronary disease” [Galvani et al. 1997]. The prognosis for
these patients was definitively worse compared with those with troponin levels
within the normal limits. The only indication of myocardial injury in these patients
was the increase in cTnI concentration. Early therapy in patients with unstable
coronary disease reduced the risk of major cardiac events, making early detection
and risk stratification critical .Laboratory information classified as falsely positive
only ten years before now had therapeutic implications.
Finally, the criteria for diagnosis of myocardial infarction changed in 2000, now
defined as detection of a rise and/or fall of cardiac biomarker values (preferably
cardiac troponin) with at least one of the following: symptoms of ischaemia, changes
in the electrocardiogram (ECG), imaging evidence of new loss of viable
myocardium/wall motion abnormality and identification of an intracoronary
thrombus by angiography or autopsy [Alpert et al. 2000].
The discovery of Troponin as a biomarker changed the foundations of human
cardiology. A simple blood test measuring a cardiac protein became the cornerstone
for myocardial infarction diagnosis.
1.1.2 BIOCHEMICAL BACKGROUND
Troponins are muscle proteins that are only present in striated muscle [Wells et al.
2008]; they are restricted to the skeletal muscles and the heart. Troponins are not
present in the smooth muscle [Collinson et al. 2001; Wells et al. 2008].
The striated pattern in skeletal and cardiac muscle results from the arrangement of
the filaments within the myofibrils. Two types of these protein structures are
identified, “thick” and “thin” filaments. The thick filaments are composed almost

5
entirely of the contracting protein “myosin”. The thin filaments contain the
contractile protein “actin” as well as two other regulatory proteins: “tropomyosin”
and “troponin” [Fox, 2006].
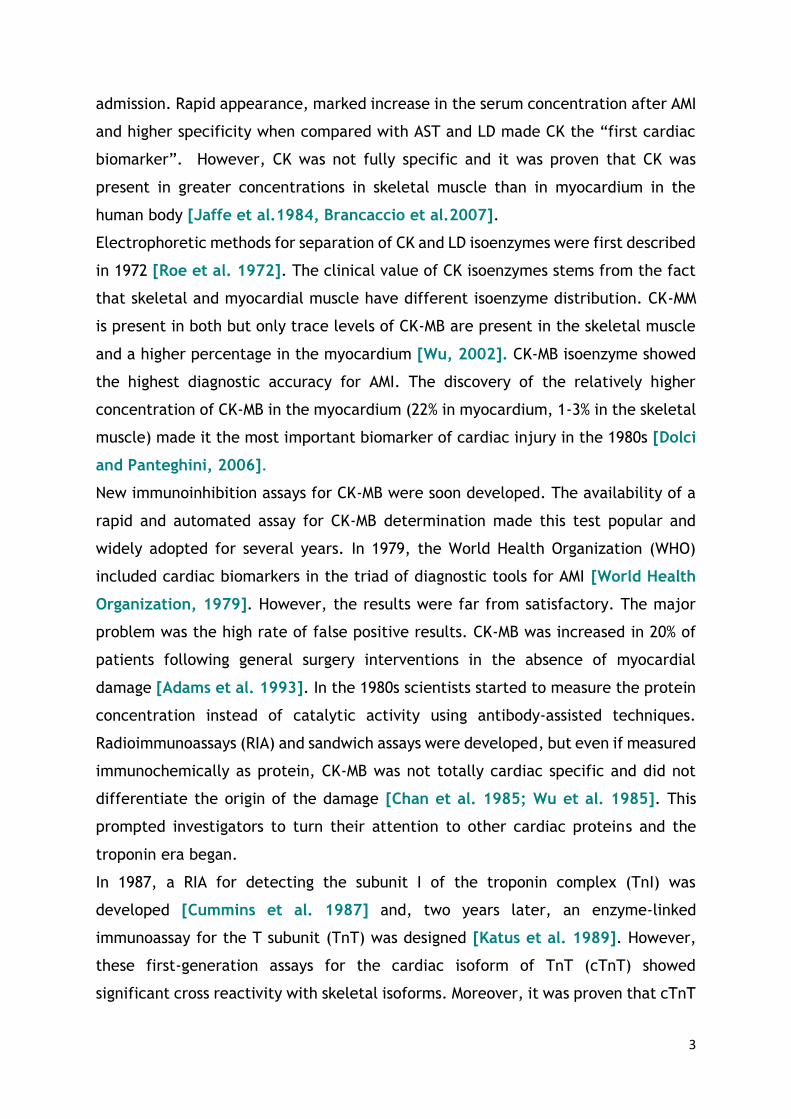
Troponins are a hetero-trimeric complex, which lies at regular intervals along the
thin filament [Solaro et al. 2008]. This is shown in Figure 1.1. The complex consists
of 3 interacting and functionally distinct proteins: troponin C, troponin T and
troponin I. The structure resembles a tadpole, with the head comprising a dumb-
bell-shaped troponin C, a globular troponin I and the C-terminal region of troponin
T; the tail is made up of the N-terminal region of troponin T [Collinson et al. 2001].
The subunits or proteins that form the troponin complex have different function,
structure and molecular weight. Troponin C (“C” for calcium, TnC) is the calcium-
binding subunit of the troponin complex. Structural studies of TnC revealed a
dumbbell-shaped molecule with two globular N and C-terminal domains connected
by a central helical linker. Its molecular weight is 18 kDa. Troponin T (“T” for
tropomyosin, TnT) binds the troponin complex to the tropomyosin and two regions
are recognized, N-terminal region which attaches the troponin complex to
FIGURE 1.1 Structure of the muscle. The troponin complex (green),tropomyosin (purple) and actin
(yellow) constitute the thin filaments. Thin and thick filaments (myosin) form cylindrical bundles known
as myofibrils. The cytoplasm of cardiomyocytes is filled with myofibrils and they are responsible for
contraction in the cardiac muscle.
Heart
Cardiomyocyte
Myofibril
Thin filament
Troponin
complex
6
tropomyosin and C-terminal region which interacts with TnI and TnC in a calcium-
dependent manner. This protein is heavy and is 37 kDa. Troponin I (“I” for inhibition,
TnI) is the inhibitory subunit of the troponin complex and it is a rod-like flexible
protein. Its molecular weight is 22 kDa [Collinson et al.2001].
Many authors described troponin I as the most sensitive of the three subunits.
Commonly, cTnI levels increase with less severe disease than cTnT, suggesting that
cTnI is more sensitive to myocardial injury [Langhorn et al. 2013]. Several
veterinary studies have measured both troponin T and troponin I in parallel in the
same population of animals [Burgener et al. 2006, Carretón et al. 2011, Langhorn
et al. 2013 and Langhorn et al. 2014 (b)]. In all of them cTnI was detectable and
above the reference range in a higher proportion of the animals included in
comparison with troponin T results. These authors hypothesized this could be due to
a difference in protein size and molecular weight or because cTnT may have a
structurally closer binding to the tropomyosin chain than cTnI.
1.1.2.1 Isoforms and specificity
Troponin C (TnC) is present in 2 isoforms. There are 2 known TnC genes, one
encoding for the fast skeletal muscle isoform (fTnC) and the other expressing both
cardiac (cTnC) and slow skeletal (sTnC) isoforms. The amino sequences of human
cTnC, sTnC and fTnC are 66% identical. This homology between cardiac and skeletal
isoforms reduces the cardiac specificity of TnC [Gomes et al. 2002].
Troponin T (TnT) has multiple isoforms. Several are present in skeletal muscle and
4 isoforms exist in cardiac tissue, although only one is characteristic of the adult
heart. The other 3 are expressed in fetal tissue and may be re-expressed during
heart failure or in damaged skeletal muscle [Wells et al. 2008]. Studies have
documented the lack of specificity of the capture antibody in the first-generation
TnT assay. This assay detected both fetal cardiac isoforms and some skeletal muscle
cTnT isoforms re-expressed in skeletal muscle in response to injury. These fetal
isoforms were then characterized and a new antibody was developed. Experiments
conducted by different groups concluded that cTnT had unique cardiac specificity
that was equal to that of cTnI [Thygesen et al.2010]. However, it has been recently
demonstrated that TnT expressed in diseased skeletal muscle is detected by the

7
antibodies used in both the fourth-generation and high-sensitivity assays [Jaffe et
al. 2011]
Three isoforms exist for TnI. There are three known TnI genes, which encode for
cardiac, fast and slow skeletal troponin isoforms (cTnI, fTnI and sTnI, respectively)
[Parmacek and Solaro, 2004] . The amino acid sequences of these three isoforms
are highly homologous with the exception of a unique 32-residue N–terminal
extension that is only present in the cardiac one. This unique extension is present in
all cTnI isoforms across species and is highly conserved among them. Both canine
and feline troponin genes have been cloned and sequenced [Rishniw et al. 2004].
Compared with the human gene, canine cTnI had one additional amino acid, which
is also detected in rodents (mouse and rat). This “extra” amino acid was also present
in feline cTnI but cats lack of a single amino acid - Glutamate/ Glycine (position 4).
Therefore there is a high degree of homology in the coding region among dogs, cats,
humans, mice and rats and commercial human cTnI analyzers can be used to measure
serum cTnI in dogs and cats. Unlike TnT, cTnI is not expressed after damage and
regeneration in adult skeletal muscle. Therefore, cTnI is the most cardio-specific
protein of the troponin complex and the main target of the analytical assays
[O´Brien et al. 1997].
1.1.2.2. Function
Troponins are essential regulatory proteins of the muscle contractile apparatus.
Striated muscle contraction is regulated by intracellular calcium concentration via
the thin filament regulatory proteins: troponin and tropomyosin [Solaro et al.2007].
This system prevents interaction of actin and myosin in the absence of calcium. At
rest, the concentration of calcium in the cytoplasm is very low due to calcium pumps
in the sarcoplasmic reticulum. With low levels of calcium, troponin and tropomyosin
are located on the outer domain of the actin, covering the myosin-binding sites. This
is known as the “blocked state” [Gomes et al. 2002].
8
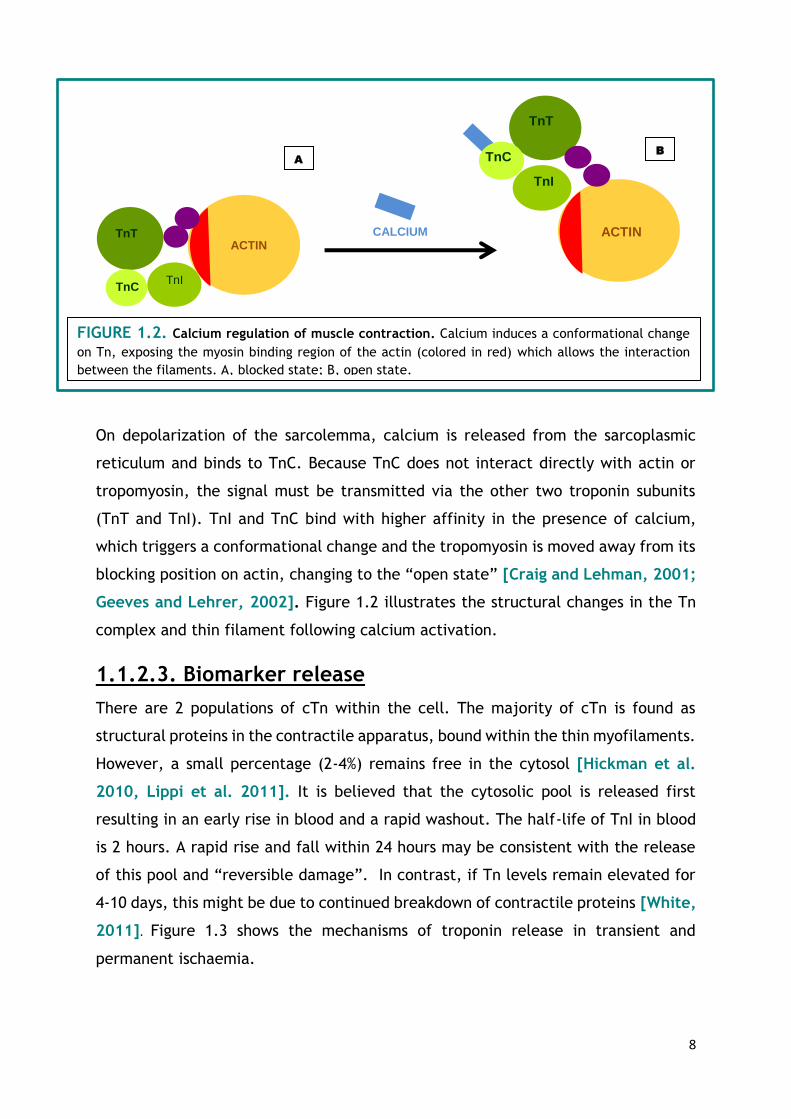
On depolarization of the sarcolemma, calcium is released from the sarcoplasmic
reticulum and binds to TnC. Because TnC does not interact directly with actin or
tropomyosin, the signal must be transmitted via the other two troponin subunits
(TnT and TnI). TnI and TnC bind with higher affinity in the presence of calcium,
which triggers a conformational change and the tropomyosin is moved away from its
blocking position on actin, changing to the “open state” [Craig and Lehman, 2001;
Geeves and Lehrer, 2002]. Figure 1.2 illustrates the structural changes in the Tn
complex and thin filament following calcium activation.
1.1.2.3. Biomarker release
There are 2 populations of cTn within the cell. The majority of cTn is found as
structural proteins in the contractile apparatus, bound within the thin myofilaments.
However, a small percentage (2-4%) remains free in the cytosol [Hickman et al.
2010, Lippi et al. 2011]. It is believed that the cytosolic pool is released first
resulting in an early rise in blood and a rapid washout. The half-life of TnI in blood
is 2 hours. A rapid rise and fall within 24 hours may be consistent with the release
of this pool and “reversible damage”. In contrast, if Tn levels remain elevated for
4-10 days, this might be due to continued breakdown of contractile proteins [White,
2011]. Figure 1.3 shows the mechanisms of troponin release in transient and
permanent ischaemia.
TnT ACTIN
TnI TnC
TnT
ACTIN
TnI
TnC
FIGURE 1.2. Calcium regulation of muscle contraction. Calcium induces a conformational change
on Tn, exposing the myosin binding region of the actin (colored in red) which allows the interaction
between the filaments. A, blocked state; B, open state.
CALCIUM
A B

9
Proteolytic degradation is mandatory for the structural troponin to be released,
whether the cytosolic pool could be released in the presence of ischaemia rather
than necrosis alone is a matter of debate. Troponin has been proven to be elevated
in several non-cardiac conditions. For example, 94% of athletes undergoing
endurance sports had measurable high sensitivity troponin levels – this is thought to
mirror increased membrane permeability rather than a clinically threatening
myocardial injury [Lippi et al. 2011].
There are 6 potential major pathobiological mechanisms for troponin release:
1. MYOCYTE NECROSIS: ischaemia, inflammation, infiltrative disease,
trauma and toxic causes (including sepsis) [French and White, 2004].
2. APOPTOSIS: programmed cell death [Narula et al.1996] .
TROPONIN IN BLOOD
REVERSIBLE INJURY
IRRREVERSIBLE INJURY
INSULT
PERMANENT TRANSIENT
FIGURE 1.3. Mechanisms of release of troponin in transient or permanent ischaemia.
• HIGH
INCREASES
•
• MILD –MOD INCREASES
• 24 HOURS

10
3. NORMAL MYOCYTE TURNOVER: cardiac myocytes regenerate although
they do it slowly (1% annual turnover at the age of 25). Whether such low-
grade turnover results in release of troponin is unknown [Bergmann et al.
2009].
4. PROTEOLYTIC DEGRADATION: proteolysis to create small fragments
could allow these to pass through an intact membrane [Gao et al.1997 and
Feng et al.2001]
5. INCREASED WALL PERMEABILITY: simulation of stretch-responsive
integrins has been shown to result in release of troponin from intact cultured
cardiomyocytes. Rat models have demonstrated that increased pre-load is
associated with troponin release, independent of ischaemia [Hessel et
al.2008]
6. BLEBS: cardiac myocytes develop blebs (active secretion vesicles) during
anoxia, with release of cytoplasmic enzymes without cell necrosis [Schwartz
et al.1984].
11
1.2 TROPONINS IN SMALL ANIMALS
1.2.1 TROPONINS IN CANINE MEDICINE
The literature reviewing the usefulness of troponins in canine patients in both
cardiac and non-cardiac conditions is extensive, detailed and confusing. The lack of
standardization of the cTnI assays employed in scientific research has resulted in a
wide variety of proposed reference ranges, significant differences in detection limits
of the assays and it is not uncommon to find controversial conclusions.
1.2.1.1 CARDIAC DISEASE
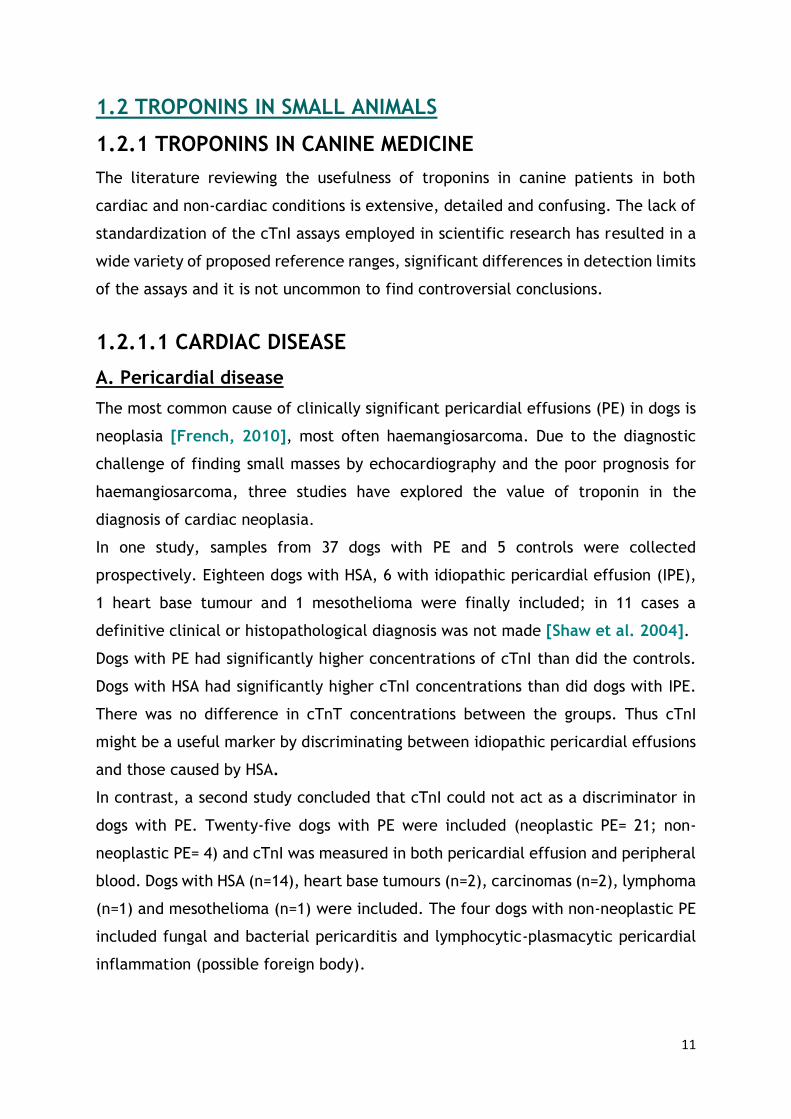
A. Pericardial disease
The most common cause of clinically significant pericardial effusions (PE) in dogs is
neoplasia [French, 2010], most often haemangiosarcoma. Due to the diagnostic
challenge of finding small masses by echocardiography and the poor prognosis for
haemangiosarcoma, three studies have explored the value of troponin in the
diagnosis of cardiac neoplasia.
In one study, samples from 37 dogs with PE and 5 controls were collected
prospectively. Eighteen dogs with HSA, 6 with idiopathic pericardial effusion (IPE),
1 heart base tumour and 1 mesothelioma were finally included; in 11 cases a
definitive clinical or histopathological diagnosis was not made [Shaw et al. 2004].
Dogs with PE had significantly higher concentrations of cTnI than did the controls.
Dogs with HSA had significantly higher cTnI concentrations than did dogs with IPE.
There was no difference in cTnT concentrations between the groups. Thus cTnI
might be a useful marker by discriminating between idiopathic pericardial effusions
and those caused by HSA.
In contrast, a second study concluded that cTnI could not act as a discriminator in
dogs with PE. Twenty-five dogs with PE were included (neoplastic PE= 21; non-
neoplastic PE= 4) and cTnI was measured in both pericardial effusion and peripheral
blood. Dogs with HSA (n=14), heart base tumours (n=2), carcinomas (n=2), lymphoma
(n=1) and mesothelioma (n=1) were included. The four dogs with non-neoplastic PE
included fungal and bacterial pericarditis and lymphocytic-plasmacytic pericardial
inflammation (possible foreign body).

12
No significant difference was identified between dogs with right atrial tumours
(n=14) and other types of neoplasia (n=7). The median cTnI level in PE from dogs
with neoplastic and non-neoplastic disease was not significantly different [Linde et
al. 2006].
A third study prospectively recruited 57 dogs, of which 18 had cardiac HSA (5
confirmed, 13 suspected), 14 had non-cardiac HSA, 10 had PE not caused by HSA and
15 had non-cardiac, non-HSA neoplasms. The plasma cTnI concentration was higher
in dogs with cardiac HSA compared with dogs with HSA at other sites, dogs with other
neoplasms and dogs with PE not caused by HSA. cTnI concentrations were therefore
considered useful in identifying cardiac HSA in dogs with PE. Plasma concentrations
above 0.25ng/ml indicated that HSA was likely in dogs with PE (sensitivity 81%,
specificity 100%) and levels above 2.45ng/ml indicated cardiac involvement in dogs
with HSA at other sites [Chun et al. 2010].
Finally, in a retrospective survival study of 120 dogs, most dogs with IPE had cTnI
between 0.151 and 1.0 ng/ml whereas dogs with PE associated with neoplasia had
cTnI levels above 1.01 ng/ml, suggesting that cTnI might be useful to distinguish the
aetiology [Fonfara et al. 2010].
B. Cardiomyopathies
Dilated cardiomyopathy (DCM) is the most common type of cardiomyopathy in dogs.
It is a disease of cardiac muscle of unknown origin, often familial, characterized by
slowly progressive ventricular dilation and loss of cardiac contractibility.
Approximately 25% of Irish Wolfhounds, 50% of male Doberman Pinschers and 33% of
female Doberman Pinschers develop DCM. Sudden cardiac death caused by
ventricular tachycardia-fibrillation occurs in at least 25-30% of affected Dobermans
[Oyama, 2008].
B.1) DOBERMAN PINSCHERS
Serum cTnI concentrations in Dobermans in various stages of cardiomyopathy (CM)
have been evaluated. Dobermans (n=336) without evidence of systemic disease were
recruited for this prospective study. Dogs were classified in 4 different groups: a
“control group” (no clinical signs, no arrhythmia, no morphological changes), an
“incipient group” (initially with no signs, no arrhythmia and normal echo at the time
of examination, but abnormal at the next examination within 1.5 years), a “VPC

13
(ventricular premature complex) group” (no clinical signs, normal echo but >100
VPCs/24h on Holter), an “ECHO group” (no signs, <50 VPCs/24h but abnormal M
mode measurements), a “VPC and ECHO group” (no clinical signs, >100 VPCs/24h
and abnormal M-mode measurements) and a “Clinical group” (dogs showing clinical
signs with abnormal ECG and echo).
Troponin I was significantly higher in all disease groups compared with the control
group. Moreover the “clinical group”, animals with the most advanced disease, had
the highest cTnI levels. No significant association between the number of VPCs and
cTnI levels was found.
Animals with initial normal echo and Holter results that developed DCM within 1.5
years had increased troponin levels at the time of examination. Therefore the ability
to detect the “incipient stage”, which the currently “gold standard” methods were
unable to detect, suggests that cTnI is a useful additional screening test for
cardiomyopathy in Doberman Pinschers. It was recommended that dogs with
increased cTnI levels should be re-examined more frequently [Wess et al. 2010].
B.2) PORTUGUESE WATER DOGS
Juvenile DCM (JDCM) in Portuguese Water Dogs (PWD) is an early onset disease with
a poor prognosis. The usefulness of cardiac biomarkers to detect JDCM was evaluated
in one study of 4 affected and 4 unaffected age-matched puppies. There was no
significant difference in results and cTnI was not considered useful in the diagnosis
of JDCM of PWD [Sleeper et al. 2002].
B.3) BOXERS
Myocardial disease in boxers is often characterized by ventricular arrhythmias,
rather than the ventricular dilation and systolic dysfunction seen in DCM of other
breeds. Due to similarities with arrhythmogenic right ventricular cardiomyopathy
(ARVC) in humans, boxer cardiomyopathy is often referred to as ARVC [Meurs,
2004]. Three different stages are commonly recognized: asymptomatic dogs with
ventricular tachyarrhythmias; dogs with syncope; dogs with systolic dysfunction and
heart failure. Sudden cardiac death may occur without previous clinical signs [Hariu
and Carpenter, 2010].
In a study evaluating the use of non-invasive techniques for the early diagnosis of
ARVC in Boxers, serum cTnI concentrations from 30 dogs, 10 boxers with early ARVC
(>1000 VPCs/24h and echocardiographic variables within the normal range), 10

14
control boxers (<5 VPCs/24h and normal echo) and 10 control non-boxer dogs, were
compared [Baumwart et al. 2007].
A significant (P=0.01) difference in cTnI concentrations was found between Boxers
with ARVC and control boxers. Mean serum cTnI concentration was 0.142 ±
0.05ng/ml for boxers with early ARVC, 0.079 ±0.03 for control boxers and 0.023 ±
0.01ng/ml for non-boxers. A significant difference was observed for cTnI
concentration between groups. Because of the difference between the two control
groups (Boxers and non-Boxer dogs), it was suggested that Boxers, as a breed, may
have higher reference range values for serum cTnI concentrations.
A significant correlation (P <0.001) was found between the serum cTnI concentration
and number of VPCs/24h for the combined Boxer population. Furthermore a
significant (P <0.001) correlation was also identified between the concentration of
cTnI and the grade of arrhythmia, suggesting that cTnI could be an indicator of
severity of the disease. However there was an overlap between the apparently
unaffected (control) and ARVC Boxers.
B.4) SURVIVAL, CHF AND ARRHYTHMIAS IN CARDIOMYOPATHIES
Another study, published in 2004, evaluated plasma cTnI concentrations in 269
canine patients with naturally occurring heart disease: 176 were determined to be
healthy, 26 were diagnosed with CM, 37 with mitral valve disease (MVD) and 30 with
congenital subaortic stenosis (SAS) [Oyama and Sisson, 2004].
The median cTnI concentrations in dogs with CM were significantly greater than in
healthy dogs and those with SAS. Within the healthy population a weak but
significant correlation between age and cTnI was found. In dogs with CM there was
no difference in median cTnI between dogs with and without congestive heart failure
(CHF) and between those with and without arrhythmias. The median survival time
of dogs with CM and cTnI >0.20ng/ml (11/26) was 112 days versus 357 days in 15
dogs with cTnI <0.20ng/ml.
B.5) OCCULT CARDIOMYOPATHY
A study evaluating alternative methods for the early detection of CM in Boxers,
Doberman Pinschers and Great Danes looked at the ability of atrial natriuretic
peptide (ANP), brain natriuretic peptide (BNP) and cTnI to detect occult CM in a
high-risk population [Oyama et al. 2007].
15
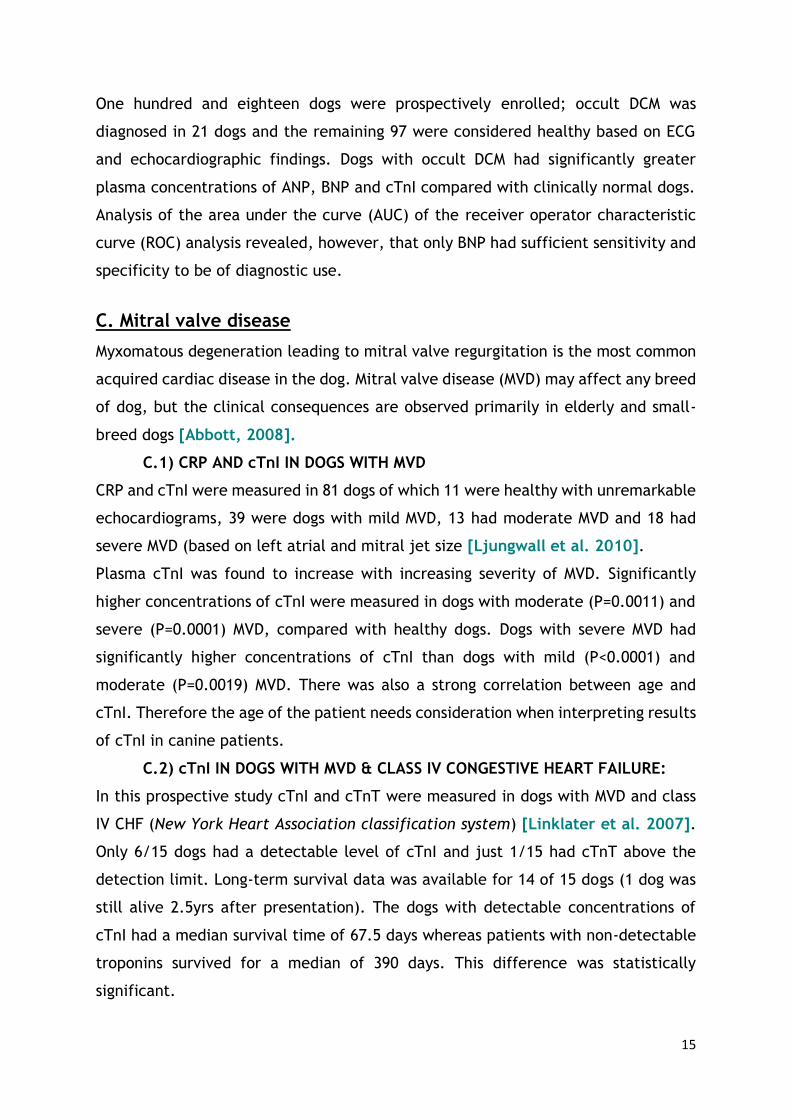
One hundred and eighteen dogs were prospectively enrolled; occult DCM was
diagnosed in 21 dogs and the remaining 97 were considered healthy based on ECG
and echocardiographic findings. Dogs with occult DCM had significantly greater
plasma concentrations of ANP, BNP and cTnI compared with clinically normal dogs.
Analysis of the area under the curve (AUC) of the receiver operator characteristic
curve (ROC) analysis revealed, however, that only BNP had sufficient sensitivity and
specificity to be of diagnostic use.
C. Mitral valve disease
Myxomatous degeneration leading to mitral valve regurgitation is the most common
acquired cardiac disease in the dog. Mitral valve disease (MVD) may affect any breed
of dog, but the clinical consequences are observed primarily in elderly and small-
breed dogs [Abbott, 2008].
C.1) CRP AND cTnI IN DOGS WITH MVD
CRP and cTnI were measured in 81 dogs of which 11 were healthy with unremarkable
echocardiograms, 39 were dogs with mild MVD, 13 had moderate MVD and 18 had
severe MVD (based on left atrial and mitral jet size [Ljungwall et al. 2010].
Plasma cTnI was found to increase with increasing severity of MVD. Significantly
higher concentrations of cTnI were measured in dogs with moderate (P=0.0011) and
severe (P=0.0001) MVD, compared with healthy dogs. Dogs with severe MVD had
significantly higher concentrations of cTnI than dogs with mild (P<0.0001) and
moderate (P=0.0019) MVD. There was also a strong correlation between age and
cTnI. Therefore the age of the patient needs consideration when interpreting results
of cTnI in canine patients.
C.2) cTnI IN DOGS WITH MVD & CLASS IV CONGESTIVE HEART FAILURE:
In this prospective study cTnI and cTnT were measured in dogs with MVD and class
IV CHF (New York Heart Association classification system) [Linklater et al. 2007].
Only 6/15 dogs had a detectable level of cTnI and just 1/15 had cTnT above the
detection limit. Long-term survival data was available for 14 of 15 dogs (1 dog was
still alive 2.5yrs after presentation). The dogs with detectable concentrations of
cTnI had a median survival time of 67.5 days whereas patients with non-detectable
troponins survived for a median of 390 days. This difference was statistically
significant.

16
C.3) cTnI AND SURVIVAL IN DOGS WITH MVD
The prognostic potential of high-sensitivity troponin I (hscTnI) and NT-proBNP was
assessed in a prospective study of 202 dogs with MVD and 30 controls [Hezzell et al.
2012]. The relationship between hscTnI and survival was found to be non-linear, as
dogs with hscTnI concentrations >0.025 had shorter survival times regardless of the
exact concentration. A ROC curve was constructed and the AUC was 0.629.
Multivariable analysis indicated that left ventricular end-diastolic diameter
(LVEDDN), age, heart rate and hscTnI were significantly and independently
associated with decreased survival time for all-cause mortality in dogs with naturally
occurring MVD. Importantly, hscTnI was not found to be independently associated
with survival time in dogs that died or were euthanized because of cardiac disease.
Combining serum hscTnI and NT-pro BNP measurements more accurately identified
those dogs with a shorter survival time than did either measurement alone.
However, when other variables (including echocardiographic variables) were known,
the independent prognostic value of including both serum values was lost.
Repeated measures models indicated that the rate of increase of both NT-pro BNP
and hscTnI was more rapid in dogs that died because of cardiac disease than in those
that died because of non-cardiac conditions. The increase in cTnI occurred late in
the course of cardiac disease whereas NT-proBNP increased earlier.
C.4) MYOCARDIAL ARTERIOSCLEROSIS IN DOGS WITH MVD AND CHF
The degree of arteriosclerotic and fibrotic changes was studied in the myocardium
at necropsy of 50 dogs with MVD and CHF [Falk et al. 2013].
cTnI concentrations increased with increasing grade of both global fibrosis and
fibrosis in the papillary muscles. The type of fibrosis seen in this study was of
“replacement type” where myocardial tissue is replaced by fibrous tissue in larger
or smaller areas. This type of fibrosis is almost invariably caused by ischaemia and
pathologists refer to it as “infarction” [Jönsson, 1972]. Serum cTnI concentrations
seem to reflect the presence of both intramyocardial fibrosis and arteriosclerosis.
This lends support to the hypothesis that arteriosclerosis may cause myocardial
damage and may play a role in the pathogenesis of heart failure in MVD in dogs.
17
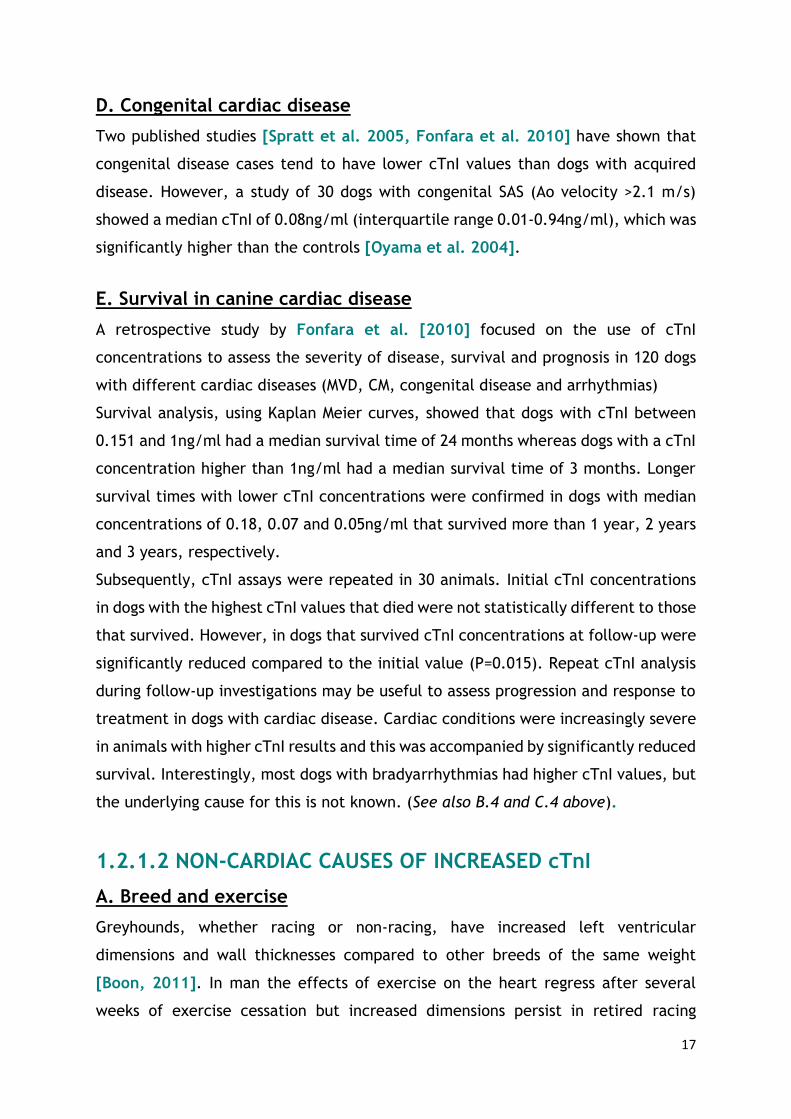
D. Congenital cardiac disease
Two published studies [Spratt et al. 2005, Fonfara et al. 2010] have shown that
congenital disease cases tend to have lower cTnI values than dogs with acquired
disease. However, a study of 30 dogs with congenital SAS (Ao velocity >2.1 m/s)
showed a median cTnI of 0.08ng/ml (interquartile range 0.01-0.94ng/ml), which was
significantly higher than the controls [Oyama et al. 2004].
E. Survival in canine cardiac disease
A retrospective study by Fonfara et al. [2010] focused on the use of cTnI
concentrations to assess the severity of disease, survival and prognosis in 120 dogs
with different cardiac diseases (MVD, CM, congenital disease and arrhythmias)
Survival analysis, using Kaplan Meier curves, showed that dogs with cTnI between
0.151 and 1ng/ml had a median survival time of 24 months whereas dogs with a cTnI
concentration higher than 1ng/ml had a median survival time of 3 months. Longer
survival times with lower cTnI concentrations were confirmed in dogs with median
concentrations of 0.18, 0.07 and 0.05ng/ml that survived more than 1 year, 2 years
and 3 years, respectively.
Subsequently, cTnI assays were repeated in 30 animals. Initial cTnI concentrations
in dogs with the highest cTnI values that died were not statistically different to those
that survived. However, in dogs that survived cTnI concentrations at follow-up were
significantly reduced compared to the initial value (P=0.015). Repeat cTnI analysis
during follow-up investigations may be useful to assess progression and response to
treatment in dogs with cardiac disease. Cardiac conditions were increasingly severe
in animals with higher cTnI results and this was accompanied by significantly reduced
survival. Interestingly, most dogs with bradyarrhythmias had higher cTnI values, but
the underlying cause for this is not known. (See also B.4 and C.4 above).
1.2.1.2 NON-CARDIAC CAUSES OF INCREASED cTnI
A. Breed and exercise
Greyhounds, whether racing or non-racing, have increased left ventricular
dimensions and wall thicknesses compared to other breeds of the same weight
[Boon, 2011]. In man the effects of exercise on the heart regress after several
weeks of exercise cessation but increased dimensions persist in retired racing

18
greyhounds. This cardiac enlargement in greyhounds is thought to have both
congenital and exercise-induced components [Pape et al. 1984].
One study reported that cTnI concentrations in healthy retired greyhounds were
significantly higher than in non-greyhound control dogs [LaVecchio et al. 2009].
The authors warned that a variable proportion of normal/healthy greyhounds could
be erroneously diagnosed with having myocardial disease based on the presence of
a functional heart murmur, higher vertebral heart score (VHS) on radiographs and
increased cTnI concentrations.
In another study cTnI and CK-MB were measured in racing greyhounds [Tharwat et
al. 2013]. The median cTnI concentration in the racing dogs was not significantly
different from that of the non-racing controls. However, within 2 hours of racing
7km, cTnI concentrations were significantly higher than pre-race values in 97% of
the animals. The cTnI levels had dropped back to the pre-race values 24hrs later.
The causes of race-induced cTnI elevations are unclear, may be explained by mild
hypoxia during exercise and may indicate that racing cause reversible cardiac injury
in healthy greyhounds.
Finally, another research group collected blood samples from ten Alaskan sled dogs
exercised for 160 km for 5 successive days (day plan: 80 km in 5h – 7-8 h resting – 80
km return journey). For all dogs, serum cTnI was below the level of detection of the
immunoassay prior to exercise. Using 0.11ng/ml as a cutoff (analyzer: Immulite
troponin I), exercise resulted in high cTnI in all dogs, peaking after the first day of
exercise but persisting throughout the 5 days of training [McKenzie et al. 2007].
B. Infectious diseases
B.1) LEPTOSPIROSIS
Acute renal failure remains the most common clinical finding in 90% of reported
cases of leptospirosis in domestic small animals. However, other organs may be
involved and hepatic disease occurs concurrently with acute renal failure in 10-20%
of cases [Harkin, 2009]. Epicarditis and endocarditis have been described in dogs
with experimentally induced leptospiral infection [Greenlee et al. 2005].
One retrospective case study assessed the relationship of the concentrations of cTnI
and the acute phase proteins C-reactive protein (CRP) and haptoglobin (Hp) with
outcome in dogs naturally infected with Leptospira interrogans [Mastrorilli et al.
2007]. Twenty dogs met the inclusion criteria (a positive leptospiral microscopic

19
agglutination test), of which 16 were symptomatic; three dogs had ventricular
arrhythmias. Eleven of the 16 symptomatic dogs had increased cTnI concentrations
(0.4 to 60.1ng). The cTnI concentration was significantly correlated with CK
(P=0.005) and AST (P=0.001) activities, but not with urea (P=0.118). Furthermore,
cTnI, CRP/Hp ratio, urinary albumin to creatinine ratio (UAC) and urinary total
protein to creatinine ratio (UPC) were significantly higher in non-survivors than in
survivors.
The lack of correlation between urea and cTnI in this study could suggest that
myocardial damage was due to direct myocyte injury rather than being secondary to
azotaemia (“uraemic syndrome”), although urea will increase for many reasons. As
cTnI concentrations were higher in non-survivors, cTnI was proposed as a potential
prognostic marker in leptospirosis infections. It was also noted that coagulation
abnormalities and DIC were common findings in the dogs of this study.
B.2) DIROFILARIASIS (Heartworm)
cTnI, cTnT, myoglobin and D-dimer were measured in dogs with and without adult
heartworm infection [Carretón et al. 2011]. Levels of cTnT in all dogs were below
the limit detection. cTnI concentrations were significantly lower in dogs without
clinical signs (group 1: microfilaraemic, negative for D. immitis antigen) compared
to group 2 (positive for D. immitis antigen but not microfilaraemic) and group 3
(positive for D. immitis antigens and microfilaraemic). No statistically significant
difference was found between group 2 and 3.
The hearts of 24 naturally infected dogs were examined by the same group using
routine histology and immunohistochemistry with anti-myoglobin and anti-cTnI
antibodies [Carretón et al. 2012]. There was no apparent association between
worm burden and the presence of myocardial lesions and there was no correlation
between the plasma levels of cardiac biomarkers and the presence of myocardial
lesions
This group also measured cTnI, myoglobin, CK-MB and AST in dogs infected with D.
immitis during adulticide treatment with ivermectin, doxycycline and melarsomine.
In this study dogs with a high worm burden (n=6) showed increased cTnI
concentrations; dogs with a low burden (n=9) had similar levels to that of healthy
dogs. After 60 days of treatment concentrations of cTnI decreased in all dogs, but

20
in those animals with high burdens the concentrations of cTnI, although decreased,
remained above the reference range [Carretón et al., 2013].
Increased cTnI concentrations have been also demonstrated in dogs with other
vector-borne diseases such as: Babesiosis [Moore and Williams, 1979, Lobetti et
al. 2002 and Taboada and Lobetti, 2006], Ehrlichiosis [Lakkawar et al. 2003,
McQuiston et al. 2003, Diniz et al. 2008, Mylonakis et al. 2010, Koutinas et al.
2012 and Champion et al. 2013] and Chagas disease, also known as “American
trypanosomiasis”, [Barr et al. 2005, Kjos et al. 2008 and Spikler, 2009].
C. Anaemia
Mortality of up to 70% has been reported in dogs diagnosed with immune-mediated
haemolytic anaemia (IMHA) and often is associated with thromboembolism
[Tircoveanu and Van Der Linden, 2008]. Lesions due to coagulopathy
(macrothrombi, microthrombi, fibrin deposition and haemorrhage) and cholestasis
were the most common abnormalities at postmortem examination of 34 dogs with
IMHA, 10 having lesions in the heart: myocardial necrosis (n=6) and myocarditis (n=4)
[McManus et al. 2001].
cTnI concentrations have been determined in dogs with IMHA to analyze the
incidence of myocardial damage in this population [Gow et al. 2011]. Eleven
healthy, 27 IMHA and 49 hospitalized dogs without cardiac, renal or haematological
disease were included in this study. A significant difference was found between the
serum cTnI concentrations of dogs with primary IMHA and the hospitalized dogs
(P<0.005) and healthy dogs (P<0.01). There was no significant difference in the cTnI
concentrations between dogs with marked anaemia compared to those with
moderate anaemia. The median serum cTnI concentration was higher in non-
survivors compared to dogs that survived for at least 4 weeks, although this was not
significantly different (only 4 dogs died in the follow up period thus the study was
severely underpowered).
D. Renal failure
cTnI concentrations have been analyzed in dogs with renal failure in the absence of
concurrent cardiac disease. In the first study, 39 dogs with renal failure were
included and 28 animals (71%) had cTnI concentrations above the reference interval
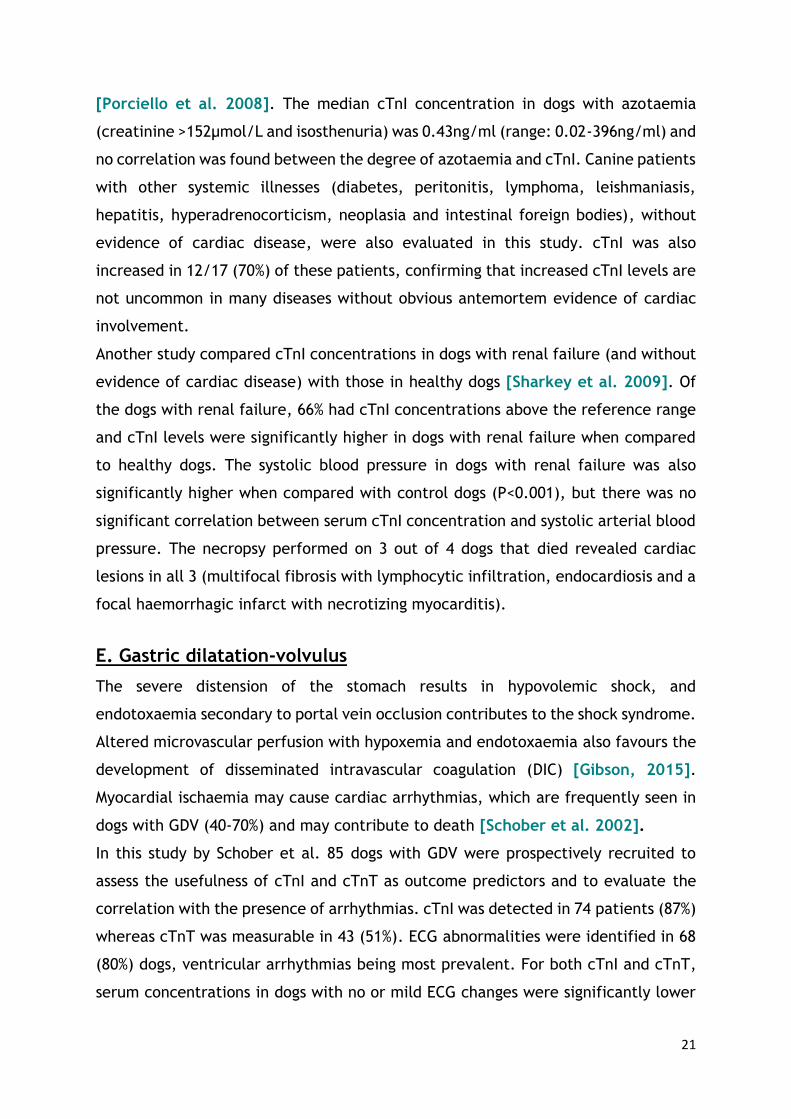
21
[Porciello et al. 2008]. The median cTnI concentration in dogs with azotaemia
(creatinine >152µmol/L and isosthenuria) was 0.43ng/ml (range: 0.02-396ng/ml) and
no correlation was found between the degree of azotaemia and cTnI. Canine patients
with other systemic illnesses (diabetes, peritonitis, lymphoma, leishmaniasis,
hepatitis, hyperadrenocorticism, neoplasia and intestinal foreign bodies), without
evidence of cardiac disease, were also evaluated in this study. cTnI was also
increased in 12/17 (70%) of these patients, confirming that increased cTnI levels are
not uncommon in many diseases without obvious antemortem evidence of cardiac
involvement.
Another study compared cTnI concentrations in dogs with renal failure (and without
evidence of cardiac disease) with those in healthy dogs [Sharkey et al. 2009]. Of
the dogs with renal failure, 66% had cTnI concentrations above the reference range
and cTnI levels were significantly higher in dogs with renal failure when compared
to healthy dogs. The systolic blood pressure in dogs with renal failure was also
significantly higher when compared with control dogs (P<0.001), but there was no
significant correlation between serum cTnI concentration and systolic arterial blood
pressure. The necropsy performed on 3 out of 4 dogs that died revealed cardiac
lesions in all 3 (multifocal fibrosis with lymphocytic infiltration, endocardiosis and a
focal haemorrhagic infarct with necrotizing myocarditis).
E. Gastric dilatation-volvulus
The severe distension of the stomach results in hypovolemic shock, and
endotoxaemia secondary to portal vein occlusion contributes to the shock syndrome.
Altered microvascular perfusion with hypoxemia and endotoxaemia also favours the
development of disseminated intravascular coagulation (DIC) [Gibson, 2015].
Myocardial ischaemia may cause cardiac arrhythmias, which are frequently seen in
dogs with GDV (40-70%) and may contribute to death [Schober et al. 2002].
In this study by Schober et al. 85 dogs with GDV were prospectively recruited to
assess the usefulness of cTnI and cTnT as outcome predictors and to evaluate the
correlation with the presence of arrhythmias. cTnI was detected in 74 patients (87%)
whereas cTnT was measurable in 43 (51%). ECG abnormalities were identified in 68
(80%) dogs, ventricular arrhythmias being most prevalent. For both cTnI and cTnT,
serum concentrations in dogs with no or mild ECG changes were significantly lower

22
than values for dogs with moderate or severe ECG abnormalities, values for dogs
with moderate ECG abnormalities being significantly lower than for dogs with severe
ECG changes. Sixteen (19%) dogs died and 10 of those had ventricular arrhythmias.
Serum cTnI and cTnT concentrations were significantly higher in dogs that died than
in dogs that survived (P <0.05). Serum cTnI and ALT activity 48 hours after surgery
were independent predictors of outcome with an accuracy of 91% [Schober et al.
2002].
F. Pyometra
A serious consequence of the uterine infection in pyometra is endotoxaemia and
possible progression into a systemic inflammatory response syndrome (SIRS).
Myocardial injury and failure secondary to endotoxaemia, inflammation,
disseminated bacterial infection and infarction are suspected to be contributing
factors to unexpected deaths in bitches with pyometra [Maretta et al. 1989].
cTnI concentrations have been measured in bitches with pyometra in two studies.
The first compared cTnI results between 58 bitches with pyometra and 9 controls
[Hagman et al. 2007]. Detectable levels of cTnI were found in 7 (12%) of the 58
cases. One of the two dogs with the highest cTnI levels had an arrhythmia on the
first day post-surgery and died later during that day. Myocarditis and disseminated
bacterial infection was demonstrated on post-mortem examination. There was a
trend for increased mortality in the pyometra patients with detectable cTnI levels.
A second study evaluated the occurrence of myocardial damage in dogs with
pyometra pre- and post-operatively, as well as its relation to the presence of SIRS
[Pelander et al. 2008]. Fifteen bitches undergoing surgery for neutering (n=12) and
mammary tumour removal (n=3) were used as controls. All controls had
undetectable pre-operative cTnI concentrations, whereas 13/46 (28%) bitches with
pyometra had increased cTnI values. After surgery, 2 controls and 18 pyometra
cases had increased serum cTnI levels. Thirty seven out of 46 pyometra cases met
two or more criteria for SIRS. There was no statistically significant difference
between SIRS positive and SIRS negative animals.

23
G. Blunt chest trauma
Concentrations of cTnI, cTnT, α-hydroxybutyrate dehydrogenase and CK-MB were
determined in 33 dogs with severe blunt chest trauma [Schober et al. 1999]. These
were compared with values from healthy controls (n=40) and correlated with the
presence of ECG abnormalities. cTnI was detected in 21/33 (64%), above the
reference range in 18 (55%) and above the cut off of 2ng/ml (used to separate minor
and major cardiac lesions in humans) in 16 dogs (48%). In contrast, cTnT was
increased in 9/33 dogs (27%) and was above 0.1ng/ml in four dogs (12%). Relevant
arrhythmias were found in only 5 dogs (15%) although ECG records were taken 12 to
24 hours after injury and some abnormalities may have disappeared. Nevertheless,
no correlation was found between the occurrence of ECG abnormalities and
biochemically detectable myocardial cell damage.
H. Systemic inflammation
Langhorn and colleagues have assessed myocardial injury and survival in critically ill
dogs admitted to an intensive care unit (ICU) with evidence of systemic inflammation
(CRP concentrations greater than 35 mg/L), and two studies have been published
(2013, 2014) involving the same population of dogs [Langhorn et al. 2013, 2014
(c)]. Animals with evidence of structural cardiac disease or those receiving
cardiotoxic drugs before admission were excluded. cTnI and cTnT were compared in
8 healthy controls and the 42 dogs with trauma, neoplasia, respiratory disease,
neural conditions, haematological disorders, splenic haematoma, peritonitis, GDV
and mucocele that met the inclusion criteria.
The first study focused on short-term survival (28 days) [Langhorn et al. 2013].
Forty of the 42 dogs (95.2%) had cTnI concentrations above the reference range at
the time of ICU admission. Non-survivors had significantly higher cTnI concentrations
than survivors and control dogs (P <0.001). Twenty one dogs had cTnT concentrations
above the detection limit of the assay. Non-survivors had significantly higher cTnT
than survivors. Admission cTnI and cTnT concentrations were highly correlated. Both
cardiac troponins were found to be good prognostic markers, however, cTnI was the
best short-term marker.
Their second study aimed to determine the long-term (1-12mths) prognostic
potential of cTnI and cTnT and also evaluated the value of daily troponin

24
measurements in the ICU [Langhorn et al. 2014 (c)]. One year outcome was
available for 38/42 dogs. The 1-year mortality rate was 47% (18/38); 11 died within
the first 28 days post-admission. Non-survivors had significantly higher cTnI and cTnT
concentrations than survivors. Peak cTnI concentrations were not significantly
higher than admission concentrations (serial determination of cTnT was not possible
due to ethical regulation and serum volume restrictions). The median day of ICU
hospitalization that cTnI peaked was day 1.5. There was no significant difference
between admission cTnI, peak cTnI and admission cTnT between short and long-term
non-survivors.
It was concluded that daily measurements of troponins in the ICU were of value as
peak cTnI concentration, but not admission cTnI, was related to 1yr case mortality.
In addition, changes in circulating cTnI did not distinguish non-survivors from
survivors. In contrast to the previous study, admission cTnT was the best long-term
prognostic marker.
J. Cardiotoxicity
J.1) SNAKE ENVENOMATION
Cardiac arrhythmias are commonly seen in humans and animals bitten by venomous
snakes, and myocardial damage, including haemorrhage and necrosis, is suspected
to have a negative impact in their outcome [Blum et al. 2004]. The presence of
myocardial damage as a contributing factor to morbidity and mortality in dogs bitten
by the European viper (Vipera berus) has been evaluated. Blood samples and 2-
minute ECG recordings were collected at presentation, and at 12, 24 and 36 hours
in 24 envenomed dogs. Eight dogs had an increased serum cTnI concentration at one
or more of the four sampling time points after the snake bite. Six dogs had abnormal
ECGs but only 3 of these 6 dogs had increased cTnI concentrations [Pelander et al.
2010].
A collaborative study between the University of Pretoria (South Africa) and the
University of Copenhagen (Denmark) documented myocardial injury and systemic
inflammation in dogs envenomed by 3 different snake species (V. berus, Bitis
arietans and Naja annulifera). cTnI concentrations were correlated with CRP. These
results suggest that myocardial damage is secondary to the inflammatory reaction
rather than a direct cardiotoxic effect of the venom. Interestingly, a higher degree
25
of cardiac injury (higher cTnI concentration) was not present in dogs that presented
with or developed arrhythmias [Langhorn et al. 2014a].
J.2) CHEMOTHERAPY
Anthracyclines (doxorubicin and epirubicin) are commonly used in oncology as they
are among the most potent chemotherapeutic agents. Unfortunately, their cardiac
toxicity is well characterized in human, laboratory and small animals limiting their
use in both human and veterinary medicine [Adamcova et al. 2005]. Anthracycline
cardiotoxicity is cumulative, irreversible, acute or delayed, and in a small
percentage of the patients fatal. In humans, the prognosis of patients who develop
CHF is poor (50% mortality in 1 year) [Von Hoff et al. 1979]. Prevention is,
therefore, the best approach and monitoring for early detection of cardiomyopathy
is of paramount importance in the management of patients undergoing anthracyline
chemotherapy. The percentage of cardiac complications in dogs at standard doses
is approximately 3-18%. [Selting et al. 2004, Takemura et al. 2007 and Chatterjee
et al. 2010].
cTnT has been measured in dogs undergoing doxorubicin treatment. The study
included 64 dogs with untreated neoplasia, asymptomatic DCM, advanced CHF,
muscoskeletal trauma and dogs receiving doxorubicin [DeFrancesco et al. 2002].
Two dogs with lymphosarcoma on doxorubicin were studied. Both dogs had
detectable concentrations of cTnT. In this study, normal dogs and dogs with
untreated neoplasia had cTnT concentrations below the detection limits. After a
cumulative doxorubicin dose of 150mg/m² the highest cTnT concentration ocurred
after 3.5 weeks, whereas after a cumulative dose of 180 mg/m², the highest
concentrations were seen after 2 weeks. One of the dogs died from suspected
doxorubicin-induced cardiotoxicity (ventricular arrhythmia)
Another report analyzed the usefulness of cTnI to predict cardiac complications in
dogs with lymphoma and osteosarcoma undergoing doxorubicin chemotherapy
[Selting et al. 2004]. Serum cTnI increased in some dogs treated with doxorubicin.
Several dogs did not show evidence of heart disease following doxorubicin
administration during the monitoring period but had increased cTnI concentrations.
cTnI failed to predict cardiac adverse events in dogs treated with doxorubicin.

26
K. Non-cardiac dyspnoea
NT-proANP, BNP and endothelin-1 have been demonstrated to be useful for
distinguishing between dogs with cardiac (CHF) and non-cardiac causes of dyspnoea,
whereas cTnI failed to distinguish these causes [Prosek et al. 2007]. Twenty six
dogs with non-cardiac diseases such as pneumonia (n=11), pulmonary neoplasia
(n=8), neoplastic pleural effusion (n=3), laryngeal paralysis (n=2) and chronic
bronchitis (n=2) were included in that study. The authors hypothesized that severe
hypoxia due to respiratory disease may result in secondary cardiac injury or may be
a consequence of endothelial damage in the pulmonary vasculature or a result of
the activation of angiotensin-converting enzyme.
A diagrammatic representation of the non-cardiac causes of increased cTnI in the
dog is shown in Figure 1.4.

27
BR
EED
LaVecchio
(2009)
EXER
CIS
E
McKenzie
(2007)
Tharw
at (2
013)
SN
AK
E
EN
VEN
OM
AT
ION
Segev (2
008)
Pela
nder (2
010)
Langh
orn
(201
4)
CH
EM
OTH
ER
APY
Christia
nse
n(2
001)
DeFra
ncse
co (2
002)
Seltin
g (2
004)
AN
AEM
IA
Gow
(2011) – IM
HA
Cham
pio
n (2
013) - In
fectio
us
Ehrlic
hio
sis Babesio
sis
Din
iz (2
008) L
obetti (2
002)
Koutin
as (2
012)
Chagas
Heartw
orm
Barr (2
005) C
arre
tón (2
011-1
3)
VEC
TO
R-B
OR
NE D
ISEA
SES
LEPT
OSPIR
OSIS
Mastro
rilli (2007)
AZO
TA
EM
IA
Porc
iello
(2008)
Shark
ey (2
009)
GD
V
Schober (2
002)
Burg
ener
(2006) P
YO
MET
RA
Hagm
an (2
007)
Pela
nder (2
008)
BLU
NT
CH
EST
TR
AU
MA
Schober (1
999)
Burg
ener (2
006)
NO
N-C
AR
DIA
C D
YSPN
OEA
Pro
sek (2
007)
FIG
UR
E 1
.4. N
on-c
ard
iac c
ause
s of in
cre
ase
d c
TnI in
the d
og.

28
1.2.2 TROPONINS IN FELINE MEDICINE
1.2.2.1 CARDIAC DISEASE
A. CARDIOMYOPATHIES AND TROPONIN IN CATS
Cardiomyopathies are highly prevalent in the feline population and represent a
heterogeneous group of disorders that result in structural and functional impairment
of the heart muscle [Fox,2003].
Hypertrophic cardiomyopathy (HCM) is the most common cardiomyopathy in cats
[Schober and Todd, 2010]. The left ventricle is hypertrophied and develops
excessive scar tissue in the absence of secondary causes (hyperthyroidism, systemic
hypertension, aortic stenosis or acromegaly). As a result, there is poor relaxation
leading to diastolic dysfunction with resulting CHF, arterial thromboembolism (ATE)
or sudden death [Fox, 2003 and Factor et al.1991] .
The aetiology of HCM remains unknown in many cats. Mutations in the myosin binding
protein C gene have been described in families of certain breeds such as Maine Coon
and Ragdoll. Therefore, HCM is a primary and likely dominant heritable myocardial
disorder. It is a developmental disease that occurs as the cat ages, at any time during
its life span, from adolescent to geriatric [Kienle, 2008 and Côté et al. 2011 (a)].
Several studies have reported increased troponin values in cats with HCM. One study,
included 33 healthy cats free of cardiac disease and 20 animals with moderate to
severe HCM. The median cTnI in the control group was < 0.03 ng/ml whereas it was
0.66 ng/ml in cats with HCM. Two animals with ATE showed the highest cTnI. In
addition, a weak correlation between cTnI and the thickness of the left ventricular
posterior wall in diastole (LVPWd) was seen, suggesting a possible association with
disease severity [Herndon et al. 2002]. Another study, published in 2003, recruited
16 HCM/hypertrophic obstructive cardiomyopathy (HOCM) affected and 18 healthy
cats. The median cTnI in the controls was < 0.20 ng/ml (below the detection limit),
0.91 ng/ml for the HCM group and 1.30 ng/ml for the HOCM group. There was a weak
correlation between cTnI level and LVPWd [Connolly et al. 2003].
Discordant results were obtained regarding CHF when the two studies are compared.
cTnI concentrations were significantly higher in cats in CHF in the former study
whereas there was not significant association in the latter study.
29
B. MYOCARDIAL DAMAGE IN FELINE HCM
In none of the studies mentioned were histopathological examinations performed on
the hearts from cats included, thus correlation of high cTnI concentrations with
myocardial damage was not definitively made.
There are several pathophysiologic mechanisms in cats with HCM that could explain
high troponin values. Firstly, microvessel or intramural coronary artery disease is
commonly seen in feline, canine and human hypertrophic hearts. Cats with HCM have
abnormally thick intramural/ small coronary arteries with enlarged media and intima
layers and markedly narrowed lumen. The arterial wall thickening results from
cellular hyperplasia of connective/fibrous tissue. The abnormal intramural coronary
arteries are commonly associated with areas of fibrosis, suggesting that these
changes are significant and may produce myocardial ischaemia, necrosis and fibrotic
replacement. A majority of cats with HCM (74%) have abnormal coronary arteries
[Liu et al. 1993, Herndon et al. 2002, Connolly et al. 2003 and Ferasin, 2012].
The hallmarks of HCM in cats are myofibre disorientation, hypertrophy of the
cardiomyocytes and increased matrix or replacement fibrosis. The presence of
myocardial hypertrophy in the absence of adequate increases in myocardial capillary
density could contribute to ischaemia, myocyte death and subsequent cTnI release.
Abnormal coronary flow dynamics due to compression applied by thickened muscle
and abundant connective tissue could decrease the coronary reserve [Krams et al.
1998] . Finally, neurohormonal activation may induce further myocyte damage due
to the cardiac remodeling effects (angiotensin II, aldosterone and endothelin) [Krum
2000, Weber 2001 and Connolly et al. 2003].
C. DYSPNOEA AND TROPONIN IN CATS
Cats with cardiomyopathies can be presented to the clinician as respiratory
emergencies due to pulmonary oedema or pleural effusion, the final consequence of
left-sided CHF. Dyspnoea in cats may be attributable to many other causes such as
airway diseases, neoplasia, infection and pleural space diseases [Starybrat and
Tappin, 2016].
In order to clarify if cTnI could help practitioners in the management of dyspnoeic
cats, 3 different studies have been carried out and all reached the same conclusion

30
that cTnI is not useful to distinguish between cardiac and non-cardiac dyspnoea in
cats.
In the first study, all cats with cardiogenic dyspnoea had cTnI concentrations > 0.2
ng/ml. Conversely, of the 12 cats with non-cardiogenic dyspnoea, 6 had plasma cTnI
concentrations < 0.2 ng/ml but 6 values exceeded >0.2ng/ml, the reference limit
for healthy cats. Dyspnoeic cats with plasma cTnI concentrations that exceeded 1.42
ng/ml most likely had CHF as the cause of respiratory distress. In dyspnoeic cats
with plasma cTnI concentrations between 0.2-1.42 ng/ml, the cause of dyspnoea
remained uncertain and thoracic radiographs or echocardiography were indicated
[Herndon et al. 2008].
In 2009, a second study included 30 animals in respiratory distress due to non-cardiac
diseases and 23 in CHF. Significantly higher cTnI concentrations were found in
animals in CHF when compared with dyspnoeic animals without cardiac disease.
Significant overlap between the 2 groups was present thereby reducing the clinical
value of the assay [Connolly et al. 2009 (a)].
Finally, a third study evaluated the use of a point-of-care multiuse analyser for cTnI,
employing from 16 to 22 µL of blood and with a turnaround time of 10 minutes.
Thirty seven healthy cats and 39 dyspnoeic cats were included. Similar findings to
the two previous studies were reported. Cats with cardiac disease had significantly
higher values of cTnI than did healthy cats and cats with a non-cardiac cause of
dyspnoea. However, there was overlap of cTnI concentrations between the 2 groups
of cats with dyspnoea [Wells et al. 2014].
1.2.2.2 NON-CARDIAC DISEASE
Increased cTn levels indicate cardiac cell injury but do not define the cause of the
injury. Elevations are not uncommon in patients with conditions other than primary
cardiac disease. In humans, cTnI has been proven to be elevated in renal
insufficiency, septic shock, gastrointestinal bleeding, cirrhosis, diabetic
ketoacidosis, hypothyroidism, chronic obstructive pulmonary disease, stroke,
seizure, strenuous exercise, chemotherapy, rhabdomyolysis, pregnancy,
rheumatological disease and non-cardiac surgery [De Gennaro et al. 2008].
In consequence, many recent investigations on cTnI in cats have focused their
attention on non-cardiac disease as a source of increased troponin.
31
A. Hyperthyroidism
In 2005, a study with 23 hyperthyroid cats showed that 50% of them had cTnI
concentrations within the detectable level of the assay at the first visit. In contrast,
only 3 out of 18 cats that completed 4 weeks of treatment using radioactive iodine
had detectable concentrations [Connolly et al. 2005]
Another publication concluded that both cardiac biomarkers, NT-proBNP and cTnI,
are increased in cats with HCM and cats with hyperthyroidism. Importantly, neither
NT-proBNP nor cTnI appeared to distinguish hypertrophy associated with
hyperthyroidism from primary HCM. Increased cTnI levels in hyperthyroid patients
decreased with treatment, supporting Connolly´s findings [Sangster et al. 2014].
B. Azotaemia
Following previous findings in humans, a retrospective observational study in 2008
demonstrated that dogs and cats with acute or chronic azotaemic renal failure often
have elevated cTnI levels [Porciello et al. 2008]. Approximately 72% of cats with
chronic kidney disease had cTnI levels above published reference intervals.
Interestingly, the severity of renal failure did not correlate with the cTnI
concentration.
The underlying mechanism that correlates cTnI and renal disease remains unknown.
Secondary cardiac toxicity due to uraemia, decreased renal excretion of troponin or
myocardial dysfunction caused by severe systemic disease are some of the
hypotheses suggested .
C. Anaemia
A recent paper, published in 2014, revealed that anaemic cats had significantly
higher cTnI concentrations compared with cats with non-anaemic, non-cardiac and
non-renal illnesses [Lalor et al. 2014].
It was impossible to establish a causal association between anaemia and myocyte
damage because of the cross-sectional study design. Two hypotheses were proposed
for the higher cTnI: left sided cardiac enlargement as a result of haemodynamic
compensatory mechanisms or direct cardiac myocyte damage.

32
D. Hypertension
Although nothing is known about the effect of hypertension on cTnI in veterinary
patients, individuals with elevated blood pressure are routinely excluded in
veterinary cTnI studies [Borgeat et al. 2014, Langhorn et al. 2014(b)]
In December 2012 a paper published in the Journal of Hypertension demonstrated
that cTnI was elevated in 32.7% of human patients with hypertensive crises.
Importantly, a significant majority (76%) of the patients with elevated troponin
levels had underlying obstructive coronary artery disease [Pattanshetty et al.
2012].
E. Blunt chest trauma
Cats with blunt chest trauma (BCT) have been shown to have increased cTnI
concentrations [Kirbach et al. 2000]. One study included 31 cats with BCT, which
were evaluated at 12-24h and 60-72h after the event. Alpha-hydroxybutyrate
deshydrogenase (HBDH), CK-MB, cTnT and cTnI were measured and all were
significantly increased 12-24h after trauma.
F. Chemotherapy
Anthracycline induced cardiomyopathy (AICM) is well characterized in dogs and
people in contrast to few reports of doxorubicin toxicity in cats. A difference in
susceptibility to doxorubicin exists between species and dogs appear to be more
prone to suffer from AICM than cats or people. Cardiac arrhythmias do not seem to
be a major concern in cats whereas atrial and ventricular arrhythmias are well
recognized in dogs and people receiving doxorubicin [O´Keefe et al. 1993].
Unsurprisingly, cTnI levels have been proven to be elevated in dogs and people
treated with anthracyclines [Selting et al. 2004 and Granger, 2006]. To the
author’s knowledge no results have been published for cats.
A diagrammatic representation of the non-cardiac causes of increased cTnI in the
cat is shown in Figure 1.5.

33
NO
N-C
AR
DIA
C D
YSPN
OEA
Hern
don e
t al. (2
008)
Connolly
et a
l. (2009)
Wells e
t al. (2
014)
AN
AEM
IA
Lalo
r et a
l. (2014)
HYPERTH
YRO
IDIS
M
Connolly
et a
l. (2005)
Sangste
r et a
l. (2014)
REN
AL FA
ILU
RE
Porc
iello
et a
l. (2007)
BLU
NT C
HEST T
RAU
MA
Kirb
ach e
t al. (2
000)
FIG
UR
E 1
.5. N
on-c
ard
iac c
ause
s of in
cre
ase
d c
TnI in
the c
at.

34
1.3 INFLAMMATION, ACUTE PHASE PROTEINS AND CARDIAC
DISEASE IN CATS.
Acute phase response in feline medicine
The acute phase reaction (APR) is considered a dynamic process, which involves
systemic and metabolic changes providing an early non-specific defence mechanism
in animals exposed to a pathogenic insult [Petersen et al. 2004].
APR begins as a local reaction induced by cytokines synthesised by activated
macrophages. Monocytes activate in the presence of bacterial toxins or local tissue
injury and synthetise and release the pro-inflammatory cytokines (IL-1, IL-6 and TNF-
α). These cytokines are soluble mediators which function as “messengers” between
the local site of injury and organs involved in homeostasis (central nervous system,
autonomic nervous system and adrenal glands) [Paltrinieri, 2008].Therefore,
cytokines induce both local and systemic effects to establish a rapid and intense
protective response [Paltrinieri, 2007].
These mediators have multiple sources, multiple targets and act together through
overlapping pathways [Gabay et al. 1999] finally producing the hallmarks of the
APR:
1. Fever
2. Leucocytosis
3. Behavioural changes
4. Changes in the concentration of APP
i. FEVER
Pro-inflammatory cytokines are unable to pass through the blood-brain barrier thus
they induce the synthesis of leptin (adipocytes) and prostaglandins (all nucleated
cells) which act as intermediate molecules and modulate the activity of the thermo-
regulation center in the hypothalamus [Sirko et al. 1989 and Paltrinieri, 2008].
ii. LEUCOCYTOSIS
The APR-induced leukocytosis is biphasic. The first wave of leucocytes is released
from the marginal pool due to the increased levels of cortisol. Cytokines induce the
release of corticotropin releasing factor (CRF) at the hypothalamus, CRF activates
the hypophysis that synthetizes adrenocorticotrophic hormone (ACTH) which

35
stimulate the adrenal glands to produce cortisol. Cortisol reduces the adhesiveness
of the white blood cells to endothelium. The marginal pool is remarkable in the
feline species as the circulating/marginal leucocytes ratio is 1:3 [Smith, 2000;
Cowell and Decker, 2000]. The second and long-lasting wave is the consequence of
the direct stimulation of IL-1 and TNF-α on the bone marrow. They increase the
replication and differentiation of myeloid precursors [Paltrinieri, 2008].
Only about 50% of cats with subacute or chronic inflammation actually have
increased numbers of neutrophils [Segev et al. 2006]. The degree of neutrophilia is
usually higher when inflammation is localized rather than in generalized infections
where neutropenia frequently occurs [Cowell and Decker 2000].
Hyperacute leukocytosis is a common event in cats. Leukocytosis can also be seen
as a consequence of excitement, fear or stress. A rapid increase in leucocytes is not
absolutely specific for inflammation [Cowell and Decker 2000].
iii. BEHAVIOURAL CHANGES
The cytokine-induced stimulation of the central nervous system results in the
activation of the hypothalamo-pituitary-adrenal and the hypothalamo-pituitary-
gonadal axes resulting in lethargy, anorexia, adipsia and disinterest in social and
sexual activities [Karrow,2006].
iv. ACUTE PHASE PROTEINS
Cytokines modulate protein synthesis by the hepatocytes [Cerón et al. 2005].
During the APR, the blood concentration of certain proteins changes dramatically as
a result of a complex pattern of induction involving cytokines and glucocorticoids.
These proteins are known as “acute phase proteins” (APP). Some will increase,
called “positive” whereas others decrease, “negative APP” [Paltrinieri, 2008]. The
main positive and negative feline APP are summarised in table 1.1.

36
iv.a) NEGATIVE APP
No data about the possible role of albumin as a negative APP are available in cats.
It has been reported to decrease in many feline inflammatory conditions although it
is unknown if this decrease is the result of extravasation of the albumin from the
vessels to inflamed tissues or true decreased hepatic production [Paltrinieri, 2008].
iv.b) POSITIVE APP
The magnitude of the increase is highly variable between the different proteins and
among different animal species (See Figure 1.6). Depending on the fold increase
from the base line (they are usually unmeasurable in blood) the APP are further
classified in “major”, “moderate” and “minor”.
1) MAJOR – 10 to 100-fold increase
2) MODERATE – 2 to 10-fold increase
3) MINOR – only a slight increase
Major proteins are often observed to increase within the first 48 hours and show a
rapid decline whereas moderate and minor both increase more slowly but are more
prolonged in duration. Moderate and minor APP are more often observed during
chronic inflammatory processes [Cray et al. 2009].
Measuring the changes in the APP concentration is used as a “molecular
thermometer”. The serial quantification of APP can provide an assessment of the
response to a pathogenic insult. To optimize their use, it is recommended that APP
profiles should include at least one positive major and one positive moderate APP.
A basic profile for a cat should include SAA (as a major APP) and Hp (as moderate)
[Cerón et al. 2008].
1. NEGATIVE APP:
- Albumin (?)
- Transferrin
- Apolipoprotein A1
- Retinol binding protein
- Cortisol binding protein
- Transthyretin
2. POSITIVE APP:
- C-Reactive protein (?)
- α-acid glycoprotein
- Haptoglobin
- Serum Amyloid A
- Complement fractions ( C3,C4)
- LPS binding protein
- Ceruloplasmin
- α-globulins with antiprot. activity
TABLE 1.1. Acute phase proteins in Feline Medicine

37
Data regarding APP levels in cats are scarce and mostly focused on general aspects
of feline APP biology. Most of the studies have been focused on AGP, SAA and, to a
lesser extent, Hp. These three molecules are considered most important APP in the
cat. CRP does not seem to be involved in the acute response in this species [Cerón
et al. 2005, Paltrinieri, 2008, Eckersall and Bell. 2010 and Eckersall and Schmidt,
2014].
1.3.1 SERUM AMYLOID A
Serum amyloid A proteins are a family of closely related apolipoproteins. SAA
proteins range in size from 104 to 112 amino acids and are considered the precursors
of amyloid A, the main component of the proteinaceous plaques deposited in major
organs as occasional consequence of chronic inflammatory diseases (“Amyloidosis”)
[Husby et al. 1994]. The liver is the primary source of circulating SAA although
extrahepatic production has been described in several species [Upragarin et al.
2005]. Expression and production have been detected in atherosclerotic lesions
[Meek et al. 1994; Yamada et al. 1996]; brain of patients with Alzheimer´s disease
[Liang et al. 1997; Chung et al. 2000] and epithelial cells from several normal
tissues such as breast lobule, colon mucosa, prostate, kidney and lung in human
patients [Urieli-Shoval et al. 1998]. The functions of SAA are thought to involve
lipid metabolism, lipid transport, chemotaxis and regulation of the inflammatory
process [Upragarin et al. 2005].
CRP /SAA Fibrinogen- Complement
Hp /SAA AGP – Macroglobulin - Comp
Hp/pigMAP/SAA Fibrinogen -Complement
CRP/SAA Hp-AGP-Ceruplasmin
AGP/SAA Hp-Complement
FIGURE 1.6. Major and minor positive APP in domestic animal species. The APP pattern may
vary from one species to another. Species differences in classification of major/minor positive APP
are apparent.

38
a) FELINE AMYLOIDOSIS
Amyloidosis results from extracellular deposition of insoluble, fibrillar and
proteinaceous amyloid in multiple organs [Jimenez et al. 2011]. Reactive systemic
amyloidosis is the most common in the cat [Van der Linde-Sipman et al. 1997 and
Gruys, 2004]. Deposition of amyloid causes pressure atrophy of adjacent cells.
Usually, the kidney is the organ most commonly involved [Grant Maxie and Newman
2007]. In Abyssinian cats, the high degree of deposition in the kidney leads to renal
failure at a young age [Van der Linde-Sipman et al. 1997]. In contrast, systemic
amyloidosis in Siamese occurs in the liver leading to hepatic rupture and intra-
abdominal hemorrhage [Beatty et al. 2002, Khoshnegah and Movassaghi, 2010 and
Chew et al. 2011].
DiBartola et al. evidenced in 1989 that Abyssinian cats with amyloidosis had
significantly higher (P=0.05) SAA concentrations than healthy Abyssinian cats and
hospitalized Abyssinian cats. In addition, healthy non-Abyssinians had significantly
(P=0.05) lower SAA concentrations than healthy Abyssinians and hospitalized
Abyssinians. However, affected and healthy Abyssinian cats could not reliably be
distinguished on the basis of SAA concentration because of the wide range of SAA
values in these 2 groups of cats [DiBartola et al, 1989].
b) INFECTION
b.1) Mycoplasma
Haemotropic mycoplasmas are small, unculturable, pleomorphic and gram-negative
bacteria which parasitise red blood cells to survive. Haemotropic mycoplasmosis
causes what is commonly known as “Feline Infectious Anaemia”. Mycoplasma
haemofelis (Mhf), previously known as “Ohio strain”, is the most pathogenic
organism and causes anaemia in immunocompetent animals. On the other hand,
Candidatus Mycoplasma haemominutum (CMhm), known as “California strain”
before, and Candidatus Mycoplasma turicensis do not cause anaemia unless
concurrent disease or immunosuppression is present [Hagiwara, 2009 and Korman
et al. 2012].
The APR to experimental infection with haemotropic mycoplasmas (Mhf and CMhm)
was characterized in a collaborative study in 2012. Three acute phase proteins were
measured in feline serum: SAA, AGP and Hp [Korman et al. 2012].

39
SAA was significantly elevated during both Mhf and CMhm infections. Peak
concentrations were reached on days 16-23 post infection (pi). Mhf was associated
with significantly higher SAA concentrations than CMhm infection, consistent with
Mhf being more pathogenic. SAA levels usually returned close to pre-infection values
by day 44 pi consistent with a self-limiting APR, despite sustained circulating
haemoplasma copy numbers. This finding indicates than an elevated SAA
concentration suggests acute (less than 44 days post-exposure) rather than chronic
infection. Increases in SAA mirrored the development of anaemia.
b.2) Bordetella bronchiseptica
A Japanese group inoculated Bordetella bronchiseptica into the bronchi of 6 healthy
cats and measured both AGP and SAA. Although no signs of bronchopneumonia were
observed on physical examination, both APP were slightly increased after
inoculation. SAA peak serum concentrations were observed sooner when compared
to AGP in infected animals [Shida et al. 2012].
b.3) Feline infectious peritonitis
Concentration of SAA, AGP and Hp were studied in cats exposed to Feline
Coronavirus (FCoV) and cats that developed Feline Infectious Peritonitis (FIP). Cats
were recruited (n=67) and allocated in 3 groups: 24 cats were classified as controls
or “specific pathogen free”, 11 were FCoV-exposed (without clinical signs) and 32
suffered from FIP (25 “wet” and 7 “dry” form). SAA was measured in 64 samples
from 50 animals. Mean SAA concentration in controls was 10.21 ± 8.32 µg/ml, 7.92
± 7.12 µg/ml for FCoV-exposed and 82.22 ± 50.23 µg/ml for FIP cats. The highest
SAA concentration was found in FIP cats. Results from cats with wet FIP did not differ
from those with dry FIP patients. Compared to controls, a 10-fold increase of SAA
was detectable in affected cats. Repeated samplings from FIP and FCoV-exposed
cats showed that when FIP appeared in the group, all cats had increased SAA, AGP
and Hp levels. This increase was persistent in FIP cats whilst it was transient in the
FCoV-exposed cats. These results concluded that SAA might also be a marker of FIP
and highlighted its possible role in the diagnosis and monitoring of the disease
[Giordano et al. 2004].
b.4) Chlamydiae
Both SAA and AGP have been determined in cats subclinically infected with
Chlamydiae. Sixty two cats were recruited and SAA concentrations were assessed in

40
54 individuals. SAA concentrations were above the reference range in 16 cats (30%).
SAA concentrations were higher in subclinical shedders than they were in cats that
did not shed Chlamydiae [Holst et al. 2011].
b.5) Retrovirus and interferon- ω therapy
A collaborative study, involving researchers from Portugal, United Kingdom and
France assessed the ability of recombinant feline interferon-ω to produce a
stimulation of innate host defence system in cats. To quantify this response, changes
in the concentrations of SAA, AGP and CRP in naturally infected retroviral positive
cats were determined. Sixteen cats were recruited and divided in 3 groups: FIV
positive cats (n=7), FeLV positive cats (n=6) and co-infected animals (n=3). All the
animals received 3 cycles of injections. For SAA, all the cats behaved similarly. A
significant increase of SAA concentration was observed after therapy. On day 65,
mean SAA concentration was 1.6 times higher than day 0, proving the effectiveness
of this immune therapy [Leal et al. 2014].
c) PANCREATITIS
SAA concentrations were monitored over an 831-day period in a cat with
pancreatitis. SAA levels were increased at the onset of the disease. Long term
monitoring from days 68 to 831 revealed a good correlation between SAA
concentrations and the relapse of clinical signs in the cat. It was suggested that SAA
might be a useful tool for monitoring the disease and its response to treatment
[Tamamoto et al. 2009].
d) INFLAMMATORY MARKER: SURGERY & VARIOUS DISEASES
A Japanese team analyzed concentrations of SAA in sera from clinically normal cats,
hospitalized cats, cats with experimentally induced inflammation and cats that
underwent urinary surgery. Concentrations of SAA were significantly higher in
hospitalized cats than in normal cats. Cats with experimentally induced
inflammation received an intramuscular injection of turpentine oil or
lipopolysaccharide of Escherichia coli (LPS). Concentrations of SAA began to increase
8h after injection and reached peak values 36-48h after administration. In view of
these results, SAA was considered a responsive protein in the early stage of the acute
phase reaction in cats [Kajikawa et al. 1999].

41
In 2003, another Japanese group determined SAA concentrations in 3 healthy cats
undergoing ovariohysterectomy before and after surgery. The concentrations of SAA
were found to increase at approximately 3-6hr and reached peak values at 21-24hr
after surgery. These results suggested that SAA reacts rapidly to inflammatory
stimuli and can be a useful marker of inflammation. This group also compared SAA
concentrations from normal healthy cats (n=45) and cats with various diseases
(n=312). The concentrations from normal cats were statistically different from the
diseased cats (P<0.001). It was concluded that SAA could be a useful marker for
some, but not for all diseases [Sasaki et al. 2003].
SAA has been also measured in cats having experimental surgeries. That study
included 11 healthy subjects that had ovariohysterectomy (n=5) or gastrotomy (n=6).
Peak concentrations of SAA after the procedures were 4.8 to 26.8 times higher for
neutering and 11.5 to 23.4 times higher for gastrotomy in comparison with pre-
treatment concentrations. These peak serum concentrations were observed at 1 or
2 days after surgical treatment and SAA was undetectable after 5 days post-surgery
in most of the cats. [Shida et al. 2012].
Finally, in a recent report APP concentrations (SAA, AGP and Hp) were compared
between “sick” and “healthy” cats (based on clinical history and clinical signs). APP
were measured in 67 cats (33 were sick and 34 were healthy) and haematology and
biochemistry results were available from 15 sick cats. Log transformed serum
amyloid A was found to be higher in sick, older and female cats. Median SAA
concentration in healthy individuals (n=34) was 1.2µg/mL (range: 0.1-12.7) whereas
median SAA concentration in sick cats (n=32) was 2.1µg/mL (range: 0.4-124.8) [Kann
et al. 2012].
e) PROGNOSTIC MARKER
The relationship between SAA concentration and prognosis in cats has been recently
evaluated. 175 Cats were recruited and divided into 2 groups according to their SAA
concentration. Median survival time of the non-elevated SAA group was 571 days
compared with 72 days for the elevated SAA group. The animals were further
subclassified according to diagnostic category: neoplasia (n=65), inflammatory
(n=64) and other diseases (n=46). There was no difference in the distribution of
disease type between non-elevated SAA and elevated SAA groups (P=0.106).

42
According to these results, SAA was considered as a significant and independent
prognostic marker in cats with a wide variety of diseases [Tamamoto et al. 2013].
1.3.2 α₁-ACID GLYCOPROTEIN (AGP)
Human AGP was first described in 1950. AGP is mainly secreted by hepatocytes
although extra-hepatic synthesis exists in several tissues such as breast epithelial
cells [Gendler, 1982], placenta [Thomas, 1989], endothelial cells [Sörensson,
1999], granulocytes and monocytes [Shibata, 1984; Fournier, 1999]. Although its
exact biological function remains obscure, AGP has been shown to inhibit several
activities of the neutrophils, down-regulating the local inflammatory response. It
also seems to inhibit platelet aggregation, enhance the cytokine secretion from
monocytes and interacts with endothelium leading to changes in its permeability
[Hochepied, 2003].
Most of the studies on feline AGP have focused on infectious diseases, with a
particular interest in FIP.
a) INFECTIOUS DISEASES
a.1) Feline infectious peritonitis
FIP is mainly a disease of domestic cats although it has been recognized in several
wild feline species as lion, leopard, cheetah, jaguar, lynx, serval, caracal, European
wild cat, Sand cat and Pallas cat [Colby and Low, 1970; Colly, 1973; Poelma et al.
1974; Theobald, 1978; Tuch et al. 1974; Pedersen, 1983; Pfeifer et al. 1983;
Watt et al. 1993 and Juan-Sallés et al. 1998].
Currently, there is no effective treatment for FIP and mortality is extremely high
once clinical signs appear. Some cats live with the disease for weeks, months or,
rarely, years [Pedersen, 2014].
A definitive ante-mortem diagnosis of FIP can be challenging [Pedersen, 2014]. The
presence of effusion in the abdomen or, less frequently, in the pleural space is one
of the most diagnostic features of the effusive (wet) form of FIP [Pedersen, 2014].
Measuring coronavirus antibody titers in serum or plasma is still controversial. FIP
virus (FIPV) is a mutation in feline enteric coronavirus (FECV). FECV and FIPV are
virtually identical and thus evoke the same antibody responses. Titers higher than
1:3200 are highly suggestive of FIP [Hartmann et al. 2003].

43
AGP has been extensively used as a test for FIP. High levels of AGP in cats with
experimentally induced FIP were first described in 1988 [Stoddart, 1988]. Later on,
AGP and Hp were studied in view to distinguish between healthy cats, cats with
naturally occurring FIP, cats with similar signs to FIP but negative diagnosis on
histopathological examination and FIV cats. Although both were significantly higher
in FIP animals, only AGP was useful to distinguish between groups. FIV cats had
significantly elevated AGP and Hp levels too, illustrating they are not pathognomonic
for FIP. AGP was thought to be of considerable value in the diagnosis of FIP,
particularly in conjunction with the clinical signs, antibody titer and
albumin:globulin ratio [Duthie et al. 1997]. More recently, it has been
demonstrated that three different APP (SAA, AGP and Hp) are increased in cats with
FIP. Importantly, those cats exposed to FCoV but asymptomatic had a transient
increase in APP concentration in contrast to FIP subjects, which experienced
persistent elevation [Giordano et al. 2004].
A recent study has focused on the value of AGP to differentiate symptomatic FIP
from non-FIP cats. The non FIP cats were subdivided into 5 categories: inflammatory
processes other than FIP (n=26), asymptomatic FCoV infection (n=49), injection site
sarcoma (n=19), post-vaccination (n=7) and clinically healthy cats (n=3). AGP was
higher in animals with symptomatic FIP than in the whole non-FIP group. In addition
AGP was higher in FIP animals than in each subcategory of the non-FIP group (P=0.01)
[Paltrinieri et al, 2007a].
a.2) Chlamydia
Controversial information has been published regarding AGP concentrations in cats
infected with Chlamydiae. In one experimental infection study all the cats with
conjunctivitis demonstrated a febrile response accompanied by elevations of AGP
[TerWee et al. 1998]. In another study of infected cats only 9/57 cats had AGP
concentrations above the reference range [Holst et al. 2011].
a.3) Retrovirus and interferon- ω therapy
The effect of recombinant interferon-ω therapy in naturally retroviral infected cats
has been recently investigated. Along with SAA and CRP, AGP levels were measured
at day 0, 20, 30 and day 65 of treatment. There was an overall increase of AGP
concentrations from day 0 to day 65. As APP increased during interferon therapy,
44
this treatment may actually modulate pro-inflammatory innate mechanisms in cats
[Leal et al. 2014].
b) NEOPLASTIC DISEASE
b.1) Lymphoma
AGP concentrations were measured in 25 healthy cats and 9 cats with lymphoma
prior to induction of chemotherapy, one week after induction, at complete
response, and at monthly intervals. The cats with lymphoma had increased AGP
concentrations however, in contrast to the human literature, AGP was not correlated
with either remission duration or survival time in cats [Correa et al. 2001].
b.2) Carcinomas, sarcomas and round cell tumours
In a further study that included 97 tumor-bearing and 51 healthy cats, mean AGP
concentrations were significantly higher (P=0.0051) for tumor-bearing cats than for
healthy controls. Importantly, the range of serum AGP concentrations for tumour-
bearing cats completely included that of the healthy population. The overlap
between AGP values from patients with neoplasia and those from healthy individuals
makes AGP a limited tool for monitoring the presence and progression of malignant
disease in the cat [Selting et al. 2000].
c) ANAEMIA SECONDARY TO INFLAMMATORY DISEASE
A German group characterized the possible pathogenic mechanisms causing anaemia
secondary to inflammatory disease (AID) in 21 cats with naturally occurring
inflammatory diseases in 2006. The study included 12 cats with abscesses, 6 with
pyothorax and 3 with fat necrosis (secondary to trauma or surgery). The
concentrations of AGP were increased in 14 out of 14 cats examined (range: 0.6-2.3
g/L, median: 1.2 g/L and normal reference range: 0.1-0.48 g/L). Concentrations of
AGP were increased up to 12 days after draining the abscesses. Increased
concentrations of APP in conjunction with leukocytosis and clinical signs were
indicative of the inflammatory processes in this population of cats [Ottenjann et al.
2006].
d) SURGERY, INDUCED INFLAMMATION AND HOSPITALIZATION
In Kajikawa´s study there was no significant difference in APP concentrations
between male or female cats. Concentrations of AGP in sera from hospitalized cats
were much higher than in clinically normal cats. AGP levels increased in cats with
experimentally induced inflammation (turpentine oil or E. coli LPS injection) and
45
those that underwent urinary surgery. The mean concentration of the APP reached
a maximum 48 hours after injection. A correlation between AGP and SAA was
detected although SAA was found to increase earliest [Kajikawa et al. 1999].
e) OTHER CONDITIONS
Kann et al. measured AGP in 67 cats. Sick cats (animals with a wide and unknown
spectrum of clinical disorders) had higher AGP concentrations than healthy
individuals. An interaction between health status (sick/healthy) and gender was
significant at P<0.05. AGP was correlated with SAA and Hp. The largest correlation
was found between Hp and AGP, followed by SAA and AGP [Kann et al. 2012].
1.3.3 Haptoglobin
Hp is a 54 kDa protein, which was firstly discovered, by Polonovski and Jayle in 1938
[Quaye, 2008 and Adams et al. 2013]. Hp gene is expressed primarily in
hepatocytes, however, it has been recently described in other locations such as
adipose tissue, ovary, lungs, testis, arteries and placenta [Kalmovarin et al. 1991,
Friedrichs et al. 1995 and Yang et al. 1995]. Hp has a pronounced antioxidant and
anti-inflammatory action, preventing the deleterious effects associated with
circulating free haemoglobin (Hb). In addition, Hp actively participates in
polymorphonuclear leukocytes recruitment, free radical quenching, tissue repair
and regeneration. Reduced expression (hypohaptoglobinaemia) or absence of the Hp
protein (ahaptoglobinaemia) is associated with allergic (skin and lungs) and
anaphylactic transfusion reactions [Shimada et al. 2002, Gilstad, 2003 and Larsen
et al. 2006].
a) ANAEMIA SECONDARY TO INFLAMMATORY DISEASE
Hp levels have been determined in cats with AID. Haptoglobin was increased in 13
out of 14 cats examined (range: 5.3-13 g/L, median: 8.8 g/L and reference range:
0.04-3.84 g/L). The Hp concentration showed an inverse correlation to the number
of aggregated reticulocytes [Ottenjann et al. 2006].
b) SURGERY, INDUCED INFLAMMATION AND HOSPITALIZATION
Similar to what was found with SAA and AGP, Kajikawa et al could not identify
differences between males and females in both healthy and diseased cats regarding
Hp concentrations. Hospitalized cats had higher Hp concentrations than clinically
normal cats. Hp was also elevated before surgery or turpentine oil administrations

46
in those cats that were kept in small boxes. Hp levels increased after surgery and
turpentine oil injection. SAA, AGP and Hp were considered acute phase reactants in
feline patients [Kajikawa et al. 1999].
c) FIP AND FIV
AGP and Hp have been analyzed in healthy cats, cats with naturally occurring FIP,
cats with similar signs to FIP but negative diagnosis on histopathological examination
and FIV cats. Both APP were significantly higher in FIP animals however, only AGP
was useful to distinguish between groups. FIV cats had significantly elevated AGP
and Hp levels too, illustrating that these APP are not specific for FIP [Duthie et al,
1997].
SAA, AGP and Hp were evaluated in cats exposed to FCoV and cats that developed
FIP. The study included 24 controls, 11 FCoV-exposed and 32 FIP cats. FIP cats had
the highest Hp concentrations [Giordano et al. 2004].
d) OTHER CONDITIONS
Haptoglobin concentrations were measured in 40 cats, comparing levels from
healthy individuals to cats with a wide variety of diseases (“sick group”). Similar to
SAA and AGP results, higher Hp concentrations were detected in sick cats compared
to healthy subjects. An association between Hp levels and gender was present.
Finally, correlation between different APP was studied and Hp and AGP showed the
strongest correlation [Kann et al. 2012].
1.3.4 C-Reactive protein
CRP was the first acute phase protein described. William S. Tillet and Thomas Francis
discovered this reactant in 1930, studying the serum of patients with pneumococcal
pneumonia [Tillet and Francis, 1930]. Plasma CRP is mainly produced and degraded
by hepatocytes and its plasma half-life is about 19 hours [Ablij and Meinders, 2002;
Pepys and Hirschfield, 2003]. Alternative generation sites have been found such as
brain neurons in patients with Alzheimer´s disease [Yasojima et al. 2000],
peripheral lymphocytes [Kuta et al. 1986] and within atherosclerotic plaques
[Torzewski et al. 1998]. The main biologic function of CRP is determined by its
ability to recognize pathogens and damaged cells of the host and to mediate their
elimination by recruiting the complement system and phagocytic cells [Volanakis,
2001]. CRP has been shown to be an independent predictor of future cardiovascular

47
events (myocardial infarction, stroke, peripheral arterial disease and sudden cardiac
death) in multiple prospective epidemiological studies in human patients [Ridker,
2003]. Prospective data also demonstrated that CRP is a stronger predictor of risk
of cardiovascular events than is low-density lipoprotein cholesterol and it is also
known as a marker of atherothrombotic disease [Ridker et al. 2002]. The excellent
correlation of circulating CRP concentrations with the severity, extent, and
progression of many different pathologies, and the prognostic significance of these
associations, are consistent with CRP not just being a marker of disease but also
contributing to pathogenesis [Pepys and Hirschfield, 2003]. CRP is considered a
major acute phase protein in humans, dogs and non-human primates [Cray et al.
2009].
a) SURGERY, INDUCED INFLAMMATION AND HOSPITALIZATION
Kajikawa et al. introduced the concept that CRP is not a highly responsive protein
in the acute response in the cat. In that study, CRP concentrations were increased
in cats kept in small boxes before surgery or turpentine oil/LPS injection (as were
SAA, AGP and Hp). CRP started to increase 8h after injection, similar to SAA and AGP
but earlier than Hp, which increased from 24h after administration. Most of the APP
reached the maximum level at 48 hours but when the magnitude of increase was
compared, it was greater in SAA, AGP and Hp than CRP. Median SAA concentration
before injection was 29.1 ±15.1 µg/ml whereas SAA levels 48h after injection were
118.4 ±3.5. Similarly, AGP before administering the oil was 556.7 ±77.4 µg/ml and
3179.4 ±227.6 48h after. In contrast, median CRP concentrations before the
procedure was 204.1 ±35.9 µg/ml and slightly increased to 269.6 ± 81.6 µg/ml 48
hours later. Comparable findings were obtained for cats undergoing urinary surgical
procedures. As a result, CRP has been considered an insensitive protein in the acute
phase reaction in the cat since 1999 [Kajikawa et al. 1999].
b) RETROVIRUS INFECTION AND INTERFERON-ω THERAPY
Recently, a new report has been published assessing the effect of interferon-ω
therapy in the immune response of cats naturally infected with retrovirus. All the
acute phase proteins significantly increased in cats undergoing this therapy. From
the beginning (day 0) until the end of treatment (day 65), a significant increase of
CRP concentrations was noted. Despite not being considered a useful biomarker of
48
inflammation in cats for years, this study showed that this APP behaves similarly to
SAA and AGP [Leal et al. 2014].
1.3.5. Inflammation in feline cardiomyopathies
Replacement fibrosis is a common histopathological hallmark of feline CM. The gross
and histologic changes associated with end-stage hypertrophic cardiomyopathy (ES-
HCM) in cats have been described previously [Cesta el al, 2005]. The most common
findings were myofibre disarray, extensive multifocal areas of fibrosis and thickened
coronary arteries. The most severely affected cat had a markedly dilated left atrium
with intra-auricular thrombi on gross inspection of the heart. Histologic examination
showed areas of oedema and fibrosis surrounding islands of necrotic myocytes
(myocardial infarctions). Interestingly, scattered lymphocytes, plasma cells and
macrophages infiltrated the areas of fibrosis around the infarcts
The underlying cause of restrictive cardiomyopathy (RCM) in cats remains unknown.
It has been hypothesized that it could be secondary to hypereosinophilic syndrome
[Fox,2004]. However there is not an adequate body of evidence in veterinary
medicine and eosinophils are rarely seen in feline myocardium.
A second hypothesis considers viral induced or an immune mediated pathway [Fox,
2004]. Feline Panleukopenia (Feline Parvovirus) virus genome has been isolated in
cats with cardiomyopathy [Meurs et al. 2000]. Myocardial inflammatory infiltrates
including neutrophils and lymphocytes were detected in 55% of the cats with HCM,
and both myocarditis and panleukopenia virus genome were identified in 11% of the
hearts in that study. It is suggested that, as the virus affects cells undergoing rapid
mitosis, myocardial infections might be expected to occur soon after birth. Cats that
survive the viral myocarditis might later develop cardiomyopathy. Myocarditis might
contribute somehow to development and progression of feline cardiomyopathies.
Cats with endomyocarditis (ECM) show varying degrees of inflammation. Histologic
findings were compared between 37 cats with ECM and 35 with RCM. In the ECM
cats, 26 of the 37 exhibited predominantly neutrophil and macrophage infiltrates.
Lymphocytes and plasma cells were present only in two cats and another two
individuals had mixed inflammatory infiltrates. In contrast, RCM cases had marked
left ventricular endocardial fibrosis without inflammation. However, small numbers
49
of lymphocytes were seen in 2 cats and neutrophils were visualized in one subject
[Stalis et al. 1995].
Two forms of RCM have been identified: myocardial RCM and endomyocardial RCM.
The latter is known as endomyocardial fibrosis (EMF). Although the main feature
identified is extreme endocardial thickening, in some cases there is distinct
endomyocarditis. Endomyocardial infiltrates are usually mononuclear cells and
macrophages with occasional neutrophils [Fox, 2004].
1.3.6. Inflammation in human HCM
Cardiac histopathology, inflammatory cytokines, high sensitivity C-reactive protein
(hsCRP) and cardiac phenotype using MRI have been employed to investigate the role
of inflammation in the phenotypic expression of myocardial fibrosis in human HCM
[Kuusisto et al, 2012].
In that study, endomyocardial biopsies were taken by fluoroscopic guidance from
the right ventricle and from the interventricular septum. Interstitial and
perivascular fibrosis was found in about 90% of cases. Inflammatory cell infiltration,
including mononuclear inflammatory cells and eosinophilic granulocytes, was found
in 37% of the patients. The degree of histopathological myocardial fibrosis
significantly correlated with late gadolinium enhancement (LGE) in cardiac magnetic
resonance (cMRI). A high intensity signal is seen when extracellular matrix is
expanded because it retains the gadolinium. The grade of myocardial inflammatory
cell infiltration correlated with fibrosis in histopathological samples (P=0.034) and
with LGE in cMRI. Furthermore, circulating levels of hsCRP, IL-1β, IL-1RA, IL-6 and
IL-10 were significantly higher in patients with HCM than in control subjects.
Importantly, levels of hsCRP were significantly associated with histopathological
myocardial fibrosis (p<0.05). All the other cytokine levels tended to be higher in
patients with moderate or marked histopathological findings compared with those
with no or mild findings.
This study demonstrated that a low-grade myocardial and general inflammation
response is present in human HCM. It is suggested that myocardial fibrosis in HCM
may be an active process modified by an inflammatory response.
The following pathogenic mechanism for myocardial fibrosis formation in HCM was
proposed: the primary injury (mechanical stress due to disorganized cellular

50
architecture, myocardial ischaemia or neuroendocrinological activation) induces NF-
ĸβ up-regulation in the myocardium. NF-ĸβ, in turn, activates production of pro-
inflammatory cytokines, inflammatory cell invasion into the myocardium and
activation of fibroblasts, finally leading to myocardial fibrosis.
Feline and canine models of HCM share the same histopathological findings with
human patients with HCM [Liu et al. 1993]. The 4 morphologic hallmarks
(asymmetric patterns of wall thickening, disorganization of cardiac muscle cells,
abnormal intramural coronary arteries and myocardial fibrosis) are present in
human, canine and feline hearts although the frequency of these differs
substantially among species (e.g. myocyte disorganization or asymmetric patterns
are more common in humans than in dogs or cats).
The CTnI test was initially designed for early diagnosis of MI in human patients.
However, several factors influence cTnI release and measurements. Despite the
increasing number of publications studying cTnI in small animals, many conflicting
results have been reported. Consequently, veterinary clinicians struggle to interpret
the test correctly. After a critical approach to literature review, the main goal of
the two retrospectives studies was to investigate the relationship between cTnI and
survival in dogs and cats taking into account every limiting and confounding factor
described in previous publicatons (e.g. lack of standardisation of cTnI assay systems
or increases of cTnI due to primary non-cardiac conditions). Furthermore, it has been
proven that humans who have HCM, experience both systemic and myocardial
inflammation. Histopathological similarities among human and cats with HCM exist
and myocardial inflammatory infiltrates are commonly found in both. To the
author´s knowledge, no previous reports addressing the presence of systemic
inflammatory response in cats with cardiac disease have been published. As a result,
the main purpose of the prospective study was to determine the characteristics of
the acute phase response in cats with a particular interest in the subset of cardiac
patients.
51
CHAPTER 2
Retrospective study in dogs
Serum cTnI and survival in canine cardiac diseases.
52
2.1 Aims and objectives
• to investigate the relationship between cTnI concentrations and survival in dogs
with cardiac disease.
• to clarify if cTnI concentrations were associated with cardiac death in the
individual patient.
• to assess the impact of age, gender, cardiac disease, presence of CHF and
arrhythmia on cTnI concentrations and survival in dogs with cardiac disease.
2.2 Material and methods
This was a retrospective study that included dogs admitted to the Small Animal
Hospital of the University of Glasgow between August 2009 and September 2012
which had cTnI measured. These animals were referred for further evaluation of
suspected cardiac abnormalities detected on thorough clinical examination or ECG.
Repeated samples from the same individual collected on different visits were
excluded for statistical purposes. If several measurements were available, only the
highest result was included in the analysis. After reviewing the clinical histories,
only dogs with cardiac disease were included. No controls were recruited for this
study.
2.2.1 ANIMALS
Dogs were eligible for inclusion where there was evidence of cardiac disease on
physical examination and/or echocardiographic examination. All subjects were
examined and scanned by a single experienced cardiologist (Dr. Paul Wotton). Dogs
with a haematocrit below 37%, creatinine >155µmol/L in the absence of diuretic
therapy, persistent systolic arterial blood pressure >180mmHg or concurrent disease
(e.g. neoplasia or trauma) were excluded.
2.2.2 CARDIAC BIOMARKER
Samples were collected by jugular venipuncture and placed in plain serum tubes,
which were allowed to clot and sent immediately for analysis on the same day.
Cardiac troponin I was tested with an “Immulite® 2000 Troponin I” (Siemens)
analyzer. The lower detection limit of the assay is 0.1ng/ml and the normal
reference range for dogs is cTnI <0.16ng/ml.
2.2.3 CLINICAL OUTCOME
Survival times were calculated from the date of sampling to the date of death or
euthanasia. The outcome was obtained either from the electronic records of the

53
primary clinicians or by contacting owners or referring practitioners by telephone.
Animals that were euthanized or died from non-cardiac conditions were excluded
from the study.
2.2.4 CHF, ARRHYTHMIAS AND TYPE OF CARDIAC DISEASE.
Dogs were further divided into subgroups based on the absence or presence of CHF.
CHF was determined by evaluation of clinical signs, thoracic radiographs and
ultrasonography (pulmonary oedema, pleural effusion or ascites). Dogs were also
divided into subgroups based on the presence or absence of arrhythmia on ECG. The
heart rhythm was further characterized using a subjective severity scale. Finally,
dogs were divided into six categories dependent on their final diagnosis considering
clinical records, echocardiographic examinations, radiographs, ECG and fluid
analysis. These categories included valvular disease, cardiomyopathy, cardiac
neoplasia, congenital disease, idiopathic pericardial effusion, and rhythm
disturbances in the absence of structural cardiac disease.
2.2.5 STATISTICAL ANALYSIS
Statistically analyses were performed using commercially available software. Data
were non-normally distributed and results were compared using the Mann-Whitney
U-test and graphically assessed with box-plots graphs. Median and ranges were used
to provide descriptive statistics.Survival was analyzed using Kaplan Meier curves.
ROC curves were created to assess the prognostic capability of cTnI and to identify
the most useful cut-offs to predict cardiac death. Regression analysis was performed
to identify if the cTnI results could have been influenced by confounding factors
such as age, breed or type of disease. Statistical significance was defined as P <0.05.
2.3 Results
2.3.1 STUDY POPULATION
After the analysis of clinical histories, ninety-four dogs with a wide variety of cardiac
diseases were finally included. Of these, 39 were intact males, 23 male neutered,
22 female neutered and 10 were intact females. The median age of the population
was 8 years old (range: 3 months-14 years). Retrievers were overrepresented, with
Labrador the most common breed (Labrador n=16, Golden Retriever n=2, Retriever
n=2). Other common breeds included in this study were Boxer (n=7), Spaniels
(Cavalier King Charles n=6, Cocker n=5, Springer n=2), Terriers (West Highland White

54
n=2, Border n=1, Bull n=1, Terrier n=1), Newfoundland (n=5), Doberman (n=4), Great
Dane (n=4), German Shepherd (n=3) and Dogue de Bordeaux (n=3). There were 2
dogs each of the following breeds: Deerhound, Rhodesian Ridgeback, Weimaraner,
Bulldog and Poodle; there was 1 dog each of the following breeds: Vizla, Saint
Bernard, Jack Russell, Husky, Alaskan Malamute, Pointer and Collie. Finally, 9 cross-
breed dogs were also recruited. Arrhythmia alone was the most common finding on
cardiac auscultation of this population of dogs (n=32) whilst murmurs were audible
in 26 dogs, combinations of murmur and arrhythmias were detected in 24 subjects,
four dogs presented with muffled heart sounds and eight individuals had normal
cardiac auscultations. Forty two dogs presented with respiratory signs (cough,
dyspnoea or tachypnea) and 23 had suffered collapsing episodes. Of these 23, 15 had
arrhythmias whereas 8 had sinus rhythm. CHF was diagnosed in 32 dogs of the study
group.
Fifty-six dogs were presented with arrhythmias; auscultation in 32 dogs revealed an
arrhythmia alone whereas 24 dogs were presented with a combination of arrhythmia
and a murmur. Of these, there were 52 dogs with tachyarrhythmias and 4 with
bradyarrhythmias. Supraventricular arrhythmias were more prevalent and atrial
fibrillation was the most commonly diagnosed. Tables 2.1 and 2.2 summarize the
rhythm alterations identified in dogs of this study population. There were 38 dogs
that had no rhythm disturbances detected.
VENTRICULAR Number of dogs
VPCs 11
AIVR 1
V. tachycardia 8
VPCs+ SPVCs 4
SUPRAVENTRICULAR Number of dogs
Sinus tachycardia 1
Sinus tachy. + ectopics 3
SPVCs 4
SPV tachycardia 4
SPV tach + block 1
Atrial Fibrillation 12
Atrial Fib + ectopics 3
SUPRAVENTRICULAR Number of dogs
3rd degree AV block 2
Sick Sinus Syndrome 2
TABLE 2.1. Tachyarrhythmias in dogs with cardiac
disease.
TABLE 2.2. Bradyarrhythmias in dogs with cardiac
disease.
**SPVCs, Supraventricular premature complexes; AIVR, accelerated idioventricular rhythm;
VPCs, ventricular premature complexes

55
The heart rhythm was further characterized using a subjective severity scale. In this
classification system 0 represented the absence of rhythm disturbances, 1 was used
for mild, 2 for moderate and 3 was used for severe arrhythmias. In those animals
with multiple rhythm disturbances (e.g. atrial fibrillation and ventricular premature
complexes), the final severity score was obtained by adding 1 point to the score
given to most severe arrhythmia present (e.g. slow atrial fibrillation (score =2) with
premature ventricular complexes: final score = 3). There were 38 dogs in group 0
(no rhythm disturbances), 17 in group 1, 21 in group 2 and 18 dogs in group 3. The
arrhythmia severity score system is included in table 2.3.
ARRHYTHMIA SEVERITY SCORE SYSTEM
SCORE Rhythm Number of
dogs (n)
O = None Sinus /Sinus arrhythmia 38
1 = Mild (n=17)
Bradyarrhythmia SUPRAVENTRICULAR Sick sinus rhythm 2
Tachyarrhythmia
SUPRAVENTRICULAR
Sinus tachycardia 1 Slow SPV tachycardia
(<160 bpm) 3
SPVCs 4 VENTRICULAR AIVR 1
Single/Sporadic/Uniform VPCs
6
2= Moderate (n=21)
Bradyarrhythmia SUPRAVENTRICULAR 3rd AV BLOCK 2
Tachyarrhythmia
SUPRAVENTRICULAR
Fast SPV tachy (>160 bpm)
1
Slow Atrial Fibrillation (<160 bpm)
7
VENTRICULAR Frequent/Runs/Multiform VPCs
5
COMBINATIONS
VPCs+SPVCs 3 Sinus tachycardia + SPVCs 2 Sinus tachycardia + VPCs 1
3= Severe (n=18)
Tachyarrhythmia
SUPRAVENTRICULAR Fast Atrial Fibrillation (>160 bpm)
5
VENTRICULAR Ventricular tachycardia 8
COMBINATIONS
Pairs/triplets VPCs + SVPCs
1
Atrial fib + VPCs 3 Fast SPV tachy + AV block 1
Finally, dogs were classified depending on their final diagnosis in 6 different groups
of disease. There were 29 dogs with MVD, 32 with cardiomyopathies, 8 with cardiac
TABLE 2.3. Arrhythmia Score System.
**SPV tachycardia, supraventricular tachycardia; SPVCs, Supraventricular premature
complexes; AIVR, accelerated idioventricular rhythm; VPCs, ventricular premature
complexes; AV block, atrio-ventricular block.
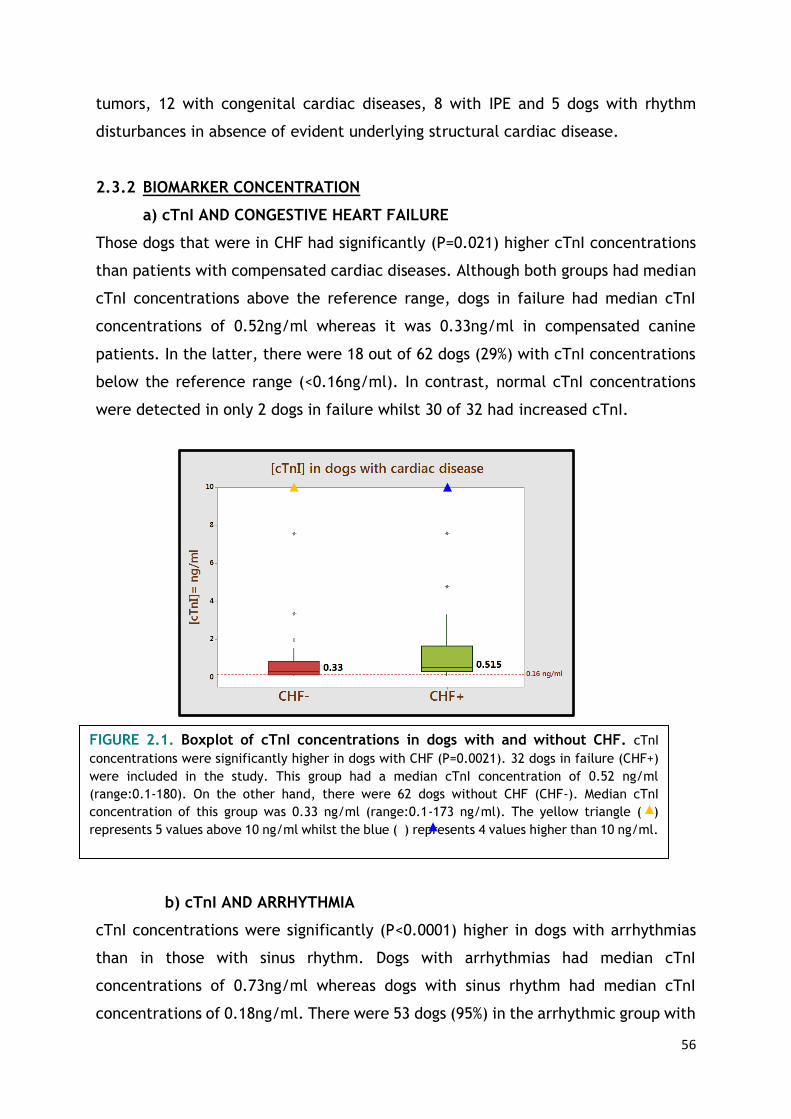
56
tumors, 12 with congenital cardiac diseases, 8 with IPE and 5 dogs with rhythm
disturbances in absence of evident underlying structural cardiac disease.
2.3.2 BIOMARKER CONCENTRATION
a) cTnI AND CONGESTIVE HEART FAILURE
Those dogs that were in CHF had significantly (P=0.021) higher cTnI concentrations
than patients with compensated cardiac diseases. Although both groups had median
cTnI concentrations above the reference range, dogs in failure had median cTnI
concentrations of 0.52ng/ml whereas it was 0.33ng/ml in compensated canine
patients. In the latter, there were 18 out of 62 dogs (29%) with cTnI concentrations
below the reference range (<0.16ng/ml). In contrast, normal cTnI concentrations
were detected in only 2 dogs in failure whilst 30 of 32 had increased cTnI.
b) cTnI AND ARRHYTHMIA
cTnI concentrations were significantly (P<0.0001) higher in dogs with arrhythmias
than in those with sinus rhythm. Dogs with arrhythmias had median cTnI
concentrations of 0.73ng/ml whereas dogs with sinus rhythm had median cTnI
concentrations of 0.18ng/ml. There were 53 dogs (95%) in the arrhythmic group with
FIGURE 2.1. Boxplot of cTnI concentrations in dogs with and without CHF. cTnI
concentrations were significantly higher in dogs with CHF (P=0.0021). 32 dogs in failure (CHF+)
were included in the study. This group had a median cTnI concentration of 0.52 ng/ml
(range:0.1-180). On the other hand, there were 62 dogs without CHF (CHF-). Median cTnI
concentration of this group was 0.33 ng/ml (range:0.1-173 ng/ml). The yellow triangle ( )
represents 5 values above 10 ng/ml whilst the blue ( ) represents 4 values higher than 10 ng/ml.

57
cTnI concentrations above the reference range and 3 individuals (5%) with cTnI
below 0.16ng/ml. These three patients with normal cTnI concentrations had single
atrial ectopics, regular junctional tachycardia (160 bpm) and sick sinus syndrome.
In contrast, 17 patients with sinus rhythm (45%) had cTnI concentrations <0.16ng/ml
whilst 21 (55%) had increased cTnI concentrations.
Dogs with severe arrhythmias (e.g. ventricular tachycardia and fast atrial
fibrillation) had significantly higher cTnI concentrations than dogs with sinus rhythm
(P=0.000) and those with mild (P=0.002) and moderate (P=0.012) arrhythmias. Dogs
with mild and moderate arrhythmias had significantly higher cTnI levels (P=0.015;
P=0.000) than subjects with sinus rhythm. However, no difference in cTnI
concentrations between dogs with mild and moderate arrhythmias was found
(P=0.218). Although all groups had median cTnI concentrations above the reference
range, animals with severe arrhythmias had median cTnI significantly high (median
cTnI=2.43ng/ml) in comparison with animals with moderate (median cTnI=
0.61ng/ml) and mild (median cTnI =0.42ng/ml)
FIGURE 2.2. Boxplot of cTnI concentrations in dogs with and without arrhythmias. Dogs
with arrhythmias had significantly higher cTnI concentratios than dogs with sinus rhythm
(P=0.0000). There were 38 dogs which presented without arrhythmias. Those had a median cTnI of
0.18 ng/ml ( range: 0.1-4.8 ng/ml).Whereas 56 dogs presented with rhythm disturbances. Those
had median cTnI of 0.73 ng/ml ( range: 0.1-180 ng/ml). The blue triangle ( ) represents 9 values
above 10 ng/ml

58
a) cTnI AND TYPE OF CARDIAC DISEASE
Dogs whose final diagnosis was cardiomyopathy had significantly higher cTnI
concentrations than dogs with acquired valvular disease (P=0.012), congenital
cardiac disease (P=0.002) and rhythm disturbances (P=0.028). There were no
differences between dogs with cardiomyopathy and those with cardiac tumours (P
=0.087) or those with idiopathic pericardial effusion (P=0.09). Moreover, those
patients with cardiac tumors had significantly (P=0.018) higher cTnI concentrations
than dogs with congenital cardiac disease. No differences between the other groups
were found.
Median cTnI concentrations were below the reference range only in those dogs with
congenital cardiac disease whereas it was 1.92ng/ml in dogs with cardiac tumors,
0.61ng/ml in those with cardiomyopathies, 0.37ng/ml in individuals with acquired
valvular disease, 0.25ng/ml in dogs with rhythm disturbances and 0.183ng/ml in
subjects with idiopathic pericardial effusion.
FIGURE 2.3. Boxplot of cTnI concentrations in dogs with mild, moderate and severe
arrhythmias. Dogs with mild arrhythmias (n=17) had a median cTnI concentration of 0.42 ng/ml
(range: 0.1-7.6 ng/ml) ; dogs with moderate arrhythmias (n=21) has a median cTnI of 0.61 ng/ml
and those with severe arrhythmia (n=18) had a median cTnI of 2.43 ng/ml. Dogs with severe
arrhythmias (e.g. ventricular tachycardia and fast atrial fibrillation) had significantly higher cTnI
concentrations than dogs with sinus rhythm (P=0.000) and those with mild (P=0.002) and
moderate (P=0.012) arrhythmias. The blue triangle ( ) represents 2 values above 70 ng/ml and
the red triangle ( ) represents 1 value above 70 ng/ml.

59
c) cTnI AND SURVIVAL
There were 39 dogs that were alive when survival information collection finished
(27th February 2014) whilst 55 dogs died before this date due to their cardiac disease.
Non-survivors had significantly (P=0.003) higher cTnI concentrations than those that
survived. Median cTnI concentration for non-survivors was 0.49ng/ml whereas it was
0.25ng/ml for survivors.
The correlation between cTnI levels and survival was further studied with Kaplan
Meier curves. In order to create the curve, dogs were divided in 2 groups: dogs with
increased cTnI concentrations (>0.16ng/ml) and dogs with non-elevated cTnI
concentrations (<0.16ng/ml). There were 74 and 20 dogs included in each category,
respectively. Dogs with increased cTnI concentrations had significantly shorter
survival times than those with cTnI within the reference range. Dog with increased
cTnI survived a median of 29 months whereas dogs with non-elevated cTnI
concentrations survived a median of 44 months.
The difference between the curves was quantified to assess statistical significance.
As the comparative analysis depends upon the whole curve and not upon isolated
points, Log-Rank test was the system of analysis of choice. Log-Rank test for the
FIGURE 2.4. Boxplot of cTnI concentrations in survivors and non-survivors. Non
survivors (n=55) had a median cTnI of 0.49 ng/ml ( range: 0.10-180 ng/ml) whereas survivors
(n=39) had median cTnI of 0.25 ng/ml ( range: 0.10-127 ng/ml). Non-survivors had
significantly higher cTnI concentrations than survivors (P = 0.003). The yellow triangle ( )
represents 2 values over 10 ng/ml and the blue triangle ( ) represents 7 values above 10
ng/ml

60
data in this retrospective study was P=0.006, thus these two curves were
significantly different. Consequently, the probability of survival of dogs with non-
elevated and elevated cTnI concentrations was significantly different. Survival times
were significantly shorter in those dogs with elevated cTnI concentrations.
The ability of the troponin test to predict cardiac mortality in dogs with primary
cardiac diseases was assessed with ROC curves. The AUC of the ROC curve was 0.69,
demonstrating the potential of cTnI testing to predict outcome in these patients.
However, the best cut-off for predicting cardiac death was cTnI >0.33ng/ml which
produced a sensitivity of 76% and a specificity of 65%, revealing that the test
produces considerable numbers of false positives and negatives.
d) DOGS WITH INCREASED cTnI AND PROLONGED SURVIVAL
Log-Rank
P=0.006
Wilcoxon
P= 0.007
0.0
00
.25
0.5
00
.75
1.0
0
Se
nsitiv
ity
0.00 0.25 0.50 0.75 1.001 - Specificity
Area under ROC curve = 0.6926
A
B
FIGURE 2.5. Kaplan Meier curve (A) and ROC curve (B) for cTnI and survival in dogs
with cardiac disease

61
There were 39 dogs that were alive in the end of study (February 2014). Of these,
13 had non-elevated cTnI concentrations whereas 26 survivors had elevated cTnI
(range: 127-0.18ng/ml). Last blood sample was collected in September 2012 thus
these patients survived 1.5 years despite having increased cTnI concentrations.
Further analysis of this subset of patients, revealed that median age was 8 years old,
median cTnI concentration was 0.38ng/ml (range: 127-0.18ng/ml), 15 dogs had
arrhythmias (4 dogs had 3-score arrhythmias, 5 had 2-score arrhythmias and 6 had 1
score-arrhythmias) and 5 had CHF. Regarding their final diagnosis, 12 dogs were
diagnosed with CM, 5 with acquired valvular disease, 4 with congenital disease, 3
had IPE and 2 had primary rhythm disturbances. cTnI concentrations and clinical
information from this group of patients are summarized in table 2.4.
Arrhythmias might play an important role in the release of cardiac troponin. The
review of data collected from dogs with non-cardiac diseases but increased cTnI
concentrations (higher than 1ng/ml) in the same study period, revealed that a high
proportion of these patients presented with arrhythmias. There were 16 out of 29
dogs with non-cardiac disease and cTnI >1ng/ml that presented with rhythm
disturbances. Tachyarrhythmias were also the most prevalent in this group of dogs.
cTnI concentrations and clinical data from this subset of patients are summarized in
table 2.5.
e) REGRESSION ANALYISIS
Univariable and multivariable regression analysis revealed that cTnI was not
associated with age or gender (P= 0.21, P=0.13). However, cTnI was associated with
the presence of arrhythmia (P=0.05) and CHF.

62
[cTnI] Age Breed Final
diagnosis CHF score Arrhythmia
Survival (years)
127 3 Weimaraner Occult DCM N 3 V.TACH 3
31.3 8 Doberman DCM N 3 bursts of VPCs (300
bpm) 2
7.58 10 Siberian Husky Tachycardia
induced CM
N 2 SUPRAVENTRICULAR TACHYCARDIA 300
bpm (atrial flutter?) 2
4.8 8 Labrador IPE Y 0 N (120 bpm) 4
1.98 1 Newfoundland Occult DCM N 1 VPCs 4
1.34 10 Crossbreed IPE N 0 N (100 bpm) 3
0.94 10 Labrador MVD N 1 VPCs 4
0.92 5 Boxer ARVC N 3 VPCs (pairs-triplets)
- APCs 3
0.92 11 Labrador DCM N 0 Sinus rhythm ECG
(arrhythmia on auscultation)
2
0.65 8 Dalmatian MVD N 1 VPCs 2
0.64 8 Doberman DCM N 3 V. TACH 2
0.47 7 Doberman Occult DCM N 0 N 3
0.41 12 Crossbreed MVD N 1 SVPCs 3
0.35 1 Alaskan
Malamute VSD N 0 N 1
0.31 5 Dogue de Burdeaux
DCM N 2 Atrial fibrillation (100-110 bpm)
3
0.31 9 Cocker Spaniel DCM Y 2 VPCs and SPV tachy. 2
0.31 6 Dogue de Burdeaux
DCM N 2 Atrial fibrillation (140-180 bpm)
2
0.27 10 Toy Poodle MVD, PH Y 0 N 3
0.25 10 Crossbreed SPV Tachy. N 1 SPV tachycardia and
AV disassociation (100 bpm)
2
0.25 11 Labrador MVD N 2 Atrial fibrillation
(130 bpm) 2
0.24 4 Boxer Aortic
stenosis N 0 N 2
0.24 8 Springer Spaniel
Sick sinus syndrome
N 1 Sick sinus syndrome 2
0.23 7 Cocker Spaniel DCM Y 0 N 3
0.216 2 Bulldog IPE Y 0 N 2
0.18 6 Boxer Aortic
stenosis N 0 N 3
0.18 6 Newfoundland Subaortic stenosis
N 0 N 2
TABLE 2.4. Dogs with cardiac disease, increased cTnI and prolonged survival.
**DCM, dilated cardiomyopathy; CM, cardiomyopathy; IPE, idiopathic pericardial effusion; MVD, mitral valve disease;
ARVC, arrhytyhmogenic right ventricular cardiomyopathy, VSD, ventricular septal defect; PH, pulmonary
hypertension; SPV tachycardia, supraventricular tachycardia; SPVCs, Supraventricular premature complexes; AIVR,
accelerated idioventricular rhythm; VPCs, ventricular premature complexes; AV block, atrio-ventricular block; AV-
disassociation, atrio-ventricular disassociation.

63
[cTnI] Age Final diagnosis Arrhythmia Dox. Hct Creat
Survival (days)
588 3 Pancreatitis/
peritonitis/Acute renal/ liver failure
V.TACH and RT phenomenon
NO 63.7 / 1
180 10 HSA - Spleen V.TACH NO 33.9 103 197
115 11 Anaemia
Thrombocytopaenia VPCs
(R-T phenom.) NO 14.7 163 0
68.6 7 HSA - splenic AIVR NO 16.9 78 888
63.5 8 Splenic mass Sinus tachy and multiform VPCs
NO 12.7 93 1055
24.2 9 Iliac thrombi -
Hypertension- renal disease
SPV tachy (250 bpm)
NO 64.2 228 5
16.2 1 SRMA NO NO 47 99 1246
14.2 9 HSA - skin NO YES 38.9 92 724
8.49 12 HSA- skin RBBB YES 38 127 54
8.21 6 Mediastinal lymphoma
NO NO 55 120 1
7.9 11 Insulinoma (Susp) NO NO 51.6 64 58
6.8 6 Cardiac contusion NO NO 20.5 / 372
6.4 12 Lung mass SPCVs ( VPCs in previous visits)
NO 61.4 92 138
6.27 7 Lymphoma NO NO 53.7 / 383
6.04 11 Splenic sarcoma VPCs NO 64.5 72 24
5.21 6 Lymphoma NO YES 35.9 64 139
4.35 1 Megaoesophagus/
Pneumonia / IM myositis
VPCs NO 47.4 111 16
3.8 7 Open (Lungs) NO NO 38.6 99 0
3.13 8 Haemoptysis and
dyspnoea UO 1st AV block -
VPCs NO 42.7 79 1
2.41 8 cruciate ligament
disease Sinus
tachycardia NO / 84 638
2.39 9 splenic HSA NO NO 38.1 123 24
1.77 8 IMHA NO NO / / 299
1.72 8 neutropenia
Borrelia+ NO NO 39.3 / 35
1.5 6 Multicentric lymphoma
NO YES 43.9 86 490
1.34 9 Brain neoplasm SPV tachycardia
(260 bpm) NO 46 93 0
1.3 11 Hypothyroidism and
CRF SPV tachy (300 bpm)
NO 34.3 / 552
1.22 8 Lymphoma VPCs YES 44.6 / 85
1.22 8 Lymphoma NO YES 36.3 126 27
1.2 10 Abdominal neoplasia Sinus tachy and
VPCs NO 30.1 102 0
TABLE 2.5. Unpublished data compiling clinical information from dogs with non-
cardiac diseases and cTnI concentrations higher than 1ng/ml.
64
2.4 Discussion
The results from this retrospective study confirmed there is an association between
cTnI and outcome in dogs with cardiac conditions. Patients with increased cTnI (cTnI
>0.16ng/ml) had a median survival time of 29 months whereas those dogs with
normal cTnI concentrations (cTnI <0.16ng/ml) had a median survival time of 44
months. Median cTnI concentration was 0.49ng/ml for non-survivors whilst it was
0.25ng/ml for survivors and this difference was statistically significant. However,
when the efficacy of the test was assessed with ROC curves (AUC = 0.69), low
specificity (65%) and sensitivity (76%) were obtained. Similar results were observed
in a report that included 202 dogs with MVD. The AUC of the ROC curve in that study
was 0.63 and, employing a cut-off of 0.025ng/ml, a sensitivity of 82% and a
specificity of 43% were produced [Hezzell et al. 2012]. The overlap of cTnI
concentrations between survivors and non-survivors and the resultant low prognostic
sensitivities and specificities have been also described in short- and long-term
survival studies in critically ill dogs with systemic inflammation [Langhorn et al.
2013 and 2014c]. Therefore, caution should be exercised as some animals escape
the rule of “higher cTnI concentrations = shorter survival times”. Cut-off
concentrations obtained with outcome predictive systems should not be used to
predict cardiac death in individual patients and decisions of euthanasia should not
be made based on cTnI results.
The association between cTnI concentrations and survival in dogs with cardiac
disease has barely been explored before. One study reported shorter survival times
with increased cTnI concentrations in dogs with cardiac disease. Patients with cTnI
concentrations between 0.151 and 1ng/ml had a median survival time of 24 months
whereas dogs with cTnI greater than 1ng/ml survived no longer than 3 months. Dogs
that survived more than 1 year, 2 years and 3 years had a median cTnI concentration
of 0.18ng/ml, 0.07ng/ml and 0.05ng/ml, respectively [Fonfara et al. 2010]. This
association between cTnI levels and outcome has been demonstrated in dogs with
cardiomyopathy and mitral valve disease in 3 additional studies. In the first, dogs
with cardiomyopathy and cTnI <0.20ng/ml survived 357 days whereas those patients
with cardiomyopathy and cTnI >0.20ng/ml had a median survival time of 112 days
[Oyama and Sisson, 2004]. In another report, cTnI was detectable in 6 out of 15
dogs with mitral valve disease (MVD) and congestive heart failure. In those, median

65
survival time was 68 days whereas those with undetectable cTnI levels (9/15)
survived for 390 days [Linklater et al. 2007]. Finally, cTnI was also associated with
decreased survival times for all-cause mortality in 202 dogs with naturally MVD.
However, cTnI was not found to be independently associated with survival in those
dogs that died or were euthanized because of cardiac disease [Hezzell et al. 2012].
In the present study, the presence of an arrhythmia was significantly associated with
higher cTnI concentrations. In dogs with arrhythmias (n=56) the median cTnI
concentration was 0.73ng/ml whereas in dogs in sinus rhythm this was 0.18ng/ml.
Moreover cTnI concentrations correlated with the severity of the arrhythmia. Dogs
with severe arrhythmias had significantly higher cTnI concentrations than those with
moderate or mild rhythm disturbances. In dogs with severe arrhythmias the median
cTnI concentration was 2.43ng/ml compared with 0.61ng/ml and 0.42ng/ml in
animals with moderate or mild rhythm abnormalities, respectively. Controversial
results have been published regarding the association between cTnI and arrhythmias
in dogs with cardiac conditions. cTnI concentrations correlated with VPC/24h and
the severity of arrhythmia in 20 boxers with and without ARVC [Baumwart et al.
2007]. In another study, which included 336 Doberman Pinschers, cTnI was able to
predict VPCs (AUC = 0.79/ SY = 71%/ SPY = 87%) but no significant linear association
between number of VPCs/24 hour and cTnI levels was found [Wess et al. 2010].
Arrhythmias were detected in 16 of 23 dogs (70%) with cTnI concentrations
>1.01ng/ml (the group with highest cTnI values in that study population) in another
report. Of these 16 dogs, seven were diagnosed with atrio-ventricular block, one
with sick sinus syndrome, four with ventricular tachycardia and 4 with ARVC
[Fonfara et al. 2010]. cTnI concentrations were significantly increased in 21
Doberman Pinchers, Great Danes and Boxers with ECG (1 or more ventricular
premature complexes during performance of 4 min ECG, n = 11) or echocardiographic
(n=20) evidence of occult cardiomyopathy [Oyama et al. 2007]. In contrast, no
difference in median cTnI concentrations was found between 26 dogs with
cardiomyopathy with and without arrhythmias [Oyama and Sisson, 2004].
cTnI concentrations have been demonstrated to be elevated in dogs with several
non-cardiac conditions as anaemia [Gow et al. 2011], renal failure [Porciello et al.
2008 and Sharkey et al. 2009], GDV [Schober et al. 2002 and Burgener et al.
2006], pyometra [Hagman et al. 2007 and Pelander et al. 2008], blunt chest

66
trauma [Schober et al. 1999], snake envenomation [Segev et al. 2008, Pelander
et al. 2010,Langhorn et al. 2014a], chemotherapy [Christiansen et al. 2002,
DeFrancesco et al. 2002 and Selting et al. 2004], exercise [ McKenzie et al. 2007
and Tharwat et al. 2013] and infectious diseases [Mastrorilli et al. 2007, Lobetti
et al. 2002 and Diniz et al. 2008]. Arrhythmias are not uncommon in these clinical
scenarios. Rhythm alterations were frequently detected in dogs with non-cardiac
diseases included in the studies mentioned above. In 85 dogs with GDV,
electrocardiographic abnormalities were detected in 68 (80%) and 36 out of 68 had
ventricular arrhythmias. cTnI concentrations for dogs with no or mild ECG changes
were significantly lower than values for dogs with moderate and severe ECG
abnormalities [Schober et al. 2002]. Electrocardiographic abnormalities were
detected in 33 out of 150 of Erhlichia canis infected dogs in another study. Dogs with
severe ECG changes had higher cTnI than dogs with mild or moderate ECG
abnormalities. High concentrations were detected in dogs with VPCs (median cTnI
2.15ng/dl) and supraventricular tachycardia (0.22ng/dl) [Diniz et al. 2008]. In 48
dogs suffering from snake envenomation, arrhythmias were found in 14 of them
(29%) and sinus tachycardia was the most prevalent (57%). Cardiac arrhythmias were
correlated with cTnT but not cTnI concentrations [Segev et al. 2008]. In another
study with 24 envenomed dogs, 6 dogs had ECG abnormalities and 3/6 had increased
cTnI levels [Pelander et al. 2010]. Finally, arrhythmias were identified in 9 out 34
dogs with Babesiosis. Those showing VPCs had high cTnI levels. There was a
significant correlation between the presence of VPCs and high cTnI concentrations
[Lobetti et al. 2002].
Importantly, cTnI has been demonstrated to be elevated in human patients with
angiographycally normal coronary arteries and benign arrhythmias as paroxysmal
supraventricular tachycardia (PSVT). This dysrhythmia is usually managed without
difficulty and rarely results in adverse clinical outcomes. As a result, the prognostic
significance of elevated troponins in patients with PSVT has been questioned
[Redfearn et al. 2005, Chow et al. 2010, Carlberg et al. 2011 and Xue et al.
2014].
The role of arrhythmias in the release of cardiac troponin in small animals remains
obscure. We hypothesized that arrhythmias might be a contributing factor to cardiac
troponin release in small animals too (“tachycardia induced elevation of cTnI”).

67
Tachyarrhythmias were a common finding in dogs in this study with high cTnI.Some
of these patients with marked elevation of cTnI concentrations and severe
arrhythmias presented prolonged survival. Myocardial ischemia secondary to the
presence of arrhythmia may contribute to the magnitude of cTnI release in these
patients.
Regression analysis failed to show correlation between cTnI and gender or age.
However, cTnI increased significantly with increasing age in 176 healthy dogs and 81
dogs with MVD in previous reports. Age is thought to cause myocardial changes
leading to cTnI leakage as the aged heart, even in the absence of demonstrable
cardiovascular disease, loses up to 35% of its total myocyte number [Oyama and
Sisson, 2004 and Ljungwall et al. 2010].
Although our results demonstrated that cTnI was significantly associated with the
presence of CHF, conflicting results have been published before. No difference in
median cTnI concentration was found in 37 dogs MVD and 26 dogs with CM with and
without CHF [Oyama and Sisson, 2004]. In another prospective study, only six out
of 15 dogs with MVD and class IV CHF had detectable levels of cTnI, nevertheless
these patients had shorter survival times than those with cTnI concentrations within
the reference range [Linklater et al. 2007]. However, in 35 dogs with acquired
and/or congenital cardiac conditions serum cTnI varied with severity of congestive
heart failure. In that study, dogs displaying clinical signs of congestive heart failure
had the highest cTnI levels. Dogs in CHF with clinical signs (class II and class IIIA of
the ISACHC – International Small Animal Cardiac Health Council - classification) had
significantly higher cTnI values than controls and dogs with CHF without clinical signs
(class IA and IB) [Spratt et al. 2005]. cTnI concentrations are thought to increase
late in the course of the cardiac disease (higher values are expected in advanced
stages) and correlate with the severity of the cardiac condition [Fonfara et al. 2010,
Ljungwall et al. 2010 and Hezzell et al. 2012].
The retrospective nature of the current study resulted in a number of limitations.
Animals that were euthanized were categorized as non-survivors. Dogs could have
been misclassified regarding their cause of death (cardiac, non-cardiac) as many of
them died at home or were put to sleep and concurrent diseases cannot be ruled
out completely. Haematology and biochemistry were not available for every patient
thus anaemic and azotaemic dogs could have been inadvertently included.
68
Furthermore, the ideal scenario would have been utilization of age-matched controls
in survival studies.
One of the major limitations of this study is that, when multiple cTnI measurements
were available, only the highest was taken into account. Little is known about the
fluctuations in cTnI concentration in the progression of the different canine cardiac
diseases. Therefore, this analysis makes statistical results difficult to interpret.
Results employing CTnI concentrations at admission would have been more useful
for clinical purposes.
The results of this study confirm that high cTnI concentrations are associated with
shorter survival times in dogs with cardiac diseases. However, due to the overlap of
cTnI concentration between survivors and non-survivors, and the low specificities
and sensitivities produced, caution should be exercised when interpreting individual
results. The role of arrhythmias in cTnI leakage remains unknown in small animals
and it requires further investigation. Arrhythmias are commonly detected in dogs
with cardiac or non-cardiac disease and increased cTnI levels. Clinical decisions
should not be made on the basis of cTnI results alone. Nevertheless, dogs with
increased troponin values require medical attention and a full cardiac examination.
Meticulous cardiac auscultation and continuous ECG monitoring should be
recommended in dogs with increased cTnI concentrations.
69
CHAPTER 3
Retrospective study in cats:
Serum cTnI and survival in feline cardiac and non-cardiac
disease.

70
3.1 Aims and objectives
• To study cTnI concentrations in cats with a wide variety of cardiac diseases.
• To test the ability of cTnI to distinguish between cats with different types of
cardiomyopathy.
• To evaluate the ability of cTnI to discriminate between cats with cardiac, thyroid
and systemic diseases.
• To investigate the relationship between cTnI concentrations and survival in cats
with cardiac disease.
• To clarify if cTnI concentrations could accurately predict cardiac death in the
individual patient.
• To assess the impact of age, gender, cardiac disease, presence of CHF and
arrhythmia on cTnI concentrations and survival in cats with cardiac disease.
3.2 Material and methods
This was a retrospective study that included cats admitted to the Small Animal
Hospital of the University of Glasgow between 2009 and September 2012, which had
cTnI measured in blood samples collected as part of a normal clinical investigation.
Repeated samples from the same individual collected on different visits were
excluded for statistical purposes. If several measurements were available, only the
highest result was included in the analysis. The clinical histories were reviewed and
they were classified in 3 different categories regarding their main disease: cats with
cardiac disease, cats with hyperthyroidism and cats with systemic diseases. No
controls were recruited for the present study.
3.2.1 ANIMALS
a) Cats with cardiac disease
Cats were eligible for inclusion where there was evidence of cardiac disease on
physical examination. The presence of arrhythmias, gallop sounds and murmurs or
combinations of these were considered valid inclusion criteria.
Cats with a haematocrit below 23%, creatinine >180 µmol/L in the absence of
diuretic therapy, thyroxine >50 nmol /L, persistent systolic arterial blood pressure
>180 mmHg or concurrent disease (e.g. neoplasia or trauma) were excluded from
the cardiac disease group.

71
b) Hyperthyroid cats
The inclusion criteria for this group was a thyroid hormone level >50 nmol/L. Cats
with haematocrit below 23%, creatinine >180 µmol/L, persistent systolic arterial
blood pressure >180 mmHg or concurrent disease (e.g. neoplasia or trauma) were
excluded from the hyperthyroid group. Cats with signs of cardiac disease on physical
examination and increased thyroxine levels were included in this group.
c) Cats with systemic diseases
Cats were included in this group if they were diagnosed with a systemic non-cardiac
disease and they did not show evidence of cardiac disease on physical examination.
Animals with haematocrit below 23%, creatinine >180 µmol/L, thyroxine >50 nmol
/L or persistent systolic arterial blood pressure >180 mmHg were excluded.
3.2.2 CARDIAC BIOMARKER
Samples were collected by jugular venipuncture and placed in plain serum tubes,
which were allowed to clot and submitted for analysis on the same day. Cardiac
troponin I was tested with an “Immulite® 2000 Troponin I” (Siemens) analyzer. This
is a chemiluminescent immunometric assay. The bead is coated with monoclonal
murine anti-troponin I antibody and the liquid phase consists of alkaline phosphatase
(bovine calf intestine) conjugated to polyclonal anti-troponin I antibody. This assay
has a lower detection limit of 0.1ng/ml. The normal reference range for cats is
<0.16ng/ml.
3.2.3 CLINICAL OUTCOME
Survival analysis was performed for cardiac cases only, due to the low number of
cats in the other groups. Survival times were calculated from the date of sampling
to the date of death or euthanasia. The outcome was obtained either from electronic
records of the primary clinicians or by contacting owners or referring practitioners
by telephone. Animals that were euthanized or died from non-cardiac conditions
were excluded from the study.
3.2.4 STATISTICAL ANALYSIS
Statistical analyses were performed using Minitab statistical software. Data were
non-normally distributed and results were compared using the Mann-Whitney U test

72
and graphically assessed with box-plots graphs. Median and interquartile ranges
were used to provide descriptive statistics.
Survival was analyzed using Kaplan-Meier curves. Cats were censored if they were
alive at the end of the study period. ROC curves were created to assess the
prognostic capability of cTnI and to identify the most useful cut-offs to predict
cardiac death and cardiac death within a year.
Regression analysis was performed to identify if the cTnI results could have been
influenced by confounding factors such as age, breed or type of disease. Statistical
significance was defined as P <0.05.
3.3 Results
3.3.1 STUDY POPULATION CHARACTERISTICS:
a) Total population
In total 141 samples were available for analysis. 53 were repeat samples and were
excluded. The remaining samples (n=68) were placed in the three categories:
cardiac disease (n=51), hyperthyroid disease (n=9), systemic disease (n=8).
b) Cardiac disease
Fifty one cats were included in the cardiac disease group. Of those, 16 were female
(4 entire and 12 neutered) and 35 were male (3 entire and 32 neutered). The most
common breed was domestic shorthair (n=30), followed by exotic shorthair (n=11),
British shorthair (n=3), Maine Coon (n=3), Domestic Longhair (n=3) and Sphynx (n=1).
The median age was 6 years old (range: 1-15 years).
Murmurs were the most common finding on physical auscultation (n=38), however
gallop sounds were detected in almost half of the population studied (n=24) and 15
animals presented with audible arrhythmias.
Electrocardiograms were available for these 15 animals. The most frequent rhythm
disturbances in this population were VPCs (n=9). Other arrhythmias were SPVCs
(n=2), atrial fibrillation with VPCs (n=2), VPCs and SPVCs combined (n=1) and 1 cat
presented with second degree A-V block.
Fifty out of the total 51 cats were scanned by the same experienced cardiologist
(Dr. Paul Wotton). The most prevalent disease was HCM (n=29) followed by
unclassified cardiomyopathy (UCM) (n=10) and RCM (n=9). A diagnosis of HCM was
made based on maximal end-diastolic thickness of the left ventricular posterior wall

73
(LVPWd) or interventricular septum (IVSd) greater than 6 mm. For RCM, the inclusion
criteria were normal thickness of the left ventricular walls and a restrictive left
ventricular filling pattern (high E:A ratio on transmitral flow). The UCM category
included those with normal thickness of the walls, normal ventricular dimensions,
reduced systolic function and absence of a restrictive pattern on transmitral flow.
One cat had pulmonic stenosis and one cat had second degree AV block. One cat had
cardiomegaly on thoracic radiographs, an arrhythmia and gallop sounds, but the
disease was not characterized as echocardiography was not undertaken.
CHF was defined as presence of pleural or pericardial effusion seen on
echocardiographic examination as well as presence of pulmonary oedema or pleural
effusion on thoracic radiographs. Using these criteria, 28 animals were considered
to be in CHF whereas 23 animals were not.
c) Hyperthyroid disease
Nine cats were included in this category. Six cats were female neutered and the
other 3 male neutered. Most were Domestic Shorthairs (n=8) and there was one
Siamese. The median age was 14 years old (range: 7-15 years).
Three animals presented with audible murmurs, 2 had gallop sounds and 2 showed
arrhythmias (SPVCs and VPCs). Five experienced some degree of respiratory distress
(tachypnoea or dyspnoea). Six out of 9 animals underwent echocardiographic
examination and all of them had cardiac abnormalities.
d) Systemic disease
Eight cats met the inclusion criteria for this group. The group comprised 1 intact
male, 6 neutered males and 1 neutered female. There were 6 Domestic Shorthairs,
1 Domestic Longhair and 1 Persian. The median age was 3.5 years old (range: 1-14
years). These patients were finally diagnosed with idiopathic epilepsy,
bronchopneumonia, pulmonary neoplasia, asthma and collapsing episodes of
unknown origin.
None of these animals presented with cardiac abnormalities on physical
examination. Two animals were scanned and no abnormalities were detected on
echocardiography.

74
3.3.2 BIOMARKER CONCENTRATIONS
a) Cats with cardiac disease
There were 49 cats (96%) with cardiac disease with increased cTnI concentration.
Only two cats (4%) included in his category had cTnI concentrations below the
detection limit of the assay (<0.1ng/ml).
The range of cTnI in cats with cardiac disease was between 0.1 and 35ng/ml and the
median cTnI concentration was 1.03ng/ml.
cTnI concentrations from cats with HCM, UCM, and RCM were compared using the
Mann-Whitney U test. cTnI concentrations were not significantly different between
disease types.
Cats with HCM (n=29) had a median cTnI concentration of 0.81ng/ml (range: 0.1-
35ng/ml), whereas it was 1.03ng/ml for cats with RCM (range: 0.26-9.53ng/ml) and
2.47ng/ml for UCM cats (range: 0.16-21.2ng/ml).
Three cats with HCM had cTnI values below the detection limit (0.1ng/ml), whereas
all UCM cats (n=10) and RCM cats (n=9) had cTnI above the reference range.
Cats that were in CHF had significantly higher cTnI concentrations than cats without
CHF (P<0.0001). Median cTnI concentration from animals in failure was 2.185ng/ml
(range of 0.27-35ng/ml), whereas cats without failure had a median cTnI
concentration of 0.41ng/ml (range of 0.1-4.76ng/ml).
FIGURE 3.1 Dotplot of cTnI concentrations in cats with cardiac disease. Note
that most of the cats had cTnI between 0 and 3ng/ml, demonstrating why no statistically
significant difference was found between types of cardiomyopathy.
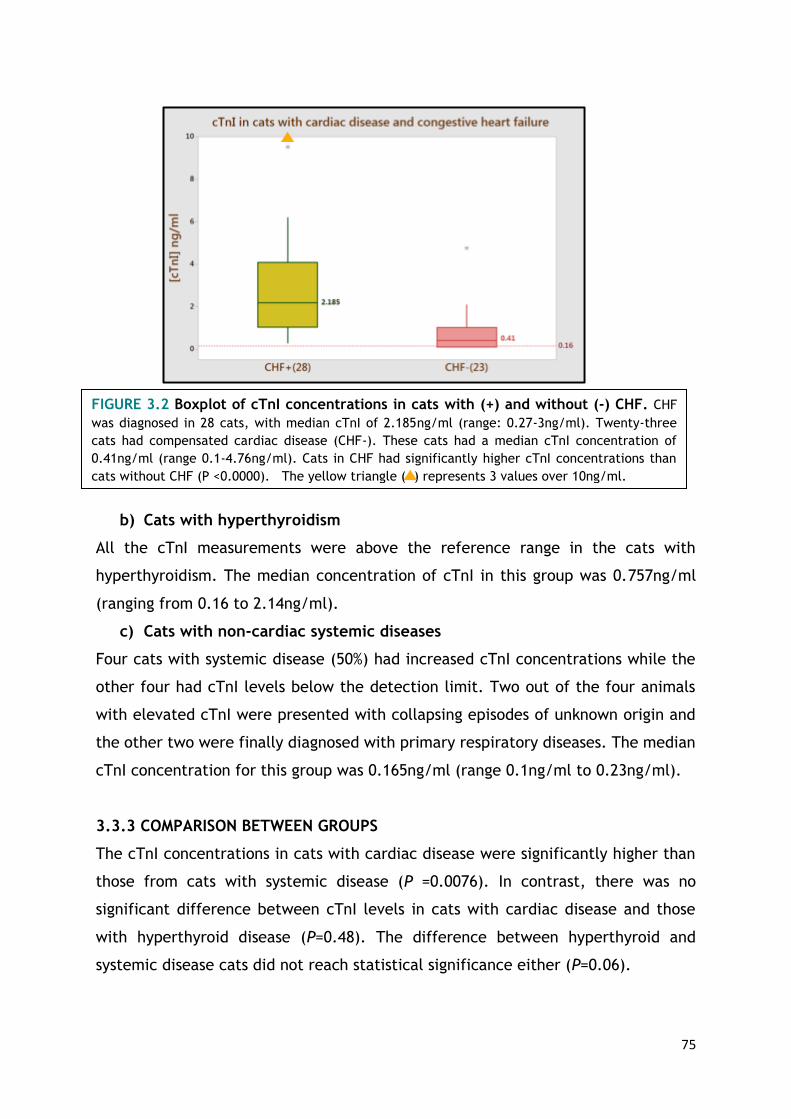
75
b) Cats with hyperthyroidism
All the cTnI measurements were above the reference range in the cats with
hyperthyroidism. The median concentration of cTnI in this group was 0.757ng/ml
(ranging from 0.16 to 2.14ng/ml).
c) Cats with non-cardiac systemic diseases
Four cats with systemic disease (50%) had increased cTnI concentrations while the
other four had cTnI levels below the detection limit. Two out of the four animals
with elevated cTnI were presented with collapsing episodes of unknown origin and
the other two were finally diagnosed with primary respiratory diseases. The median
cTnI concentration for this group was 0.165ng/ml (range 0.1ng/ml to 0.23ng/ml).
3.3.3 COMPARISON BETWEEN GROUPS
The cTnI concentrations in cats with cardiac disease were significantly higher than
those from cats with systemic disease (P =0.0076). In contrast, there was no
significant difference between cTnI levels in cats with cardiac disease and those
with hyperthyroid disease (P=0.48). The difference between hyperthyroid and
systemic disease cats did not reach statistical significance either (P=0.06).
FIGURE 3.2 Boxplot of cTnI concentrations in cats with (+) and without (-) CHF. CHF
was diagnosed in 28 cats, with median cTnI of 2.185ng/ml (range: 0.27-3ng/ml). Twenty-three
cats had compensated cardiac disease (CHF-). These cats had a median cTnI concentration of
0.41ng/ml (range 0.1-4.76ng/ml). Cats in CHF had significantly higher cTnI concentrations than
cats without CHF (P <0.0000). The yellow triangle ( ) represents 3 values over 10ng/ml.
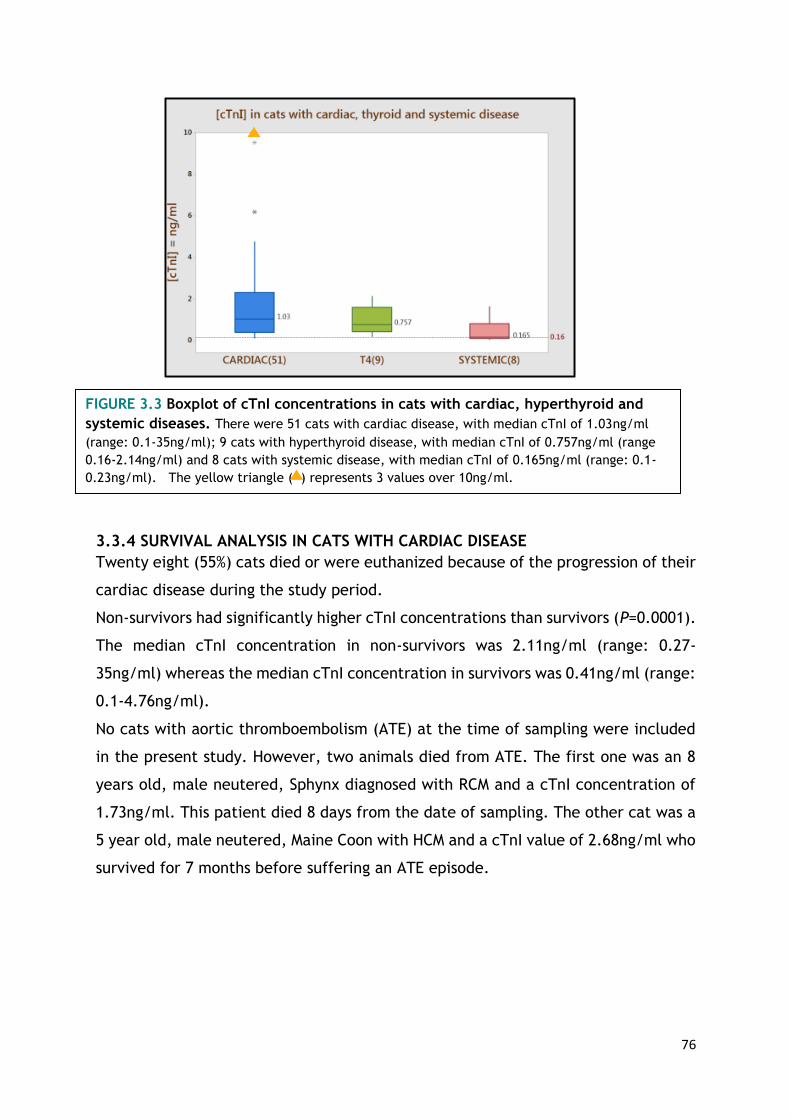
76
3.3.4 SURVIVAL ANALYSIS IN CATS WITH CARDIAC DISEASE
Twenty eight (55%) cats died or were euthanized because of the progression of their
cardiac disease during the study period.
Non-survivors had significantly higher cTnI concentrations than survivors (P=0.0001).
The median cTnI concentration in non-survivors was 2.11ng/ml (range: 0.27-
35ng/ml) whereas the median cTnI concentration in survivors was 0.41ng/ml (range:
0.1-4.76ng/ml).
No cats with aortic thromboembolism (ATE) at the time of sampling were included
in the present study. However, two animals died from ATE. The first one was an 8
years old, male neutered, Sphynx diagnosed with RCM and a cTnI concentration of
1.73ng/ml. This patient died 8 days from the date of sampling. The other cat was a
5 year old, male neutered, Maine Coon with HCM and a cTnI value of 2.68ng/ml who
survived for 7 months before suffering an ATE episode.
FIGURE 3.3 Boxplot of cTnI concentrations in cats with cardiac, hyperthyroid and
systemic diseases. There were 51 cats with cardiac disease, with median cTnI of 1.03ng/ml
(range: 0.1-35ng/ml); 9 cats with hyperthyroid disease, with median cTnI of 0.757ng/ml (range
0.16-2.14ng/ml) and 8 cats with systemic disease, with median cTnI of 0.165ng/ml (range: 0.1-
0.23ng/ml). The yellow triangle ( ) represents 3 values over 10ng/ml.
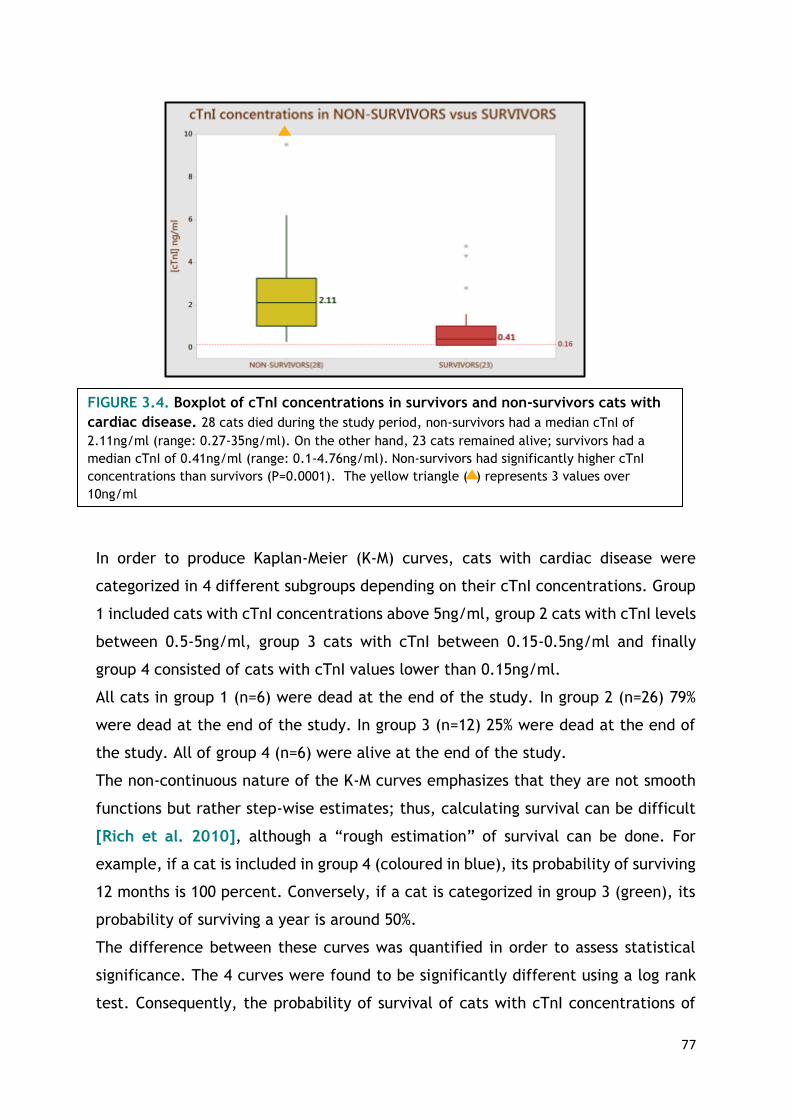
77
In order to produce Kaplan-Meier (K-M) curves, cats with cardiac disease were
categorized in 4 different subgroups depending on their cTnI concentrations. Group
1 included cats with cTnI concentrations above 5ng/ml, group 2 cats with cTnI levels
between 0.5-5ng/ml, group 3 cats with cTnI between 0.15-0.5ng/ml and finally
group 4 consisted of cats with cTnI values lower than 0.15ng/ml.
All cats in group 1 (n=6) were dead at the end of the study. In group 2 (n=26) 79%
were dead at the end of the study. In group 3 (n=12) 25% were dead at the end of
the study. All of group 4 (n=6) were alive at the end of the study.
The non-continuous nature of the K-M curves emphasizes that they are not smooth
functions but rather step-wise estimates; thus, calculating survival can be difficult
[Rich et al. 2010], although a “rough estimation” of survival can be done. For
example, if a cat is included in group 4 (coloured in blue), its probability of surviving
12 months is 100 percent. Conversely, if a cat is categorized in group 3 (green), its
probability of surviving a year is around 50%.
The difference between these curves was quantified in order to assess statistical
significance. The 4 curves were found to be significantly different using a log rank
test. Consequently, the probability of survival of cats with cTnI concentrations of
FIGURE 3.4. Boxplot of cTnI concentrations in survivors and non-survivors cats with
cardiac disease. 28 cats died during the study period, non-survivors had a median cTnI of
2.11ng/ml (range: 0.27-35ng/ml). On the other hand, 23 cats remained alive; survivors had a
median cTnI of 0.41ng/ml (range: 0.1-4.76ng/ml). Non-survivors had significantly higher cTnI
concentrations than survivors (P=0.0001). The yellow triangle ( ) represents 3 values over
10ng/ml
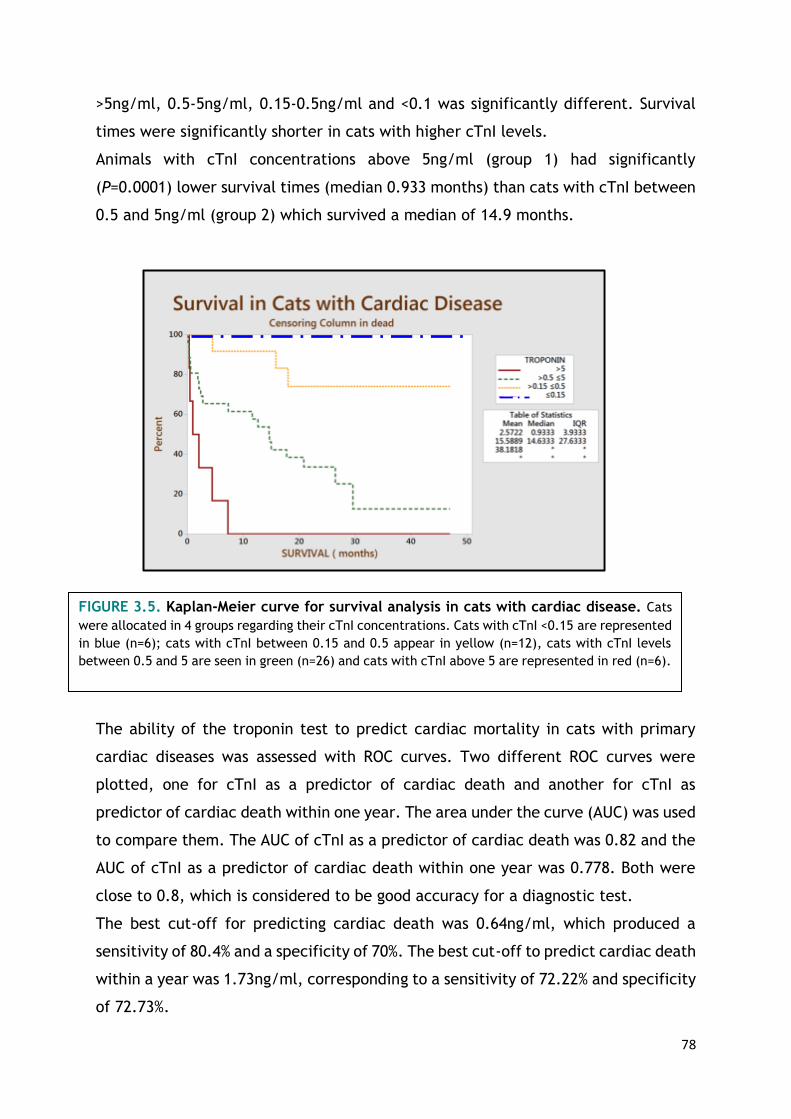
78
>5ng/ml, 0.5-5ng/ml, 0.15-0.5ng/ml and <0.1 was significantly different. Survival
times were significantly shorter in cats with higher cTnI levels.
Animals with cTnI concentrations above 5ng/ml (group 1) had significantly
(P=0.0001) lower survival times (median 0.933 months) than cats with cTnI between
0.5 and 5ng/ml (group 2) which survived a median of 14.9 months.
The ability of the troponin test to predict cardiac mortality in cats with primary
cardiac diseases was assessed with ROC curves. Two different ROC curves were
plotted, one for cTnI as a predictor of cardiac death and another for cTnI as
predictor of cardiac death within one year. The area under the curve (AUC) was used
to compare them. The AUC of cTnI as a predictor of cardiac death was 0.82 and the
AUC of cTnI as a predictor of cardiac death within one year was 0.778. Both were
close to 0.8, which is considered to be good accuracy for a diagnostic test.
The best cut-off for predicting cardiac death was 0.64ng/ml, which produced a
sensitivity of 80.4% and a specificity of 70%. The best cut-off to predict cardiac death
within a year was 1.73ng/ml, corresponding to a sensitivity of 72.22% and specificity
of 72.73%.
FIGURE 3.5. Kaplan-Meier curve for survival analysis in cats with cardiac disease. Cats
were allocated in 4 groups regarding their cTnI concentrations. Cats with cTnI <0.15 are represented
in blue (n=6); cats with cTnI between 0.15 and 0.5 appear in yellow (n=12), cats with cTnI levels
between 0.5 and 5 are seen in green (n=26) and cats with cTnI above 5 are represented in red (n=6).

79
3.3.5 REGRESSION ANALYSIS AND ANOVA
Univariable and multivariable analysis revealed that age, gender or type of
cardiomyopathy were not statistically associated with cTnI. In contrast, cTnI was
significantly correlated with CHF. Higher troponin values were found in animals in
CHF. Using a cTnI concentration of 1.13ng/ml as a cut-off, 83% of the animals in CHF
were correctly classified (sensitivity 73% and specificity 91%).
3.4 Discussion
To the author´s knowledge, this is the first study that has demonstrated that cTnI is
increased in several feline cardiac disease phenotypes. Some authors have previously
reported that cats with HCM have increased cTnI values, however there are no
previous reports regarding cTnI in UCM and RCM [Herdon et al. 2002, Connolly et
al. 2003, Borgeat el al. 2014 and Langhorn et al. 2014b]. However, cTnI seems
not to be a useful test to distinguish between HCM, RCM and UCM as the difference
between concentrations in these groups was not statistically significant.
No histopathological examinations were performed in the cases included in this
study; thus it was impossible to establish a causal relationship for cTnI release.
However, abnormal coronary arteries with thickened walls and narrowed lumens are
a common finding in cats with HCM [Fox, 2003]. These abnormal vessels are
FIGURE 3.6. ROC curves for cTnI and survival in cats with cardiac disease. A, cTnI as
predictor of cardiac death (AUC=0.8269). B, cTnI as predictor of cardiac death within a
year (AUC =0.778)

80
commonly surrounded by areas of “replacement fibrosis” caused by ischaemia. End-
stage HCM, the final phase of the disease, is seen in some cats. The hallmark
histological feature of end stage HCM is multifocal myocardial scarring (large regions
of replacement fibrosis) for which myocardial infarction is considered the most likely
cause. The small vessel disease present in HCM may lead to alterations of blood flow,
causing ischaemia, subsequent myocardial cell death and replacement fibrosis.
Moreover, intracardiac thrombi and thromboembolism appear to be very common in
this subset of cats, thus coronary arterial thromboembolism is likely to occur [Cesta
et al. 2005]. Some authors have suggested that the myocardiocyte disarray seen in
human patients with HCM can contribute to ischaemia [Varnava et al. 2001]. As
with HCM, RCM also shows a broad spectrum of pathological phenotypes. The
endomyocardial form, known as endomyocardial fibrosis (EMF), is associated with
marked replacement fibrosis involving the endocardium or endomyocardium [Fox,
2004]. Commonly both atria are enlarged in RCM; in some cases atrial hypertrophy
is evident, whereas in others the atrial walls are severely thinned. This is thought to
be as a consequence of marked myocyte loss and collagen replacement. Similar to
HCM cats, intracardiac thrombi and arterial thromboembolism are frequently
observed. The term UCM is used when there are structural markers of RCM without
proof of impaired diastolic ventricular filling [Côté et al, 2011b].
Replacement fibrosis and ischaemia are, thus, common in feline cardiomyopathies
and are the most likely causes of myocardial damage and cTnI release in these
patients. Some similar histopathological findings are common to these 3 clinical
types of feline cardiac disease and could be the explanation for the lack of
difference in cTnI concentrations between them.
Only one cat was presented with pulmonic stenosis. This patient had a troponin value
of 0.11ng/ml. No reports describing cTnI values in cats with congenital diseases have
been published. Dogs with congenital disease have lower cTnI values that those with
acquired heart diseases and further studies are required to see if a similar finding
may be present in cats [Oyama and Sisson 2004, Spratt et al. 2005 and Fonfara
et al. 2010].
No cats with ATE at the time of sampling were included in this study. However, two
animals later died from ATE; one of them had a cTnI concentration of 1.73ng/ml and
died 8 days after sampling. The second cat had a cTnI value of 2.68ng/ml and died
81
7 months after being sampled. A previous study included 2 animals with ATE and
these cats had the highest troponin concentrations of the population examined
[Herndon et al. 2002]. Several different factors may have influenced the
progression to ATE in our two cases, such as therapeutic protocol or type of disease.
Further studies are needed to see if cTnI is a good predictor of ATE in cats.
In the present study cTnI has been shown to be a good predictor of survival regardless
of type of cardiomyopathy in cats. Cats with cardiac disease and cTnI levels above
5ng/ml survived for a median time of 0.933 months while cats with cardiac disease
and cTnI concentrations between 0.5 and 5ng/ml survived a median time of 14.9
months. The best cut-off for predicting cardiac death was 0.64ng/ml, with a
sensitivity of 80.4% and a specificity of 70%.
Two recent papers have focused on the usefulness of cTnI as a predictor of mortality
in cats with cardiac diseases. The first one specifically recruited purebred cats
(Maine Coon, British Shorthair, Norwegian Forest and Exotic Shorthairs) with
suspected familial HCM and demonstrated that both cTnI and cTnT concentrations
at admission were prognostic for survival [Langhorn et al. 2014b]. The second study
showed that a circulating concentration of cTnI greater than 0.7ng/ml was a
significant predictor of cardiac death in cats of any breed with HCM. Importantly,
cTnI remained significant even if the size of the left atrium or the presence of CHF
remained uncertain [Borgeat et al. 2014].
In the present study, the regression analysis showed that cTnI was correlated with
CHF. Those animals that were in CHF had significantly higher cTnI values and
significantly lower survival times. Controversial information has been published
about CHF and cTnI in cats. One study also showed that cats with CHF at the time
of cTnI measurement had significantly higher (P=0.0095) concentrations than did
cats with no CHF [Herndon et al. 2002]. However, in another study the authors
were not able to demonstrate a statistically significant difference in cTnI levels
between cats with CHF due to cardiomyopathy and those without (P=0.16) [Connolly
et al. 2003]. Any discrepancy between studies may be related to low numbers. This
study has shown that, in a well characterized population of cats, cTnI may
differentiate cats with CHF from cats without CHF, but it is important to be aware
that three previous studies have all shown that whilst cats with dyspnoea due to
congestive heart failure tend to have higher cTnI concentrations than cats with non-

82
cardiac dyspnoea, there was a high degree of overlap between the groups. cTnI is
considered to be unsuitable to distinguish between causes of dyspnoea in cats
[Herndon et al. 2008, Connolly et al. 2009a and Wells et al. 2014]
Cardiac biomarkers have previously been shown to be elevated in cats with
hyperthyroidism [Connolly et al. 2005 and Sangster et al. 2014] and this study
confirms this finding. This study has also shown that cTnI cannot distinguish between
cardiomyopathy secondary to thyroid disease and any of the primary
cardiomyopathies HCM, RCM and UCM. Structural cardiac changes due to elevated
circulating thyroid hormone levels in cats are well known. Tachycardia,
hypertension, increased erythropoietin release, activated renin-angiotensin-
aldosterone system and chronic sympathetic stimulation are common features and
can lead to further cardiac remodeling [Côté et al. 2011c]
cTnI concentrations were significantly higher in cats with cardiac disease in
comparison with cTnI from patients with systemic disease where cardiac disease,
renal disease, anaemia and systemic hypertension had been excluded (P= 0.0076).
However 50% of the animals included in the latter group had cTnI concentrations
above the reference range. The cause of the increased cTnI in this group is
uncertain. cTnI has been shown to increase in many non-cardiac conditions in both
human and veterinary patients. Anaemia [Lalor et al. 2014], azotaemia [Porciello
et al. 2008], cardiac contusion [Kirbach et al. 2000], non-cardiac causes of
dyspnoea [Herndon et al. 2008, Connolly et al. 2009a and Wells et al. 2014] and
hyperthyroidism [Connolly et al. 2005 and Sangster et al. 2014] have been shown
to cause increased troponin I in cats. Exercise [McKenzie et al. 2007 and Tharwat
et al. 2013], snake envenomation [Segev et al. 2008, Pelander et al. 2010 and
Langhorn et al. 2014a], chemotherapy [Christiansen et al. 2002, Defrancesco et
al. 2002 and Selting et al. 2004], vector-borne diseases as Ehrlichiosis [Diniz et al.
2008 and Koutinas et al. 2012], Babesiosis [Lobetti et al. 2002], Dirofilariasis
[Carretón et al. 2011, 2012 and 2013] and Chagas disease [Barr et al. 2005],
Leptospirosis [Mastrorilli et al. 2007] gastric volvulus and dilatation [Schober et al.
2002 and Burgener et al. 2006], pyometra [Hagman et al. 2007 and Pelander et
al. 2008] have all been shown to result in increased cTnI concentrations in dogs.
cTnI is not a specific clinical marker; it indicates the presence of myocardial injury
but does not define the underlying cause. Of the four cats with systemic disease that

83
had elevated cTnI in this study, two had respiratory disease and two were presented
with non–cardiogenic causes of collapse. In these cases elevation of cTnI may have
been caused by hypoxia.
The regression analysis failed to show a significant relationship between cTnI and
age, sex or type of cardiac disease. This supports the findings of Borgeat et al.
(2014), as no correlation was found between age and cTnI in that study. However,
some studies found a significant interaction between age and cTnI levels in dogs
[Oyama and Sisson, 2004 and Ljungwall et al. 2010]. They theorized about the
aged heart and myocyte loss in the absence of cardiac disease. These findings, may
suggest a difference between cats and dogs and needs further investigation.
The retrospective nature of the current study resulted in a number of limitations.
Animals that were euthanized were categorized as non-survivors. Cats could have
been misclassified regarding their cause of death (cardiac, non-cardiac) as many of
them died at home or were euthanized and concurrent diseases cannot be ruled out
completely. Haematology and biochemistry were not available for every patient,
thus anaemic and azotaemic cats could have been inadvertently included. The final
number of patients included in the study was small reducing the power of the
statistical calculations. In an ideal scenario age-matched controls should have been
recruited for the survival studies. Finally, animals included in the systemic disease
group did not undergo echocardiographic examination and therefore subclinical
cardiac disease could not be ruled out.
In summary, this study has shown that increased cTnI is associated with long-term
mortality in cats of any breed with a wide variety of cardiac diseases, not only HCM.
Despite the fact that higher troponin values are associated with shorter survival
times, decisions on euthanasia should not be made based on cTnI results alone as a
significant overlap exist between survivors and non-survivors. Clinicians should
consider cTnI as an additional tool in their routine diagnostic investigations, but
always being aware of the limitations of this biomarker and the numerous non-
cardiac diseases that can cause elevation.

84
85
CHAPTER 4
Prospective study in cats
APP and cardiac biomarkers in feline cardiac and non-cardiac
diseases.
86
4.1 Aims and objectives
• To determine the concentration of four different APP in a well characterized
population of cats.
• To assess the usefulness of APP to distinguish cats with cardiac, hyperthyroid or
non-cardiac systemic diseases.
• To investigate the elevation of cardiac biomarkers in cats with non-cardiac
diseases.
• To analyze the relationship between cardiac biomarkers and markers of
inflammation in cats with a wide variety of diseases.
• To identify possible confounding factors for both cardiac biomarkers and markers
of inflammation in cats.
4.2 Material and methods
The present prospective study protocol was approved by the Research Ethics
Committee of the School of Veterinary Medicine, University of Glasgow. Every animal
included in the present study received humane care with strict ethical and
professional standards. Cats were eligible for inclusion if they were admitted to the
Small Animal Hospital from January to June 2014 and collecting blood was part of
the clinical investigation of their primary clinical condition. Full echocardiographic
examination was intended in all cats, however in animals with non-cardiac
conditions only brief echocardiography was done as time limitations were
established by the Ethic and Welfare Committee. Informed owner consent to
participate was obtained for all cats. Individuals were assigned to four different
categories depending on their final diagnosis: cats with cardiac disease, cats with
hyperthyroidism, cats with systemic diseases other than cardiac or hyperthyroidism
and cats with comorbidities (animals with combinations of diseases included in the
previous categories). Furthermore, cats with cardiac disease were further classified
depending on the presence or abscence of CHF. CHF was diagnosed combining
clinical signs, echocardiography, abdominal ultrasonography and thoracic
radiographs (pleural effusion, pulmonary edema and peritoneal effusion). No healthy
animals were recruited for the present study.
4.2.1. ANIMALS
a) GROUP I. CATS WITH CARDIAC DISEASE
Cats were eligible for inclusion if evidence of cardiac disease was present on physical
examination and confirmed on ultrasonography. The presence of arrhythmias, gallop

87
sounds and murmurs or combinations of these were considered valid inclusion
criteria. All the individuals were scanned by experienced echocardiographers,
confirming the presence of structural cardiac disease.
Hypertension, hyperthyroidism (defined as thyroxine higher than 50 nmol/L) or
evidence of concurrent diseases were criteria of exclusion.
b) GROUP II. CATS WITH SYSTEMIC DISEASE
Cats diagnosed with systemic non-cardiac diseases were included in this group.
Animals with concurrent hyperthyroidism (thyroxine levels >50nmol/L) or cardiac
disease were excluded. However, animals were included in this group if
abnormalities were found on cardiac auscultation but echocardiographic findings
were normal. Cats with abnormal thoracic auscultation that were not scanned were
excluded, as significant underlying cardiac disease could not be ruled out.
c) GROUP III. CATS WITH HYPERTHYROIDISM
Cats with serum thyroxine levels above 50 nmol/L were assigned to this group. Both
untreated cats and those undergoing treatment for hyperthyroidism were included
in this category. The presence of a concurrent systemic disease was a criterion of
exclusion.
d) GROUP IV. CATS WITH COMOBIRDITIES
This group included cats with heart disease or hyperthyroidism and simultaneous
extracardiac disorders. The diagnosis of hyperthyroidism was made if cats had
thyroxine levels above 50 mol/L. Animals were considered to have underlying
cardiac conditions if they had abnormalities on cardiac auscultation and abnormal
echocardiographic findings. Animals with systemic disease and abnormalities on
cardiac auscultation, which were not scanned, were included in this category.
4.2.2. STUDY PROTOCOL
a) Sample collection and storage
Blood was obtained by venipuncture and placed in plain serum tubes. Blood was
allowed to clot for 15-20 minutes at room temperature, centrifuged and then serum
was carefully separated and stored at -20 degrees C until the moment of analysis.
Samples were aliquoted into 4 vials and were stored for a maximum of 6 months
before analysis. When possible, 100 µL were used for SAA and Hp measurements,
50 µl for AGP, 50 µL for CRP at Acute Phase Protein Laboratory (Glasgow University,
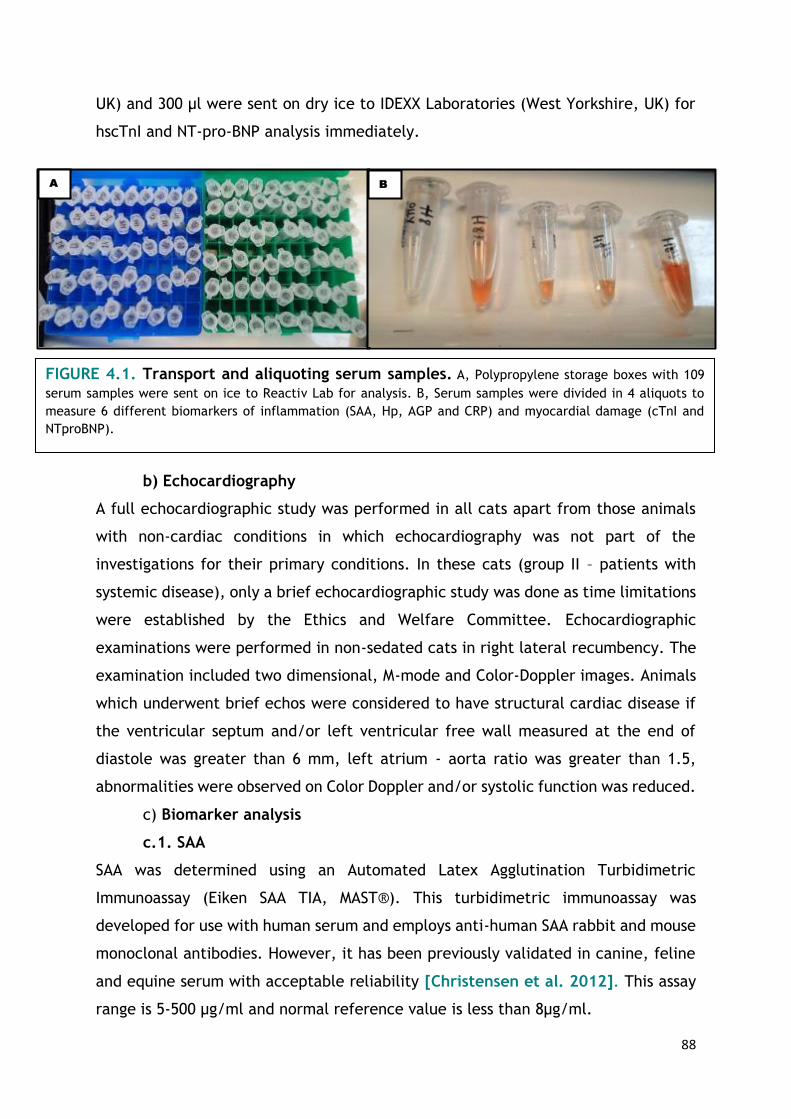
88
UK) and 300 µl were sent on dry ice to IDEXX Laboratories (West Yorkshire, UK) for
hscTnI and NT-pro-BNP analysis immediately.
b) Echocardiography
A full echocardiographic study was performed in all cats apart from those animals
with non-cardiac conditions in which echocardiography was not part of the
investigations for their primary conditions. In these cats (group II – patients with
systemic disease), only a brief echocardiographic study was done as time limitations
were established by the Ethics and Welfare Committee. Echocardiographic
examinations were performed in non-sedated cats in right lateral recumbency. The
examination included two dimensional, M-mode and Color-Doppler images. Animals
which underwent brief echos were considered to have structural cardiac disease if
the ventricular septum and/or left ventricular free wall measured at the end of
diastole was greater than 6 mm, left atrium - aorta ratio was greater than 1.5,
abnormalities were observed on Color Doppler and/or systolic function was reduced.
c) Biomarker analysis
c.1. SAA
SAA was determined using an Automated Latex Agglutination Turbidimetric
Immunoassay (Eiken SAA TIA, MAST®). This turbidimetric immunoassay was
developed for use with human serum and employs anti-human SAA rabbit and mouse
monoclonal antibodies. However, it has been previously validated in canine, feline
and equine serum with acceptable reliability [Christensen et al. 2012]. This assay
range is 5-500 µg/ml and normal reference value is less than 8µg/ml.
A B
FIGURE 4.1. Transport and aliquoting serum samples. A, Polypropylene storage boxes with 109
serum samples were sent on ice to Reactiv Lab for analysis. B, Serum samples were divided in 4 aliquots to
measure 6 different biomarkers of inflammation (SAA, Hp, AGP and CRP) and myocardial damage (cTnI and
NTproBNP).

89
c.2. Hp
Hp was determined by measuring the peroxidase activity of
haptoglobin/haemoglobin complex (Hp-Hb).The reaction mixture is prepared with
haemoglobin derived from sheep. The level of peroxidase activity of Hp-Hb is
determined spectrophotometrically [Eckersall,2002]. The test has been previously
used in cats with urinary tract obstruction [Schmidt et al. 2015]. Normal reference
range for cats is 0.27-3.79 g/L and the detection limit of the assay is 0.05 g/L.
c.3. AGP:
Agar gel Immuno-diffusion was the test of choice for AGP determinations. Sheep
anti-AGP antibodies were incorporated into melted 1% agarose gel. The detection
limit of the assay is 200 µg/ml and concentrations above 500 µg/ml were considered
significant.
c.4.CRP
Quantitative determination of CRP was performed using a highly sensitive two-site
enzyme-linked immunoassay (Cat CRP ELISA®, Kamiya Biomedical Company). The
company has previously validated the test in cats and it has been also employed to
assess the acute phase response in cats receiving interferon-ω therapy [Leal et al.
2014]. However, this kit is available for research use only.
The lower detection limit of the assay is 0.0 mg/ml and the reference range for
feline patients is 0.1-0.2 mg/ml.

90
FIGURE 4.3. Double antibody sandwich ELISA test for CRP determination.
A, Microtitre plates are coated with anti-CRP. B, 1:8000 dilution of the sample is added
to each well. C, Unbound proteins are removed by washing. D, Addition of antibodies
conjugated with HRP. E, After washing and removing the unbound conjugated
antibodies, Tetramethylbenzidine was pipetted into each well .F, Spectrophotometer.
B A
C D
FIGURE 4.2. Immuno-diffusion test for AGP determination. A, Sheep anti-
AGP antibodies were fixed in 1% agarose gel. The cover which protects the plate against
external contamination was marked to identify the position of the samples. B, Serum
samples were added into wells with a micropipette. C, After 20 hours of incubation,
white precipitin rings were visible around the wells at the equivalence zone. D,
Standard curve.
A B C
D E F

91
c.5. HscTnI
HscTnI was tested using a chemiluminescent immunoassay (Access AccuTnI®,
Beckman Coulter, Inc). This cTnI test employs paramagnetic particles as solid phase.
Materials bound to the solid phase are held in a magnetic field while unbound
materials are washed away. The detection antibody is conjugated with alkaline
phosphatase and when its chemiluminescent substrate is added, light is produced.
The light is measured by spectrophotometry. The detection limit of the assay is
<0.01 ng/ml and the normal reference range for cats is <0.04 ng/ml.
c.6. NT-proBNP
A two-site enzyme-linked immunoassay (Feline Cardiopet Plus ELISA®, IDEXX) was
the test of choice in the present study. This sandwich assay method incorporates
sheep antibodies and one monoclonal antibody specific for feline NT-proBNP.
The lower detection limit of the assay is 24 pmol/L whereas the higher is 1500
pmol/L. The algorithm supplied by IDEXX for interpretation of measured NT-proBNP
in cats states that in those animal whose NT-proBNP concentrations are lower than
100 pmol/L, clinically significant cardiomyopathy is highly unlikely. For those whose
NT-proBNP levels are between 100-270 pmol/L, clinically significant cardiomyopathy
is unlikely but early disease may be present. Finally, in animals with concentrations
higher than 270 pmol/L, clinically significant cardiomyopathy is highly likely.
4.2.3. STATISTICAL ANALYSIS
Statistical analysis was performed using commercially available software (Minitab,
version 17.1.0). Variables were tested for normality and 2-sample T-tests were
employed to compare normally distributed data whilst Mann-Whitney U-tests were
used for non-normally distributed variables. The data were graphically assessed with
box-plots and median and ranges were used to provide descriptive statistics.
Univariable and multivariable regression analysis were performed to identify
variables (e.g. age, breed, anaemia, azotemia or type of disease) that were
potential confounders of biomarker concentrations. Finally, ROC curves were
plotted to assess the usefulness of biomarkers as predictors of CHF and determine
optimal cut-off points. Statistical significance was defined as P <0.05.

92
4.3 Results
4.3.1. STUDY POPULATION
In total 109 serum samples were collected, but nine were repeat samples and
excluded from further analysis. In addition, the serum of one cat that was receiving
Oxyglobin at the moment of sampling was also discarded. This product may produce
alterations in chemistry values determined by colorimetric methods [Adamantos et
al. 2005]. In consequence, 99 subjects were finally included in this prospective
study.
Of the 99 cats, 54 were neutered males, 31 neutered females, 10 intact males and
four intact females. Regarding breeds recruited, 76 were Domestic Shorthair (DSH),
six Ragdoll, three Siamese, three Bengal, two Maine Coon, two Domestic Longhair
Biomarker Method Detection limit Reference range Laboratory
SAA
Automated Latex Agglutination Turbidimetric
Immunoassay (Eiken SAA TIA, MAST®)
5-500 µg/ml <8 µg/ml
Acute Phase
Laboratory,
University of
Glasgow, UK
Hp Haemoglobin Binding Assay 0.05 g/L 0.27-3.79 g/L
CRP
Two-site enzyme linked
immunoassay
(CAT CRP ELISA®, Kamiya
Biomedical Company)
0.0 mg/ml 0.1-0.2 mg/ml
AGP Agar Gel Immunodiffusion 200 µg/ml <500 µg/ml
Virology Laboratory,
Veterinary
Diagnostic Services,
University of
Glasgow
hscTnI
Chemiluminescent immunoassay
(Access AccuTnI®, Beckman Coulter, Inc)
0.01 ng/ml <0.04 ng/ml
IDEXX Laboratories
(West Yorkshire)
NT-proBNP
Two-site enzyme-linked immunoassay
(Feline Cardiopet Plus ELISA®, IDEXX)
24 -1500 pmol/L <100 pmol/L
TABLE 4.1.Methods of analysis of cardiac and inflammatory biomarkers used in this
study.

93
and one each of Burmese, Birman, Persian, Russian Blue, Tonkinese, Korat and
British Shorthair. The median age of this population was 9.7 years (range: 5 months
- 19 years) and the median weight was 4.3 kg (range: 1.40 - 7.20 Kg). Biomarker
results in the study population are summarized in Table 4.2.
a) GROUP I. Cats with cardiac disease
After six months of recruitment, 22 cats met the inclusion criteria for this category.
Group I included 10 neutered males, six neutered females, five intact males and one
intact female. Sixteen of these were DSH and there was one cat each of Maine Coon,
Ragdoll, Russian Blue, Bengal, Burmese and Domestic Longhair. The median age was
8.5 years (range: 7 months - 17 years) and median weight was 4.6 Kg (range: 2.6 -
6.9 Kg). The most common finding on physical examination was an audible murmur
(13/22), generally grade III/VI or louder. Sporadic premature beats were detected
in one cat and isolated gallop sounds in another. Combinations of a murmur and
gallop sounds were detected in two animals whilst the combination of a murmur and
arrhythmia was audible in one cat only. Arrhythmias were shown to be VPCs and
SPVCs on electrocardiographic recordings, respectively. No abnormalities on cardiac
auscultation were recorded in four cats. However, these four patients were
presented in significant respiratory distress secondary to CHF, confirmed by
transthoracic ultrasonography.
All the individuals had structural cardiac disease confirmed by echocardiography.
The most prevalent disease was HCM (11/21), followed by UCM (6/21) and RCM
hscTnI (ng/ml)
NT-proBNP (pmol/L)
SAA (µg/ml)
Hp (g/L)
AGP (µg/ml)
CRP (mg/ml)
n 97/99 97/99 95/99 96/99 96/99 86/99
Median 0.07 115 5 1.06 560 0.19
Range 0.01-4.96 24-1500 5-240 0.05-20.03 200-2420 0.02-0.48
Undetectable 8 12 62 0 2 0
Non-elevated 26 34 2 87 39 52
Elevated (n) 63 51 31 9 55 34
Elevated (%) 65% 53% 33% 9% 57% 40%
TABLE 4.2. Panel of cardiac and inflammatory biomarkers in the study population. It
includes the number of animals which were tested for each substance (n), median concentration of
the biomarker in the population (Median), the range of concentration, number of cats with
biomarker concentrations below the detection limit (Undetectable), those with biomarker
concentrations within the reference range (non-elevated) and number (n) and proportion (%) of
cats with increased biomarker concentrations.

94
(1/21). Two animals presented with congenital cardiac disease (VSD and mitral valve
dysplasia) and one showed dynamic left ventricular outflow tract obstruction. One
cat admitted to the Out of Hours Service underwent incomplete echocardiographic
examination, a dilated left atrium and pleural effusion was confirmed on echo
however a definitive diagnosis was not made.
CHF was defined as presence of pleural/pericardial effusion seen on
echocardiographic examination and/or presence of pulmonary oedema or pleural
effusion on thoracic radiographs. Following these criteria, 11 cats were in CHF in
the present study. Biomarker results in group I are summarized in Table 4.3.
a.1. Influence of congestive heart failure
Animals in CHF had significantly higher concentration of hscTnI (P=0.0086), NT-
proBNP (P=0.0001) and AGP (P=0.002) than cats with stable cardiac diseases.
However, no differences in SAA (P=0.0554), Hp (P=0.5114) or CRP (P=0.08)
concentrations were found between these two categories.
Median hscTnI concentration in cats without CHF was 0.15 ng/ml (range: 0.02 - 0.74
ng/ml) whereas from cats in CHF it was 0.43 ng/ml (range: 0.12 - 3.82 ng/ml).
Median NT-proBNP was 320 pmol/L in cats with no CHF (range: 24 - 1095 pmol/L)
whereas cats in CHF had a median NT-proBNP concentration of 1434 pmol/L (range:
594 - 1500 pmol/L). One cat had NT-proBNP levels below the detection limit of the
assay and two had concentrations within the reference range. These three
individuals were all included in the no-failure category. All the animals in CHF had
NT-proBNP higher than 270 pmol/L (reference value for clinically significant
cardiomyopathy given by IDEXX Laboratories) and seven cats with fully compensated
cardiac disease had NT-proBNP above this reference value. Finally, cats in CHF had
a median AGP concentration of 780 µg/ml (range: 360 - 1680) whereas it was 320
µg/ml (range: 220 - 840 µg/ml) for cats with no CHF. Median SAA concentration in
cats with CHF was 29.20 µg/ml whereas in cats with compensated cardiac disease it
was <5 µg/ml. Six cats in failure had elevated SAA concentrations whereas only 2
compensated cats had SAA above the reference range. However, there was no
statistically significant difference between these two groups (P=0.0554).

95
FIGURE 4.4. Boxplots illustrating hscTnI, NT-proBNP and AGP concentrations in cats with
cardiac disease. Cats in CHF had significantly* higher hscTnI, NT-proBNP and AGP concentrations
in comparison to cats with compensated cardiac disease.
The performance of hscTnI, NT-proBNP and AGP as predictors of CHF in cats was
examined with ROC curves. The greatest AUC and test with the best predictive
ability for CHF in feline patients was NT-pro BNP. The AUC for this marker was 0.98,
revealing an excellent behavior of NT-proBNP to diagnose CHF in cats. The AUC for
hscTnI and AGP were 0.84 and 0.89 respectively.
An NT-proBNP concentration higher than 1234 pmol/L was the optimal cut off point
for prediction of CHF in cats with cardiac disease, with a sensitivity of 90.91% and a
specificity of 100%. Employing this cut off point, 95.45% of cats in CHF included in
group I would have been correctly diagnosed.
The logistic regression analysis found no benefit in combining these three biomarkers
(as a “panel of cardiac biomarkers”) to predict CHF in cats with primary cardiac
disease.

96
b) GROUP II. CATS WITH SYSTEMIC DISEASES
There were 43 cats that met the requirements for inclusion in this group. Twenty three of
these cats were neutered males, 15 were neutered females, 4 intact males and 1 intact
female. This group included 32 DSH, two Ragdolls, two Siamese and there was one cat each
of Bengal, Birman, British Shorthair, Domestic Longhair, Korat, Persian and Tonkinese. The
median weight of this group of cats was 3.73 Kg (range: 1.4 - 7.2 kg) and the median age
was 9 years (range: 5 months - 19 years).
Brief echocardiographic examinations were performed on 35 of these patients (81%) and no
structural abnormalities were identified. Five of the 35 scanned cats had soft murmurs
(grade II/VI or less) on auscultation. These five cats had normal echocardiographic studies
and three of them were anaemic. Eight cats from group II did not undergo echocardiographic
examination due to their fractious nature or poor health; all of these had normal cardiac
auscultations. Biomarker concentrations obtained from cats included in group II are
summarized in table 4.3.
0.0
00
.25
0.5
00
.75
1.0
0
Se
nsi
tivity
0.00 0.25 0.50 0.75 1.001 - Specificity
Area under ROC curve = 0.8347
0.0
00
.25
0.5
00
.75
1.0
0
Se
nsi
tivity
0.00 0.25 0.50 0.75 1.001 - Specificity
Area under ROC curve = 0.9835
A B
0.0
00
.25
0.5
00
.75
1.0
0
Se
nsi
tivity
0.00 0.25 0.50 0.75 1.001 - Specificity
Area under ROC curve = 0.8926
C
FIGURE 4.5 . ROC curves for NT-proBNP, hscTnI and AGP as predictors of CHF in
cats with cardiac disease. A, ROC curve for hscTnI, this test had an AUC of 0.8347. B, ROC
curve for NT-proBNP, its AUC was 0.9835. C, ROC curve for AGP whose AUC was 0.8926.
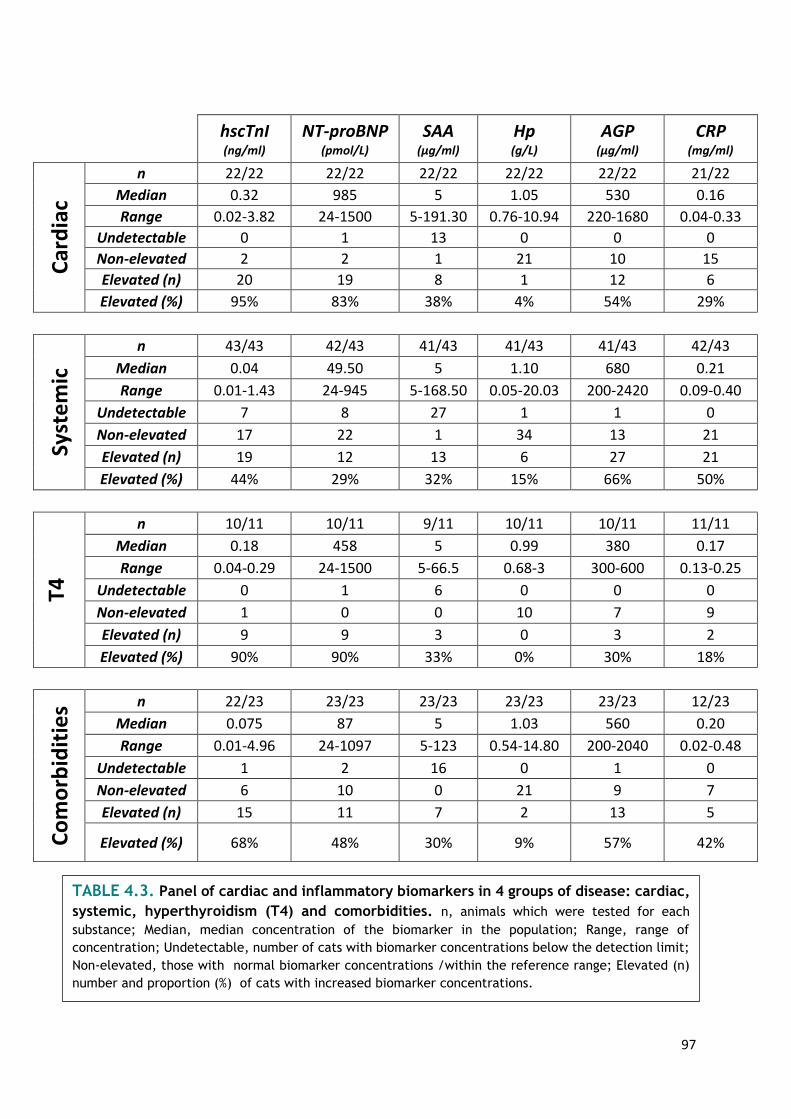
97
hscTnI (ng/ml)
NT-proBNP (pmol/L)
SAA (µg/ml)
Hp (g/L)
AGP (µg/ml)
CRP (mg/ml)
Car
dia
c
n 22/22 22/22 22/22 22/22 22/22 21/22
Median 0.32 985 5 1.05 530 0.16
Range 0.02-3.82 24-1500 5-191.30 0.76-10.94 220-1680 0.04-0.33
Undetectable 0 1 13 0 0 0
Non-elevated 2 2 1 21 10 15
Elevated (n) 20 19 8 1 12 6
Elevated (%) 95% 83% 38% 4% 54% 29%
Syst
em
ic
n 43/43 42/43 41/43 41/43 41/43 42/43
Median 0.04 49.50 5 1.10 680 0.21
Range 0.01-1.43 24-945 5-168.50 0.05-20.03 200-2420 0.09-0.40
Undetectable 7 8 27 1 1 0
Non-elevated 17 22 1 34 13 21
Elevated (n) 19 12 13 6 27 21
Elevated (%) 44% 29% 32% 15% 66% 50%
T4
n 10/11 10/11 9/11 10/11 10/11 11/11
Median 0.18 458 5 0.99 380 0.17
Range 0.04-0.29 24-1500 5-66.5 0.68-3 300-600 0.13-0.25
Undetectable 0 1 6 0 0 0
Non-elevated 1 0 0 10 7 9
Elevated (n) 9 9 3 0 3 2
Elevated (%) 90% 90% 33% 0% 30% 18%
Co
mo
rbid
itie
s n 22/23 23/23 23/23 23/23 23/23 12/23
Median 0.075 87 5 1.03 560 0.20
Range 0.01-4.96 24-1097 5-123 0.54-14.80 200-2040 0.02-0.48
Undetectable 1 2 16 0 1 0
Non-elevated 6 10 0 21 9 7
Elevated (n) 15 11 7 2 13 5
Elevated (%) 68% 48% 30% 9% 57% 42%
TABLE 4.3. Panel of cardiac and inflammatory biomarkers in 4 groups of disease: cardiac,
systemic, hyperthyroidism (T4) and comorbidities. n, animals which were tested for each
substance; Median, median concentration of the biomarker in the population; Range, range of
concentration; Undetectable, number of cats with biomarker concentrations below the detection limit;
Non-elevated, those with normal biomarker concentrations /within the reference range; Elevated (n)
number and proportion (%) of cats with increased biomarker concentrations.

98
c) GROUP III. Cats with hyperthyroidism
After six months of recruitment, eleven hyperthyroid cats were included in the
present study. Nine of these eleven patients were neutered male, one was a
neutered female and the other one was an intact female. All recruited hyperthyroid
cats were DSH. The median age of group III was 13 years ( range: 6 - 18 years) and
median weight was 4.13 kg (range:2.5-5.5 kg). Of the eleven cats, thoracic
auscultation abnormalities were detected in six individuals. Four cats had audible
murmurs and 2 had gallop sounds. Echocardiographic examination was performed on
nine hyperthyroid cats and abnormalities were detected in five of them. Three cats
were in CHF. Biomarker concentrations from hyperthyroid cats are included in table
4.3.
d) GROUP IV. Cats with comorbidities
Group IV population comprised 23 cats with two or more concurrent conditions
included in the previous groups hence, cardiac, systemic or hyperthyroid diseases
(e.g HCM and inflammatory bowel disease or hyperthyroidism and mediastinal
neoplasia). Of these, twelve were neutered males, nine neutered females and one
intact female and one intact male. There were 17 DSH, three Ragdolls, one Siamese,
one Bengal and one Maine Coon which fullfilled the inclusion criteria. The median
age of the group was 8 years ( range: 10 months to 17 years) and median weight was
4.1 kg ( range: 2 - 7 kg). Nineteen of the twenty-three cats had abnormal thoracic
auscultations. Murmurs were audible in fourteen cats, gallops sounds were detected
in one cat, three individuals had an audible arrhythmia and one cat had a murmur
and gallop sounds combined. Electrocardiography showed VPCs in three cases.
Nineteen cats underwent echocardiographic examination. The four cats that were
not scanned had abnormal cardiac auscultation and the following concurrent
conditions: pulmonary neoplasia, gastric lymphoma and hepatopathy (n=2). As these
cats had systemic diseases but the absence of concurrent cardiac disease could not
be ruled out, they were included in group IV instead of group II. Of the nineteen cats
that were scanned, 16 had some kind of abnormality on their echocardiographic
studies, with compensated HCM the most common finding. Two cats had pleural
effusion and one of these also had a small volume of pericardial effusion. The first
was a two-year old, male neutered ragdoll with biatrial enlargement whose final
diagnosis was feline infectious peritonitis (Feline Coronavirus antibody titre greater
99
than 1280, hyperproteinemia, hyperglobulinemia, anaemia and abnormal
appearance of the right kidney) and concurrent hypertrophic cardiomyopathy and
CHF. The second case was a cat finally diagnosed with feline systemic reactive
angioendotheliomatosis after a post-mortem examination, as vascular proliferative
lesions were present in the myocardium, liver and kidneys. The echocardiographic
examination of this patient revealed normal atrial size, good systolic function, mild
pericardial effusion, moderate pleural effusion and hypertrophy of the left
ventricular free wall and interventricular septum. The results of this group are
compiled in table 4.3.
4.3.2. COMPARISON BETWEEN 4 STUDY GROUPS
Cats with cardiac disease had significantly higher hscTnI and NT-proBNP
concentrations than cats with systemic diseases (P<0.001, P<0.001) and
comorbidities (P=0.010, P<0.001). No differences regarding cardiac biomarker levels
were found between cats with cardiac disease and hyperthyroidism (P=0.13;
P=0.30). Hyperthyroid cats had significantly higher NT-proBNP concentrations than
cats with systemic disease (P<0.001) and comorbidities (P=0.03). Hyperthyroid cats
had significantly higher hscTnI concentrations than cats with systemic diseases
(P=0.02) but not when compared with those with comorbidities (P=0.25). Finally,
cats with comorbidities showed significantly higher hscTnI and NT-proBNP levels
than cats with systemic disease (P= 0.04; P =0.03).
Regarding the APP results, no significant differences in either SAA or Hp
concentrations were detected between the four groups of disease. Cats with
systemic diseases had significantly higher AGP and CRP concentrations than cats with
hyperthyroidism (P=0.008; P=0.01) but no differences were identified when
compared with cats with cardiac diseases (P=0.14; P =0.08) or those with
comorbidities (P=0.34; P=0.55).
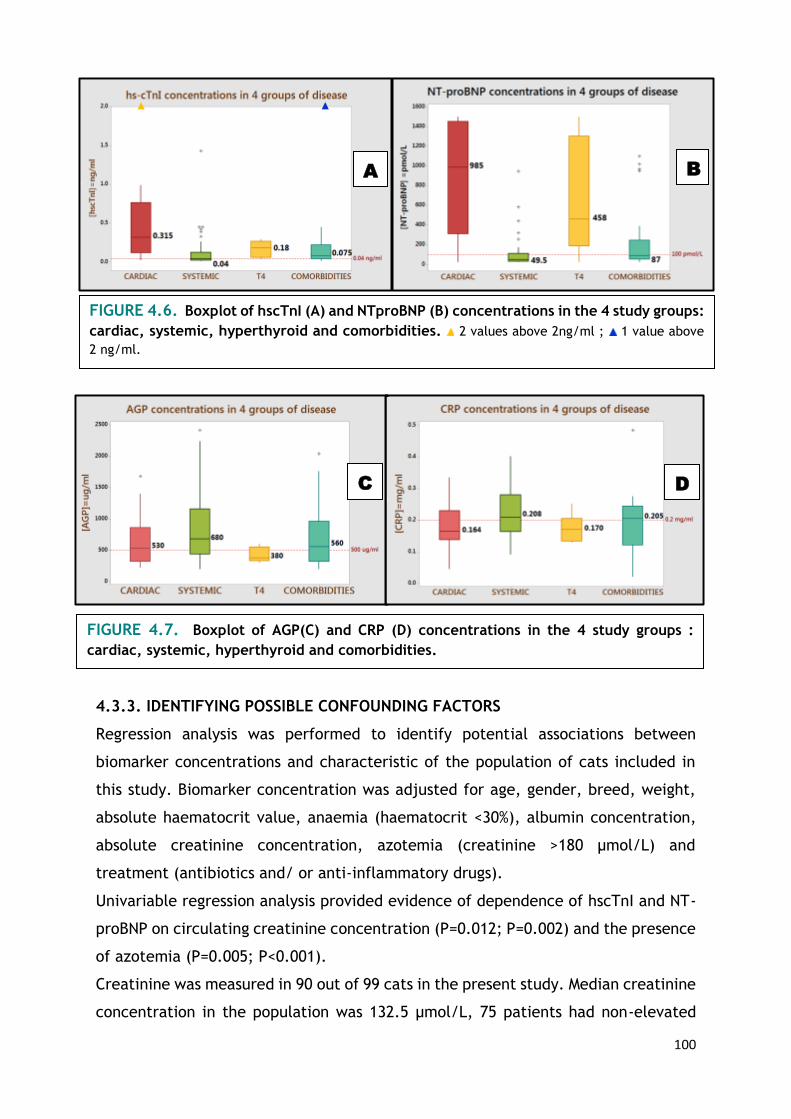
100
4.3.3. IDENTIFYING POSSIBLE CONFOUNDING FACTORS
Regression analysis was performed to identify potential associations between
biomarker concentrations and characteristic of the population of cats included in
this study. Biomarker concentration was adjusted for age, gender, breed, weight,
absolute haematocrit value, anaemia (haematocrit <30%), albumin concentration,
absolute creatinine concentration, azotemia (creatinine >180 µmol/L) and
treatment (antibiotics and/ or anti-inflammatory drugs).
Univariable regression analysis provided evidence of dependence of hscTnI and NT-
proBNP on circulating creatinine concentration (P=0.012; P=0.002) and the presence
of azotemia (P=0.005; P<0.001).
Creatinine was measured in 90 out of 99 cats in the present study. Median creatinine
concentration in the population was 132.5 µmol/L, 75 patients had non-elevated
FIGURE 4.7. Boxplot of AGP(C) and CRP (D) concentrations in the 4 study groups :
cardiac, systemic, hyperthyroid and comorbidities.
C D
FIGURE 4.6. Boxplot of hscTnI (A) and NTproBNP (B) concentrations in the 4 study groups:
cardiac, systemic, hyperthyroid and comorbidities. 2 values above 2ng/ml ; 1 value above
2 ng/ml.
A B

101
levels and 15 were azotaemic (>180 µmol/L). Increased hscTnI concentrations were
found in 63 cats of the total population and 51 individuals had increased NT-proBNP
values. There were 19 cats with systemic disease with increased hscTnI
concentrations. Of these, 6 cats had normal plasma creatinine concentrations,
haematocrit and echocardiographic examination. On the other hand, there were 12
patients with systemic disease that had increased NT-proBNP. Four of these, had
normal creatinine, haematocrit and echocardiographic examinations.
SAA concentrations were associated with body weight (P=0.03), haematocrit
(P=0.004) and the presence of anaemia (P=0.03). However, after adjusting for
weight, anaemia and haematocrit using multivariate analysis the associations were
no longer statistically significant (P=0.063). There was an inverse relationship
between SAA and haematocrit. AGP concentrations were associated with weight
(P=0.005), albumin levels (0.008), haematocrit (P<0.001) and anaemia (P<0.001).
When AGP concentrations were adjusted for haematocrit, weight and albumin levels
using multivariable analysis, the association between AGP and albumin was no longer
significant (P=0.44). Similarly to SAA, one could expect higher AGP concentrations
in individuals with lower haematocrit values.
Haematocrit values were available from 72 cats out of the 99 included in the study.
The median haematocrit was 34.4%. There were 22 cats with haematocrit values
below 30% whereas 50 were above this reference range. SAA was increased in 31
cats whereas AGP was elevated in 55.
No associations were found between Hp or CRP with the variables age, weight,
gender, anaemia, haematocrit, albumin, creatinine, azotaemia or treatment.
4.4. Discussion
4.4.1. APP
Each animal species has its own major APP that must be considered the marker of
choice for diagnostic purposes [Paltrinieri, 2008]. While CRP and SAA are
considered major APP in the dog, SAA and AGP are thought to play a major role in
the APR in the cat. However, data regarding APP levels in cats are scarce and mostly
focused on general aspects of feline APP biology [Ceron et al. 2005; Paltrinieri,
2008].

102
The concentrations of four positive acute phase reactants were determined in this
well-characterized population of 99 cats. AGP was the most frequently increased
acute phase protein in the study population as 57% of the patients had elevated
concentrations. Interestingly, CRP was the second most commonly elevated, being
above the reference range in 40% of the patients whereas SAA was increased in 33%
and Hp in 9% of the cats.
Most of the studies on feline AGP have focused on infectious diseases, with particular
interest in FIP. Many studies illustrated that AGP is not exclusive or pathognomonic
for FIP as cats with FIV or exposed to FCoV but asymptomatic had increases in AGP
concentrations [Duthie et al. 1997; Giordano et al. 2004; Paltrinieri et al. 2007a,
Paltrinieri et al. 2007b]. Indeed, cats with lymphoma [Correa et al. 2001], tumor
bearing cats [Selting et al. 2000], cats with anaemia secondary to abscesses,
pyothorax and fat necrosis [Ottenjann et al. 2006], cats infected with Chlamydiae
[TerWee et al. 1998], and cats with a wide variety of conditions [Kann et al. 2012]
have been shown to have increased AGP concentrations.
One of the most interesting findings of the present study is the possible usefulness
of AGP as a predictor of CHF in cats with cardiac conditions. Cats with CHF had
significantly higher concentrations of hscTnI, NT-proBNP and AGP. In addition, APP
concentrations in cats with cardiac disease were not significantly different
compared to those obtained from cats with systemic diseases. ROC curves revealed
that AGP is as good as hscTnI and NT-proBNP as a predictor of CHF in cats with
cardiac conditions. However combining these three biomarkers did not provide
additional information.
Importantly, mean AGP was not significantly different in cats with systemic disease
and those with cardiac disease. Given that AGP was significantly higher in cats with
cardiac disease and CHF when compared with cats with stable cardiac disease, hence
concurrent systemic disease in the former cannot be completely rule out. However,
these patients underwent several physical examinations and clinical tests, making
this scenario unlikely.
There is a growing body of evidence in both human and veterinary medicine to
suggest that inflammation plays an important role in the aetiopathogenesis of CHF
(“The cytokine hypothesis of CHF”). It is thought that CHF progresses, at least in
part, as a result of the local and systemic effects exerted by these cytokines [Araujo
103
et al. 2009]. CRP is elevated in human patients with CHF [Pye et al. 1990; Huang
et al. 2004] and it has been proven to predict short and long-term CHF development
in patients with stable coronary heart disease and patients with myocardial
infarction [Berton et al. 2003; Suleiman et al. 2003; Sabatine et al. 2007;
Williams et al. 2008]. CRP has been also associated with a significant improvement
in the prediction of adverse events in cardiovascular disease, beyond that observed
with conventional risk factors [Kaptoge et al. 2012]. Controversial data have been
published regarding CRP concentrations in dogs with cardiac disease and CHF. One
study showed that dogs in CHF had significantly higher CRP concentrations compared
to the healthy controls [Cunningham et al. 2012] whereas there was no association
with CHF in three other studies [Rush et al. 2006; Ljungvall et al. 2010;
Cunningham et al. 2013]. To the authors’ knowledge, this is the first study to
evidence increased AGP concentrations in cats with cardiac disease in CHF.
AGP has been shown to be present in several extra-hepatic tissues including the
myocardium and active synthesis has been proven in endothelial cells [Siegel et al.
1985; Sörensson et al. 1999]. This study was not designed to find causal
relationships and further investigations will be required to clarify the association
between CHF and increased AGP concentrations in cats.
Notably, SAA was undetectable in a significant number of patients despite being
considered a major APP in the cat. There were 62 out of 95 cats with SAA
concentrations below the reference range (<5µg/ml). Two large studies on SAA
concentrations in cats have been published. The first compared SAA concentrations
in healthy cats (n=45) and cats with a wide variety of conditions (n=312). SAA
concentrations from controls were significantly lower in comparison with those
obtained from diseased cats. However, among different disease groups, those cats
with enteritis (n=9), oral disorders (n=14) and liver disorders (n=21) had SAA
concentrations not significantly different than controls [Sasaki et al. 2003]. The
second study examined a population of 175 cats. Of these 110 had normal SAA
concentrations whereas 65 (37%) had increased SAA concentrations [Tamamoto et
al. 2013]. Similarly, in the present study only 33% of the subjects had increased SAA
concentrations. No differences between cats with cardiac disease, hyperthyroidism,
comorbidities or systemic disease in terms of SAA concentrations were found. Thus,
SAA might be a useful marker for some, but not for all feline inflammatory

104
conditions. Furthermore, SAA is believed to be one of the APPs most rapidly
responsive in the cat [Eckersall and Bell, 2010]. Major proteins are often observed
to increase markedly within the first 48 hours after the triggering event and often
have a rapid decline due to their short half-life. Moderate and minor proteins
increase more slowly and may be observed more often during chronic inflammatory
processes [Cray et al. 2009]. Hence, these results might mirror the presence of
chronic conditions or animals with treated (well-controlled) diseases in our study
population.
Multiple regression analysis demonstrated an inverse relationship between AGP, SAA
and haematocrit. Increased SAA values have been described in cats with
experimentally induced feline infectious anaemia [Korman et al. 2012] and
increased AGP concentrations have been described in cats with anaemia secondary
to inflammatory diseases (abscesses, pyothorax and fat necrosis) [Ottenjann et al.
2006]. In view of these results, hematology analysis should be performed when
interpreting SAA and AGP measurements.
CRP is considered a major acute phase protein in dogs, humans and non-human
primates while it is thought to be an insensitive protein in the feline acute phase
reaction [Kajikawa et al. 1999; Ceron et al. 2005; Cray et al. 2009; Eckersall and
Bell 2010; Jain et al. 2011]. As a consequence, data regarding CRP concentrations
are scarce and it has not been well studied in the cat. Conflicting results have been
published regarding the role of CRP in the feline APR. One study revealed that, in
contrast to the considerable elevations of SAA, Hp and AGP after turpentine oil
administration or urinary surgical procedures only small increases were observed in
CRP concentrations in cats [Kajikawa et al. 1999]. Another study assessed the
usefulness of interferon-ω therapy in cats naturally infected with retrovirus. In that
study, CRP behaved similarly to SAA and AGP, increasing significantly after 65 days
of treatment [Leal et al. 2014]. CRP was the second most commonly increased APP
in the present study. Group II (systemic disease) and Group IV (comorbidities) had
median CRP concentrations slightly above the reference range. Thus, CRP may also
have a value as a biomarker in some conditions and further investigations are
required to determine its role in feline inflammation.
Hp is considered a minor APP in the cat. Increased Hp concentrations have been
described in cats with anaemia secondary to inflammatory diseases [Ottenjann et

105
al. 2006], cats which were given subcutaneous turpentine oil or LPS and cats that
underwent urinary surgery [Kajikawa et al. 1999], cats with FIP and FIV infections
[Duthie et al. 1997; Giordano et al. 2004] and cats with a wide variety of
unspecified conditions [Kann et al. 2012]. In contrast to previous publications, Hp
was only elevated in 9 out of 96 cats in the present prospective study. Regression
analysis did not show any association between anaemia and Hp. Thus the usefulness
of Hp as an inflammatory biomarker in feline medical conditions seems to be less
promising than expected.
4.4.2. Cardiac biomarkers
The two cardiac biomarkers behaved similarly. ROC curve analysis revealed that both
markers were useful to distinguish cats with CHF from the group of cats with
compensated cardiac disease although NT-proBNP was superior. Indeed, NT-proBNP
has been shown to provide a reliable means of discriminating cats with CHF from
those with primary respiratory causes of dyspnea in several studies [Collins, 2013;
Wess et al. 2008; Fox et al. 2009; Connolly et al. 2009b] whereas cTnI seems to
be unsuitable for the same purpose [Herndon et al. 2008; Connolly et al. 2009a;
Wells et al. 2014]. Nevertheless, recent publications have demonstrated the
potential of cTnI as a prognostic biomarker in cats with cardiomyopathy [Langhorn
et al. 2014b; Borgeat et al. 2014]. Even more, cTnI has been proven to be superior
over NT-proBNP as a prognostic marker in cats with HCM [Borgeat et al. 2014].
Clinicians should then know that these biomarkers seem to offer different
information; while NT-proBNP is better as a CHF predictor, cTnI appears to be
superior at predicting poor outcomes in cats with cardiac disease.
Hyperthyroid cats had increased NT-proBNP and hscTnI concentrations in the present
study. These findings were predictable, as cardiac biomarkers have been previously
demonstrated to be elevated in cats with hyperthyroidism [Connolly et al. 2005;
Menaut et al. 2012; Sangster et al. 2014]. Our prospective study not only supports
these findings but also confirms that cardiac and hyperthyroid cats cannot be
distinguished from their APP concentrations.
One of the strengths of this prospective study is that most of the animals underwent
echocardiographic examination to prevent misclassification of the patients with
subclinical cardiac disease. Heart scans were performed in 84 out of 99 cats,
including 35 out of 43 cats with systemic diseases. Despite this, many cats in group

106
II had increased hscTnI (44%) and NT-proBNP (29%) concentrations. Cardiac
biomarker elevations are not uncommon in patients with conditions other than
primary cardiac diseases. In cats, cTnI has been proven to be elevated in
hyperthyroidism [Connolly et al. 2005; Sangster et al. 2014], azotemia [Porciello
et al. 2008], anaemia [Lalor et al. 2014], blunt chest trauma [Kirbach et al. 2000],
and non-cardiogenic causes of dyspnea [Herndon et al. 2008; Connolly et al.
2009a; Wells et al. 2014]. On the other hand, NT-proBNP has been demonstrated
to be elevated in cats with hyperthyroidism [Menaut et al. 2012; Sangster et al.
2014] and hypertension [Lalor et al. 2009]. The latter identified a significant
positive correlation between NT-proANP and plasma creatinine concentration but
this correlation was not present with NT-proBNP. In contrast, the presence of
azotemia was a significant confounding factor in the evaluation of NT-proBNP in the
present study. In fact, an NT-proBNP and plasma creatinine association has also
previously been described in human and canine patients [McCullough and Sandberg,
2003; Luchner et al. 2005; Boswood et al. 2008; Schmidt et al. 2009] No
associations between these markers and anaemia were found in the present study.
LIMITATIONS
An important limitation of this study was the storage of the samples. Serum samples
were kept at -20°C for a maximum of 6 months. Recently, a 4-month stability study
was carried out revealing that cTnI recovery decreased below acceptable limits
(down to 72%) when samples were stored for 4 months at -20°C [Langhorn et al.
2014b]. Previous studies have shown apparently normal NTproBNP bioreactivity in
feline samples stored for up to ten years at -80°C however, slight but significant
reductions have been observed in human samples stored at -20°C for two years
[Cauliez et al. 2008; Lalor et al. 2009]. This could have resulted in a minor
degradation of cardiac biomarkers in the samples. Secondly, biochemistry and
hematology were not available for every cat included in this study. Thirdly, many
recruited cats were already on treatment (antibiotic or anti-inflammatory drugs) at
the moment of sampling and APP are known to fluctuate in response to medication
[Tamamoto et al. 2009]. Fourthly, samples were collected from cats with a wide
variety of conditions and no controls were recruited. This may have an influence on
interpretation as it has been shown that magnitude of increase of some APP differs
107
between illnesses [Sasaki et al. 2003]. Fifthly, echocardiography was not performed
in all cats.
CONCLUSION
In conclusion, in this well characterized population of cats the most commonly
increased APP was AGP followed by CRP, SAA and Hp, respectively. This is opposite
to the recommendation of measuring SAA and Hp as inflammatory panel in cats.
Further investigations, including these 4 APP, are required to understand their real
role in the feline APR.
APPs were shown to be unsuitable to distinguish between cats with cardiac,
hyperthyroid and non-cardiac diseases.
AGP was as good as NT-proBNP or hscTnI to distinguish between cats with cardiac
disease with and without CHF. This possible role of AGP as a marker of CHF has not
been described before and further research should be done.
NT-proBNP and hscTnI concentrations were significantly higher in cats with cardiac
disease and hyperthyroidism than in cats with systemic disease. However, both
cardiac biomarkers were elevated in a substantial number of cats with non-cardiac
non-hyperthyroid systemic diseases.
No correlation was found between cardiac and inflammatory markers making the
theory of myocardial damage/troponin release induced by inflammation less likely
in patients with non-cardiac diseases.
A positive association was detected between cardiac biomarkers and plasma
creatinine concentrations and between anaemia and SAA and AGP concentration.
Haematology and biochemistry analysis are required in order to interpret biomarker
results properly.

108
109
FINAL CONCLUSIONS AND FUTURE RESEARCH
The number of publications studying cTnI in small animal veterinary medicine has
significantly increased in the last decade. Several factors may influence cTnI release
and measurement. In consequence, many conflicting results have been reported
challenging the ability of clinicians to interpret the test.
Two essential recommendations to read cTnI results are :
It is imperative to consider cTnI as a non-specific biomarker of myocardial injury.
An elevation of cTnI indicates the presence of myocardial injury but does not define
the underlying cause. cTnI is a highly specific biochemical marker (we are certain
about its cardiac origin) but non-specific clinical marker (we are uncertain the
cause). Elevations are not uncommon in veterinary patients with conditions other
than primary cardiac disease. Therefore, raised cardiac troponin alone will never
allow practitioners to make a clinical diagnosis. Full blood work and cardiac
examination should be done in patients with elevated cTnI.
Secondly, the lack of standardization of cTnI assay systems has meant an inability to
compare absolute values between methods. Reference ranges and cut-off values
obtained in previous studies with different analyzers are not interchangeable and
should not be used in practice to make clinical decisions. Practitioners should use
reference ranges given by their laboratory.
Results of this study confirm that high cTnI concentrations are associated with
shorter survival times in dogs and cats with cardiac disease. Animals with higher cTnI
concentrations had shorter survival times. However, cTnI was superior to predict
cardiac death in cats than in dogs. Several factors may have affected these results.
There was a wide clinical and morphologic heterogeneity of canine cardiac diseases
included in the study. Pathophysiological mechanisms may vary notably between
cardiomyopathies, valvular, congenital and/or pericardial diseases and this could
directly impact on the magnitude and velocity of cTnI release. In contrast, the feline
population was more homogenous as most of the cats suffer from cardiomyopathy.
Furthermore, a high incidence of arrhythmias was present in the canine population.
The role of arrhythmias in cTnI release remains unknown. Significantly higher cTnI
levels were found in those dogs with more severe arrhythmias but some of them
experienced fairly good outcomes. The author hypothesizes that the presence of an
arrhythmia (especially tachyarrhythmias) may cause a significant transient increase
110
of cTnI that would cease once the rhythm is controlled. Therefore, the author
believes the prognostic value of cTnI in dogs which present with arrhythmias should
be interpreted with caution. Finally, due to the overlap of cTnI concentration
between survivors and non-survivors in both canine and feline patients, clinical
decisions should not be done relying merely on cTnI results.
Assessing the relationship between arrhythmias, cTnI and survival is an enthralling
area of research. Comparative studies with serial cTnI measurements in dogs with
well controlled arrhythmias versus animals with uncontrolled rhythm disturbances
will be of particular interest.
Results of the prospective study demonstrated that AGP was the most commonly
elevated APP in our well-characterized population of cats. AGP was followed by CRP,
SAA and Hp concentrations respectively.
The feline APR is still uncharted territory, the information available is scarce and
conflicting. CRP is considered a non-responsive protein in the APR in this species and
measurement of SAA and Hp is recommended to assess inflammation in cats.
Clarifying the real role of CRP, AGP, SAA and Hp in feline APR represents an
intriguing line of future research.
A considerable number of cats with non-cardiac diseases had increased hscTnI and
NT-proBNP. Cardiac biomarkers were associated with plasma creatinine levels.
Nevertheless, there was still a group of patients with normal echo, normal
haematocrit and non-azotaemic with increased cardiac markers. Several authors
have proposed inflammation as a source of troponin release in dogs with non-cardiac
diseases. In the present study, the relationship between cardiac and inflammatory
markers did not reach statistical significance. However, in cats with cardiac disease
AGP was significantly higher in animals in CHF and turned out to be as good predictor
of CHF in cats as NT-proBNP and hscTnI. Thus, inflammation may be involved in the
release of cardiac biomarkers in some but not all feline conditions. Further
investigations regarding the usefulness of AGP as a predictor of CHF and cardiac
death in cats would also be an attractive future work.

111
112
REFERENCES
❖ Ablij, H. C. and Meinders, A. E. (2002). C-reactive protein: History and
revival. European Journal of Internal Medicine, 13, 412–422.
❖ Abbott, J.A (2008). Acquired Valvular Disease. In: Manual of Canine and Feline
Cardiology. Saunders. Fourth Edition.110-138.
❖ Adamantos, S., Boag, A., Hughes, D. (2005). Clinical use of a haemoglobin-
based oxygen-carrying solution in dogs and cats. In Practice, 27, 399-405.
❖ Adamcova, M., Sterba, M., Simunek, T., Potacova, A., Popelova, O.,
Mazurova, Y., Gersl, V. (2005). Troponin as a marker of myocardial damage
in drug-induced cardiotoxicity. Expert Opinion on Drug Safety, 4(3), 457–472
❖ Adams J.E., Abendschein D.R., Jaffe A.S. (1993). Biochemical markers of
myocardial injury. Is MB creatine kinase the choice for the 1990s? Circulation,
88, 750-63
❖ Adams, J.N., Cox, A. J., Freedman, B. I., Langefeld, C. D., Carr, J. J., &
Bowden, D. W. (2013). Genetic analysis of haptoglobin polymorphisms with
cardiovascular disease and type 2 diabetes in the Diabetes Heart Study.
Cardiovascular Diabetology, 12, 31.
❖ Alpert, J. S., Thygesen, K., Antman, E., Bassand, J. P. (2000). Myocardial
infarction redefined--a consensus document of The Joint European Society of
Cardiology/American College of Cardiology Committee for the redefinition of
myocardial infarction. Journal of the American College of Cardiology, 36(3),
959–969.
❖ Araújo, J. P., Lourenço, P., Azevedo, A., Friões, F., Rocha-Gonçalves, F.,
Ferreira, A., Bettencourt, P. (2009). Prognostic Value of High-Sensitivity C-
Reactive Protein in Heart Failure: A Systematic Review. Journal of Cardiac
Failure, 15(3), 256–266.
❖ Atkinson A.J., J., Colburn, W. A., DeGruttola, V. G., DeMets, D. L., Downing,
G. J., Hoth, D. F., Zeger, S. L. (2001). Biomarkers and surrogate endpoints:
Preferred definitions and conceptual framework. Clinical Pharmacology and
Therapeutics, 69, 89–95.
❖ Barr, S. C., Warner, K. L., Kornreic, B. G., Piscitelli, J., Wolfe, A., Benet, L.,
McKerrow, J. H. (2005). A cysteine protease inhibitor protects dogs from

113
cardiac damage during infection by Trypanosoma cruzi. Antimicrobial Agents
and Chemotherapy, 49, 5160–5161.
❖ Baumwart, R. D., Orvalho, J., Meurs, K. M. (2007). Evaluation of serum
cardiac troponin I concentration in Boxers with arrhythmogenic right
ventricular cardiomyopathy. American journal of veterinary research, 68,
524–528.
❖ Beatty, J. A., Barrs, V. R., Martin, P. A., Nicoll, R. G., France, M. P., Foster,
S. F., Malik, R. (2002). Spontaneous hepatic rupture in six cats with systemic
amyloidosis. Journal of Small Animal Practice. 355–363.
❖ Bergmann, O., Bhardwaj, R. D., Bernard, S., Zdunek, S., Barnabé-Heide, F.,
Walsh, S., Frisén, J. (2009). Evidence for cardiomyocyte renewal in humans.
Science, 324(5923), 98–102.
❖ Berton, G., Cordiano, R., Palmieri, R., Pianca, S., Pagliara, V., Palatini, P.
(2003). C-reactive protein in acute myocardial infarction: Association with
heart failure. American Heart Journal, 145(6), 1094–1101.
❖ Blum, A., Tatur, I., Simsolo, C. (2004). Vipera palaestinae envenomation-
induced bradycardia. European Journal of Internal Medicine 2004,15,134.
❖ Bodor, G. S., Survant, L., Voss, E. M., Smith, S., Porterfield, D., Apple, F. S.
(1997). Cardiac troponin T composition in normal and regenerating human
skeletal muscle. Clinical Chemistry, 43(3), 476–484.
❖ Boon, J.A. (2011). Evaluation of Size, Function and Haemodynamics. In:
Veterinary Echocardiography. Wiley-Blackwell. 2nd Ed. 153-249.
❖ Borgeat, K., Sherwood, K., Payne, J. R., Luis Fuentes, V., Connolly, D. J.
(2014). Plasma Cardiac Troponin I Concentration and Cardiac Death in Cats
with Hypertrophic Cardiomyopathy. Journal of veterinary internal medicine /
American College of Veterinary Internal Medicine, 28, 1731–1737.
❖ Boswood, A., Dukes-McEwan, J., Loureiro, J., James, R. A., Martin, M.,
Stafford-Johnson, M., Attree, S. (2008). The diagnostic accuracy of different
natriuretic peptides in the investigation of canine cardiac disease. Journal of
Small Animal Practice, 49, 26–32.
❖ Brancaccio, P., Maffulli, N., Limongelli, F. M. (2007). Creatine kinase
monitoring in sport medicine. British Medical Bulletin. 81-82 (1), 209–230,
114
❖ Burgener, I. A., Kovacevic, A., Mauldin, G. N., Lombard, C. W. (2006). Cardiac
Troponin as Indicators of Acute Myocardial Damage in Dogs. Journal of
Veterinary Internal Medicine, 20, 277–283.
❖ Carlberg, D. J., Tsuchitani, S., Barlotta, K. S., Brady, W. J. (2011). Serum
troponin testing in patients with paroxysmal supraventricular tachycardia:
Outcome after ED care. American Journal of Emergency Medicine, 29(5), 545–
548.
❖ Carretón, E., Corbera, J. A., Juste, M. C., Morchón, R., Simón, F., Montoya-
Alonso, J. A. (2011). Dirofilaria immitis infection in dogs: Cardiopulmonary
biomarker levels. Veterinary Parasitology, 176, 313–316.
❖ Carretón, E., Grandi, G., Morchón, R., Simón, F., Passeri, B., Cantoni, A. M.,
Montoya-Alonso, J. A. (2012). Myocardial damage in dogs affected by
heartworm disease (Dirofilaria immitis): Immunohistochemical study of
cardiac myoglobin and troponin I in naturally infected dogs. Veterinary
Parasitology, 189, 390–393.
❖ Carretón, E., Morchón, R., González-Miguel, J., Juste, M. C., Simón, F.,
Montoya-Alonso, J. A. (2013). Utility of cardiac biomarkers during adulticide
treatment of heartworm disease (Dirofilaria immitis) in dogs. Veterinary
Parasitology, 197, 244–250.
❖ Cauliez, B., Guignery, J., Marinier, S., Mariau, I., Lavoinne, A. (2008). Two-
year stability of NT-proBNP in frozen samples using the Roche Elecsys system.
Annals of Clinical Biochemistry, 45(Pt 3), 318–319.
❖ Cerón, J. J., Eckersall, P. D., Martínez-Subiela, S. (2005). Acute phase
proteins in dogs and cats: Current knowledge and future perspectives.
Veterinary Clinical Pathology, 34, 85–99.
❖ Cerón, J. J., Martinez-Subiela, S., Ohno, K., Caldin, M. (2008). A seven-point
plan for acute phase protein interpretation in companion animals. The
Veterinary Journal, 177, 6–7.
❖ Cesta, M. F., Baty, C. J., Keene, B. W., Smoak, I. W., Malarkey, D. E. (2005).
Pathology of end-stage remodeling in a family of cats with hypertrophic
cardiomyopathy. Veterinary Pathology, 42, 458–467.

115
❖ Champion, T., Francoy, C., Neto, G. B. P.,Camacho, A. A. (2013).
Electrocardiographic evaluation and serum cardiac troponin I levels in
anaemic dogs with blood parasitosis. Ciências Agrárias, 6, 2915-2924.
❖ Chan D.W., Taylor E., Frye R, Blitzer R.L. (1985). Immunoenzymetric assay
for creatine kinase MB with subunit-specific monoclonal antibodies compared
with an immunochemical method and electrophoresis. Clin Chem. 31(3), 465-
9.
❖ Chatterjee, K., Zhang, J., Honbo, N., Karliner, J. S. (2010). Doxorubicin
cardiomyopathy. Cardiology. 115, (2), 155-162.
❖ Chew, D. J., DiBartola, S. P., Schenck, P. A. (2011). Familial Renal Diseases
of Dogs and Cats. In: Canine and Feline Nephrology and Urology. 2nd Ed.
Elsevier, 197–217
❖ Chow, G. V, Hirsch, G. A., Spragg, D. D., Cai, J. X., Cheng, A., Ziegelstein, R.
C., Marine, J. E. (2010). Prognostic significance of cardiac troponin I levels in
hospitalized patients presenting with supraventricular tachycardia. Medicine,
89(3), 141–148.
❖ Christensen, M., Jacobsen, S., Ichiyanagi, T., Kjelgaard-Hansen, M. (2012).
Evaluation of an automated assay based on monoclonal anti-human serum
amyloid A (SAA) antibodies for measurement of canine, feline, and equine
SAA. Veterinary Journal, 194(3), 332–337.
❖ Christiansen, S., Redmann, K., Scheld, H. H., Jahn, U. R., Fobker, M., Gruber,
A. D., & Hammel, D. (2002). Adriamycin-induced Cardiomyopathy in the Dog
— an Appropriate Model for Research on Partial Left Ventriculectomy? Journal
of Heart and Lung Transplantation, 21(7), 783–790.
❖ Chun, R., Kellihan, H. B., Henik, R. A., Stepien, R. L. (2010). Comparison of
plasma cardiac troponin I concentrations among dogs with cardiac
hemangiosarcoma, noncardiac hemangiosarcoma, other neoplasms, and
pericardial effusion of nonhemangiosarcoma origin. Journal of the American
Veterinary Medical Association, 237, 806–811.
❖ Chung, T. F., Sipe, J. D., McKee, A., Fine, R. E., Schreiber, B. M., Liang, J.
S., Johnson, R. J. (2000). Serum amyloid A in Alzheimer’s disease brain is
predominantly localized to myelin sheaths and axonal membrane. Amyloid,
7, 105–110.

116
❖ Colby, E.D. and Low, R.J. (1970) Feline infectious peritonitis. Veterinary
Medicine Small Animal Clinic 65, 783-786.
❖ Collins, S. (2013). Measuring NT-proBNP in Small Animal Practice. Diploma in
Veterinary Cardiology. RCVS Knowledge. 1-60.
❖ Collinson, P. O., Boa, F. G., Gaze, D. C. (2001). Measurement of cardiac
troponins. Annals of Clinical Biochemistry, 38, 423–449.
❖ Colly, L.P. (1973) Feline infectious peritonitis. The Veterinary Clinics of North
America 3, 34
❖ Connolly, D. J., Cannata, J., Boswood, A., Archer, J., Groves, E. A., Neiger,
R. (2003). Cardiac troponin I in cats with hypertrophic cardiomyopathy.
Journal of Feline Medicine and Surgery, 5, 209–216.
❖ Connolly, D. J., Guitian, J., Boswood, A., Neiger, R. (2005). Serum troponin I
levels in hyperthyroid cats before and after treatment with radioactive
iodine. Journal of Feline Medicine and Surgery, 7, 289–300.
❖ Connolly, D. J., Brodbelt, D. C., Copeland, H., Collins, S., Fuentes, V. L.
(2009a). Assessment of the diagnostic accuracy of circulating cardiac troponin
I concentration to distinguish between cats with cardiac and non-cardiac
causes of respiratory distress. Journal of Veterinary Cardiology, 11, 71–8.
❖ Connolly, D. J., Magalhaes, R. J., Fuentes, V. L., Boswood, A., Cole, G., Boag,
A., Syme, H. M. (2009b). Assessment of the diagnostic accuracy of circulating
natriuretic peptide concentrations to distinguish between cats with cardiac
and non-cardiac causes of respiratory distress. Journal of Veterinary
Cardiology, S41-S50.
❖ Correa, S.S., Mauldin, G.N., Mauldin, G.E., Mooney, S.C (2001) Serum alpha
1-acid glycoprotein concentration in cats with lymphoma. Journal of the
American Animal Hospital Association 37, 153-158.
❖ Côté, E., MacDonald, KA, Meurs, KM, Sleeper, MM. (2011a). Chapter 11:
Hypertrophic Cardiomyopathy. In: Feline Cardiology, Wiley-Blackwell, 103-
175.
❖ Côté, E., MacDonald, KA, Meurs, KM, Sleeper, MM. (2011b). Chapter 12:
Restrictive/Unclassified Cardiomyopathy. In: Feline Cardiology, Wiley-
Blackwell, 177-181.

117
❖ Côté, E., MacDonald, KA, Meurs, KM, Sleeper, MM. (2011c). Chapter 26:
Endocrine Diseases Affecting the Heart. In: Feline Cardiology, Wiley-
Blackwell, 395-407.
❖ Cowell, R.L., Decker, L.S (2000). Interpretation of feline leukocyte responses.
In: Feldman B.F, Zinkl, J.G, Jain, N.C. Schalm (Eds) Veterinary Hematology.
Lippincott Williams and Wilkins. 382-390.
❖ Craig, R., and Lehman, W. (2001). Crossbridge and tropomyosin positions
observed in native, interacting thick and thin filaments. Journal of Molecular
Biology, 311(5), 1027–1036.
❖ Cray, C., Zaias, J., Altman, N. H. (2009). Acute phase response in animals: A
review. Comparative Medicine, 59, 517-526.
❖ Cummins, B., Auckland, M. L., Cummins, P. (1987). Cardiac-specific troponin-
I radioimmunoassay in the diagnosis of acute myocardial infarction. American
Heart Journal, 113(6), 1333–1344.
❖ Cunningham, S. M., Rush, J. E., Freeman, L. M. (2012). Systemic Inflammation
and Endothelial Dysfunction in Dogs with Congestive Heart Failure. Journal of
Veterinary Internal Medicine, 26(3), 547–557.
❖ Cunningham, S. M., Rush, J. E., Freeman, L. M. (2013). Short-term effects of
atorvastatin in normal dogs and dogs with congestive heart failure due to
myxomatous mitral valve disease. Journal of Veterinary Internal Medicine /
American College of Veterinary Internal Medicine, 27(4), 985–9.
❖ Defrancesco, T. C., Atkins, C. E., Keene, B. W., Coats, J. R., Hauck, M. L.
(2002). Prospective Clinical Evaluation of Serum Cardiac Troponin T in Dogs
Admitted to a Veterinary Teaching Hospital. Journal of Veterinary Emergency
and Critical Care, 16, 553–557.
❖ De Gennaro, L., Brunetti, N. D., Cuculo, A., Pellegrino, P. L., Izzo, P., Roma,
F., Di Biase, M. (2008). Increased troponin levels in nonischaemic cardiac
conditions and noncardiac diseases. Journal of Interventional Cardiology, 21,
129–139.
❖ DiBartola, S. P., Reiter, J. A., Cornacoff, J. B., Kociba, G. J., Benson, M. D.
(1989). Serum amyloid A protein concentration measured by radial
immunodiffusion in Abyssinian and non-Abyssinian cats. American Journal of
Veterinary Research, 50, 1414–1417.

118
❖ Diniz, P. P. V. P., De Morais, H. S. A., Breitschwerdt, E. B., & Schwartz, D. S.
(2008). Serum cardiac troponin I concentration in dogs with ehrlichiosis.
Journal of Veterinary Internal Medicine, 22, 1136–1143.
❖ Dolci, A. and Panteghini, M. (2006). The exciting story of cardiac biomarkers:
From retrospective detection to gold diagnostic standard for acute myocardial
infarction and more. Clinica Chimica Acta, 369, 179–187.
❖ Duthie, S., Eckersall, P. D., Addie, D. D., Lawrence, C. E., Jarrett, O. (1997).
Value of alpha 1-acid glycoprotein in the diagnosis of feline infectious
peritonitis. The Veterinary Record, 141, 299–303.
❖ Eckersall, PD (2002). Haptoglobin Assay. United States Patent. Nº:
US6451550B1.
❖ Eckersall, P.D., and Bell, R. (2010). Acute phase proteins: Biomarkers of
infection and inflammation in veterinary medicine. Veterinary Journal, 185,
23–27.
❖ Eckersall, P.D. and Schmidt, E. M. (2014), The final hurdles for acute phase
protein analysis in small animal practice. Journal of Small Animal Practice,
55, 1–3.
❖ Factor, S.F., Butany, J., Sole, M.J, Wigle, E.D., Williams, W.C., Rojkind, M.
(1991). Pathologic fibrosis and matrix connective tissue in the subaortic
myocardium of patients with hypertrophic cardiomyopathy. Journal of the
American College of Cardiology, 17(6), 1343-51.
❖ Falk, T., Ljungvall, I., Zois, N.E., Höglund, K., Olsen, L.H., Pedersen, H.D.,
Häggström, J. (2013). Cardiac troponin-I concentration, myocardial
arteriosclerosis, and fibrosis in dogs with congestive heart failure because of
myxomatous mitral valve disease. Journal of Veterinary Internal Medicine, 27,
500–506.
❖ Feng, J., Schaus, B. J., Fallavollita, J. A., Lee, T.C., Canty, J. M. (2001).
Preload induces troponin I degradation independently of myocardial ischemia.
Circulation, 103(16), 2035–2037.
❖ Ferasin, L. (2012). Feline Cardiomyopathy. In Practice, 34, 204-213.
❖ Fonfara, S., Loureiro, J., Swift, S., James, R., Cripps, P., Dukes-McEwan, J.
(2010). Cardiac troponin I as a marker for severity and prognosis of cardiac
disease in dogs. Veterinary Journal, 184, 334–339.
119
❖ Fournier, T., Bouach, N., Delafosse, C., Crestani, B., Aubier, M. (1999).
Inducible expression and regulation of the alpha 1-acid glycoprotein gene by
alveolar macrophages: prostaglandin E2 and cyclic AMP act as new positive
stimuli. Journal of Immunology, 163, 2883–2890.
❖ Fox, P.R. (2003). Hypertrophic Cardiomyopathy. Clinical and Pathologic
Correlates. Journal of Veterinary Cardiology, 5, 39–45.
❖ Fox, P.R. (2004). Endomyocardial fibrosis and restrictive cardiomyopathy:
pathologic and clinical features. Journal of Veterinary Cardiology, 6, 25–31.
❖ Fox, P. R., Oyama, M. A., Reynolds, C., Rush, J. E., DeFrancesco, T. C.,
Keene, B. W., Hogan, D. F. (2009). Utility of plasma N-terminal pro-brain
natriuretic peptide (NT-proBNP) to distinguish between congestive heart
failure and non-cardiac causes of acute dyspnea in cats. Journal of Veterinary
Cardiology, 11 Suppl 1, S51-61.
❖ Fox, S.I. (2006). Chapter 12. In: Human Physiology. 9th Edition. McGraw-Hill.
340-379
❖ French, A.T. (2010). Chapter 24: Pericardial Disease. In: BSAVA Manual of
Canine and Feline Cardiorespiratory Medicine. 2nd Ed., 213 -219.
❖ French, J.K. and White, H.D. (2004). Clinical implications of the new
definition of myocardial infarction.
❖ Friedrichs, W. E., Navarijo-Ashbaugh, A. L., Bowman, B. H., Yang, F. (1995).
Expression and inflammatory regulation of haptoglobin gene in adipocytes.
Biochemical and Biophysical Research Communications, 209, 250–256.
❖ Gabay, C. and Kushner, I. (1999). Acute-phase proteins and other systemic
responses to inflammation. The New England Journal of Medicine, 340, 448–
454.
❖ Galvani, M., Ottani, F., Ferrini, D., Ladenson, J. H., Destro, A., Baccos, D.,
Jaffe, A. S. (1997). Prognostic influence of elevated values of cardiac troponin
I in patients with unstable angina. Circulation, 95(8), 2053–2059.
❖ Gao, W. D., Atar, D., Liu, Y., Perez, N. G., Murphy, A. M., Marban, E. (1997).
Role of troponin I proteolysis in the pathogenesis of stunned myocardium.
Circulation Research, 80(3), 393–399.
❖ Geeves M.A and Lehrer S.S. (2002). Cooperativity in the Ca2+ regulation of
muscle contraction. Results Probl Cell Differ, 36,111-32.
120
❖ Gendler, S. J., DermGao, W. D., Atar, D., Liu, Y., Perez, N. G., Murphy, A.
M., & Marban, E. (1997). Role of troponin I proteolysis in the pathogenesis of
stunned myocardium. Circulation Research, 80(3), 393–399.er, G. B.,
Silverman, L. M., & Tökés, Z. A. (1982). Synthesis of alpha 1-antichymotrypsin
and alpha 1-acid glycoprotein by human breast epithelial cells. Cancer
Research 42, 4567–4573.
❖ Gibson, T.W.G. (2015). Gastric Dilation and Volvulus in Small Animals. In:
Diseases of the Stomach and Intestines in Small Animals.The Merck Veterinary
Manual. Tenth Edition.
❖ Gilstad, C. W. (2003). Anaphylactic transfusion reactions. Current Opinion in
Hematology, 10, 419–423.
❖ Giordano, A., Spagnolo, V., Colombo, A., Paltrinieri, S. (2004). Changes in
some acute phase protein and immunoglobulin concentrations in cats affected
by feline infectious peritonitis or exposed to feline coronavirus infection.
Veterinary Journal 167, 38–44.
❖ Gomes, A. V, Potter, J. D., Szczesna-Cordary, D. (2002). The role of troponins
in muscle contraction. IUBMB Life, 54, 323–333
❖ Gow, D. J., Gow, A. G., Bell, R., Spratt, D., Cash, R., Ricketts, S., Mellanby,
R. J. (2011). Serum cardiac troponin I in dogs with primary immune-mediated
haemolytic anaemia. Journal of Small Animal Practice, 52, 259–264.
❖ Granger, C. B. (2006). Prediction and prevention of chemotherapy-induced
cardiomyopathy: can it be done? Circulation, 114(23), 2432–3.
❖ Grant Maxie, M and Newman S.J, (2007). The urinary system: Glomerular
disease. In: Jubb, Kennedy and Palmer´s Pathology of Domestic Animals (5th
Ed.) 451-466.
❖ Greenlee, J. J., Alt, D. P., Bolin, C. A., Zuerner, R. L., Andreasen, C. B.
(2005). Experimental canine leptospirosis caused by Leptospira interrogans
serovars pomona and bratislava. American Journal of Veterinary Research,
66, 1816–1822.
❖ Gruys, E. (2004). Protein folding pathology in domestic animals. Journal of
Zhejiang University. Science 5, 1226–1238.
❖ Hagiwara, M.K (2009). Anaemia in cats: is it Mycoplasma? In: Proceedings of
the 34th World Small Animal Veterinary Congress WSAVA 2009.

121
❖ Hagman, R., Lagerstedt, A.-S., Fransson, B. A., Bergström, A., Häggström, J.
(2007). Cardiac troponin I levels in canine pyometra. Acta Veterinaria
Scandinavica, 49, 6.
❖ Hartmann K, Binder C, Hirschberger J, Cole D, Reinacher M, Schroo S, Frost
J, Egberink H, Lutz H, Hermanns W. (2003) Comparison of different tests to
diagnose feline infectious peritonitis. Journal of Veterinary Internal Medicine
17, 781-790.
❖ Hariu, C. D. and Carpenter, D. H. (2010). Arrhythmogenic right ventricular
cardiomyopathy in boxers. Compendium (Yardley, PA), 32(12), E1–E7.
❖ Harkin, K.R.(2009). Leptospirosis. In: Current Veterinary Therapy XIV.
Saunders-Elsevier.1237-1240.
❖ Herndon, W. E., Kittleson, M. D., Sanderson, K., Drobatz, K. J., Clifford, C.
A., Gelzer, A., Sleeper, M. M. (2002). Cardiac Troponin I in Feline
Hypertrophic Cardiomyopathy. Journal of Veterinary Internal Medicine, 16,
558–564.
❖ Herndon, W. E., Rishniw, M., Schrope, D., Sammarco, C. D., Boddy, K. N.,
Sleeper, M. M. (2008). Assessment of plasma cardiac troponin I concentration
as a means to differentiate cardiac and noncardiac causes of dyspnea in cats.
Journal of the American Veterinary Medical Association, 233, 1261–1264.
❖ Hessel, M. H. M., Atsma, D. E., Van Der Valk, E. J. M., Bax, W. H., Schalij, M.
J., Van Der Laarse, A. (2008). Release of cardiac troponin I from viable
cardiomyocytes is mediated by integrin stimulation. Pflugers Archiv European
Journal of Physiology, 455(6), 979–986.
❖ Hezzell, M. J., Boswood, A., Moonarmart, W., Souttar, K., & Elliott, J. (2012).
The Combined Prognostic Potential of Serum High-Sensitivity Cardiac
Troponin I and N-Terminal pro-B-Type Natriuretic Peptide Concentrations in
Dogs with Degenerative Mitral Valve Disease. Journal of Veterinary Internal
Medicine, 26, 302–311.
❖ Hickman, P. E., Potter, J. M., Aroney, C., Koerbin, G., Southcott, E., Wu, A.
H. B., Roberts, M. S. (2010). Cardiac troponin may be released by ischemia
alone, without necrosis. Clinica Chimica Acta, 411, 318-323.
❖ Hochepied, T., Berger, F. G., Baumann, H., Libert, C. (2003). α1-acid
glycoprotein: An acute phase protein with inflammatory and
122
immunomodulating properties. Cytokine and Growth Factor Reviews 14, 25–
34.
❖ Holst, B. S., Krook, L., Englund, S., Lagerstedt, A. S., Bölske, G. (2011).
Shedding of chlamydiae in relation to titers of serum chlamydiae-specific
antibodies and serum concentrations of two acute-phase proteins in cats
without conjunctivitis. American Journal of Veterinary Research 72, 806–812.
❖ Huang, W., Yin, W., Jen, H., Chiang, M., Feng, A., Young, M. S. (2004). C-
Reactive Protein Levels in Chronic Congestive Heart Failure. Acta Cardiol Sin,
20, 7–13.
❖ Husby, G., Marhaug, G., Dowtor, B., Sletten, K., Sipe, J. D. (1994). Serum
amyloid A (SAA): Biochemistry, genetics and the pathogenesis of AA
amyloidosis. Amyloid 1, 119-137.
❖ Jaffe, A. S., Garfinkel, B. T., Ritter, C. S., Sobel, B. E. (1984). Plasma M.B.
creatine kinase after vigorous exercise in professional athletes. The American
Journal of Cardiology, 53(6), 856–858.
❖ Jaffe, A. S., Landt, Y., Parvin, C. A., Abendschein, D. R., Geltman, E. M.,
Ladenson, J. H. (1996). Comparative sensitivity of cardiac troponin I and
lactate dehydrogenase isoenzymes for diagnosing acute myocardial
infarction. Clinical Chemistry, 42, 1770–1776.
❖ Jaffe, A. S., Vasile, V. C., Milone, M., Saenger, A. K., Olson, K. N., Apple, F.
S. (2011). Diseased skeletal muscle: A noncardiac source of increased
circulating concentrations of cardiac troponin T. Journal of the American
College of Cardiology, 58, 1819–1824
❖ Jain, S., Gautam, V., Naseem, S. (2011). Acute-phase proteins: As diagnostic
tool. Journal of Pharmacy and Bioallied Sciences, 3, 118–127.
❖ Jiménez, M.A, Sánchez, B., Peña, L. (2011). Glomerular injury in domestic
cats and the Iberian lynx (Lynx pardinus): A Comparative Review. In:
Prabhakar, S (2011) An update on Glomerulopathies-Etiology and
Pathogenesis. Intech
❖ Juan-Sallés C, Domingo M, Herráez P, Fernández A, Segalés J, Fernández J
(1998) Feline infectious peritonitis in servals (Felis serval). Veterinary Record,
143, 535-36.

123
❖ Kajikawa, T., Furuta, A., Onishi, T., Tajima, T., Sugii, S. (1999). Changes in
concentrations of serum amyloid a protein, α1-acid glycoprotein,
haptoglobin, and C-reactive protein in feline sera due to induced
inflammation and surgery. Veterinary Immunology and Immunopathology, 68,
91–98.
❖ Kalmovarin, N., Friedrichs, W. E., O’Brien, H. V, Linehan, L. A., Bowman, B.
H., Yang, F. (1991). Extrahepatic expression of plasma protein genes during
inflammation. Inflammation, 15, 369–379.
❖ Kann, R. K. C., Seddon, J. M., Henning, J., Meers, J. (2012). Acute phase
proteins in healthy and sick cats. Research in Veterinary Science 93, 649–654.
❖ Kaptoge S, Di Angelantonio E, Pennells L, Wood AM, White IR, Gao P, Danesh
J. (2012). C-reactive protein, fibrinogen, and cardiovascular disease
prediction. The New England Journal of Medicine, 367(14), 1310–20.
❖ Karmen, A., Wróblewski, F., LaDue, J. (1955). Transaminase activity in human
blood. The Journal of Clinical Investigation, 34, 126–133.
❖ Karrow, N. A. (2006). Activation of the hypothalamic-pituitary-adrenal axis
and autonomic nervous system during inflammation and altered programming
of the neuroendocrine-immune axis during fetal and neonatal development:
Lessons learned from the model inflammagen, lipopolysaccharide. Brain,
Behavior, and Immunity 20, 144–158.
❖ Katus, H. A., Remppis, A., Looser, S., Hallermeier, K., Scheffold, T., Kubler,
W. (1989). Enzyme linked immuno assay of cardiac troponin T for the
detection of acute myocardial infarction in patients. Journal of Molecular and
Cellular Cardiology, 21(12), 1349–1353.
❖ Khoshnegah, J. and Movassaghi, A.R. (2010). A very severe case of feline
amyloidosis with spontaneous rupture and chronic renal failure. Comparative
Clinical Pathology 19, 519-522.
❖ Kienle, R.D. (2008). Chapter 8. Feline Cardiomyopathy. In: Manual of Canine
and Feline Cardiology. Saunders, Fourth Edition, 151-175.
❖ Kirbach B, Schober KE, Oechtering G, Aupperle H. (2000) Diagnosis of
myocardial cell injury in cats with blunt chest trauma using biochemical
markers in blood. Tierärztl Prax 2000; 28, 25-33.

124
❖ Kjos, S. A., Snowden, K. F., Craig, T. M., Lewis, B., Ronald, N., Olson, J. K.
(2008). Distribution and characterization of canine Chagas disease in Texas.
Veterinary Parasitology, 152(3-4), 249–256.
❖ Korman, R. M., Cerón, J. J., Knowles, T. G., Barker, E. N., Eckersall, P. D.,
& Tasker, S. (2012). Acute phase response to Mycoplasma haemofelis and
“Candidatus Mycoplasma haemominutum” infection in FIV-infected and non-
FIV-infected cats. The Veterinary Journal, 193, 433–438.
❖ Koutinas, C. K., Mylonakis, M. E., O’Brien, P. J., Leontides, L., Siarkou, V. I.,
Breitschwerdt, E. B., Koutinas, A. F. (2012). Serum cardiac troponin I
concentrations in naturally occurring myelosuppressive and non-
myelosuppressive canine monocytic ehrlichiosis. Veterinary Journal, 194,
259–261.
❖ Kuta, A. E., & Baum, L. L. (1986). C-reactive protein is produced by a small
number of normal human peripheral blood lymphocytes. The Journal of
Experimental Medicine, 164, 321–326.
❖ Kuusisto, J., Kärjä, V., Sipola, P., Kholová, I., Peuhkurinen, K., Jääskeläinen,
P., Laakso, M. (2012). Low-grade inflammation and the phenotypic expression
of myocardial fibrosis in hypertrophic cardiomyopathy. Heart (British Cardiac
Society), 98, 1007–13.
❖ Krams, R., Kofflard, M. J. M., Duncker, D. J., Von Birgelen, C., Carlier, S.,
Kliffen, M., Serruys, P. W. (1998). Decreased coronary flow reserve in
hypertrophic cardiomyopathy is related to remodeling of the coronary
microcirculation. Circulation, 97(3), 230–233.
❖ Krum, H. (2000). New and emerging pharmacological strategies in the
management of chronic heart failure. Current Opinion in Pharmacology, 1(2),
126–133.
❖ Ladenson, J. H. (2007). A personal history of markers of myocyte injury
(myocardial infarction). Clinica Chimica Acta, 381, 3–8.
❖ Lakkawar, A.W., Nair, M.G., Varshney, K.C., Sreekrishnan, R. and Rao, V.N.
(2003). Pathology of canine monocytic ehrlichiosis in a German Shepherd dog.
Slovenian Veterinary Research, 40(2), 119-128
❖ Lalor, S. M., Connolly, D. J., Elliott, J., Syme, H. M. (2009). Plasma
concentrations of natriuretic peptides in normal cats and normotensive and

125
hypertensive cats with chronic kidney disease. Journal of Veterinary
Cardiology, 11 Suppl 1, S71-S79.
❖ Lalor, S. M., Gunn-Moore, D. A., Cash, R., Foot, A., Reed, N., Mellanby, R. J.
(2014). Serum Cardiac Troponin I concentrations in cats with anaemia - a
preliminary, single-centre observational study. Journal of Small Animal
Practice, 55, 320–322.
❖ Langhorn, R., Oyama, M. A., King, L. G., Machen, M. C., Trafny, D. J.,
Thawley, V., Kjelgaard-Hansen, M. (2013). Prognostic Importance of
Myocardial Injury in Critically Ill Dogs with Systemic Inflammation. Journal of
Veterinary Internal Medicine, 27, 895–903.
❖ Langhorn, R., Persson, F., Åblad, B., Goddard, A., Schoeman, J.P., Willesen,
J., Tarnow, I., Kjelgaard-Hansen, M. (2014a). Myocardial injury in dogs with
snake envenomation and its relation to systemic inflammation. Journal of
Veterinary Emergency and Critical Care, 24, 174-181
❖ Langhorn, R., Tarnow, I., Willesen, J. L., Kjelgaard-Hansen, M., Skovgaard, I.
M., & Koch, J. (2014b). Cardiac Troponin I and T as Prognostic Markers in Cats
with Hypertrophic Cardiomyopathy. Journal of Veterinary Internal Medicine,
28, 1485-1491.
❖ Langhorn, R., Thawley, V., Oyama, M. A., King, L. G., Machen, M. C., Trafny,
D. J., Kjelgaard-Hansen, M. (2014c). Prediction of Long-term Outcome by
Measurement of Serum Concentration of Cardiac Troponins in Critically Ill
Dogs with Systemic Inflammation. Journal of Veterinary Internal Medicine, 28,
1492-7.
❖ Larsen, K., Macleod, D., Nihlberg, K., Gürcan, E., Bjermer, L., Marko-Varga,
G., Westergren-Thorsson, G. (2006). Specific haptoglobin expression in
bronchoalveolar lavage during differentiation of circulating fibroblast
progenitor cells in mild asthma. Journal of Proteome Research, 5, 1479–1483.
❖ Lavecchio, D., Marin, L. M., Baumwart, R., Iazbik, M. C., Westendorf, N.,
Couto, C. G. (2009). Serum cardiac troponin i concentration in retired racing
greyhounds. Journal of Veterinary Internal Medicine, 23, 87–90.
❖ Leal, R. O., Gil, S., Sepúlveda, N., Mcgahie, D., Duarte, A., Niza, M. M. R. E.,
Tavares, L. (2014). Monitoring acute phase proteins in retrovirus infected cats
126
undergoing feline interferon-ω therapy. Journal of Small Animal Practice, 55,
39–45.
❖ Liang, J. S., Sloane, J. A., Wells, J. M., Abraham, C. R., Fine, R. E., Sipe, J.
D. (1997). Evidence for local production of acute phase response
apolipoprotein Serum Amyloid A in Alzheimer´s disease brain. Neuroscience
Letters, 225, 73–76.
❖ Linde, A., Summerfield, N. J., Sleeper, M. M., Wright, F. B., Clifford, C. A.,
Melgarejo, T., Knight, D. H. (2006). Pilot study on cardiac troponin I levels in
dogs with pericardial effusion. Journal of veterinary cardiology: the official
journal of the European Society of Veterinary Cardiology, 8, 19–23.
❖ Linklater, A. K. J., Lichtenberger, M. K., Thamm, D. H., Tilley, L., Kirby, R.
(2007). Serum concentrations of cardiac troponin I and cardiac troponin T in
dogs with class IV congestive heart failure due to mitral valve disease. Journal
of Veterinary Emergency and Critical Care, 17, 243–249.
❖ Lippi, G., Cervellin, G., Banfi, G., Plebani, M. (2011). Cardiac troponins and
physical exercise. It’s time to make a point. Biochemia Medica, 21, 55–62.
❖ Liu, S. K., Roberts, W. C., Maron, B. J. (1993). Comparison of morphologic
findings in spontaneously occurring hypertrophic cardiomyopathy in humans,
cats and dogs. American Journal of Cardiology, 72, 944–951.
❖ Ljungvall, I., Höglund, K., Tidholm, A., Olsen, L. H., Borgarelli, M., Venge,
P., Häggström, J. (2010). Cardiac troponin I is associated with severity of
myxomatous mitral valve disease, age, and C-reactive protein in dogs. Journal
of Veterinary Internal Medicine, 24, 153–159.
❖ Lobetti, R., Dvir, E., Pearson, J. (2002). Cardiac Troponins in Canine
Babesiosis. Journal of Veterinary Internal Medicine, 16, 63–68.
❖ Luchner, A., Hengstenberg, C., Löwel, H., Riegger, G. A. J., Schunkert, H.,
Holmer, S. (2005). Effect of compensated renal dysfunction on approved heart
failure markers: Direct comparison of brain natriuretic peptide (BNP) and N-
terminal pro-BNP. Hypertension, 46(1), 118–123.
❖ Marretta, S.M., Matthiesen, D.T., Nichols, R. (1989) Pyometra and its
complications. Problems in Veterinary Medicine, 1, 50–62.
❖ Mastrorilli, C., Dondi, F., Agnoli, C., Turba, M. E., Vezzali, E., Gentilini, F.
(2007). Clinicopathologic features and outcome predictors of Leptospira

127
interrogans Australis serogroup infection in dogs: a retrospective study of 20
cases (2001-2004). Journal of Veterinary Internal Medicine, 21, 3–10.
❖ McCullough, P. A., and Sandberg, K. R. (2003). B-type natriuretic peptide and
renal disease. Heart Failure Reviews, 8, 355–358.
❖ McKenzie, E. C., Jose-Cunilleras, E., Hinchcliff, K. W., Holbrook, T. C., Royer,
C., Payton, M. E., Davis, M. S. (2007). Serum chemistry alterations in Alaskan
sled dogs during five successive days of prolonged endurance exercise.
Journal of the American Veterinary Medical Association, 230, 1486–1492.
❖ McManus, P. M., Craig, L. E. (2001). Correlation between leukocytosis and
necropsy findings in dogs with immune-mediated hemolytic anaemia: 34 cases
(1994-1999). Journal of the American Veterinary Medical Association, 218,
1308–1313.
❖ McQuiston, J.H., McCall, C.L., Nicholson, W.L. (2003). Ehrlichiosis and related
infections. Veterinary Medicine Today: Zoonosis Update. JAVMA, 223, (12),
1750-1756.
❖ Meek, R. L., Urieli-Shoval, S., Benditt, E. P. (1994). Expression of
apolipoprotein serum amyloid A mRNA in human atherosclerotic lesions and
cultured vascular cells: implications for serum amyloid A function.
Proceedings of the National Academy of Sciences of the United States of
America, 91, 3186–3190.
❖ Menaut, P., Connolly, D. J., Volk, A., Pace, C., Luis Fuentes, V., Elliott, J.,
Syme, H. (2012). Circulating natriuretic peptide concentrations in
hyperthyroid cats. Journal of Small Animal Practice, 53, 673–678.
❖ Meurs, K. M. (2004). Boxer dog cardiomyopathy: An update. Veterinary Clinics
of North America - Small Animal Practice 34 (5), 1235-1244.
❖ Meurs, K. M., Fox, P. R., Magnon, A. L., Liu, S. K., Towbin, J. A. (2000).
Molecular screening by polymerase chain reaction detects panleukopenia
virus DNA in formalin-fixed hearts from cats with idiopathic cardiomyopathy
and myocarditis. Cardiovascular Pathology, 9, 119–126.
❖ Moore, D. J., and Williams, M. C. (1979). Disseminated intravascular
coagulation: a complication of Babesia canis infection in the dog. Journal of
the South African Veterinary Association, 50(4), 265–275.

128
❖ Moscucci, M., Eagle, K. A. (2006). Door-to-balloon time in primary
percutaneous coronary intervention: Is the 90-minute gold standard an
unreachable chimera? Circulation, 113(8), 1048–1050.
❖ Müller-Bardorff, M., Hallermayer, K., Schröder, A., Ebert, C., Borgya, A.,
Gerhardt, W., Katus, H. A. (1997). Improved troponin T ELISA specific for
cardiac troponin T isoform: Assay development and analytical and clinical
validation. Clinical Chemistry, 43(3), 458–466.
❖ Mylonakis, M.E., Siarkou, V.I., Koutinas, A.F. (2010). Myelosuppressive Canine
Monocytic Ehrlichiosis (Ehrlichia canis): an update on the pathogenesis,
diagnosis and management. Israel Journal of Veterinary Medicine, 65(4), 129-
135.
❖ Narula, J., Haider, N., Virmani, R., DiSalvo, T. G., Kolodgie, F. D., Hajjar, R.
J., Khaw, B.-A. (1996). Apoptosis in Myocytes in End-Stage Heart Failure. New
England Journal of Medicine, 335(16), 1182–1189.
❖ O’Brien, P. J., Landt, Y.,Ladenson, J. H. (1997). Differential reactivity of
cardiac and skeletal muscle from various species in a cardiac troponin I
immunoassay. Clinical Chemistry, 43(12), 2333–2338.
❖ O´Keefe, D. A. O., Sisson, D. D., Gelberg, H. B., Schaeffer, D. J., & Krawiec,
D. R. (1993). Systemic Toxicity Associated With Doxorubicin Administration in
Cats. Journal of Veterinary Internal Medicine, 7(5), 309–316.
❖ Ottenjann, M., Weingart, C., Arndt, G., Kohn, B. (2006). Characterization of
the anaemia of inflammatory disease in cats with abscesses, pyothorax, or fat
necrosis. Journal of Veterinary Internal Medicine, 20, 1143–1150.
❖ Oyama, M.A. (2008). Canine Cardiomyopathy. In: Manual of Canine and Feline
Cardiology. Saunders. Fourth edition, 139-150.
❖ Oyama, M. A., Sisson, D. D. (2004). Cardiac Troponin-I Concentration in Dogs
with Cardiac Disease. Journal of Veterinary Internal Medicine, 18, 831–839.
❖ Oyama, M. A., Sisson, D. D., Solter, P. F. (2007). Prospective screening for
occult cardiomyopathy in dogs by measurement of plasma atrial natriuretic
peptide, B-type natriuretic peptide, and cardiac troponin-I concentrations.
American Journal of Veterinary Research, 68, 42–47.
❖ Paltrinieri, S. (2008). The feline acute phase reaction. The Veterinary
Journal, 177, 26-35.
129
❖ Paltrinieri, S. (2007). Early biomarkers of inflammation in dogs and cats: The
acute phase proteins. Veterinary Research Communications, 31, 125–129.
❖ Paltrinieri, S., Metzger, C., Battilani, M., Pocacqua, V., Gelain, M. E.,
Giordano, A. (2007a). Serum alpha-1-acid glycoprotein (AGP) concentration
in non-symptomatic cats with feline coronavirus (FCoV) infection. Journal of
Feline Medicine and Surgery, 9, 271–277.
❖ Paltrinieri, S., Giordano, A., Tranquillo, V., Guazzetti, S. (2007b). Critical
assessment of the diagnostic value of feline alpha1-acid glycoprotein for
feline infectious peritonitis using the likelihood ratios approach. Journal of
Veterinary Diagnostic Investigation 19, 266-272
❖ Pape, L.A., Rippe, J.M., Walker, W.S., Weiner, B.H., Ockene, I.S., Paraskos,
J.A., Alpert, J.S.(1984). Effects of the cessation of training on left ventricular
function in the racing greyhound. Serial studies in a model of cardiac
hypertrophy. Basic Research in Cardiology, 79, 98-109.
❖ Parmacek, M. S., Solaro, R. J. (2004). Biology of the troponin complex in
cardiac myocytes. Progress in Cardiovascular Diseases, 47 (3), 159-176.
❖ Pattanshetty, D. J., Bhat, P. K., Aneja, A., & Pillai, D. P. (2012). Elevated
troponin predicts long-term adverse cardiovascular outcomes in hypertensive
crisis: a retrospective study. Journal of hypertension, 30, 2410–2415.
❖ Pedersen, N.C. (1983) Feline infectious peritonitis and feline enteric
coronavirus infections. Part I: Feline enteric coronavirus. Feline Practice 13,
13-19.
❖ Pedersen, N. C. (2014). An update on feline infectious peritonitis: Diagnostics
and therapeutics. Veterinary Journal, 201(2), 133–141.
❖ Pelander, L., Hagman, R., Häggström, J. (2008). Concentrations of cardiac
Troponin I before and after ovariohysterectomy in 46 female dogs with
pyometra. Acta Veterinaria Scandinavica, 50, 35.
❖ Pelander, L., Ljungvall, I., Häggström, J. (2010). Myocardial cell damage in
24 dogs bitten by the common European viper (Vipera berus). The Veterinary
Record, 166, 687–690.
❖ Pepys, M. B., & Hirschfield, G. M. (2003). C-reactive protein: A critical
update. Journal of Clinical Investigation, 111(12), 1805–1812.

130
❖ Petersen, H. H., Nielsen, J. P., Heegaard, P. M. H. (2004). Application of
acute phase protein measurements in veterinary clinical chemistry.
Veterinary Research. 35, 163-187.
❖ Pfeifer, M.L., Evermann J.F., Roelkie M.E., Gallina A.M., Ott R.L., McKeirnan
A.J. (1983) Feline infectious peritonitis in a captive cheetah. Journal
American Veterinary Medicine Association 183, 1317-1319.
❖ Poelma F.G., Peters, J.C., Mieog, W.H.W., Zwart, P. (1974) Infectise
Peritonitiss bei Karakal (Felis caracal) and Nordluchs (Felis lynx lynx). In:
Proceedings Erkrankungen der Zootiere, 13th International Symposium of Zoo
Veterinarians, Helsinki, Finland, 249-253.
❖ Porciello, F., Rishniw, M., Herndon, W. E., Birettoni, F., Antognoni, M. T.,
Simpson, K. W. (2008). Cardiac troponin I is elevated in dogs and cats with
azotaemia renal failure and in dogs with non-cardiac systemic disease.
Australian Veterinary Journal, 86, 390–394.
❖ Prosek R., Sisson, D. D., Oyama, M. A., Solter, P. F. (2007). Distinguishing
Cardiac and Noncardiac Dyspnea in 48 Dogs Using Plasma Atrial Natriuretic
Factor, B-Type Natriuretic Factor, Endothelin, and Cardiac Troponin-I.
Journal of Veterinary Internal Medicine, (21), 238–242.
❖ Pye, M., Rae, A. P., Cobbe, S. M. (1990). Study of serum C-reactive protein
concentration in cardiac failure. British Heart Journal, 63, 228–230.
❖ Quaye, I. K. (2008). Haptoglobin, inflammation and disease. Transactions of
the Royal Society of Tropical Medicine and Hygiene, 102, 735–742.
❖ Redfearn, D. P., Ratib, K., Marshall, H. J., Griffith, M. J. (2005).
Supraventricular tachycardia promotes release of troponin I in patients with
normal coronary arteries. International Journal of Cardiology, 102, 521–522.
❖ Rich, J. T., Neely, J. G., Paniello, R. C., Voelker, C. C. J., Nussenbaum, B.,
Wang, E. W. (2010). A practical guide to understanding Kaplan-Meier curves.
Otolaryngology - Head and Neck Surgery, 143, 331–336.
❖ Ridker, P. M., Rifai, N., Rose, L., Buring, J. E., Cook, N. R. (2002). Comparison
of C-reactive protein and low-density lipoprotein cholesterol levels in the
prediction of first cardiovascular events. The New England Journal of
Medicine, 347, 1557–1565.
131
❖ Ridker, P. M. (2003). Clinical Application of C-Reactive Protein for
Cardiovascular Disease Detection and Prevention. Circulation.
❖ Rishniw, M., Barr, S. C., Simpson, K. W., Winand, N. J. Wootton, J. A. M.
(2004). Cloning and sequencing of the canine and feline cardiac troponin I
genes. American Journal of Veterinary Research, 65, 53–58.
❖ Roe C.R., Limbird L.E., Wagner G.S., Nerenberg S.T.(1972).Combined
isoenzyme analysis in the diagnosis of myocardial injury: application of
electrophoretic methods for the detection and quantitation of the creatine
phosphokinase MB isoenzyme. J Lab Clin Med, 80 , 577-90.
❖ Rush, J. E., Lee, N. D., Freeman, L. M., Brewer, B. (2006). C-reactive protein
concentration in dogs with chronic valvular disease. Journal of Veterinary
Internal Medicine, 20, 635–9.
❖ Sabatine, M. S., Morrow, D. A., Jablonski, K. A., Rice, M. M., Warnica, J. W.,
Domanski, M. J., Braunwald, E. (2007). Prognostic significance of the Centers
for Disease Control/American Heart Association high-sensitivity C-reactive
protein cut points for cardiovascular and other outcomes in patients with
stable coronary artery disease. Circulation, 115, 1528–1536.
❖ Sangster, J. K., Panciera, D. L., Abbott, J. A., Zimmerman, K. C., & Lantis,
A. C. (2014). Cardiac biomarkers in hyperthyroid cats. Journal of Veterinary
Internal Medicine, 28, 465–472.
❖ Sasaki, K., Ma, Z., Khatlani, T. S., Okuda, M., Inokuma, H., Onishi, T. (2003).
Evaluation of feline serum amyloid A (SAA) as an inflammatory marker.
Journal of Veterinary Medical Science, 65, 545–548.
❖ Schmidt, M. K., Reynolds, C. A., Estrada, A. H., Prošek, R., Maisenbacher, H.
W., Sleeper, M. M., Oyama, M. A. (2009). Effect of azotemia on serum N-
terminal proBNP concentration in dogs with normal cardiac function: A pilot
study. Journal of Veterinary Cardiology, 11 Suppl. 1, S81-S86.
❖ Schmidt, E., Filipovic, M., Francuski, J., AndriC, N, Barbosa,L., Waterston,
M., Eckersall,D. (2015). Acute phase protein concentrations in cats with
urinary tract obstruction. ACVIM Forum, Indianapolis, Indiana, June 3–6, 2015.
❖ Schober, K. E., Kirbach, B., Oechtering, G. (1999). Noninvasive assessment of
myocardial cell injury in dogs with suspected cardiac contusion. Journal of
Veterinary Cardiology, 1, 17–25.
132
❖ Schober, K. E., Cornand, C., Kirbach, B., Aupperle, H., Oechtering, G. (2002).
Serum cardiac troponin I and cardiac troponin T concentrations in dogs with
gastric dilatation-volvulus. Journal of the American Veterinary Medical
Association, 221, 381–388.
❖ Schober, K., Todd, A. (2010). Echocardiographic assessment of left
ventricular geometry and the mitral valve apparatus in cats with hypertrophic
cardiomyopathy. Journal of Veterinary Cardiology, 12(1), 1–16.
❖ Schwartz, P., Piper, H. M., Spahr, R., & Spieckermann, P. G. (1984).
Ultrastructure of cultured adult myocardial cells during anoxia and
reoxygenation. The American Journal of Pathology, 115(3), 349–61.
❖ Segev, G., Klement, E., Aroch, I. (2006). Toxic neutrophils in cats: clinical
and clinicopathologic features, and disease prevalence and outcome--a
retrospective case control study. Journal of Veterinary Internal Medicine 20,
20–31.
❖ Segev, G., Ohad, D. G., Shipov, A., Kass, P. H., Aroch, I. (2008). Cardiac
arrhythmias and serum cardiac troponins in Vipera palaestinae envenomation
in dogs. Journal of Veterinary Internal Medicine, 22, 106–113.
❖ Selting, K.A., Ogilvie, G.K., Lana, S.E., Fettman, M.J., Mitchener, K.L.,
Hansen, R.A., Richardson, K.L., Walton, J.A., Scherk, M.A. (2000), Serum
Alpha 1-Acid Glycoprotein Concentrations in Healthy and Tumor-Bearing Cats.
Journal of Veterinary Internal Medicine 14, 503–506.
❖ Selting, K. A., Lana, S. E., Ogilvie, G. K., Olmstead, A., Mykles, D. L., Bright,
J., Fettman, M. J. (2004). Cardiac troponin I in canine patients with
lymphoma and osteosarcoma receiving doxorubicin: comparison with clinical
heart disease in a retrospective analysis. Veterinary and Comparative
Oncology, 2, 142–156.
❖ Sharkey, L. C., Berzina, I., Ferasin, L., Tobias, A. H., Lulich, J. P., Hegstad-
Davies, R. L. (2009). Evaluation of serum cardiac troponin I concentration in
dogs with renal failure. Journal of the American Veterinary Medical
Association, 234, 767–770.
❖ Shaw, S. P, Rozanski, E, Rush, J. E. (2004). Cardiac Troponins I and T in Dogs
with Pericardial Effusion. Journal of Veterinary Internal Medicine, 18, 322–
324.

133
❖ Shibata, Y., Tamura, K., Ishida, N. (1984). Cultured human monocytes,
granulocytes and a monoblastoid cell line (THP-1) synthesize and secrete
immunosuppressive acidic protein (a type of alpha 1-acid glycoprotein).
Microbiology and Immunology, 28, 99–111.
❖ Shida, T., Kuribayashi, T., Seita, T., Maruo, T., Yamazaki, S., Yamamoto, S.
(2012). Characteristics of Increased Serum Amyloid A (SAA) and a alpha1- Acid
Glycoprotein (AAG) Concentrations in Cats Subjected to Experimental Surgical
Treatments or Inoculated with Bordetella bronchiseptica. The Journal of
Applied Research in Veterinary Medicine, 10, 69–75.
❖ Shimada, E., Tadokoro, K., Watanabe, Y., Ikeda, K., Niihara, H., Maeda, I.,
Juji, T. (2002). Anaphylactic transfusion reactions in haptoglobin-deficient
patients with IgE and IgG haptoglobin antibodies. Transfusion, 42, 766–773.
❖ Siegel, R.J., Fishbein, C., Said, J.W., Tokes, Z.A., Shell, W.E. (1985).
Localization of alpha-1 acid glycoproteins in human myocardium. Laboratory
Investigation; a Journal of Technical Methods and Pathology, 52, 107–112.
❖ Sirko, S., Bishai, I., Coceani, F. (1989). Prostaglandin formation in the
hypothalamus in vivo: effect of pyrogens. American Journal of Physiology,
256, 616–624.
❖ Sleeper, M. M., Henthorn, P. S., Vijayasarathy, C., Dambach, D. M., Bowers,
T., Tijskens, P., Lankford, E. B. (2002). Dilated Cardiomyopathy in Juvenile
Portuguese Water Dogs. Journal of Veterinary Internal Medicine, 16, 52–62.
❖ Smith, G.S (2000). Neutrophils. In: Feldman B.F, Zinkl, J.G, Jain, N.C.
Schalm´s Veterinary Hematology. Lippincott Williams and Wilkins. 281-296
❖ Solaro, R. J., Rosevear, P., Kobayashi, T. (2008). The unique functions of
cardiac troponin I in the control of cardiac muscle contraction and relaxation.
Biochemical and Biophysical Research Communications, 369, 82–87.
❖ Sörensson, J., Matejka, G. L., Ohlson, M., Haraldsson, B. (1999). Human
endothelial cells produce orosomucoid, an important component of the
capillary barrier. American Journal of Physiology, 276, H530–H534.
❖ Spikler, A.R. (2009). American Trypanosomiasis. The Center for Food Security
and Public Health and Institute for International Cooperation in Animal
Biologics. Iowa State University.1-8.

134
❖ Spratt, D. P., Mellanby, R. J., Drury, N., & Archer, J. (2005). Cardiac troponin
I: evaluation I of a biomarker for the diagnosis of heart disease in the dog.
Journal of Small Animal Practice, 46, 139–145.
❖ Stalis, I. H., Bossbaly, M. J., Van Winkle, T. J. (1995). Feline endomyocarditis
and left ventricular endocardial fibrosis. Veterinary Pathology, 32, 122–126.
❖ Starybrat, D., Tappin, S. (2016). Approaching the dyspnoeic cat in the middle
of the night. Veterinary Ireland Journal , 6 (1), 37-43.
❖ Stoddart, M.E., Whicher, J.T., Harbou,r D.A.(1988). Cats inoculated with
feline infectious peritonitis virus exhibit a biphasic acute phase plasma
protein response. Veterinary Record 123, 622-624.
❖ Suleiman, M., Aronson, D., Reisner, S. A., Kapeliovich, M. R., Markiewicz, W.,
Levy, Y., Hammerman, H. (2003). Admission C-reactive protein levels and 30-
day mortality in patients with acute myocardial infarction. The American
Journal of Medicine, 115, 695–701.
❖ Taboada J. and Lobetti R. (2006). Babesiosis. In: Infectious Diseases of the
Dog and Cat. Elsevier. Third Edition.
❖ Takemura, G., & Fujiwara, H. (2007). Doxorubicin-Induced Cardiomyopathy.
From the Cardiotoxic Mechanisms to Management. Progress in Cardiovascular
Diseases, 49, 330–352.
❖ Tamamoto, T., Ohno, K., Ohmi, A., Seki, I., Tsujimoto, H. (2009). Time-
course monitoring of serum amyloid A in a cat with pancreatitis. Veterinary
Clinical Pathology, 38, 83–86.
❖ Tamamoto, T., Ohno, K., Takahashi, M., Nakashima, K., Fujino, Y.,
Tsujimoto, H. (2013). Serum amyloid A as a prognostic marker in cats with
various diseases. Journal of Veterinary Diagnostic Investigation, 25, 428–432.
❖ TerWee, J., Sabara, M., Kokjohn, K., Sandbulte, J., Frenchick, P., Dreier, K.
J. (1998). Characterization of the systemic disease and ocular signs induced
by experimental infection with Chlamydia psittaci in cats. Veterinary
Microbiology, 59, 259–281.
❖ Tharwat, M., Al-Sobayil, F., Buczinski, S. (2013). Influence of racing on the
serum concentrations of the cardiac biomarkers troponin I and creatine kinase
myocardial band (CK-MB) in racing greyhounds. Veterinary Journal, 197, 900–
902.
135
❖ Theobald, J. (1978) Feline Infectious peritonitis. In: Fowler ME Zoo and Wild
Animal Medicine. WB Saunders Co., Philadelphia, 650-667.
❖ Thomas, T., Fletcher, S., Yeoh, G., Shreiber, J. (1989). The expression of
α(1)-acid glycoprotein mRNA during rat development. High levels of
expression in the decidua. The Journal of Biological Chemistry, 264, 5784–
5790.
❖ Thygesen, K., Mair, J., Katus, H., Plebani, M., Venge, P., Collinson, P., …
Jaffe, A. S. (2010). Recommendations for the use of cardiac troponin
measurement in acute cardiac care. European Heart Journal, 31, 2197–2204.
❖ Tillett, W. S. and Francis, T. (1930). Serological reactions in pneumonia with
a non-protein somatic fraction of the Pneumococcus. The Journal of
Experimental Medicine, 52, 561–571.
❖ Tircoveanu, R., and Van der Linden, P. (2008). Hemodilution and anaemia in
patients with cardiac disease: what is the safe limit? Current Opinion in
Anaesthesiology, 21(1), 66–70.
❖ Torzewski, J., Torzewski, M., Bowyer, D. E., Fröhlich, M., Koenig, W.,
Waltenberger, J., Hombach, V. (1998). C-reactive protein frequently
colocalizes with the terminal complement complex in the intima of early
atherosclerotic lesions of human coronary arteries. Arteriosclerosis,
Thrombosis, and Vascular Biology, 18, 1386–1392.
❖ Tuch, K., Witte, KH, Wüller, H (1974) Feststellung der felinen infecktisen
Peritonitis (FIP) bei Hauskatzen and Leoparden in Deutschland. Zenterblatt
Veterinarmedizin 21, 426-441
❖ Upragarin, N., Landman, W. J. M., Gaastra, W., Gruys, E. (2005). Extrahepatic
production of acute phase serum amyloid A. Histology and Histopathology,
20, 1295-1307.
❖ Urieli-Shoval, S., Cohen, P., Eisenberg, S., Matzner, Y. (1998). Widespread
expression of serum amyloid A in histologically normal human tissues.
Predominant localization to the epithelium. The Journal of Histochemistry
and Cytochemistry: Official Journal of the Histochemistry Society, 46, 1377–
1384.

136
❖ Van der Linde-Sipman, J.S, Niewold, T.A , Tooten, P.C.J , Neijs-Backer M.,
Gruys E. (1997). Generalized AA-amyloidosis in Siamese and Oriental cats.
Veterinary Immunology and Immunopathology, 1-10.
❖ Varnava, A. M., Elliott, P. M., Mahon, N., Davies, M. J., McKenna, W. J.
(2001). Relation between myocyte disarray and outcome in hypertrophic
cardiomyopathy. American Journal of Cardiology, 88, 275–279.
❖ Volanakis, J. E. (2001). Human C-reactive protein: Expression, structure, and
function. In Molecular Immunology, 38, 189–197.
❖ Von Hoff, D. D., Layard, M. W., Basa, P., Davis, H. L., Von Hoff, A. L.,
Rozencweig, M., Muggia, F. M. (1979). Risk factors for doxorubicin-induced
congestive heart failure. Annals of Internal Medicine, 91(5), 710–717.
❖ Watt N.J., MacIntyre N.J., McOrist, S. (1993). An extended outbreak of
infectious peritonitis in a closed colony of European wildcats (Felis sylvestris).
Journal Comparative Pathology 108, 73-79.
❖ Weber, K. T. (2001). Aldosterone in congestive heart failure. New England
Journal of Medicine, 345(23), 1689–1697.
❖ Wells, S. M. and Sleeper, M. (2008). Cardiac troponins. Journal of Veterinary
Emergency and Critical Care, 18, 235–245.
❖ Wells, S. M., Shofer, F. S., Walters, P. C., Stamoulis, M. E., Cole, S. G.,
Sleeper, M. M. (2014). Evaluation of blood cardiac troponin I concentrations
obtained with a cage-side analyzer and noncardiac causes of dyspnea. Journal
of the American Veterinary Medical Association, 244, 425–430.
❖ Wess, G., Daisenberger, P., Hirschberger, J., Hartmann, K. (2008). The utility
of NT-proBNP to differentiate cardiac and respiratory causes of dyspnea in
cats [Abstract]. Journal of Veterinary Internal Medicine; 22: 707-708.
❖ Wess, G., Simak, J., Mahling, M., Hartmann, K. (2010). Cardiac troponin I in
doberman pinschers with cardiomyopathy. Journal of Veterinary Internal
Medicine, 24, 843–849.
❖ White, H. D. (2011). Pathobiology of troponin elevations: do elevations occur
with myocardial ischaemia as well as necrosis? Journal of the American
College of Cardiology, 57(24), 2406–8.
❖ Williams, E. S., Shah, S. J., Ali, S., Na, B. Y., Schiller, N. B., Whooley, M. A.
(2008). C-reactive protein, diastolic dysfunction, and risk of heart failure in
137
patients with coronary disease: Heart and Soul Study. European Journal of
Heart Failure, 10, 63–69.
❖ World Health Organization. (1979) Nomenclature and criteria for diagnosis of
ischaemic heart disease. Report of the Joint International Society and
Federation of Cardiology/World Health Organization task force on
standardization of clinical nomenclature. Circulation, 59(3), 607-9.
❖ Wroblewski F., Ruegsegger P., Ladue JS. (1956). Serum lactic dehydrogenase
activity in acute transmural myocardial infarction. Science, 123, 1122-3.
❖ Wroblewski F., Ross C., Gregory K. (1960). Isoenzymes and myocardial
infarction. N Engl J Med, 15, 531-6.
❖ Wu A.H., Gornet T.G., Bretaudiere J.P., Panfili P.R. (1985). Comparison of
enzyme immunoassay and immunoprecipitation for creatine kinase MB in
diagnosis of acute myocardial infarction. Clin Chem., 31(3), 470-4.
❖ Wu, A. H. (2002). Diagnostic enzymology and other biochemical markers of
organ damage. In: McClatchey, K.D. 2002 Clinical Laboratory Medicine.
Second Edition, 14, 281-205.
❖ Xue, F., Jiang, T.-B., Jiang, B., Cheng, X.-J., He, Y.-M., Li, X. Yang, X.-J.
(2014). Cardiac troponin I elevation with supraventricular tachycardia: two
case reports and review of the literature. BMC Research Notes, 7, 136.
❖ Yamada, T., Kakihara, T., Kamishima, T., Fukuda, T., Kawai, T. (1996). Both
acute phase and constitutive serum amyloid A are present in atherosclerotic
lesions. Pathology International, 46, 797–800.
❖ Yang, F., Friedrichs, W. E., Navarijo-Ashbaugh, A. L., deGraffenried, L. A.,
Bowman, B. H., Coalson, J. J. (1995). Cell type-specific and inflammatory-
induced expression of haptoglobin gene in lung. Laboratory Investigation; a
Journal of Technical Methods and Pathology, 73, 433–440.
❖ Yasojima, K., Schwab, C., McGeer, E. G., McGeer, P. L. (2000). Human
neurons generate C-reactive protein and amyloid P: Upregulation in
Alzheimer’s disease. Brain Research, 887, 80–89.

138